the Creative Commons Attribution 4.0 License.
the Creative Commons Attribution 4.0 License.
 | 03 Dec 2025
Estimation of CFC-11 emissions from coal combustion in China
Zhenzhen Niu
Shaofei Kong
Qin Yan
Yi Cheng
Huang Zheng
Yao Hu
Jian Wu
Xujing Qin
Haoyu Dong
Weisi Jiang
Yingying Yan
Wei Liu
Feng Ding
Yongqing Bai
Shihua Qi
The trichlorofluoromethane (CFC-11) emission from its production and use (PAU) has drawn widespread interest, while its combustion sources have been overlooked. This study identified CFC-11 emission factors (EFs) of 3.6, 3.2 and 0.025 mg kg−1 from the combustion of domestic chunk coal, honeycomb briquettes and coal-fired power plants, respectively. A multi-year (2000–2021) emission inventory of CFC-11 from coal combustion in China was established. Results indicated that the CFC-11 annual emission from coal combustion in China was, on average, 233.5 t yr−1. It exhibited fluctuations and maintained an overall upward trend, accounting for 0.8 % of PAU emissions in 2000 and increasing to 9.8 % in 2021, with the peak value appearing in 2016. In the Shandong and Hebei provinces, which have high coal consumption amounts, the CFC-11 emissions from coal combustion increased by approximately 74 % during 2014–2017 compared to 2011–2012. At the Gosan station close to the Chinese mainland, CFC-11 emitted from coal combustion in Hebei and Shandong was 0.5 ppt of its average concentration during January 2016. An additional climate effect of the clean heating and coal-to-electricity policies in China was also observed, with an obvious decrease (2.2 × 10⁶ and 3.4 × 10⁷ t) in CO2-equivalent emission. This study provides substantial evidence of CFC-11 emission from coal combustion and highlights the role of combustion emission against the background of reducing CFC-11 from PAU. The data compiled in this work can be found at https://doi.org/10.6084/m9.figshare.28523063 (Niu et al., 2025).
- Article
(2916 KB) - Full-text XML
-
Supplement
(1584 KB) - BibTeX
- EndNote


Trichlorofluoromethane (CFC-11) has been widely used as a blowing agent for foams incorporated into buildings and consumer products since the 1950s (McCulloch et al., 2001; Rigby et al., 2019). The lifetime of CFC-11 exceeds 50 years, allowing it to accumulate in the atmosphere (Guo et al., 2009; Lickley et al., 2021; Rigby et al., 2013). CFC-11 could deplete stratospheric ozone through photodissociation (Fleming et al., 2020; Molina and Rowland, 1974) and has served as a reference compound for calculating ozone depletion potential (ODP) (Western et al., 2023). Over a 100-year time horizon, CFC-11 has a global warming potential (GWP) thousands of times greater than that of carbon dioxide (CO2) (Chiodo and Polvani, 2022; Polvani et al., 2020), with the GWP values of CFC-11 and CO2 being 7090 and 1, respectively (Burkholder et al., 2022). An accurate understanding of CFC-11 emissions was helpful for assessing the impact of China's implementation of the Montreal Protocol (Fang et al., 2018).
The production and consumption of CFC-11 for emissive applications were phased out globally in 2010 according to the Montreal Protocol, released in 1987 (Park et al., 2021). This has resulted in a declining trend of its global atmospheric concentration (Park et al., 2021) and an expectation for ozone-layer recovery throughout the 21st century (Scientific assessment of ozone depletion, 2019). However, since 2012, the decline rate of atmospheric CFC-11 emission has significantly slowed by about 50 % (Montzka et al., 2018). Eastern China has been identified as a hotspot for unexpected increased emissions of CFC-11 (Park et al., 2021). Previous studies attributed it to new productions of CFC-11 in eastern China (Montzka et al., 2018; Rigby et al., 2019), especially for blowing closed-cell insulating foam (McCulloch et al., 2001). Based on ambient monitoring data, previous studies simulated CFC-11 emissions increasing by 29.4 % globally (Montzka et al., 2021), 58.3 % in East Asia (Adcock et al., 2020) and 130.7 % in eastern China (Park et al., 2021) during 2014–2017 compared to the corresponding values of 2011–2012. They concluded that the annual emissions from existing CFC-11 banks alone could not fully explain the observed increase, highlighting a need to evaluate other potential sources for unexpected emissions (Montzka et al., 2018). Therefore, the identification of new CFC-11 emission sources and updating its emission estimation are urgent works.
There are two popular methods frequently adopted to estimate CFC-11 emissions. The first is estimating its emissions based on an atmospheric observation dataset, including the inverse modeling approach, which identified the CFC-11 emission using two backward-running Lagrangian models, i.e., the UK Met Office Numerical Atmospheric-dispersion Modelling Environment (NAME) and the FLEXible PARTicle dispersion model (FLEXPART) (Park et al., 2021), and the ratio method, which is based on a correlation of CFC-11 with tracers holding clear emissions (Zhang et al., 2014). Many tracers have been adopted in previous studies, such as carbon monoxide (CO), chloroform (CHCl3) and carbon tetrachloride (CCl4) (Adcock et al., 2020; Huang et al., 2021). CO was often selected because its emission inventory was established well and updated frequently by MEIC (Multiresolution Emission Inventory for China, http://meicmodel.org.cn/#firstPage, last access: 12 January 2024). The essential precondition is that the CFC-11 and CO sources are co-located (Dhomse et al., 2019; Huang et al., 2021; Kim et al., 2010). However, CO is a tracer for incomplete combustion (Zeng et al., 2020). If the CFC-11 emission amounts were obtained by multiplying CO emission amounts with a CFC-11 / CO ratio from a linear fit, the results would be untenable for the following two reasons: (1) the CFC-11 / CO ratios selected varied in different studies, e.g., 0.087 (Huang et al., 2021), 0.079 (Huang et al., 2021), 0.027–0.069 (Palmer et al., 2003) and 0.022 (Shao et al., 2011). There was no objective criterion for selecting the CFC-11 / CO ratios. (2) The hypothetical co-locations of CFC-11 and CO do not mean that their sources are the same. The obtained CFC-11 emission amounts obtained through this method actually mean that CFC-11 is related only to the combustion sources.
The second method to estimate CFC-11 emissions is a bottom-up method. The CFC-11 emission inventory was estimated based on the reported CFC-11 production and use (PAU) amounts from different sectors, including foam blowing, solvents and refrigerators (Fang et al., 2018; Wan et al., 2009; Zhao et al., 2011), and combustion sources (coal combustion, diesel combustion, etc.) were never included. Additionally, in the fields of source profiles of volatile organic compounds (VOCs), CFC-11 has been frequently detected for various types of combustion sources (Gong et al., 2019; SPECIATE Version 5.3; Sun et al., 2019). The emitted mass concentrations or emission factors of CFC-11 from various combustion sources have also been widely reported, such as power plants (12.5 µg m−3) (Shi et al., 2015), gasoline and diesel vehicles (0.01–0.06 mg km−1) (Wang et al., 2020), and coal combustion (0.07–0.51 ppbv) (Li et al., 2003). CFC-11 can be formed by the combustion of coal that contains the necessary elements of carbon, chlorine and fluorine (Jin et al., 2025; Luo et al., 2004). The level of CFC-11 has been detected at ppb levels in combustion (Pons et al., 2019), which is 3 magnitudes higher than its ambient levels. To the best of our knowledge, the emission inventory of CFC-11 emissions from combustion sources has not been reported.
In this study, we detected the emission factors (EFs) of CFC-11 from domestic coal combustion (chunk coal and honeycomb briquette) and coal-fired power plants with a unified dilution sampling method. An emission inventory with high spatial resolution of CFC-11 from coal combustion in China during 2000–2021 was first established. The variation trends of CFC-11 emitted from coal combustion and PAU were compared. The impact of CFC-11 emissions from coal combustion in the hotspots of Shandong and Hebei provinces on coastal air was simulated with the WRF-FLEXPART model. This study provides a quantitative assessment of CFC-11 emissions from coal combustion in China, offering new insights for identifying its variation trend in ambient air and refining the projection of stratospheric ozone layer recovery.
2.1 Source sampling
To ensure the representativeness and applicability of the emission factors, the combustion experiments were designed to closely simulate real-world domestic coal combustion conditions in rural China. A total of 10 kinds of chunk coals and 11 kinds of honeycomb briquettes were collected and burned in a laboratory in Wuhan. The annual average ambient level of CFC-11 was 0.6 µg m−3 in the year 2023. Fuels were collected from eight agricultural regions of China (Fig. S1 in the Supplement), including the Northeast Plain (Heilongjiang, Jilin and Liaoning), arid and semi-arid regions of North China (Inner Mongolia, Ningxia, Gansu and Xinjiang), the Loess Plateau (Shaanxi and Shanxi), the North China Plain (Anhui, Beijing, Hebei, Henan, Jiangsu, Shandong, Shanghai and Tianjin), the Yangtze Plain (Hubei, Hunan, Jiangxi and Zhejiang), Sichuan Basin (Sichuan and Chongqing), the Yunnan-Guizhou Plateau (Guangxi, Guizhou and Yunnan), the Tibet Plateau (Qinghai and Xizang), and South China (Fujian, Guangdong and Hainan). The specific information on fuel collection can be seen in Table S1. If the fuel in one region was not collected, the fuel emission characteristics of the neighboring provinces were used as a substitute.
To minimize the impact of ignition smoke, both honeycomb briquettes and chunk coal were lit from beneath pre-measured charcoal. An electric oven was used to ignite the charcoal, allowing it to burn until visible smoke dissipated. The combustion state was controlled by adjusting the stove's bottom air door: fully open for flaming and closed for smoldering. This method replicated the actual burning practices observed in rural China (Yan et al., 2020; Yan et al., 2022). For each test, about 0.8 kg chunk coals and 1.5 kg honeycomb briquettes (three pieces) were burned. The stove used was a typical household furnace purchased from a local market, with an outer diameter, inner diameter and height of 30, 12 and 43 cm, respectively. An electronic scale was positioned at the bottom of the stove to record the variation in fuel quality. Flue gases were drawn with a sampling gun (1.5 m higher than the flame) and then diluted ∼ 30 times with a dilution system (TH-150, Wuhan Tianhong Ltd., China). The equipment settings can be found in our previous studies (Yan et al., 2020, 2022). The diluted gases were collected into a 4 L Tedlar bag at a flow rate of 150 mL min−1. The specific sampling systems can be seen in Fig. S2. Each sampling practice covered a whole fuel-burning period. A total of 52 sets of samples were obtained.
For coal-fired power plants, 6 L summa cans were used to collect the flue gas after dilution. Each sampling time lasted for about 23 h. The power plant has adopted ultra-low emission pollutant control measures, including wet desulfurization, electric dust precipitation and denitrification. Detailed information on the plant and field sampling settings can be found in our previous research (Zeng et al., 2021).
2.2 CFC-11 analysis, quality assurance and quality control
CFC-11 was analyzed by gas chromatography/mass spectrometry (GC–MS, Agilent 7820A/5977E). Samples were preconcentrated using a cold trap to remove water and CO2, with 300 mL of gas extracted from Tedlar bags or summa cans. The concentrated analytes were then injected into BD-624 chromatographic columns (60 m × 0.25 mm × 1.4 µm) via helium carrier gas. The GC system employed a dual-detector configuration: effluent from the column was split between an FID and an MS detector. The chromatographic column temperature was programmed from 35 to 180 °C at 6 °C min−1. Both detectors were maintained at 200 °C. The MS operated in EI mode (70 eV) for ionization. An internal standard method was used to calculate the concentration. Four internal standard substances were used: bromochloromethane, 1,4-difluorobenzene, chlorobenzene and 4-bromofluorobenzene. The CFC-11 substance was determined with a mass selective detector (MSD) by the target ion at 103/101, and this method has been widely used in previous research (Huang et al., 2021; Jin et al., 2025; Zhang et al., 2014). GC–MS has also been used in other research for CFC-11 observation (Park et al., 2021).
For quality control and quality assurance, the Tedlar bags were not reused in this study. A system blank test was conducted, after every 10 samples were analyzed and after the samples were analyzed at high concentrations. The calibration curves were updated monthly. A parallel sample was analyzed for every 10 samples or each batch (less than 10 samples) to ensure that the relative deviations of the targets were less than or equal to 30 %. If the relative deviations exceeded 30 %, then the sample was re-analyzed. Before each sample analysis, the relative abundance of water, nitrogen and oxygen should be less than 10 %; otherwise, leakage of the instrument system should be rechecked. The detection limit of CFC-11 was 0.15 µg m−3. The concentration of CFC-11 in the blank sample of the instrument was 0.
2.3 Calculation method of CFC-11 emission
The EFs of CFC-11 from domestic coal combustion were calculated as follows:
where i is the fuel type; EFi is the CFC-11 emission factor for the combustion of fuel i, mg kg−1; ci is the mass concentration of CFC-11 in the sampling port after the combustion of fuel i, µg m−3; v indicates the flow rate of flue gas, L min−1; vi indicates the sampling flow rate, L min−1; n is the dilution ratio; c0 is the mass concentration of CFC-11 in the atmospheric environment, which, in this study, was 0.6 µg m−3; t is the sampling time, min; and Mi is the weight of fuel i burned, kg. The average mass concentration of CFC-11 from domestic coal combustion was 93.9 ± 90.4 µg m−3, which was 150.7 times that of the ambient concentration, indicating that the impact of ambient CFC-11 concentrations on its emission from coal combustion sources can be ignored.
The EFs of CFC-11 from coal-fired power plants were calculated as follows:
where i is the fuel type; mi is the emission amount of CFC-11 released from the combustion of fuel i, mg; ci is the mass concentration of CFC-11 from the stack, ignoring the CFC-11 ambient concentration, µg m−3; v1 indicates the sampling flow rate, L min−1; t is the sampling time, min; EFij is the CFC-11 emission factor emitted by the combustion of coal i from power plant j, mg kg−1; rj is the semidiameter of the stack at the sampling point, m; r is the semidiameter of the sampling nozzle, m; n is the dilution ratio; v is the flow rate of flue gas, L min−1; and Mi is the weight of coal i burned, kg.
The CFC-11 emission amounts were calculated by multiplying its EFs (Table S2) with the corresponding coal consumption amounts each year in China. The coal consumption amounts for each province of China from 2000–2021 were obtained from the China Energy Statistical Yearbook, and there were no data for Hong Kong SAR, Macao SAR, Taiwan and Xizang ( National Bureau of Statistics of China, 2001–2022). The coal consumption amounts from 2022–2060 were calculated according to the decrease rate in references (Wu et al., 2024; Energy Foundation, 2024). The spatial distribution of CFC-11 from domestic coal combustion was allocated according to the 2000–2018 land use data with 30 m × 30 m and the 2000–2021 population distribution data with 1 km × 1 km (WorldPop and Center for International Earth Science Information Network) (Gong et al., 2019, 2020). The land use data for 2019–2021 used the data in 2018. The point of interest (POI) industrial data were obtained to allocate the CFC-11 emission from coal-fired power plants into each plant (Fig. S3). The specific calculation and allocation method can be found in our previous studies (Cheng et al., 2022; Wu et al., 2021).
When using CO as a tracer to calculate the CFC-11 emissions, the following equation was adopted (Palmer et al., 2003):
where ECFC-11 is the CFC-11 emissions (in tonnes, t); ECO is the CO emissions (in tonnes, t); is the slope of the linear correlation between ΔCFC-11 and ΔCO; and MCFC-11 and MCO are the molecular weights of CFC-11 and CO.
The CO2-equivalent (CO2-eq) emissions were calculated by multiplying the CFC-11 emission amounts by its global warming potential (GWP) value of 7090 (Burkholder et al., 2022).
2.4 WRF-FLEXPART modeling
A previous study identified the Shandong and Hebei provinces as the dominant source regions for CFC-11 detected on islands near Korea and Japan (Park et al., 2021). Here, we tried to explore the influence of CFC-11 emissions from coal combustion in the two provinces on its ambient levels. FLEXPART has usually been employed for inverse estimation of CFC-11 emissions by other researchers (An et al., 2012; Park et al., 2021; Rigby et al., 2019). Here, January was the heating period with higher coal combustion, and the year 2016 had higher CFC-11 emissions (Montzka et al., 2018); January 2016 was selected as the simulation period. The meteorological input data were obtained and downloaded from the National Centers for Environmental Prediction (NCEP) Final Analysis (FNL; https://rda.ucar.edu/, last access: 15 November 2024), which provided the lateral boundary conditions and initial meteorological fields for the simulation. The FNL data have a horizontal resolution of 1° × 1° and a temporal interval of 6 h. The simulation domain encompassed the East Asian region (within the boundary of 20–47° N and 110–140° E). Hebei and Shandong were identified as the primary CFC-11 release areas. The simulation period was set as January 2016 (similar to the monitoring period in previous studies) (Park et al., 2021), utilizing the forward modeling approach for analysis. Air parcels were released from the gridded emission areas over the Hebei and Shandong provinces at altitudes from the surface up to 100 m, reflecting the near-ground emissions from coal combustion.
3.1 CFC-11 EFs for coal combustion and comparison with other sources
The EFs of CFC-11 from chunk coal and honeycomb briquette combustion varied from 0.3 to 12.7 mg kg−1 (3.6 ± 2.9 mg kg−1) and from 0.6 to 4.2 mg kg−1 (3.2 ± 0.7 mg kg−1), respectively (Fig. 1). These values were 144 and 128 times higher than the EF for coal-fired power plants (0.025 mg kg−1). The honeycomb briquette had higher combustion efficiency than chunk coal, which may reduce the release of chloride and the formation of CFC-11 (Li et al., 2016). The much lower EFs for coal-fired power plants could be related to the high combustion temperature and series of flue gas treatment measures (Yan et al., 2016). CFC-11 includes chloride (Cl) and fluoride (F), and the formation of CFC-11 needs the participation of both. F and Cl were widely distributed in coal (Jin et al., 2025; Yang et al., 2017). Former studies indicated that F content varied within 20–300 mg kg−1 from coals in the North China Plain and Northwest China, lower than those from Southwest China (50–3000 mg kg−1) (Luo et al., 2004). Yang et al. (2017) reported that the F content in China's coal varied from 11 to 3575 mg kg−1, with an average value of 130 mg kg−1. Chen (2010) collected 305 kinds of coal samples from all around China and analyzed the Cl content, indicating that the Cl content varied from 13.2 to 2815 µg g−1. Jin et al. (2025) reported that the chlorine content of bituminous coal was 252.5 mg kg−1 in China. The formation and emission mechanisms of CFC-11 during coal combustion remained unclear. Only one older study reported that CFC-11 could be detected from the combustion of all 23 tested types of coal, and the release of CFC-11 peaked at a combustion temperature of 400 °C (Li et al., 2004). Coal combustion could emit halogenated organic compounds, such as methyl chloride (CH3Cl) and chloroform (CH2Cl2) (Liu et al., 2024). Recent research presented the possible formation route of CFC-11 from the above halogenated organic compounds in the iron and steel industry, based on the traditional liquid-phase fluorination method (Liu et al., 2024). This exploratory study primarily deduced that the formation conditions of CFC-11 in coal combustion were similar to the industrial synthesis conditions of CFC-11. The transformation pathways of solid fluoride in coal to CFC-11 and influencing parameters remain unclear. The mechanisms driving the formation and release of CFC-11, as well as the dominant influencing factors, are still unexplored and warrant further investigation.
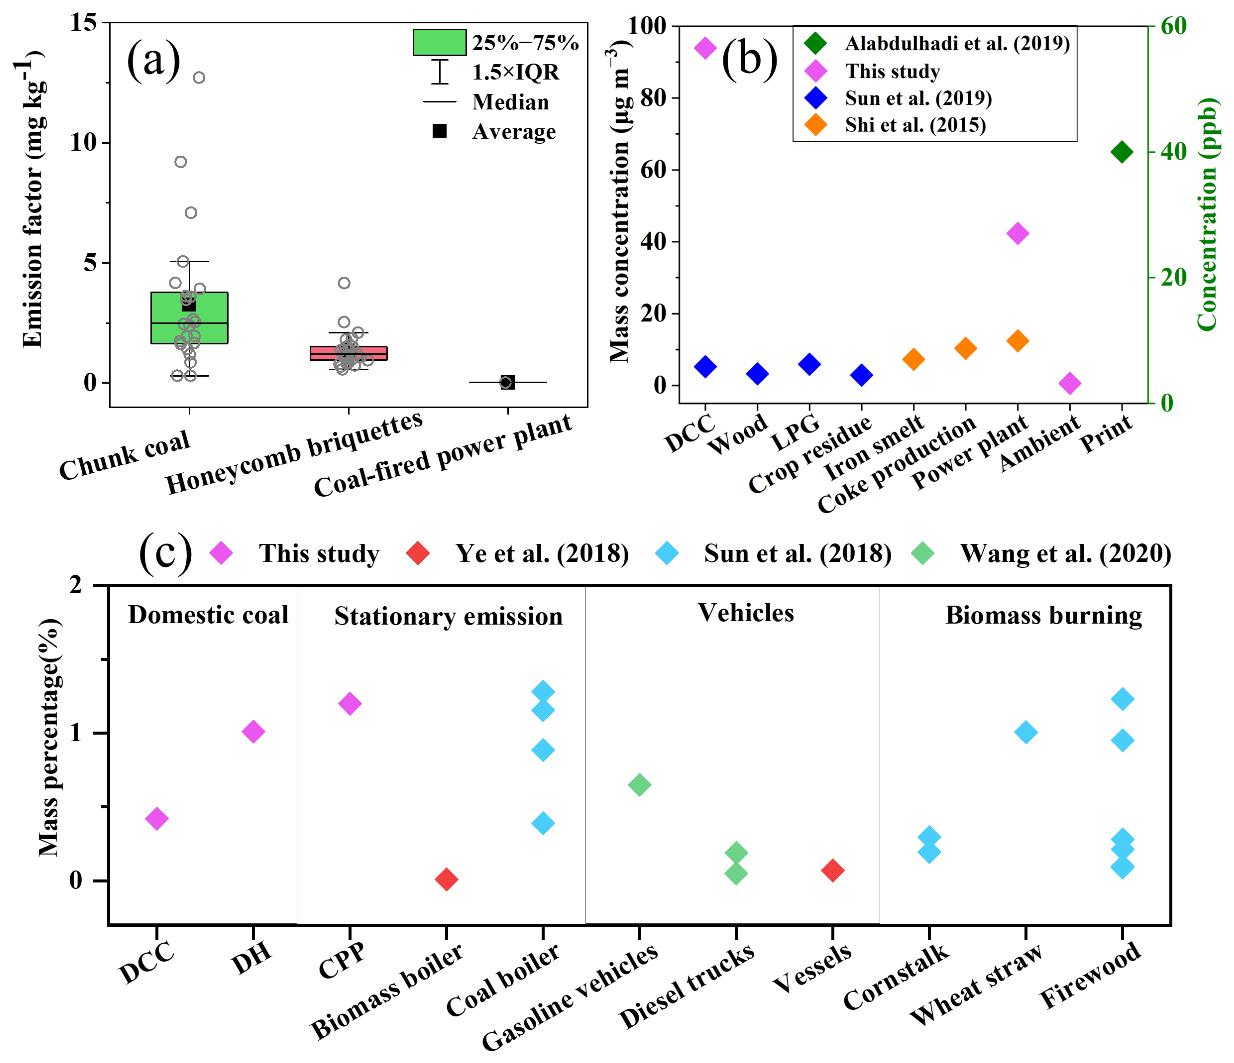
Figure 1Comparison of CFC-11 emission from coal combustion and other sources based on its emission factor (a), mass concentration (b) and mass percentage (c) in total VOCs. The VOCs included 102, 61, 107, 101, 98 and 102 species in this study, Sun et al. (2019), Shi et al. (2015), Ye (2018), Sun et al. (2018) and Wang et al. (2020), respectively. DCC means domestic chunk coal, DH means domestic honeycomb, and CPP means coal-fired power plant.
Previous studies have reported the emission of CFC-11 from other anthropogenic sources (Gong et al., 2019; Sun et al., 2019). Domestic anthracite coal combustion (5.2 µg m−3) (Sun et al., 2019), coating (44.5 and 91.0 µg m−3) and printing (40 ppb and 10.9 µg m−3) all emitted CFC-11 (Alabdulhadi et al., 2019; Shen et al., 2018). Figure 1b presents the CFC-11 mass concentration for reported combustion sources in the literature, including coal-fired power plants (42.3 µg m−3), iron smelting (7.3 µg m−3), coke production (10.3 µg m−3) and coal-fired power plants (12.5 µg m−3) (Shi et al., 2015). The CFC-11 accounted for 0.4 %, 1.0 % and 1.2 % of the total volatile organic compounds (VOCs) detected from the combustion of chunk coal, honeycomb briquette and coal-fired power plants in this study, respectively. The CFC-11 also detected from stationary combustion of biomass (0.01 %) (Ye, 2018), heavy-duty diesel trucks (0.05 % or 0.2 %) (Wang et al., 2020), vessels (0.07 %) (Ye, 2018) and corn stover burning (0.3 % or 0.2 %) has also been reported in the literature (Fig. 1c) (Sun et al., 2018). Ground measurement campaigns also recorded high CFC-11 levels from specific events, such as 626 and 658 ppt for garbage burning and a landfill fire near Mecca, respectively (Simpson et al., 2022). Although combustion-related CFC-11 emissions were influenced by combustion conditions, these findings provided evidence for the contribution of coal combustion and other combustion sources to overall CFC-11 emissions.
3.2 Spatiotemporal distribution of CFC-11 from coal combustion in China
The annual CFC-11 emissions from coal combustion in China during 2000–2021 exhibited fluctuations and an overall upward trend, peaking at 268.7 t yr−1 in 2016 (Fig. 2a–b). CFC-11 emissions increased after 2012, consistent with previous studies that reported rising CFC-11 concentrations in ambient air (Adcock et al., 2020; Montzka et al., 2018; Rigby et al., 2019). Approximately 40 %–60 % of the global increase in CFC concentration was attributed to China, particularly the Shandong and Hebei provinces (Adcock et al., 2020; Montzka et al., 2018; Rigby et al., 2019). This study found marked increases in CFC-11 emissions from Hebei (14.3 t yr−1) and Shandong (11.0 t yr−1) in 2013, which were 2.2 and 1.4 times the respective emission amounts in 2012 (Fig. 3). The emission of CFC-11 emissions from coal combustion in China fluctuated during 2001–2021, averaging 233.5 t yr−1. The contribution of coal combustion to CFC-11 emissions on a global scale needs further research.
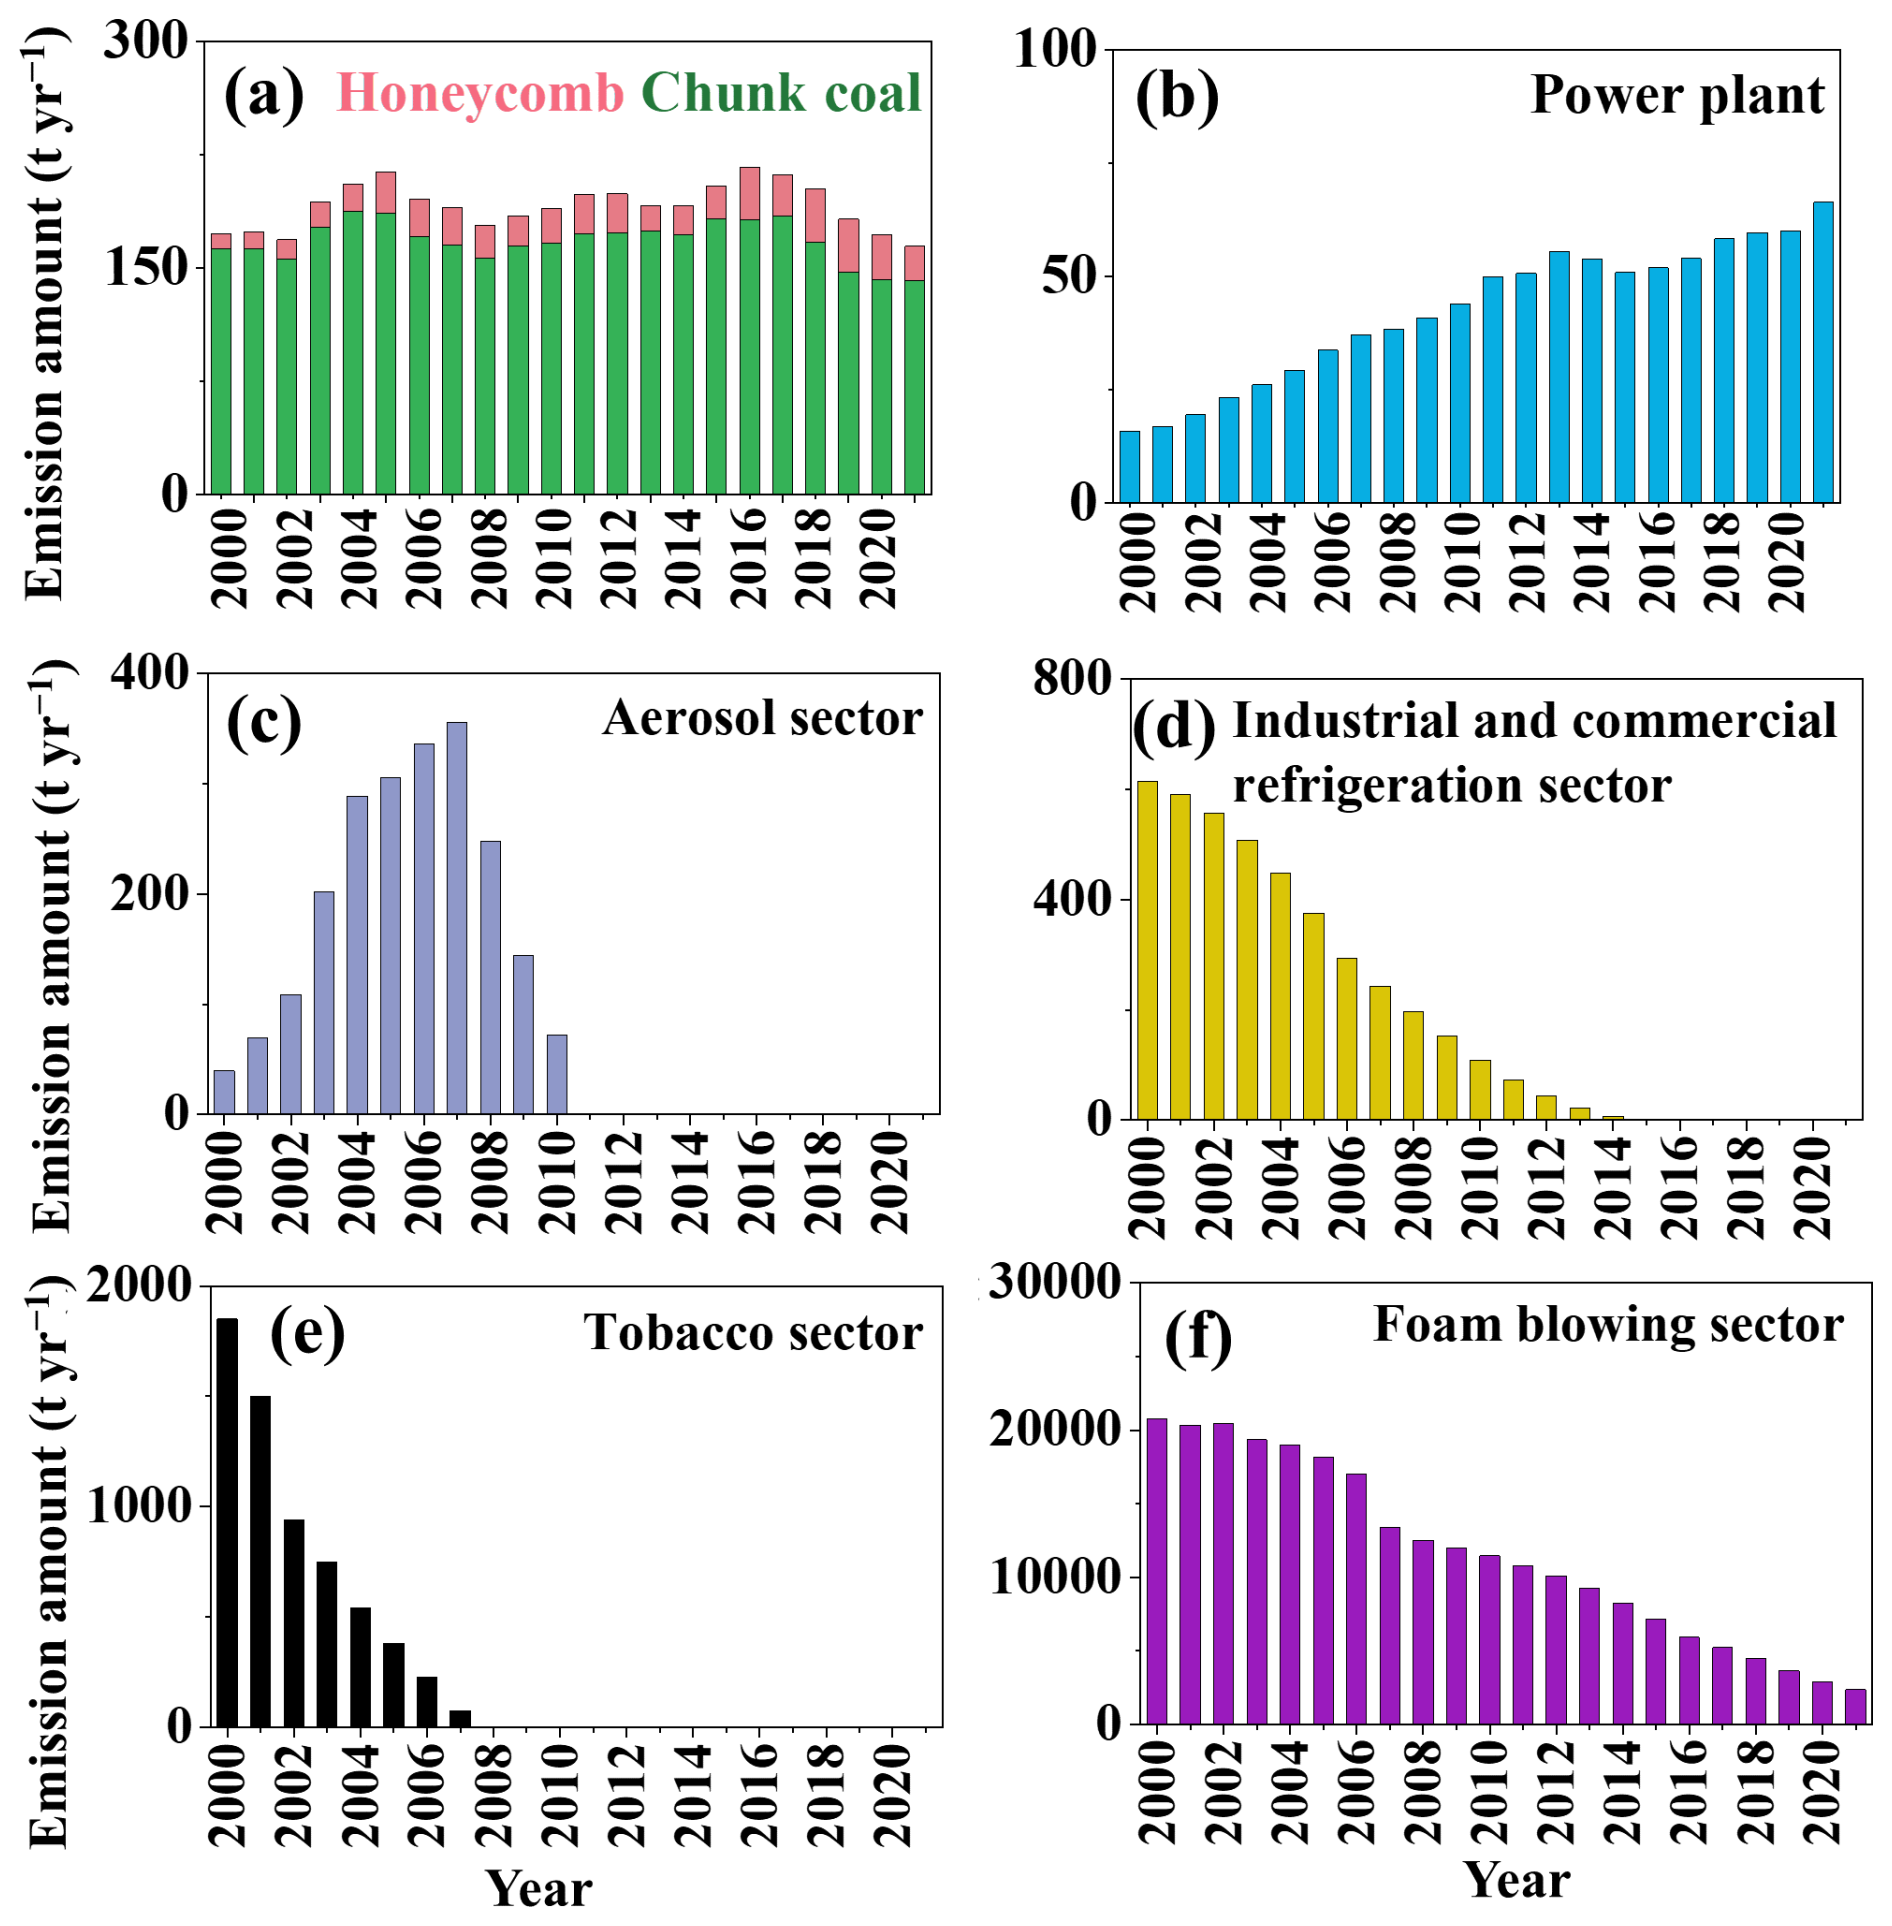
Figure 2Annual CFC-11 emission from domestic coal combustion (a), coal-fired power plants (b), the aerosol sector (c), the industrial and commercial refrigeration sector (d), the tobacco sector (e), and the foam-blowing sector (f) in China. The data for panels (a) and (b) were calculated in this study. The data for panels (c)–(f) come from Fang et al. (2018).
Although the contribution of domestic chunk coal combustion to CFC-11 annual emissions decreased from 2000 to 2021, it was still the dominant contributor, accounting for 60.9 %–86.4 % of CFC-11 emissions of domestic coal combustion in China (Fig. 3). By 2021, the cumulative CFC-11 emissions from coal combustion reached 5135.7 t in China (Fig. S4), with domestic coal combustion contributing 4200.0 t and coal-fired power plant contributing 935.7 t. With the transformation of China's energy structure, the proportion of CFC-11 emissions from coal-fired power plants in total CFC-11 emissions from coal combustion increased from 7.9 % in 2000 to 18.2 % in 2021.
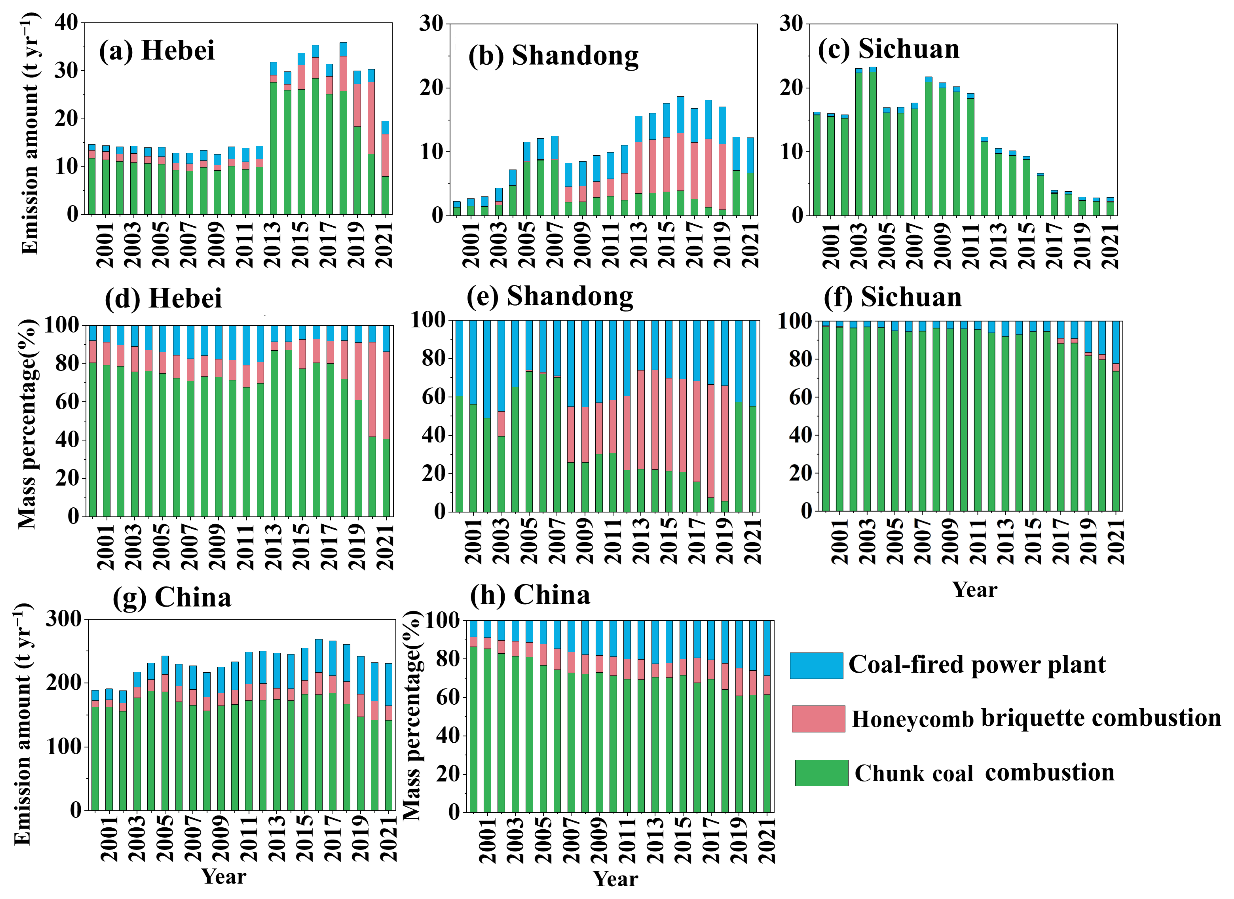
Figure 3The CFC-11 emission amounts (a–c) and mass percentages (d–f) from power plants, domestic chunk coal and honeycomb combustion in Hebei, Shandong and Sichuan, as well as those for all of China (g, h).
Previous studies have constructed CFC-11 emission inventories for its PAU processes and formed a PAU emission bank (Fang et al., 2018; Wan et al., 2009), which mainly included the aerosol, industrial and commercial refrigeration, tobacco, and foam-blowing sectors in China, as shown in Fig. 2c–f. The CFC-11 emission amounts from coal combustion were comparable with those from the aerosol sector and from industrial and commercial refrigeration. The CFC-11 emissions from the aerosol and tobacco sectors disappeared after 2010 and 2007 as a result of the Montreal Protocol, respectively. After 2015, the foam-blowing sector became the sole contributor to CFC-11 emissions among these sectors, with its emission declining to 7155.9 t yr−1. If all other CFC-11 emissions from PAU sources gradually approached 0 while the CFC-11 emissions from coal combustion persisted, the influence of CFC-11 emissions from coal combustion should be considered at that time, especially when the CFC-11 emissions from PAU were reduced to 0.
Figure S5 presents the CFC-11 emissions from coal combustion in different provinces in China during 2000–2021. Provinces in heating areas (Fig. S6), including Inner Mongolia, Hebei, Henan, Xinjiang, Shandong and Shanxi, all of which are in the northern region of China, exhibited high CFC-11 emissions throughout the study period, which, for 2021, were 36.1, 19.5, 10.0, 21.2, 12.2 and 15.2 t, respectively. Figures 4 and S7 show the CFC-11 emission intensity of CFC-11 from domestic coal combustion. High-emission areas were consistently concentrated in the North China Plain, including Hebei, Shandong and Henan, where residential coal consumption has historically been significant. Over time, these high-emission zones became more pronounced, particularly after 2013.
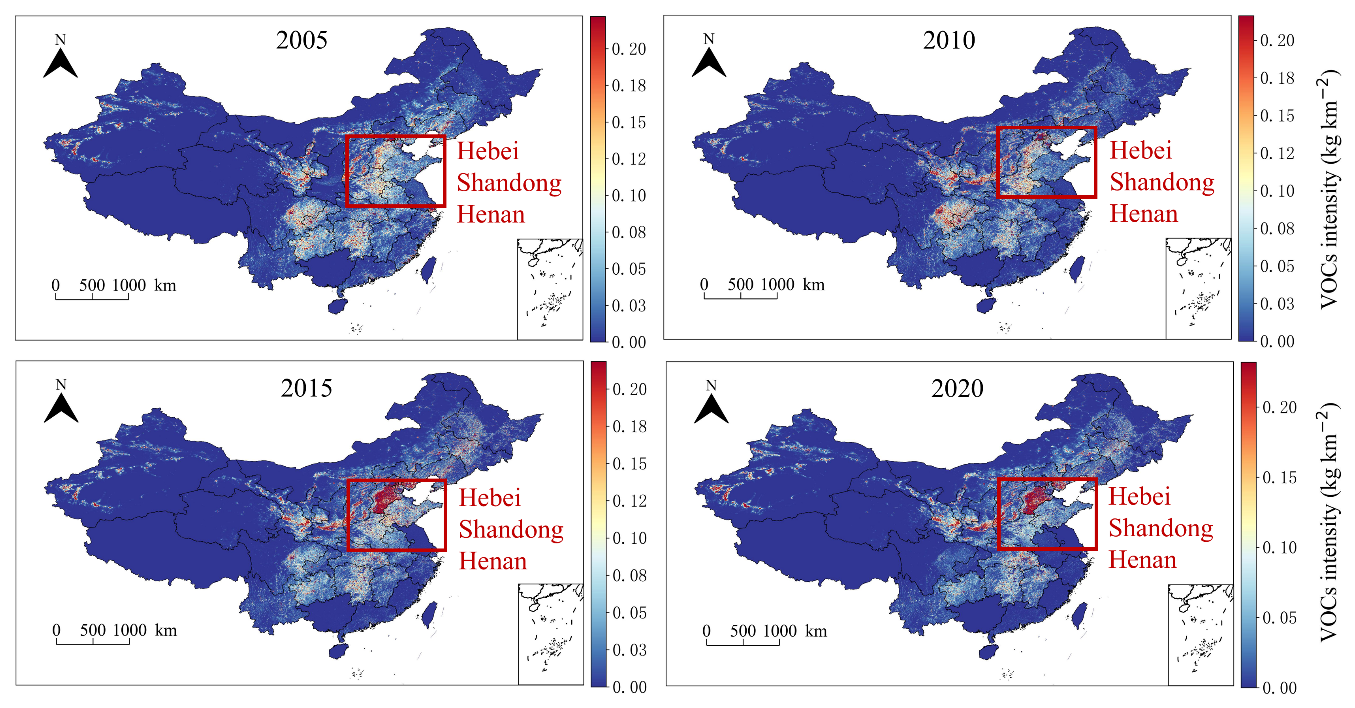
Figure 4Emission intensity of CFC-11 from domestic coal combustion in 2005, 2010, 2015 and 2020.
3.3 Comparison with CFC-11 emission obtained from CFC/CO ratios
In this study, the slope of CFC-11 and CO from coal combustion was 0.447 (Fig. 5), higher than 0.039–0.087 in the atmosphere (Huang et al., 2021). The CFC-11 emission inventory from coal combustion was obtained according to the CO emission inventory from coal combustion and the CFC-11 / CO ratio. Figure 5b presents the CFC-11 emission from coal combustion using the CO tracer method and bottom-up method. The CFC-11 emission obtained through the CO tracer method was 7872–60 466 kt yr−1, much higher than the emission obtained using the bottom-up method (7.9–60.8 t yr−1). Although the ratio method using CO as a tracer was commonly applied in estimations, it might lead to an overestimation of CFC-11 emissions. Because CO had many emission sources, if the ratio was calculated using CFC-11 / CO in the atmospheric concentration, then CFC-11 was also assumed to come from these emission sources. From previous research, CFC-11 emission from combustion sources, including industrial processes, vehicle emissions, garbage burning, liquefied petroleum gas (LPG) and biomass burning, has long been overlooked (Shen et al., 2018; Wu and Xie, 2017). However, the growing significance of these emissions highlights the need for a more comprehensive evaluation of all potential sources of CFC-11, including the above-mentioned combustion sources and non-combustion sources like fuel oil storage, oil transportation and printing facilities (Alabdulhadi et al., 2019).
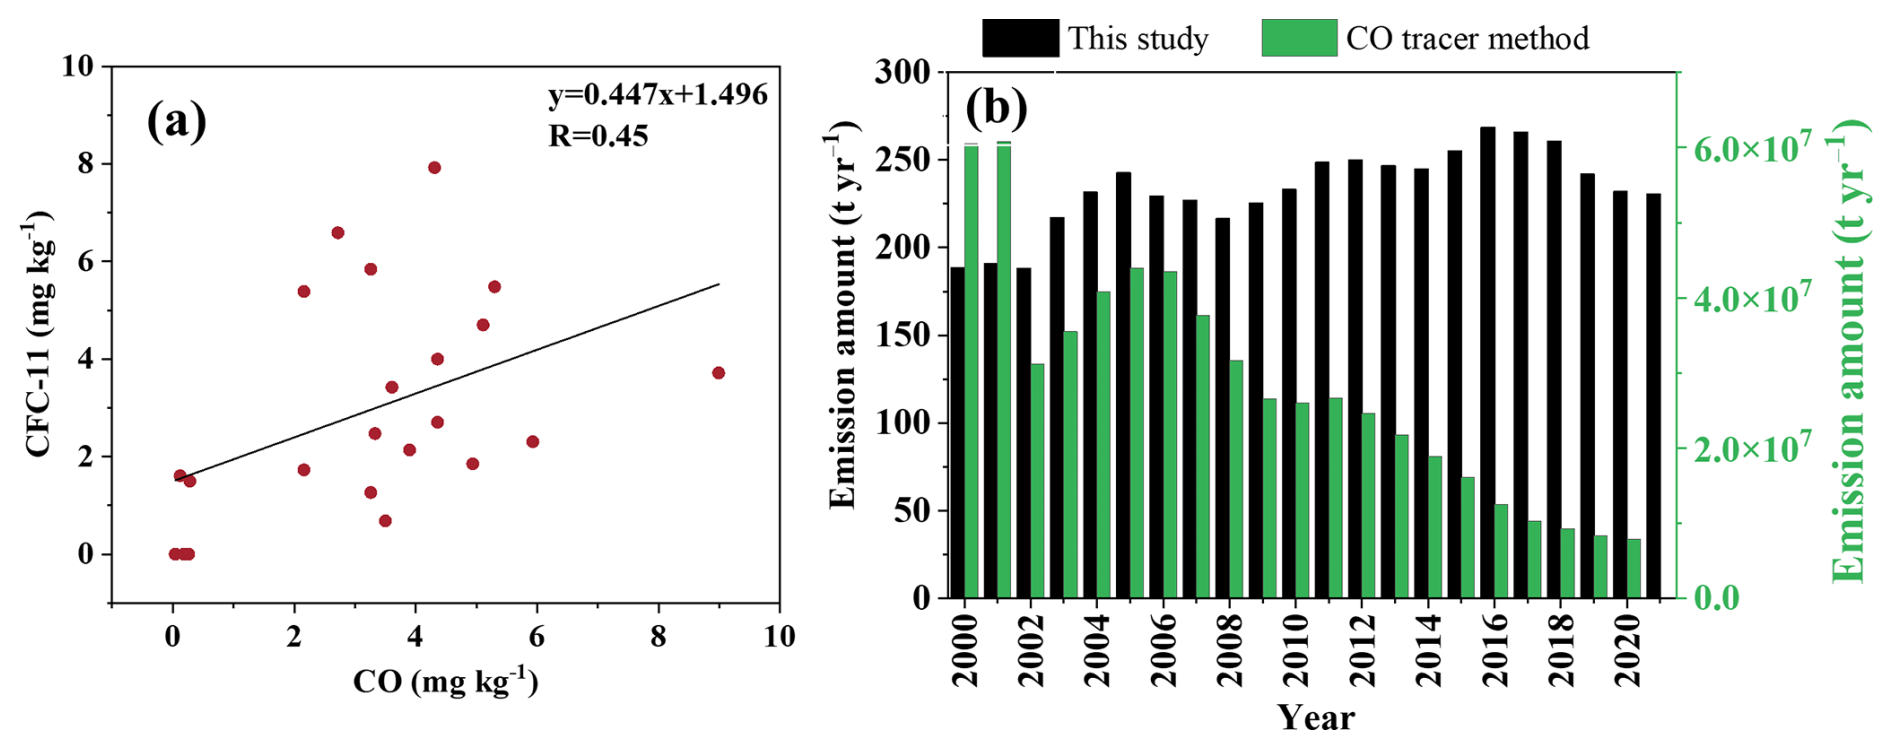
Figure 5Interspecies correlations of CFC-11 with CO from coal combustion, with R= Pearson's r (a), and comparison of CFC-11 emissions from coal combustion between the method of this study and the CO tracer method (b). The emission inventory of CO for coal combustion was obtained from previous studies (Liu et al., 2015; Peng et al., 2019; Tong et al., 2018).
3.4 Increasing importance of coal combustion in CFC-11 emission
A lot of researchers calculated the CFC-11 emissions in China and even globally based on ambient monitoring data (Table S3) and found that the CFC-11 emissions from coal combustion were smaller than all CFC-11 emissions in China. The proportion of CFC-11 emissions from coal combustion relative to its bank emissions increased year by year from 2000 (Fig. 6a). The annual CFC-11 emissions from coal combustion in China from 2000 to 2021 varied from 188.5 to 268.7 t yr−1, accounting for 1.5 %–2.1 % of the global increase in CFC-11 emission of 13 ± 5 kt yr−1 reported in the literature (Montzka et al., 2018). In 2000, the CFC-11 emission from coal combustion was 188.5 t yr−1, accounting for only 0.8 % of PAU emissions in China. By 2021, however, CFC-11 emissions from coal combustion had risen to 9.8 % of PAU emissions according to Fig. 6a. After 2025, the CFC-11 emission from PAU in China was 0 (Fang et al., 2018), but the CFC-11 from coal combustion still existed, as seen in Fig. S8. Subsequent controls should give greater consideration to coal combustion because of its widespread sources (Jin et al., 2025).
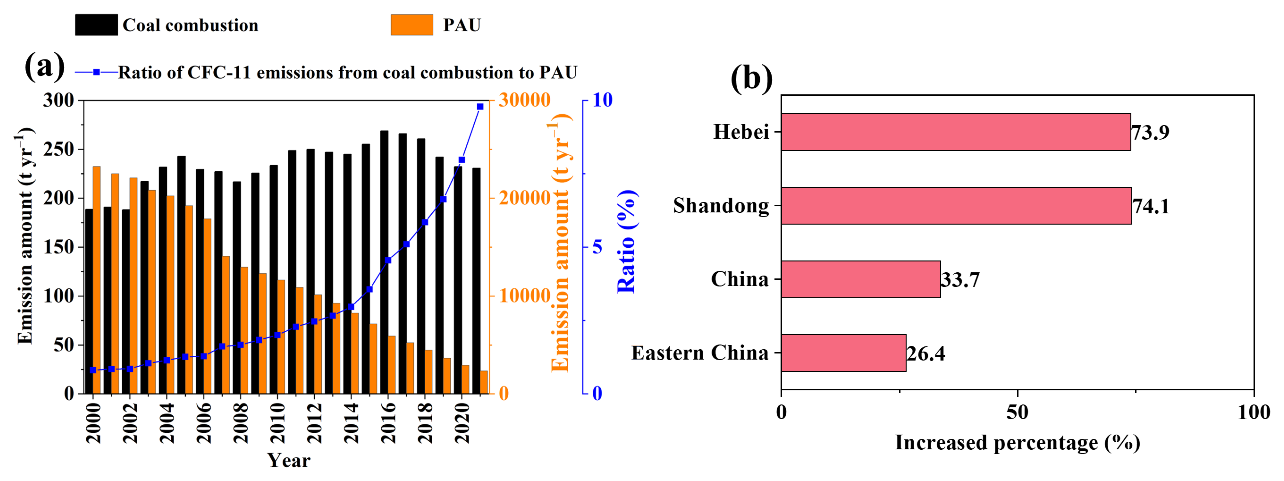
Figure 6(a) Comparison of CFC-11 emission amounts from coal combustion (including coal consumed in domestic use and power plants) with CFC-11 emission from production and use (PAU), including the aerosol sector, tobacco sector, foam-blowing sector, and industrial and commercial refrigeration sector in China (Fang et al., 2018). (b) The increased percentages of CFC-11 in this study in 2014–2017 compared to 2011–2012.
CFC-11 emissions from coal combustion increased sharply in 2013, as seen in Fig. 2. From 2014 to 2017, CFC-11 emissions from coal combustion in China, Shandong Province and Hebei Province increased compared to their corresponding emissions in the 2011–2012 period; the increasing ratios were 33.7 %, 74.1 % and 73.9 %, respectively (Fig. 6b). Previous studies indicated that the concentration of CFC-11 in the Northern Hemisphere's atmosphere in 1995 was approximately 267 ppt (Montzka et al., 2018). In 2060, the concentration of CFC-11 will be 136.7 ppt, and in 2100, the concentration of CFC-11 will still be 69.5 ppt (Daniel et al., 2022). Considering that the lifetime of CFC-11 is about 52 years (Burkholder et al., 2022), we inferred that coal combustion might slightly contribute to the 136.7 and 69.5 ppt of CFC-11.
3.5 Additional climate benefits of clean heating and coal-to-electricity policies
As clean coal and heating policies were implemented, the coal consumption structures became different in the southern (e.g., Sichuan) and northern (Hebei and Shandong) provinces and changed quickly, which led to a clear variation of CFC-11 emission from coal combustion (Fig. 3). The CFC-11 emission from honeycomb briquette combustion increased for Hebei and Shandong after 2013, when the Action Plan for Air Pollution Prevention and Control in China was released (Geng et al., 2024). In the Sichuan province, CFC-11 emissions from chunk coal combustion decreased significantly, especially after 2013. By 2020, no CFC-11 emissions from honeycomb briquette combustion were detected in the Shandong and Sichuan provinces.
With the replacement of chunk coal with honeycomb briquette and the coal-to-electricity policy, the emission of CFC-11 from chunk coal combustion gradually decreased after 2016 for China (Fig. S9). Domestic coal combustion was projected to cease entirely by 2030 (Energy Foundation, 2024), and CFC-11 emissions from coal-fired power plants should decrease gradually to 0 by 2060 to realize carbon neutrality (Fig. S9) (Wu et al., 2024). From 2000 to 2060, the cumulative CFC-11 emissions from coal combustion in China will be 7115.0 t. Even though the coal consumption structure has changed (Shen et al., 2022), coal combustion remains a stable emission source of CFC-11. Its accumulated emission amounts are similar to the historical (2000–2060) CFC-11 emissions from the tobacco sector (6263 t) and higher than that of the aerosol sector (4233 t) and industrial and commercial refrigeration (2169 t).
Figure 7 illustrates the CO2-eq emissions in China from coal combustion between 2000 and 2021. In 2021, the CO2-eq emissions reached 1.7 × 10⁶ t yr−1, accounting for 0.02 % of total anthropogenic CO2 emissions in China and 0.2 % of CO2 emissions from cement from the Global Carbon Atlas (2024). This value accounts for 0.03 % of China's forest carbon sink (6.6 × 10⁹ t CO2) (Liu et al., 2015; Pan et al., 2011). These findings highlight the need to reassess the role of CFC-11 from combustion emissions in global warming potential. From Fig. 7b, the contribution of chunk coal combustion to CO2-eq emissions decreased from 89.3 % in 2000 to 63.3 % in 2021 and will decrease to 0 after 2030. The replacement of chunk coal with honeycomb briquette resulted in a decrease of 25.2 % in chunk coal usage and 8.9 % in honeycomb usage (China Energy Statistical Yearbook). During 2000–2021, if all chunk coal was replaced by honeycomb briquette, CFC-11 and CO2-eq emissions would be reduced by 10.6–16.0 t yr−1 and 7.5 × 10⁴–1.1 × 10⁵ t yr−1, respectively (Figs. S6 and 7c). This study verified the necessity of energy mix adjustment and the use of clean energy from the aspect of co-prevention and control of multi-pollutants and the win-win scenario in the climate and environment (Shen et al., 2019; Shen et al., 2021; Tao et al., 2021). Although the decreased CFC-11 and CO2-eq emissions were small, their impacts on the ozone layer and climate change should not be underestimated because of the extensive and universal sources of CFC-11 emissions (Jin et al., 2025).
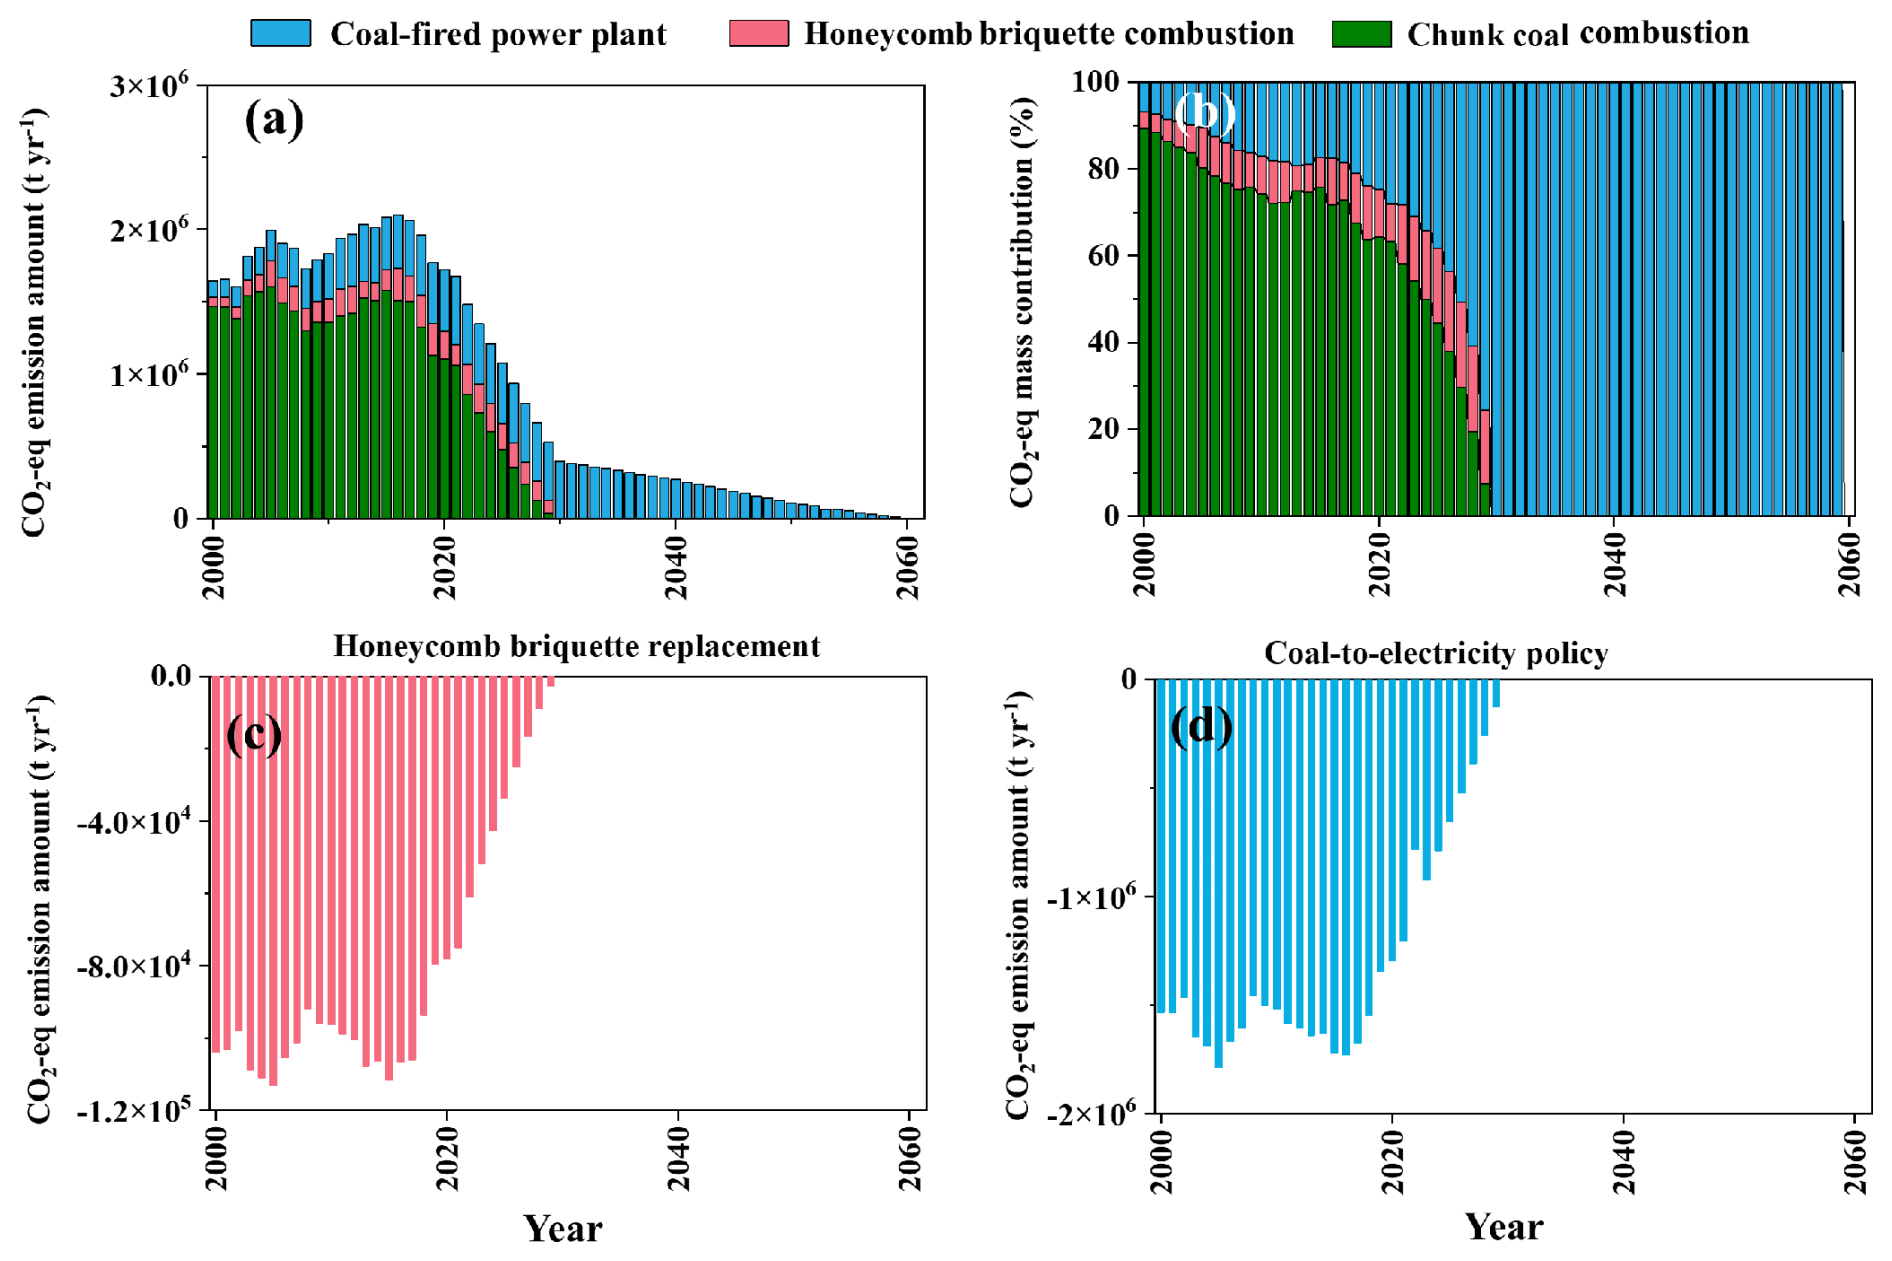
Figure 7(a) Annual CO2-eq emission amounts and (b) CO2-eq mass contribution for CFC-11 emitted from coal combustion in China in this study. The changes in CO2-eq emissions from CFC-11 if coal was replaced by honeycomb (c) and if domestic coal was replaced by electricity produced in coal-fired power plants (d).
In contrast, the contribution of coal-fired power plants to CO2-eq emissions increased from 6.8 % in 2000 to 28.0 % in 2021 and is expected to rise to 100 % after 2030. The coal-to-electricity strategy implemented in China increased the coal consumption in power plants (Wang et al., 2020), significantly reducing CFC-11 emissions from domestic coal combustion by 170.1–252.0 t yr−1 and reducing CO2-eq emissions by 1.2 × 10⁶–1.8 × 10⁶ t yr−1 during 2000–2021 (Figs. S6 and 5d). This indicates that transitioning to cleaner coal alternatives can not only improve the air quality in the North China Plain (Fang et al., 2019) but also yield unexpected significant climate benefits by reducing CFC-11 and CO2-eq emissions. However, CFC-11 has a very large and uncertain indirect radiative cooling effect due to its depletion of ozone, resulting in an indirect GWP of −4390 (Daniel et al., 2022). CO2-eq emission in this study was calculated using direct GWP, but relying solely on the direct GWP might lead to overestimation of its climate impact. Therefore, a more comprehensive approach is essential for accurately assessing the full climate impact of CFC-11 and informing effective mitigation strategies.
3.6 The influence of CFC-11 from coal combustion on ambient concentration
Previous researchers indicated that additional emission of CFC-11 was found in 2016 (Montzka et al., 2018; Rigby et al., 2019); monthly CFC-11 emission is presented in Fig. 8. The monthly CFC-11 emissions from domestic coal combustion were allocated according to Wu et al. (2021), whereas those from coal-fired power plants were allocated according to the power generation volume from the National Bureau of Statistics of China (2025) (https://www.stats.gov.cn/, last access: 12 January 2025). The higher CFC-11 emissions from domestic coal combustion occurred in cold months, i.e., January (22.1 t), February (22.1 t), October (22.1 t), November (26.1 t) and December (24.1 t). The higher CFC-11 emissions from coal-fired power plants occurred in August (4.9 t) and December (5.0 t).
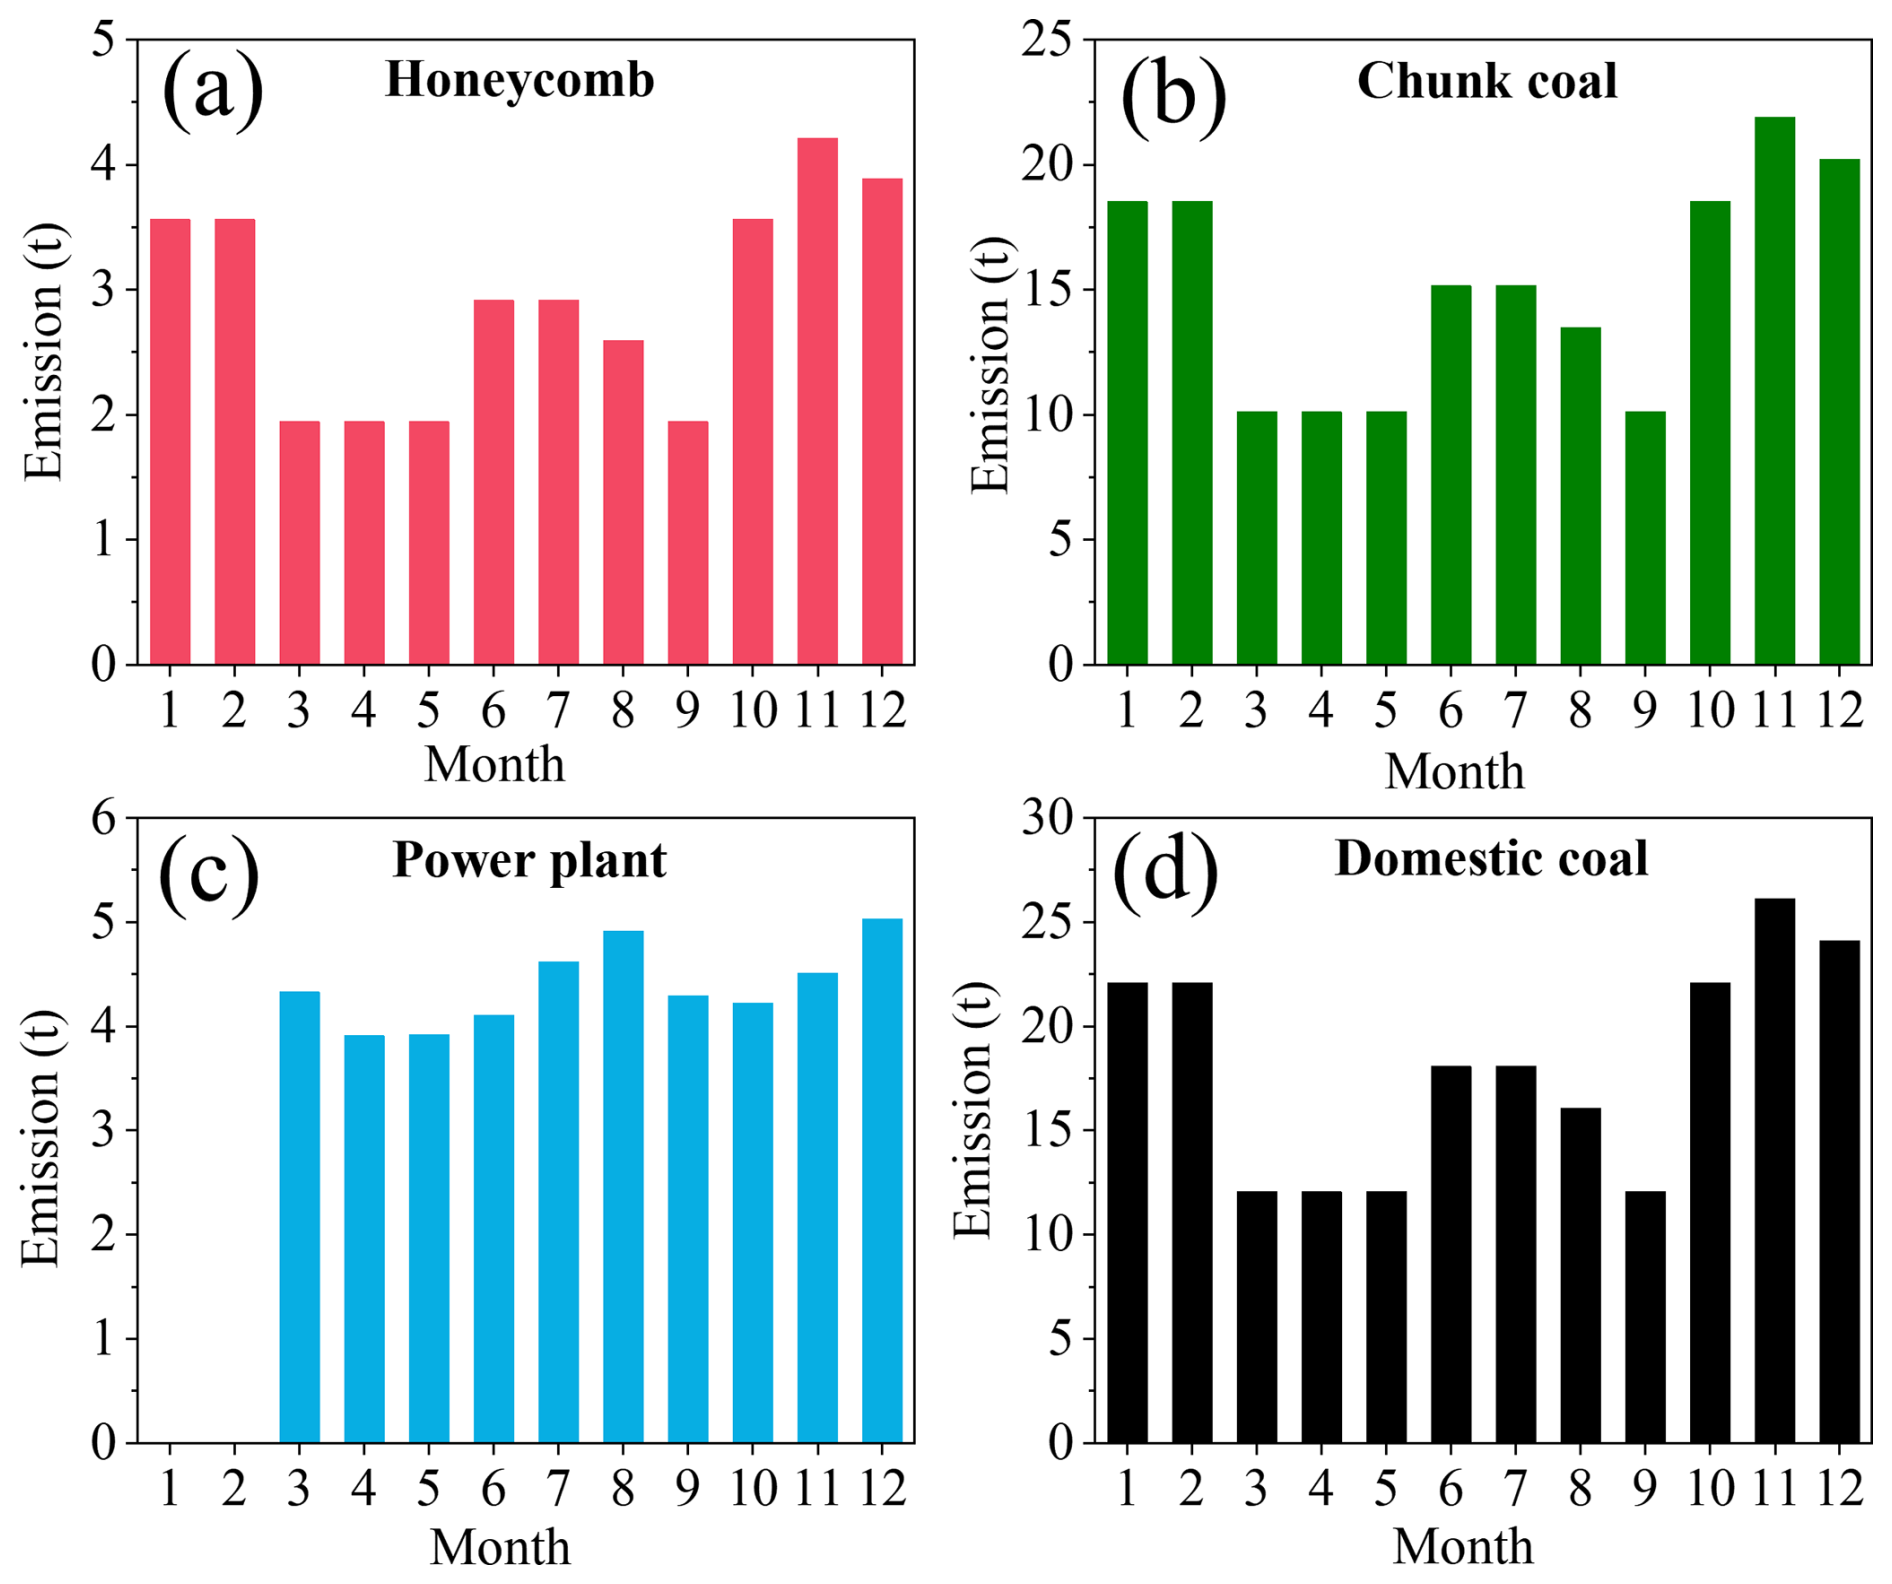
Figure 8Monthly CFC-11 emissions from domestic honeycomb briquette combustion (a), domestic chunk coal combustion (b), coal-fired power plants (c) and domestic coal combustion (d) in 2016. The CFC-11 emissions from coal-fired power plants in January and February did not have specific data.
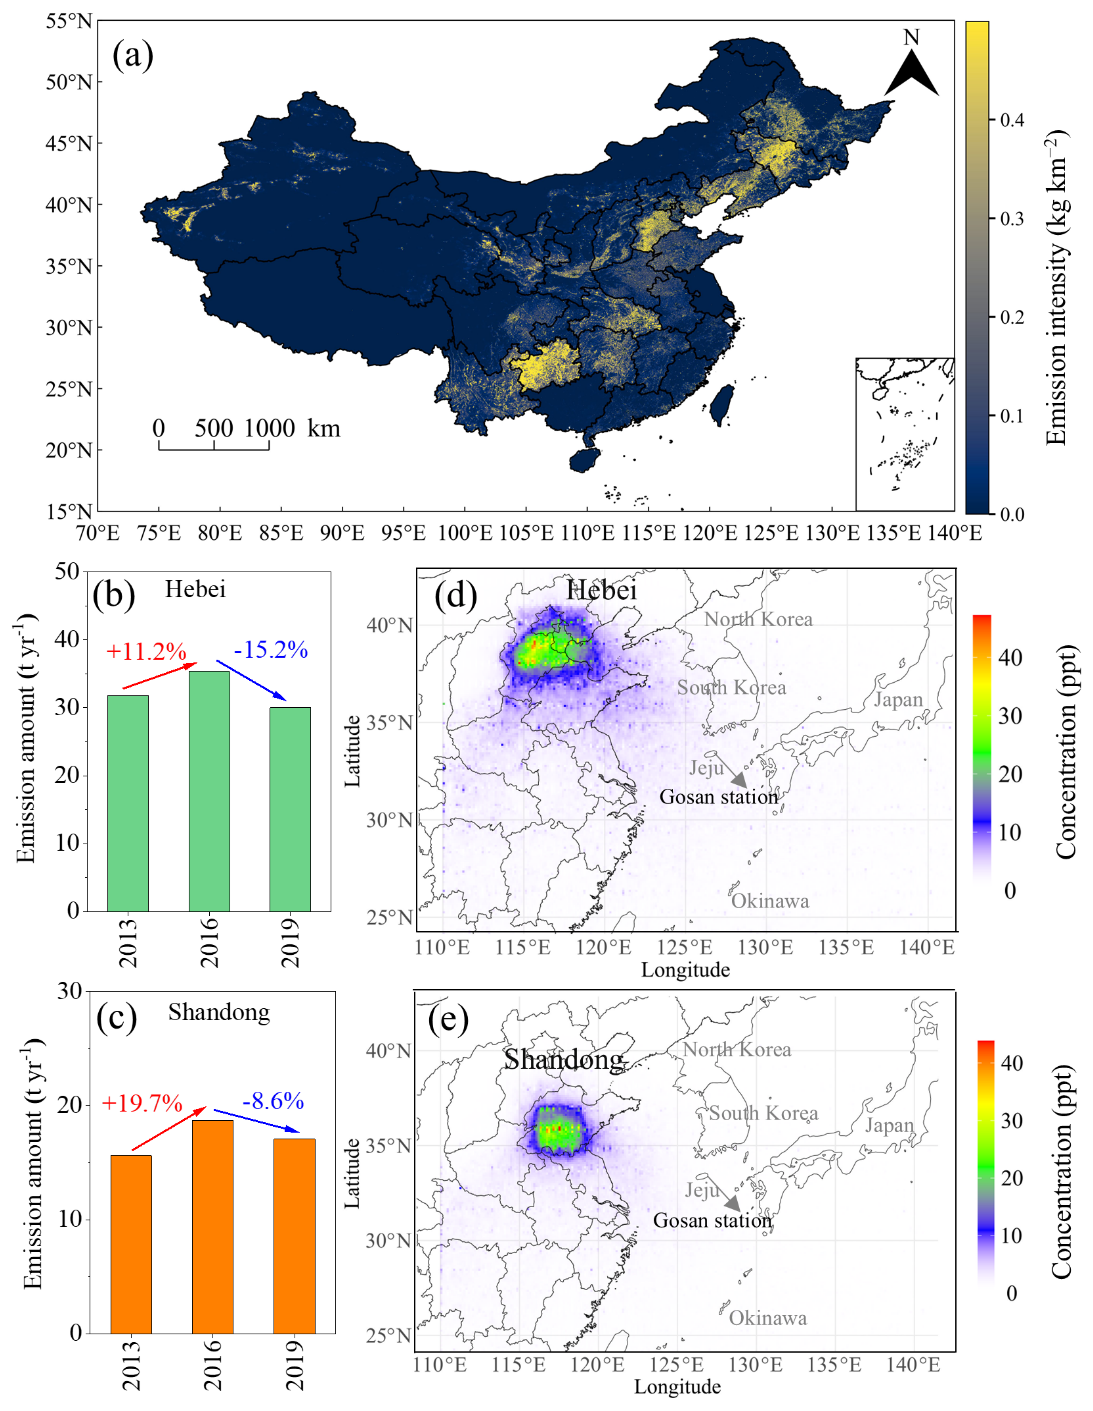
Figure 9The emission intensity (kg km−2) of CFC-11 from coal combustion in 2016 for all of China (a), and the changes in CFC-11 from coal combustion in 2013, 2016 and 2019 in Hebei (b) and Shandong (c). The distribution of simulated CFC-11 mass concentration contributed by coal combustion in January 2016 from the Hebei (d) and Shandong (e) provinces based on WRF-FLEXPART.
Shandong and Hebei were regarded as the hot source regions of CFC-11 (Montzka et al., 2018; Rigby et al., 2019). From Fig. 9a, the Hebei and Shandong provinces showed high emission intensities of CFC-11 from coal combustion, with average emission intensities of 0.23 and 0.03 kg km−2, respectively. We also found that the CFC-11 emission from coal combustion in the Hebei and Shandong provinces peaked in 2016 (Fig. 9b–c). They increased by 11.2 % and 19.7 %, compared with those of 2013, then decreased by 15.2 % and 8.6 % in 2019, respectively. Based on the WRF-FLEXPART modeling, we found that the CFC-11 emissions from coal combustion in the Shandong and Hebei provinces could impact South Korean areas (Fig. 9d–e). CFC-11 emissions from coal combustion in the two provinces could lead to enhanced atmospheric concentrations of 1.8–7.7 ppt within a 410 km radius of the source regions during January. CFC-11 emissions from coal combustion in Shandong and Hebei provinces during January contributed to 21.5 ppt and 7.0 ppt of CFC-11 observed at Mount Tai (36.3° N, 117.1° E), which was 249±13 ppt during winter 2017 to spring 2018 (Huang et al., 2021). The influence within 410 km is unlikely to extend to the monitoring stations outside China. Specifically, CFC-11 emissions from coal combustion in Hebei were simulated to contribute 0.4 ppt of the ambient CFC-11 at the Gosan station in South Korea. Similarly, the contributions from Shandong were simulated to be 0.1 ppt. At the Gosan station in South Korea, the measured CFC-11 concentration was 233.2 ppt in January 2021 through the Advanced Global Atmospheric Gases Experiment (AGAGE, https://www-air.larc.nasa.gov/missions/agage/, last access: 15 January 2025). Our simulations suggested that CFC-11 emissions from coal combustion in Hebei and Shandong might contribute to the increased CFC-11 concentration observed at Gosan station obviously.
Although this suggested that regional coal combustion sources could slightly influence background monitoring data in coastal East Asia, the contribution remained much smaller than from global PAU-related emissions and must be interpreted cautiously. Notably, the results here also exhibited uncertainties or shortages. Firstly, the CFC-11 emission factors from chunk coal and honeycomb briquettes varied in a large range, with the ratios of maximum to minimum values being 42 and 7 times and with relative standard deviations of 61 % and 81 %, respectively. Secondly, the quick variation in domestic coal consumption amount and structure has not been reflected in the statistical yearbooks. The uncertainty of the CFC-11 emission inventory from coal combustion in 2021 was ±50.2 % through 100 000 Monte Carlo simulations with a 95 % confidence interval. In this study, the coefficient of variation (CV; the standard deviation divided by the mean) for coal consumption amounts in power plants was assumed to be 5 %, and for domestic coal consumption, it was set at 20 % (Zhao et al., 2011). The uncertainty for EFs was based on the standard deviation of EFs given in Table S2.
The dataset presented is available at https://doi.org/10.6084/m9.figshare.28523063 (Niu et al., 2025). The activity data of coal combustion were from the China Energy Statistical Yearbook (2000–2021) (National Bureau of Statistics of China, 2001–2022). Land use data were from https://data-starcloud.pcl.ac.cn/ (last access: 12 August 2024) (Gong et al., 2019, 2020). Population distribution data were from https://hub.worldpop.org/doi/10.5258/SOTON/WP00674 (last access: 12 August 2024) (WorldPop and Center for International Earth Science Information Network). The POI industrial data were obtained from https://lbs.amap.com/ (last access: 10 September 2024). The CO emissions from coal combustion in China were from http://meicmodel.org.cn/#firstPage (last access: 1 November 2024) (Multiresolution Emission Inventory for China). The meteorological input data were obtained and downloaded from https://rda.ucar.edu/ (last access: 15 November 2024) (National Centers for Environmental Prediction Final Analysis).
There is currently no quantitative research on CFC-11 emissions from coal combustion. This study addresses that gap by estimating CFC-11 emissions in China from 2000 to 2021, based on coal consumption data and experimentally determined emission factors. The measured CFC-11 EFs were 3.6, 3.2 and 0.025 mg kg−1 from domestic chunk coal, honeycomb briquettes and coal-fired power plants, respectively. During the study period, total CFC-11 emissions from coal combustion in China were estimated at 233.5 t yr−1. In the Shandong and Hebei provinces, which have high levels of coal consumption, CFC-11 emissions increased by approximately 74 % during 2014–2017 compared to 2011–2012. At the Gosan monitoring station near mainland China, emissions from Hebei and Shandong contributed 0.4 ppt and 0.1 ppt to the average CFC-11 concentration in January 2016, respectively. Notably, China's clean heating and coal-to-electricity policies also brought climate co-benefits, resulting in significant reductions of CO2-equivalent emissions by 2.2 × 10⁶ and 3.4 × 10⁷ t, respectively. This study provides quantitative evidence of CFC-11 emissions from coal combustion, but the formation mechanisms of CFC-11 from coal combustion are unclear and need further investigation.
The supplement related to this article is available online at https://doi.org/10.5194/essd-17-6731-2025-supplement.
ZN: Conceptualization, Experiments, Visualization, Writing. SK: Conceptualization, Methodology, Supervision, Writing – review & editing. QY, YC, HZ and JW: Experiments. YH, XQ, HD and WJ: Visualization. YY, WL, FD, YB and SQ: Supervision.
The contact author has declared that none of the authors has any competing interests.
Publisher’s note: Copernicus Publications remains neutral with regard to jurisdictional claims made in the text, published maps, institutional affiliations, or any other geographical representation in this paper. While Copernicus Publications makes every effort to include appropriate place names, the final responsibility lies with the authors. Views expressed in the text are those of the authors and do not necessarily reflect the views of the publisher.
This work was supported by the Key Technologies Research and Development Program (grant no. 2023YFC3709802), the Hubei Provincial Science Fund for Distinguished Young Scholars (grant no. 2022CFA040), and the National Natural Science Foundation of China (grant no. 42077202).
This paper was edited by Bo Zheng and reviewed by two anonymous referees.
Adcock, K. E., Ashfold, M. J., Chou, C. C.-K., Gooch, L. J., Mohd Hanif, N., Laube, J. C., Oram, D. E., Ou-Yang, C.-F., Panagi, M., Sturges, W. T., and Reeves, C. E.: Investigation of East Asian emissions of CFC-11 using atmospheric observations in Taiwan, Environ. Sci. Technol., 54, 3814–3822, https://doi.org/10.1021/acs.est.9b06433, 2020.
Alabdulhadi, A., Ramadan, A., Devey, P., Boggess, M., and Guest, M.: Inhalation exposure to volatile organic compounds in the printing industry, J. Air Waste Manage., 69, 1142–1169, https://doi.org/10.1080/10962247.2019.1629355, 2019.
An, X., Henne, S., Yao, B., Vollmer, M. K., Zhou, L., and Li, Y.: Estimating emissions of HCFC-22 and CFC-11 in China by atmospheric observations and inverse modeling, Sci. China Chem., 55, 2233–2241, https://doi.org/10.1007/s11426-012-4624-8, 2012.
Burkholder, J. B., Hodnebrog, Ø., McDonald, B. C., Orkin, V., Papadimitriou, V. C., and Van Hoomissen, D.: Summary of abundances, lifetimes, ODPs, REs, GWPs, and GTPs. WMO, Geneva, Switzerland, Open File Rep. 509, 435 pp., https://www.csl.noaa.gov/assessments/ozone/2022 (last access: 22 December 2024), 2022.
Cheng, Y., Kong, S., Yao, L., Zheng, H., Wu, J., Yan, Q., Zheng, S., Hu, Y., Niu, Z., Yan, Y., Shen, Z., Shen, G., Liu, D., Wang, S., and Qi, S.: Multiyear emissions of carbonaceous aerosols from cooking, fireworks, sacrificial incense, joss paper burning, and barbecue as well as their key driving forces in China, Earth Syst. Sci. Data, 14, 4757–4775, https://doi.org/10.5194/essd-14-4757-2022, 2022.
Chen, L.: Study on environmental geochemistry of Chlorine in Chinese coals, Master thesis, Nanchang University, China, https://doi.org/10.7666/d.y1850295, 2010.
Chiodo, G. and Polvani, L. M.: New insights on the radiative impacts of ozone-depleting substances, Geophys. Res. Lett., 49, e2021GL096783, https://doi.org/10.1029/2021GL096783, 2022.
Daniel, J. S., Reimann, S., Ashford, P., Fleming, E. L., Hossaini, R., Lickley, M. J., Schofield, R., Walter-Terrinoni, H., McBride, L., Park, S., Ross, M., N., Salawitch, R. J., Sherry, D., Tegtmeier, S., and Velders, G. J. M.: CHAPTER 7 Scenarios and information for Policymakers, UNEP, Nairobi, Kenya, Open File Rep. 48 pp., https://csl.noaa.gov/assessments/ozone/2022/downloads/ (last access: 1 March 2025), 2022.
Dhomse, S. S., Feng, W., Montzka, S. A., Hossaini, R., Keeble, J., Pyle, J. A., Daniel, J. S., and Chipperfield, M. P.: Delay in recovery of the Antarctic ozone hole from unexpected CFC-11 emissions, Nat. Commun., 10, 5781, https://doi.org/10.1038/s41467-019-13717-x, 2019.
Energy Foundation, Tsinghua University Building Energy Efficiency Research Center: Constructing a new rural energy system toward carbon neutrality-comprehensive report on the governance of rural domestic coal in China, Tsinghua University, Beijing, China, Open File Rep., 63 pp., 2024 (in Chinese).
Fang, X., Ravishankara, A. R., Velders, G. J. M., Molina, M. J., Su, S., Zhang, J., Hu, J., and Prinn, R. G.: Changes in emissions of ozone-depleting substances from China due to implementation of the Montreal Protocol, Environ. Sci. Technol., 52, 11359–11366, https://doi.org/10.1021/acs.est.8b01280, 2018.
Fang, D., Chen, B., Hubacek, K., Ni, R., Chen, L., Feng, K., and Lin, J.: Clean air for some: unintended spillover effects of regional air pollution policies, Sci. Adv., 5, eaav4707, https://doi.org/10.1126/sciadv.aav4707, 2019.
Fleming, E. L., Newman, P. A., Liang, Q., and Daniel, J. S.: The impact of continuing CFC-11 emissions on stratospheric ozone, J. Geophys. Res.-Atmos., 125, e2019JD031849, https://doi.org/10.1029/2019JD031849, 2020.
Geng, G., Liu, Y., Liu, Y., Liu, S., Cheng, J., Yan, L., Wu, N., Hu, H., Tong, D., Zheng, B., Yin, Z., He, K., and Zhang, Q.: Efficacy of China's clean air actions to tackle PM2.5 pollution between 2013 and 2020, Nat. Geosci., 17, 987–994, https://doi.org/10.1038/s41561-024-01540-z, 2024.
Global Carbon Atlas: Carbon Emissions, https://globalcarbonatlas.org/emissions/carbon-emissions/, last access: 22 December 2024.
Gong, P., Li, X., and Zhang, W.: 40-Year (1978–2017) human settlement changes in China reflected by impervious surfaces from satellite remote sensing, Sci. Bull., 64, 756–763, https://doi.org/10.1016/j.scib.2019.04.024, 2019.
Gong, P., Chen, B., Li, X., Liu, H., Wang, J., Bai, Y., Chen, J., Chen, X., Fang, L., Feng, S., Feng, Y., Gong, Y., Gu, H., Huang, H., Huang, X., Jiao, H., Kang, Y., Lei, G., Li, A., Li, X., Li, X., Li, Y., Li, Z., Li, Z., Liu, C., Liu, C., Liu, M., Liu, S., Mao, W., Miao, C., Ni, H., Pan, Q., Qi, S., Ren, Z., Shan, Z., Shen, S., Shi, M., Song, Y., Su, M., Ping Suen, H., Sun, B., Sun, F., Sun, J., Sun, L., Sun, W., Tian, T., Tong, X., Tseng, Y., Tu, Y., Wang, H., Wang, L., Wang, X., Wang, Z., Wu, T., Xie, Y., Yang, J., Yang, J., Yuan, M., Yue, W., Zeng, H., Zhang, K., Zhang, N., Zhang, T., Zhang, Y., Zhao, F., Zheng, Y., Zhou, Q., Clinton, N., Zhu, Z., and Xu, B.: Mapping essential urban land use categories in China (EULUCChina): Preliminary results for 2018, Sci. Bull., 65, 182–187, https://doi.org/10.1016/j.scib.2019.12.007, 2020.
Guo, H., Ding, A., Wang, T., Simpson, I. J., Blake, D. R., Barletta, B., Meinardi, S., Rowland, F. S., Saunders, S. M., Fu, T., Hung, W., and Li, Y.: Source origins, modeled profiles, and apportionments of halogenated hydrocarbons in the greater Pearl River Delta region, southern China, J. Geophys. Res., 114, 2008JD011448, https://doi.org/10.1029/2008JD011448, 2009.
Huang, X., Zhang, Y., Xue, L., Tang, J., Song, W., Blake, D. R., and Wang, X.: Constraining emission estimates of CFC-11 in Eastern China based on local observations at surface stations and Mount Tai, Environ. Sci. Technol. Lett., 8, 940–946, https://doi.org/10.1021/acs.estlett.1c00539, 2021.
Jin, W., Yan, Y., Qiu, X., Peng, L., Li, Z., and Tang, Y.: Characterizing full-phase chlorine species emissions from domestic coal combustion in China: Implications for significant impacts on air pollution and ozone-layer depletion, Environ. Pollut., 372, 126043, https://doi.org/10.1016/j.envpol.2025.126043, 2025.
Kim, J., Li, S., Kim, K., Stohl, A., Mühle, J., Kim, S., Park, M., Kang, D., Lee, G., Harth, C. M., Salameh, P. K., and Weiss, R. F.: Regional atmospheric emissions determined from measurements at Jeju Island, Korea: Halogenated compounds from China, Geophys. Res. Lett., 37, 2010GL043263, https://doi.org/10.1029/2010GL043263, 2010.
Li, Q., Jiang, J., Zhang, Q., Zhou, W., Cai, S., Duan, L., Ge, S., and Hao, J.: Influences of coal size, volatile matter content, and additive on primary particulate matter emissions from household stove combustion, Fuel, 182, 780–787, https://doi.org/10.1016/j.fuel.2016.06.059, 2016.
Li, J., Wang, J., Li, H., Rao, Z., Li, Q., and Luo, S.: The production and release of CFCs from coal combustion, Acta Geol. Sin.-Engl., 77, 81–85, https://doi.org/10.1111/j.1755-6724.2003.tb00113.x, 2003.
Li, J., Wang, J., Yao, Z., Li, H., Li, Q., Luo, S., Xu, X., and Wang, Y.: Production and emission of Chlorofluorocarbons during coal combustion. Rock and Mineral Analysis, 23, 1–5, https://doi.org/10.15898/j.cnki.11-2131/td.2004.01.001, 2004 (in Chinese).
Lickley, M., Fletcher, S., Rigby, M., and Solomon, S.: Joint inference of CFC lifetimes and banks suggests previously unidentified emissions, Nat. Commun., 12, 2920, https://doi.org/10.1038/s41467-021-23229-2, 2021.
Liu, F., Zhang, Q., Tong, D., Zheng, B., Li, M., Huo, H., and He, K. B.: High-resolution inventory of technologies, activities, and emissions of coal-fired power plants in China from 1990 to 2010, Atmos. Chem. Phys., 15, 13299–13317, https://doi.org/10.5194/acp-15-13299-2015, 2015.
Liu, Y., Weng, W., Zhang, Q., Li, Q., Xu, J., Zheng, L., Su, Y., Wu, D., Yan, W., Zhang, J., Chen, J., and Yao, B.: Ozone-depleting substances unintendedly emitted from iron and steel industry: CFCs, HCFCs, halons and halogenated very short-lived substances, J. Geophys. Res.-Atmos., 129, e2024JD041035, https://doi.org/10.1029/2024JD041035, 2024.
Liu, Z., Guan, D., Wei, W., Davis, S. J., Ciais, P., Bai, J., Peng, S., Zhang, Q., Hubacek, K., Marland, G., Andres, R. J., Crawford-Brown, D., Lin, J., Zhao, H., Hong, C., Boden, T. A., Feng, K., Peters, G. P., Xi, F., Liu, J., Li, Y., Zhao, Y., Zeng, N., and He, K.: Reduced carbon emission estimates from fossil fuel combustion and cement production in China, Nature, 524, 335–338, https://doi.org/10.1038/nature14677, 2015.
Luo, K., Ren, D., Xu, L., Dai, S., Cao, D., Feng, F., and Tan, J.: Fluorine content and distribution pattern in Chinese coals, Int. J. Coal Geol., 57, 143–149, https://doi.org/10.1016/j.coal.2003.10.003, 2004.
McCulloch, A., Ashford, P., and Midgley, P. M.: Historic emissions of fluorotrichloromethane (CFC-11) based on a market survey, Atmos. Environ., 35, 4387–4397, https://doi.org/10.1016/S1352-2310(01)00249-7, 2001.
Molina, M. J. and Rowland, F. S.: Stratospheric sink for chlorofluoromethanes: chlorine atom-catalysed destruction of ozone, Nature, 249, 810–812, https://doi.org/10.1038/249810a0, 1974.
Montzka, S. A., Dutton, G. S., Yu, P., Ray, E., Portmann, R. W., Daniel, J. S., Kuijpers, L., Hall, B. D., Mondeel, D., Siso, C., Nance, J. D., Rigby, M., Manning, A. J., Hu, L., Moore, F., Miller, B. R., and Elkins, J. W.: An unexpected and persistent increase in global emissions of ozone-depleting CFC-11, Nature, 557, 413–417, https://doi.org/10.1038/s41586-018-0106-2, 2018.
Montzka, S. A., Dutton, G. S., Portmann, R. W., Chipperfield, M. P., Davis, S., Feng, W., Manning, A. J., Ray, E., Rigby, M., Hall, B. D., Siso, C., Nance, J. D., Krummel, P. B., Mühle, J., Young, D., O'Doherty, S., Salameh, P. K., Harth, C. M., Prinn, R. G., Weiss, R. F., Elkins, J. W., Walter-Terrinoni, H., and Theodoridi, C.: A decline in global CFC-11 emissions during 2018–2019, Nature, 590, 428–432, https://doi.org/10.1038/s41586-021-03260-5, 2021.
National Bureau of Statistics of China, 2001–2022, Department of Energy Statistics: China Energy Statistical Yearbook, 2001–2022, https://www.cnki.net/ (last access: 12 June 2024), 2001–2022.
National Bureau of Statistics of China, National data [data set], https://data.stats.gov.cn/, last access: 12 January 2025.
Niu, Z., Kong, S., Yan, Q., Cheng, Y., Zheng, H., Hu, Y., Wu, J., Qin, X., Dong, H., Jiang, W., Yan, Y., Liu, W., Ding, F., Bai, Y., and Qi, S.: Estimation of CFC-11 emissions from coal combustion in China, Figshare [data set], https://doi.org/10.6084/m9.figshare.28523063, 2025.
Palmer, P. I., Jacob, D. J., Mickley, L. J., Blake, D. R., Sachse, G. W., Fuelberg, H. E., and Kiley, C. M.: Eastern Asian emissions of anthropogenic halocarbons deduced from aircraft concentration data, J. Geophys. Res., 108, 2003JD003591, https://doi.org/10.1029/2003JD003591, 2003.
Pan, Y., Birdsey, R. A., Fang, J., Houghton, R., Kauppi, P. E., Kurz, W. A., Phillips, O. L., Shvidenko, A., Lewis, S. L., Canadell, J. G., Ciais, P., Jackson, R. B., Pacala, S. W., McGuire, A. D., Piao, S., Rautiainen, A., Sitch, S., and Hayes, D.: A large and persistent carbon sink in the world's forests, Science, 333, 988–993, https://doi.org/10.1126/science.1201609, 2011.
Park, S., Western, L. M., Saito, T., Redington, A. L., Henne, S., Fang, X., Prinn, R. G., Manning, A. J., Montzka, S. A., Fraser, P. J., Ganesan, A. L., Harth, C. M., Kim, J., Krummel, P. B., Liang, Q., Mühle, J., O'Doherty, S., Park, H., Park, M.-K., Reimann, S., Salameh, P. K., Weiss, R. F., and Rigby, M.: A decline in emissions of CFC-11 and related chemicals from eastern China, Nature, 590, 433–437, https://doi.org/10.1038/s41586-021-03277-w, 2021.
Peng, L., Zhang, Q., Yao, Z., Mauzerall, D. L., Kang, S., Du, Z., Zheng, Y., Xue, T., and He, K.: Underreported coal in statistics: A survey-based solid fuel consumption and emission inventory for the rural residential sector in China, Appl. Energy, 235, 1169–1182, https://doi.org/10.1016/j.apenergy.2018.11.043, 2019.
Polvani, L. M., Previdi, M., England, M. R., Chiodo, G., and Smith, K. L.: Substantial twentieth-century Arctic warming caused by ozone-depleting substances, Nat. Clim. Change, 10, 130–133, https://doi.org/10.1038/s41558-019-0677-4, 2020.
Pons, J., Tope, H., and Walter-Terrinoni, H.: Montreal protocol on substances that deplete the ozone layer, report of the technology and economic assessment panel May 2019, Volume 3: Decision XXX/3 TEAP Task Force Report on Unexpected Emissions of Trichlorofluoromethane (CFC-11), UNEP, Nairobi, Kenya, Open File Rep. 178 pp., https://ozone.unep.org/sites/default/files/2020-07/TEAP_Task_Force_Dec_XXX-3_on_Unexpected_CFC-11_Emissions_May_2019.pdf (last access: 27 October 2025), 2019.
Rigby, M., Prinn, R. G., O'Doherty, S., Montzka, S. A., McCulloch, A., Harth, C. M., Mühle, J., Salameh, P. K., Weiss, R. F., Young, D., Simmonds, P. G., Hall, B. D., Dutton, G. S., Nance, D., Mondeel, D. J., Elkins, J. W., Krummel, P. B., Steele, L. P., and Fraser, P. J.: Re-evaluation of the lifetimes of the major CFCs and CH3CCl3 using atmospheric trends, Atmos. Chem. Phys., 13, 2691–2702, https://doi.org/10.5194/acp-13-2691-2013, 2013.
Rigby, M., Park, S., Saito, T., Western, L. M., Redington, A. L., Fang, X., Henne, S., Manning, A. J., Prinn, R. G., Dutton, G. S., Fraser, P. J., Ganesan, A. L., Hall, B. D., Harth, C. M., Kim, J., Kim, K.-R., Krummel, P. B., Lee, T., Li, S., Liang, Q., Lunt, M. F., Montzka, S. A., Mühle, J., O'Doherty, S., Park, M.-K., Reimann, S., Salameh, P. K., Simmonds, P., Tunnicliffe, R. L., Weiss, R. F., Yokouchi, Y., and Young, D.: Increase in CFC-11 emissions from eastern China based on atmospheric observations, Nature, 569, 546–550, https://doi.org/10.1038/s41586-019-1193-4, 2019.
Shao, M., Huang, D., Gu, D., Lu, S., Chang, C., and Wang, J.: Estimate of anthropogenic halocarbon emission based on measured ratio relative to CO in the Pearl River Delta region, China, Atmos. Chem. Phys., 11, 5011–5025, https://doi.org/10.5194/acp-11-5011-2011, 2011.
Shen, G., Ru, M., Du, W., Zhu, X., Zhong, Q., Chen, Y., Shen, H., Yun, X., Meng, W., Liu, J., Cheng, H., Hu, J., Guan, D., and Tao, S.: Impacts of air pollutants from rural Chinese households under the rapid residential energy transition, Nat. Commun., 10, 3405, https://doi.org/10.1038/s41467-019-11453-w, 2019.
Shen, G., Xiong, R., Tian, Y., Luo, Z., Jiangtulu, B., Du, W., Meng, J., Chen, Y., Xue, B., Wang, B., Duan, Y., Duo, J., Fan, F., Huang, L., Ju, T., Liu, F., Li, S., Liu, X., Li, Y., Wang, M., Nan, Y., Pan, B., Pan, Y., Wang, L., Zeng, E., Zhan, C., Chen, Y., Shen, H., Cheng, H., and Tao, S.: Substantial transition to clean household energy mix in rural households in China, Nat. Sci. Rev., 9, nwac050, https://doi.org/10.1093/nsr/nwac050, 2022.
Shen, H., Luo, Z., Xiong, R., Liu, X., Zhang, L., Li, Y., Du, W., Chen, Y., Cheng, H., Shen, G., and Tao, S.: A critical review of pollutant emission factors from fuel combustion in home stoves, Environ. Int., 157, 106841, https://doi.org/10.1016/j.envint.2021.106841, 2021.
Shen, L., Xiang, P., Liang, S., Chen, W., Wang, M., Lu, S., and Wang, Z.: Sources profiles of volatile organic compounds (VOCs) measured in a typical industrial process in Wuhan, Central China, Atmosphere, 9, 297, https://doi.org/10.3390/atmos9080297, 2018.
Shi, J., Deng, H., Bai, Z., Kong, S., Wang, X., Hao, J., Han, X., and Ning, P.: Emission and profile characteristic of volatile organic compounds emitted from coke production, iron smelt, heating station and power plant in Liaoning Province, China, Sci. Total Environ., 515–516, 101–108, https://doi.org/10.1016/j.scitotenv.2015.02.034, 2015.
Simpson, I. J., Barletta, B., Meinardi, S., Aburizaiza, O. S., DeCarlo, P. F., Farrukh, M. A., Khwaja, H., Kim, J., Kim, Y., Panday, A., Siddique, A., Stone, E. A., Wang, T., Woo, J.-H., Xue, L., Yokelson, R. J., Zeb, J., and Blake, D. R.: CFC-11 measurements in China, Nepal, Pakistan, Saudi Arabia and South Korea (1998–2018): Urban, landfill fire and garbage burning sources, Environ. Chem., 18, 370–392, https://doi.org/10.1071/EN21139, 2022.
Sun, J., Shen, Z., Huang, Y., Cao, J., Ho, S. S. H., Niu, X., Wang, T., Zhang, Q., Lei, Y., Xu, H., and Liu, H.: VOCs emission profiles from rural cooking and heating in Guanzhong Plain, China and its potential effect on regional O3 and SOA formation, Atmos. Chem. Phys. Discuss. [preprint], https://doi.org/10.5194/acp-2018-36, 2018.
Sun, J., Shen, Z., Zhang, L., Zhang, Y., Zhang, T., Lei, Y., Niu, X., Zhang, Q., Dang, W., Han, W., Cao, J., Xu, H., Liu, P., and Li, X.: Volatile organic compounds emissions from traditional and clean domestic heating appliances in Guanzhong Plain, China: Emission factors, source profiles, and effects on regional air quality, Environ. Int., 133, 105252, https://doi.org/10.1016/j.envint.2019.105252, 2019.
Tao, S., Shen, G., Cheng, H., and Ma, J.: Toward clean residential energy: challenges and priorities in research, Environ. Sci. Technol., 55, 13602–13613, https://doi.org/10.1021/acs.est.1c02283, 2021.
Tong, D., Zhang, Q., Liu, F., Geng, G., Zheng, Y., Xue, T., Hong, C., Wu, R., Qin, Y., Zhao, H., Yan, L., and He, K.: Current emissions and future mitigation pathways of coal-fired power plants in China from 2010 to 2030, Environ. Sci. Technol., 52, 12905–12914, https://doi.org/10.1021/acs.est.8b02919, 2018.
Wan, D., Xu, J., Zhang, J., Tong, X., and Hu, J.: Historical and projected emissions of major halocarbons in China, Atmos. Environ., 43, 5822–5829, https://doi.org/10.1016/j.atmosenv.2009.07.052, 2009.
Wang, M., Li, S., Zhu, R., Zhang, R., Zu, L., Wang, Y., and Bao, X.: On-road tailpipe emission characteristics and ozone formation potentials of VOCs from gasoline, diesel and liquefied petroleum gas fueled vehicles, Atmos. Environ., 223, 117294, https://doi.org/10.1016/j.atmosenv.2020.117294, 2020.
Wang, S., Su, H., Chen, C., Tao, W., Streets, D. G., Lu, Z., Zheng, B., Lelieveld, J., Pöschl, U., and Cheng, Y.: Natural gas shortages during the “coal-to-gas” transition in China have caused a large redistribution of air pollution, P. Natl. Acad. Sci. USA, 117, 31018–31025, https://doi.org/10.1073/pnas.2007513117, 2020.
Western, L. M., Vollmer, M. K., Krummel, P. B., Adcock, K. E., Crotwell, M., Fraser, P. J., Harth, C. M., Langenfelds, R. L., Montzka, S. A., Mühle, J., O'Doherty, S., Oram, D. E., Reimann, S., Rigby, M., Vimont, I., Weiss, R. F., Young, D., and Laube, J. C.: Global increase of ozone-depleting chlorofluorocarbons from 2010 to 2020, Nat. Geosci., 16, 309–313, https://doi.org/10.1038/s41561-023-01147-w, 2023.
Wu, H., Liu, J., Hu, X., He, G., Zhou, Y., Wang, X., Liu, Y., Ma, J., and Tao, S.: Fewer than 15 % of coal power plant workers in China can easily shift to green jobs by 2060, One Earth, 7, 1994–2007, https://doi.org/10.1016/j.oneear.2024.10.006, 2024.
Wu, J., Kong, S., Zeng, X., Cheng, Y., Yan, Q., Zheng, H., Yan, Y., Zheng, S., Liu, D., Zhang, X., Fu, P., Wang, S., and Qi, S.: First high-resolution emission inventory of levoglucosan for biomass burning and non-biomass burning sources in China, Environ. Sci. Technol., 55, 1497–1507, https://doi.org/10.1021/acs.est.0c06675, 2021.
Wu, R. and Xie, S.: Spatial distribution of ozone formation in China derived from emissions of speciated volatile organic compounds, Environ. Sci. Technol., 51, 2574–2583, https://doi.org/10.1021/acs.est.6b03634, 2017.
Yan, Q., Kong, S., Yan, Y., Liu, H., Wang, W., Chen, K., Yin, Y., Zheng, H., Wu, J., Yao, L., Zeng, X., Cheng, Y., Zheng, S., Wu, F., Niu, Z., Zhang, Y., Zheng, M., Zhao, D., Liu, D., and Qi, S.: Emission and simulation of primary fine and submicron particles and water-soluble ions from domestic coal combustion in China, Atmos. Environ., 224, 117308, https://doi.org/10.1016/j.atmosenv.2020.117308, 2020.
Yan, Q., Kong, S., Yan, Y., Liu, X., Zheng, S., Qin, S., Wu, F., Niu, Z., Zheng, H., Cheng, Y., Zeng, X., Wu, J., Yao, L., Liu, D., Shen, G., Shen, Z., and Qi, S.: Emission and spatialized health risks for trace elements from domestic coal burning in China, Environ. Int., 158, 107001, https://doi.org/10.1016/j.envint.2021.107001, 2022.
Yan, Y., Yang, C., Peng, L., Li, R., and Bai, H. Emission characteristics of volatile organic compounds from coal-, coal gangue-, and biomass-fired power plants in China. Atmos. Environ., 143, 261–269, https://doi.org/10.1016/j.atmosenv.2016.08.052, 2016.
Yang, N., Tang, S., Zhang, S., Huang, W., Chen, P., Chen, Y., Xi, Z., Yuan, Y., and Wang, K.: Fluorine in Chinese coal: A review of distribution, abundance, modes of occurrence, genetic factors and environmental effects, Minerals, 7, 219, https://doi.org/10.3390/min7110219, 2017.
Ye, X.: Study on characteristics of pollutants emission from non-road mobile source and biomass boilers on real work conditions, Master thesis, South China University of Technology, China, https://www.lib.scut.edu.cn/2016/1014/c8766a124602/page.htm (last access: 27 October 2025), 2018.
Zeng, L., Dang, J., Guo, H., Lyu, X., Simpson, I. J., Meinardi, S., Wang, Y., Zhang, L., and Blake, D. R.: Long-term temporal variations and source changes of halocarbons in the Greater Pearl River Delta region, China, Atmos. Environ., 234, 117550, https://doi.org/10.1016/j.atmosenv.2020.117550, 2020.
Zeng, X., Kong, S., Zhang, Q., Ren, H., Liu, J., Feng, Y., Yan, Q., Qin, S., Zheng, S., Yao, L., Fan, Z., Zhang, Y., Liu, X., Yan, Y., Zhu, K., Ding, F., Liu, W., Liu, D., Qi, S., and Fu, P.: Source profiles and emission factors of organic and inorganic species in fine particles emitted from the ultra-low emission power plant and typical industries, Sci. Total Environ., 789, 147966, https://doi.org/10.1016/j.scitotenv.2021.147966, 2021.
Zhang, Y., Wang, X., Simpson, I. J., Barletta, B., Blake, D. R., Meinardi, S., Louie, P. K. K., Zhao, X., Shao, M., Zhong, L., Wang, B., and Wu, D.: Typical industrial sector-based volatile organic compounds source profiles and ozone formation potentials in Zhengzhou, China, Atmos. Pollut. Res., 11, 841–850, https://doi.org/10.1016/j.apr.2020.01.012, 2014.
Zhao, Y., Nielsen, C. P., Lei, Y., McElroy, M. B., and Hao, J.: Quantifying the uncertainties of a bottom-up emission inventory of anthropogenic atmospheric pollutants in China, Atmos. Chem. Phys., 11, 2295–2308, https://doi.org/10.5194/acp-11-2295-2011, 2011.