the Creative Commons Attribution 4.0 License.
the Creative Commons Attribution 4.0 License.
 | 27 Nov 2025
Long-term plankton and environmental monitoring dataset from the marine protected area of the Iroise Marine Natural Park (2010–2023) in the Iroise Sea, North Atlantic
Laetitia Drago
Caroline Cailliau
Patrick Pouline
Béatriz Beker
Laëtitia Jalabert
Jean-Baptiste Romagnan
Sakina-Dorothée Ayata
This data paper presents a long-term monitoring dataset of phytoplankton (2010–2022) and zooplankton (2010–2023) communities, as well as associated environmental parameters (2010–2023), from the Iroise Marine Natural Park, Iroise Sea, North Atlantic, France's first marine protected area (Drago et al., 2025). The dataset combines traditional microscopy-based phytoplankton counts with zooplankton data (abundances) obtained from digitized images using the ZooScan imaging system, along with surface and bottom temperature and salinity measurements. Sampling was conducted seasonally along two main transects and three coastal stations, capturing both spatial and temporal dynamics of plankton communities. Phytoplankton was identified at the species level by the same taxonomist during all the time series (573 taxa in total). From their individual images, zooplankton were automatically sorted into 103 taxonomic and morphological groups, validated by an expert, and compiled into a data table, allowing both community and individual approaches using abundances and biovolumes at both individual and community levels. Individual zooplankton images have also been made available for further morphometric analyses. This 14-year-long, spatially and temporally resolved zooplankton imaging dataset (available at https://doi.org/10.17882/105465) is part of an ongoing effort to enhance the availability of zooplankton imaging data, locally and globally. This, as a whole dataset, can be used to study the influence of coastal–offshore environmental gradients on marine plankton biodiversity patterns, especially in protected waters at the intersection of the English Channel and the Atlantic Ocean, in a region characterized by the presence of the Ushant front.
- Article
(2455 KB) - Full-text XML
-
Supplement
(456 KB) - BibTeX
- EndNote


Planktonic organisms play a pivotal role in marine and freshwater ecosystems (Grigoratou et al., 2025). They are key contributors to the biological carbon pump, with phytoplankton fixing atmospheric CO2 (Iversen, 2023; Siegel et al., 2023) and zooplankton exporting this carbon passively through the sinking of molts and carcases and fecal pellets, as well as actively through diel vertical migration (Steinberg and Landry, 2017). At the base of the aquatic food webs (Ikeda, 1985), these organisms sustain diverse marine life, from marine mammals and birds to fish (Chavez et al., 2008; Frederiksen et al., 2006), with substantial socioeconomic implications as water quality indicators (Suthers et al., 2019) and as a food source for fisheries (Lehodey et al., 2006; van der Lingen et al., 2006), but they also have potential negative impacts on aquaculture, human health, and activities during harmful bloom events (Griffith and Gobler, 2020).
Long-term monitoring of planktonic communities through time series datasets has proven invaluable for understanding marine ecosystem dynamics. The number of sustained observation programs has grown significantly in past decades, spanning diverse environments from coastal monitoring stations to open-ocean sites (Batchelder et al., 2012; Berline et al., 2012; Grandremy et al., 2024). These datasets have revealed crucial insights into planktonic dynamics across multiple temporal and spatial scales, though continued expansion of such monitoring efforts remains important for comprehensive ecosystem understanding (Jonkers et al., 2022; Pitois and Yebra, 2022).
Imaging technologies have emerged as powerful tools for studying planktonic communities, enabling high-throughput analysis of both taxonomic and trait-based characteristics (Irisson et al., 2022; Orenstein et al., 2022). Datasets originating from these technologies are providing unprecedented views into the diversity and distribution of zooplankton (Panaïotis et al., 2023; Perhirin et al., 2023; Vilgrain et al., 2021) and phytoplankton (Bolaños et al., 2020; Kenitz et al., 2020; Sonnet et al., 2022). These diversity and distribution patterns reveal how plankton communities respond to environmental changes and drive ecosystem processes. They provide critical insights into food web dynamics, carbon cycling efficiency, and ecosystem health (Grigoratou et al., 2025; Miloslavich et al., 2018). These imaging approaches allow for faster processing of more samples while capturing detailed morphological information. Indeed, although studies have traditionally focused on the taxonomic diversity of plankton, there is a growing recognition of the relevance of trait-based approaches, which can offer deeper insights into ecosystem functioning and community responses to environmental changes (Kiørboe et al., 2018; Litchman et al., 2013; Martini et al., 2021). Traits such as body size and shape, feeding mode, and motility can provide a more mechanistic understanding of plankton ecology and their role in biogeochemical processes (Buitenhuis et al., 2013; Litchman et al., 2015).
Despite these technological advances, significant challenges remain in making plankton datasets widely accessible and useful for the broader scientific community, particularly given the substantial costs and human resources involved in marine sampling campaigns, including varying detection capabilities across instruments and lack of standardized data formats across platforms, as well as insufficient metadata documentation. The need for standardized, well-documented, and openly accessible datasets is increasingly critical, particularly for supporting long-term ecological monitoring and modeling efforts. Following FAIR principles (findable, accessible, interoperable, and reusable) defined by Wilkinson et al. (2016), modern plankton datasets must include comprehensive metadata and standardized protocols to ensure their utility across different research applications (Titocci et al., 2025). Recently, several plankton datasets have been published following the FAIR principle (Acri et al., 2020; Devreker et al., 2024; Dugenne et al., 2024; Grandremy et al., 2024). Following this trend, we present here a long-term dataset (2010–2024) from the Iroise Marine Natural Park, France's first marine protected area (MPA). The dataset includes a phytoplankton time series based on microscopy counts (conducted by two taxonomists throughout the study period) and a zooplankton dataset that comprises digitized images obtained by the ZooScan imaging system and associated abundances. Both datasets are accompanied by contextual environmental variables (temperature, salinity). These datasets will contribute to a better understanding of plankton dynamics in protected Atlantic waters, while serving as examples of how traditional and modern approaches could be effectively combined and shared to support observational studies, monitoring surveys, and modeling efforts (Holland et al., 2025).
The Iroise Marine Natural Park (“Parc Naturel Marin d'Iroise” in French; https://parc-marin-iroise.fr/, last access: 10 September 2025), established in 2007 as the first French marine protected Area (MPA), spans 3550 km2 off the western coast of Brittany. Managed by the French Biodiversity Agency (Office Français de la Biodiversité, OFB), this MPA encompasses the Iroise Sea, a unique ecosystem located at the intersection of the English Channel and the Atlantic Ocean. The MPA's monitoring activities align with two major European directives: the Water Framework Directive (WFD/DCE, 2000/60/CE, https://eur-lex.europa.eu/eli/dir/2000/60/oj, last access: 10 September 2025) for coastal waters and the Marine Strategy Framework Directive (MSFD/DCSMM, 2008/56/CE, https://eur-lex.europa.eu/eli/dir/2008/56/oj, last access: 10 September 2025), which aims to achieve Good Environmental Status of marine waters. In the context of the Iroise Marine Natural Park (IMPN), this translates into a regulatory framework requiring high levels of protection with regulated activities. Implementation includes governance actions such as the management council providing guidance on agricultural activities that may impact eutrophication and initiatives to enhance the purifying role of coastal wetlands. As essential ocean variables (EOVs), plankton communities are key indicators within the MSFD framework, providing crucial information about ecosystem health and food web dynamics (Batten et al., 2019). Monitoring planktonic communities is particularly relevant for MPAs like the Iroise Marine Natural Park, as their rapid responses to environmental changes provide early warning signals of ecosystem shifts, such as harmful algal blooms, that are crucial for adaptive management strategies. It is also particularly relevant for fisheries (Benedetti et al., 2019; Berthou et al., 2010; Duhamel et al., 2011), as small pelagic fish like sardines (Sardina pilchardus) feed on plankton (Garrido et al., 2008). As a result, the Iroise Sea also holds significant economic and cultural importance for France's sardine fishery. A substantial portion of France's sardine catches come from this region and adjacent waters, with the port of Douarnenez serving as a historic sardine fishing hub and exemplifying a traditional sardine fishing community (Le Floc'h et al., 2020). Beyond its ecological and conservation value, this economic and cultural heritage contributed to the creation of the Iroise Marine Natural Park as the first marine protected area in France. This makes the long-term monitoring of plankton communities crucial not only for biodiversity conservation but also for preserving the economic and cultural heritage that led to its designation as France's first marine protected area.
The Iroise area also serves as a natural laboratory for studying planktonic community responses to climate change and understanding connections between lower trophic levels and fisheries. This is due to its complex oceanography, particularly the seasonal Ushant thermal front (Le Boyer et al., 2009; Pingree et al., 1975), which can act as a barrier for the dispersal of planktonic organisms between the Lusitanian biogeographical province in the south and the boreal biogeographical province in the north (Ayata et al., 2010). This front, along with an inner front and distinct surface–bottom dynamics, creates diverse habitats that support rich plankton communities and overall marine biodiversity (Cadier et al., 2017; Ramond et al., 2021; Schultes et al., 2013).
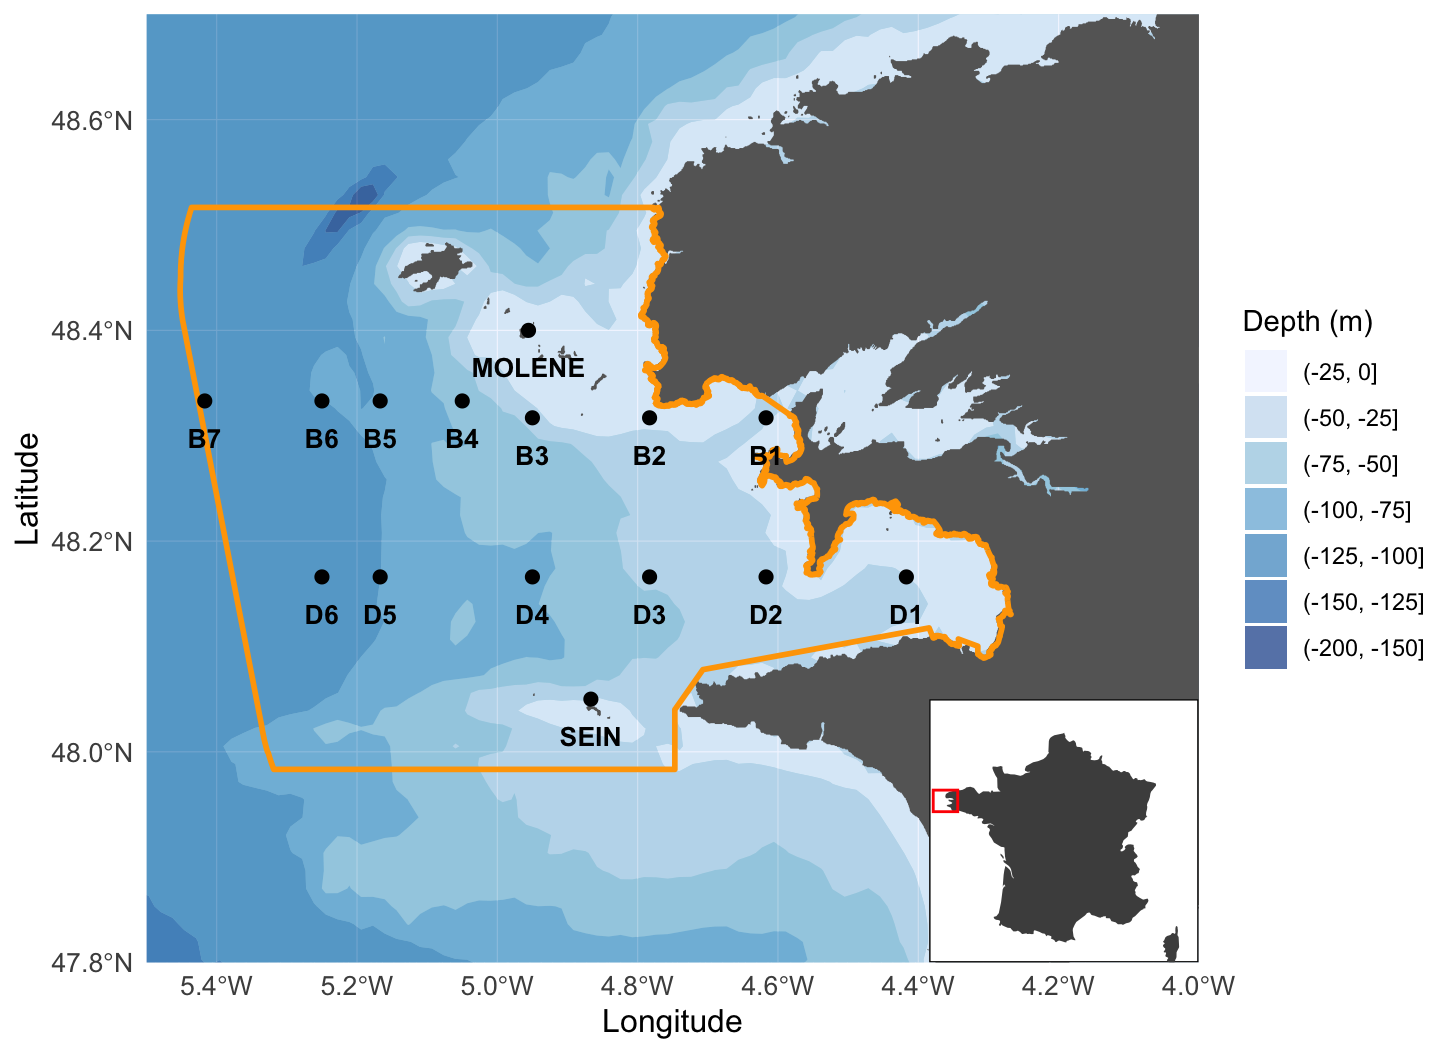
Figure 1Sampling zone in the Iroise Marine Natural Park with northern transect B (stations B1 to B7 from coast to open ocean), southern transect D (stations D1 to D6 from coast to open ocean), and coastal stations Molène, Sein, and Douarnenez (D1). PNMI limits are traced in yellow and bathymetry is shown in the background. Bathymetry data were obtained using the getNOAA.bathy() function from the R package marmap (Pante et al., 2023).
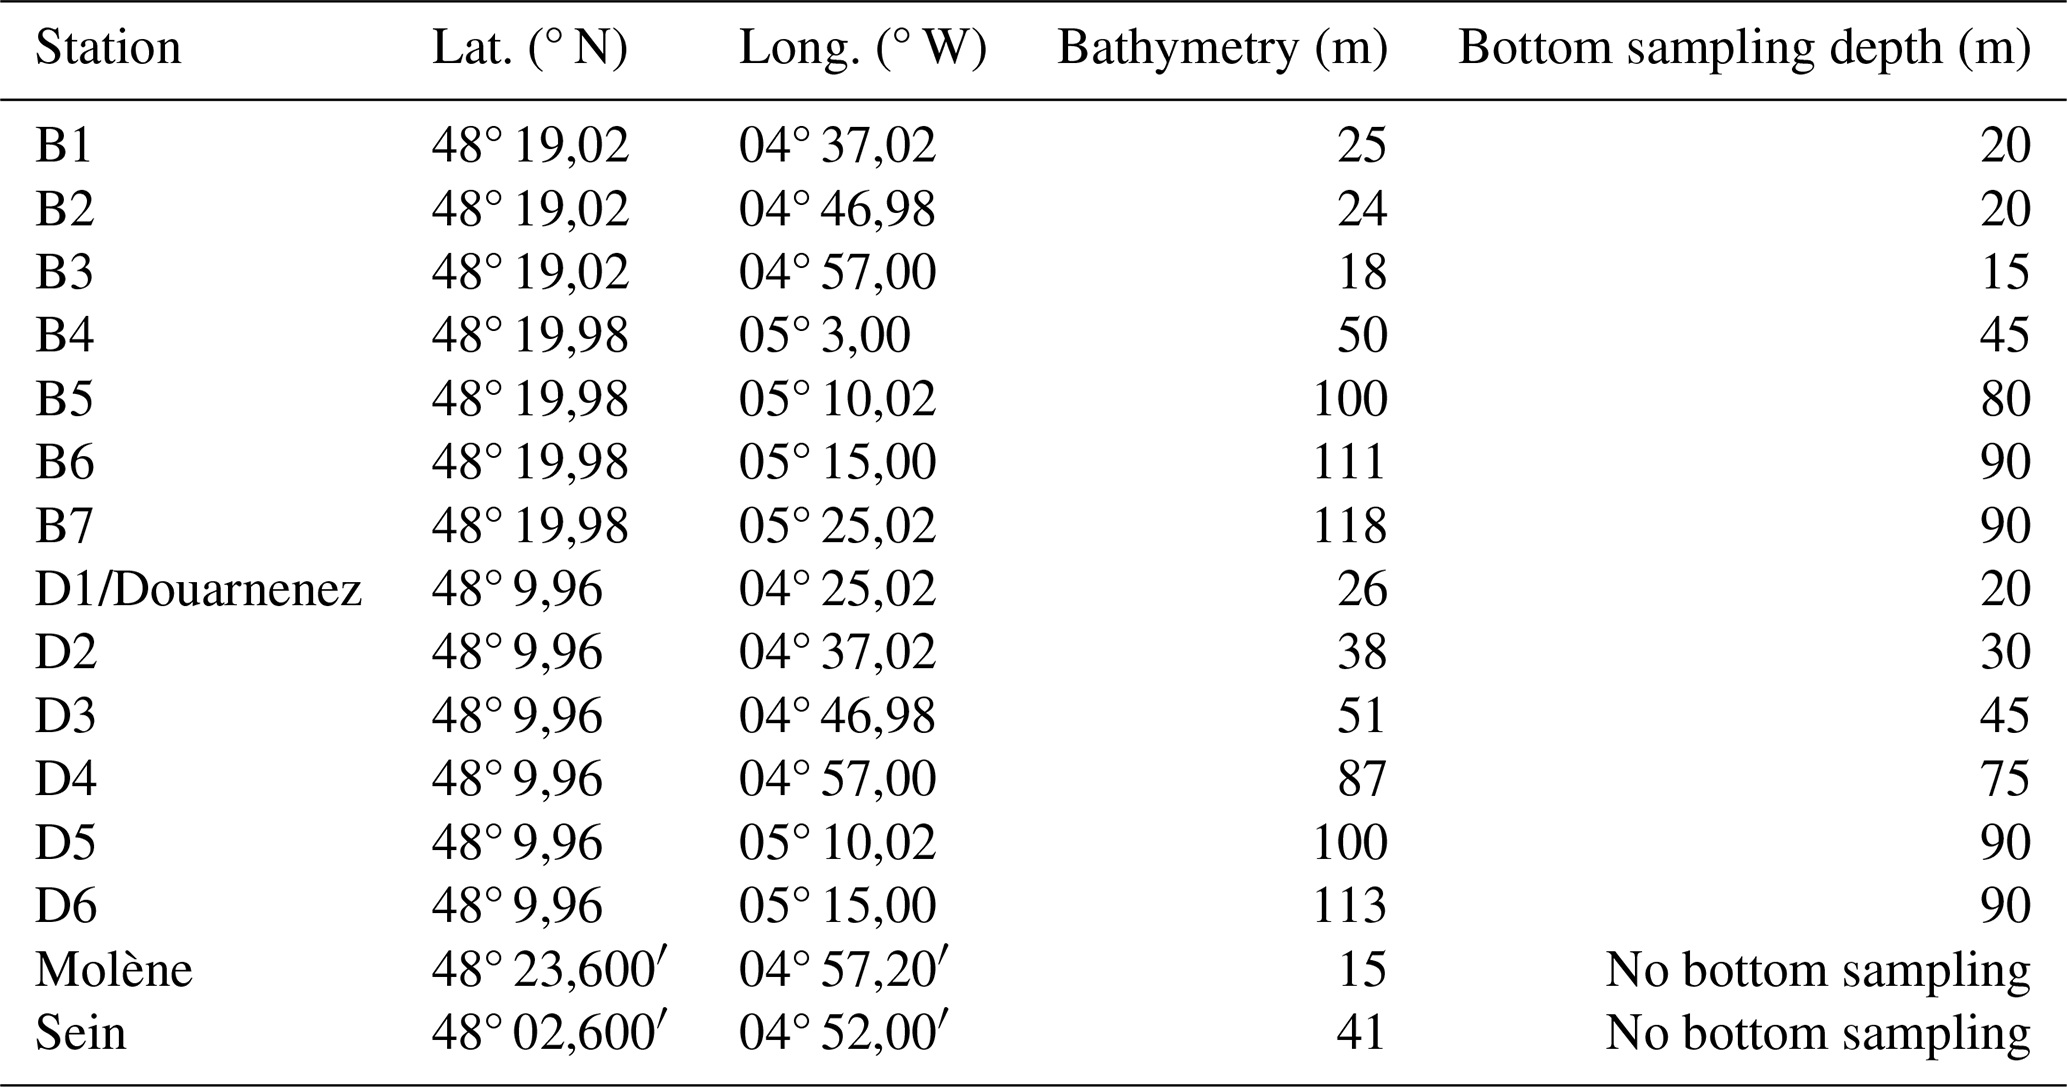
Table 1Coordinates and sampling depth of the stations on the two transects and the coastal stations. For the transect stations, the sampling was done both at the subsurface and at depth. For the coastal stations (Molène, Sein, Douarnenez), the sampling was only done at the subsurface (approximately 1 m depth).
3.1 Sampling
Plankton community sampling in the Iroise Marine Natural Park was conducted through regular monitoring cruises operated by the OFB-PNMI on board the vessel N/O Albert Lucas for the years 2011 and 2012 and on board the ValBelle PM 509 vessel in the north and the Augustine PM 510 vessel in the south between 2013 and 2024. Sampling design (Fig. 1; Table 1) included two parallel transects following a coastal–offshore gradient, as well as three coastal stations (Molène, Sein, and Douarnenez). Transects were strategically chosen and positioned within water masses that are influenced by front dynamics when the front is established. Along each transect, sampling stations were positioned at regular intervals to ensure capture of multiple water masses, given that the front position varies (Cadier et al., 2017; Chevallier et al., 2014). The northern transect B (offshore of Brest) included seven stations (B1 to B7 from the coast to offshore) and extended slightly further than the southern transect D (offshore of Douarnenez), which comprised six stations (D1 to D6, with D1 being more eastward than B1). Field sampling was conducted by two teams of four people each: one team covering the northern transect and one covering the southern transect. All stations were sampled within a single day by the two teams, requiring approximately 10 h from sample collection to fixation. Transect cruises were scheduled to capture seasonal variations, with sampling conducted in late spring, mid-summer, and mid-autumn, covering three of the four seasons until 2017 (see the transect sampling plan for zooplankton in Table S1 in the Supplement and for phytoplankton is Table S2 in the Supplement). From 2017 until 2023, the sampling frequency increased from three to four times per year (see Tables S1 and S2 for details). For the three coastal stations (Molène, Sein, and Douarnenez), phytoplankton were sampled every 2 weeks and zooplankton every month across the indicated time periods in Table S3 in the Supplement. The highly variable weather of the region occasionally prevented comprehensive sampling of hydrobiological variables and plankton at all stations, as occurred in fall 2012 and spring 2016 for the transect sampling sites, while coastal stations were less affected. Additionally, late winter 2020 sampling was interrupted due to COVID-19 restrictions. Sampling was reduced in 2014, then resumed in 2015 after reassuring the funders of the utility of collecting phytoplankton, zooplankton, and physical parameter data. The Douarnenez station being the same as station D1, data from both are treated as originating from the same station (D1) in this paper.
3.1.1 Hydrological data acquisition
Water samples were collected bimonthly by the Iroise Marine Natural Park technical personnel using a 5 L Niskin bottle following the Service d'Observation en Milieu LITtoral (SOMLIT) (Cocquempot et al., 2019) and Institut Universitaire Européen de la Mer (IUEM) protocols. Temperature and salinity were measured at sea at each station with a WTW (Wissenschaftlich-Technische Werkstätten) probe (Cond 1970i) equipped with a standard conductivity measuring cell (TetraCon 325/C) at the subsurface (approximately 1 m depth) and 1 m above the bottom. From 2017, temperature and salinity were also measured at sea using a conductivity–temperature–depth (CTD) sensor (NKE MP7 sensor).
Table 2Evolution of environmental and phytoplankton sampling protocol in the Iroise Marine Natural Park (2010–2023).
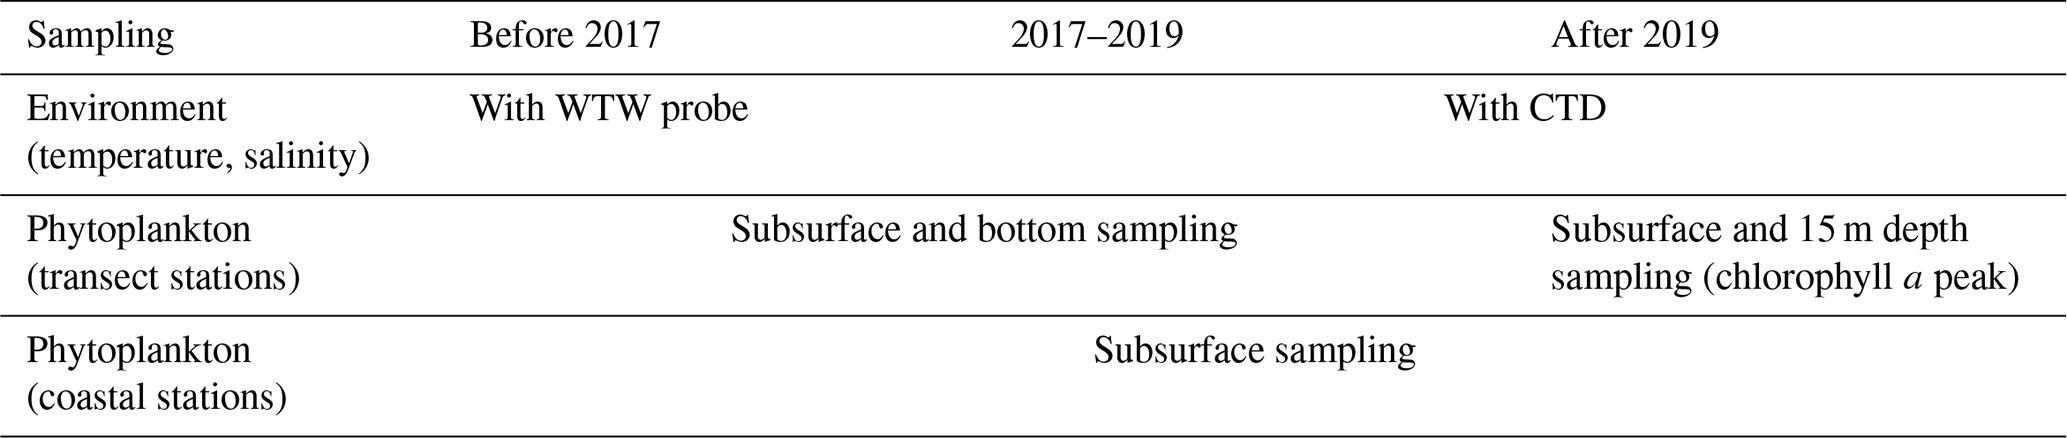
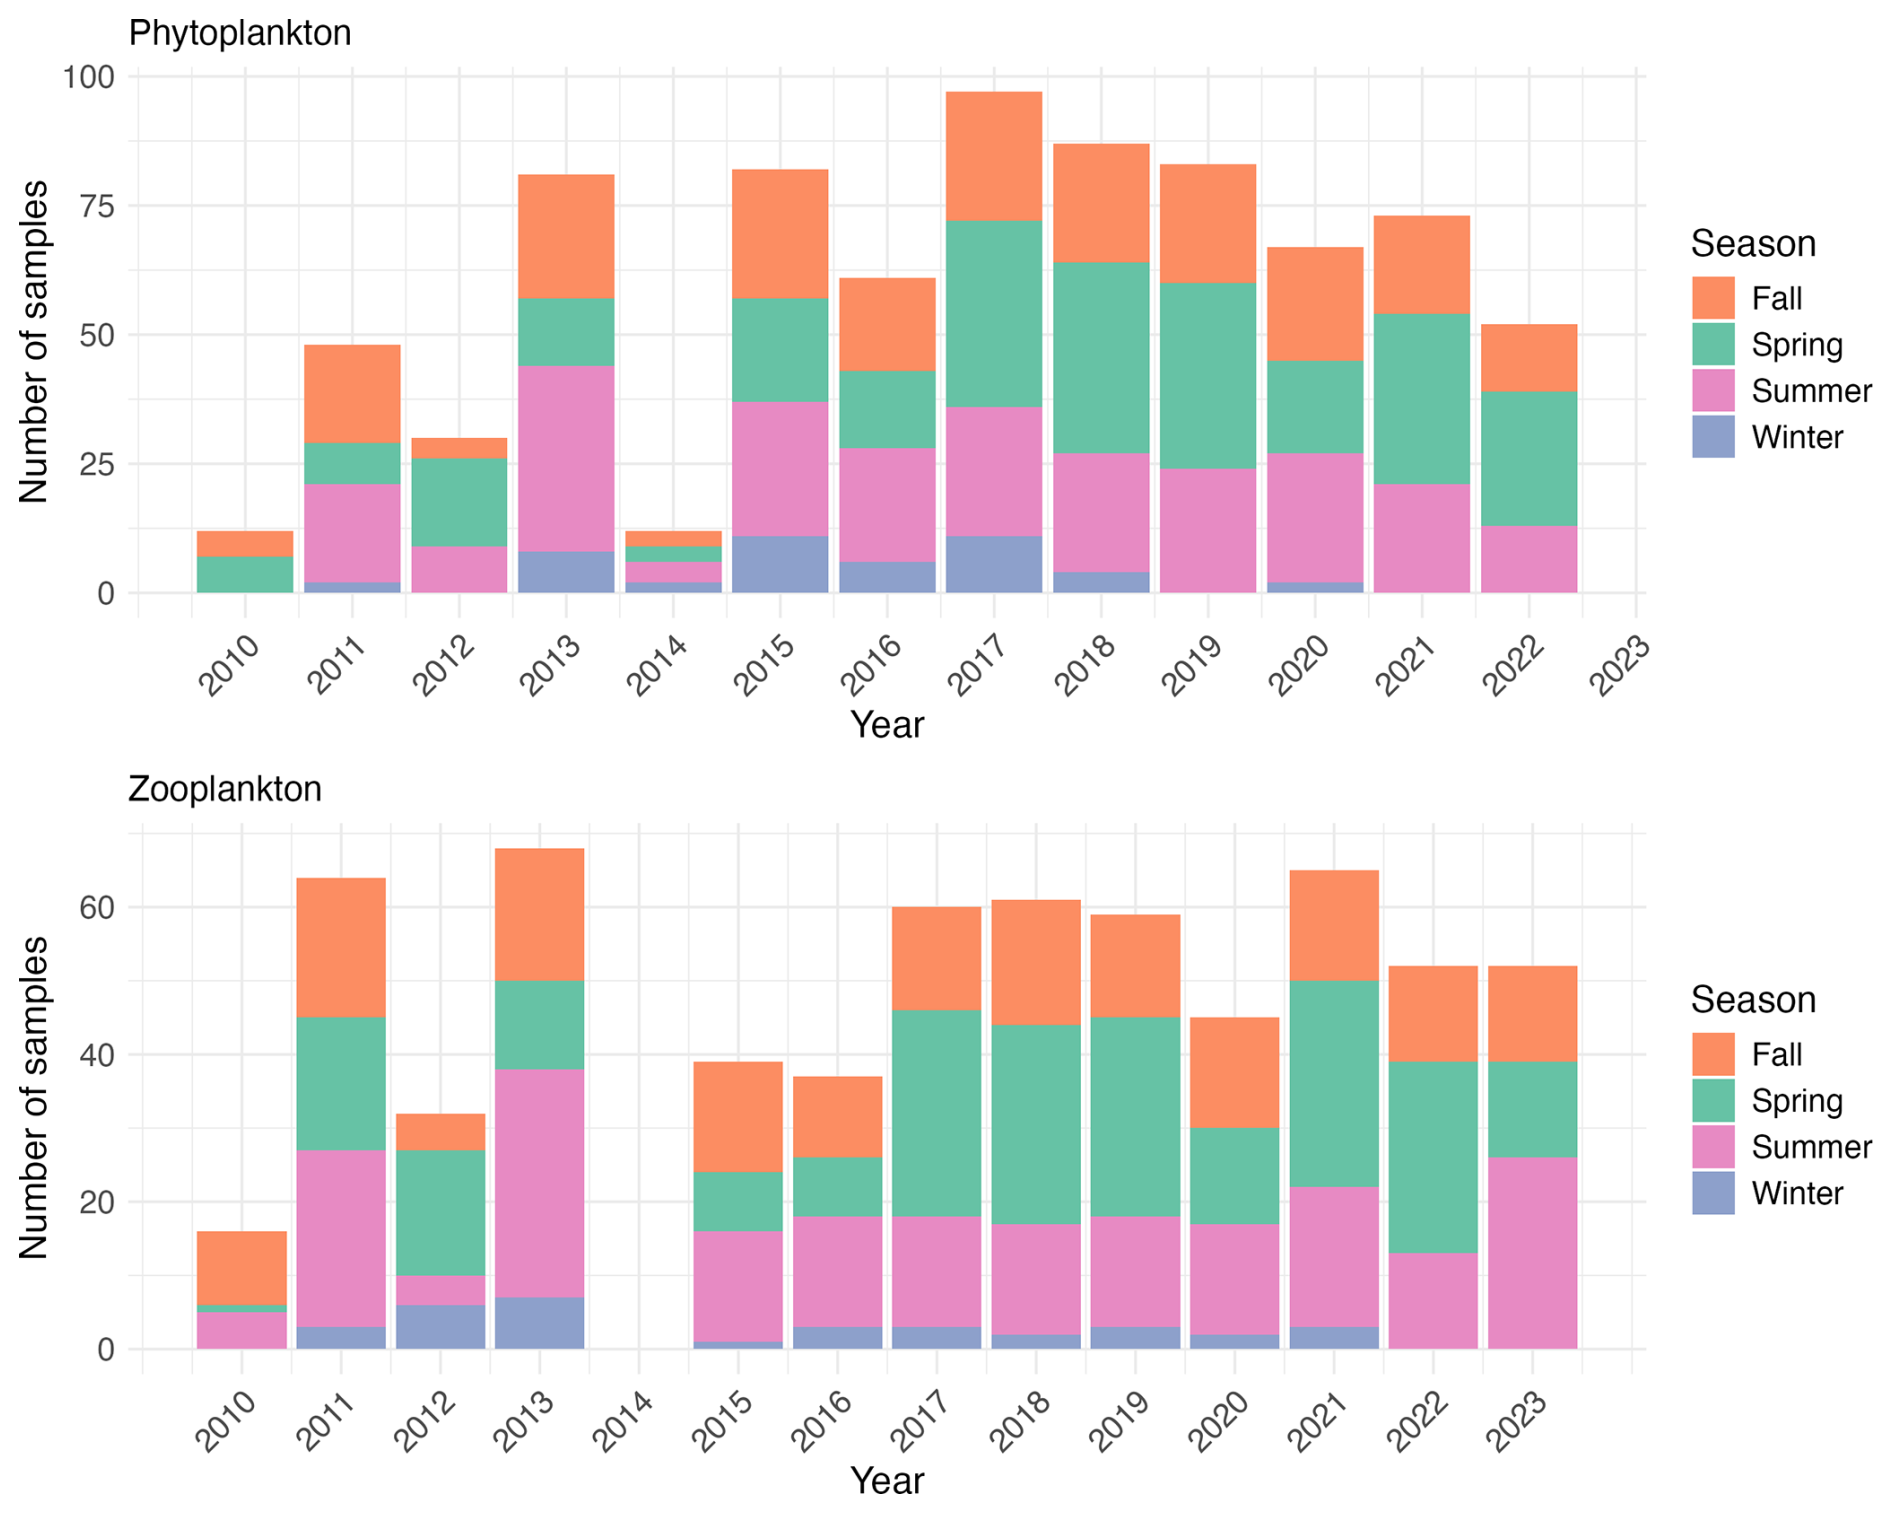
Figure 2Temporal distribution of phytoplankton and zooplankton sampling effort from 2010 to 2023. The stacked bars represent the number of samples collected per season (fall, spring, summer, winter) for each year. The upper panel shows phytoplankton sampling frequency (total number of phytoplankton samples = 785), while the lower panel shows zooplankton sampling frequency (total number of zooplankton samples = 650). Note that phytoplankton sampling was reduced in 2014, while no zooplankton samples were collected that year.
3.1.2 Phytoplankton sampling
For phytoplankton sampling, 250 mL of water was collected from the 5 L Niskin bottle, preserved in 250 mL glass flasks with 1 mL of Lugol's solution, and stored at ambient temperature in darkness. Coastal stations were sampled bimonthly at the subsurface only. For the transect stations (D1 through D6 and B1 through B7), phytoplankton was initially sampled at subsurface and bottom depths before 2017 (see Table 2). Following the introduction of CTD profiling in 2017, vertical profiles from 2017–2018 revealed that at offshore stations (B5–B7 and D5–D6), the chlorophyll a maximum, when present, consistently occurred between 15–18 m depth. At coastal stations (up to 40 m deep), strong vertical mixing typically maintained a homogeneous water column with no deep chlorophyll maximum, though when present, it also occurred at approximately 15 m depth. Based on these observations, bottom sampling was discontinued in 2019 and replaced with sampling at 15 m depth to better capture phytoplankton biomass.
The present dataset comprises 785 phytoplankton samples in total (Fig. 2). The annual number of phytoplankton samples varied annually (from 12 in 2010 and 2014 to 97 in 2017), with reduced winter sampling due to weather conditions. The sampling effort increased notably from 2010, reaching a peak of 97 samples in 2017, then gradually decreased to approximately 50 samples in 2022.
3.1.3 Zooplankton sampling
Zooplankton samples were obtained using a 200 µm mesh size WP2 plankton net with a 57 cm mouth diameter equipped with a flowmeter. At the sampling site, the WP2 net was deployed as vertically as possible to a maximum depth of 5 m above the sediment. However, the dynamic sea conditions in this area usually resulted in the cable forming a small angle. The net was then retrieved at a speed of 1 m s−1. In the case of flowmeter malfunction (e.g., due to clogging by algae), the filtered volume was estimated by multiplying the net's mouth area by the length of cable deployed and it was flagged in the sample_comment column of the corresponding EcoTaxa table. This calculation assumed consistent and adequate filtering efficiency across all sampling events. After initial rinsing, the cod-end tap was opened and the sample was collected in a 25 cm diameter sieve with 200 µm mesh. The tap was then closed, the net was rinsed again, and the tap reopened to collect any remaining organisms in the sieve. This rinsing and collection procedure was repeated two to three times depending on sample density to ensure complete organism recovery. The collected zooplanktonic organisms were transferred into a 250 mL double-sealed polypropylene flask and preserved by adding buffered formaldehyde in a 2:1 formaldehyde-to-sample ratio to achieve a final concentration of 4 %. The annual number of zooplankton samples ranged from 16 samples in 2010 (the first year of sampling) to 68 samples in 2013, reflecting variations in sampling frequency due to weather conditions (Fig. 2). In total, 650 zooplankton samples were collected.
3.2 Plankton identification and processing
3.2.1 Phytoplankton identification
Phytoplankton identification was performed on 50 mL subsamples following concentration using Utermöhl settling chambers (Hasle, 1978). Enumeration was conducted using phase contrast microscopy (Wild M40 inverted microscope) along diametrical transects at 300× or 600× magnification. Following Lund et al. (1958), the entire chamber surface was analyzed when warranted by specimen size or abundance. Taxonomic identification was performed to the lowest feasible level, with diatoms, dinoflagellates, and nanophytoplankton generally identified to genus or species. The employed methodology precluded identification and measurement of picophytoplankton (organisms < 2 µm in size). Indeed, due to their size, the cyanobacteria identified in this study were large colonial and filamentous forms (> 100 µm) from the Chroococcaceae, Oscillatoriaceae, and Microcoleaceae (genus Trichodesmium) families, hence belonging to the microphytoplankton size class. The dataset provided on SEANOE (see the “Data availability” section) contains the lowest identification level. For readability and visualization purposes, we decided to present phytoplankton data regrouped at the phylum level and zooplankton at a coarser level compared to the Ecotaxa definition.
3.2.2 Zooplankton digitization
Zooplankton samples were digitized using the ZooScan imaging system (Gorsky et al., 2010), a waterproof flatbed scanner that generates high-resolution (2400 dpi, pixel size: 10.56 µm) 16-bit grayscale images. All steps from digitization to identification were carried out at the EMBRC Quantitative Imaging Platform (PIQv) of the Institut de la Mer de Villefranche (https://sites.google.com/view/piqv/, last access: 10 September 2025). Prior to scanning, samples underwent a size-based separation process to prevent the underrepresentation of larger, less abundant organisms that might otherwise be lost in the fractionning process. This involved sieving the samples through a 1000 µm mesh, creating two distinct size classes: one for organisms exceeding 1 mm (large fraction) and another for those below this threshold (small fraction). A 100 µm mesh sieve, smaller than the net mesh size, was also used to prevent sample loss. Each size fraction was then fractionated using a Motoda plankton splitter (Motoda, 1959) to reduce the number of organisms per scan and limit object overlap as much as possible, following recommendations by Vandromme et al. (2012) and Jalabert et al. (2024).
3.2.3 Zooplankton image processing and identification
ZooScan images were processed using the ZooProcess software (Gorsky et al., 2010). The ZooScan captures 16-bit grayscale images of both the background and plankton samples, which are then converted to 8-bit. This conversion maps pixel values from 0 (black) to 255 (white) while preserving the meaningful gray range of the original image.
This normalization ensures comparability across different ZooScans without compromising identification accuracy, as the 8-bit resolution still exceeds the opacity variations found in preserved plankton. Next, a background image was subtracted from each sample image to create a nearly white background. To minimize measurement bias from overlapping objects, each subsample underwent manual separation of touching organisms and detritus particles on the scanning tray prior to imaging. These “multiple” images, which can affect abundance and biovolume estimates, were manually separated as recommended in Vandromme et al. (2012) following the protocol detailed in Jalabert et al. (2024).
Finally, particle processing was performed, where objects were segmented and extracted based on two thresholds: a gray-level intensity of 243 and a minimum equivalent spherical diameter (ESD) of 300 µm. The final output includes a table with 42 measurements (such as area, major and minor axes, gray level, and transparency) (https://zenodo.org/records/14704251, last access: 10 September 2025) along with individual regions of interest (ROIs) for each detected object.
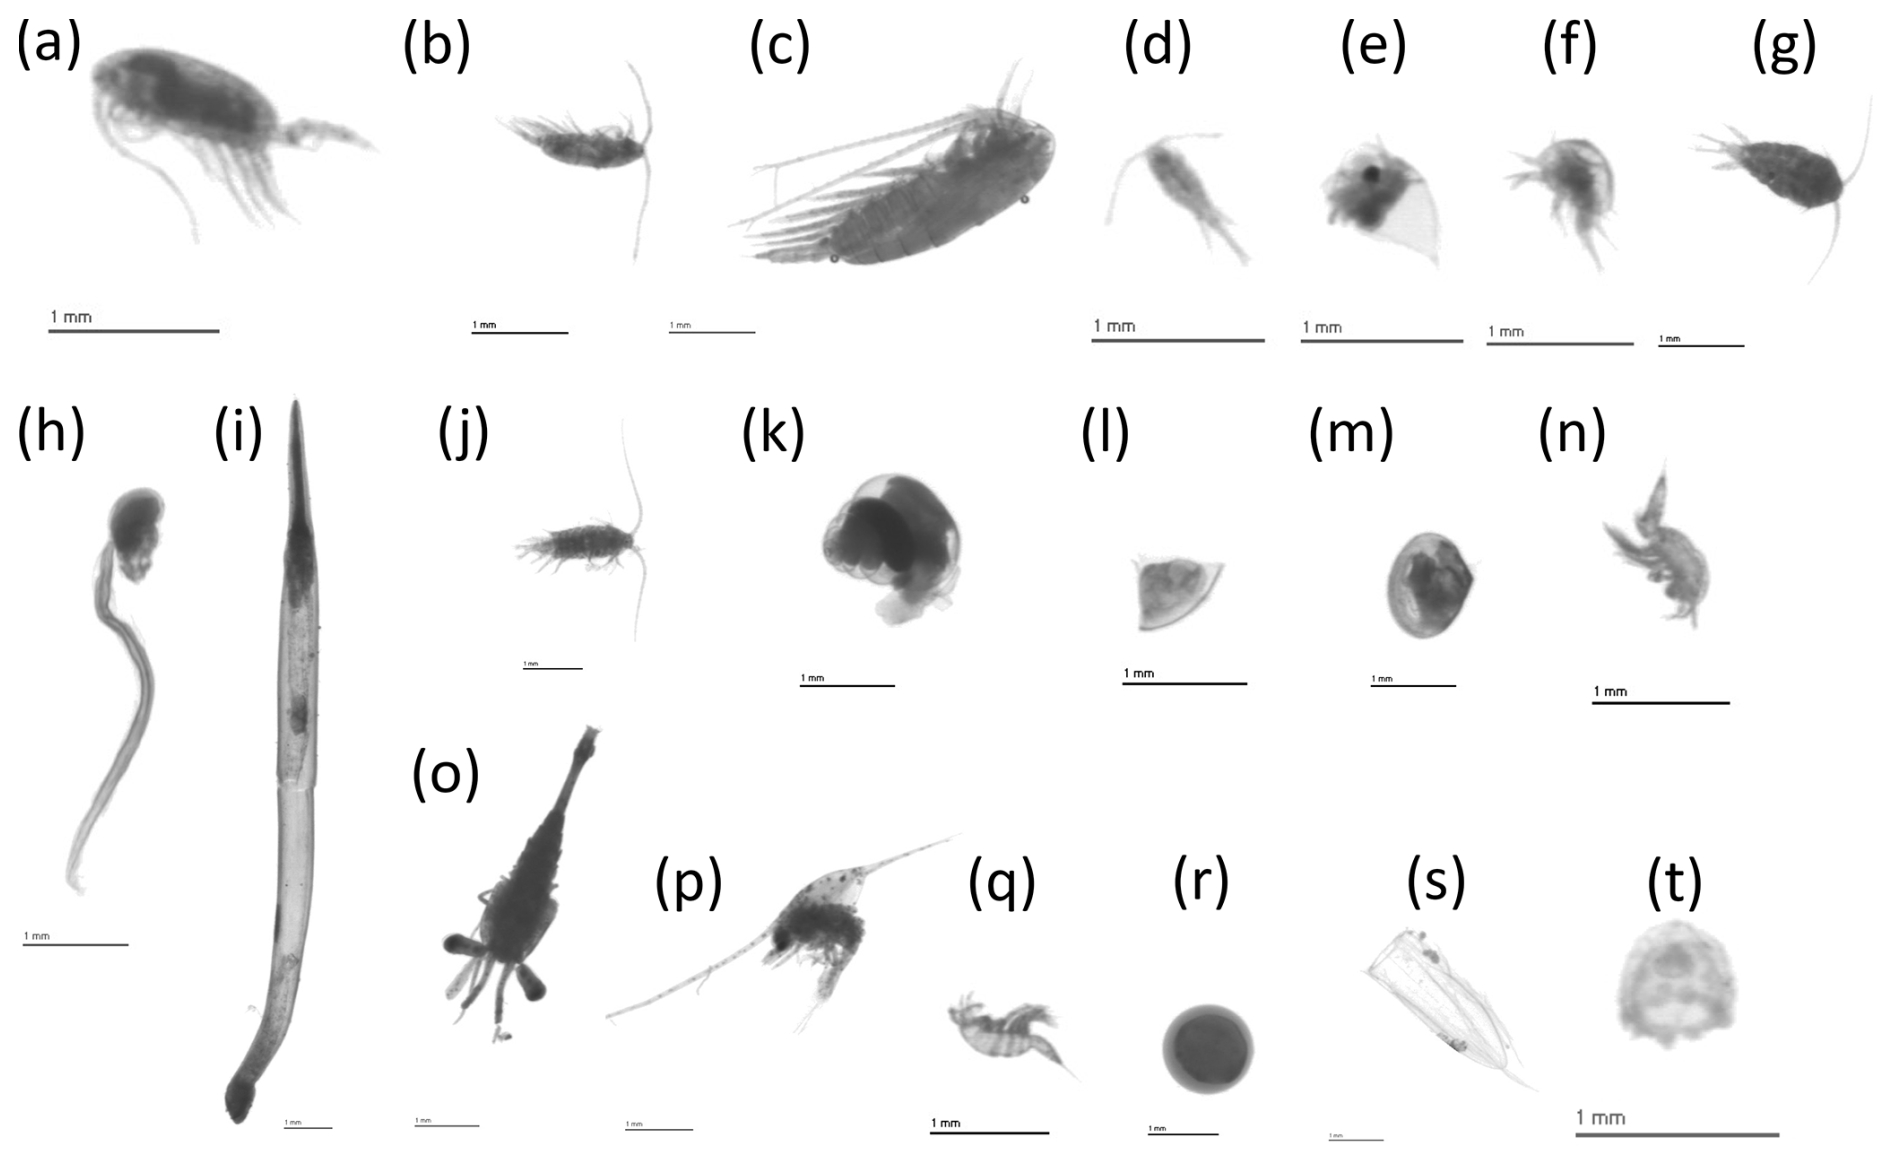
Figure 3Examples of planktonic organisms imaged by the ZooScan for the 20 most abundant taxa. (a) Calanoida, (b) Acartiidae, (c) Calanidae, (d) Oithonidae, (e) Podonidae, (f) nauplii < Cirripedia, (g) Temoridae, (h) Oikopleuridae, (i) Chaetognatha, (j) Centropagidae, (k) Limacinidae, (l) cyphonaute, (m) Bivalvia < Mollusca, (n) Oncaeidae, (o) Eumalacostraca, (p) larvae < Porcellanidae, (q) Harpacticoida, (r) egg < other, (s) nectophore < Diphyidae, (t) Hydrozoa. Note that a scale bar of 1 mm is represented in each image for comparison.
The digitized objects were then imported into the EcoTaxa web platform (Picheral et al., 2017, https://ecotaxa.obs-vlfr.fr/, last access: 11 February 2025), where supervised learning algorithms performed initial taxonomic classification, followed by a manual validation by human experts from the PIQv (Irisson et al., 2022). Organisms were categorized into 103 biological categories, excluding detritus, bubbles, and other scanning artifacts (Fig. 3). On average, per scan, there were 1152 ± 1030 (mean ± SD) elements (living and not living combined) for the large fraction (organisms exceeding 1 mm) and 2160 ± 1581 elements for the small one (organisms smaller than 1 mm), which corresponded to an average per scan of 545 ± 513 living objects for the large fraction and 1337 ± 1107 living objects for the small fraction.
3.3 Data processing
3.3.1 Environmental data processing
For both temperature and salinity, after removing abnormal data (e.g., negative salinity), the data were binned on a 1 m depth bin interpolated on a 1 m vertical resolution. Additional quality control included outlier detection and removal based on a 0.001 quantile threshold.
3.3.2 Phytoplankton data processing
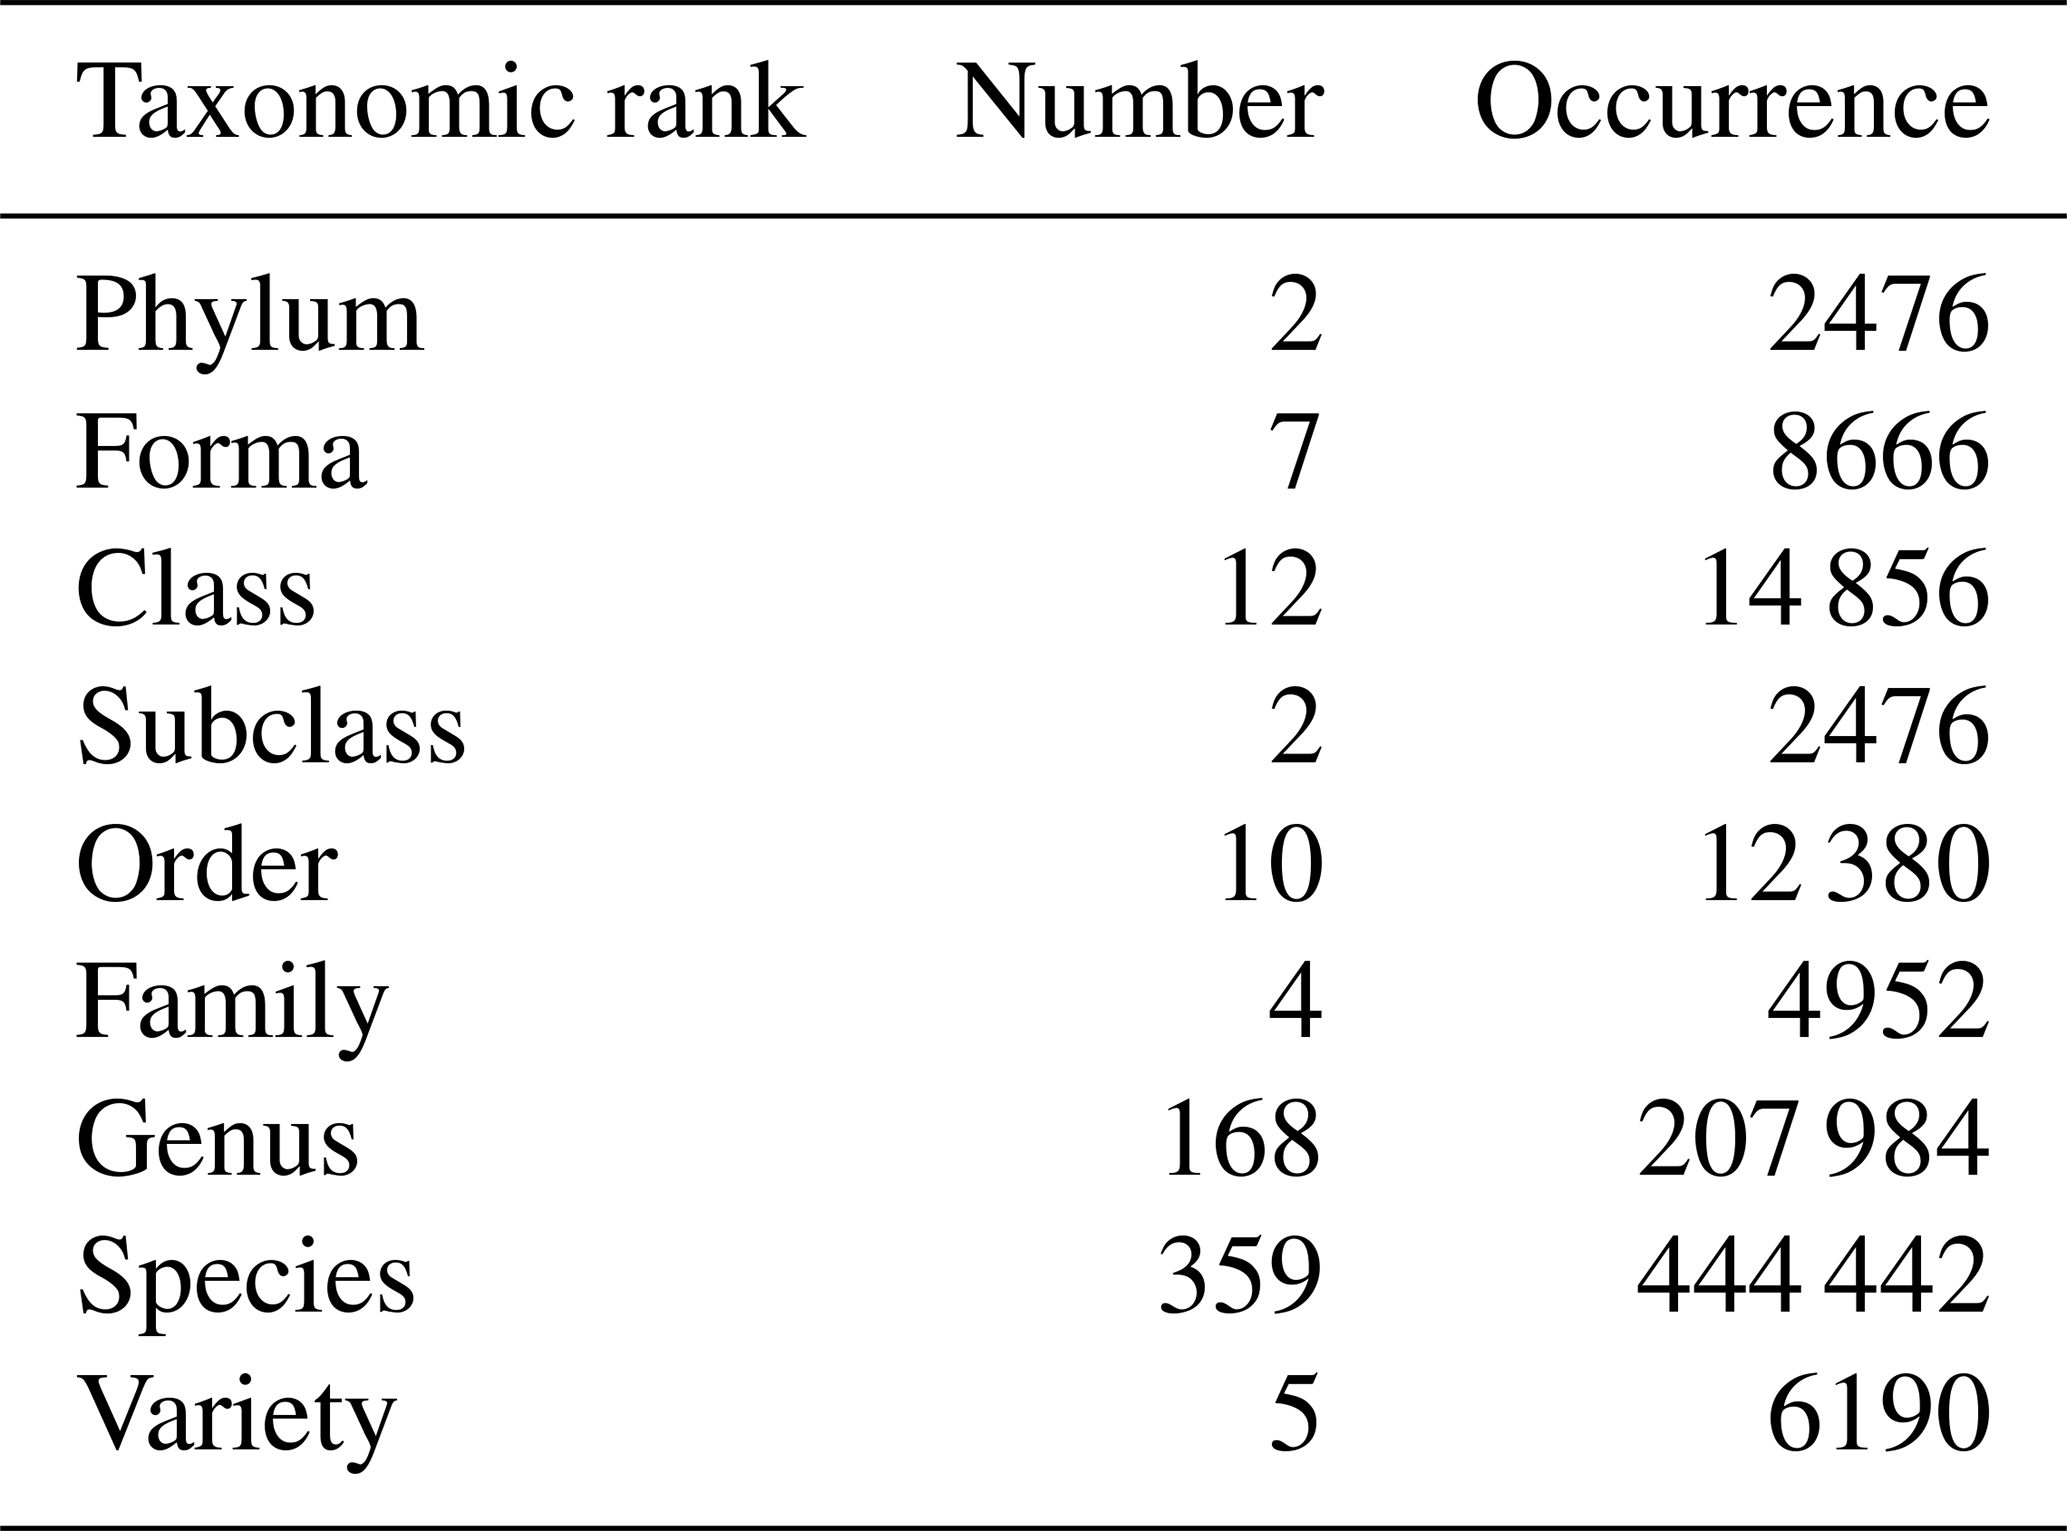
The 785 phytoplankton samples contained 573 unique taxa distributed across nine taxonomic ranks from phylum to variety level, with the majority represented at the genus (164 taxa) and species (359 taxa) levels (Table 3).
Table 3Number of unique taxa and occurrences across taxonomic ranks in marine phytoplankton samples from 2010 to 2022.
The Douarnenez station, being sampled at the same location as the D1 station from the southern transect, was redesignated as D1 while retaining a “Douarnenez” tag in the dataset for subsequent analyses. Based on the sampling month, data were grouped by season: winter (December, January, February), spring (March, April, May), summer (June, July, August), and fall (September, October, November). Proportions of each taxon were computed at various taxonomic levels to examine taxa distribution on both seasonal and annual scales.
3.3.3 Zooplankton data processing
Zooplankton imaging data were downloaded from Ecotaxa projects (see Table S4 in the Supplement for the detailed references of Ecotaxa projects), resulting in a dataset containing a total of 655 930 individual images of zooplankton organisms after removing artifacts and non-target objects (e.g., parts of organisms, seaweed).
Abundances (in individuals m−3) were computed using the subsampling ratios (column acq_sub_part of the Ecotaxa table) for both the large (acq1) and small (acq2) size fractions (see methods in Sect. 3.2.2). They were then normalized by total sampled seawater volumes (column sample_tot_vol of the Ecotaxa table) following Eq. (1):
where n is the number of individuals for the corresponding taxon.
The area (in pixels) obtained through ZooProcess image analysis was converted to mm2 using the converting column from the Ecotaxa table called process_particle_pixel_size_mm. This allowed computing the equivalent spherical diameter (ESD, in mm) following Eq. (2):
To compute the biovolume (in mm3) of each organism, we used the spheroid method based on area measurements following Eq. (3):
This approach was chosen to avoid errors that can occur with ellipse fitting, especially for organisms with irregular shapes or protruding appendages. Area measurements, obtained through ZooProcess image analysis, provide a more consistent basis for estimating biovolume across diverse plankton morphologies (Drago et al., 2022).
Table 4Names of the taxonomic groups of the zooplankton dataset according to the Ecotaxa annotation (column “Annotation_category”), the regroupment proposed in this paper (column “Groups”), and the associated number of images and their relative frequencies across the complete dataset. The groups are listed in decreasing numbers of images.
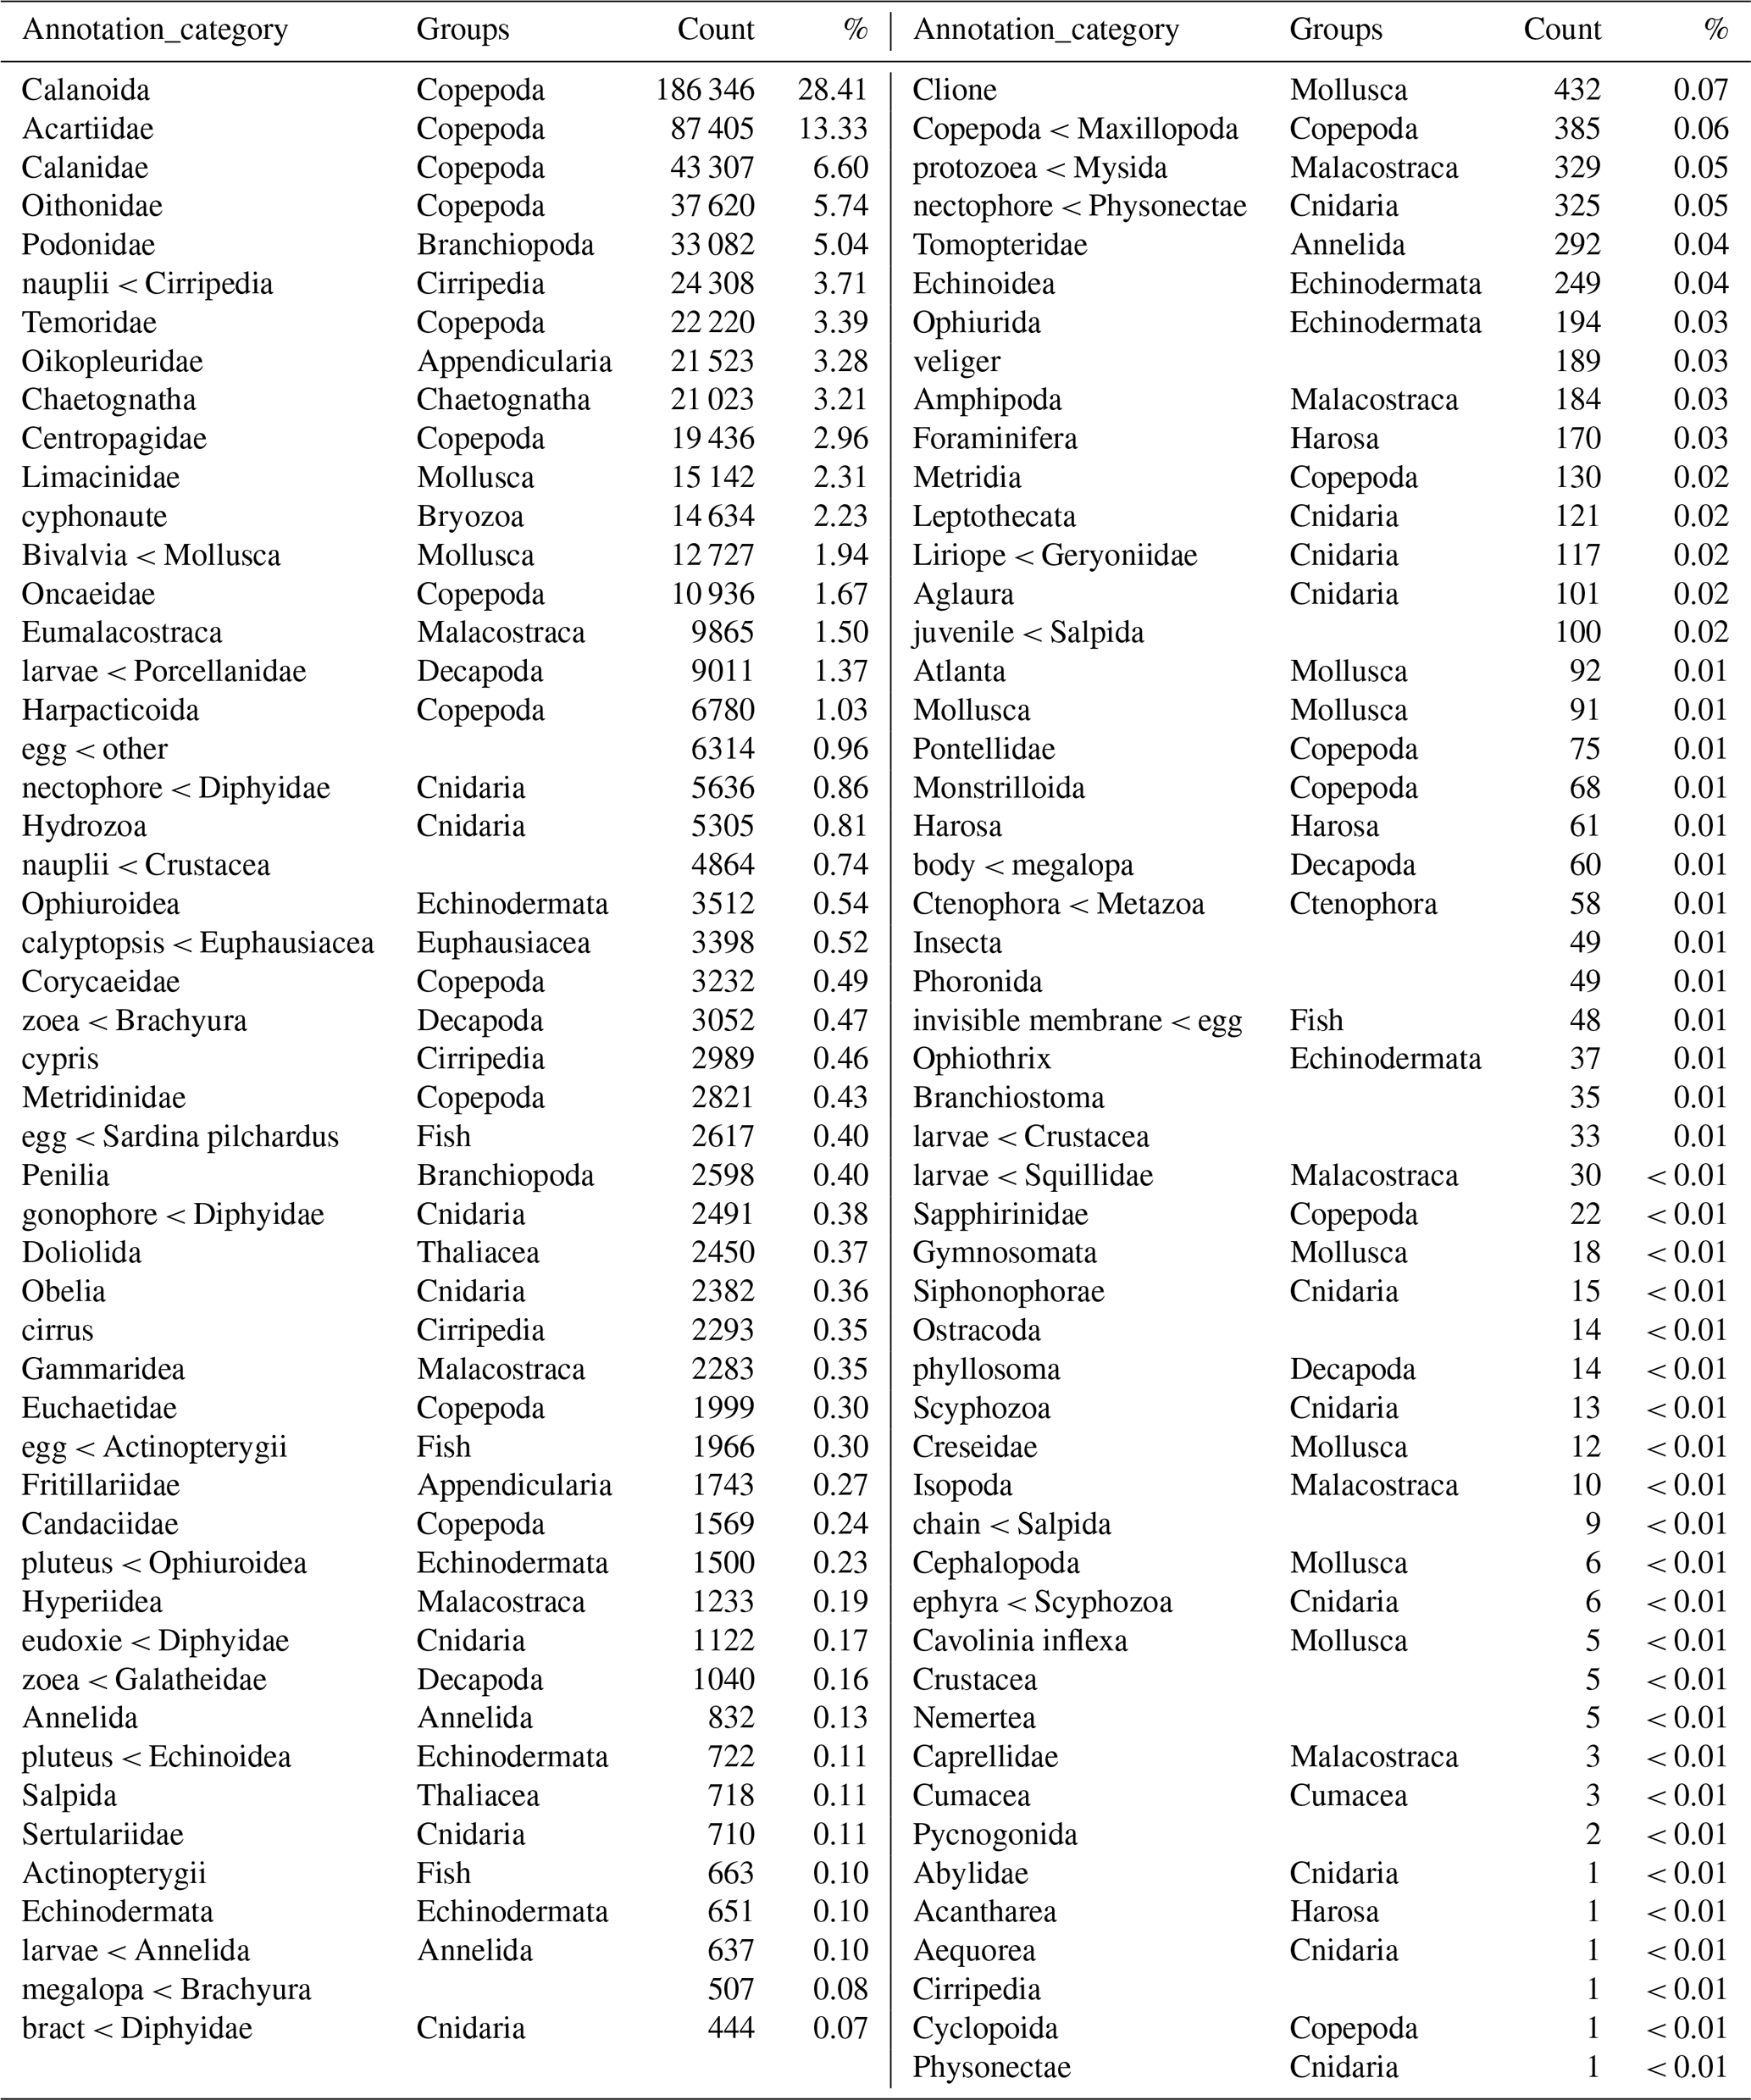
The image data were thereafter grouped into 17 broader taxonomic groups (see Table 4).
Multiple quality control procedures were implemented throughout data collection, processing, and analysis to ensure data reliability and consistency. These procedures covered environmental parameters, phytoplankton identification, and zooplankton classification.
For environmental parameters, systematic quality checks were performed on temperature and salinity measurements. Abnormal values, such as negative salinity readings, were removed from the dataset. The remaining data underwent binning on 1 m depth intervals with interpolation at 1 m vertical resolution.
Phytoplankton identification quality was maintained through taxonomic consistency. For transect samples, all microscopic analyses were performed by a single specialized taxonomist (Béatriz Beker from the French network RESOMAR) throughout the entire study period (2010–2022). She participates in quality assurance programs including the Phytoplankton Proficiency Test organized by the Marine Institute-IOC-BEQUALM-NMBAQC to ensure taxonomic accuracy. For coastal station samples, another taxonomist (Sylvain Coulon) conducted identifications for samples from Douarnenez (2013–2018), Sein (2013–2020), and Molene (2013–2017), representing 241 of 336 coastal samples, using the same taxonomic reference list as Béatriz Beker, while Béatriz Beker identified the remaining coastal samples. This approach ensures consistency in counting methodology and taxa identification across the time series. Sylvain Coulon collaborates with Ifremer specialists for taxonomic validation and regularly participates in REPHY (REPHY – French Observation and Monitoring Program for Phytoplankton and Hydrology In Coastal Waters, 2023) and PHYTOBS (https://www.phytobs.fr/, last access: 10 September 2025) networks (workshops, intercalibration exercises) to ensure consistent phytoplankton identification standards.
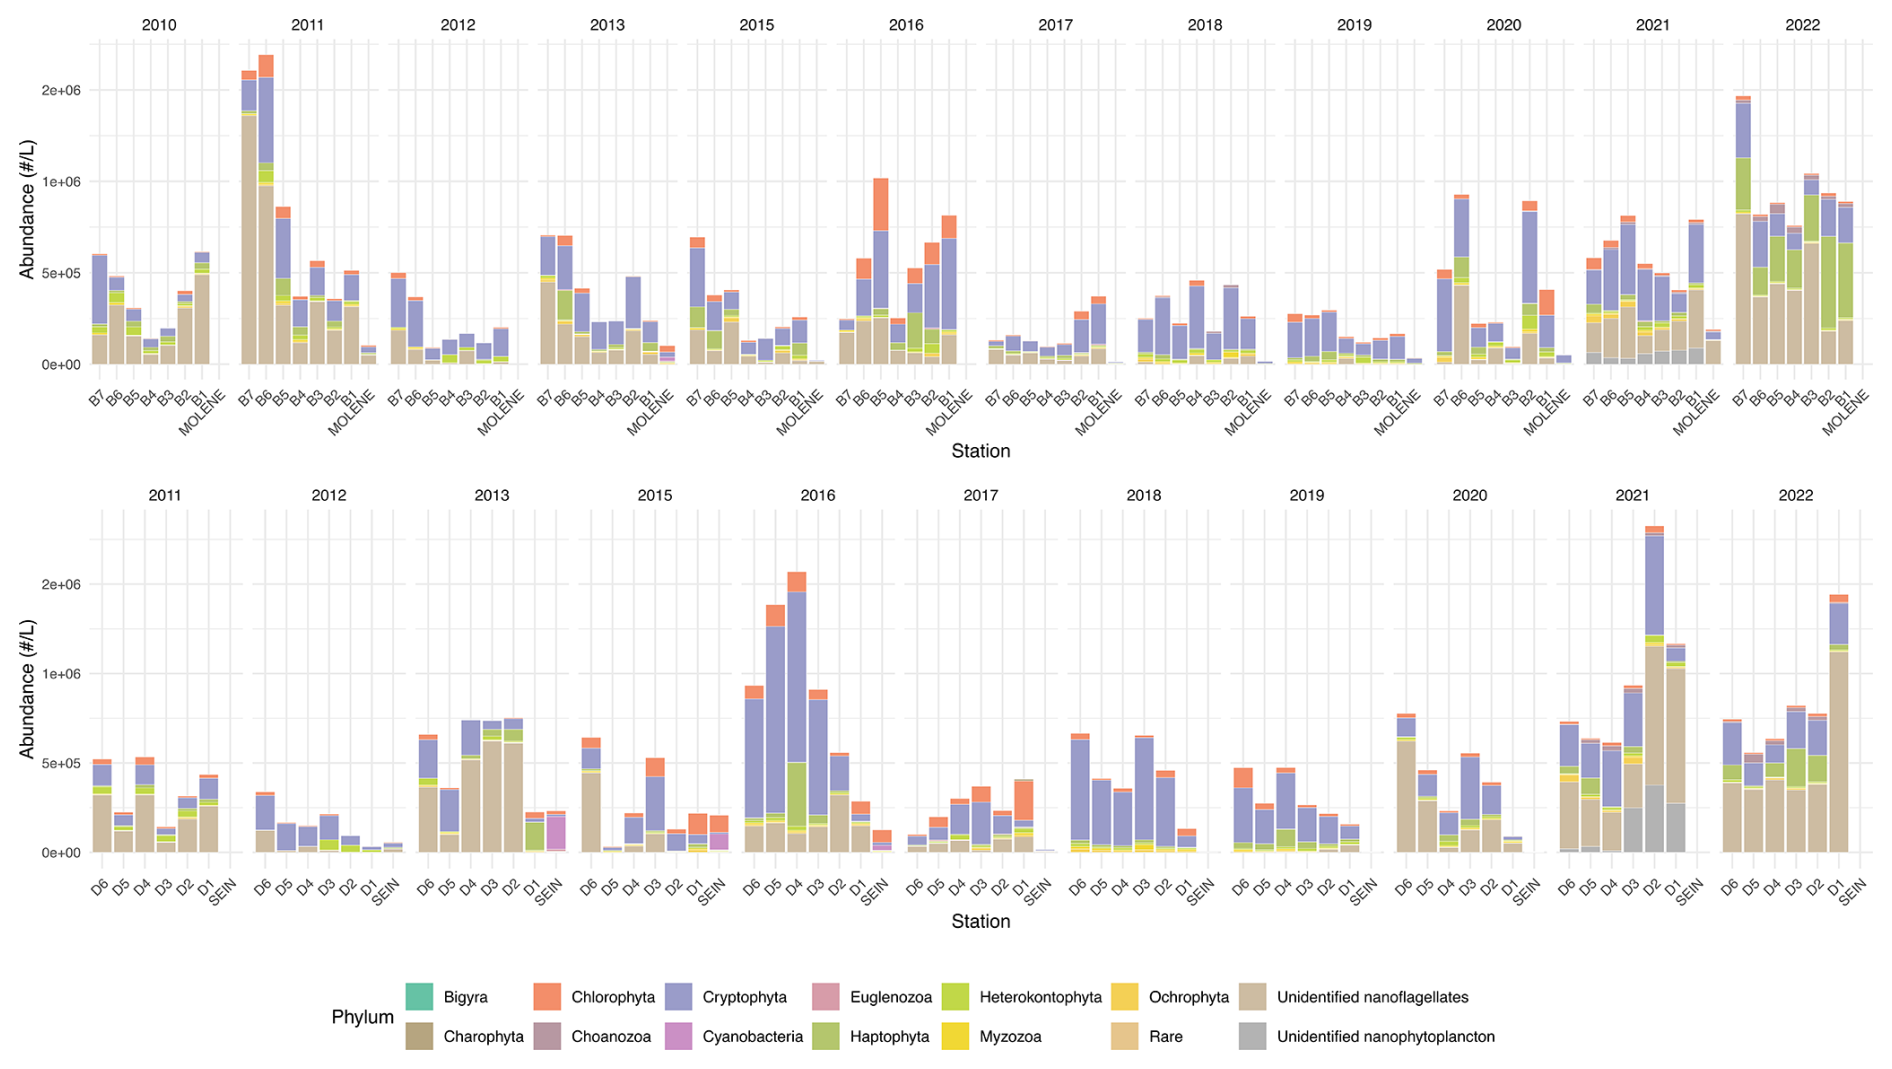
Figure 4Mean absolute abundance (cells L−1) of phytoplankton phyla at surface sampling stations across two transects (B on top and D on the bottom) as well as at Molene and Sein coastal stations from 2010 to 2022. Each stacked bar represents the total community count at a sampling station, with the size of each colored bar indicating the absolute abundance of each phylum. The upper panel displays the B transect (B1–B7) and the Molène coastal station, while the lower panel shows the D transect (D1–D6) and the Sein coastal station. Each phylum is represented by a distinct color as shown in the legend.
For zooplankton data, initial classification was performed using supervised learning algorithms, followed by expert validation as described in Irisson et al. (2022). Particularly for samples collected between 2018 and 2023, experts from the PIQv (Quantitative Imaging Platform of Villefranche) reviewed and validated all the already classified objects, making corrections where necessary, serving as a strong quality assurance indicator. This validation process ensured taxonomic homogenization across projects during these years. This dual approach – combining efficient computational methods with expert biological knowledge – optimizes the balance between processing speed and taxonomic precision. It allows for the reliable analysis of large-scale plankton datasets while maintaining high standards of scientific rigor. While all identifications have been reviewed by at least one human operator, we cannot fully guarantee the correctness of each of the > 655k identifications. Some taxonomic uncertainty may persist at finer classification levels, particularly for samples processed before 2018 when taxonomic expertise was fully standardized across operators. However, standardized protocols and systematic validation procedures established during the study period provide confidence in data consistency at the taxonomic group level.
Both monitoring programs show increased complexity over time, evolving from sporadic sampling in 2010–2011 to more systematic seasonal coverage in recent years (Fig. 2). This temporal heterogeneity may affect the detection of seasonal patterns and short-term variability, particularly in the earlier years (2010–2016) when fewer seasons were sampled compared to the more frequent sampling in later years (2017–2022), potentially influencing the interpretation of long-term trends and seasonal dynamics.

Figure 5Relative abundance (% of total individuals) of phytoplankton phyla at surface sampling stations across two transects (B on top and D on the bottom) as well as at Molene and Sein coastal stations from 2010 to 2022. Each stacked bar represents the community composition at a sampling station, with the proportion of each phylum calculated as the percentage of the total abundance of individuals counted at that station. The upper panel displays the B transect (B1–B7) and the Molène coastal station, while the lower panel shows the D transect (D1–D6) and the Sein coastal station. Each phylum is represented by a distinct colour as shown in the legend.
5.1 Database structure
The dataset contains three distinct tables all containing both text and numerical data.
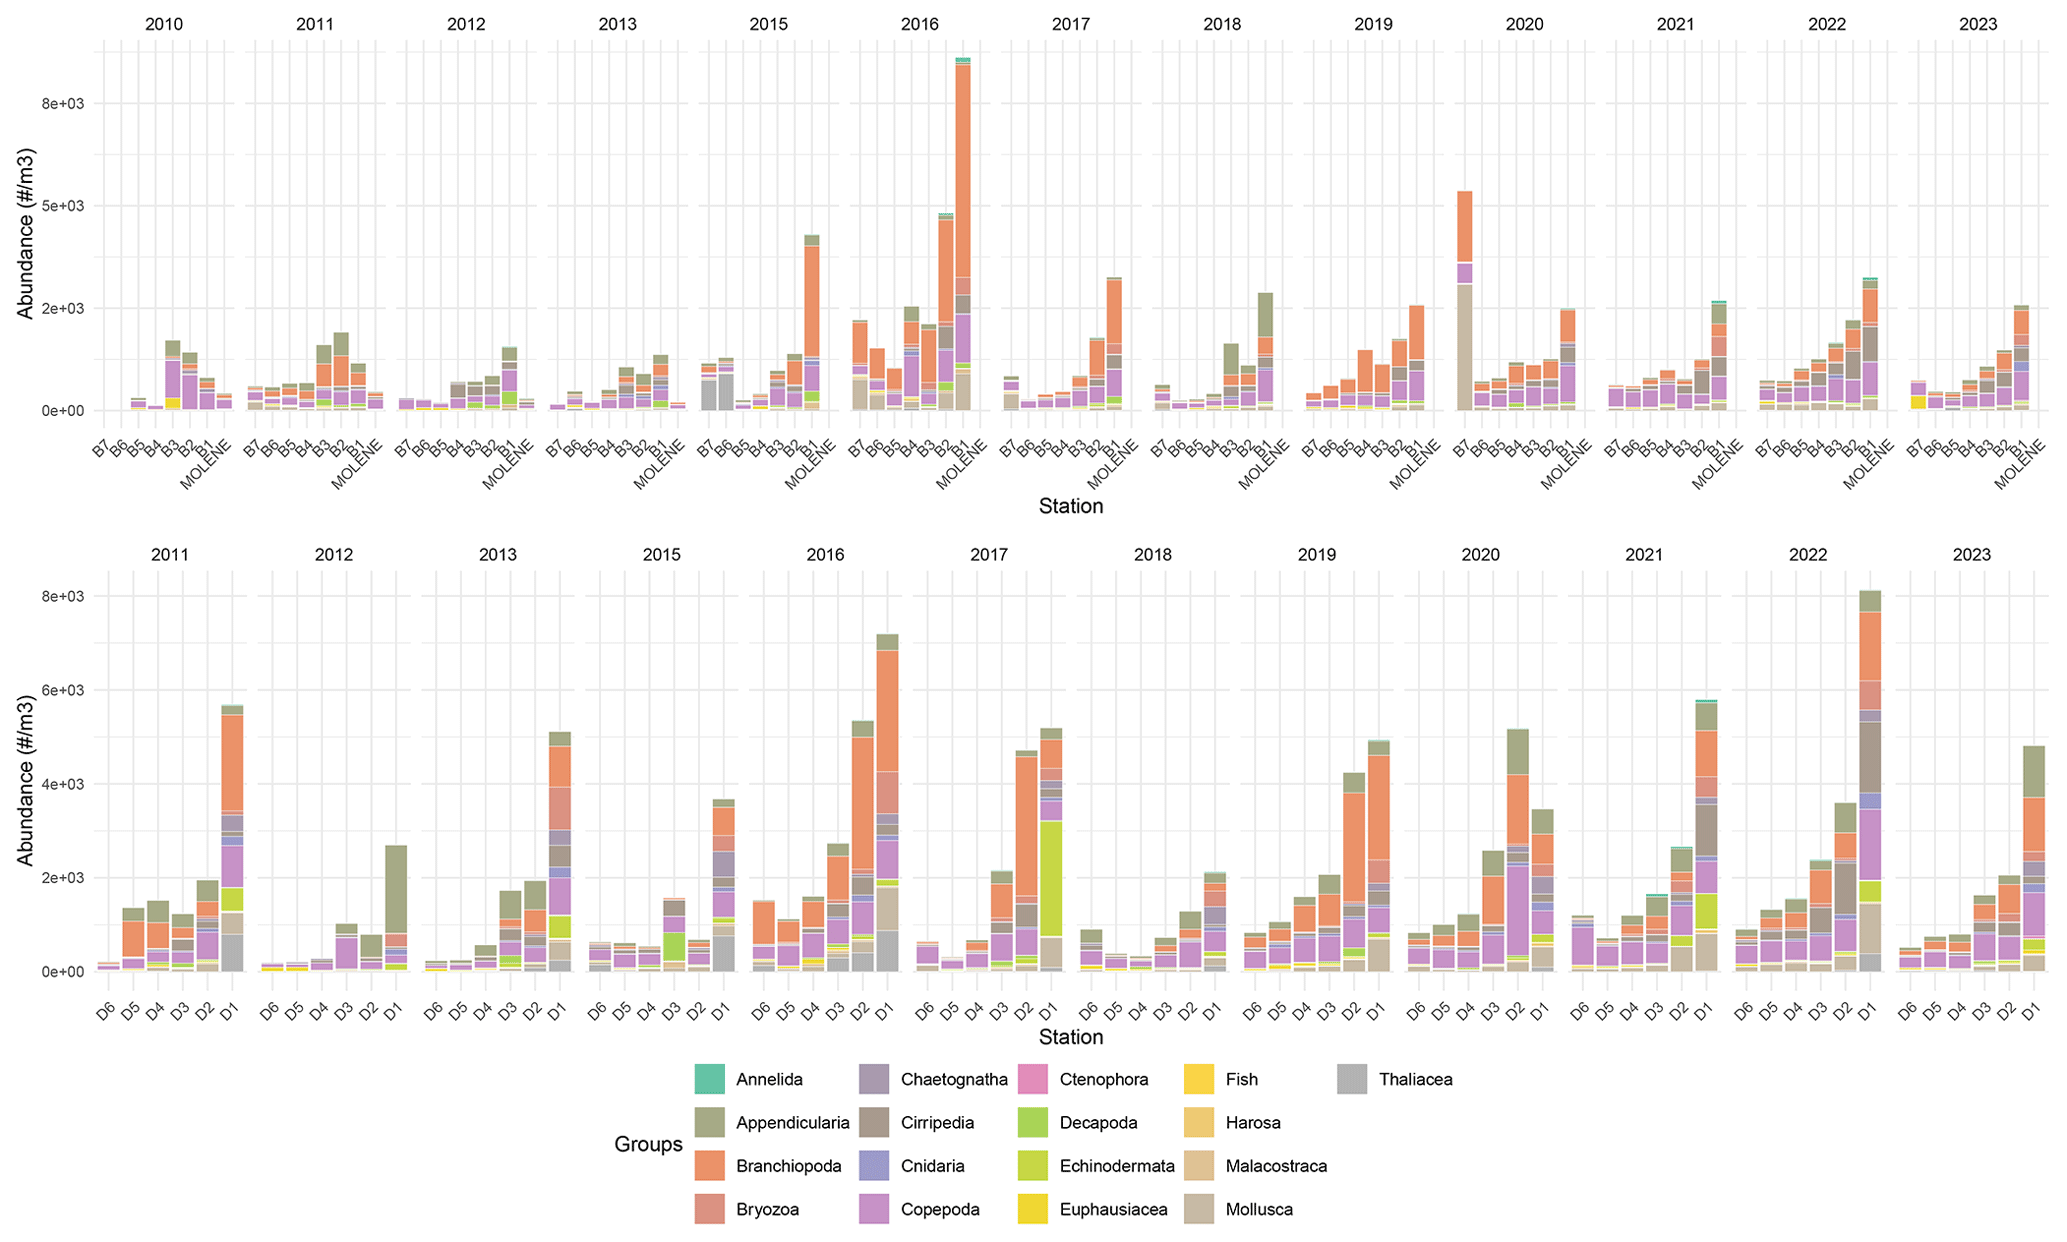
Figure 6Mean absolute abundance (individuals m−3) of zooplankton phyla at surface sampling stations across two transects (B on top and D on the bottom) and at Molene coastal station from 2010 to 2023. Each stacked bar represents the mean absolute abundance at a specific station, with different colors indicating distinct taxonomic groups as shown in the legend. The upper panel shows data from the B transect (stations B1–B7) and Molene station, while the lower panel displays data from the D transect (stations D1–D6). Note that the Cumacea group was excluded as it contains only three images.
The first dataset contains phytoplankton data and follows a similar organizational structure:
-
Metadata information (columns 1–8):
-
Station name (column 1)
-
Transect name (column 2)
-
Coordinates: longitude and latitude (columns 3–4, in DD.dddd)
-
Sampling time: date, year, month, and Julian day (columns 5–8)
-
-
Environmental measurements:
-
Surface, 15 m, and bottom temperature (columns 9–11, in °C)
-
Surface, 15 m, and bottom salinity (columns 12–14, in PSU)
-
-
Phytoplankton taxa concentrations:
-
Surface abundance in cells L−1 (columns 15–582, prefix “surface_” + taxa name)
-
Bottom abundance in cells L−1 (columns 583–1150, prefix “bottom_” + taxa name)
-
The complete taxonomic hierarchy for each phytoplanktonic taxon, from kingdom to its identification level, was retrieved using the worrms R package (Chamberlain and Vanhoorne, 2023). Each taxon is provided in the third dataset with the corresponding unique identifier called aphiaID from the World Register of Marine Species (WoRMS Editorial Board, 2025), which enables unambiguous species identification across databases.
The second dataset integrates zooplankton measurements with their corresponding environmental parameters and is organized as follows:
-
Metadata information (columns 1–8):
-
Station name (column 1)
-
Transect name (column 2)
-
Coordinates: longitude and latitude (columns 3–4, in DD.dddd)
-
Sampling time: date, year, month, and Julian day (columns 5–8)
-
-
Environmental measurements:
-
Surface and bottom temperature (columns 9–10, in °C)
-
Surface and bottom salinity (columns 11–12, in PSU)
-
-
Biological data for each taxonomic group:
-
Sample abundance in individuals m−3 (columns 13–116, prefix “conc_” + taxa name)
-
Total biovolume in mm3 m−3 (columns 117–220, prefix “tot_biov_” + taxa name)
-
Mean individual biovolume in mm3 (columns 221–324, prefix “mean_biov_” + taxa name)
-
5.2 Phytoplankton distribution
Figure 4 shows the mean annual phytoplankton abundances across the sampling area, highlighting the remarkable temporal and spatial variability throughout the study period. The absolute abundance shows substantial temporal and spatial variability throughout the study period. Notable peaks in total phytoplankton abundance occurred in 2011 and 2022 in transect B, with mean abundances exceeding 2 × 10⁶ cells L−1 at some stations. In transect D, remarkable abundance peaks were observed in 2016 and 2021–2022, where mean abundances also exceeded 2 × 10⁶ cells L−1.
There does not appear to be a consistent coastal-to-offshore gradient in phytoplankton abundance throughout the years in either northern and southern stations. This absence of a clear gradient could likely result from temporal averaging across seasons, which obscures the spatial effects of the seasonal Ushant thermal front that would be evident in season-specific analyses.
To have a better look at the composition, we can observe phytoplankton relative abundance as presented in Fig. 5. In surface waters, the phytoplankton composition showed interannual and spatial variations along both transects. Several groups dominate the community structure across stations and years, including Cryptophyta (in orange), Heterokontophyta (in dark green), Myzozoa (in light green), and nanoflagellates (in light brown). Nanoflagellates are one of the predominant groups in all the years except for 2018 and 2019 when they are present in very low proportion. Some groups, such as Cyanobacteria, nanophytoplankton, and Euglenozoa, appear sporadically and in lower proportions.
Some years present a coast–offshore gradient in community composition, but most years do not present a clear pattern of distribution (Fig. 5). The two coastal stations of Molène and Sein sometimes display a very different distribution. This is especially visible for the station Sein that presents a high to low presence of Cyanobacteria from 2013 to 2016.
5.3 Zooplankton distribution
Zooplankton data collected from 2010 to 2023 revealed a pronounced coastal–offshore gradient in mean absolute abundance throughout the years (Fig. 6), with decreasing zooplankton concentrations as distance from the coastline increased. Coastal stations (especially B1 and D1) consistently exhibited the highest values, with maximum values reaching up to 8 × 10³individuals m−3 during peak periods in transect B. Notably, the D transect stations exhibited abundance values exceeding 2 × 10³ individuals m−3 more frequently than stations along transect B.
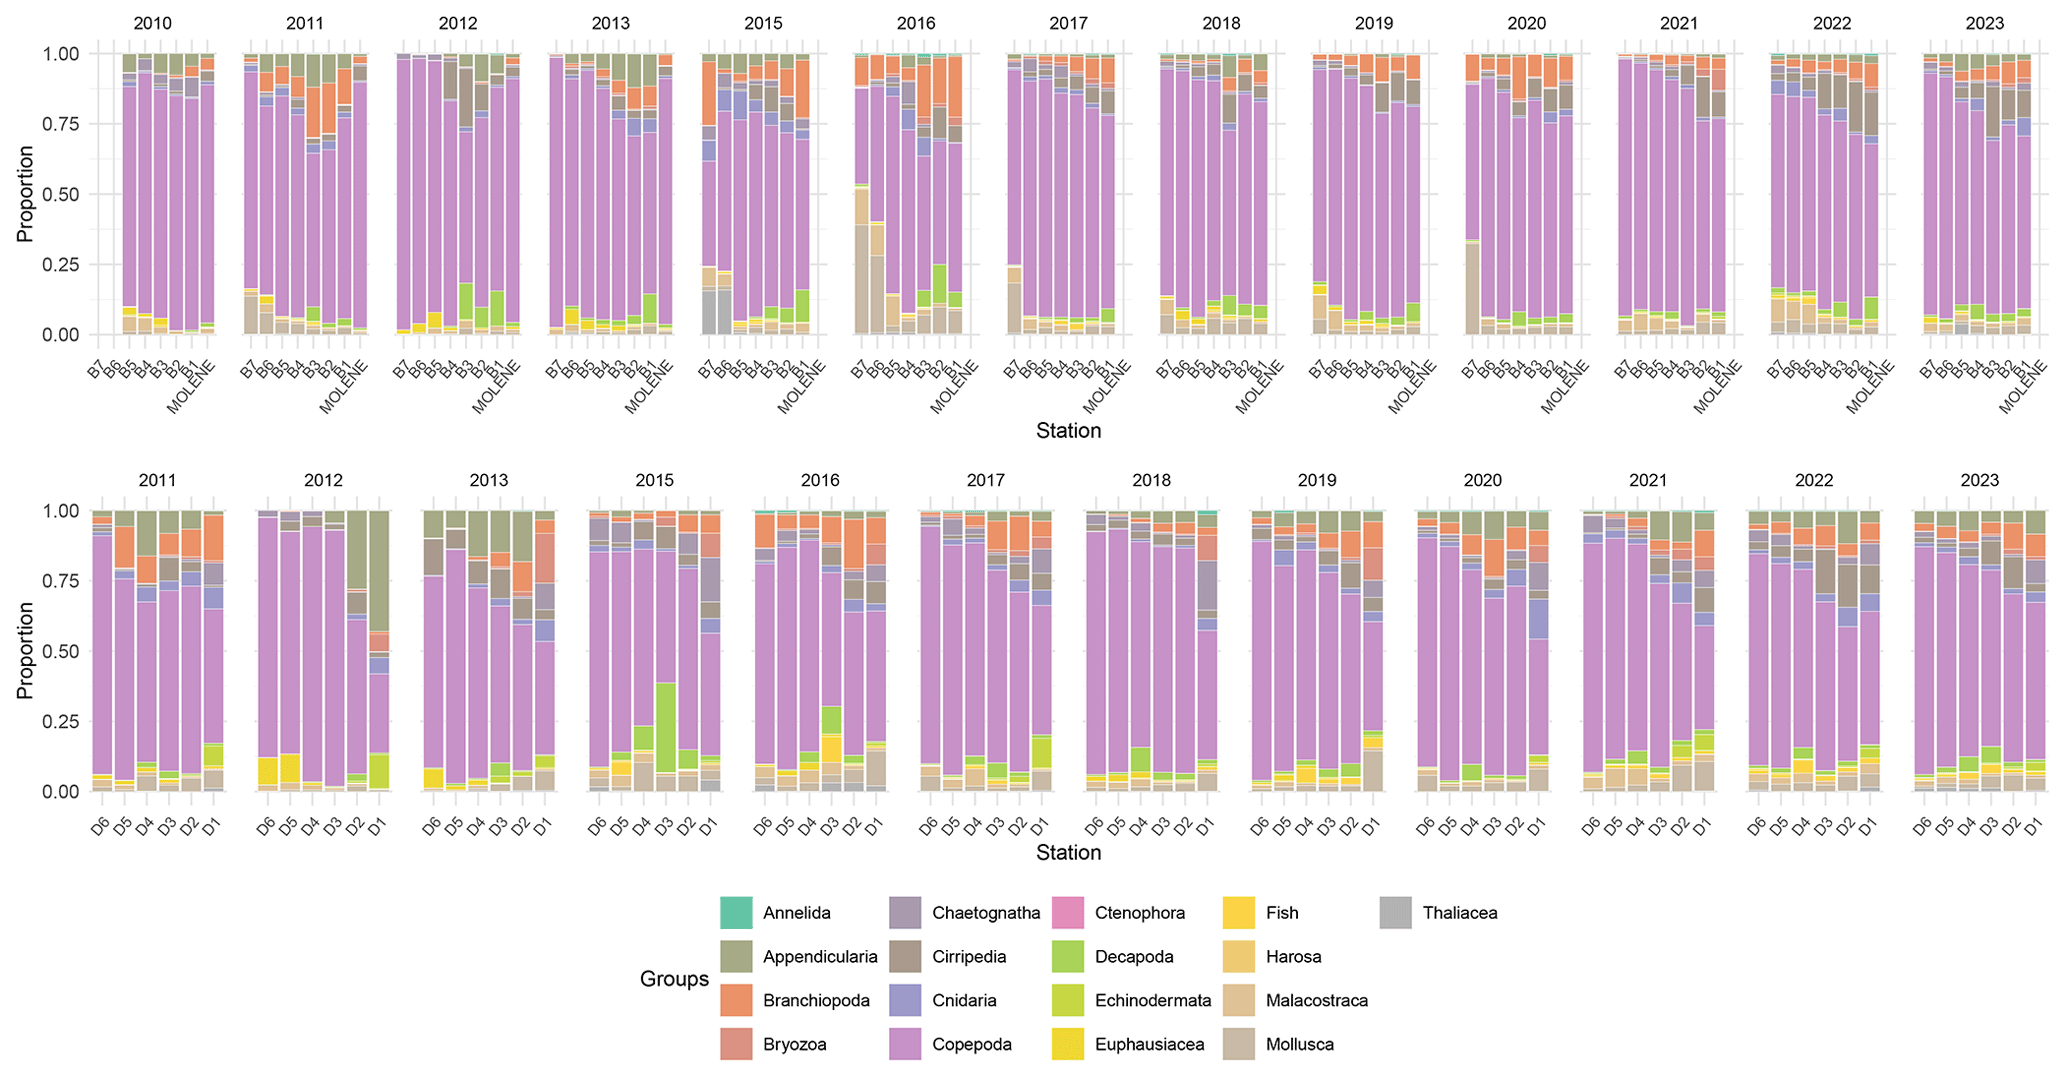
Figure 7Relative abundance (% of total individuals) of the 16 zooplankton taxonomic groups across two transects (B on top and D on the bottom) and at Molene coastal station from 2010 to 2023. Each stacked bar represents the community composition at a sampling station, with the proportion of each group calculated as the percentage of the total number of individuals counted at that station. Note that the Cumacea group was excluded as it contains only three images. The upper panel displays the B transect (B1–B7) and the Molène coastal station, while the lower panel shows the D transect (D1–D6). Each faunistical group is represented by a distinct color as shown in the legend.
The zooplankton community shows clear spatial gradients in dominant groups (Fig. 7). Copepoda and Branchiopoda exhibit a pronounced coastal–oceanic gradient, with higher proportions in coastal stations decreasing towards open-ocean stations. Conversely, Mollusca shows an inverse gradient with higher proportions at offshore stations compared to coastal areas. The southern transect (D) is characterized by notably higher proportions of Appendicularia compared to the northern transect. Overall, the community structure remains relatively consistent over the 13-year study period across both transects, suggesting a relatively stable ecosystem structure in the region.
Following the FAIR principle (Wilkinson et al., 2016), all code used for data processing and analysis is publicly accessible through our GitHub repository (https://github.com/neccton-algo/PNMI_data_paper, last access: 7 November 2025) and on Zenodo (https://doi.org/10.5281/zenodo.17408491).
The table containing abundances of phytoplankton and zooplankton as well as zooplankton biovolume are available in the SEANOE data portal: https://doi.org/10.17882/105465 (Drago et al., 2025). Individual zooplankton images are available to be viewed and explored on the Ecotaxa web application (Picheral et al., 2017, https://ecotaxa.obs-vlfr.fr/, last access: 11 February 2025; no registration needed). The references for the projects are available in Table S4.
Recent studies have shown significant changes in small pelagic fish communities across French waters, particularly regarding decreases in mean body size and condition (Menu et al., 2023; Queiros et al., 2019), highlighting the critical importance of long-term monitoring of plankton communities (Holland et al., 2025) which constitute their primary food resource (Brosset et al., 2016; Sommer et al., 2018).
The combined physical and biological data enable tracking ecosystem responses to environmental changes while providing baseline data for assessing ecosystem health in the Iroise Marine Natural Park. Beyond its ecological significance, this MPA and the Iroise Marine Natural Park hold particular importance for France's sardine fishery. The region, with Douarnenez as a historic sardine fishing hub, supports a significant portion of France's pelagic fisheries, particularly for purse seiners. This makes the long-term monitoring of plankton communities crucial not only for biodiversity conservation but also for preserving the economic and cultural heritage that led to its designation as France's first marine protected area.
While no comparable pluri-annual multi-station planktonic datasets exist within the Iroise Marine Natural Park, other French coastal monitoring programs (e.g., SOMLIT for chlorophyll a, Goberville et al., 2010; Savoye et al., 2024; REPHY for toxic phytoplankton, Chenouf et al., 2022) provide only limited single-point data lacking spatial coverage for meaningful comparison. Yet, several regional surveys offer potential for broader comparative analyses: the PELGAS survey (Bay of Biscay, 2006–2015), primarily focused on small pelagic fish, also provides phytoplankton data, vertically integrated chlorophyll a biomass (Doray et al., 2018), and microphytoplankton taxonomic composition (Houliez et al., 2021). For zooplankton, the same sampling and scanning methodology was used, providing vertically integrated mesozooplankton biomass (Doray et al., 2018), as well as the complete dataset (Grandremy et al., 2024). EVOHE surveys (Bay of Biscay, since 1987) provide autumn data on phytoplankton and microzooplankton taxonomy and abundance, as well as mesozooplankton taxonomy and size class biomass (see https://sextant.ifremer.fr/record/709a4b9f-557e-46cb-9af2-d1453b491f98/, last access: 10 September 2025). The PELTIC program (English Channel, Celtic Sea, and Bristol Channel, 2012–2023) could also provide comparative phytoplankton abundance data but is similarly limited seasonally (Cefas, 2024).
These comparisons underscore the importance and uniqueness of the comprehensive PNMI dataset presented here.
The consistent phytoplankton identification methodology throughout the 13-year time series (2010–2022) by two experienced taxonomists using the same taxonomic reference list ensures taxonomic continuity and reliability, providing a robust foundation for studying long-term changes in phytoplankton community structure. The high taxonomic resolution of this dataset (573 distinct phytoplankton taxa across multiple taxonomic levels) enables detailed analyses of phytoplankton community dynamics, biodiversity patterns, and responses to environmental gradients. Additionally, the use of a standardized protocol using the ZooScan imaging system for zooplankton imaging data enables detailed morphometric measurements and creates a standardized visual record, complementing other recently published planktonic datasets that employ various techniques such as microscopy (Acri et al., 2020; Devreker et al., 2024) and imaging instruments (Dugenne et al., 2024; Grandremy et al., 2024). Making such an imaging dataset openly available offers further opportunities for future functional-trait-based analyses of plankton dynamics (Litchman et al., 2015; Perhirin et al., 2023; Vilgrain et al., 2021). The plankton communities' descriptors that can be accessed and derived from this dataset (abundances and biovolumes for zooplankton) are proposed at multiple taxonomic levels and accessible through the EcoTaxa web platform (Picheral et al., 2017). These datasets contribute to global plankton monitoring efforts by combining traditional and modern approaches in a standardized format, supporting diverse ecological studies and modeling applications where zooplankton representation has traditionally been simplified usually through size discrimination (Everett et al., 2017). Publishing comprehensive long-term datasets combining phytoplankton, zooplankton, and environmental data in open-access formats demonstrates their scientific value to funding agencies and supports the continuation of costly but essential ecological monitoring programs. The integration of long-term monitoring and technological innovations strengthens our ability to understand and protect marine ecosystems while providing valuable insights for both immediate research needs and future applications.
The supplement related to this article is available online at https://doi.org/10.5194/essd-17-6583-2025-supplement.
Conceptualization and methodology: LD, CC, PP, SDA. Data curation and validation: LD, CC, BB, LJ, SDA. Formal analysis, investigation, visualization: LD, SDA. Funding acquisition: PP, SDA. Project administration and resources: CC, PP, SDA. Supervision: SDA. Writing – original draft: LD, SDA. Writing – review and editing: LD, CC, PP, BB, LJ, JBR, SDA.
The contact author has declared that none of the authors has any competing interests.
Publisher's note: Copernicus Publications remains neutral with regard to jurisdictional claims made in the text, published maps, institutional affiliations, or any other geographical representation in this paper. While Copernicus Publications makes every effort to include appropriate place names, the final responsibility lies with the authors. Views expressed in the text are those of the authors and do not necessarily reflect the views of the publisher.
The co-authors wish to thank French and European public taxpayers who fund their salaries. The authors thank the European Marine Biological Resource Centre (EMBRC) platform PIQv (Quantitative Imaging Platform of Villefranche-sur-Mer) for image analysis. This work was also supported by EMBRC France, whose French state funds are managed by the French National Research Agency within the Investments of the Future program under reference ANR-10-INBS-02. We extend our sincere gratitude to all field crew members of the OFB-PNMI who assisted with sample collection in sometimes very challenging weather conditions. We also thank Sylvain Coulon for his valuable contribution to phytoplankton identifications for coastal stations. We also thank Lars Stemmann from Sorbonne University for his help in convincing the OFB-PNMI that it was worth pursuing the plankton sampling during 2014 because of its interest for the scientific community. We also thank everyone who contributed to sample collection and data processing all along the years, making this dataset possible.
LD's post-doc is funded by Horizon Europe RIA under grant number 101081273 (NECCTON project). SDA acknowledges additional funding by the Institut Universitaire de France and by the French Agence Nationale de la Recherche (ANR) under grant ANR-22-CE02-0023-1 (project TRAITZOO). This research has been supported by the HORIZON EUROPE Research Infrastructures (grant no. 101081273), the Institut Universitaire de France (grant no. Chaire Junior, Médiation scientifique, 2023), and the Agence Nationale de la Recherche (grant no. ANR-22-CE02-0023-1).
This paper was edited by Davide Bonaldo and reviewed by two anonymous referees.
Acri, F., Bastianini, M., Bernardi Aubry, F., Camatti, E., Boldrin, A., Bergami, C., Cassin, D., De Lazzari, A., Finotto, S., Minelli, A., Oggioni, A., Pansera, M., Sarretta, A., Socal, G., and Pugnetti, A.: A long-term (1965–2015) ecological marine database from the LTER-Italy Northern Adriatic Sea site: plankton and oceanographic observations, Earth Syst. Sci. Data, 12, 215–230, https://doi.org/10.5194/essd-12-215-2020, 2020.
Ayata, S.-D., Lazure, P., and Thiébaut, É.: How does the connectivity between populations mediate range limits of marine invertebrates? A case study of larval dispersal between the Bay of Biscay and the English Channel (North-East Atlantic), Prog. Oceanogr., 87, 18–36, https://doi.org/10.1016/j.pocean.2010.09.022, 2010.
Batchelder, H. P., Mackas, D. L., and O'Brien, T. D.: Spatial–temporal scales of synchrony in marine zooplankton biomass and abundance patterns: A world-wide comparison, Prog. Oceanogr., 97–100, 15–30, https://doi.org/10.1016/j.pocean.2011.11.010, 2012.
Batten, S. D., Abu-Alhaija, R., Chiba, S., Edwards, M., Graham, G., Jyothibabu, R., Kitchener, J. A., Koubbi, P., McQuatters-Gollop, A., Muxagata, E., Ostle, C., Richardson, A. J., Robinson, K. V., Takahashi, K. T., Verheye, H. M., and Wilson, W.: A Global Plankton Diversity Monitoring Program, Front. Mar. Sci., 6, https://doi.org/10.3389/fmars.2019.00321, 2019.
Benedetti, F., Jalabert, L., Sourisseau, M., Becker, B., Cailliau, C., Desnos, C., Elineau, A., Irisson, J.-O., Lombard, F., Picheral, M., Stemmann, L., and Pouline, P.: The Seasonal and Inter-Annual Fluctuations of Plankton Abundance and Community Structure in a North Atlantic Marine Protected Area, Front. Mar. Sci., 6, 214, https://doi.org/10.3389/fmars.2019.00214, 2019.
Berline, L., Siokou-Frangou, I., Marasović, I., Vidjak, O., Fernández de Puelles, M. L., Mazzocchi, M. G., Assimakopoulou, G., Zervoudaki, S., Fonda-Umani, S., Conversi, A., Garcia-Comas, C., Ibanez, F., Gasparini, S., Stemmann, L., and Gorsky, G.: Intercomparison of six Mediterranean zooplankton time series, Prog. Oceanogr., 97–100, 76–91, https://doi.org/10.1016/j.pocean.2011.11.011, 2012.
Berthou, P., Masse, J., Duhamel, E., Begot, E., Laurans, M., Biseau, A., Pitel-Roudaut, M., Duhamel, E., Begot, E., Laurans, M., Biseau, A., and Pitel-Roudaut, M.: La pêcherie de bolinche dans le périmètre du parc naturel marin d'Iroise, Archimer, https://archimer.ifremer.fr/doc/00007/11811/ (last access: 10 September 2025), 2010.
Bolaños, L. M., Karp-Boss, L., Choi, C. J., Worden, A. Z., Graff, J. R., Haëntjens, N., Chase, A. P., Della Penna, A., Gaube, P., Morison, F., Menden-Deuer, S., Westberry, T. K., O'Malley, R. T., Boss, E., Behrenfeld, M. J., and Giovannoni, S. J.: Small phytoplankton dominate western North Atlantic biomass, ISME J., 14, 1663–1674, https://doi.org/10.1038/s41396-020-0636-0, 2020.
Brosset, P., Le Bourg, B., Costalago, D., Bănaru, D., Van Beveren, E., Bourdeix, J., Fromentin, J., Ménard, F., and Saraux, C.: Linking small pelagic dietary shifts with ecosystem changes in the Gulf of Lions, Mar. Ecol. Prog. Ser., 554, 157–171, https://doi.org/10.3354/meps11796, 2016.
Buitenhuis, E. T., Vogt, M., Moriarty, R., Bednaršek, N., Doney, S. C., Leblanc, K., Le Quéré, C., Luo, Y.-W., O'Brien, C., O'Brien, T., Peloquin, J., Schiebel, R., and Swan, C.: MAREDAT: towards a world atlas of MARine Ecosystem DATa, Earth Syst. Sci. Data, 5, 227–239, https://doi.org/10.5194/essd-5-227-2013, 2013.
Cadier, M., Sourisseau, M., Gorgues, T., Edwards, C. A., and Memery, L.: Assessing spatial and temporal variability of phytoplankton communities' composition in the Iroise Sea ecosystem (Brittany, France): A 3D modeling approach Part 2: Linking summer mesoscale distribution of phenotypic diversity to hydrodynamism, J. Mar. Syst., 169, 111–126, https://doi.org/10.1016/j.jmarsys.2017.01.004, 2017.
Cefas: Phytoplankton abundance data from pelagic surveys in the Celtic Seas and English Channel for autumn 2017 to 2023 (2), CEFAS: Centre for Environment Fisheries and Aquaculture Science, https://doi.org/10.14466/CEFASDATAHUB.156, 2024.
Chamberlain, S. and Vanhoorne, B.: worrms: World register of marine species (WoRMS), R package version 0.4.3, https://CRAN.R-project.org,package=worrms (last access: 7 November 2025), 2023.
Chavez, F. P., Bertrand, A., Guevara-Carrasco, R., Soler, P., and Csirke, J.: The northern Humboldt Current System: Brief history, present status and a view towards the future, Prog. Oceanogr., 79, 95–105, https://doi.org/10.1016/j.pocean.2008.10.012, 2008.
Chenouf, S., Merzereaud, M., Raux, P., and Pérez Agúndez, J. A.: Dataset for Estimated Closures of Scallop (Pecten maximus) Production Areas Due to Phycotoxin Contamination along the French Coasts of the Eastern English Channel, Data, 7, 103, https://doi.org/10.3390/data7080103, 2022.
Chevallier, C., Herbette, S., Marié, L., Le Borgne, P., Marsouin, A., Péré, S., Levier, B., and Reason, C.: Observations of the Ushant front displacements with MSG/SEVIRI derived sea surface temperature data, Remote Sens. Environ., 146, 3–10, https://doi.org/10.1016/j.rse.2013.07.038, 2014.
Cocquempot, L., Delacourt, C., Paillet, J., Riou, P., Aucan, J., Castelle, B., Charria, G., Claudet, J., Conan, P., Coppola, L., Hocdé, R., Planes, S., Raimbault, P., Savoye, N., Testut, L., and Vuillemin, R.: Coastal Ocean and Nearshore Observation: A French Case Study, Front. Mar. Sci., 6, 324, https://doi.org/10.3389/fmars.2019.00324, 2019.
Devreker, D., Wacquet, G., and Lefebvre, A.: A 45-year hydrological and planktonic time series in the South Bight of the North Sea, Earth Syst. Sci. Data, 17, 1173–1189, https://doi.org/10.5194/essd-17-1173-2025, 2025.
Doray, M., Petitgas, P., Romagnan, J. B., Huret, M., Duhamel, E., Dupuy, C., Spitz, J., Authier, M., Sanchez, F., Berger, L., Dorémus, G., Bourriau, P., Grellier, P., and Massé, J.: The PELGAS survey: Ship-based integrated monitoring of the Bay of Biscay pelagic ecosystem, Prog. Oceanogr., 166, 15–29, https://doi.org/10.1016/j.pocean.2017.09.015, 2018.
Drago, L., Panaïotis, T., Irisson, J.-O., Babin, M., Biard, T., Carlotti, F., Coppola, L., Guidi, L., Hauss, H., Karp-Boss, L., Lombard, F., McDonnell, A. M. P., Picheral, M., Rogge, A., Waite, A. M., Stemmann, L., and Kiko, R.: Global Distribution of Zooplankton Biomass Estimated by In Situ Imaging and Machine Learning, Front. Mar. Sci., 9, 894372, https://doi.org/10.3389/fmars.2022.894372, 2022.
Drago, L., Cailliau, C., Pouline, P., Beker, B., Jalabert, L., Romagnan, J.-B., and Ayata, S.-D.: Plankton and environmental monitoring dataset from the Iroise Marine Natural Park (NE Atlantic, 2010–2023), SEANOE, https://doi.org/10.17882/105465, 2025.
Dugenne, M., Corrales-Ugalde, M., Luo, J. Y., Kiko, R., O'Brien, T. D., Irisson, J.-O., Lombard, F., Stemmann, L., Stock, C., Anderson, C. R., Babin, M., Bhairy, N., Bonnet, S., Carlotti, F., Cornils, A., Crockford, E. T., Daniel, P., Desnos, C., Drago, L., Elineau, A., Fischer, A., Grandrémy, N., Grondin, P.-L., Guidi, L., Guieu, C., Hauss, H., Hayashi, K., Huggett, J. A., Jalabert, L., Karp-Boss, L., Kenitz, K. M., Kudela, R. M., Lescot, M., Marec, C., McDonnell, A., Mériguet, Z., Niehoff, B., Noyon, M., Panaïotis, T., Peacock, E., Picheral, M., Riquier, E., Roesler, C., Romagnan, J.-B., Sosik, H. M., Spencer, G., Taucher, J., Tilliette, C., and Vilain, M.: First release of the Pelagic Size Structure database: global datasets of marine size spectra obtained from plankton imaging devices, Earth Syst. Sci. Data, 16, 2971–2999, https://doi.org/10.5194/essd-16-2971-2024, 2024.
Duhamel, E., Laspougeas, C., and Fry, A.: Rapport final du programme d'embarquements à bord des bolincheurs travaillant dans le Parc naturel marin d'Iroise, Archimer, https://archimer.ifremer.fr/doc/00065/17593/ (last access: 10 September 2025), 2011.
Everett, J. D., Baird, M. E., Buchanan, P., Bulman, C., Davies, C., Downie, R., Griffiths, C., Heneghan, R., Kloser, R. J., Laiolo, L., Lara-Lopez, A., Lozano-Montes, H., Matear, R. J., McEnnulty, F., Robson, B., Rochester, W., Skerratt, J., Smith, J. A., Strzelecki, J., Suthers, I. M., Swadling, K. M., van Ruth, P., and Richardson, A. J.: Modeling What We Sample and Sampling What We Model: Challenges for Zooplankton Model Assessment, Front. Mar. Sci., 4, https://doi.org/10.3389/fmars.2017.00077, 2017.
Frederiksen, M., Edwards, M., Richardson, A. J., Halliday, N. C., and Wanless, S.: From plankton to top predators: bottom-up control of a marine food web across four trophic levels, J. Anim. Ecol., 75, 1259–1268, https://doi.org/10.1111/j.1365-2656.2006.01148.x, 2006.
Garrido, S., Ben-Hamadou, R., Oliveira, P., Cunha, M., Chícharo, M., and Van Der Lingen, C.: Diet and feeding intensity of sardine Sardina pilchardus: correlation with satellite-derived chlorophyll data, Mar. Ecol. Prog. Ser., 354, 245–256, https://doi.org/10.3354/meps07201, 2008.
Goberville, E., Beaugrand, G., Sautour, B., Tréguer, P., and Somlit, T.: Climate-driven changes in coastal marine systems of western Europe, Mar. Ecol. Prog. Ser., 408, 129–147, https://doi.org/10.3354/meps08564, 2010.
Gorsky, G., Ohman, M. D., Picheral, M., Gasparini, S., Stemmann, L., Romagnan, J.-B., Cawood, A., Pesant, S., Garcia-Comas, C., and Prejger, F.: Digital zooplankton image analysis using the ZooScan integrated system, J. Plankton Res., 32, 285–303, https://doi.org/10.1093/plankt/fbp124, 2010.
Grandremy, N., Bourriau, P., Daché, E., Danielou, M.-M., Doray, M., Dupuy, C., Forest, B., Jalabert, L., Huret, M., Le Mestre, S., Nowaczyk, A., Petitgas, P., Pineau, P., Rouxel, J., Tardivel, M., and Romagnan, J.-B.: Metazoan zooplankton in the Bay of Biscay: a 16-year record of individual sizes and abundances obtained using the ZooScan and ZooCAM imaging systems, Earth Syst. Sci. Data, 16, 1265–1282, https://doi.org/10.5194/essd-16-1265-2024, 2024.
Griffith, A. W. and Gobler, C. J.: Harmful algal blooms: A climate change co-stressor in marine and freshwater ecosystems, Harmful Algae, 91, 101590, https://doi.org/10.1016/j.hal.2019.03.008, 2020.
Grigoratou, M., Menden-Deuer, S., McQuatters-Gollop, A., Arhonditsis, G., Artigas, L. F., Ayata, S.-D., Bedikoğlu, D., Beisner, B. E., Chen, B., Davies, C., Diarra, L., Elegbeleye, O. W., Everett, J. D., Garcia, T. M., Gentleman, W. C., Gonçalves, R. J., Guy-Haim, T., Halfter, S., Hinners, J., Horaeb, R. R., Huggett, J. A., Johnson, C. L., Kavanaugh, M. T., Lara-Lopez, A., Lindemann, C., López-Abbate, C., Messié, M., Möller, K. O., Montes, E., Muller-Karger, F. E., Neeley, A., Olaleye, Y., Palacz, A. P., Poulton, A. J., Prowe, A. E. F., Ratnarajah, L., Rodríguez, L., Rodríguez-Flórez, C. N., Rodriquez-Santiago, A., Rousseaux, C. S., Saad, J. F., Santi, I., Soccodato, A., Stern, R., Våge, S., Varkitzi, I., and Richardson, A.: The immeasurable value of plankton to humanity, BioScience, biaf049, https://doi.org/10.1093/biosci/biaf049, 2025.
Hasle, G. R.: The inverted-microscope method, in: Phytoplankton Manual, edited by: Sournia, A., United Nations Educational, Scientific, and Cultural Organization, Paris, France, 88–96, ISBN 92-3-101572-9, 1978.
Holland, M. M., Artigas, L. F., Atkinson, A., Best, M., Bresnan, E., Devlin, M., Eerkes-Medrano, D., Johansen, M., Johns, D. G., Machairopoulou, M., Pitois, S., Scott, J., Schilder, J., Stern, R., Tait, K., Whyte, C., Widdicombe, C., and McQuatters-Gollop, A.: Mind the gap - The need to integrate novel plankton methods alongside ongoing long-term monitoring, Ocean Coast. Manag., 107542, https://doi.org/10.1016/j.ocecoaman.2025.107542, 2025.
Houliez, E., Lefebvre, S., Dessier, A., Huret, M., Marquis, E., Bréret, M., and Dupuy, C.: Spatio-temporal drivers of microphytoplankton community in the Bay of Biscay: Do species ecological niches matter?, Prog. Oceanogr., 194, 102558, https://doi.org/10.1016/j.pocean.2021.102558, 2021.
Ikeda, T.: Metabolic rates of epipelagic marine zooplankton as a function of body mass and temperature, Mar. Biol., 85, 1–11, 1985.
Irisson, J.-O., Ayata, S.-D., Lindsay, D. J., Karp-Boss, L., and Stemmann, L.: Machine Learning for the Study of Plankton and Marine Snow from Images, Annu. Rev. Mar. Sci., 14, https://doi.org/10.1146/annurev-marine-041921-013023, 2022.
Iversen, M. H.: Carbon Export in the Ocean: A Biologist's Perspective, Annu. Rev. Mar. Sci., 15, https://doi.org/10.1146/annurev-marine-032122-035153, 2023.
Jalabert, L., Elineau, A., Brandão, M., and Picheral, M.: Zooscan-Zooprocess user manual and procedures at the Quantitative Imaging Platform of Villefranche-sur-Mer (PIQv), Zenodo, https://doi.org/10.5281/zenodo.13949803, 2024.
Jonkers, L., Meilland, J., Rillo, M. C., de Garidel-Thoron, T., Kitchener, J. A., and Kucera, M.: Linking zooplankton time series to the fossil record, ICES J. Mar. Sci., 79, 917–924, https://doi.org/10.1093/icesjms/fsab123, 2022.
Kenitz, K. M., Orenstein, E. C., Roberts, P. L. D., Franks, P. J. S., Jaffe, J. S., Carter, M. L., and Barton, A. D.: Environmental drivers of population variability in colony-forming marine diatoms, Limnol. Oceanogr., 65, 2515–2528, https://doi.org/10.1002/lno.11468, 2020.
Kiørboe, T., Visser, A., and Andersen, K. H.: A trait-based approach to ocean ecology, ICES J. Mar. Sci., 75, 1849–1863, https://doi.org/10.1093/icesjms/fsy090, 2018.
Le Boyer, A., Cambon, G., Daniault, N., Herbette, S., Le Cann, B., Marié, L., and Morin, P.: Observations of the Ushant tidal front in September 2007, Cont. Shelf Res., 29, 1026–1037, https://doi.org/10.1016/j.csr.2008.12.020, 2009.
Le Floc'h, P., Alban, F., Merzéréaud, M., and Duhamel, E.: Identification des points de rupture dans la série longue des productions de sardine en France (1900–2017), Rev. Déconomie Ind., 49–78, https://doi.org/10.4000/rei.9023, 2020.
Lehodey, P., Alheit, J., Barange, M., Baumgartner, T., Beaugrand, G., Drinkwater, K., Fromentin, J.-M., Hare, S. R., Ottersen, G., Perry, R. I., Roy, C., van der Lingen, C. D., and Werner, F.: Climate Variability, Fish, and Fisheries, J. Climate, 19, 5009–5030, https://doi.org/10.1175/JCLI3898.1, 2006.
Litchman, E., Ohman, M. D., and Kiørboe, T.: Trait-based approaches to zooplankton communities, J. Plankton Res., 35, 473–484, https://doi.org/10.1093/plankt/fbt019, 2013.
Litchman, E., de Tezanos Pinto, P., Edwards, K. F., Klausmeier, C. A., Kremer, C. T., and Thomas, M. K.: Global biogeochemical impacts of phytoplankton: a trait-based perspective, J. Ecol., 103, 1384–1396, https://doi.org/10.1111/1365-2745.12438, 2015.
Lund, J. W. G., Kipling, C., and Le Cren, E. D.: The inverted microscope method of estimating algal numbers and the statistical basis of estimations by counting, Hydrobiologia, 11, 143–170, https://doi.org/10.1007/BF00007865, 1958.
Martini, S., Larras, F., Boyé, A., Faure, E., Aberle, N., Archambault, P., Bacouillard, L., Beisner, B. E., Bittner, L., Castella, E., Danger, M., Gauthier, O., Karp-Boss, L., Lombard, F., Maps, F., Stemmann, L., Thiébaut, E., Usseglio-Polatera, P., Vogt, M., Laviale, M., and Ayata, S.-D.: Functional trait-based approaches as a common framework for aquatic ecologists, Limnol. Oceanogr., 66, 965–994, https://doi.org/10.1002/lno.11655, 2021.
Menu, C., Pecquerie, L., Bacher, C., Doray, M., Hattab, T., Van Der Kooij, J., and Huret, M.: Testing the bottom-up hypothesis for the decline in size of anchovy and sardine across European waters through a bioenergetic modeling approach, Prog. Oceanogr., 210, 102943, https://doi.org/10.1016/j.pocean.2022.102943, 2023.
Miloslavich, P., Bax, N. J., Simmons, S. E., Klein, E., Appeltans, W., Aburto-Oropeza, O., Andersen Garcia, M., Batten, S. D., Benedetti-Cecchi, L., Checkley, D. M., Chiba, S., Duffy, J. E., Dunn, D. C., Fischer, A., Gunn, J., Kudela, R., Marsac, F., Muller-Karger, F. E., Obura, D., and Shin, Y.-J.: Essential ocean variables for global sustained observations of biodiversity and ecosystem changes, Glob. Change Biol., 24, 2416–2433, https://doi.org/10.1111/gcb.14108, 2018.
Motoda, S.: Devices of Simple Plankton Apparatus, Mem. Fac. Fish. Hokkaido Univ., 1959.
Orenstein, E. C., Ayata, S., Maps, F., Becker, É. C., Benedetti, F., Biard, T., De Garidel-Thoron, T., Ellen, J. S., Ferrario, F., Giering, S. L. C., Guy-Haim, T., Hoebeke, L., Iversen, M. H., Kiørboe, T., Lalonde, J., Lana, A., Laviale, M., Lombard, F., Lorimer, T., Martini, S., Meyer, A., Möller, K. O., Niehoff, B., Ohman, M. D., Pradalier, C., Romagnan, J., Schröder, S., Sonnet, V., Sosik, H. M., Stemmann, L. S., Stock, M., Terbiyik-Kurt, T., Valcárcel-Pérez, N., Vilgrain, L., Wacquet, G., Waite, A. M., and Irisson, J.: Machine learning techniques to characterize functional traits of plankton from image data, Limnol. Oceanogr., 67, 1647–1669, https://doi.org/10.1002/lno.12101, 2022.
Panaïotis, T., Babin, M., Biard, T., Carlotti, F., Coppola, L., Guidi, L., Hauss, H., Karp-Boss, L., Kiko, R., Lombard, F., McDonnell, A. M. P., Picheral, M., Rogge, A., Waite, A. M., Stemmann, L., and Irisson, J.: Three major mesoplanktonic communities resolved by in situ imaging in the upper 500 m of the global ocean, Glob. Ecol. Biogeogr., geb.13741, https://doi.org/10.1111/geb.13741, 2023.
Pante, E., Simon-Bouhet, B., and Irisson, J.-O.: marmap: Import, Plot and Analyze Bathymetric and Topographic Data, R package version 1.0.10, https://CRAN.R-project.org/package=marmap (last access: 7 November 2025), 2023.
Perhirin, M., Gossner, H., Godfrey, J., Johnson, R., Blanco-Bercial, L., and Ayata, S.: Morphological and taxonomic diversity of mesozooplankton is an important driver of carbon export fluxes in the ocean, Mol. Ecol. Resour., 24, e13907, https://doi.org/10.1111/1755-0998.13907, 2023.
Picheral, M., Colin, S., and Irisson, J.-O.: EcoTaxa, a tool for the taxonomic classification of images, https://ecotaxa.obs-vlfr.fr/ (last access: 11 February 2025), 2017.
Pingree, R. D., Pugh, P. R., Holligan, P. M., and Forster, G. R.: Summer phytoplankton blooms and red tides along tidal fronts in the approaches to the English Channel, Nature, 258, 672–677, https://doi.org/10.1038/258672a0, 1975.
Pitois, S. and Yebra, L.: Contribution of marine zooplankton time series to the United Nations Decade of Ocean Science for Sustainable Development, ICES J. Mar. Sci., 79, 722–726, https://doi.org/10.1093/icesjms/fsac048, 2022.
Queiros, Q., Fromentin, J.-M., Gasset, E., Dutto, G., Huiban, C., Metral, L., Leclerc, L., Schull, Q., McKenzie, D. J., and Saraux, C.: Food in the Sea: Size Also Matters for Pelagic Fish, Front. Mar. Sci., 6, 385, https://doi.org/10.3389/fmars.2019.00385, 2019.
Ramond, P., Siano, R., Schmitt, S., De Vargas, C., Marié, L., Memery, L., and Sourisseau, M.: Phytoplankton taxonomic and functional diversity patterns across a coastal tidal front, Sci. Rep., 11, 2682, https://doi.org/10.1038/s41598-021-82071-0, 2021.
Savoye, N., Lizon, F., Breton, E., Claquin, P., Joly, O., Sultan, E., Bozec, Y., Jung, J.-L., Boulard, C., Rimmelin-Maury, P., Leynart, A., Agogué, H., Pineau, P., del Amo, Y., Conan, P., Mostajir, B., Grégori, G., Mousseau, L., and Fabrice, M.: SOMLIT (Service d'Observation en Milieu Littoral) time series (French Research Infrastructure ILICO): long-term core parameter monitoring of French coasts, SEANOE, https://doi.org/10.17882/100323, 2024.
Schultes, S., Sourisseau, M., Le Masson, E., Lunven, M., and Marié, L.: Influence of physical forcing on mesozooplankton communities at the Ushant tidal front, J. Mar. Syst., 109–110, S191–S202, https://doi.org/10.1016/j.jmarsys.2011.11.025, 2013.
Siegel, D. A., DeVries, T., Cetinić, I., and Bisson, K. M.: Quantifying the Ocean's Biological Pump and Its Carbon Cycle Impacts on Global Scales, Annu. Rev. Mar. Sci., 15, annurev-marine-040722-115226, https://doi.org/10.1146/annurev-marine-040722-115226, 2023.
Sommer, U., Charalampous, E., Scotti, M., and Moustaka-Gouni, M.: Big fish eat small fish: implications for food chain length?, Community Ecol., 19, 107–115, https://doi.org/10.1556/168.2018.19.2.2, 2018.
Sonnet, V., Guidi, L., Mouw, C. B., Puggioni, G., and Ayata, S.-D.: Length, width, shape regularity, and chain structure: time series analysis of phytoplankton morphology from imagery, Limnol. Oceanogr., 67, 1850–1864, https://doi.org/10.1002/lno.12171, 2022.
Steinberg and Landry, M. R.: Zooplankton and the Ocean Carbon Cycle, Annu. Rev. Mar. Sci., 9, 413–444, https://doi.org/10.1146/annurev-marine-010814-015924, 2017.
Suthers, I., Rissik, D., and Richardson, A.: Plankton: A Guide to Their Ecology and Monitoring for Water Quality, Csiro Publishing, ISBN 978-1-4863-0880-4, 248 pp., 2019.
Titocci, J., Pata, P. R., Durazzano, T., Ayata, S.-D., Clerc, C., Cornils, A., Duffy, P., Greer, A. T., Halsband, C., Heneghan, R. F., Lacoursière-Roussel, A., Lombard, F., Majaneva, S., Pakhomov, E. A., Reis, C., Rist, S., Rommel, A. C. M., Silva, T., Stemmann, L., Ugwu, K., Basset, A., Rosati, I., Murphy, K. J., and Hunt, B. P. V.: Pathways for converting zooplankton traits to ecological insights are paved with findable, accessible, interoperable, and reusable (FAIR) data practices, ICES J. Mar. Sci., 82, fsaf017, https://doi.org/10.1093/icesjms/fsaf017, 2025.
van der Lingen, C., Hutchings, L., and Field, J.: Comparative trophodynamics of anchovy Engraulis encrasicolus and sardine Sardinops sagax in the southern Benguela: are species alternations between small pelagic fish trophodynamically mediated?, Afr. J. Mar. Sci., 28, 465–477, https://doi.org/10.2989/18142320609504199, 2006.
Vandromme, P., Stemmann, L., Garcìa-Comas, C., Berline, L., Sun, X., and Gorsky, G.: Assessing biases in computing size spectra of automatically classified zooplankton from imaging systems: A case study with the ZooScan integrated system, Methods Oceanogr., 1–2, 3–21, https://doi.org/10.1016/j.mio.2012.06.001, 2012.
Vilgrain, L., Maps, F., Picheral, M., Babin, M., Aubry, C., Irisson, J., and Ayata, S.: Trait-based approach using in situ copepod images reveals contrasting ecological patterns across an Arctic ice melt zone, Limnol. Oceanogr., 66, 1155–1167, https://doi.org/10.1002/lno.11672, 2021.
Wilkinson, M. D., Dumontier, M., Aalbersberg, Ij. J., Appleton, G., Axton, M., Baak, A., Blomberg, N., Boiten, J.-W., Da Silva Santos, L. B., Bourne, P. E., Bouwman, J., Brookes, A. J., Clark, T., Crosas, M., Dillo, I., Dumon, O., Edmunds, S., Evelo, C. T., Finkers, R., Gonzalez-Beltran, A., Gray, A. J. G., Groth, P., Goble, C., Grethe, J. S., Heringa, J., 'T Hoen, P. A. C., Hooft, R., Kuhn, T., Kok, R., Kok, J., Lusher, S. J., Martone, M. E., Mons, A., Packer, A. L., Persson, B., Rocca-Serra, P., Roos, M., Van Schaik, R., Sansone, S.-A., Schultes, E., Sengstag, T., Slater, T., Strawn, G., Swertz, M. A., Thompson, M., Van Der Lei, J., Van Mulligen, E., Velterop, J., Waagmeester, A., Wittenburg, P., Wolstencroft, K., Zhao, J., and Mons, B.: The FAIR Guiding Principles for scientific data management and stewardship, Sci. Data, 3, 160018, https://doi.org/10.1038/sdata.2016.18, 2016.
WoRMS Editorial Board: WoRMS World Register of Marine Species, Integrated Marine Information System (IMIS), https://doi.org/10.14284/170, 2025.