the Creative Commons Attribution 4.0 License.
the Creative Commons Attribution 4.0 License.
 | 26 Nov 2025
Tracking vegetation phenology across diverse biomes using Version 3.0 of the PhenoCam Dataset
Adam M. Young
Thomas Milliman
Koen Hufkens
Keith L. Ballou
Christopher Coffey
Kai Begay
Michael Fell
Mostafa Javadian
Alison K. Post
Christina Schädel
Zakary Vladich
Oscar Zimmerman
Dawn M. Browning
Christopher R. Florian
Minkyu Moon
Michael D. SanClements
Bijan Seyednasrollah
Mark A. Friedl
Andrew D. Richardson
Vegetation phenology plays a significant role in driving seasonal patterns in land-atmosphere interactions and ecosystem productivity, and is a key factor to consider when modeling or investigating ecological and land-surface dynamics. To integrate phenology in ecological research ultimately requires the application of carefully curated and quality controlled phenological datasets that span multiple years and include a wide range of different ecosystems and plant functional types. By using digital cameras to record images of plant canopies every 30 min, pixel-level information from the visible red-green-blue color channels can be quantified to evaluate canopy greenness (defined as the green chromatic coordinate, GCC), and how it varies in space and time. These phenological cameras (i.e., “PhenoCams”) offer a pragmatic and effective way to measure and provide phenology data for both research and education. Here, in this dataset descriptor, we present the PhenoCam dataset version 3 (V3.0), providing significant updates relative to prior releases. PhenoCam V3.0 includes 738 unique sites and a total of 4805.5 site years, a 170 % increase relative to PhenoCam V2.0 (1783 site years), with notable expansion of network coverage for evergreen broadleaf forests, understory vegetation, grasslands, wetlands, and agricultural systems. Furthermore, in this updated release, we now include a PhenoCam-based estimate of the normalized difference vegetation index (cameraNDVI), calculated from back-to-back visible and visible+near-infrared images acquired from approximately 75 % of cameras in the network, which utilize a sliding infrared cut filter. Both GCC and cameraNDVI showed similar, but somewhat unique, patterns in canopy greenness and VIS vs. NIR reflectance, across various ecosystems, indicating their consistent ability to record phenological variability. However, we did find that at most sites, GCC time series had less variability and fewer outliers, representing a smoother signal of canopy greenness and phenology. Overall, PhenoCam greenness as measured by both GCC and cameraNDVI provides expanded opportunities for studying phenology and tracking ecological changes, with potential applications to the evaluation of satellite data products, earth system and ecosystem modeling, and understanding phenologically mediated ecosystem processes. The PhenoCam V3.0 data release is publicly available for download from the Oak Ridge National Lab Distributed Active Archive Center: the source imagery used to derive phenology information is available at https://doi.org/10.3334/ORNLDAAC/2364 (Ballou et al., 2025), and the summarized phenology data are available at https://doi.org/10.3334/ORNLDAAC/2389 (Zimmerman et al., 2025).
- Article
(13218 KB) - Full-text XML
-
Supplement
(5424 KB) - BibTeX
- EndNote


The study of vegetation phenology aims to describe and understand the drivers and impacts of reoccurring, seasonal changes in plant growth in terrestrial ecosystems, including periods such as budburst and leaf emergence, fall senescence, and dormancy (Lieth and Radford, 1971; Richardson et al., 2013). Vegetation phenology (hereafter referred to as phenology) is sensitive to variability in temperature and precipitation (Jolly et al., 2005; Rosenzweig et al., 2007; Hufkens et al., 2016; Post et al., 2022), and serves as an indicator of environmental trends (Schwartz, 1998; Peñuelas et al., 2002). Phenology also exerts direct influence over dynamics linking the biosphere and atmosphere. For example, inter-annual variation in net ecosystem production is tied to shifts in the timing of green-up and leaf emergence across a range of spatial scales; in North America, warmer temperatures in 2012 resulted in relatively early spring green-up of deciduous forests, and notable increases in annual net ecosystem production for the Eastern US (Wolf et al., 2016). Surface-to-atmosphere latent and sensible heat fluxes are also influenced by phenology, for example, by altering aerodynamic resistance to sensible heat fluxes through changes in land-surface roughness or by influencing evapotranspiration due to timing of seasonal changes in stomatal conductance (Blanken and Black, 2004; Young et al., 2021). Recent Earth-system modeling experiments have also demonstrated how phenology influences land-atmosphere coupling (Li et al., 2024) and boundary layer height (Li et al., 2023). Understanding the role and drivers of phenology in different ecosystems is important for anticipating future terrestrial ecosystem dynamics that require validated, generalizable phenology modules to be integrated with land-surface and Earth-system models. While current phenology routines have continued to be improved upon (e.g., Hufkens et al., 2018; Post et al., 2022; Schädel et al., 2023), most models are still unable to capture the full range of variability in phenology patterns observed across a wide range of ecoclimatic conditions (Li et al., 2022). Continued diagnosis and improvement of phenology models will depend on multi-year records and data products covering broad regional-to-continental spatial scales of phenology.
Multiple approaches and published data products are currently available for studying phenology. At the global scale, satellite-based remote sensing provides a multi-decadal record of vegetation seasonality, but at coarse spatial resolution. The most widely used metric derived from remote sensing reflectance measurements is the Normalized Difference Vegetation Index (NDVI). NDVI is defined as the normalized differences between reflectance values from both visible red (R) and near-infrared wavelengths (NIR),
NDVI can be broadly related to vegetation health; during photosynthesis, leaf chlorophyll pigments absorb radiation in the spectrum of visible light, while reflecting radiation in the NIR (Waring and Running, 2007). Time series of NDVI can be used to clearly depict seasonal changes in vegetation activity, and these time series can be further used to identify and extract phenological transition dates based on the seasonal amplitude of greenness. For example, in deciduous broadleaf forests, the timing of leaf development and senescence can be estimated when NDVI reaches 50 % of the total seasonal amplitude. Products derived from such remote sensing data have been invaluable in advancing our understanding of the role of phenology in many ecosystems (e.g., Stöckli and Vidale, 2004; Zhang et al., 2013; Jeong et al., 2011). While satellite data enable global monitoring of phenology, the relatively coarse spatial resolution of most platforms (e.g., 500 m for MODIS) means individual pixels may contain multiple species, plant functional types, or land-cover types. Furthermore, the temporal resolution of image acquisition and the multi-day compositing period of many platforms (e.g., 8 and 16 d for MODIS) result in additional uncertainties, because many phenological transitions can occur within the span of a week (Klosterman et al., 2014). Additionally, extensive cloud cover – particularly for multiple days or weeks – obscures and reduces the ability of satellites to detect changes in vegetation, indicating the ability of near-surface remote sensing methods to provide time series with fewer gaps (Tran et al., 2022). More recently, satellite products at a higher spatial and temporal resolution have become available (e.g., Moon et al., 2021), but there remains a tradeoff with the shorter duration of these new data records.
The development and implementation of near-surface remote sensing using digital cameras offers a method for complementing satellite studies of vegetation phenology. This approach – commonly referred to as PhenoCam (i.e., “Phenological Camera”) – uses repeat digital imagery from cameras positioned to overlook ecosystem canopies. Individual cameras are usually programmed to take multiple images per day (e.g., every 15–30 min) (Richardson et al., 2018b). From digital imagery, digital numbers (DN) from the visible red (R), green (G), and blue (B) color channels (i.e., RGB) can be extracted for each pixel. By delineating a region of interest (ROI) in the camera field-of-view that directly focuses on the canopy (or other vegetation of interest), information on vegetation greenness is obtained using a metric of relative greenness called the green-chromatic coordinate (GCC),
Time series summaries of GCC – such as 1 or 3 d time steps – provide information on how vegetation greenness changes at a relatively fine temporal scale relative to most satellite-based remote sensing. The PhenoCam approach therefore directly enhances phenology data derived from satellites: PhenoCams provide phenology data at finer spatial (leaf-to-branch) and temporal (daily) resolution than is usually possible with satellite-based measures, although satellite sensors can provide much broader spatial coverage (continental-to-global). Previous studies have made extensive use of PhenoCam data to evaluate satellite phenological data products from MODIS (Klosterman et al., 2014; Richardson et al., 2018a; Liu et al., 2017), Landsat (Yan et al., 2019; Melaas et al., 2016), Harmonized Landsat Sentinel-2 (HLS, Bolton et al., 2020), PlanetScope (Moon et al., 2021), SPOT-VGT and PROBA-V (Bórnez et al., 2020), VIIRS (Zhang et al., 2018), MERIS (Brown et al., 2017), and GOES (Wheeler and Dietze, 2021).
The PhenoCam Network (https://phenocam.nau.edu, last access: 19 November 2025) is one of the largest public repositories of phenological digital camera imagery and derived data products (Richardson, 2023). The majority of sites within the PhenoCam network are located in North America, follow a standardized protocol, and use common hardware (StarDot NetCam SC) that has been vetted (Sonnentag et al., 2012; Brown et al., 2016; Richardson, 2023). To ensure network continuity following the discontinuation of the original camera, the StarDot NetCam Live 2 was selected as its successor, with studies confirming its comparable performance for phenological monitoring (Javadian et al., 2025). The complementary metal-oxide-semiconductor (CMOS) imaging sensor within these cameras is sensitive to NIR wavelengths, and the cut filter used to block wavelengths ≥ 700 nm for standard visible-wavelength (RGB) imagery is software controlled: with the filter removed, the camera records an RGB+NIR image (Petach et al., 2014). The original intent of this design was to enhance photon capture under low-light conditions and to permit nighttime security monitoring with an infrared illuminator. However, it has also been shown to offer the potential for the camera to serve as a four-channel imager (red, green, blue, and NIR), enabling calculation of a “camera NDVI” from digital numbers and exposure values (Petach et al., 2014) that is similar to the standard NDVI metric calculated using reflectance values from satellite imagery (Eq. 1). To date, the implementation and use of camera NDVI from PhenoCams (hereafter referred to as cameraNDVI) has received only minor attention (e.g., Filippa et al., 2018).
In this data descriptor, we introduce the PhenoCam V3.0 public data release, which provides a substantial update to the V2.0 release (Seyednasrollah et al., 2019), with a 170 % increase in total site-years and a better representation of understory ecosystems, evergreen broadleaf forests, grasslands, wetlands, and agriculture systems, in particular. In this descriptor for the V3.0 dataset, we detail how the PhenoCam Network has grown in terms of spatial and temporal coverage, while also evaluating the representation of the Network across ecoregions and biomes, at both continental and global levels. Furthermore, two new operational data records are introduced to enhance the usefulness of this dataset. First, the dataset now includes cameraNDVI (Data Record 6) for all sites with the requisite hardware and camera configuration. We evaluate this cameraNDVI product in a detailed comparison using PhenoCam imagery and NDVI estimates derived from broadband measurements of incident and upwelling solar radiation (i.e., broadbandNDVI) (Huemmrich et al., 1999; Jenkins et al., 2007). We conduct this evaluation using broadband data from National Ecological Observatory Network (NEON; https://www.neonscience.org, last access: 19 November 2025; Metzger et al., 2019), spanning a broad range of ecosystems, from Arctic tundra to tropical forests. Second, we now also include a reduced set of simplified data products containing just three columns: date, mean measured GCC at a daily time step, and a smoothed GCC product that can be used for interpolation or gap filling (Data Record 7). For many users, the simplified data will be much easier to work with than the 1 and 3 d summary products contained in Data Record 4, which are almost 50 columns wide. For users who wish to access additional information, such as metadata or uncertainty estimates, these can be found in Data Records 3, 4 and 5.
While it is well established that PhenoCams are a powerful tool to monitor trends in phenology, other potential applications of PhenoCam data include: (1) evaluation of satellite data products; (2) calibration and validation of phenological models for different vegetation types; and (3) ecological interpretation of other data streams, including eddy covariance data for surface-atmosphere CO2, H2O, and sensible-heat fluxes.
The data described here have been archived with the ORNL DAAC (Zimmerman et al., 2025) and are also accessible through the PhenoCam Explorer web page (https://phenocam.nau.edu/phenocam_explorer, last access: 19 November 2025). The data records have been truncated at the end of 2023, but data records from active cameras continue to be updated nightly, and are publicly available as provisional (i.e., un-curated) data through the PhenoCam project web page (https://phenocam.nau.edu, last access: 19 November 2025). A companion data set (Ballou et al., 2025), which contains the imagery from which these data are derived, is also being released at the same time, and it may be useful for computer vision, machine learning, or deep learning analyses (e.g., Taylor and Browning, 2022; Cao et al., 2021). See Sect. 2.5 for additional details on data access and Sect. 5 for our Data Availability statement.
The details of camera installation and configuration protocols, site classification, and image and data processing routines have been previously documented in detail by Richardson et al. (2018b) and Seyednasrollah et al. (2019). We provide only a brief summary here, as the underlying methods and data processing code remain unchanged.
2.1 Overview of PhenoCam
Each PhenoCam camera is classified into one of three types: Type I, Type II or Type III. Type I cameras follow a standardized protocol, and site personnel are actively engaged as PhenoCam collaborators (e.g., providing camera maintenance and troubleshooting as required). For Type II cameras, there is some deviation from the standard protocol, but site personnel are still actively engaged. For Type III cameras, there is some deviation from the standard protocol, and no active collaboration of personnel on-site. Because the standard protocol has been widely embraced by PhenoCam network collaborators (as of 12 December 2024, 836 of 977 cameras with data in the archive, or almost 86 %, are classified as Type I), and because of the generally lower data quality from Type III cameras (e.g., issues with white balance, field of view shifts, and interrupted continuity), recent data curation efforts have focused on Type I cameras, and have been discontinued for Type III cameras.
All cameras in the PhenoCam network record three-layer JPEG images, from which we extract information about the mean intensity of each of the red, green, and blue (RGB) color channels, calculated across a user-defined region of interest (ROI), as described in the Introduction (Section 1; e.g., Eq. 2). The ROI is delineated to correspond to the vegetation under study (Sonnentag et al., 2012; Richardson et al., 2018b). While a single image per day would be generally sufficient to document phenological changes in most ecosystems, it is typical for cameras in the PhenoCam network to upload an image every 15 or 30 min. This ensures high quality data by minimizing data discontinuity in cases of unfavorable weather (rain or snow), adverse illumination conditions (clouds or aerosols), or short-term power outages. Following previously developed methods (Sonnentag et al., 2012), we use statistics calculated from the sub-daily GCC time-series to generate 1 and 3 d “summary product” GCC time-series, which have been found to be effective at filtering out noisy color output due to adverse conditions that may occur (Sonnentag et al., 2012). From these summary time series products, we estimate phenological transition dates corresponding to the start of each “greenness rising” (e.g., budburst) and “greenness falling” phenological phase (e.g., senescence). Uncertainties are quantified and provided for all GCC time series and transition date estimates.
2.2 NDVI derived from infrared PhenoCam imagery
Motivation and proof-of-concept for cameraNDVI, as well as details on the calculations, can be found in Petach et al. (2014). In brief, cameraNDVI is calculated using data extracted from the same ROI in back-to-back (30 s apart) RGB and RGB+NIR images. Accounting for exposure differences between the two images, it is then possible to estimate the NIR contribution to the RGB+NIR image by subtracting off the estimated RGB component
Where primes (′) denote exposure-adjusted DN values, with NIR and then used in Eq. (1) in place of reflectances to obtain cameraNDVI. We describe some important distinctions between cameraNDVI and NDVI estimated from other platforms (e.g., satellite remote sensing, or tower-mounted radiometric instruments) in the Discussion (Sect. 4). Additionally, there is no outlier detection mechanism implemented for cameraNDVI, given challenges with the higher variance of this data product (see Sect. 3.2). This remains an ongoing area of research and development that will be implemented when available.
2.3 Comparisons among cameraNDVI, GCC, and tower broadband NDVI
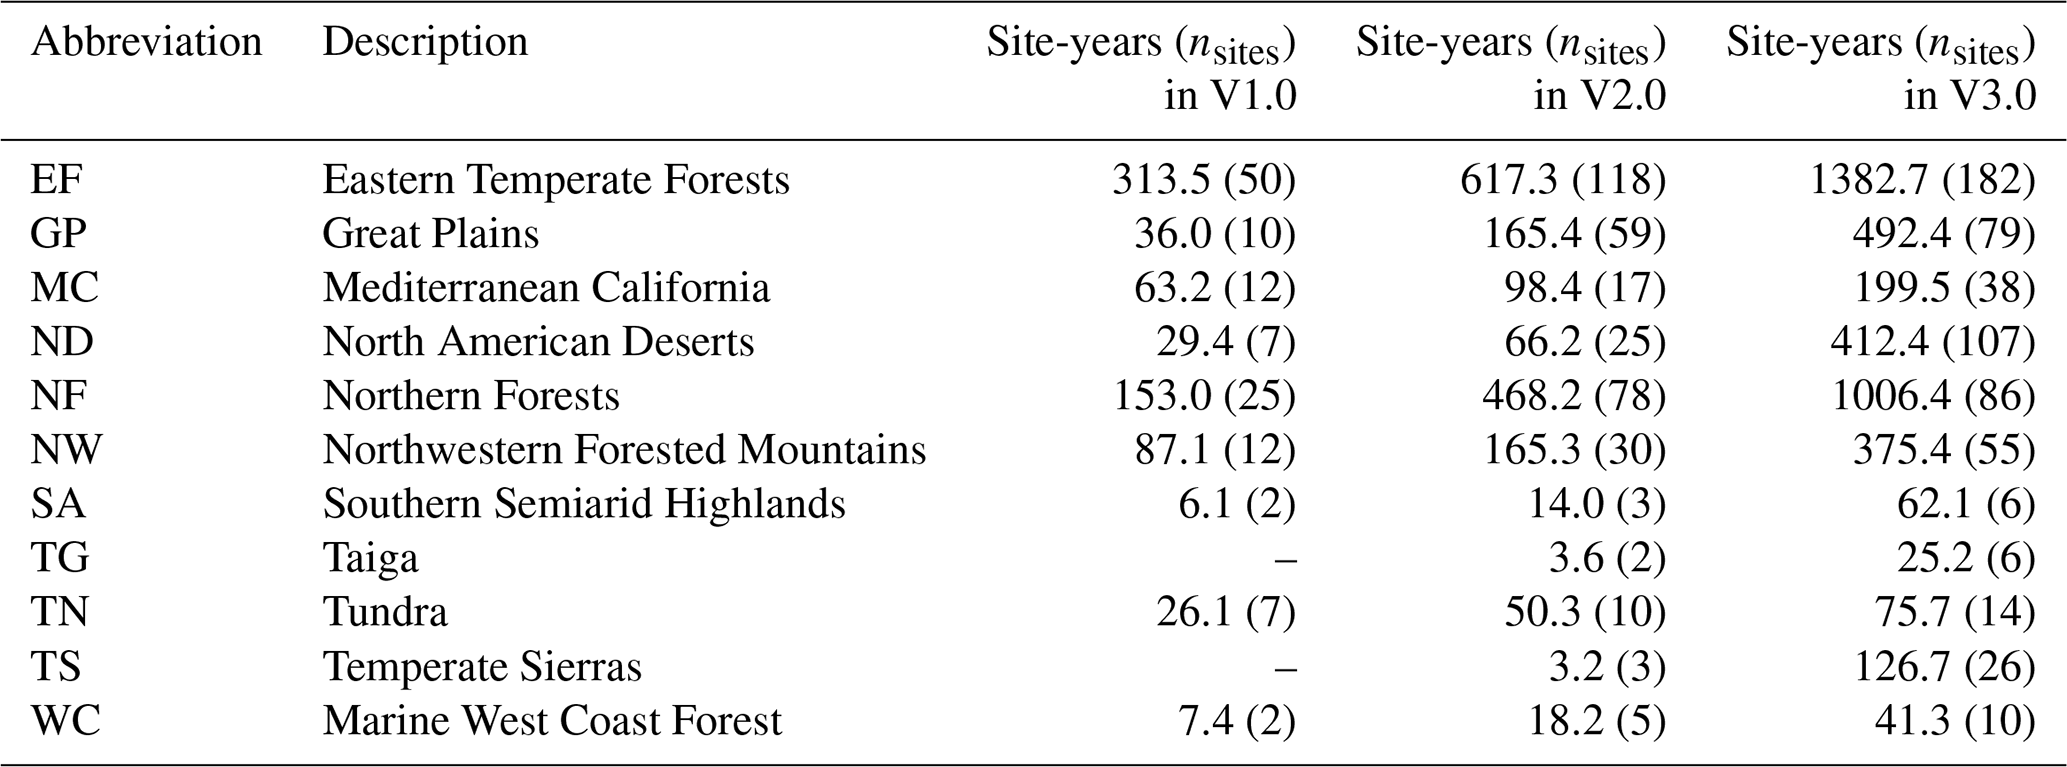
To investigate how well time series of cameraNDVI agree with other estimates of plant phenology, we compared cameraNDVI to both GCC (Eq. 2) and tower-measured broadbandNDVI (Jenkins et al., 2007). First, to compare cameraNDVI and GCC, we began with visual comparisons between a sample set of time series to evaluate overall coherence, subsequently calculating and comparing the signal-to-noise ratio (SNR) for cameraNDVI and GCC at all sites. Specifically, the signal of a given time series (i.e., either GCC or cameraNDVI) is characterized using the same smoothing spline approach used to derive seasonal transition dates (Richardson et al., 2018b; Seyednasrollah et al., 2019), where the optimal span of the function is determined by minimizing the Bayesian Information Criterion (Richardson et al., 2018b). The noise is characterized from the residuals around the smoothing spline, and the unitless Signal-to-Noise ratio (SNR) is then calculated as the ratio of the variance of the smoothing spline to the variance of the residuals. The SNR thus provides a normalized metric of the day-to-day variation in a time series relative to the seasonal variability in that time series. Next, we calculated the ratio of the SNR for GCC to the SNR for cameraNDVI by site when both metrics were available. For interpretation, if SNR(GCC)SNR(cameraNDVI) > 1, then GCC is inferred as a “less noisy” index relative to cameraNDVI, and these results are summarized for the entire network. Finally, we further explored the relationship between GCC and cameraNDVI by each individual plant function type (PFT, see Table 1) and Level I Ecoregion (see Fig. 2, Table 2) through boxplots that compare the distributions of both (1) linear correlations between GCC and cameraNDVI 1 d time series, and (2) SNR(GCC)SNR(cameraNDVI).
In addition to comparing cameraNDVI to GCC, we further compared cameraNDVI to a vegetation index commonly referred to as “broadband NDVI” (e.g., Jenkins et al., 2007). Broadband NDVI (hereafter broadbandNDVI) is calculated from radiometric sensors that measure downwelling (↓) and upwelling (↑) photosynthetically active radiation (Q, 400–700 nm) – measured using photosynthetic photon flux density (µmol m−2 s−1) – and global radiation (Rg, 400–2500 nm, W m−2), where an estimate of reflectances (r) are obtained following Jenkins et al. (2007):
There are multiple approaches to calculating broadbandNDVI, and the calculated index value will vary slightly depending on the approach (e.g., Huemmrich et al., 1999; Wang et al., 2004; Jenkins et al., 2007; Rocha et al., 2021).
We chose to compare cameraNDVI to broadbandNDVI, rather than to satellite-based NDVI, for several reasons. First, similar to cameraNDVI, broadbandNDVI estimates are inherently less sensitive to days with clouds, rain, or other adverse weather conditions; they thus have a temporal resolution and continuity that is more closely aligned with cameraNDVI. Second, the coarse spatial resolution of many satellite data products risks mixing vegetation types in heterogenous terrain (Richardson et al., 2018a), while the limited temporal resolution presents further challenges for characterizing the congruency between cameraNDVI and satellite NDVI, and these issues are minimized for broadbandNDVI measurements obtained from the same tower where PhenoCams are mounted. The comparison between cameraNDVI and broadbandNDVI is not perfectly aligned due to field-of-view (FOV) differences: PhenoCams have an oblique FOV of the canopy, while both photosynthetically active radiation (PAR) quantum sensors and shortwave pyranometers have a hemispherical FOV and a cosine response.
Similar to our comparisons between GCC and cameraNDVI, we compared cameraNDVI to broadbandNDVI through a simple visual evaluation of the two time series, as well as the same SNR analysis. For these comparisons, we used data aggregated to a 3 d time step. Given the large number of sites for which broadbandNDVI can be calculated (199 AmeriFlux sites as of the last access date; https://ameriflux.lbl.gov/sites/site-search/#vars=PPFD_IN%2CPPFD_OUT%2CSW_IN%2CSW_OUT, last access: 19 November 2025) we chose to focus our attention on sites within the National Ecological Observatory Network (NEON, https://www.neonscience.org, last access: 19 November 2025). NEON instruments are rigorously calibrated, and consistent deployment protocols ensure data are comparable across a wide range of site conditions. Across all NEON sites, a Hukseflux NR01 four-channel net radiometer is deployed to calculate upwelling and downwelling shortwave and longwave radiation (NEON, 2023b) and a Kipp & Zonen PAR Quantum Sensor (PQS) 1 was used to measure incoming and outgoing photosynthetically active radiation (NEON, 2023a). Both these NEON data products (PAR and radiation data) were downloaded from the AmeriFlux data portal for all 47 terrestrial sites in NEON's 20 ecoclimatic domains under the AmeriFlux CC-BY-4.0 License (NEON, 2023c, d, e, f, g, h, i, j, k, l, m, n, o, p, q, r, s, t, u, v, w, x, y, z, aa, ab, ac, ad, ae, af, ag, ah, ai, aj, ak, al, am, an, ao, ap, aq, ar, as, at, au, av, aw). Additional site details for these AmeriFlux datasets are available in Table S1 in the Supplement. Furthermore, the calculated broadbandNDVI data in comparison to cameraNDVI are available either in Fig. 8 or in the Supplement (Figs. S1–S5). Finally, all PhenoCam derived variables (e.g., GCC, cameraNDVI) at the 47 NEON sites were derived from cameras and imagery maintained and operated by the National Ecological Observatory Network (NEON, 2025), all of which are included in the PhenoCam Network.
2.4 Structure of PhenoCam V3.0 data product
The PhenoCam Dataset V3.0 contains seven separate Data Records for each site (Box 1). The structure for Data Records 1–5 is unchanged and described in detail in the data descriptors for V1.0 (Richardson et al., 2018b) and V2.0 (Seyednasrollah et al., 2019). Furthermore, details on image and time-series processing, data quality flags and filtering, and availability of interoperable software packages, such as phenocamr (Hufkens et al., 2018) and vegindex (https://github.com/PhenoCamNetwork/python-vegindex, last access: 19 November 2025), can be found in these past data descriptors. No new software packages have been developed for this data release, and existing packages (e.g., phenocamr) do not yet support interfacing with cameraNDVI or the simplified data files. Data Records 6 and 7 are new to this release:
-
New Data Record 6 includes derived data and metadata used to calculate cameraNDVI. There are two key file types here:
- –
the “PhenoCam Camera NDVI ROI (RGB/IR Image Pair) Statistics File” (filename:
<sitename>_<veg_type>_<ROI_ID_) (see Box 2 for details)
number>_ndvi_roistats.csv - –
the “PhenoCam 1-day and 3-day NDVI Summary Files” (filename:
<site_name>_<vegetation_type>_or
<ROI>_ndvi_1day.csv_3day.csv) (Box 3). Transition dates are not calculated from the cameraNDVI time series.
- –
-
New Data Record 7 provides a set of “simplified” data products, which do not include all the color statistics, color indices, cross-correlations, and uncertainties for different temporal resolutions and filtering approaches that are provided in Data Records 3–5. Rather, Data Record 7 only includes a summary file of daily mean GCC and smoothed daily mean GCC (filename:
<site_name>_<vegetation_type>_) (Box 4), as well as “rising” and “falling” transition dates derived from the daily mean GCC data (filename:
<ROI>_simplified_1day.csv<site_name>_<vegetation_type>_) (Box 5). While these data records were developed with secondary and post-secondary educational applications in mind, we anticipate that most users of the data set will find the simplified data products are sufficient for most scientific applications, with the added benefit of being more compact and easier to work with.
<ROI>_simplified_transition_
dates.csv
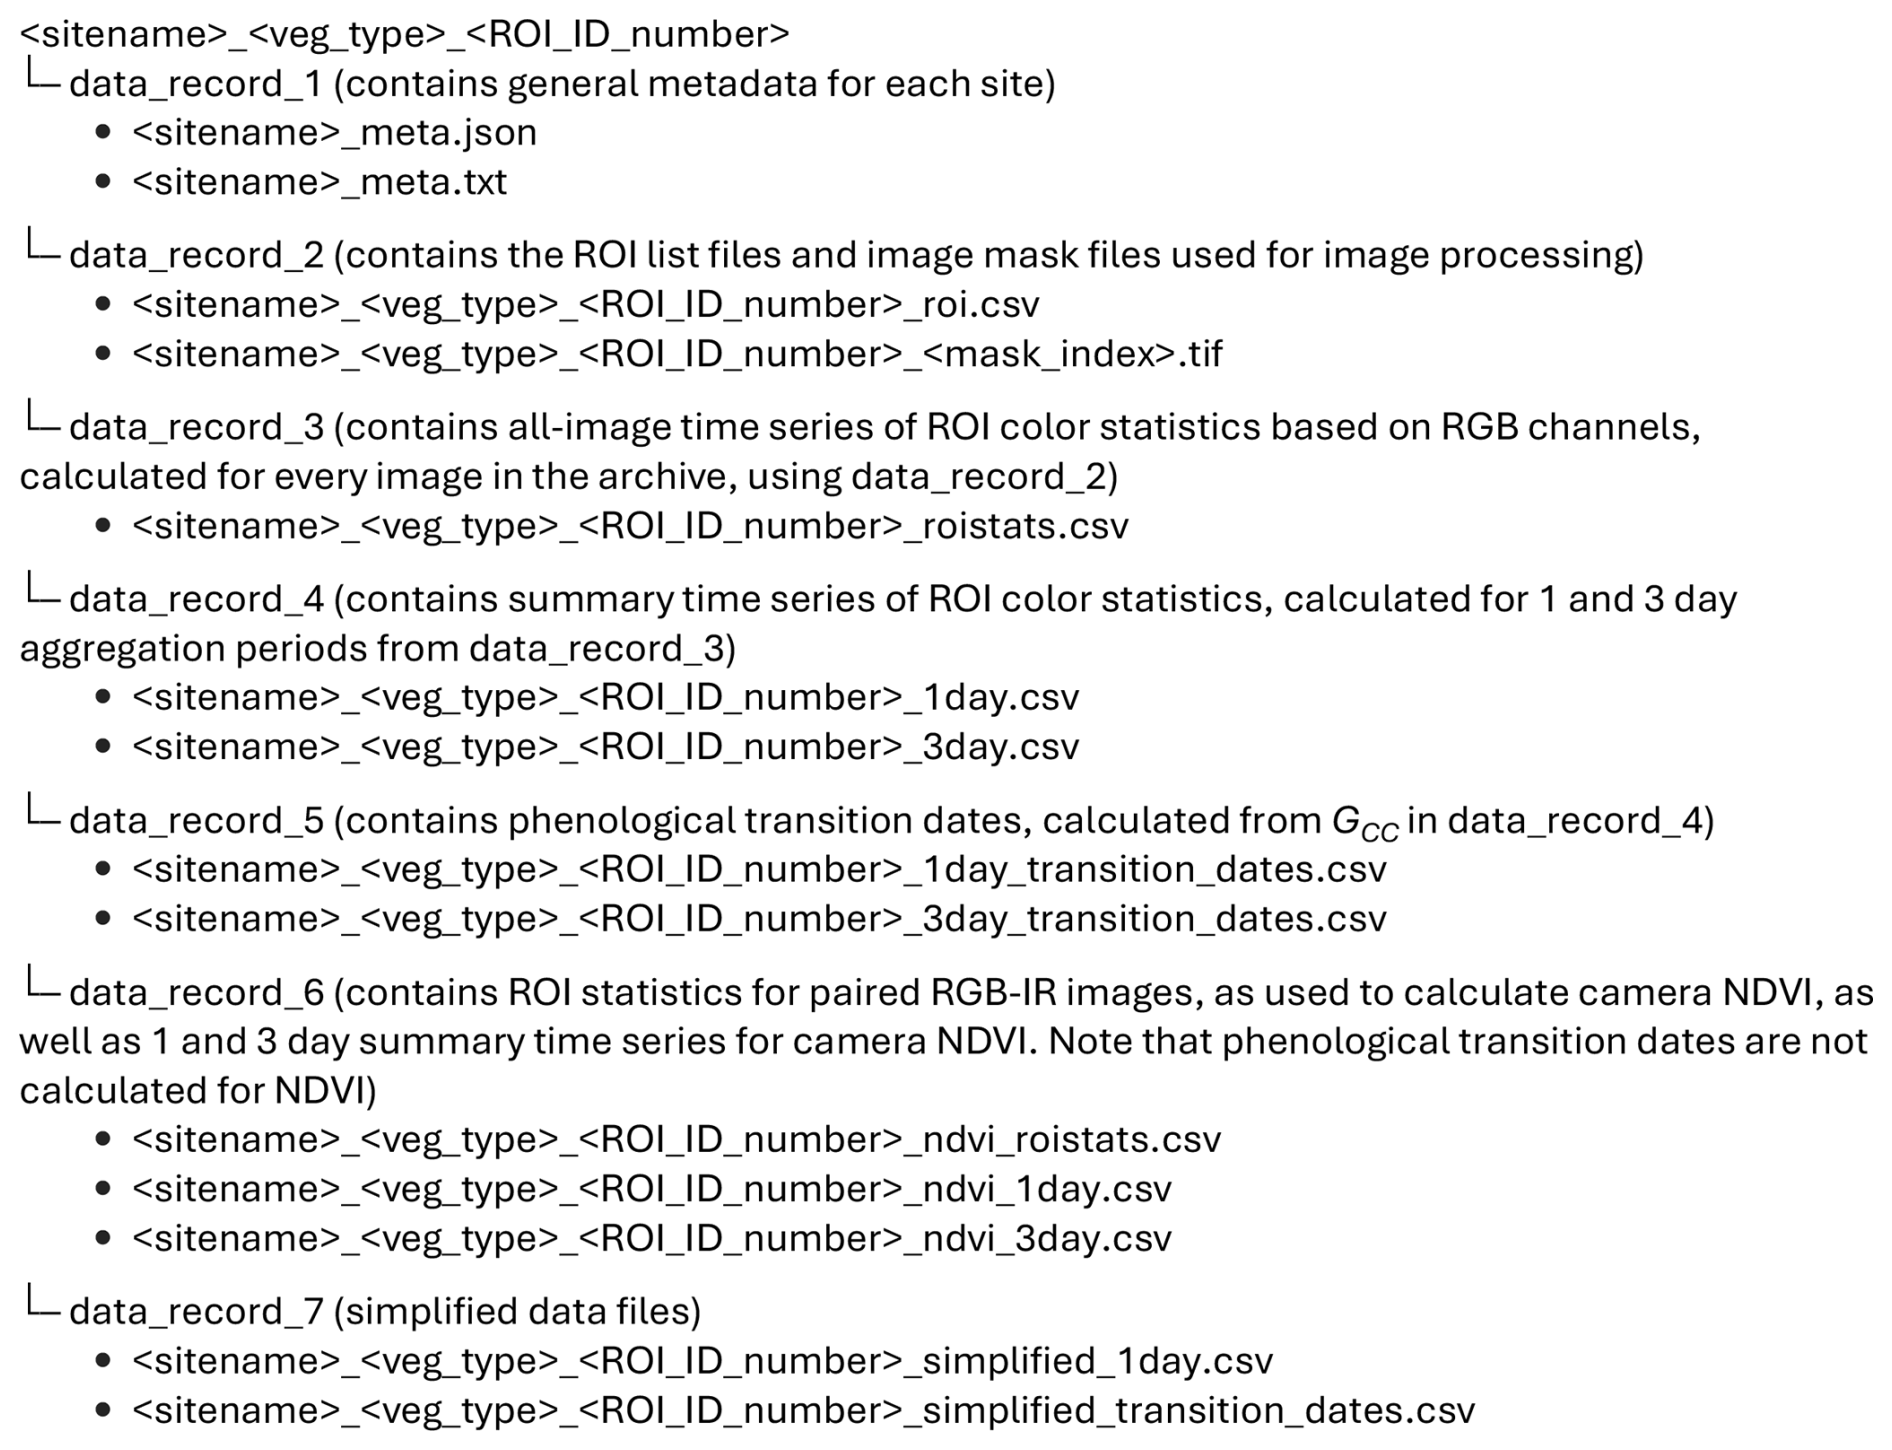
Box 1Dataset hierarchy of PhenoCam V3.0. Each ROI for each site has seven data structures, with each structure representing a different level of processing. For data downloaded from the PhenoCam Explorer or Gallery web pages, data for each <sitename>_<veg_type>_<ROI_ID_number> will be contained in a single .zip file, with each data record in a separate folder.
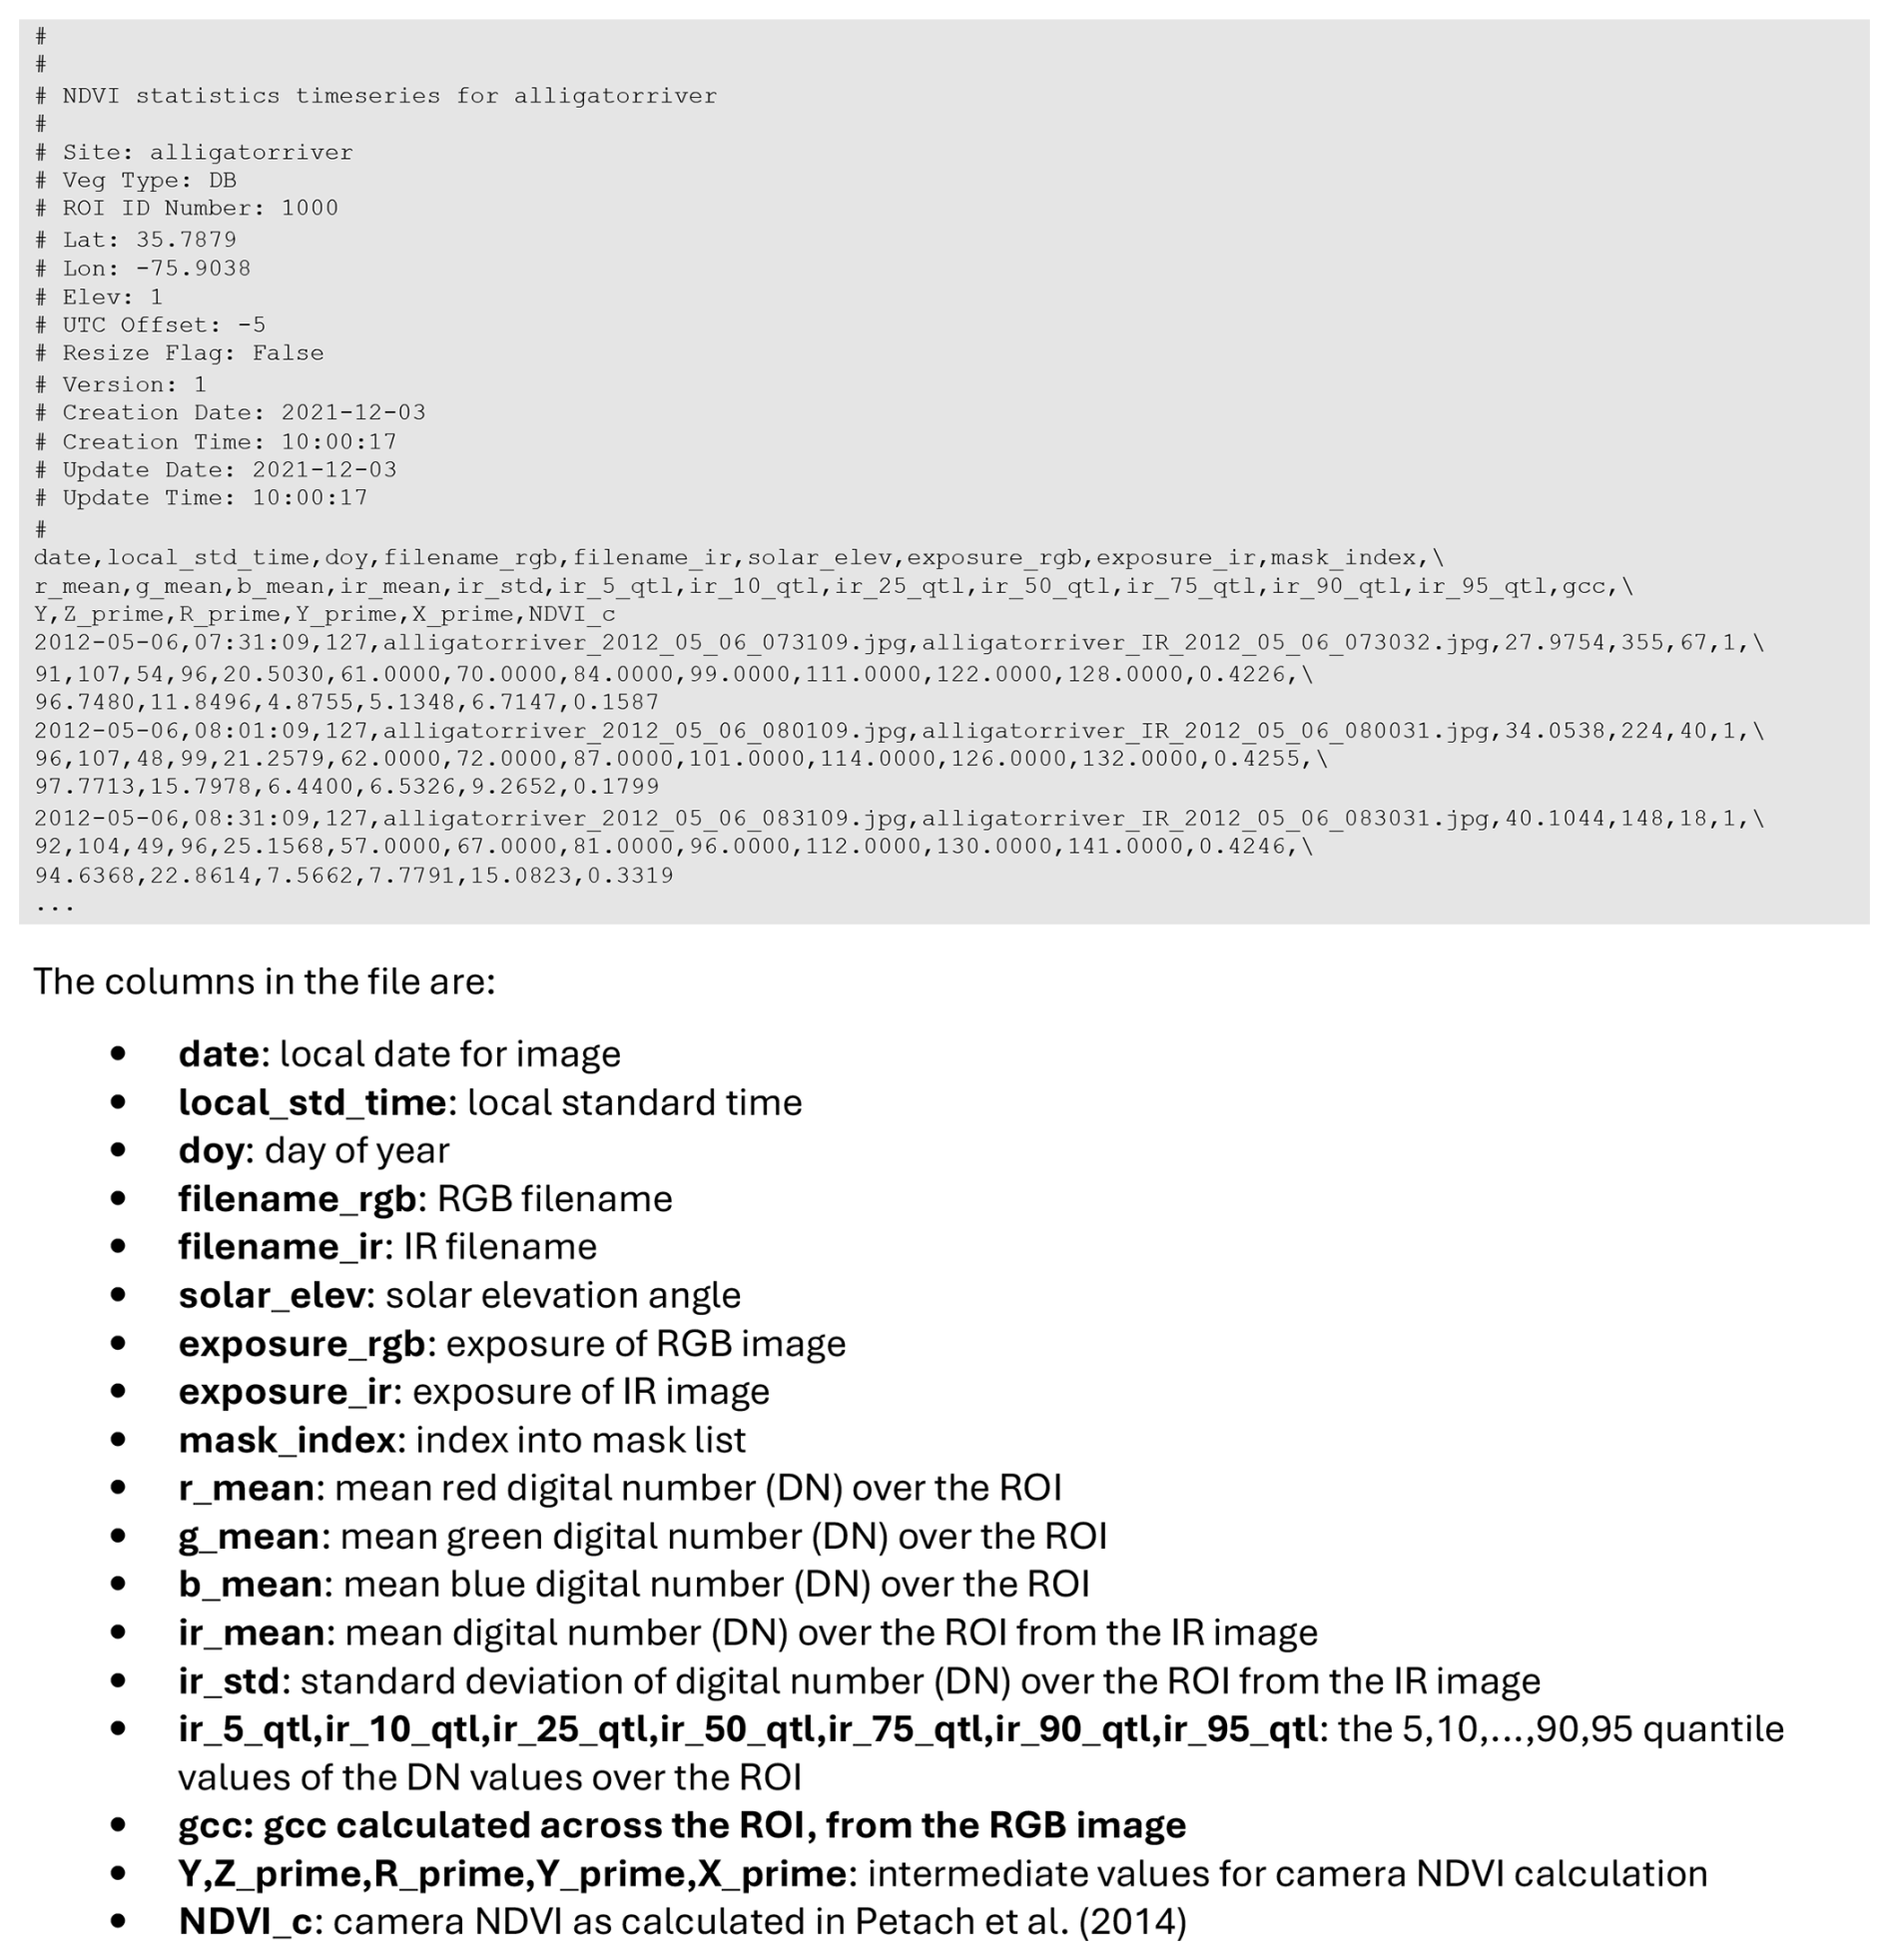
Box 2Format of “Camera NDVI ROI (RGB/IR Image Pair) Statistics File” in Data Record 6: The Camera NDVI ROI statistics file (filename: <sitename>_<veg_type>_<ROI_ID_number>_ndvi_roistats.csv) is created by combining the RGB and IR ROI statistics files for RGB/IR image pairs. Comment lines at the beginning of the file are preceded with “#” and include some basic site metadata along with creation and update dates and times. For display purposes, longer lines have been broken with a “\” character.
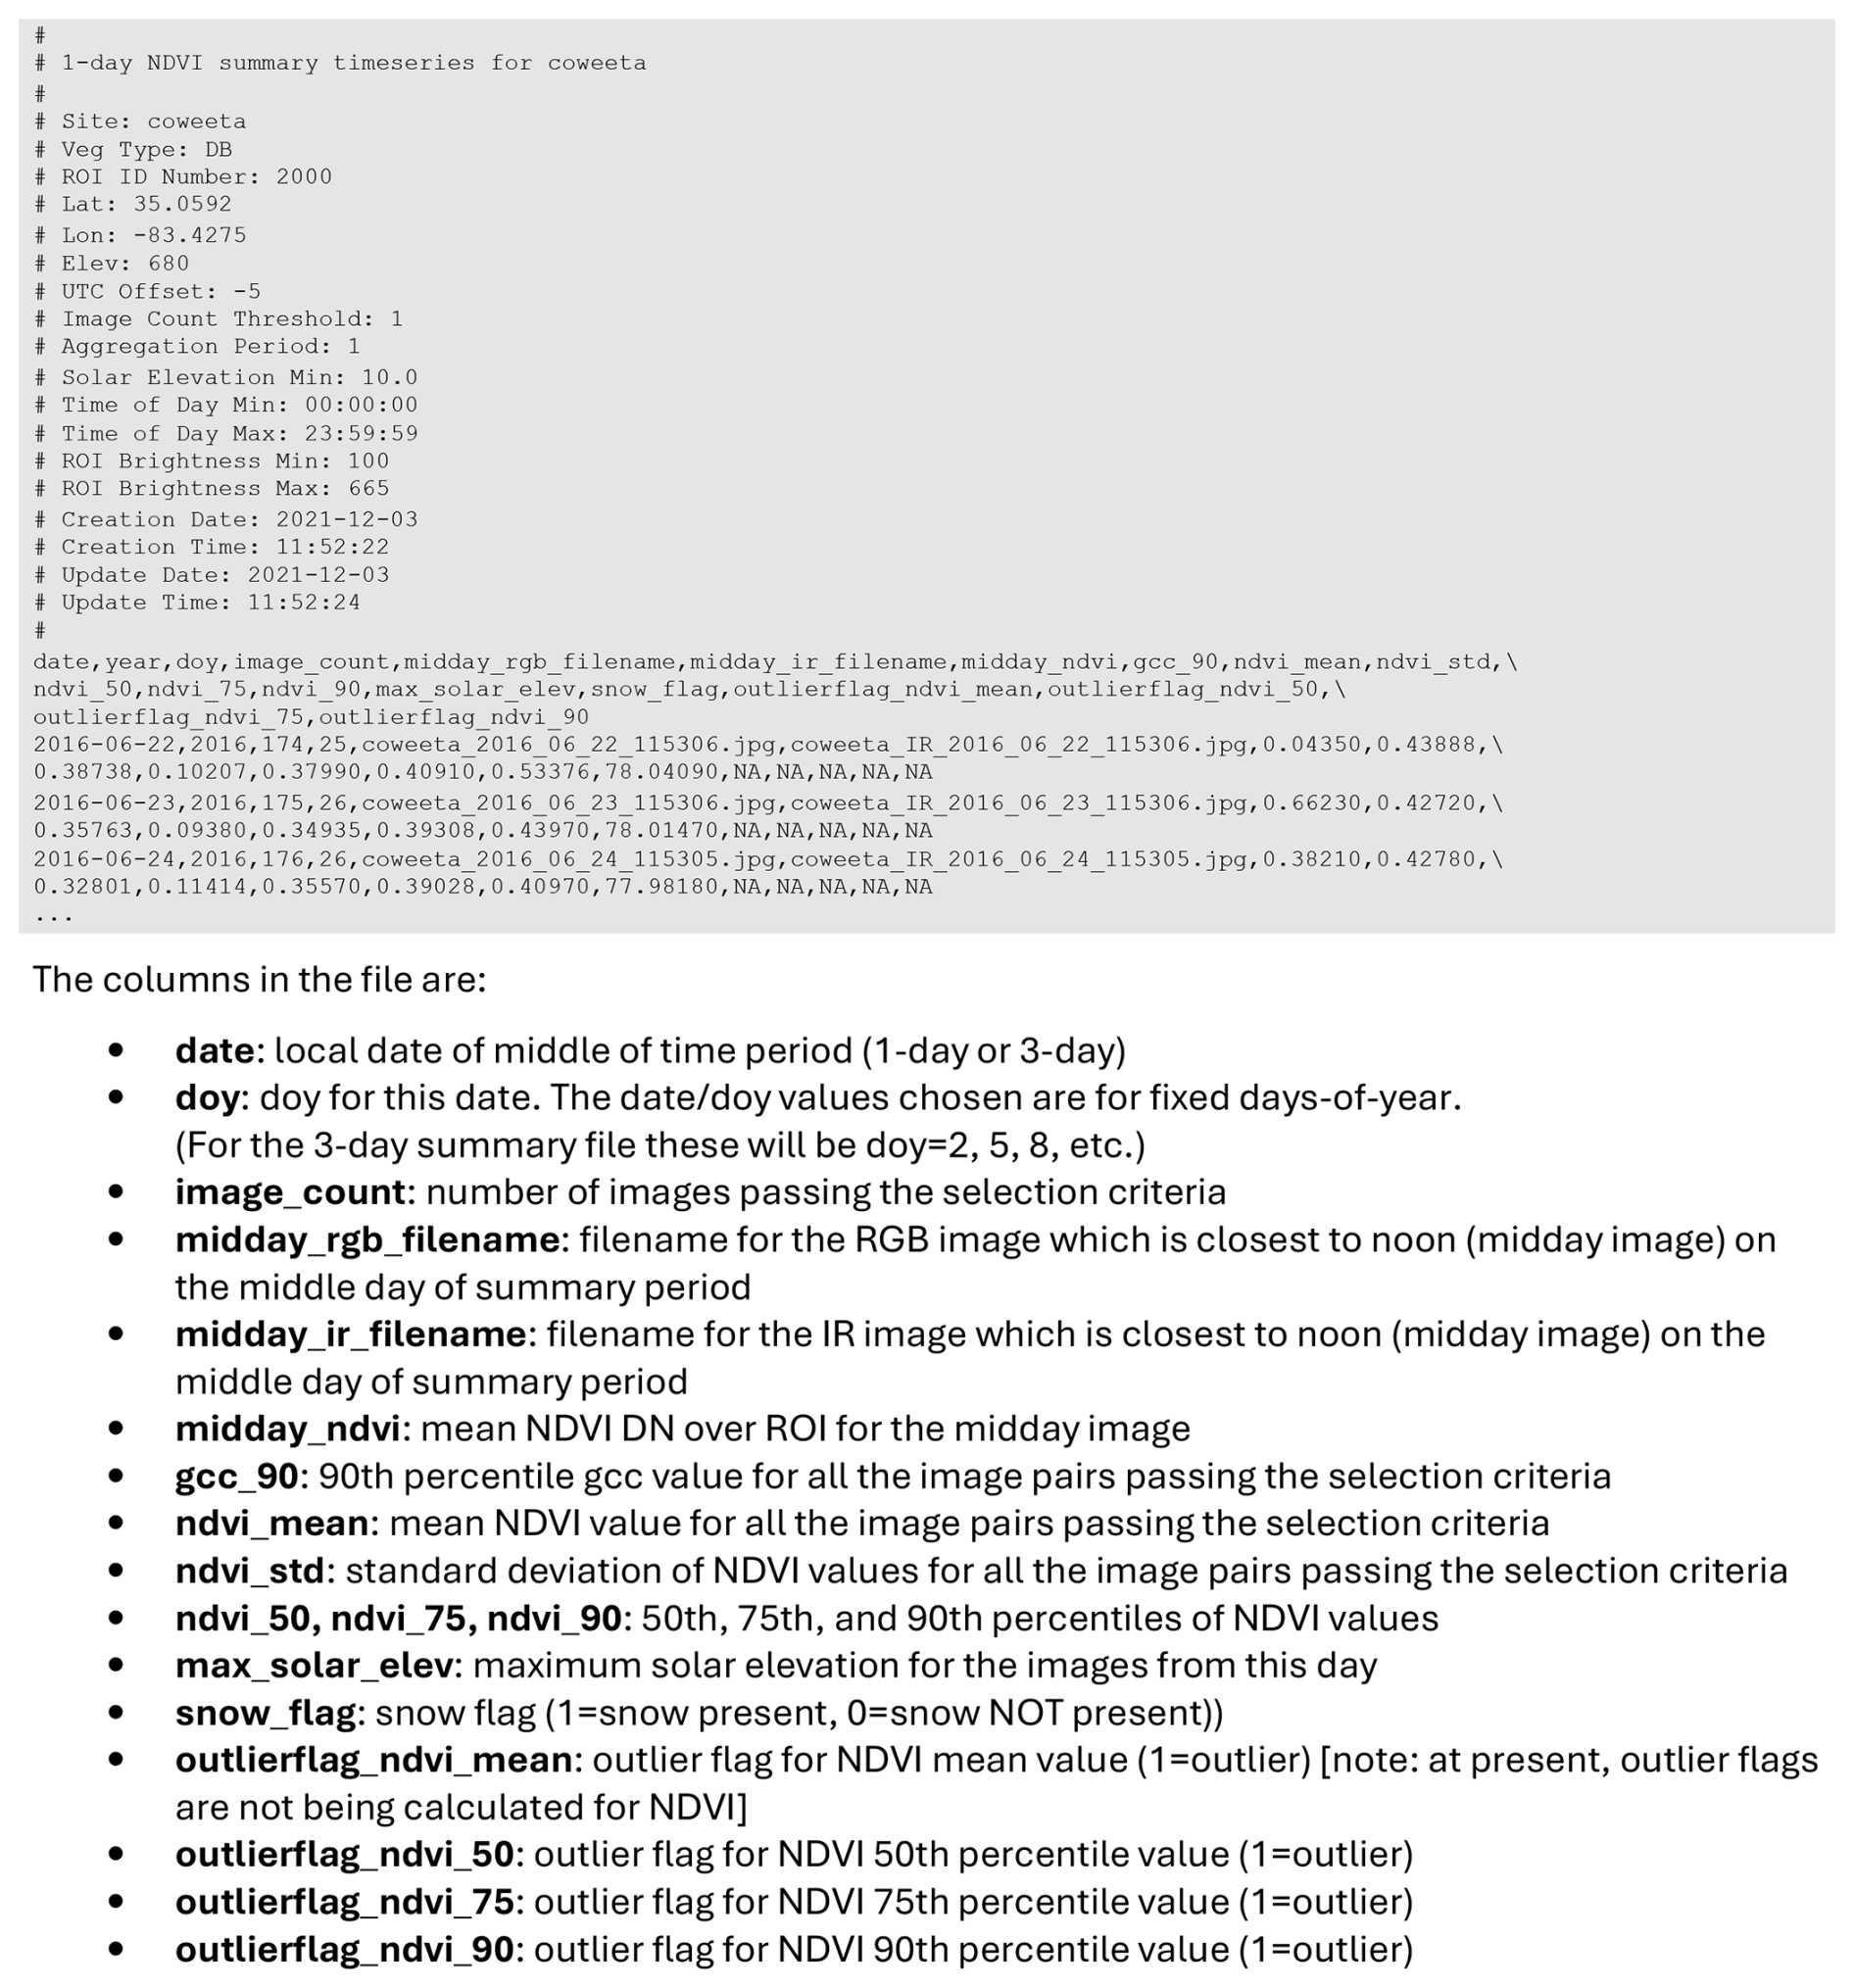
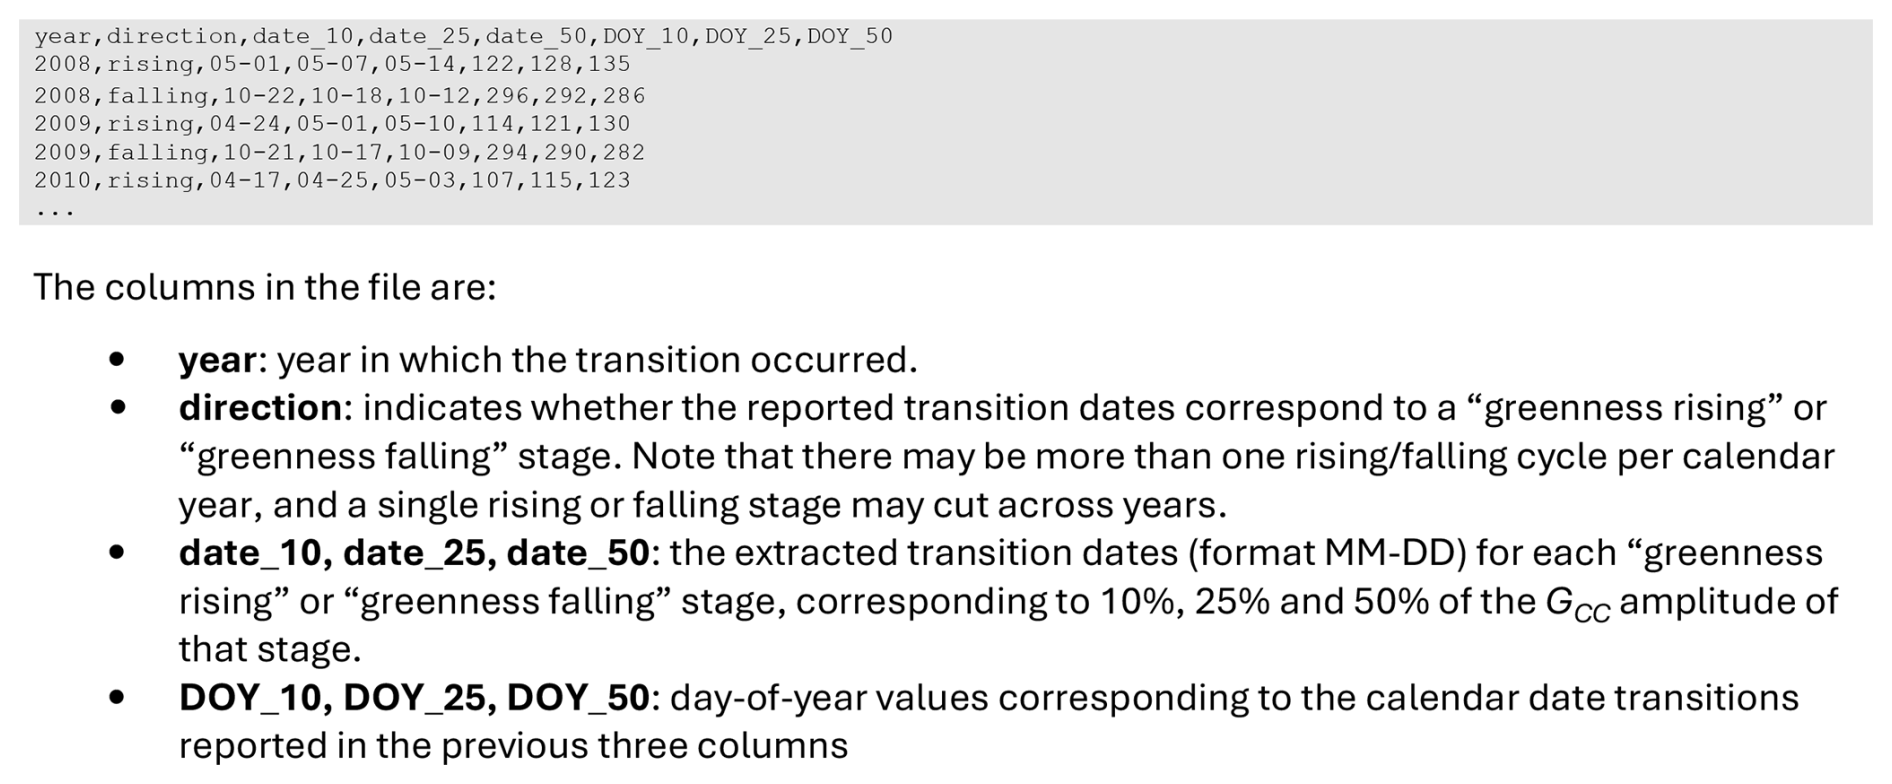
Box 3Format of the “1-day and 3-day NDVI Summary Files” in Data Record 6. Derived from the “Camera NDVI ROI (RGB/IR Image Pair) Statistics File”, this file (filename: <sitename>_<veg_type>_<ROI_ID_number>_ndvi_1day.csv or _3day.csv) reports aggregated statistics for GCC and cameraNDVI calculated over 1 and 3 d aggregation periods. The format of the 3 d file is identical, only the aggregation period changes. Comment lines at the beginning of the file are preceded with “#” and include some basic site metadata along with creation and update dates and times. Dates for which there are no images (or none passing the selection criteria) have empty fields as shown in the second data line above. When a particular value cannot be calculated it is given a “no data” value of NA.
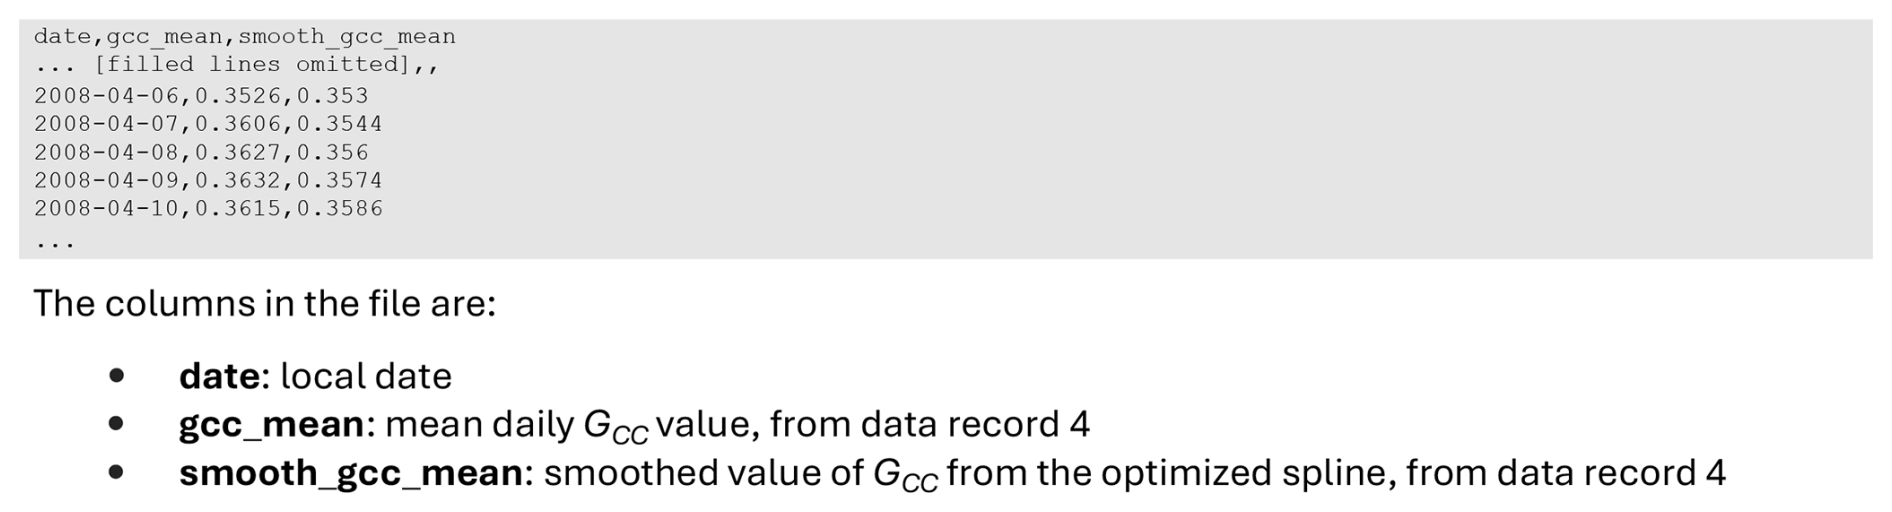
Box 4Format of the “Simplified Daily Summary Files” in Data Record 7. This file (filename: <sitename>_<veg_type>_<ROI_ID_number>_simplified_1day.csv) reports aggregated statistics for GCC_mean at a 1 d aggregation period. The “Simplified Daily Summary Files” from Data Record 7 are intended to be easier for data end-users to work with, in that they do not have the multitude of columns found in Data Records 3 and 4. Additionally, unlike the other standard data records, the simplified data records do not include any metadata.
Box 5Format of the “Simplified Transition Date Files” in Data Record 7. This file (filename: <sitename>_<veg_type>_<ROI_ID_number>_simplified_transition_dates.csv) reports transition dates for GCC_mean, extracted from the 1 d transition dates reported in Data Record 5. The “Simplified Transition Date Files” from Data Record 7 include only transition dates derived from GCC_mean. This file is intended to be easier for data end-users to work with, compared to the standard transition date files in Data Record 5 which also include information about uncertainties and the seasonal amplitude of GCC. Additionally, the simplified data records do not include any metadata.
2.5 Accessing PhenoCam V3.0
The PhenoCam V3.0 data release can be accessed three different ways:
-
The Oak Ridge National Laboratory Distributed Active Archive Center (ORNL DAAC), which is free to use and access (registration for an EarthData login is required). This archive also includes a helpful User Guide to better understand the dataset structure and organization. Please see the Data Availability Statement in Sect. 5.
-
The PhenoCam Explorer webpage (Fig. 1a, b). This webpage (https://phenocam.nau.edu/phenocam_explorer/, last access: 19 November 2025) is free to use, and offers several tools to query, search, and visualize the PhenoCam V3.0 data products for each site. Users can access and evaluate previous versions of PhenoCam data releases (V1.0 and V2.0) through this portal as well. This page includes a button allowing users to download the entire V3.0 dataset as a single zip file (Fig. 1a). This zip file contains the data for every ROI in V3.0 packaged in their own individual zip files, each containing directories for each of the seven data records described in this paper, Richardson et al. (2018b), and Seyednasrollah et al. (2019) (Sect 2.4). The PhenoCam Explorer webpage also offers options to download versioned zip files for individual ROIs (Fig. 1b).
-
The PhenoCam Gallery (https://phenocam.nau.edu/webcam/ (last access: 19 November 2025), e.g., Fig. 1c, d, e). At the top of the PhenoCam webpage, there are several persistent dropdown menus that offer links to download the data or visit the Explorer webpage. On each individual site page (e.g., Fig. 1c, d), users also have access to links indicating if a site is part of a data release, and each link points the user to the ORNL data archive. The “Download PhenoCam V3 Dataset” link at the top of Fig. 1d takes the users to Fig. 1e, where they also have the option to download the entire V3.0 dataset as a single zip file (∼ 6.5 GB), or to download zip files for individual V3.0 ROIs. This page (Fig. 1e) also offers the option to download a list of all ROIs and associated zip file URLs to aid in programmatic access (e.g., via R or Python) to the versioned data. To download data via this page users must first register with PhenoCam (which is also free). Finally, under the URL for each ROI (Fig. 1d), users can access additional information (e.g., visualization of ROI mask or time series of GCC) and download the provisional data.
We encourage users to explore some or all these pathways for accessing V3.0 to find the option that will best suit their own research or education requirements. Finally, it is critical to note the difference between versioned and provisional data sets: versioned data (i.e., V1.0, V2.0, and V3.0) are prepared for long-term archive at ORNL, have undergone extensive QA/QC, and are static (i.e., they will not be changed in the future), ultimately making them ideal for conducting reproducible science. By comparison, provisional datasets accessed through the PhenoCam gallery and API contain results from the most recent data acquisition and are updated daily but have not undergone the same quality checks and review after the end date of V3.0 (i.e., 31 December 2023).
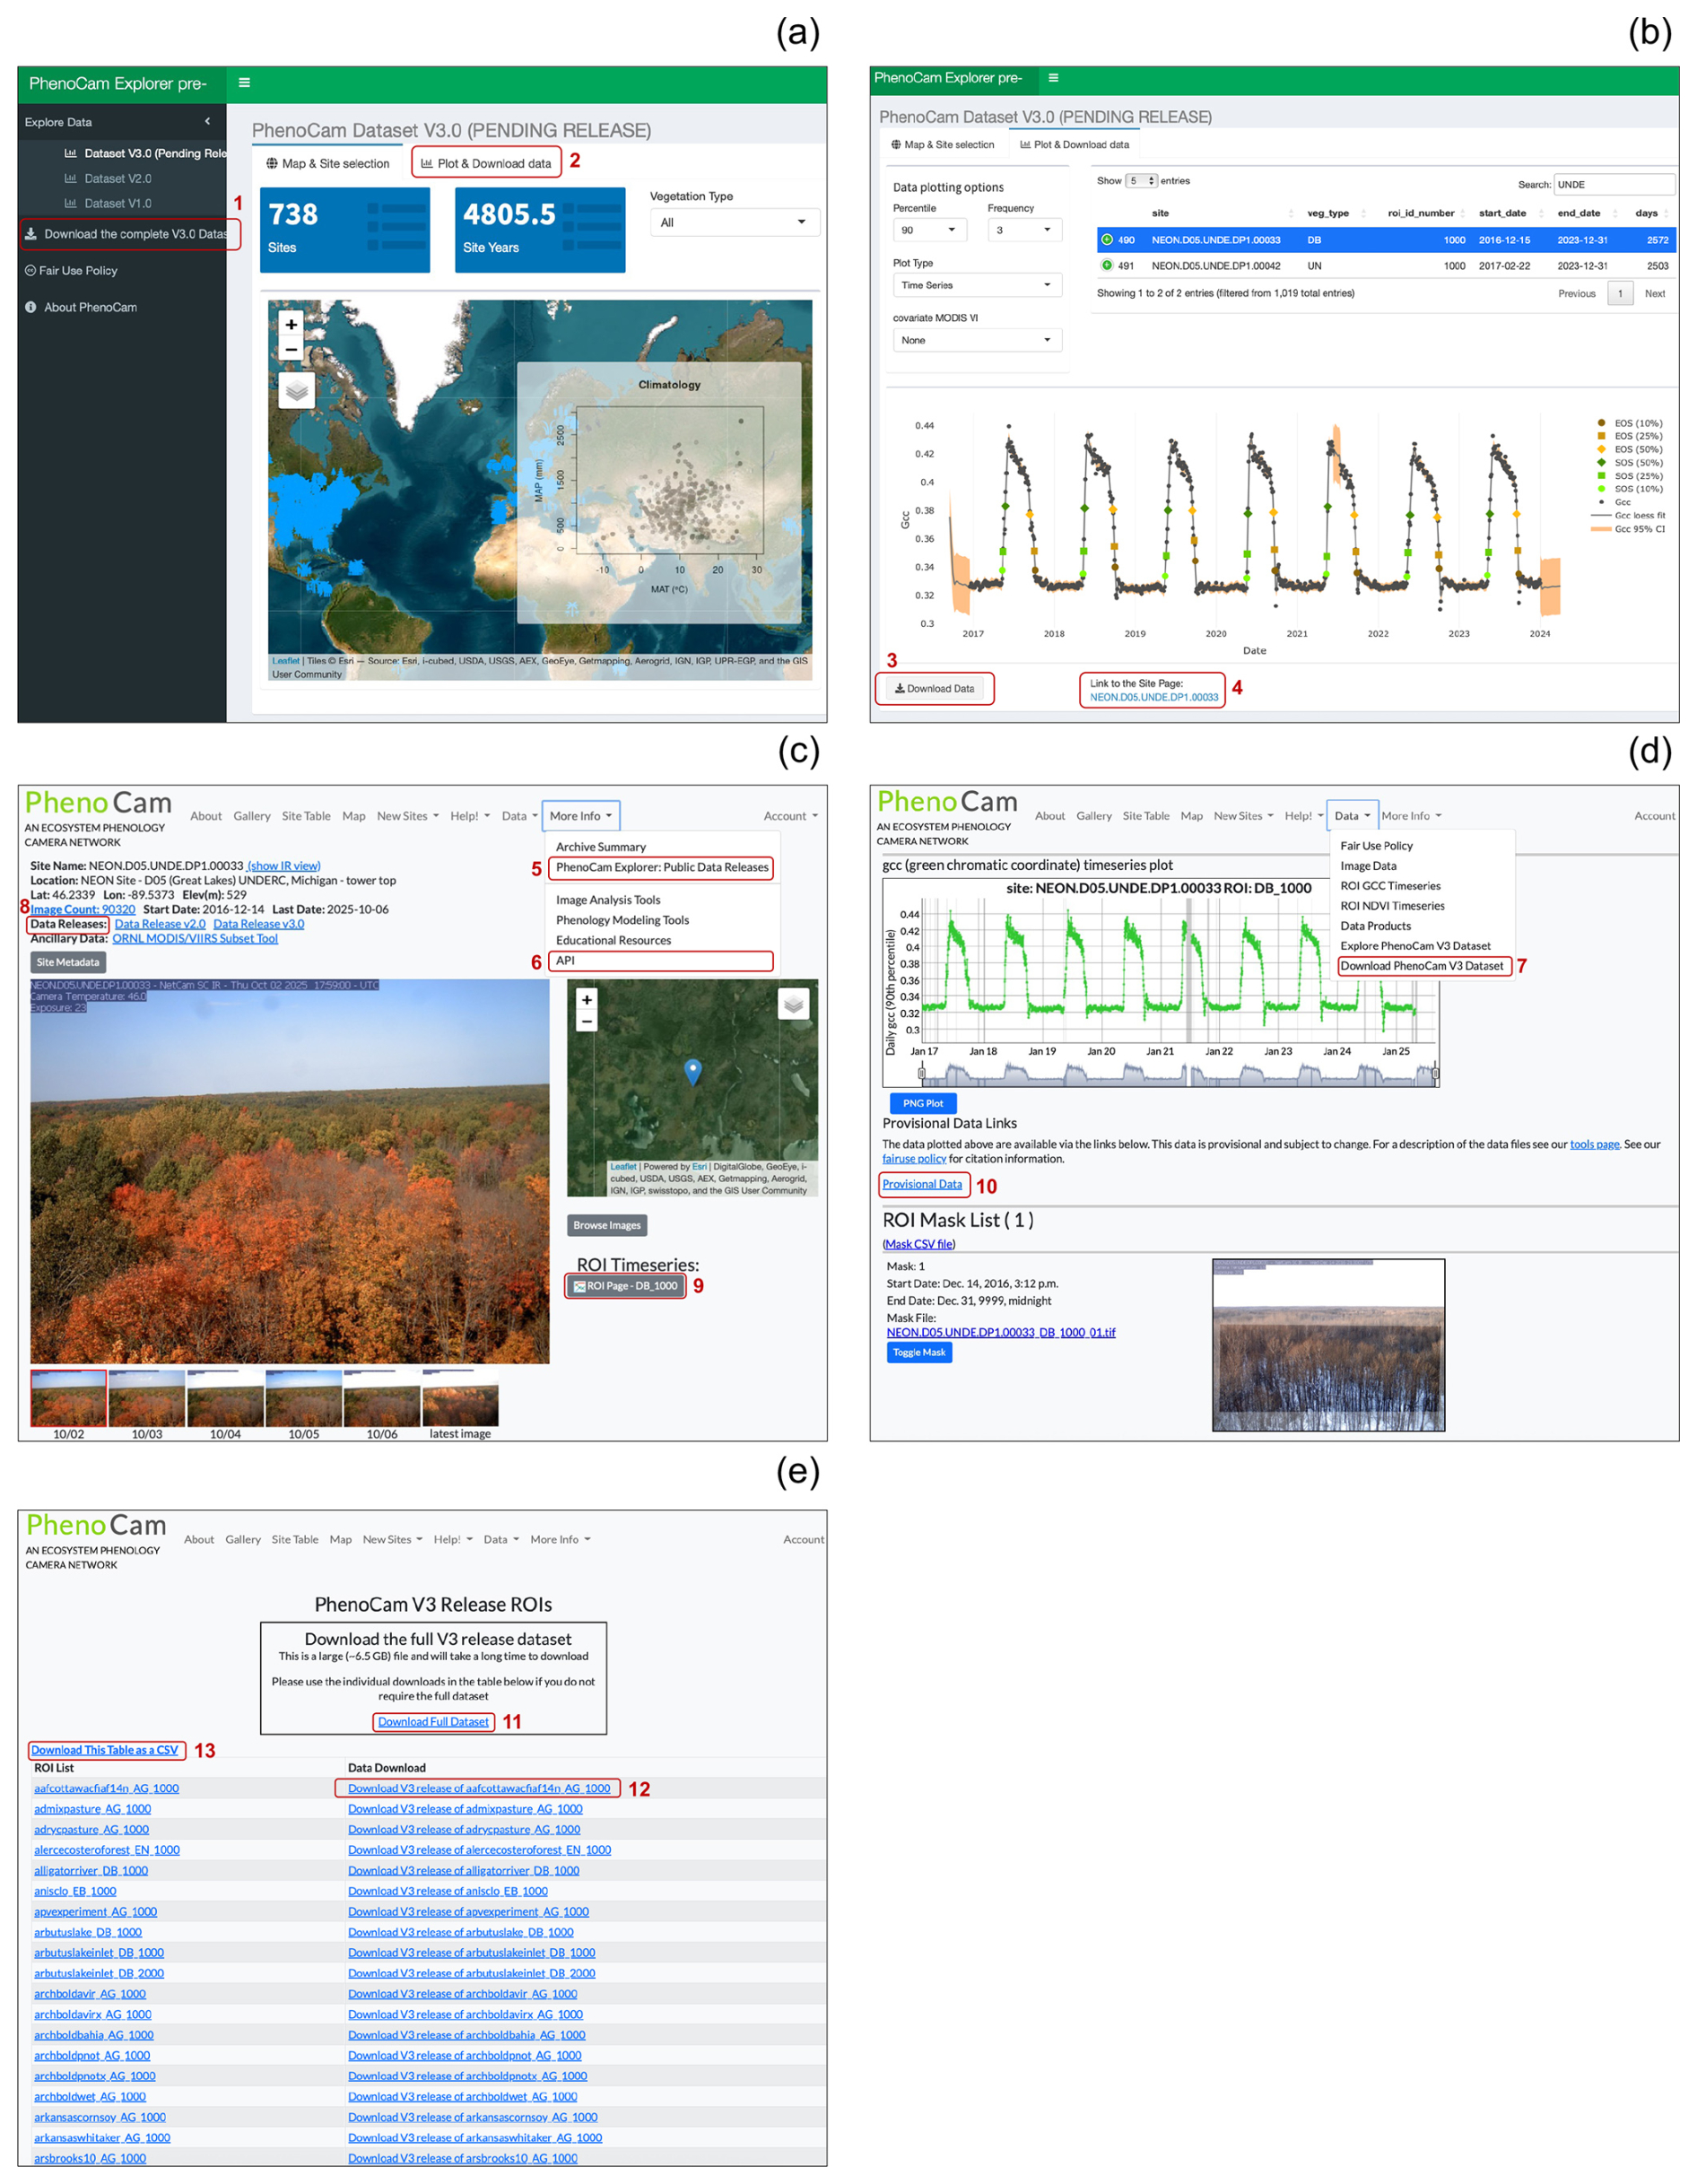
Figure 1Various ways to access PhenoCam V3.0 data. (a) Using PhenoCam Explorer (https://phenocam.nau.edu/phenocam_explorer/), users can explore the spatial distribution of available PhenoCams in V3.0. There is also the option to download the entire V3.0 dataset as a zip file (red box #1). Red box #2 indicates the “Plot and Download Data” tab, which takes users to (b) and allows for broader query options for specific sites or vegetation types, as well as exploring visualizations of time series, transition dates, and relationships with other variables (NDVI, EVI). This page also offers a download button on the bottom for each specific ROI (red box #3), which will provide a zip file of the V3.0 data for that specific ROI. Red box #4 takes users to (c) the landing page for a given site in the PhenoCam gallery. The PhenoCam gallery webpage (https://phenocam.nau.edu/webcam/, last access: 19 November 2025) has a persistent header of drop-down menus, providing links to visit the explorer page (c, red box #5), the Application Programming Interface (API, c, red box #6), or to download V3.0 data ((d), red box #7). For each individual site page in the PhenoCam gallery, we provide metadata at the top indicating which versioned data releases the site is included in, pointing users to the ORNL archive (red box #8). The ROI link(s) for each site (red box #9) take users to (d), which provides additional information and a link to download provisional data (red box #10). The “Download PhenoCam V3 Data” link under the drop down menu (red box #7) will take users to the PhenoCam V3 Release ROIs page (e) where there are additional options to download the entire V3.0 archive as a single zip file (red box #11) or download zip files for individual ROIs (e.g., red box #12). Finally, in (e) (red box #13), users have the option to download a CSV table that contains V3.0 versioned zip file URLs for each ROI to aid in programmatic downloads of the V3.0 dataset.
3.1 Updated Data Coverage of V3.0
The PhenoCam V3.0 dataset release has significantly expanded in both spatial and temporal coverage relative to PhenoCam V2.0 (Fig. 2, Tables 1 and 2). Sites included in this data release have at minimum six months of continuous data available, and all time series have been carefully curated via repeated visual evaluations and quality checks by an expert team. Adjustment of ROI masks have been made as needed to accommodate camera field of view shifts, and Type II or III sites where automatic white balancing has negatively affected data quality have been removed. There are now 738 unique sites and 4805.5 site-years within this data release, compared to 393 sites and 1783 site-years in PhenoCam V2.0 (Seyednasrollah et al. 2019) (Table 1). The vegetation types with the largest increase in site-years (as a percentage) were:
-
1118 % increase for understory (UN), from 18 sites-years in V2.0 to 219.2 site-years in V3.0.
-
264 % increase for evergreen broadleaf forests (EB), from 28 sites-years in V2.0 to 101.8 site-years in V3.0
-
227 % increase in grasslands (GR), from 279 site-years in V2.0 to 912.4 site-years in V3.0.
-
217 % increase in wetlands (WL), from 64 site-years in V2.0 to 202.7 site-years in V3.0.
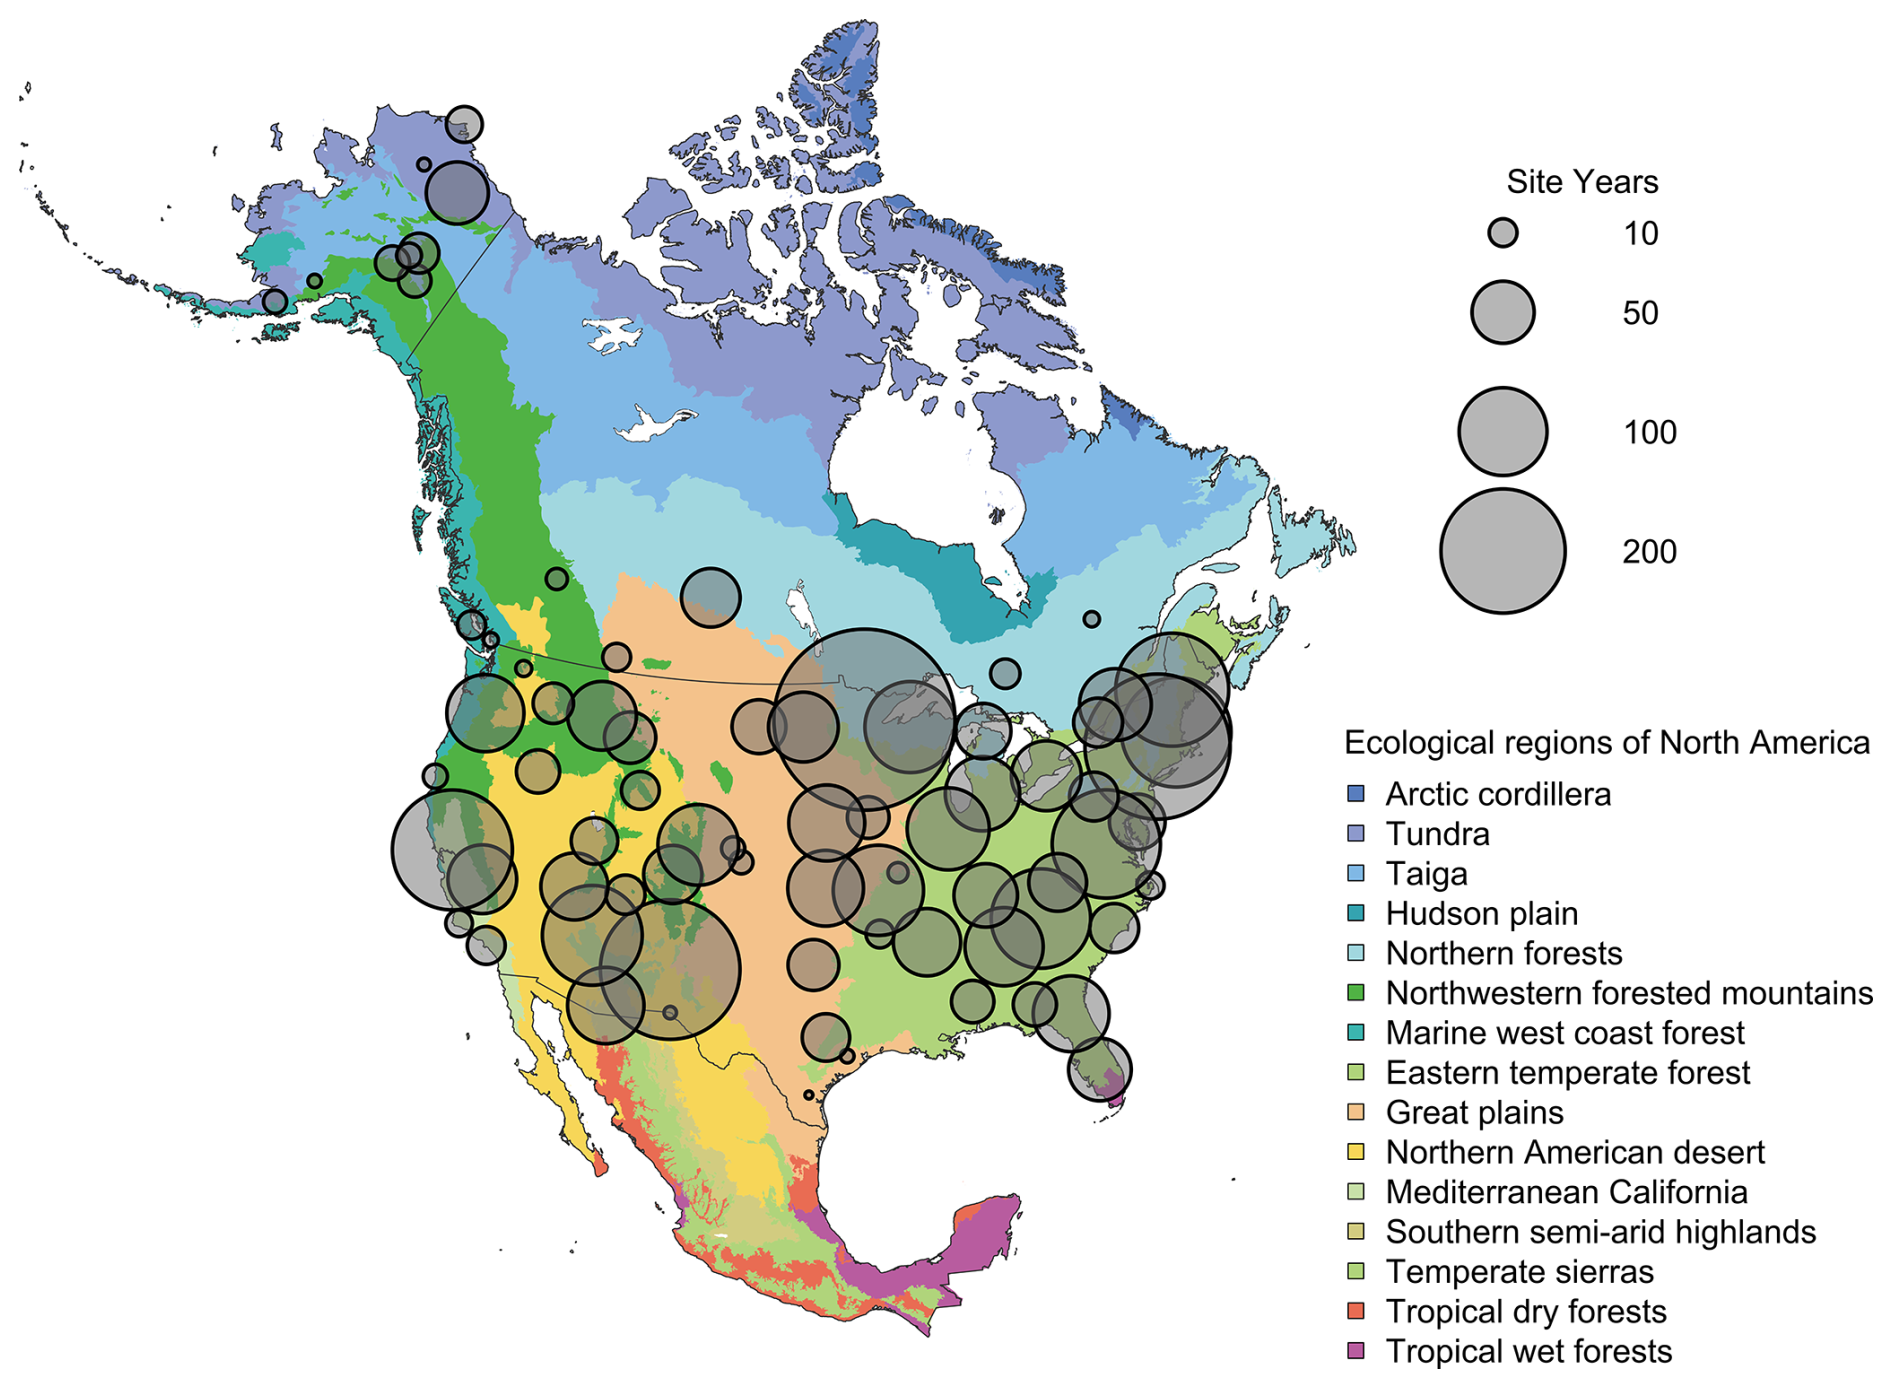
Figure 2Spatial distribution of PhenoCam data across ecological regions of North America. Background map illustrates USA Environmental Protection Agency Level I Ecoregions (Omernik and Griffith, 2014). Data counts have been aggregated to a spatial resolution of 4°, and the size of each circle corresponds to the number of site-years of data in the 4×4° grid cell. A total of 4286.6 out of 4805.5 total site years in the V3.0 dataset are depicted in Fig. 2. However, sites in Hawaii, Puerto Rico, Central and South America, Europe, Asia and Africa (total of 518.9 site years) are not shown.
Table 1Vegetation type abbreviations for ROIs (region of interests), and the corresponding number of sites and site-years of data in the PhenoCam dataset described here (V3.0). For comparative purposes, the number of sites and site-years of data in the previous dataset releases is also presented. The number of sites that contain an ROI for a given vegetation type are in parentheses, and a given site can contain ROIs for multiple vegetation types. MX and NV ROIs were excluded in V2.0 but are currently available again in V3.0. There are 2.7 site years of Reference Panel (RF) ROIs in V3.0 as well, for a total of 4805.5 site years in the V3.0 data release.
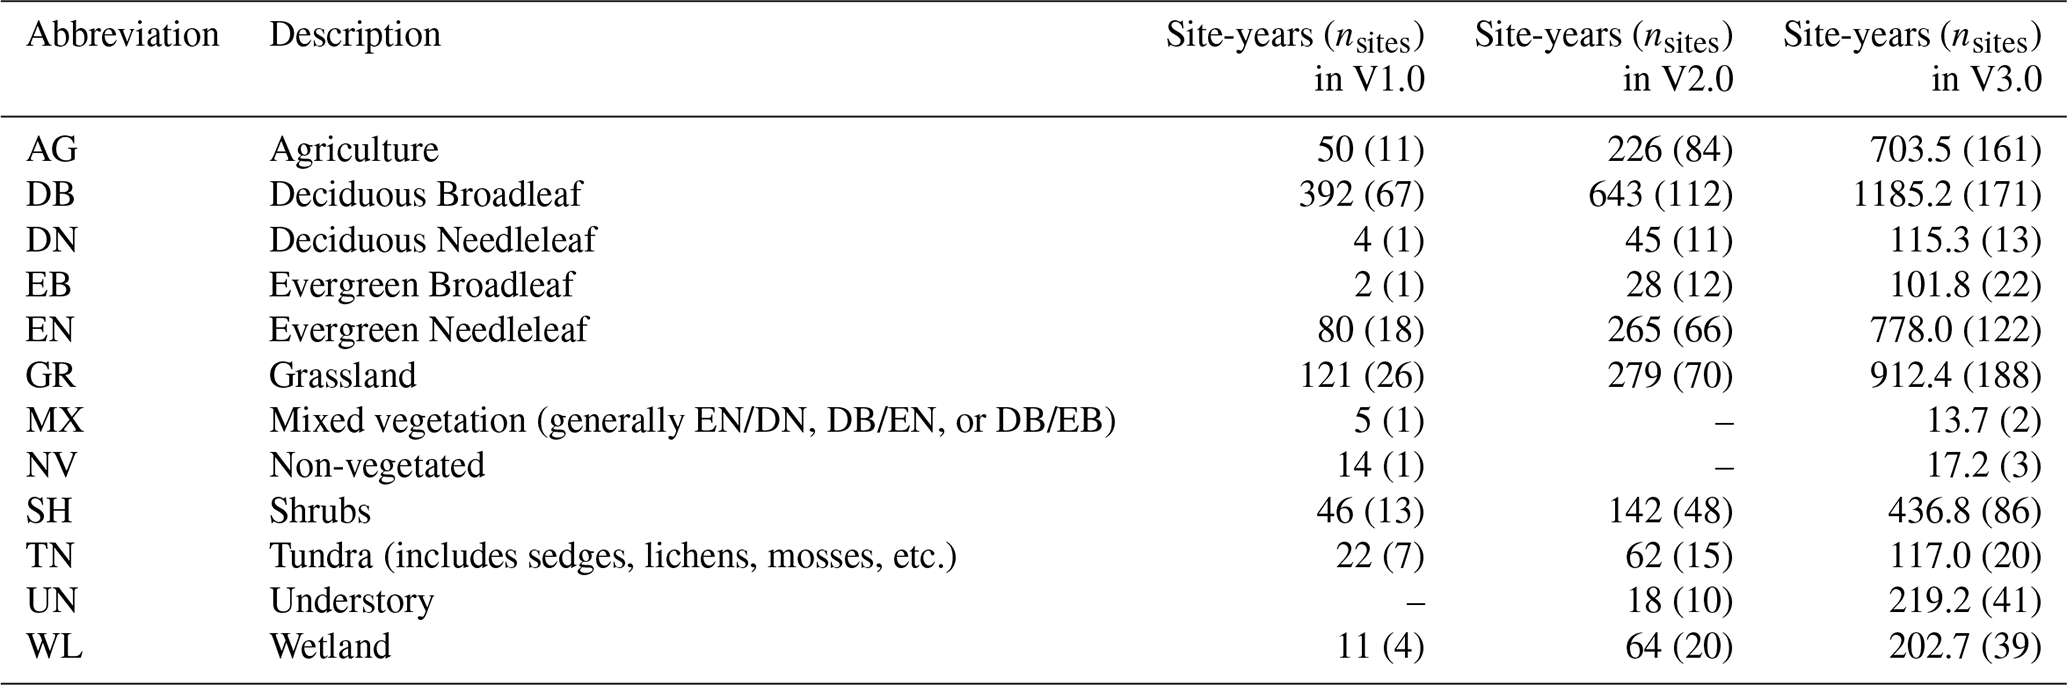
Table 2Number of sites and site years for each Level I Ecoregion in North America. These Level I ecoregions correspond to the same ecoregions in Fig. 2 (Omernik and Griffith, 2014). Sites are not included if they are located outside North America.
Using the Level II Ecoregion classification of North America (https://www.epa.gov/eco-research/ecoregions-north-america, last access: 19 November 2025; Omernik and Griffith, 2014), we identified ecoregions and biomes where coverage is lowest. From about 30 to 55° N, virtually every Level II ecoregion has at least three (and in many cases substantially more) PhenoCams (Fig. 3a). Ecoregions in the high Arctic of northern Canada and most of Mexico emerge as poorly represented, suggesting they should be targeted for future camera deployment efforts. The everglades ecoregion of Southern Florida does not have any PhenoCams currently, but there are six active PhenoCams in Puerto Rico to characterize coverage of North American tropical wet forests.
Using the Whittaker Biome Classification (Whittaker, 1975), we also examined the distribution of PhenoCam sites across global climate-space (Fig. 3b). Using the most recent version of WorldClim 30 year average temperature and precipitation data (Fick and Hijmans, 2017), we found that mean annual temperature at PhenoCam sites in North America spans almost 40° C, ranging from −12.0 to 26.1 °C, while mean annual precipitation varies 30-fold, from 109 mm to over 3800 mm. Among the biomes corresponding to this ecoclimatic gradient, boreal forest, temperate forest, temperate grassland desert, temperate rain forest, tropical forest savanna, and woodland/shrubland biomes are generally well-represented by the current distribution of PhenoCam network sites. However, the ecoclimatic representation of the network would benefit from the installation of more cameras in subtropical desert, tundra, and tropical rain forest biomes. Although expansion of PhenoCam coverage in Mexico is expected in the coming years, increased global coverage of warm, wet, and warm and wet ecosystems will require collaboration and engagement of site PIs across the tropics and sub-tropics more generally.
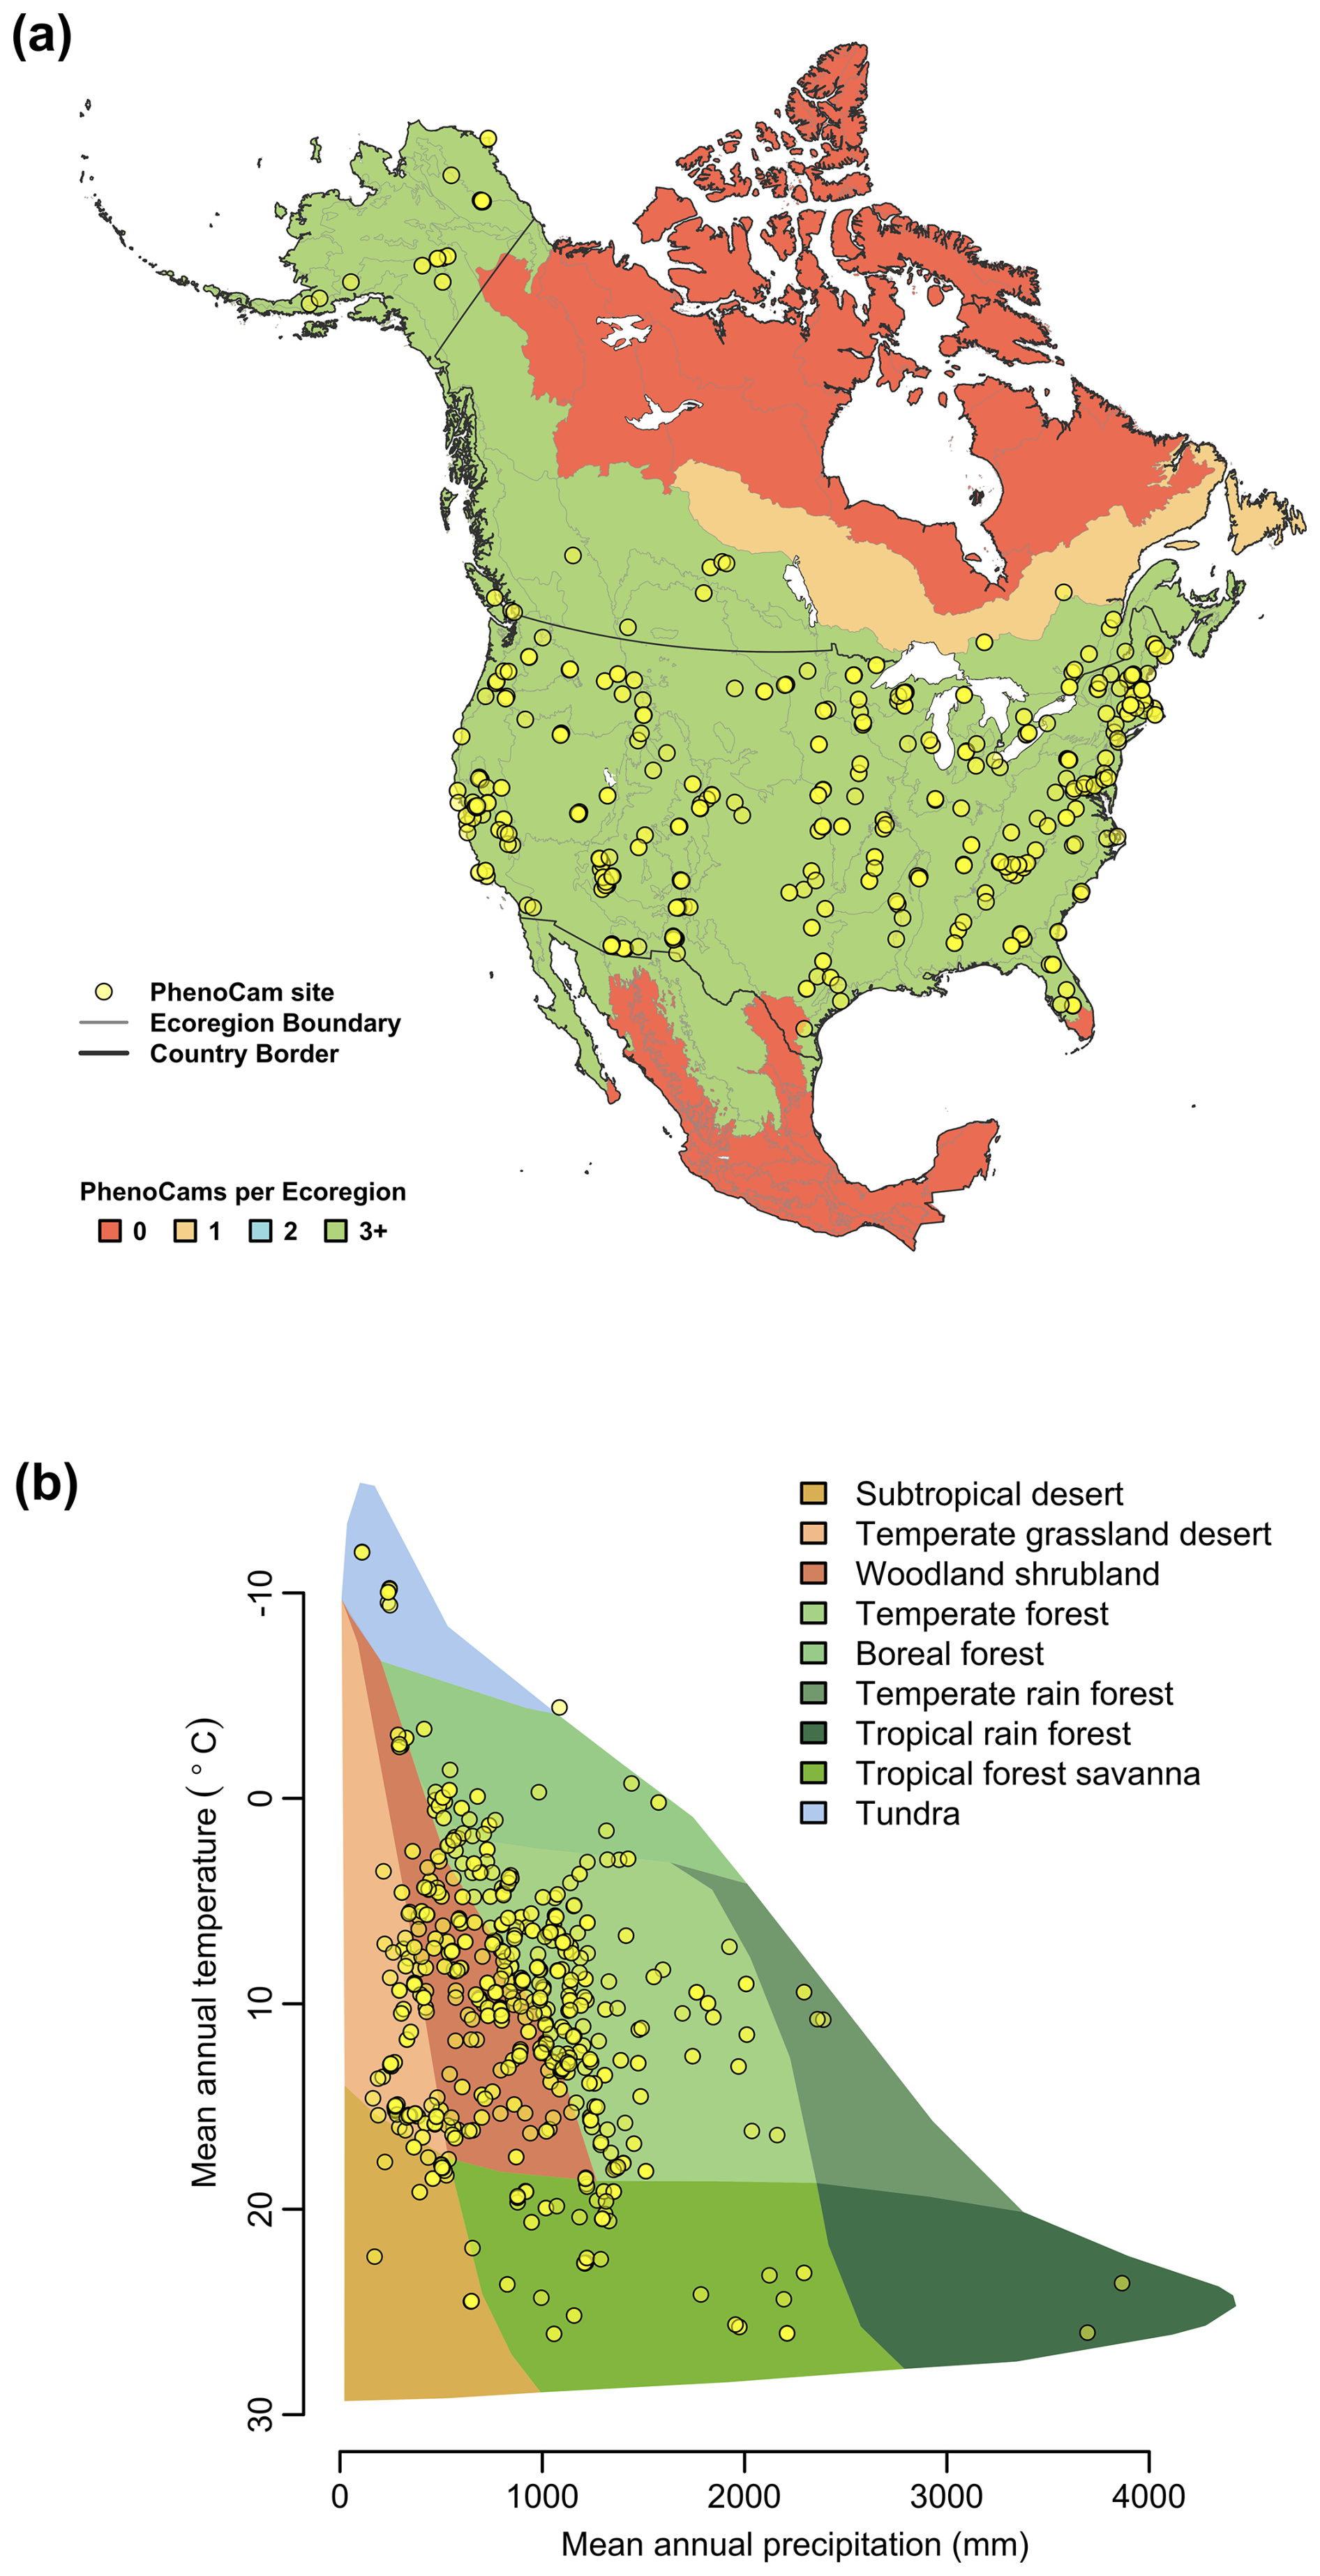
Figure 3Representation of PhenoCam cameras in ecoclimatic space. (a) The number of PhenoCams for each Level II Ecoregion in North America colored by the number of PhenoCams per region. (b) The distribution of PhenoCams across climate space in relation to major terrestrial biomes defined by the Whittaker classification. Ecoregion boundaries are obtained from the USA Environmental Protection Agency Ecoregion Level II map of North America from Omernik and Griffith (2014).
The longest time series for a single plant functional type (PFT) and Type I camera at a single site is for an evergreen conifer forest site, howland1, started in January 2007 (16.8 year split into three separate ROIs that adjust for camera field-of-view shifts; https://phenocam.nau.edu/webcam/sites/howland1/, last access: 19 November 2025). Other Type I cameras of considerable temporal coverage include four deciduous broadleaf forest sites where cameras were first installed in 2008: harvard (15.7 years), caryinstitute (15.7 years), queens (15.5 years), bartlettir (15.4 years), and morganmonroe (15.3 years). In total, there are 58 time series from Type I cameras that are at least a decade in length, and 355 time series between 5–10 years in length. Of cameras with the capacity to produce cameraNDVI, the longest ROIs are more than 10 years long (e.g., canadaOBS, kendall, missouriozarks), with 341 ROIs at least 5 years in length. Finally, to ensure our data processing algorithm is consistent between versioned datasets, we compared transition dates in V3.0 to those in V2.0, similar to methods described in Seyednasrollah et al. (2019). We found strong consistency between datasets, with r2 values >98 % and mean absolute errors (MAE) < 2.0 d. There were a small number of individual transition dates (∼ 1 %) between versions that we were unable to align for comparison; this primarily affected sites where ROIs have changed (e.g., FOV mask or time period differs), or in systems where the seasonal amplitude in GCC or the timing or number of seasonal transitions is more variable, such as in arid grasslands or in agricultural sites.
3.2 Comparisons among GCC, cameraNDVI, and broadbandNDVI
We generally found that GCC and cameraNDVI exhibited very similar patterns in canopy greenness (Fig. 4), indicating the capacity of both GCC and cameraNDVI to consistently record variability in phenology. This similarity was apparent across a wide range of ecosystems, from Arctic tundra to deciduous forest ecosystems, as well as shrublands and grasslands. While there was general agreement in seasonal patterns, there were some distinct and important differences as well. As an example, there were several key discrepancies between GCC and cameraNDVI at deciduous broadleaf sites (Figs. 4–5). First, there is no distinct “spike” in spring greenness in early spring in cameraNDVI, a common and notable artefact in GCC caused by bright “greenness” of early season leaves (Keenan et al., 2014) (Fig. 5). Additionally, there is a delay in fall senescence in cameraNDVI relative to GCC, with cameraNDVI exhibiting a more gradual decline in greenness after October; this is presumed to be driven by differences in foliage color (affecting GCC) vs. foliage amount (affecting cameraNDVI) (Wingate et al., 2015). For both reasons, cameraNDVI likely better represents the seasonal dynamics of deciduous forest LAI (leaf area index); but, because GCC and cameraNDVI are indicative of different aspects of phenology (leaf color vs. leaf presence), we believe that the “best” metric will depend on the specific application. In this sense, the two metrics are complementary rather than redundant.
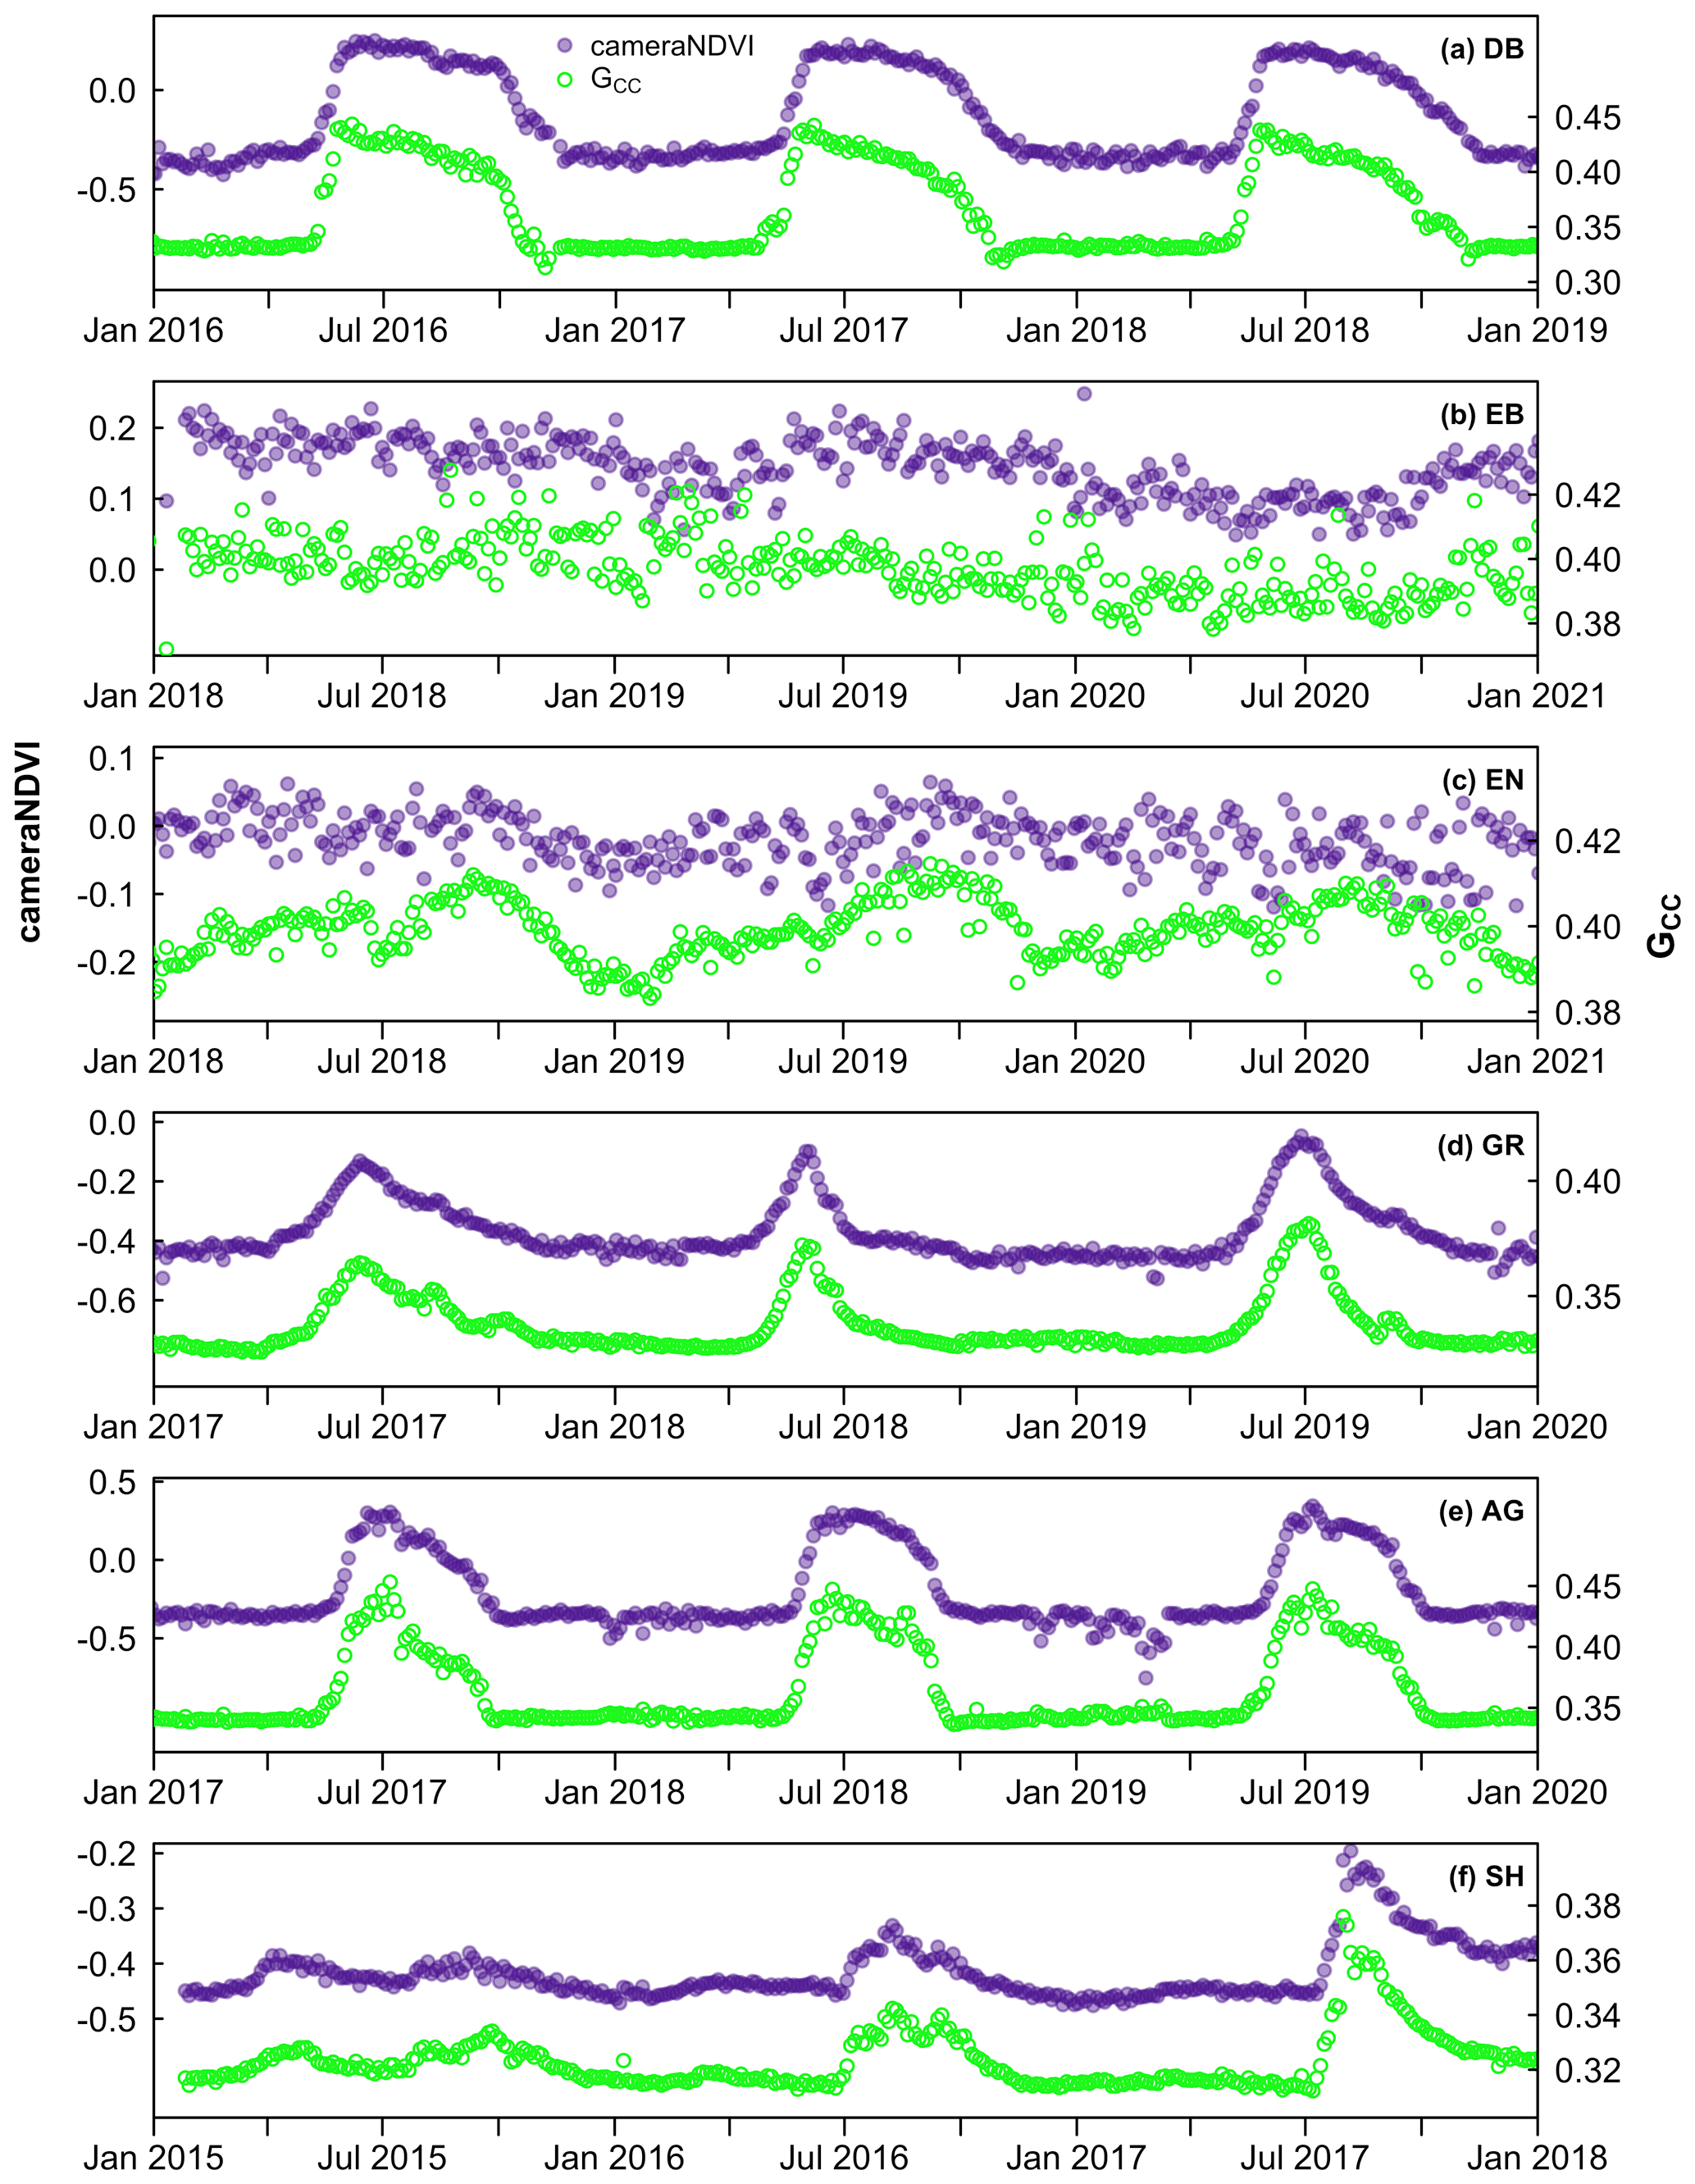
Figure 4Time series comparing cameraNDVI to GCC across a wide range of sites and ecosystems from North America, including (a) a deciduous broadleaf forest at queens, (b) an evergreen broadleaf forest at laupahoehoe, (c) an evergreen needleleaf forest at austincary, (d) a grassland cperuvb, (e) an agricultural site mead1, and (f) a shrubland site luckyhills.
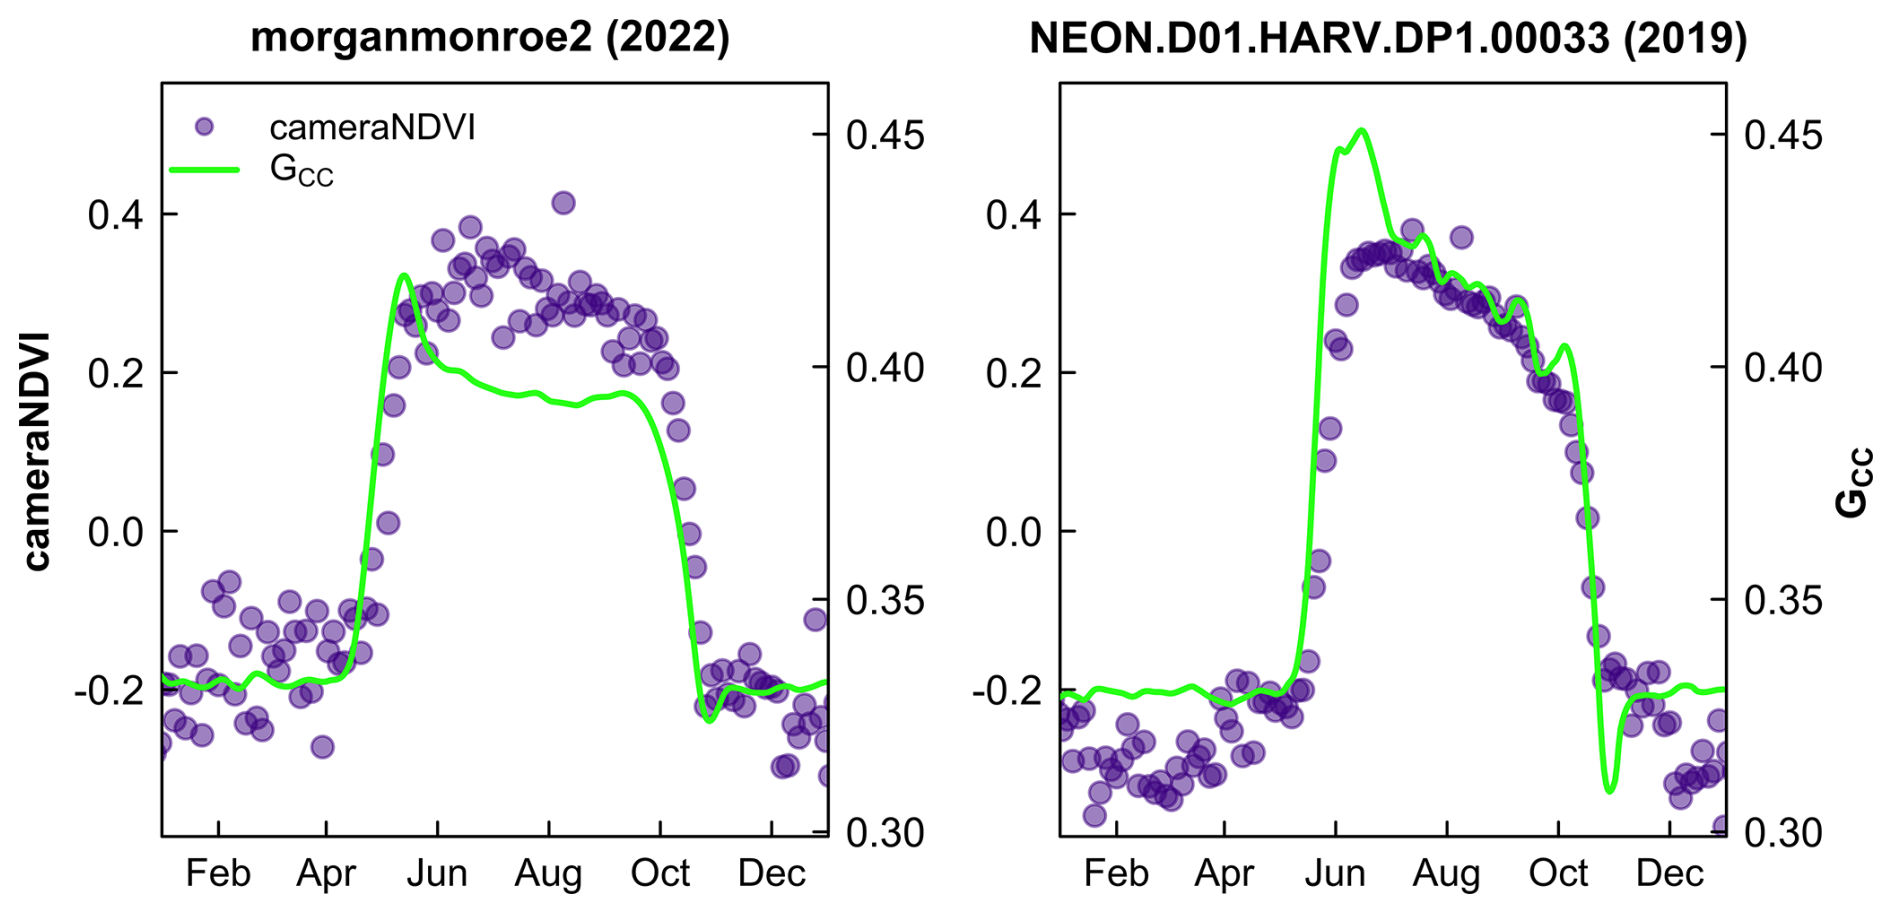
Figure 5Comparison of cameraNDVI and smoothed GCC time series at deciduous broadleaf sites. The early growing season greenness “spike” in GCC is absent from cameraNDVI. Scales on y-axis are equal for both sites.
While there was general agreement in the overall seasonality between cameraNDVI and GCC, we found that in most cases, GCC provided clearer seasonal patterns and time series. For example, GCC provided much more distinct greenness signals in evergreen needleleaf forests relative to cameraNDVI (Fig. 4c). By comparison, an evergreen broadleaf site displayed similar levels of noise for both GCC and cameraNDVI (Fig. 4b). To summarize across all sites, we used a signal-to-noise ratio (SNR) analysis (Fig. 6), where we uncovered consistent evidence that GCC provides clearer seasonal patterns relative to cameraNDVI. Approximately 17 % of all sites had cameraNDVI SNR estimates that were greater than SNR of GCC; in other words, in more than 80 % of cases, GCC provides a less noisy greenness metric for tracking phenology relative to cameraNDVI. When separating this analysis by individual PFTs and Level I Ecoregions, we found similar patterns where cameraNDVI was in general noisier than GCC (Fig. 7). There were a few notable exceptions; in 63 % of all evergreen broadleaf (EB) sites, cameraNDVI had a less noisy signal relative to GCC (Fig. 7c). Shrublands (SH), grasslands (GR), and evergreen needleleaf (EN) forests displayed an opposing pattern compared to EB sites, with only 8 %, 9 %, and 11 % of sites where cameraNDVI was less noisy than GCC, respectively.
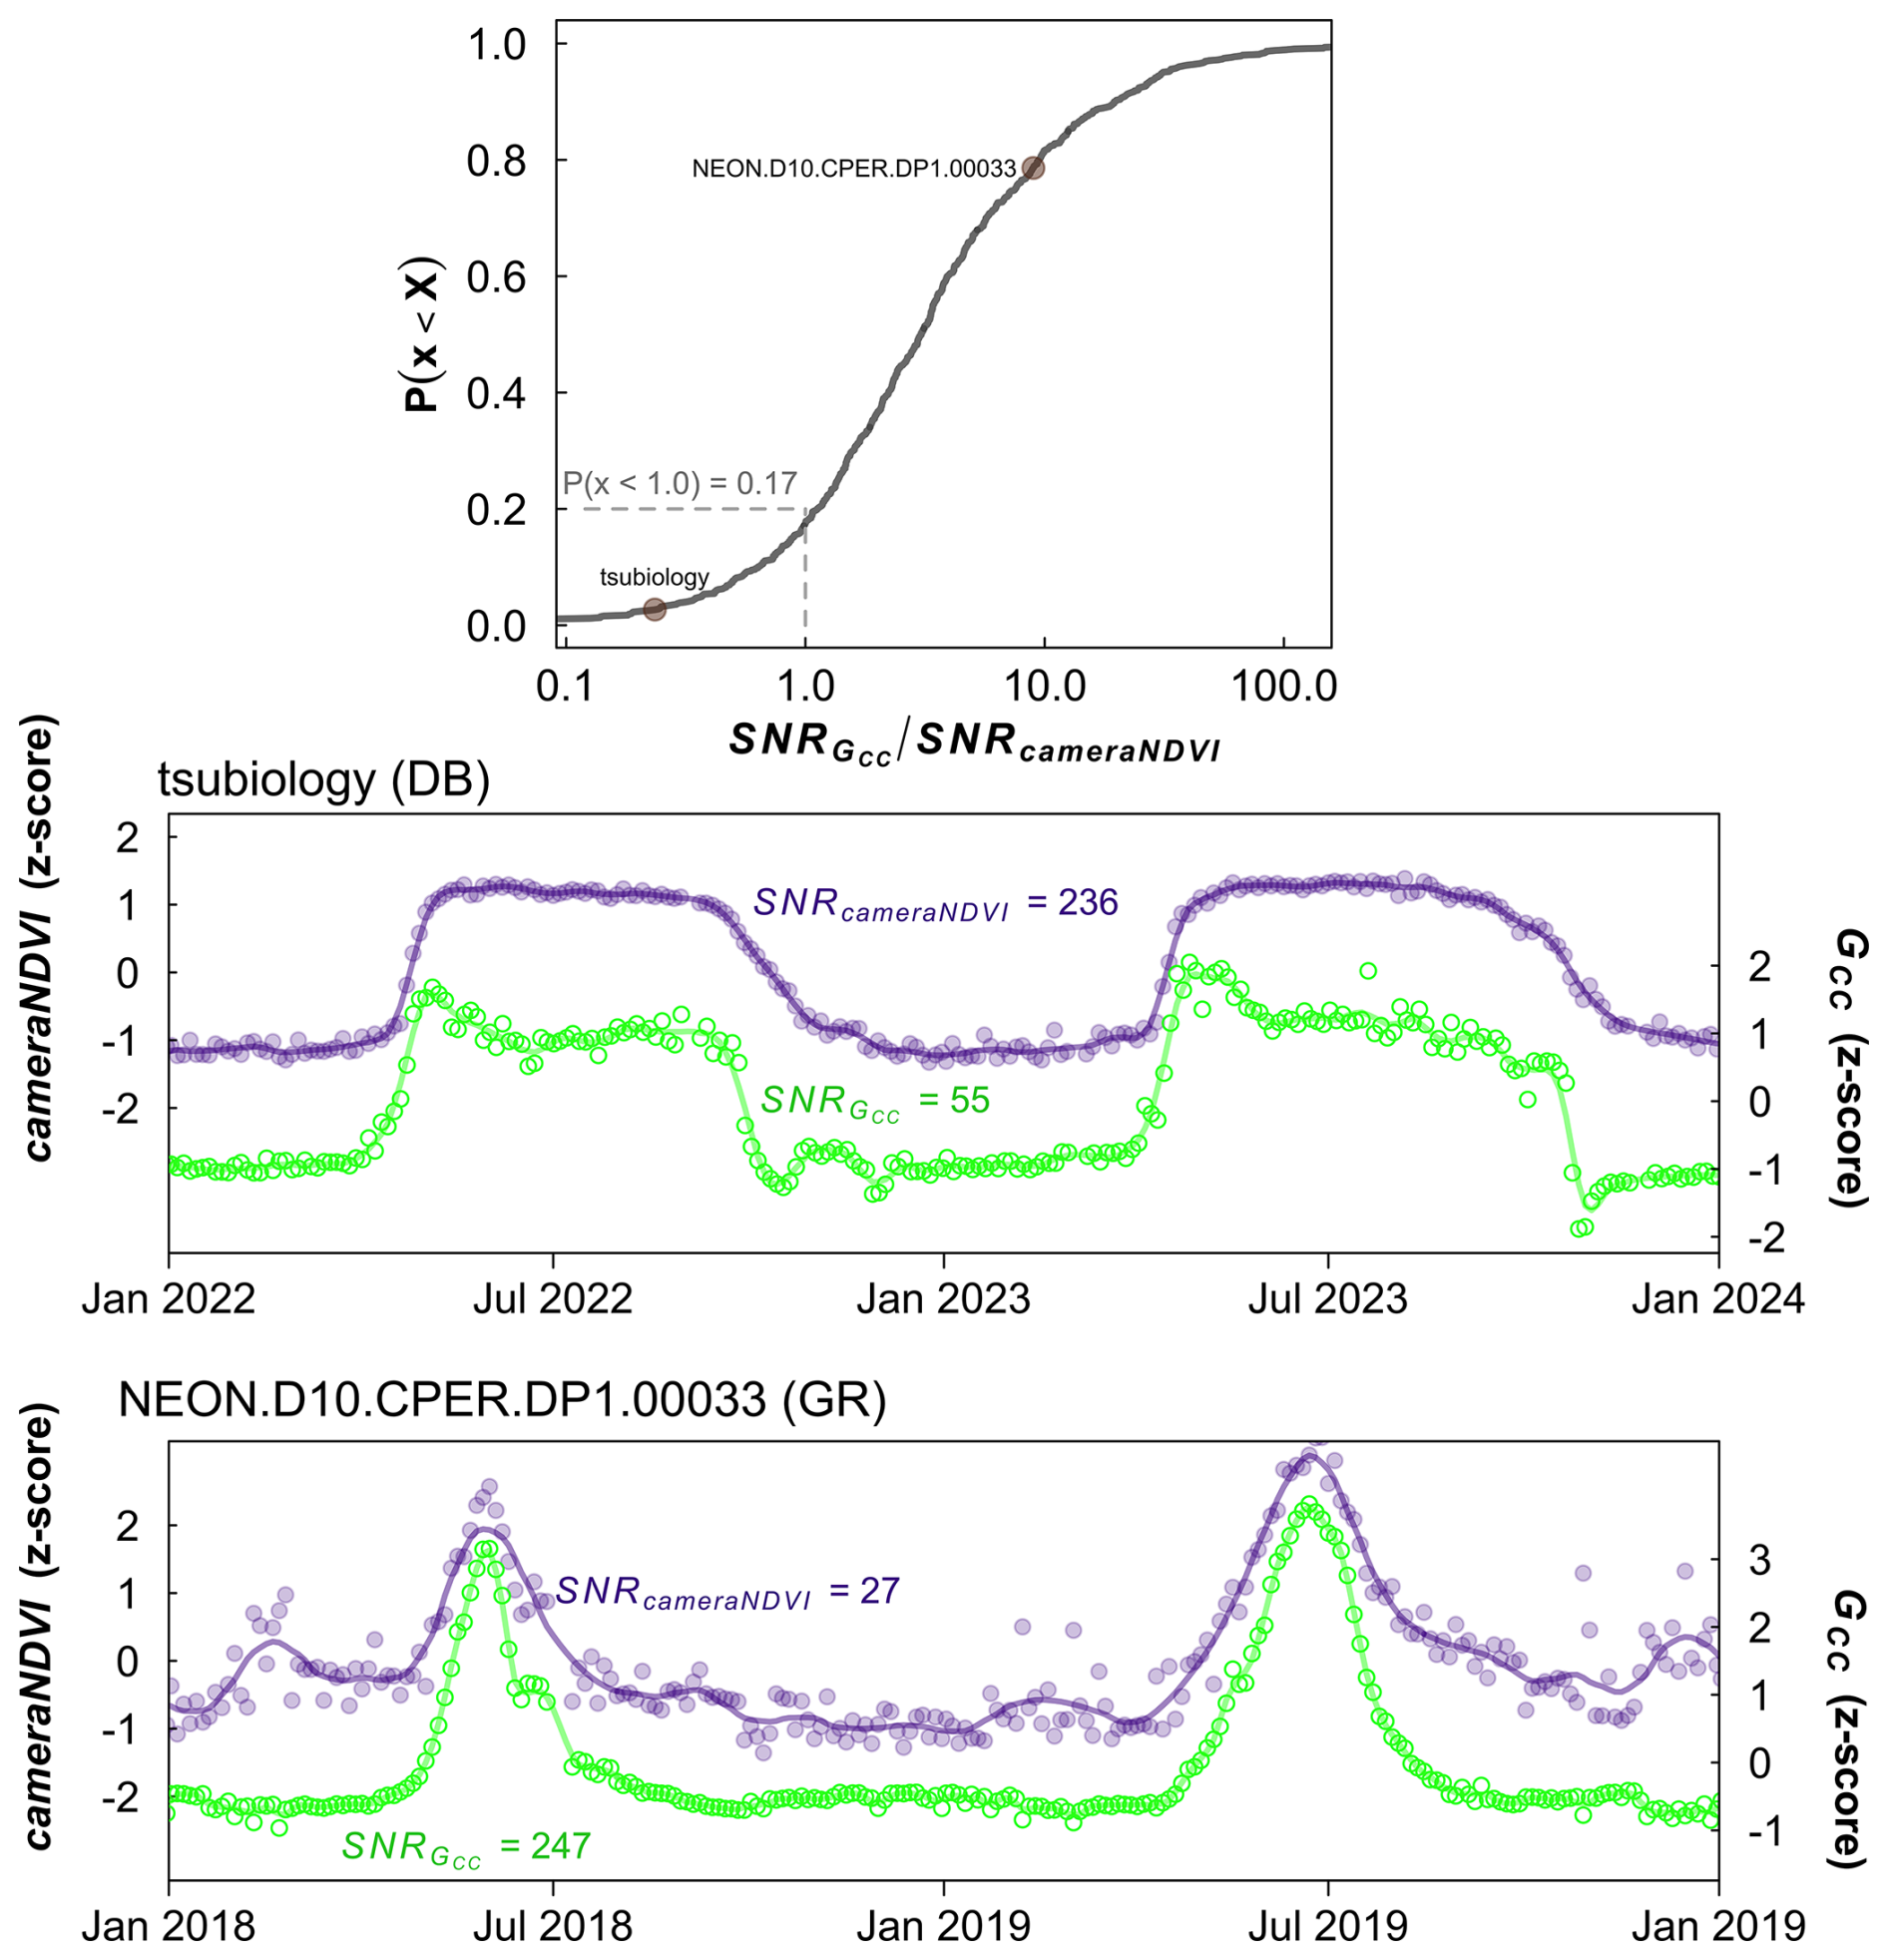
Figure 6Ratio of signal-to-noise ratio (SNR) of GCC to SNR of cameraNDVI. Top most panel shows the cumulative distribution function of the ratio, where values <1 indicate SNR for cameraNDVI is greater than SNR for GCC, meaning less high-frequency variability in the cameraNDVI data and hence a less noisy cameraNDVI time series compared to GCC. By comparison, values > 1 occur when GCC has less high frequency variability than cameraNDVI. From this analysis, SNR of cameraNDVI was higher than that of GCC for approximately 17 % of site-years, whereas SNR of GCC was higher than cameraNDVI for the remaining ∼ 83 % of site-years. The bottom two panels show example time series for a site where SNRDIFF < 1 (tsubiology, deciduous broadleaf, DB) and SNRDIFF >1 (NEON.D10.CPER.DP1.00033, grassland, GR). For tsubiology, SNRGCC SNRcameraNDVI=0.23, and for NEON.D10.CPER.DP1.00033, SNRGCC SNRcameraNDVI=9.14. Both these points are plotted and labeled in the top panel. In both cases, the time series are highly coherent between cameraNDVI and GCC.
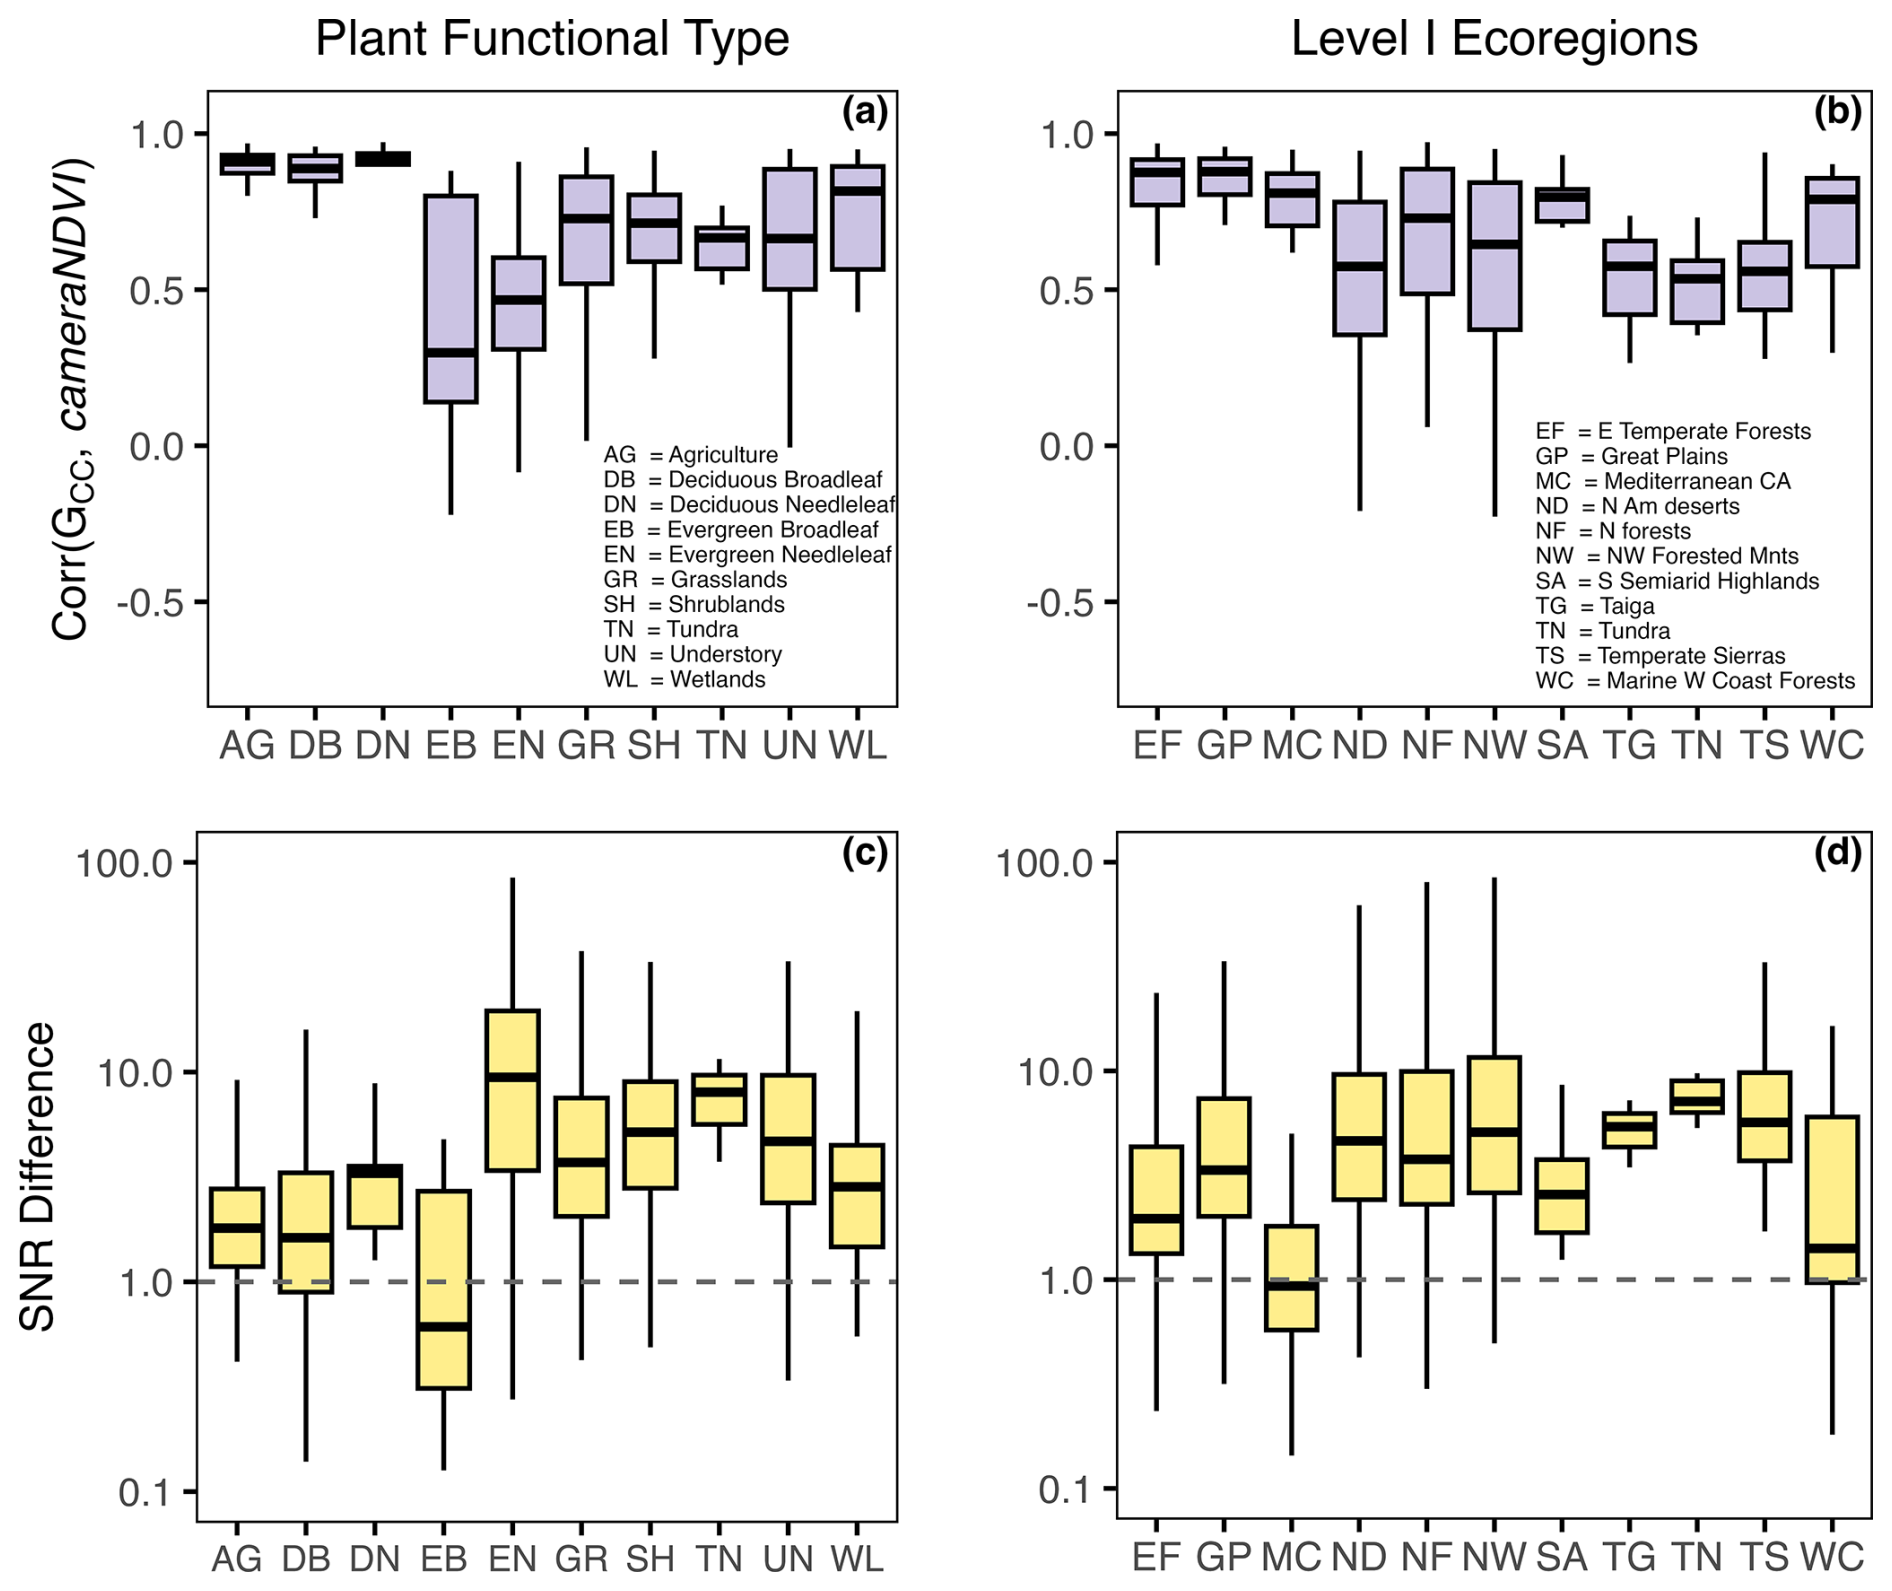
Figure 7Summarizing relationships between GCC and cameraNDVI by vegetation type (i.e., PFT) and Level I Ecoregions. In (a) and (b), the distributions represent the linear correlation between 1 d time series for GCC and cameraNDVI. In (c) and (d), distributions represent the signal-to-noise ratio (i.e., SNR Difference = SNR), where values > 1.0 indicate that GCC has a less noisy or smoother signal.
To bolster our evaluation of cameraNDVI, we further compared it to other reflectance-based measurements of canopy greenness. Specifically, we compared cameraNDVI to broadbandNDVI derived from flux-tower data at NEON sites, which revealed that there is generally a strong seasonal correspondence between the two datasets (Figs. 8, S1–S5). Overall, cameraNDVI appeared to be less noisy than broadbandNDVI, and the clear correlation between these two datasets indicates that cameraNDVI can provide a reliable – and perhaps better – greenness metric that is comparable to other estimates of NDVI. In particular, broadbandNDVI exhibited some large outliers due to snowfall events. At times, broadbandNDVI was highly variable from one day to the next, which is unlikely to be related to changes in canopy structure (Fig. 8). For example, at some sites there appears to be a two-stage increase in early season broadbandNDVI (Fig. 8a, h); in Fig. 8a at Harvard Forest – a deciduous broadleaf site – there is an early shift in broadbandNDVI likely due to initial snowmelt prior to leaf out in the spring. Another example of noisier winter-time periods for broadbandNDVI can be found at Bartlett (a deciduous forest site in New Hampshire, Fig. S1) and in tundra ecosystems of Alaska, such as Toolik (Fig. 8h) and Barrow (Fig. S5). By comparison, cameraNDVI appears to be less sensitive to snow-covered time periods. We further compared cameraNDVI to broadbandNDVI through a Signal-to-Noise Ratio (SNR) analysis at all terrestrial NEON sites, which was practically identical to our SNR analysis between GCC and cameraNDVI (see Sect. 2.3). Through this SNR analysis, we found that cameraNDVI was consistently less noisy at most of the NEON sites investigated (Fig. S6), further supporting our visual evaluation that cameraNDVI is less prone to exhibiting extreme outliers and sensitivity to snow cover in colder regions than broadbandNDVI.
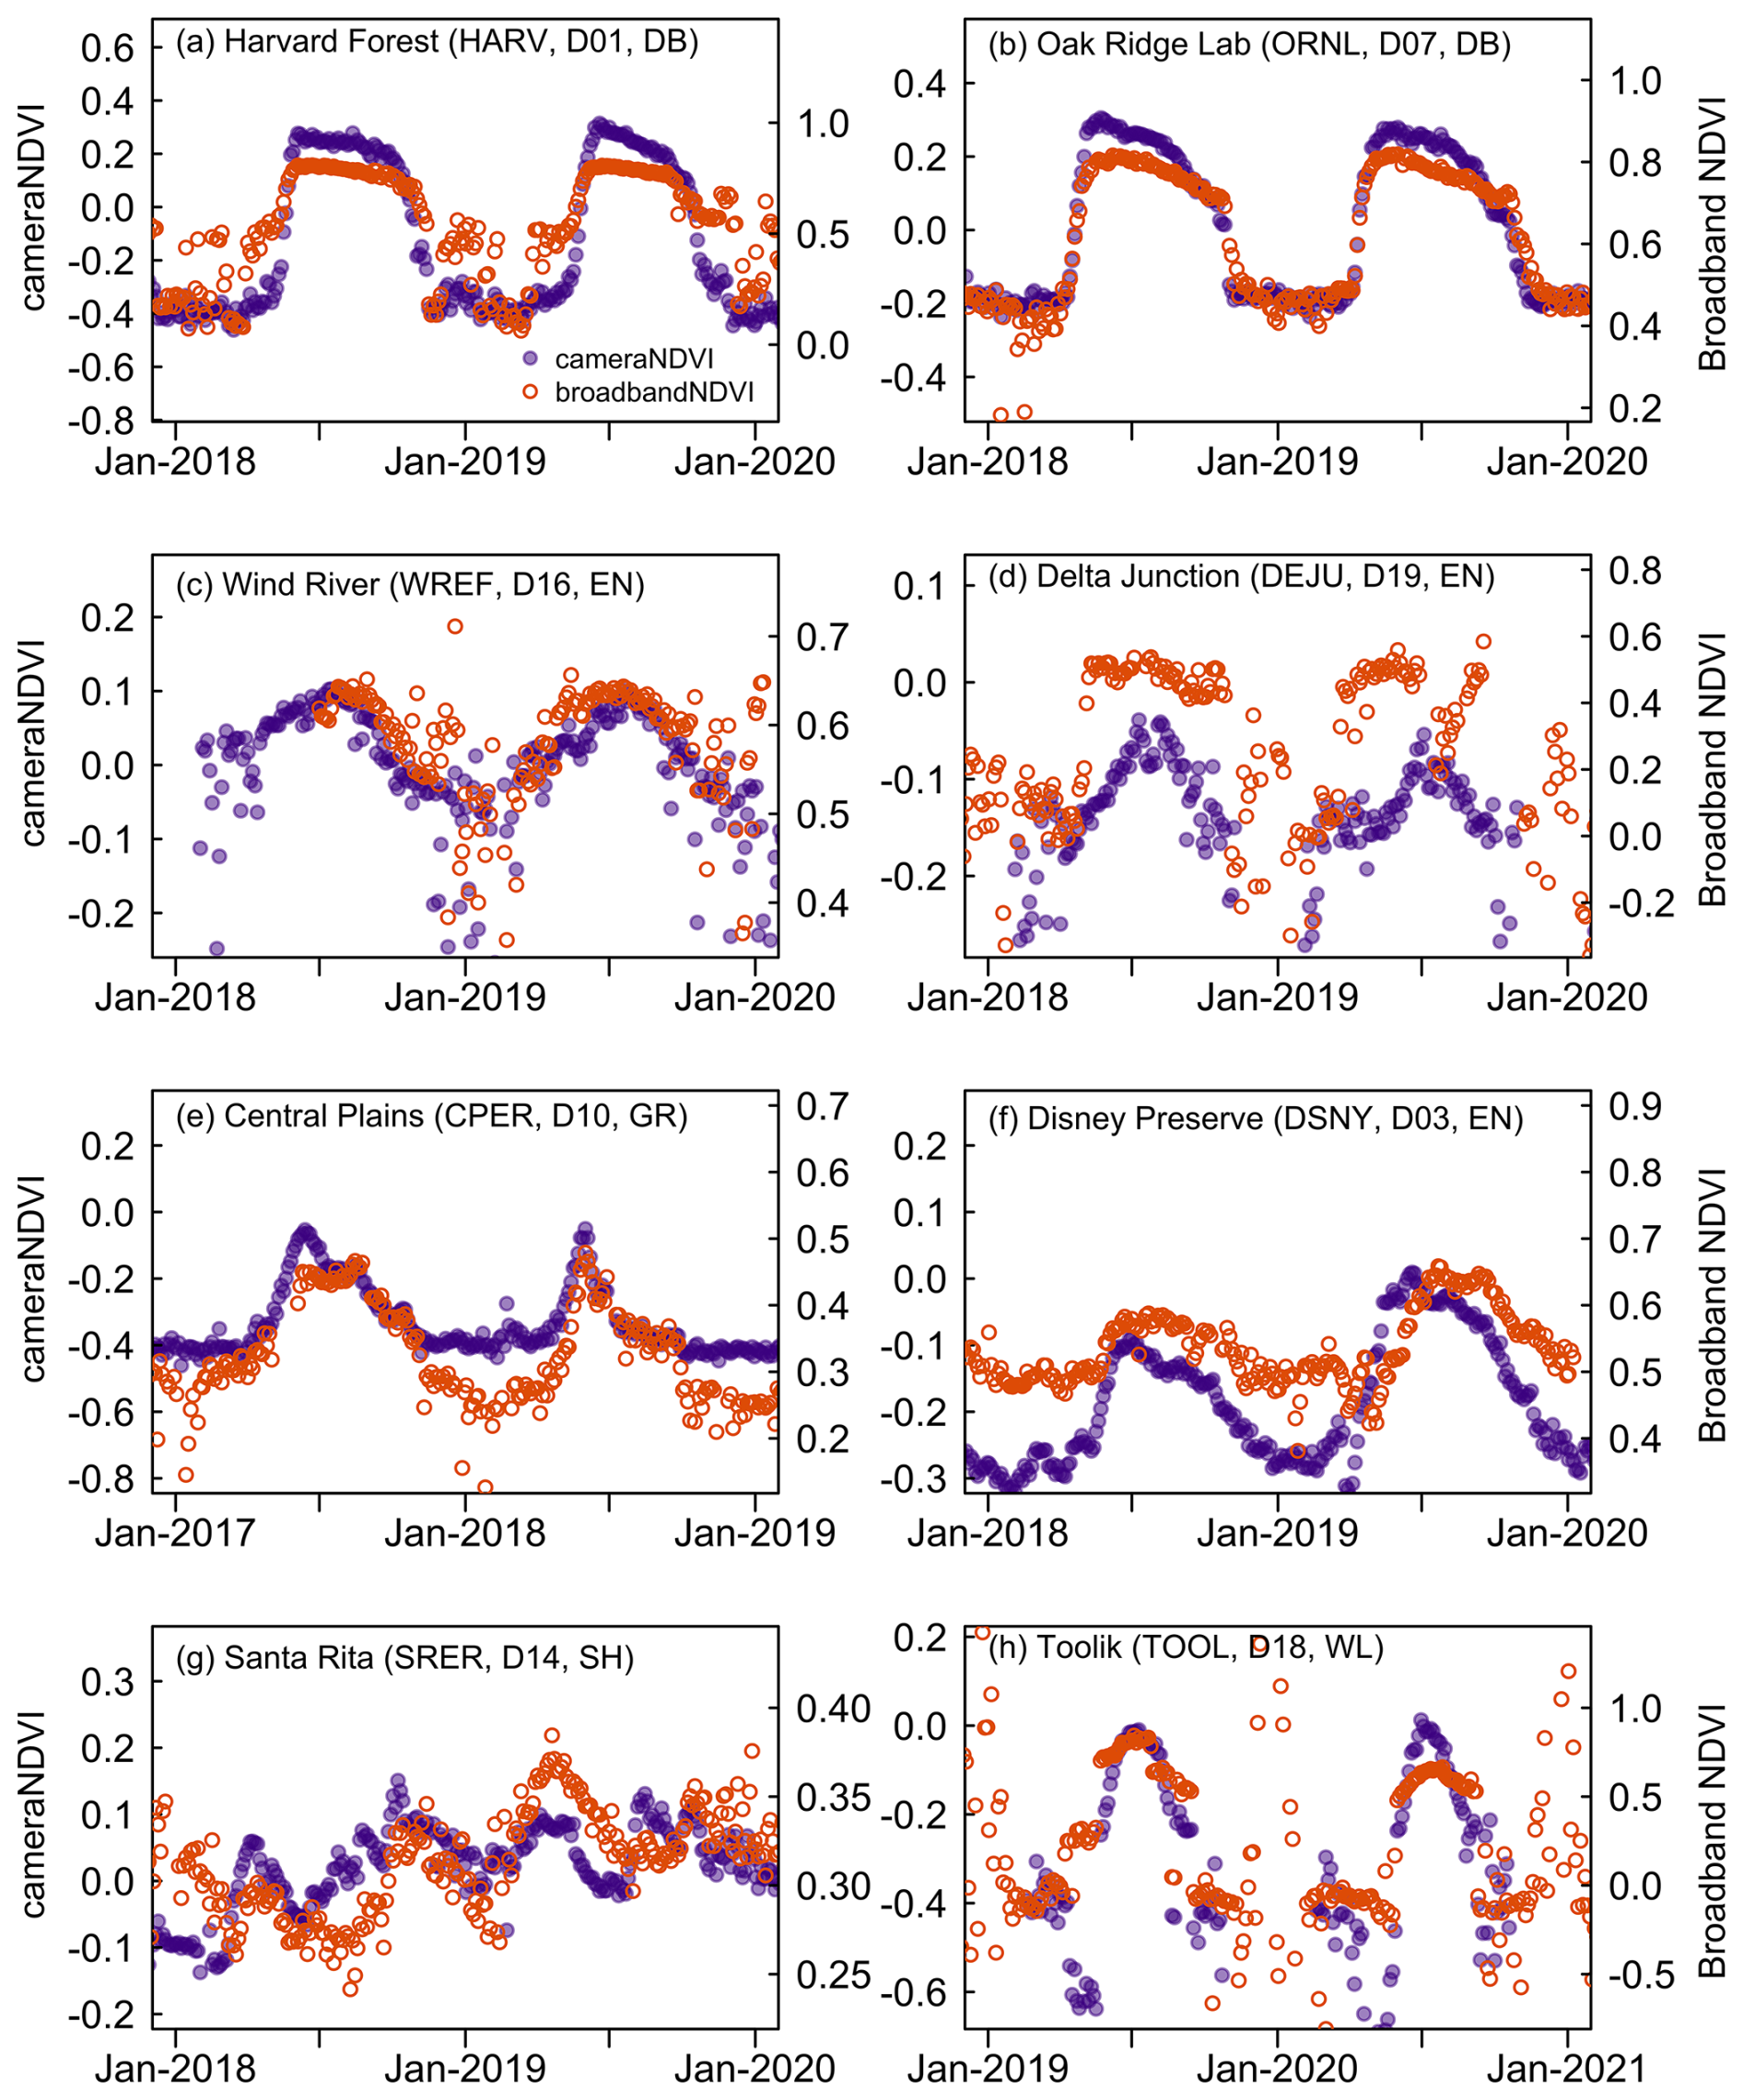
Figure 8Comparing cameraNDVI to broadbandNDVI. NDVI estimates are calculated at co-located NEON towers. Seasonality tends to be better defined in the cameraNDVI data compared to the broadbandNDVI data.
In this descriptor for the public data release of PhenoCam V3.0, we present significant updates to PhenoCam V1.0 and V2.0, published in 2018 and 2019, respectively (Seyednasrollah et al., 2019; Richardson et al., 2018b). In addition to more than doubling the total number of site years (Table 1, Fig. 2), we also significantly increased data availability in previously under-represented plant functional types, such as in forest understory, evergreen broadleaf forests, grasslands, and wetlands (Sect. 3.1). Furthermore, we provide a new PhenoCam data variable: cameraNDVI, a measure of vegetation greenness that is conceptually similar to satellite and flux-tower based estimates of NDVI (Eqs. 1 and 3). To help guide users in applying cameraNDVI for scientific or educational purposes, we present the following discussion points on both the strengths and weaknesses of this new data variable compared to GCC.
Prior to discussing comparisons between GCC and cameraNDVI, we note that cameraNDVI are often negative (i.e., < 0), even during periods with green vegetation in the field-of-view (e.g., Fig. 4f). This is an important distinction when compared to the more common physical interpretations of NDVI derived from satellite remote sensing (Eq. 1). Negative values most likely emerge from the fact that cameraNDVI is calculated from exposure-adjusted pixel intensities, rather than true measures of reflectance. Although intensity has been shown to scale with reflectance for both the R and NIR channels (Petach et al., 2014), the relative magnitude of R vs NIR pixel intensity does not necessarily correspond to the relative magnitude of R vs NIR reflectance. Consequently, while seasonality of cameraNDVI may correctly depict seasonal vegetation dynamics, the absolute magnitude of cameraNDVI may be quite different from standard NDVI products from satellite platforms. To facilitate comparisons across sites, one potential solution is to re-scale cameraNDVI to match the range of satellite NDVI (e.g., MODIS), as suggested by Filippa et al. (2018).
Through extensive tests directly comparing PhenoCam GCC and cameraNDVI, we ultimately found evidence that GCC provides a clearer and less noisy phenological signal of greenness compared to cameraNDVI at most sites (Figs. 6, 7). In general, this more-variable signal in cameraNDVI can be attributed to an increased variance and a higher likelihood of outliers occurring, a consequence of the following factors. First, large outliers can occur in cameraNDVI estimates; in particular, cameraNDVI 0.5 seem to be associated with a stuck infrared (IR) cut filter within the camera. Second, changes in lighting conditions during the calculation of cameraNDVI can cause a noisier signal. Specifically, since cameraNDVI is calculated from two images that are taken approximately 30 s apart (one with IR filter and one without), cameraNDVI is subject to changes in lighting conditions during this 30 s period (e.g., shifting cloud cover affecting incoming solar radiation), ultimately generating a noisier phenology signal relative to GCC. Since GCC is calculated from a single image, it is not sensitive to such changes. Finally, large outliers in cameraNDVI are also due to a higher sensitivity to snow than GCC, leading to noisier data during the winter season, particularly in high-latitude ecosystems (e.g., DEJU and TOOL in Alaska, Fig. 8d, h). However, while GCC provides a less-noisy signal in general, this result is not ubiquitous across all conditions or vegetation types. For example, performance between cameraNDVI and GCC metrics appeared comparable at evergreen broadleaf (EB) sites (Figs. 4b, 7, S7), and using our SNR analysis, we found that at ∼ 55 % of all EB sites cameraNDVI provided a cleaner signal than GCC (Fig. 7). To investigate specific outliers that may be due to snowcover in cameraNDVI, we suggest users visually inspect the image archive for the site in question, which can be browsed by year, month, or day. Imagery for each site is updated daily, and “site pages” can be accessed from the “gallery page” (https://phenocam.nau.edu/webcam/gallery/, last access: 19 November 2025; for more information, see the tutorial on how to access PhenoCam data and imagery, available at https://phenocam.nau.edu/education/PhenoCam_Access_Guide.pdf, last access: 19 November 2025). Furthermore, users can also access the archived imagery, from the ORNL DAAC in Ballou et al. (2025).
While cameraNDVI exhibits several apparent weaknesses as a measure of phenology relative to GCC (i.e., noisier signal, higher sensitivity to snowcover), there are some key advantages that cameraNDVI may offer. First, cameraNDVI is more representative of seasonal LAI in deciduous broadleaf forest sites than GCC. In particular, there is no distinct spring “spike” in cameraNDVI (Fig. 5) (Keenan et al., 2014). Second, senescence derived from cameraNDVI is also delayed relative to GCC at the end of the growing season, such as in deciduous forests, likely representing changes in LAI rather than leaf color (Filippa et al., 2018). Similarly, at grassland sites, we found that the seasonal patterns of cameraNDVI are quite similar to GCC, except cameraNDVI appears to decline more slowly in senescing grasslands because LAI remains high even if foliage is no longer green (e.g., Figs. 4d, 6). Finally, while cameraNDVI is not calculated directly from reflectance values – and therefore the absolute magnitude is not directly comparable to other NDVI measurements – cameraNDVI appears to give a cleaner phenology signal relative to flux-tower derived broadbandNDVI (Figs. 8, S1–S5). We encourage data users to view cameraNDVI as complementary to, but not a substitute for, GCC; each index – with their own inherent strengths and weaknesses – can provide unique information about different aspects of canopy development and changes in structure.
Through standardized data collection and processing protocols, as well as the continually growing size of the network, PhenoCam data products offer a powerful tool to study vegetation phenology in almost any terrestrial biome (Richardson et al., 2013; Richardson, 2023). As with any environmental data product, there are key strengths and caveats that users must consider. First and foremost, PhenoCam GCC captures changes in leaf pigmentation and canopy color, which frequently aligns very closely with photosynthetic phenology (Bowling et al., 2018; Keenan et al., 2014), and can also provide clear and consistent estimates of phenological transitions (Richardson et al., 2019; Dunn et al., 2022). However, as discussed in the previous paragraph, GCC is less capable of capturing changes in canopy structure and LAI; by comparison, the new cameraNDVI product appears to offer a better measure of canopy structure. Furthermore, GCC is relative at each site; individual sites are influenced by both the color of foliage and the amount of background visible through the canopy, leading to variability when comparing the magnitude of GCC values between sites. Finally, one of the most important strengths of PhenoCam is the standardized collection and data processing of repeat imagery from across the observatory. This standardization is critical for multiple reasons: (1) it produces a consistent visual record of site and environmental conditions, (2) it allows the monitoring of fine-scale or short-term changes in vegetation (e.g., Knox et al., 2017; Hufkens et al., 2012), (3) provides a framework for conducting regional-continental scale syntheses and evaluation of satellite remote sensing products (e.g., Young et al., 2022; Moon et al., 2019; Bolton et al., 2020), and (4) the scale and footprint of PhenoCam data are well aligned with other near-surface ecological datasets, such as eddy covariance towers (e.g., Oishi et al., 2018; Desai et al., 2022; Liu et al., 2025), thermal cameras (e.g., Javadian et al., 2024), SIF (e.g., Zhang et al., 2023; Magney et al., 2019), and LiDAR (e.g., Musinsky et al., 2022). To date, by leveraging the strengths of standardized processing routines and community engagement, PhenoCam data products have been cited and used in approximately 500 publications over the last 17 years (Richardson and Javadian, 2025).
Data are free and publicly available for download from the Oak Ridge National Lab Distributed Active Archive Center (ORNL DAAC; https://daac.ornl.gov, last access: 19 November 2025):
-
Digital Camera Imagery from the PhenoCam Network, 2000–2023: https://doi.org/10.3334/ORNLDAAC/2364 (Ballou et al., 2025)
-
Vegetation Phenology from Digital Camera Imagery, 2000–2023: https://doi.org/10.3334/ORNLDAAC/2389 (Zimmerman et al., 2025)
Here, we present an updated version of the PhenoCam public data release (Version 3.0). PhenoCam V3.0 significantly expands the total number of site-years from 1783 in V2.0 to 4805.5 in V3.0. As with past releases, the imagery and time series data have been quality-checked and controlled by a team of PhenoCam experts and data managers, and all data and underlying imagery are freely and openly available. This version includes substantial updates to previously under-represented plant functional types, including evergreen broadleaf forests, grassland and agricultural sites, and understory vegetation (Table 1). In addition to this expansion in available phenology data, we also include updates to the published Data Records. Specifically, we now include cameraNDVI, a metric of phenology that is based on infrared camera imagery and provides a more direct comparison to other reflectance-based measures of NDVI, such as from satellites and or flux towers, relative to GCC. Finally, the new simplified time series and transition date data products included in the published PhenoCam Data Records should aid many users in both educational and basic research applications.
Supplemental figures and tables that accompany this data descriptor are provided in the Supplement Sect. S1. The supplement related to this article is available online at https://doi.org/10.5194/essd-17-6531-2025-supplement.
ADR initiated the PhenoCam network, obtained funding to develop and support the network, designed the observational protocol, and proposed the format of the standardized data sets. ADR and MAF oversaw project development. AMY led the efforts to draft this Data Descriptor with contributions from ADR. TM, KH, KLB, and MF contributed to systems design, development of processing routines, and management and maintenance of cyberinfrastructure. CC, KB, MJ, AKP, CS, ZV, OZ, BS and MM contributed to dataset development, processing and curation, and evaluation and application. DMB, CRF, and MDS contributed to network development and cross-network collaboration. All authors reviewed and approved the content of this Data Descriptor.
The contact author has declared that none of the authors has any competing interests.
The views and conclusions contained in this document are those of the authors and should not be interpreted as representing the opinions or policies of the U.S. Geological Survey or the National Science Foundation. Mention of trade names or commercial products does not constitute their endorsement by the U.S. Geological Survey or the National Science Foundation.
Publisher’s note: Copernicus Publications remains neutral with regard to jurisdictional claims made in the text, published maps, institutional affiliations, or any other geographical representation in this paper. While Copernicus Publications makes every effort to include appropriate place names, the final responsibility lies with the authors. Views expressed in the text are those of the authors and do not necessarily reflect the views of the publisher.
We thank our many collaborators, including site PIs and technicians, for their efforts in support of PhenoCam. Development and maintenance of the PhenoCam Network archive has been supported by the National Science Foundation, the Long-Term Agroecosystem Research (LTAR) network which is supported by the United States Department of Agriculture (USDA), the U.S. Department of Energy, the U.S. Geological Survey, the Northeastern States Research Cooperative, and the USA National Phenology Network.
The National Ecological Observatory Network is a program sponsored by the National Science Foundation and operated under cooperative agreement by Battelle. This material is based in part upon work supported by the National Science Foundation through the NEON Program.
Funding for the AmeriFlux data portal was provided by the U.S. Department of Energy Office of Science.
This paper was edited by Birgit Heim and reviewed by two anonymous referees.
Ballou, K., Vladich, Z., Young, A. M., Milliman, T., Hufkens, K., Coffey, C., Begay, K., Fell, M., Javadian, M., Post, A. K., Schädel, C., Zimmerman, O., Browning, D. M., Florian, C. R., Friedl, M. A., Moon, M., SanClements, M. D., Seyednasrollah, B., Richardson, A. D., Abraha, M., Alber, M., Allen, D. W., Apple, M., Arain, M. A., Axel, A. C., Badiou, P. H. J., Bahn, M., Baker, J., Baldocchi, D., Bayliss, S. L. J., Behrens, N., Beier, C. M., Bernacchi, C. J., Berveiller, D., Bhattacharjee, J., Biraud, S. C., Blais, J. J., Blanken, P., Bonfim, M., Bosch, D. D., Boughton, R., Boughton, E. H., Brown, R. F., Brunsell, N., Burns, S. P., Carbone, M. S., Carlson, B. R., Carrara, A., Cavagna, M., Chan, W. S., Chen, J., Christen, A., Chrysoulakis, N., Chu, H., Clark, P. E., Conrad, B. J., Cortese, M. R., Crandall, R. M., Cremonese, E., Crepaz, H., Davis, F. W., Debinski, D., Desai, A. R., Detto, M., Diaz-Delgado, R., Duchesne, L., Dunn, A. L., Easterday, K. J., Eissenstat, D. M., El-Madany, T., Ellum, D. S. S., Ernest, S. K. M., Esposito, A., Euskirchen, E. S., Fenstermaker, L., Filchev, L. F., Fill, J. M., Flanagan, L. B., Forsythe, B., Frank, J. M., Freestone, A. L., Gallagher, J., García, M. B., García-Díaz, D., Gharun, M., Gianelle, D., Gonet, J. M., Goslee, S. C., Griffis, T., Groffman, P., Gu, L., Guillemot, J., Halm, I. M., Halpin, M., Hammerle, A., Hanson, C. V., Hanson, P. J., Harlow, Z., Hart, K. M., Hatch, C. E., Heinrich, P. L., Hemming, D., Heskel, M., Hill, A. C., Hove, A. A., Hübner, T., Hui, D., Humphreys, E. R., Inkenbrandt, P. C., Jaimes-Hernandez, A., Jensen, R., Johnson, B. G., Johnson, J. M. F., Joseph, L. S. K., Keel, E., Kelly, V. R., King, K. W., Kirchner, J. W., Kirchner, P. B., Kline, M. A., Knox, S. H., Krassovski, M., Ladig, K. L., Lærke, P. E., Langvall, O., Lany, N. K., Lanthier, G., le Maire, G., Liu, H., López Jiménez, R., Luo, Y. P., Manco, A., Marrs, J., Martin, T. A., Mauritz, M., McCarty, G., McNeil, B., Meier, F., Mensinger, M., Meyer, G. A., Migliavacca, M., Miura, T., Mohanty, B. P., Moore, C. E., Mudd, R., Munger, J. W., Murrell, Z. E., Nesic, Z., Neufeld, H. S., Norris, J., O'Connell, J., O'Halloran, T. L., Oechel, W., Oishi, A. C., Oryan, B., Oswald, W. W., Peltier, D. M. P., Perez-Quezada, J., Perkins, T. D., Phillips, C., Pizarro, M., Poursanidis, D., Pullens, J. W. M., Ramanamandimby, P., Rao, M. P., Ray, R. L., Reba, M. L., Redmond, C., Reinmann, A. B., Roberts, D. A., Robertson, G. P., Rodriguez-Caton, M., Rumora, K. R., Rundquist, B. C., Runkle, B. R. K., Sachs, T., Sadler, E. J., Saha, A., Saliendra, N. Z., Sankey, T. S., Scheifinger, H., Schmalbeck, L., Schuppenhauer, M. R., Schwartz, M. D., Scott, R. L., Sebestyen, S. D., Smale, D., Smith, E. M., Smith, J., Sonnentag, O., Stoy, P., Strachan, S., Suvocarev, K., Szutu, D., Tekinay, F., Thom, J. E., Thomas, R. Q., Trauernicht, C., Trejo, D., Tsirantonakis, D., Valero, A., Van den berg, A. K., Van der Molen, M. K., Vargas, R., Vellend, M., Verfaillie, J., Vogel, C. S., Vrieling, A., Walker, J. J., Ward, J. R., Watts, D. A., Webb, N., Wetzel, P., Weyers, S., Whipple, A. V., Whippo, C. W., White, W. A., Whitham, T. G., Wille, C., Wingler, A., Wohlfahrt, G., Wolf, S., Wood, J. D., Woodley, A. L., Yang, J., Yang, X., Yenni, G., Zambrano-olimpo, A. J., Zandonai, A., Zhang, Y., and Zona, D.: PhenoCam Dataset v3.0: Digital Camera Imagery from the PhenoCam Network, 2000–2023 (version 3), ORNL Distributed Active Archive Center [dataset], https://doi.org/10.3334/ORNLDAAC/2364, 2025.
Blanken, P. D. and Black, T. A.: The canopy conductance of a boreal aspen forest, Prince Albert National Park, Canada, Hydrological Processes, 18, 1561-1578, https://doi.org/10.1002/hyp.1406, 2004.
Bolton, D. K., Gray, J. M., Melaas, E. K., Moon, M., Eklundh, L., and Friedl, M. A.: Continental-scale land surface phenology from harmonized Landsat 8 and Sentinel-2 imagery, Remote Sensing of Environment, 240, 111685, https://doi.org/10.1016/j.rse.2020.111685, 2020.
Bórnez, K., Richardson, A. D., Verger, A., Descals, A., and Peñuelas, J.: Evaluation of VEGETATION and PROBA-V Phenology Using PhenoCam and Eddy Covariance Data, Remote Sensing, 12, 3077, https://doi.org/10.3390/rs12183077, 2020.
Bowling, D. R., Logan, B. A., Hufkens, K., Aubrecht, D. M., Richardson, A. D., Burns, S. P., Anderegg, W. R. L., Blanken, P. D., and Eiriksson, D. P.: Limitations to winter and spring photosynthesis of a Rocky Mountain subalpine forest, Agricultural and Forest Meteorology, 252, 241–255, https://doi.org/10.1016/j.agrformet.2018.01.025, 2018.
Brown, L. A., Dash, J., Ogutu, B. O., and Richardson, A. D.: On the relationship between continuous measures of canopy greenness derived using near-surface remote sensing and satellite-derived vegetation products, Agricultural and Forest Meteorology, 247, 280–292, https://doi.org/10.1016/j.agrformet.2017.08.012, 2017.
Brown, T. B., Hultine, K. R., Steltzer, H., Denny, E. G., Denslow, M. W., Granados, J., Henderson, S., Moore, D., Nagai, S., SanClements, M., Sánchez-Azofeifa, A., Sonnentag, O., Tazik, D., and Richardson, A. D.: Using phenocams to monitor our changing Earth: toward a global phenocam network, Frontiers in Ecology and the Environment, 14, 84–93, https://doi.org/10.1002/fee.1222, 2016.
Cao, M., Sun, Y., Jiang, X., Li, Z., and Xin, Q.: Identifying Leaf Phenology of Deciduous Broadleaf Forests from PhenoCam Images Using a Convolutional Neural Network Regression Method, Remote Sensing, 13, 2331, https://doi.org/10.3390/rs13122331, 2021.
Desai, A. R., Murphy, B. A., Wiesner, S., Thom, J., Butterworth, B. J., Koupaei-Abyazani, N., Muttaqin, A., Paleri, S., Talib, A., Turner, J., Mineau, J., Merrelli, A., Stoy, P., and Davis, K.: Drivers of Decadal Carbon Fluxes Across Temperate Ecosystems, Journal of Geophysical Research: Biogeosciences, 127, e2022JG007014, https://doi.org/10.1029/2022JG007014, 2022.
Dunn, R. J. H., Aldred, F., Gobron, N., Miller, J. B., Willett, K. M., Ades, M., Adler, R., Allan, R. P., Anderson, J., Anneville, O., Aono, Y., Argüez, A., Arosio, C., Augustine, J. A., Azorin-Molina, C., Barichivich, J., Basu, A., Beck, H. E., Bellouin, N., Benedetti, A., Blagrave, K., Blenkinsop, S., Bock, O., Bodin, X., Bosilovich, M. G., Boucher, O., Bove, G., Buechler, D., Buehler, S. A., Carrea, L., Chang, K.-L., Christiansen, H. H., Christy, J. R., Chung, E.-S., Ciasto, L. M., Coldewey-Egbers, M., Cooper, O. R., Cornes, R. C., Covey, C., Cropper, T., Crotwell, M., Cusicanqui, D., Davis, S. M., de Jeu, R. A. M., Degenstein, D., Delaloye, R., Donat, M. G., Dorigo, W. A., Durre, I., Dutton, G. S., Duveiller, G., Elkins, J. W., Estilow, T. W., Fedaeff, N., Fereday, D., Fioletov, V. E., Flemming, J., Foster, M. J., Frith, S. M., Froidevaux, L., Füllekrug, M., Garforth, J., Garg, J., Gentry, M., Goodman, S., Gou, Q., Granin, N., Guglielmin, M., Hahn, S., Haimberger, L., Hall, B. D., Harris, I., Hemming, D. L., Hirschi, M., Ho, S.-P., Holzworth, R., Hrbáček, F., Hubert, D., Hulsman, P., Hurst, D. F., Inness, A., Isaksen, K., John, V. O., Jones, P. D., Junod, R., Kääb, A., Kaiser, J. W., Kaufmann, V., Kellerer-Pirklbauer, A., Kent, E. C., Kidd, R., Kim, H., Kipling, Z., Koppa, A., L'Abée-Lund, J. H., Lan, X., Lantz, K. O., Lavers, D., Loeb, N. G., Loyola, D., Madelon, R., Malmquist, H. J., Marszelewski, W., Mayer, M., McCabe, M. F., McVicar, T. R., Mears, C. A., Menzel, A., Merchant, C. J., Miralles, D. G., Montzka, S. A., Morice, C., Mösinger, L., Mühle, J., Nicolas, J. P., Noetzli, J., Nõges, T., Noll, B., O'Keefe, J., Osborn, T. J., Park, T., Pellet, C., Pelto, M. S., Perkins-Kirkpatrick, S. E., Phillips, C., Po-Chedley, S., Polvani, L., Preimesberger, W., Price, C., Pulkkanen, M., Rains, D. G., Randel, W. J., Rémy, S., Ricciardulli, L., Richardson, A. D., Robinson, D. A., Rodell, M., Rodríguez-Fernández, N. J., Rosenlof, K. H., Roth, C., Rozanov, A., Rutishäuser, T., Sánchez-Lugo, A., Sawaengphokhai, P., Schenzinger, V., Schlegel, R. W., Schneider, U., Sharma, S., Shi, L., Simmons, A. J., Siso, C., Smith, S. L., Soden, B. J., Sofieva, V., Sparks, T. H., Stackhouse, P. W., Stauffer, R., Steinbrecht, W., Steiner, A. K., Stewart, K., Stradiotti, P., Streletskiy, D. A., Telg, H., Thackeray, S. J., Thibert, E., Todt, M., Tokuda, D., Tourpali, K., Tye, M. R., van der A, R., van der Schalie, R., van der Schrier, G., van der Vliet, M., van der Werf, G. R., van Vliet, A., Vernier, J.-P., Vimont, I. J., Virts, K., Vivero, S., Vömel, H., Vose, R. S., Wang, R. H. J., Weber, M., Wiese, D., Wild, J. D., Williams, E., Wong, T., Woolway, R. I., Yin, X., Yuan, Y., Zhao, L., Zhou, X., Ziemke, J. R., Ziese, M., and Zotta, R. M.: Global Climate, Bulletin of the American Meteorological Society, 103, S11–S142, https://doi.org/10.1175/BAMS-D-22-0092.1, 2022.
Fick, S. E. and Hijmans, R. J.: WorldClim 2: new 1 km spatial resolution climate surfaces for global land areas, International Journal of Climatology, 37, 4302-4315, https://doi.org/10.1002/joc.5086, 2017.
Filippa, G., Cremonese, E., Migliavacca, M., Galvagno, M., Sonnentag, O., Humphreys, E., Hufkens, K., Ryu, Y., Verfaillie, J., Morra di Cella, U., and Richardson, A. D.: NDVI derived from near-infrared-enabled digital cameras: Applicability across different plant functional types, Agricultural and Forest Meteorology, 249, 275–285, https://doi.org/10.1016/j.agrformet.2017.11.003, 2018.
Huemmrich, K. F., Black, T. A., Jarvis, P. G., McCaughey, J. H., and Hall, F. G.: High temporal resolution NDVI phenology from micrometeorological radiation sensors, Journal of Geophysical Research: Atmospheres, 104, 27935–27944, https://doi.org/10.1029/1999JD900164, 1999.
Hufkens, K., Friedl, M. A., Keenan, T. F., Sonnentag, O., Bailey, A., O'Keefe, J., and Richardson, A. D.: Ecological impacts of a widespread frost event following early spring leaf-out, Global Change Biology, 18, 2365-2377, https://doi.org/10.1111/j.1365-2486.2012.02712.x, 2012.
Hufkens, K., Keenan, T. F., Flanagan, L. B., Scott, R. L., Bernacchi, C. J., Joo, E., Brunsell, N. A., Verfaillie, J., and Richardson, A. D.: Productivity of North American grasslands is increased under future climate scenarios despite rising aridity, Nature Climate Change, 6, 710, https://doi.org/10.1038/nclimate2942, 2016.
Hufkens, K., Basler, D., Milliman, T., Melaas, E. K., and Richardson, A. D.: An integrated phenology modelling framework in R, Methods in Ecology and Evolution, 9, 1276–1285, https://doi.org/10.1111/2041-210x.12970, 2018.
Javadian, M., Scott, R. L., Woodgate, W., Richardson, A. D., Dannenberg, M. P., and Smith, W. K.: Canopy temperature dynamics are closely aligned with ecosystem water availability across a water- to energy-limited gradient, Agricultural and Forest Meteorology, 357, 110206, https://doi.org/10.1016/j.agrformet.2024.110206, 2024.
Javadian, M., Salgado-Castillo, F., Hufkens, K., and Richardson, A. D.: Continuity in phenological monitoring: Assessing the performance of an updated PhenoCam, Agricultural and Forest Meteorology, 373, 110774, https://doi.org/10.1016/j.agrformet.2025.110774, 2025.
Jenkins, J. P., Richardson, A. D., Braswell, B. H., Ollinger, S. V., Hollinger, D. Y., and Smith, M. L.: Refining light-use efficiency calculations for a deciduous forest canopy using simultaneous tower-based carbon flux and radiometric measurements, Agricultural and Forest Meteorology, 143, 64–79, https://doi.org/10.1016/j.agrformet.2006.11.008, 2007.
Jeong, S. J., Ho, C. H., Gim, H. J., and Brown, M. E.: Phenology shifts at start vs. end of growing season in temperate vegetation over the Northern Hemisphere for the period 1982–2008, Global Change Biology, 17, 2385–2399, https://doi.org/10.1111/j.1365-2486.2011.02397.x, 2011.
Jolly, W. M., Nemani, R., and Running, S. W.: A generalized, bioclimatic index to predict foliar phenology in response to climate, Global Change Biology, 11, 619–632, https://doi.org/10.1111/j.1365-2486.2005.00930.x, 2005.
Keenan, T. F., Darby, B., Felts, E., Sonnentag, O., Friedl, M. A., Hufkens, K., O'Keefe, J., Klosterman, S., Munger, J. W., Toomey, M., and Richardson, A. D.: Tracking forest phenology and seasonal physiology using digital repeat photography: a critical assessment, Ecological Applications, 24, 1478–1489, https://doi.org/10.1890/13-0652.1, 2014.
Klosterman, S. T., Hufkens, K., Gray, J. M., Melaas, E., Sonnentag, O., Lavine, I., Mitchell, L., Norman, R., Friedl, M. A., and Richardson, A. D.: Evaluating remote sensing of deciduous forest phenology at multiple spatial scales using PhenoCam imagery, Biogeosciences, 11, 4305–4320, https://doi.org/10.5194/bg-11-4305-2014, 2014.
Knox, S. H., Dronova, I., Sturtevant, C., Oikawa, P. Y., Matthes, J. H., Verfaillie, J., and Baldocchi, D.: Using digital camera and Landsat imagery with eddy covariance data to model gross primary production in restored wetlands, Agricultural and Forest Meteorology, 237–238, 233–245, https://doi.org/10.1016/j.agrformet.2017.02.020, 2017.
Li, X., Ault, T., Richardson, A. D., Carrillo, C. M., Lawrence, D. M., Lombardozzi, D., Frolking, S., Herrera, D. A., and Moon, M.: Impacts of shifting phenology on boundary layer dynamics in North America in the CESM, Agricultural and Forest Meteorology, 330, 109286, https://doi.org/10.1016/j.agrformet.2022.109286, 2023.
Li, X., Ault, T., Richardson, A. D., Frolking, S., Herrera, D. A., Friedl, M. A., Carrillo, C. M., and Evans, C. P.: Northern hemisphere land-atmosphere feedback from prescribed plant phenology in CESM, Journal of Climate, https://doi.org/10.1175/JCLI-D-23-0179.1, 2024.
Li, X. L., Melaas, E., Carrillo, C. M., Ault, T., Richardson, A. D., Lawrence, P., Friedl, M. A., Seyednasrollah, B., Lawrence, D. M., and Young, A. M.: A Comparison of Land Surface Phenology in the Northern Hemisphere Derived from Satellite Remote Sensing and the Community Land Model, Journal of Hydrometeorology, 23, 859-873, https://doi.org/10.1175/jhm-d-21-0169.1, 2022.
Lieth, H. and Radford, J. S.: Phenology, Resource Management, and Synagraphic Computer Mapping, BioScience, 21, 62-70, https://doi.org/10.2307/1295541, 1971.
Liu, Y., Hill, M. J., Zhang, X., Wang, Z., Richardson, A. D., Hufkens, K., Filippa, G., Baldocchi, D. D., Ma, S., Verfaillie, J., and Schaaf, C. B.: Using data from Landsat, MODIS, VIIRS and PhenoCams to monitor the phenology of California oak/grass savanna and open grassland across spatial scales, Agricultural and Forest Meteorology, 237–238, 311–325, https://doi.org/10.1016/j.agrformet.2017.02.026, 2017.
Liu, Y., Lucas, B., Bergl, D. D., and Richardson, A. D.: Robust filling of extra-long gaps in eddy covariance CO2 flux measurements from a temperate deciduous forest using eXtreme Gradient Boosting, Agricultural and Forest Meteorology, 364, 110438, https://doi.org/10.1016/j.agrformet.2025.110438, 2025.
Magney, T. S., Bowling, D. R., Logan, B. A., Grossmann, K., Stutz, J., Blanken, P. D., Burns, S. P., Cheng, R., Garcia, M. A., Köhler, P., Lopez, S., Parazoo, N. C., Raczka, B., Schimel, D., and Frankenberg, C.: Mechanistic evidence for tracking the seasonality of photosynthesis with solar-induced fluorescence, Proceedings of the National Academy of Sciences, 116, 11640-11645, https://doi.org/10.1073/pnas.1900278116, 2019.
Melaas, E. K., Sulla-Menashe, D., Gray, J. M., Black, T. A., Morin, T. H., Richardson, A. D., and Friedl, M. A.: Multisite analysis of land surface phenology in North American temperate and boreal deciduous forests from Landsat, Remote Sensing of Environment, 186, 452–464, https://doi.org/10.1016/j.rse.2016.09.014, 2016.
Metzger, S., Ayres, E., Durden, D., Florian, C., Lee, R., Lunch, C., Luo, H., Pingintha-Durden, N., Roberti, J. A., SanClements, M., Sturtevant, C., Xu, K., and Zulueta, R. C.: From NEON Field Sites to Data Portal: A Community Resource for Surface–Atmosphere Research Comes Online, Bulletin of the American Meteorological Society, 100, 2305–2325, https://doi.org/10.1175/BAMS-D-17-0307.1, 2019.
Moon, M., Zhang, X., Henebry, G. M., Liu, L., Gray, J. M., Melaas, E. K., and Friedl, M. A.: Long-term continuity in land surface phenology measurements: A comparative assessment of the MODIS land cover dynamics and VIIRS land surface phenology products, Remote Sensing of Environment, 226, 74-92, https://doi.org/10.1016/j.rse.2019.03.034, 2019.
Moon, M., Richardson, A. D., and Friedl, M. A.: Multiscale assessment of land surface phenology from harmonized Landsat 8 and Sentinel-2, PlanetScope, and PhenoCam imagery, Remote Sensing of Environment, 266, https://doi.org/10.1016/j.rse.2021.112716, 2021.
Musinsky, J., Goulden, T., Wirth, G., Leisso, N., Krause, K., Haynes, M., and Chapman, C.: Spanning scales: The airborne spatial and temporal sampling design of the National Ecological Observatory Network, Methods in Ecology and Evolution, 13, 1866–1884, https://doi.org/10.1111/2041-210X.13942, 2022.
NEON (National Ecological Observatory Network): Photosynthetically active radiation (PAR) (DP1.00024.001), National Ecological Observatory Network [data set], https://doi.org/10.48443/VZFH-7675, 2023a.
NEON (National Ecological Observatory Network): Shortwave and longwave radiation (net radiometer) (DP1.00023.001), RELEASE-2023, National Ecological Observatory Network [data set], https://doi.org/10.48443/TSNX-2995, 2023b.
NEON (National Ecological Observatory Network): AmeriFlux BASE PR-xGU NEON Guanica Forest (GUAN), Ver. 6-5, AmeriFlux AMP [data set], https://doi.org/10.17190/AMF/1773393, 2023c.
NEON (National Ecological Observatory Network): AmeriFlux BASE PR-xLA NEON Lajas Experimental Station (LAJA), Ver. 6-5, AmeriFlux AMP [data set], https://doi.org/10.17190/AMF/1773394, 2023d.
NEON (National Ecological Observatory Network): AmeriFlux BASE US-xAB NEON Abby Road (ABBY), Ver. 8-5, AmeriFlux AMP [data set], https://doi.org/10.17190/AMF/1617726, 2023e.
NEON (National Ecological Observatory Network): AmeriFlux BASE US-xAE NEON Klemme Range Research Station (OAES), Ver. 7-5, AmeriFlux AMP [data set], https://doi.org/10.17190/AMF/1671891, 2023f.
NEON (National Ecological Observatory Network): AmeriFlux BASE US-xBA NEON Barrow Environmental Observatory (BARR), Ver. 7-5, AmeriFlux AMP [data set], https://doi.org/10.17190/AMF/1671892, 2023g.
NEON (National Ecological Observatory Network): AmeriFlux BASE US-xBL NEON Blandy Experimental Farm (BLAN), Ver. 7-5, AmeriFlux AMP [data set], https://doi.org/10.17190/AMF/1671893, 2023h.
NEON (National Ecological Observatory Network): AmeriFlux BASE US-xBN NEON Caribou Creek – Poker Flats Watershed (BONA), Ver. 8-5, AmeriFlux AMP [data set], https://doi.org/10.17190/AMF/1617727, 2023i.
NEON (National Ecological Observatory Network): AmeriFlux BASE US-xBR NEON Bartlett Experimental Forest (BART), Ver. 8-5, AmeriFlux AMP [data set], https://doi.org/10.17190/AMF/1579542, 2023j.
NEON (National Ecological Observatory Network): AmeriFlux BASE US-xCL NEON LBJ National Grassland (CLBJ), Ver. 7-5, AmeriFlux AMP [data set], https://doi.org/10.17190/AMF/1671894, 2023k.
NEON (National Ecological Observatory Network): AmeriFlux BASE US-xCP NEON Central Plains Experimental Range (CPER), Ver. 8-5, AmeriFlux AMP [data set], https://doi.org/10.17190/AMF/1579720, 2023l.
NEON (National Ecological Observatory Network): AmeriFlux BASE US-xDC NEON Dakota Coteau Field School (DCFS), Ver. 8-5, AmeriFlux AMP [data set], https://doi.org/10.17190/AMF/1617728, 2023m.
NEON (National Ecological Observatory Network): AmeriFlux BASE US-xDJ NEON Delta Junction (DEJU), Ver. 8-5, AmeriFlux AMP [data set], https://doi.org/10.17190/AMF/1634884, 2023n.
NEON (National Ecological Observatory Network): AmeriFlux BASE US-xDL NEON Dead Lake (DELA), Ver. 8-5, AmeriFlux AMP [data set], https://doi.org/10.17190/AMF/1579721, 2023o.
NEON (National Ecological Observatory Network): AmeriFlux BASE US-xDS NEON Disney Wilderness Preserve (DSNY), Ver. 7-5, AmeriFlux AMP [data set], https://doi.org/10.17190/AMF/1671895, 2023p.
NEON (National Ecological Observatory Network): AmeriFlux BASE US-xGR NEON Great Smoky Mountains National Park, Twin Creeks (GRSM), Ver. 8-5, AmeriFlux AMP [data set], https://doi.org/10.17190/AMF/1634885, 2023q.
NEON (National Ecological Observatory Network): AmeriFlux BASE US-xHA NEON Harvard Forest (HARV), Ver. 9-5, AmeriFlux AMP [data set], https://doi.org/10.17190/AMF/1562391, 2023r.
NEON (National Ecological Observatory Network): AmeriFlux BASE US-xHE NEON Healy (HEAL), Ver. 8-5, AmeriFlux AMP [data set], https://doi.org/10.17190/AMF/1617729, 2023s.
NEON (National Ecological Observatory Network): AmeriFlux BASE US-xJE NEON Jones Ecological Research Center (JERC), Ver. 8-5, AmeriFlux AMP [data set], https://doi.org/10.17190/AMF/1617730, 2023t.
NEON (National Ecological Observatory Network): AmeriFlux BASE US-xJR NEON Jornada LTER (JORN), Ver. 8-5, AmeriFlux AMP [data set], https://doi.org/10.17190/AMF/1617731, 2023u.
NEON (National Ecological Observatory Network): AmeriFlux BASE US-xKA NEON Konza Prairie Biological Station – Relocatable (KONA), Ver. 8-5, AmeriFlux AMP [data set], https://doi.org/10.17190/AMF/1579722, 2023v.
NEON (National Ecological Observatory Network): AmeriFlux BASE US-xKZ NEON Konza Prairie Biological Station (KONZ), Ver. 9-5, AmeriFlux AMP [data set], https://doi.org/10.17190/AMF/1562392, 2023w.
NEON (National Ecological Observatory Network): AmeriFlux BASE US-xLE NEON Lenoir Landing (LENO), Ver. 6-5, AmeriFlux AMP [data set], https://doi.org/10.17190/AMF/1773398, 2023x.
NEON (National Ecological Observatory Network): AmeriFlux BASE US-xMB NEON Moab (MOAB), Ver. 7-5, AmeriFlux AMP [data set], https://doi.org/10.17190/AMF/1671896, 2023y.
NEON (National Ecological Observatory Network): AmeriFlux BASE US-xML NEON Mountain Lake Biological Station (MLBS), Ver. 7-5, AmeriFlux AMP [data set], https://doi.org/10.17190/AMF/1671897, 2023z.
NEON (National Ecological Observatory Network): AmeriFlux BASE US-xNG NEON Northern Great Plains Research Laboratory (NOGP), Ver. 8-5, AmeriFlux AMP [data set], https://doi.org/10.17190/AMF/1617732, 2023aa.
NEON (National Ecological Observatory Network): AmeriFlux BASE US-xNQ NEON Onaqui-Ault (ONAQ), Ver. 8-5, AmeriFlux AMP [data set], https://doi.org/10.17190/AMF/1617733, 2023ab.
NEON (National Ecological Observatory Network): AmeriFlux BASE US-xNW NEON Niwot Ridge Mountain Research Station (NIWO), Ver. 7-5, AmeriFlux AMP [data set], https://doi.org/10.17190/AMF/1671898, 2023ac.
NEON (National Ecological Observatory Network): AmeriFlux BASE US-xPU NEON Pu'u Maka'ala Natural Area Reserve (PUUM), Ver. 6-5, AmeriFlux AMP [data set], https://doi.org/10.17190/AMF/1773399, 2023ad.
NEON (National Ecological Observatory Network): AmeriFlux BASE US-xRM NEON Rocky Mountain National Park, CASTNET (RMNP), Ver. 8-5, AmeriFlux AMP [data set], https://doi.org/10.17190/AMF/1579723, 2023ae.
NEON (National Ecological Observatory Network): AmeriFlux BASE US-xRN NEON Oak Ridge National Lab (ORNL), Ver. 6-5, AmeriFlux AMP [data set], https://doi.org/10.17190/AMF/1773400, 2023af.
NEON (National Ecological Observatory Network): AmeriFlux BASE US-xSB NEON Ordway-Swisher Biological Station (OSBS), Ver. 7-5, AmeriFlux AMP [data set], https://doi.org/10.17190/AMF/1671899, 2023ag.
NEON (National Ecological Observatory Network): AmeriFlux BASE US-xSC NEON Smithsonian Conservation Biology Institute (SCBI), Ver. 7-5, AmeriFlux AMP [data set], https://doi.org/10.17190/AMF/1671900, 2023ah.
NEON (National Ecological Observatory Network): AmeriFlux BASE US-xSE NEON Smithsonian Environmental Research Center (SERC), Ver. 8-5, AmeriFlux AMP [data set], https://doi.org/10.17190/AMF/1617734, 2023ai.
NEON (National Ecological Observatory Network): AmeriFlux BASE US-xSJ NEON San Joaquin Experimental Range (SJER), Ver. 7-5, AmeriFlux AMP [data set], https://doi.org/10.17190/AMF/1671901, 2023aj.
NEON (National Ecological Observatory Network): AmeriFlux BASE US-xSL NEON North Sterling, CO (STER), Ver. 8-5, AmeriFlux AMP [data set], https://doi.org/10.17190/AMF/1617735, 2023ak.
NEON (National Ecological Observatory Network): AmeriFlux BASE US-xSP NEON Soaproot Saddle (SOAP), Ver. 8-5, AmeriFlux AMP [data set], https://doi.org/10.17190/AMF/1617736, 2023al.
NEON (National Ecological Observatory Network): AmeriFlux BASE US-xSR NEON Santa Rita Experimental Range (SRER), Ver. 8-5, AmeriFlux AMP [data set], https://doi.org/10.17190/AMF/1579543, 2023am.
NEON (National Ecological Observatory Network): AmeriFlux BASE US-xST NEON Steigerwaldt Land Services (STEI), Ver. 8-5, AmeriFlux AMP [data set], https://doi.org/10.17190/AMF/1617737, 2023an.
NEON (National Ecological Observatory Network): AmeriFlux BASE US-xTA NEON Talladega National Forest (TALL), Ver. 7-5, AmeriFlux AMP [data set], https://doi.org/10.17190/AMF/1671902, 2023ao.
NEON (National Ecological Observatory Network): AmeriFlux BASE US-xTE NEON Lower Teakettle (TEAK), Ver. 8-5, AmeriFlux AMP [data set], https://doi.org/10.17190/AMF/1617738, 2023ap.
NEON (National Ecological Observatory Network): AmeriFlux BASE US-xTL NEON Toolik (TOOL), Ver. 8-5, AmeriFlux AMP [data set], https://doi.org/10.17190/AMF/1617739, 2023aq.
NEON (National Ecological Observatory Network): AmeriFlux BASE US-xTR NEON Treehaven (TREE), Ver. 8-5, AmeriFlux AMP [data set], https://doi.org/10.17190/AMF/1634886, 2023ar.
NEON (National Ecological Observatory Network): AmeriFlux BASE US-xUK NEON The University of Kansas Field Station (UKFS), Ver. 8-5, AmeriFlux AMP [data set], https://doi.org/10.17190/AMF/1617740, 2023as.
NEON (National Ecological Observatory Network): AmeriFlux BASE US-xUN NEON University of Notre Dame Environmental Research Center (UNDE), Ver. 8-5, AmeriFlux AMP [data set], https://doi.org/10.17190/AMF/1617741, 2023at.
NEON (National Ecological Observatory Network): AmeriFlux BASE US-xWD NEON Woodworth (WOOD), Ver. 8-5, AmeriFlux AMP [data set], https://doi.org/10.17190/AMF/1579724, 2023au.
NEON (National Ecological Observatory Network): AmeriFlux BASE US-xWR NEON Wind River Experimental Forest (WREF), Ver. 8-5, AmeriFlux AMP [data set], https://doi.org/10.17190/AMF/1617742, 2023av.
NEON (National Ecological Observatory Network): AmeriFlux BASE US-xYE NEON Yellowstone Northern Range (Frog Rock) (YELL), Ver. 8-5, AmeriFlux AMP [data set], https://doi.org/10.17190/AMF/1617743, 2023aw.
NEON (National Ecological Observatory Network): Phenology images (DP1.00033.001), provisional data, National Ecological Observatory Network [data set], https://data.neonscience.org/data-products/DP1.00033.001 (last access: 19 August 2025), 2025.
Oishi, A. C., Miniat, C. F., Novick, K. A., Brantley, S. T., Vose, J. M., and Walker, J. T.: Warmer temperatures reduce net carbon uptake, but do not affect water use, in a mature southern Appalachian forest, Agricultural and Forest Meteorology, 252, 269–282, https://doi.org/10.1016/j.agrformet.2018.01.011, 2018.
Omernik, J. M. and Griffith, G. E.: Ecoregions of the Conterminous United States: Evolution of a Hierarchical Spatial Framework, Environmental Management, 54, 1249–1266, https://doi.org/10.1007/s00267-014-0364-1, 2014.
Peñuelas, J., Filella, I., and Comas, P.: Changed plant and animal life cycles from 1952 to 2000 in the Mediterranean region, Global Change Biology, 8, 531–544, https://doi.org/10.1046/j.1365-2486.2002.00489.x, 2002.
Petach, A. R., Toomey, M., Aubrecht, D. M., and Richardson, A. D.: Monitoring vegetation phenology using an infrared-enabled security camera, Agricultural and Forest Meteorology, 195–196, 143–151, https://doi.org/10.1016/j.agrformet.2014.05.008, 2014.
Post, A. K., Hufkens, K., and Richardson, A. D.: Predicting spring green-up across diverse North American grasslands, Agricultural and Forest Meteorology, 327, https://doi.org/10.1016/j.agrformet.2022.109204, 2022.
Richardson, A. D.: PhenoCam: An evolving, open-source tool to study the temporal and spatial variability of ecosystem-scale phenology, Agricultural and Forest Meteorology, 342, 109751, https://doi.org/10.1016/j.agrformet.2023.109751, 2023.
Richardson, A. D. and Javadian, M.: PhenoCam Bibliography, figshare [data set], https://doi.org/10.6084/m9.figshare.29493248.v1, 2025.
Richardson, A. D., Keenan, T. F., Migliavacca, M., Ryu, Y., Sonnentag, O., and Toomey, M.: Climate change, phenology, and phenological control of vegetation feedbacks to the climate system, Agricultural and Forest Meteorology, 169, 156-173, https://doi.org/10.1016/j.agrformet.2012.09.012, 2013.
Richardson, A. D., Hufkens, K., Milliman, T., and Frolking, S.: Intercomparison of phenological transition dates derived from the PhenoCam Dataset V1.0 and MODIS satellite remote sensing, Scientific Reports, 8, https://doi.org/10.1038/s41598-018-23804-6, 2018a.
Richardson, A. D., Hufkens, K., Milliman, T., Aubrecht, D. M., Chen, M., Gray, J. M., Johnston, M. R., Keenan, T. F., Klosterman, S. T., Kosmala, M., Melaas, E. K., Friedl, M. A., and Frolking, S.: Tracking vegetation phenology across diverse North American biomes using PhenoCam imagery, Scientific Data, 5, 180028, https://doi.org/10.1038/sdata.2018.28, 2018b.
Richardson, A. D., Hufkens, K., Li, X., and Ault, T. R.: Testing Hopkins' Bioclimatic Law with PhenoCam data, Applications in Plant Sciences, 7, e01228, https://doi.org/10.1002/aps3.1228, 2019.
Rocha, A. V., Appel, R., Bret-Harte, M. S., Euskirchen, E. S., Salmon, V., and Shaver, G.: Solar position confounds the relationship between ecosystem function and vegetation indices derived from solar and photosynthetically active radiation fluxes, Agricultural and Forest Meteorology, 298–299, 108291, https://doi.org/10.1016/j.agrformet.2020.108291, 2021.
Rosenzweig, C., Casassa, G., Karoly, D. J., Imeson, A., Liu, C., Menzel, A., Rawlins, S., Root, T. L., Seguin, B., and Tryjanowski, P.: Assessment of observed changes and responses in natural and managed systems, in: Climate Change 2007: Impacts, Adaptation and Vulnerability. Contribution of Working Group II to the Fourth Assessment Report of the Intergovernmental Panel on Climate Change, edited by: Parry, M. L., Canziani, O. F., Palutikof, J. P., van der Linden, P. J., and Hanson, C. E., Cambridge University Press, Cambridge, UK, 79–131, 2007.
Schädel, C., Seyednasrollah, B., Hanson, P. J., Hufkens, K., Pearson, K. J., Warren, J. M., and Richardson, A. D.: Using long-term data from a whole ecosystem warming experiment to identify best spring and autumn phenology models, Plant-Environment Interactions, 4, 188–200, https://doi.org/10.1002/pei3.10118, 2023.
Schwartz, M. D.: Green-wave phenology, Nature, 394, 839–840, https://doi.org/10.1038/29670, 1998.
Seyednasrollah, B., Young, A. M., Hufkens, K., Milliman, T., Friedl, M. A., Frolking, S., and Richardson, A. D.: Tracking vegetation phenology across diverse biomes using Version 2.0 of the PhenoCam Dataset, Scientific Data, 6, 222, https://doi.org/10.1038/s41597-019-0229-9, 2019.
Sonnentag, O., Hufkens, K., Teshera-Sterne, C., Young, A. M., Friedl, M., Braswell, B. H., Milliman, T., O'Keefe, J., and Richardson, A. D.: Digital repeat photography for phenological research in forest ecosystems, Agricultural and Forest Meteorology, 152, 159–177, https://doi.org/10.1016/j.agrformet.2011.09.009, 2012.
Stöckli, R. and Vidale, P. L.: European plant phenology and climate as seen in a 20-year AVHRR land-surface parameter dataset, International Journal of Remote Sensing, 25, 3303–3330, https://doi.org/10.1080/01431160310001618149, 2004.
Taylor, S. D. and Browning, D. M.: Classification of Daily Crop Phenology in PhenoCams Using Deep Learning and Hidden Markov Models, Remote Sens., 14, 286, https://doi.org/10.3390/rs14020286, 2022.
Tran, K. H., Zhang, X., Ketchpaw, A. R., Wang, J., Ye, Y., and Shen, Y.: A novel algorithm for the generation of gap-free time series by fusing harmonized Landsat 8 and Sentinel-2 observations with PhenoCam time series for detecting land surface phenology, Remote Sensing of Environment, 282, 113275, https://doi.org/10.1016/j.rse.2022.113275, 2022.
Wang, Q., Tenhunen, J., Dinh, N. Q., Reichstein, M., Vesala, T., and Keronen, P.: Similarities in ground- and satellite-based NDVI time series and their relationship to physiological activity of a Scots pine forest in Finland, Remote Sensing of Environment, 93, 225–237, https://doi.org/10.1016/j.rse.2004.07.006, 2004.
Waring, R. and Running, S.: Forest Ecosystems: Analysis at Multiple Scales, 3rd edn., Academic Press, ISBN 012370605X, 2007.
Wheeler, K. I. and Dietze, M. C.: Improving the monitoring of deciduous broadleaf phenology using the Geostationary Operational Environmental Satellite (GOES) 16 and 17, Biogeosciences, 18, 1971–1985, https://doi.org/10.5194/bg-18-1971-2021, 2021
Whittaker, R. H.: Communities and Ecosystems, 2nd Edn., MacMillan Publishing, New York, NY, ISBN 0024273902, 1975.
Wingate, L., Ogée, J., Cremonese, E., Filippa, G., Mizunuma, T., Migliavacca, M., Moisy, C., Wilkinson, M., Moureaux, C., Wohlfahrt, G., Hammerle, A., Hörtnagl, L., Gimeno, C., Porcar-Castell, A., Galvagno, M., Nakaji, T., Morison, J., Kolle, O., Knohl, A., Kutsch, W., Kolari, P., Nikinmaa, E., Ibrom, A., Gielen, B., Eugster, W., Balzarolo, M., Papale, D., Klumpp, K., Köstner, B., Grünwald, T., Joffre, R., Ourcival, J.-M., Hellstrom, M., Lindroth, A., George, C., Longdoz, B., Genty, B., Levula, J., Heinesch, B., Sprintsin, M., Yakir, D., Manise, T., Guyon, D., Ahrends, H., Plaza-Aguilar, A., Guan, J. H., and Grace, J.: Interpreting canopy development and physiology using a European phenology camera network at flux sites, Biogeosciences, 12, 5995–6015, https://doi.org/10.5194/bg-12-5995-2015, 2015.
Wolf, S., Keenan, T. F., Fisher, J. B., Baldocchi, D. D., Desai, A. R., Richardson, A. D., Scott, R. L., Law, B. E., Litvak, M. E., Brunsell, N. A., Peters, W., and van der Laan-Luijkx, I. T.: Warm spring reduced carbon cycle impact of the 2012 US summer drought, Proceedings of the National Academy of Sciences, 113, 5880–5885, https://doi.org/10.1073/pnas.1519620113, 2016.
Yan, D., Scott, R. L., Moore, D. J. P., Biederman, J. A., and Smith, W. K.: Understanding the relationship between vegetation greenness and productivity across dryland ecosystems through the integration of PhenoCam, satellite, and eddy covariance data, Remote Sensing of Environment, 223, 50–62, https://doi.org/10.1016/j.rse.2018.12.029, 2019.
Young, A. M., Friedl, M. A., Seyednasrollah, B., Beamesderfer, E., Carrillo, C. M., Li, X., Moon, M., Arain, M. A., Baldocchi, D. D., Blanken, P. D., Bohrer, G., Burns, S. P., Chu, H., Desai, A. R., Griffis, T. J., Hollinger, D. Y., Litvak, M. E., Novick, K., Scott, R. L., Suyker, A. E., Verfaillie, J., Wood, J. D., and Richardson, A. D.: Seasonality in aerodynamic resistance across a range of North American ecosystems, Agricultural and Forest Meteorology, 310, 108613, https://doi.org/10.1016/j.agrformet.2021.108613, 2021.
Young, A. M., Friedl, M. A., Novick, K., Scott, R. L., Moon, M., Frolking, S., Li, X., Carrillo, C. M., and Richardson, A. D.: Disentangling the Relative Drivers of Seasonal Evapotranspiration Across a Continental-Scale Aridity Gradient, Journal of Geophysical Research: Biogeosciences, 127, e2022JG006916, https://doi.org/10.1029/2022JG006916, 2022.
Zhang, G., Zhang, Y., Dong, J., and Xiao, X.: Green-up dates in the Tibetan Plateau have continuously advanced from 1982 to 2011, Proceedings of the National Academy of Sciences, 110, 4309–4314, https://doi.org/10.1073/pnas.1210423110, 2013.
Zhang, J., Gonsamo, A., Tong, X., Xiao, J., Rogers, C. A., Qin, S., Liu, P., Yu, P., and Ma, P.: Solar-induced chlorophyll fluorescence captures photosynthetic phenology better than traditional vegetation indices, ISPRS Journal of Photogrammetry and Remote Sensing, 203, 183–198, https://doi.org/10.1016/j.isprsjprs.2023.07.021, 2023.
Zhang, X., Jayavelu, S., Liu, L., Friedl, M. A., Henebry, G. M., Liu, Y., Schaaf, C. B., Richardson, A. D., and Gray, J.: Evaluation of land surface phenology from VIIRS data using time series of PhenoCam imagery, Agricultural and Forest Meteorology, 256–257, 137–149, https://doi.org/10.1016/j.agrformet.2018.03.003, 2018.
Zimmerman, O., Young, A. M., Milliman, T., Hufkens, K., Ballou, K., Coffey, C., Begay, K., Fell, M., Javadian, M., Post, A. K., Schädel, C., Vladich, Z., Browning, D. M., Florian, C. R., Friedl, M. A., Moon, M., SanClements, M. D., Seyednasrollah, B., Richardson, A. D., Abraha, M., Alber, M., Allen, D. W., Apple, M., Arain, M. A., Axel, A. C., Badiou, P. H. J., Bahn, M., Baker, J., Baldocchi, D., Bayliss, S. L. J., Behrens, N., Beier, C. M., Bernacchi, C. J., Berveiller, D., Bhattacharjee, J., Biraud, S. C., Blais, J. J., Blanken, P., Bonfim, M., Bosch, D. D., Boughton, R., Boughton, E. H., Brown, R. F., Brunsell, N., Burns, S. P., Carbone, M. S., Carlson, B. R., Carrara, A., Cavagna, M., Chan, W. S., Chen, J., Christen, A., Chrysoulakis, N., Chu, H., Clark, P. E., Conrad, B. J., Cortese, M. R., Crandall, R. M., Cremonese, E., Crepaz, H., Davis, F. W., Debinski, D., Desai, A. R., Detto, M., Diaz-Delgado, R., Duchesne, L., Dunn, A., Easterday, K. J., Eissenstat, D. M., El-madany, T., Ellum, D. S. S., Ernest, S. K. M., Esposito, A., Euskirchen, E. S., Fenstermaker, L., Filchev, L. F., Fill, J. M., Flanagan, L. B., Forsythe, B., Frank, J. M., Freestone, A. L., Gallagher, J., García, M. B., García-Díaz, D., Gharun, M., Gianelle, D., Gonet, J. M., Goslee, S. C., Griffis, T., Groffman, P., Gu, L., Guillemot, J., Halm, I. M., Halpin, M., Hammerle, A., Hanson, P. J., Hanson, C. V., Harlow, Z., Hart, K. M., Hatch, C. E., Heinrich, P. L., Hemming, D., Heskel, M., Hill, A. C., Hove, A. A., Hübner, T., Hui, D., Humphreys, E. R., Inkenbrandt, P. C., Jaimes-hernandez, A., Jensen, R., Johnson, J., Johnson, B. G., Joseph, L. S. K., Keel, E., Kelly, V. R., King, K. W., Kirchner, J. W., Kirchner, P. B., Kline, M. A., Knox, S. H., Krassovski, M., Ladig, K. L., Lærke, P. E., Langvall, O., Lanthier, G., Lany, N. K., le Maire, G., Liu, H., López Jiménez, R., Luo, Y., Manco, A., Marrs, J., Martin, T. A., Mauritz, M., McCarty, G., McNeil, B., Meier, F., Mensinger, M., Meyer, G., Migliavacca, M., Miura, T., Mohanty, B. P., Moore, C. E., Mudd, R., Munger, J. W., Murrell, Z. E., Nesic, Z., Neufeld, H. S., Norris, J., O'Connell, J., O'Halloran, T. L., Oechel, W., Oishi, A. C., Oryan, B., Oswald, W. W., Peltier, D. M. P., Perez-Quezada, J., Perkins, T. D., Phillips, C., Pizarro, M., Poursanidis, D., Pullens, J. W. M., Ramanamandimby, P., Rao, M. P., Ray, R. L., Reba, M. L., Redmond, C., Reinmann, A. B., Roberts, D. A., Robertson, G. P., Rodriguez-Caton, M., Rumora, K. R., Rundquist, B. C., Runkle, B. R. K., Sachs, T., Sadler, E. J., Saha, A., Saliendra, N. Z., Sankey, T. S., Scheifinger, H., Schmalbeck, L., Schuppenhauer, M. R., Schwartz, M. D., Scott, R. L., Sebestyen, S. D., Smale, D., Smith, E. M., Smith, J., Sonnentag, O., Stoy, P., Strachan, S., Suvocarev, K., Szutu, D., Tekinay, F., Thom, J. E., Thomas, R. Q., Trauernicht, C., Trejo, D., Tsirantonakis, D., Valero, A., Van den berg, A. K., Van der Molen, M. K., Vargas, R., Vellend, M., Verfaillie, J., Vogel, C. S., Vrieling, A., Walker, J. J., Ward, J. R., Watts, D. A., Webb, N., Wetzel, P., Weyers, S., Whipple, A. V., Whippo, C. W., White, W. A., Whitham, T. G., Wille, C., Wingler, A., Wohlfahrt, G., Wolf, S., Wood, J. D., Woodley, A. L., Yang, J., Yang, X., Yenni, G., Zambrano-olimpo, A. J., Zandonai, A., Zhang, Y., and Zona, D.: PhenoCam Dataset v3.0: Vegetation Phenology from Digital Camera Imagery, 2000–2023 (version 3), ORNL Distributed Active Archive Center [data set], https://doi.org/10.3334/ORNLDAAC/2389, 2025.