the Creative Commons Attribution 4.0 License.
the Creative Commons Attribution 4.0 License.
 | 25 Nov 2025
Multi-spatial scale assessment and multi-dataset fusion of global terrestrial evapotranspiration datasets
Yi Wu
Yiying Wang
Qi Zhang
Jiachen Ji
Yuanfang Chai
Evapotranspiration (ET) is an important component of the terrestrial water cycle, carbon cycle, and energy balance. Currently, there are four main types of ET datasets: remote sensing–based, machine learning–based, reanalysis–based, and land–surface–model–based. However, most existing ET fusion datasets rely on a single type of ET dataset, limiting their ability to effectively capture regional ET variations. This limitation hinders accurate quantification of the terrestrial water balance and understanding of climate change impacts. In this study, the accuracy and uncertainty of thirty ET datasets (across all four types) are evaluated at multiple spatial scales, and a fusion dataset BMA (Bayesian model averaging)-ET, is obtained using BMA method and dynamic weighting scheme. ET from FLUXNET2015 as reference, the study recommends remote sensing- and machine learning-based ET datasets, especially Model Tree Ensemble Evapotranspiration (MTE), Penman-Monteith-Leuning (PML) and Process-based Land Surface Evapotranspiration/Heat Fluxes (PLSH), but the optimal selection depends on season and vegetation type. At the basin scale, most of ET datasets demonstrate superior performance. Relative uncertainty based on remote sensing and machine learning is low at the grid point scale. The fusion dataset BMA-ET accurately captures trends in ET, showing a global terrestrial increasing trend of 0.65 (0.51–0.78) mm yr−1 during the period 1980–2020. BMA-ET has higher correlation coefficients and lower root-mean-square errors than most individual ET datasets. Validation using ET from FLUXNET2015 as reference shows that correlation coefficients of more than 70 % of the flux sites exceed 0.6. Validation results based on independent data sources show that the correlation coefficients of BMA-ET with AmeriFlux, ChinaFlux, and ICOS reach 0.61, 0.72, and 0.74, respectively. Overall, BMA-ET provides a comprehensive, long-term resource for understanding global ET patterns and trends, addressing the limitation of prior ET fusion efforts. Free access to the dataset can be found at https://doi.org/10.5281/zenodo.15470621 (Wu and Miao, 2025).
- Article
(9692 KB) - Full-text XML
-
Supplement
(10435 KB) - BibTeX
- EndNote


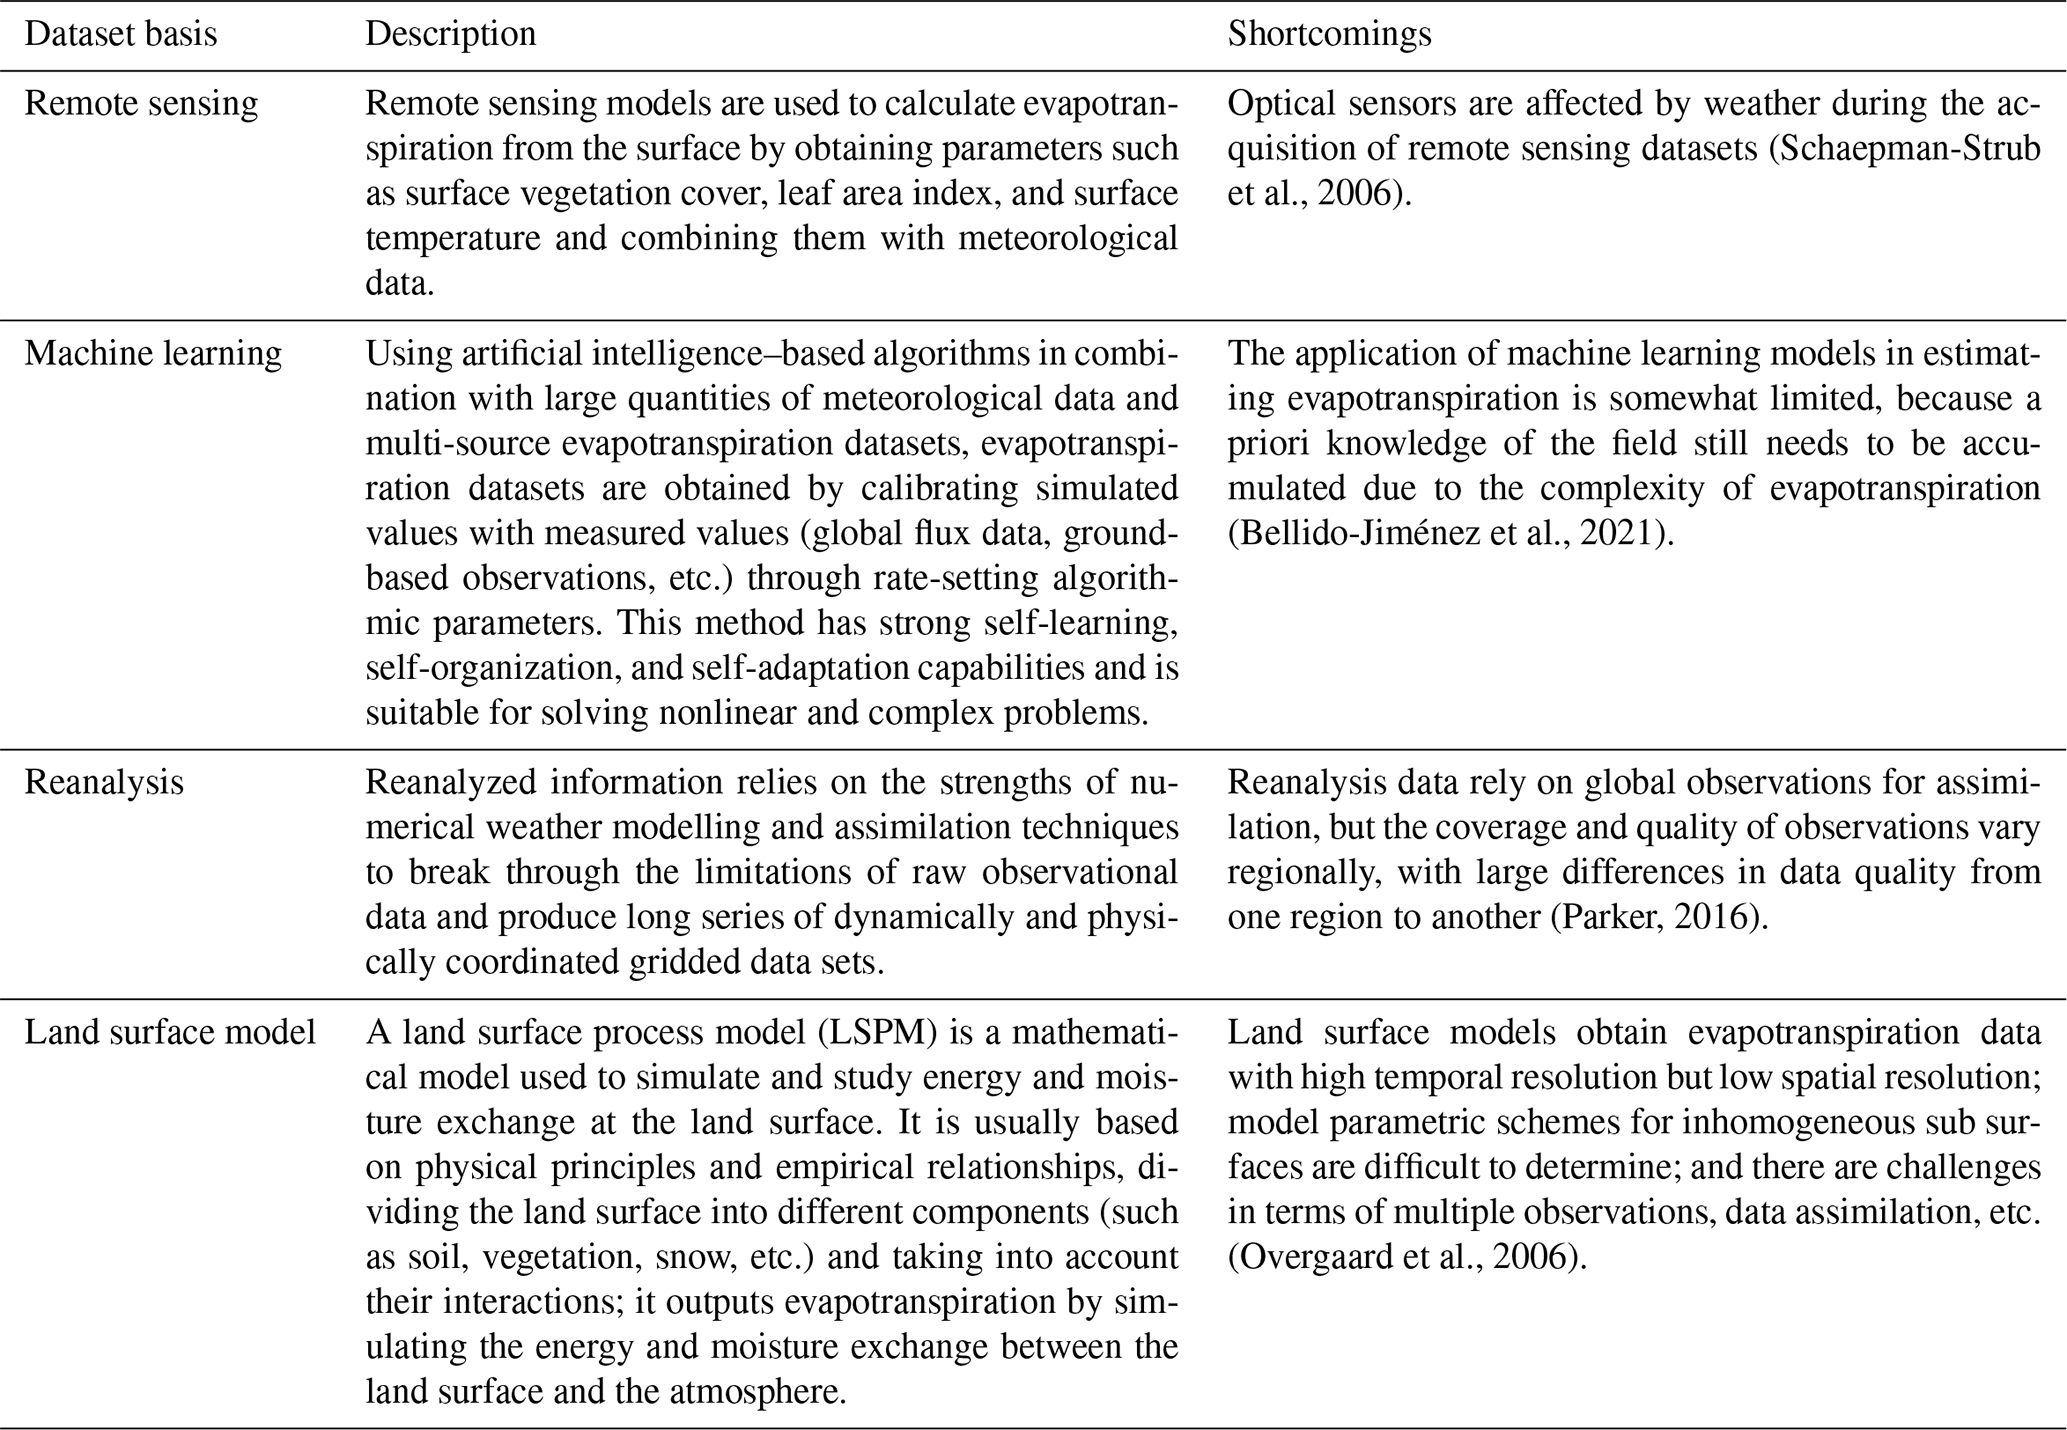
Terrestrial evapotranspiration (ET) is the physical process by which water is converted from liquid to gaseous state from surface soils, vegetation or water surfaces, and it is accompanied by energy conversion processes (Wang and Dickinson, 2012). Specifically, ET consists mainly of soil evapotranspiration, vegetation transpiration, canopy interception, and evaporation from water or ice surfaces (Lawrence et al., 2007). Globally, about two-thirds of precipitation is evaporated into the atmosphere each year, while more than half of the net solar radiation absorbed by land surfaces is used to evaporate surface moisture (Jasechko et al., 2013). Evapotranspiration is the nexus of the coupled global water-carbon-energy cycle (Zheng et al., 2025) and is a key process for quantifying the response of the hydrological cycle to global change (Chai et al., 2025). ET datasets are classified into four main types in this study: remote sensing–based, machine learning–based, reanalysis–based, and land–surface–model–based (Table 1). These four types of ET datasets are now widely used in scientific research.
Table 1Descriptions of four types of evapotranspiration datasets.
Against the background of global warming (Hu et al., 2025) and intensification of the hydrological cycle (Zhang et al., 2025), global ET is showing obvious interannual and seasonal variations (Wang and Dickinson, 2012). Therefore, accurate estimation of terrestrial ET is not only necessary for understanding the distribution of water and energy at different spatial and temporal scales but also important for research in many disciplines, such as hydrology and meteorology. However, due to the complexity of spatial and temporal variations in ET, the many factors affecting ET, and the limited availability of field observations, there are large discrepancies among ET estimates from different methods, resulting in large uncertainties in existing assessments of spatial and temporal variations in global ET (Long et al., 2014).
An important part of hydrological cycle research is ET dataset assessment, which involves comparing and analysing different ET datasets to improve the accuracy, reliability and applicability of ET estimates. In recent years, with the development of remote sensing technology and data processing methods, research on the assessment of ET datasets has made significant progress. Chao et al. (2021) evaluated five remotely sensed datasets in the continental US using reconstructed ET data (Recon) as a baseline, and the results showed that the GLEAM dataset, P-LSH dataset, and PML dataset showed better performance at the annual scale during 2003–2008, followed by the MTE and MODIS datasets. Yu et al. (2023) validated and assessed the consistency and uncertainty of nine ET datasets in the continental US under normal and extreme weather conditions using eddy covariance (EC) flux observations and the three-cornered hat (TCH) method, and the results showed that the accuracy of the different ET datasets varied depending on the land cover type and that GLEAM3.6b and two fusion datasets – reliability ensemble averaging (REA) and Synthesized (Syn) – showed superior results for most land cover types during 2003–2015. Pan et al. (2020) analysed the spatial and temporal variations of global terrestrial ET, and the results showed that the annual mean global terrestrial ET ensembles averaged by three different methods were basically the same; results also showed that the ensembles of the remote sensing–based physical models and the machine learning algorithms both exhibited an increasing trend for ET during the period 1982–2011, while the ensembles of the land surface models on average did not show a significant change. Xie et al. (2024) evaluated the accuracy and uncertainty of seven satellite-based and two reanalysis datasets for global terrestrial ET and found no single ET dataset could provide the most accurate ET estimates for all land cover types; GLASS-AVHRR and GLASS-MODIS were the two datasets with the lowest relative uncertainty, while MERRA2 had the largest relative uncertainty from 2003 to 2015.
To reduce ET data uncertainty, improve data precision, and extend the study period, researchers have used data fusion techniques – such as arithmetic averaging, weighted averaging, and machine learning methods – to integrate multiple ET datasets into a more reliable dataset. Zhang et al. (2019) developed the first set of coupled global terrestrial ET and vegetation gross primary productivity datasets at 500 m resolution for the period 2000–2020 based on the multi-scale fusion of the PML-V2 ET model with station and basin observations and global remote sensing data. He et al. (2020) developed a gridded ET dataset (1982–2011) from statistical or empirical data, remotely sensed data, and land-surface models for the contiguous United States (CONUS), which was integrated via Bayesian three-cornered hat (BTCH) and ensemble mean (EM) methods, and the results show that BTCH outperforms EM and all individual parent datasets compared to eddy covariance towers (ETEC) from AmeriFlux sites and ET values from the water balance method (ETWB). Lu et al. (2021) obtained a long series (1980–2017) of global daily evapotranspiration datasets (REA-ET) with a spatial resolution of 0.25° using the fusion of reliability ensemble averaging methods based on three widely used model-based ET datasets, including ERA5, MERRA2, and GLDAS2-Noah reanalysis data, and the results showed that the fusion dataset captured the evapotranspiration trends in different areas well and performed well for all vegetation cover types.
With the development of remote sensing technology and improved data fusion methods, a large number of ET datasets have emerged. However, existing efforts to fuse ET datasets have not generally involved multiple types of ET datasets but have mainly focused on fusion of a single type of ET dataset, which limits their ability to capture characteristics of regional ET variations. This limitation seriously hampers the accurate quantification of the terrestrial water balance and understanding of climate change impacts. The current study looks at more datasets, including four types of ET datasets, comprising 30 ET datasets in all, and the ET datasets are also evaluated from more diverse perspectives, from the site scale to the basin scale to the global scale, which can provide data references for studies at different spatial scales. Therefore, this study attempts to develop a long time series (1980–2020) global terrestrial evapotranspiration dataset based on ET from FLUXNET2015 and four types of global evapotranspiration datasets (a total of 30 ET datasets) using a Bayesian model averaging (BMA) algorithm; the aim is to obtain an ET fusion dataset that contains more diverse information than previous efforts. A key advancement of this fusion dataset lies in its dynamic weighting scheme, which adjusts for different vegetation types and years with non-overlapping coverage among ET datasets. This approach significantly improves the utilization of FLUXNET2015 observations, especially across diverse vegetation types.
2.1 Data
2.1.1 Evapotranspiration data
Thirty evapotranspiration datasets were used in this study, including four remote sensing (RS) datasets, four machine learning (ML) datasets, two reanalysis (RA) datasets, and 20 datasets based on land surface models (LSMs) (Table 2 and Fig. 1). Download links for all ET datasets are in Table S1 of the supplementary material. The Penman-Monteith-Leuning (PML) estimates are calculated using the observation-driven PML model (Zhang et al., 2016). The basic principle of the Global Land Evaporation Amsterdam Model (GLEAM) is to maximise the recovery of ET information contained in current satellite-observed climate and environmental variables to derive values for the different components of terrestrial ET (Martens et al., 2017). The Global Land Surface Satellite (GLASS) evapotranspiration dataset is a long-time-series, high-resolution, high-precision remote sensing inversion dataset based on multi-source remote sensing data and measured station data obtained through inversion algorithms (Liang et al., 2013). The PLSH dataset was obtained based on AVHRR remotely sensed data and reanalysed meteorological data inverted with the improved Penman-Monteith formula (Zhang et al., 2015). The FLUXCOM datasets use meteorological observations and satellite data as inputs to upscale evapotranspiration estimates from 224 flux tower sites using three machine learning methods (random forest algorithm, artificial neural network, and multivariate adaptive regression spline) (Jung et al., 2019). Three FLUXCOM datasets were included in this study – FLUXCOM-CRUNCEP_v8, FLUXCOM-GSWP3, and FLUXCOM-WFDEI – each with different input data. The Model Tree Ensemble Evapotranspiration (MTE) dataset is based on global flux site observations, combining MODIS data and meteorological data, and using machine learning to extrapolate the data from the site scale to the global scale (Jung et al., 2011). ERA5-Land (the land component of the European Centre for Medium-Range Weather Forecasts [ECMWF] ReAnalysis v5) is produced by inversion of the terrestrial component of the ERA5 climate reanalysis data (Muñoz-Sabater et al., 2021). The production combines climate model data with monitoring data from meteorological observatories to form a globally complete and continuous data set using the laws of physics. The MERRA-Land (Modern-Era Retrospective Analysis for Research and Applications, land only) dataset focuses more on historical analyses of the hydrological cycle over a wide range of weather and climate scales (Reichle et al., 2011). GLDAS stands for Global Land Data Assimilation System, and its goal is to use advanced land surface modelling, assimilation techniques, and the assimilation of satellite- and ground-based observational datasets to produce optimal land surface states and flux fields. The study used three GLDAS datasets that differed based on the surface model used: GLDAS CLSM, GLDAS NOAH, and GLDAS VIC (Rodell et al., 2004). Version 12 of the TRENDY programme (TRENDY v12) was chosen for this study (corresponding to dataset IDs 14–30 in Table 2), and all simulations follow the same boundary conditions and simulation specifications and are therefore well comparable (Friedlingstein et al., 2023).
Table 2Information for 30 evapotranspiration datasets.
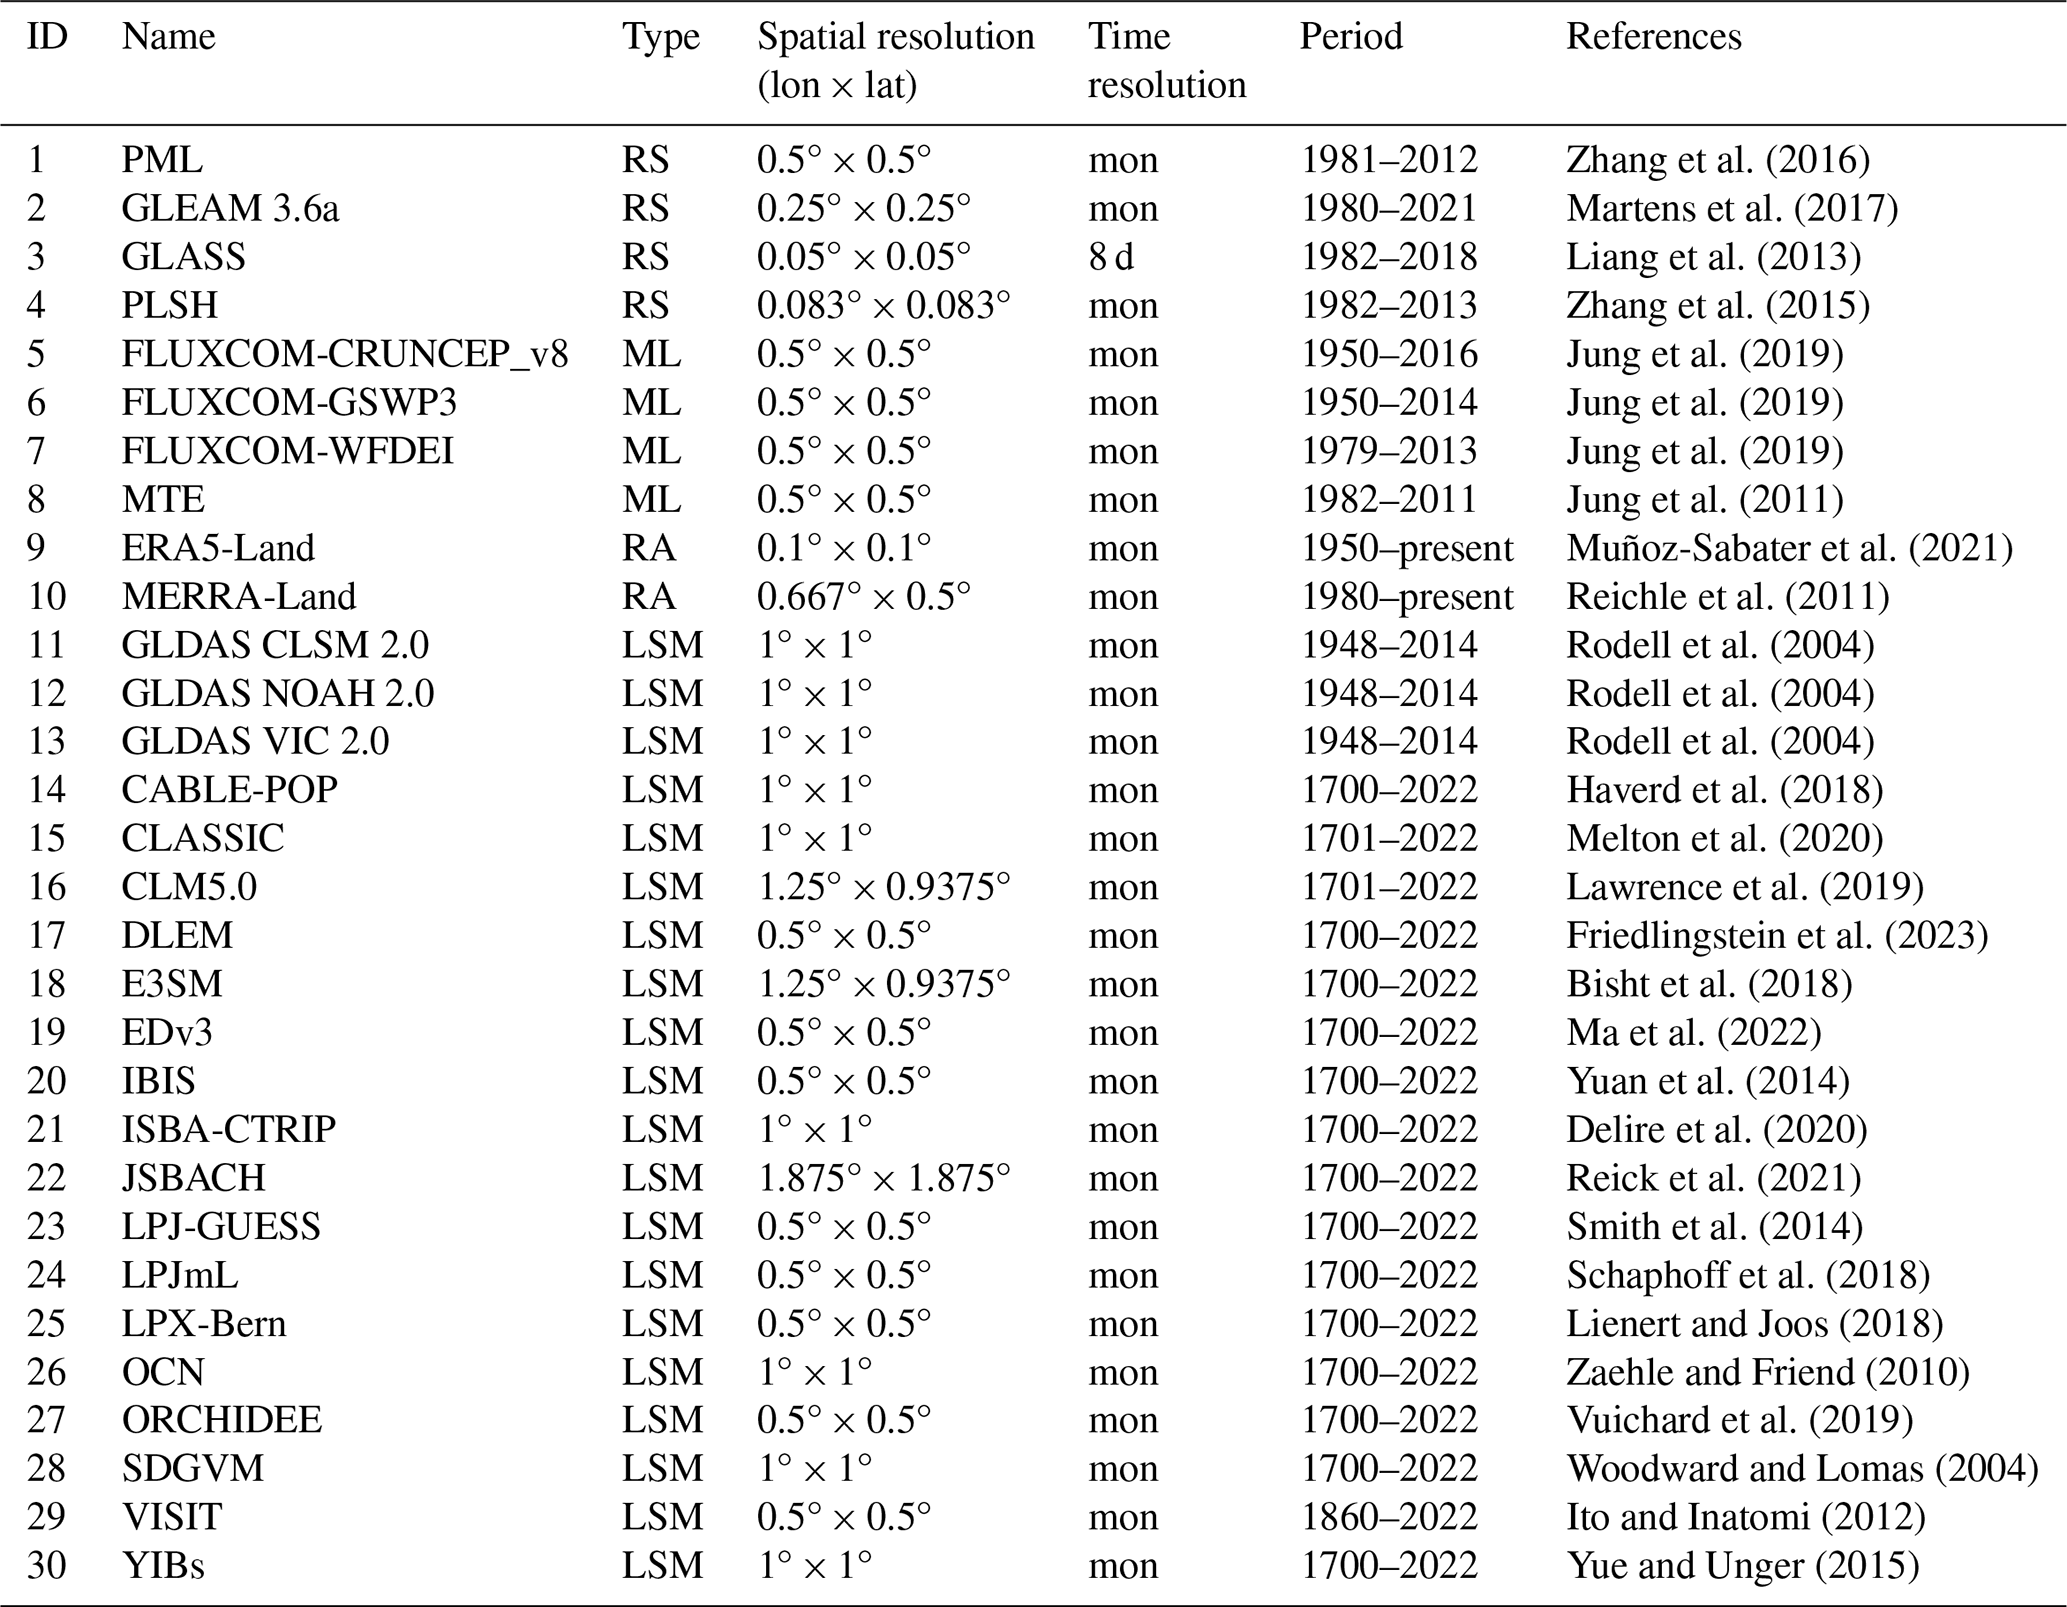
Note: In the table, RS is used for remote sensing, ML for machine learning, RA for reanalysis, and LSM for land surface model; “mon” indicates a time resolution of one month.
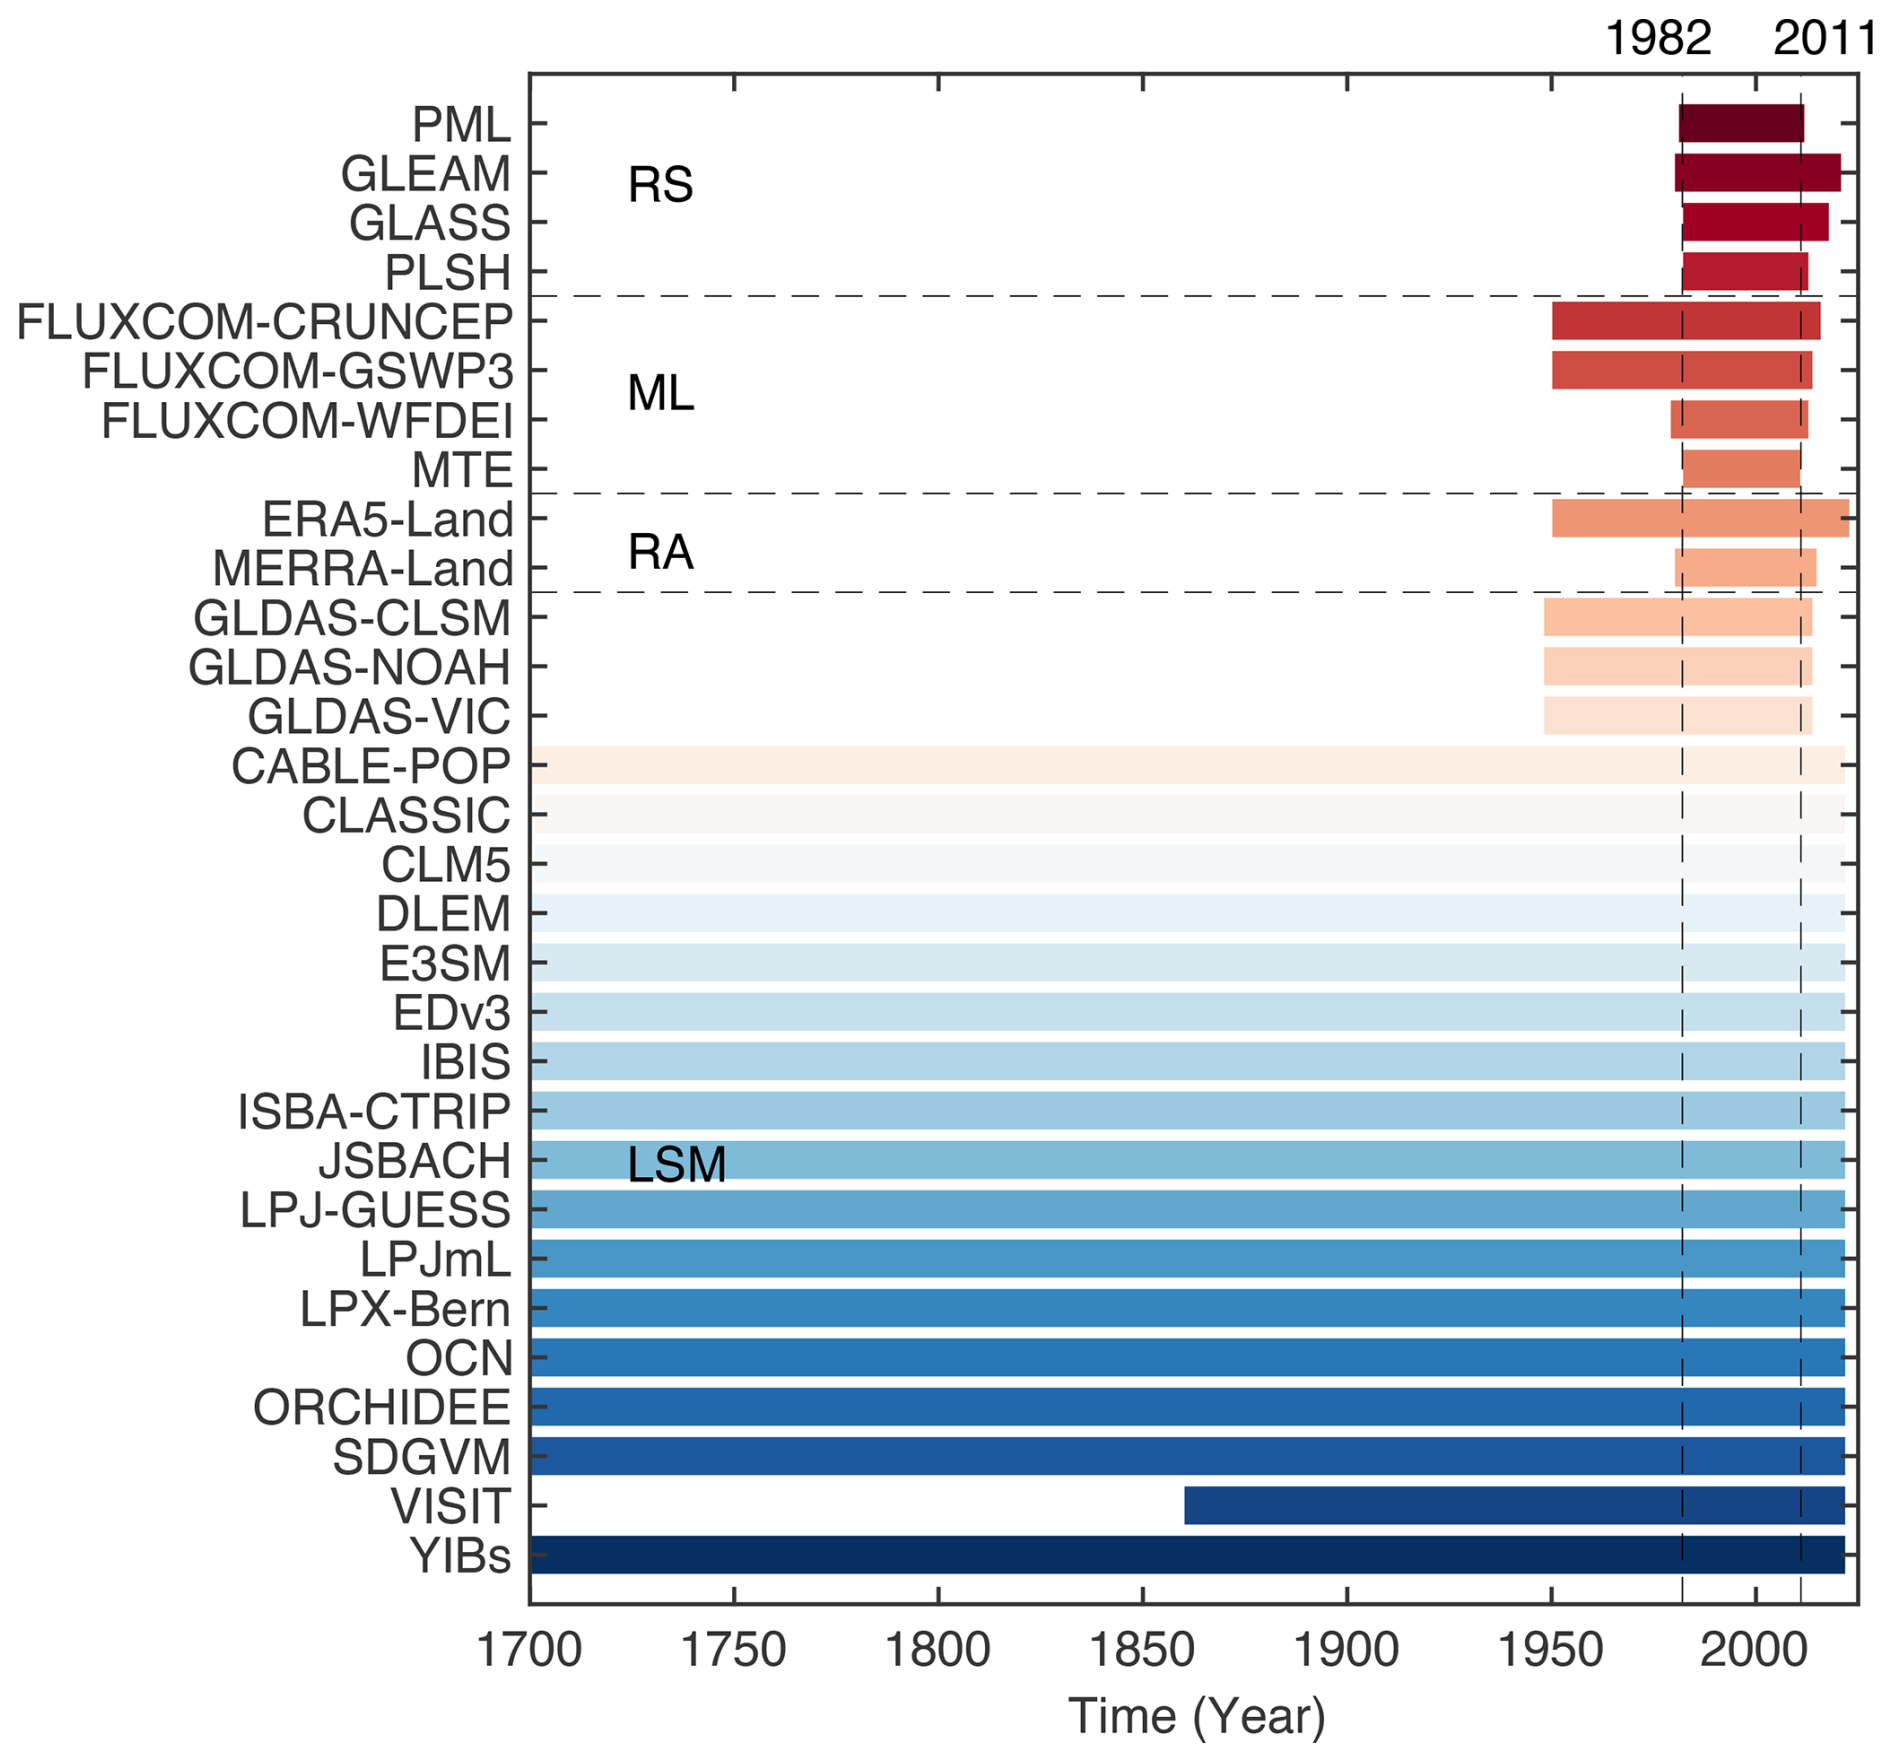
Figure 1Years of coverage for each evapotranspiration dataset, with 1982–2011 being the common period of coverage for all evapotranspiration datasets. Dataset types are labelled as follows, by group: RS = remote sensing; ML = machine learning; RA = reanalysis; LSM = land surface model.
2.1.2 Site data
In order to evaluate the evapotranspiration datasets, the study used observations from FLUXNET2015 flux sites (Fig. S1, Tables S2–S4). Flux site data are from the FLUXNET2015 dataset, which covers 212 flux sites worldwide and documents flux observations on near-surface carbon, water, and energy; quality control information; and uncertainty quantification results collected from 1991 to 2014 (accessed at https://fluxnet.org/data/fluxnet2015-dataset, last access: 25 October 2025). The FLUXNET2015 dataset provides continuous measurements of carbon and energy fluxes at half-hourly to hourly intervals via the eddy covariance method (Baldocchi et al., 2001; Ma et al., 2021). The study subsequently refers to the observational dataset as ET from FLUXNET2015. Based on MODIS IGBP (International Geosphere-Biosphere Programme) land cover, the flux sites can be classified into 12 vegetation types (see Fig. S1 in the Supplement). These sites are distributed across the major climatic zones (tropical, subtropical, temperate, and boreal) and continents (Asia, Africa, South America, Oceania, and especially Europe and North America) (Fig. S1). Specific flux site data processing is described in Supplement Text S1. Ultimately, our study retained 174 flux sites. In addition, we also validated the energy balance closure on the flux site data (Supplement Text S2 and Fig. S2). We found that the flux sites for most vegetation types were consistent with energy balance closure, so the 174 sites screened by the study are reliable and can be used for accuracy evaluation of ET datasets.
We used independent data sources to validate ET fusion dataset, specifically including AmeriFlux (accessed at https://ameriflux.lbl.gov/data, last access: 25 October 2025), ChinaFlux (accessed at http://rs.cern.ac.cn/data/initDRsearch, last access: 25 October 2025), and ICOS (accessed at https://www.icos-cp.eu/data-products/ecosystem-release, last access: 25 October 2025). The site information of AmeriFlux, ChinaFlux, and ICOS list in Tables S5–S7.
2.1.3 Other datasets
To assess global ET datasets at the basin scale, a total of 32 basins across the globe were selected for this study, and basin boundary data were obtained from HydroBasins Level 3 basin boundaries (accessed at https://www.hydrosheds.org/products/hydrobasins#downloads, last access: 25 October 2025) (Table S8). The streamflow data were obtained from the Dai and Trenberth Global River Flow and Continental Discharge Dataset (accessed at http://www.cgd.ucar.edu/cas/catalog/surface/dai-runoff/index.html, last access: 25 October 2025) and the Global Runoff Data Centre (accessed at http://www.bafg.de/GRDC/EN/Home/homepage_node.html, last access: 25 October 2025) (Table S8). Precipitation data were obtained from the Global Precipitation Climatology Centre (GPCC), which provides a global land-surface gridded precipitation dataset based on approximately 86 100 rain gauges and stations worldwide. The advantage of GPCC is the use of a large number of station observations. The spatial resolution is 1° × 1°. Data are available from https://psl.noaa.gov/data/gridded/data.gpcc.html (last access: 25 October 2025).
The MCD12Q1 data are considered in this study. The MCD12Q1 data is a fusion of data from sensors Terra and Aqua, with a spatial resolution of 500 m, and provides interannual global data on land cover types (from 2001 onwards), containing six classification systems, where the International Geosphere Biosphere Programme (IGBP) is used (Cai et al., 2014). The IGBP classifies land cover types into 17 categories, including 11 natural vegetation classifications, 3 land use and land mosaics, and 3 unvegetated land classifications. The product uses supervised classification in addition to additional post-processing of the data, i.e., some a priori knowledge and ancillary data are incorporated to improve the accuracy of the classification. This study uses the MOD12 Q1 dataset to classify global land cover (Fig. S3).
2.2 Methods
Prior to the evaluation and fusion of the ET datasets, the spatial resolution of all ET datasets was standardized to 0.5° × 0.5° and 1° × 1° using a bilinear interpolation method. This study compared the differences in ET data at 1 and 0.5° globally and under each vegetation type, respectively. The results show that the sensitivity to spatial resolution is low for each ET dataset (Fig. S4). Since the common coverage period for the 30 ET datasets is 1982–2011, the ET evaluations in this study are also focused on this time period. ET dataset uncertainty is characterised using standard deviation. The evaluation of ET datasets covers three specific aspects. First, site scale: thirty ET datasets were assessed for accuracy at site scale using the three statistical indicators described below. Evaluations of site scale were carried out based on 1991–2011 (the years of common coverage of the flux station data and the 30 sets of ET datasets).
-
Correlation coefficient (R)
-
Mean absolute error (MAE)
-
Root-mean-square error (RMSE)
where n is the number of samples, xi is the estimated monthly value of the evapotranspiration dataset, yi is the observed monthly value of the evapotranspiration site, and and are the mean values of xi and yi, respectively.
Second, the basin water balance approach was used for ET evaluation at the basin scale (Supplement Text S3). Third, the global-scale ET evaluation used the three-cornered hat (TCH) method (Supplement Text S4). Using the TCH method, we obtained the TCH uncertainty and relative uncertainty for each ET dataset, where the relative uncertainty is calculated as the ratio of the uncertainty to the mean value of the time series. We also used standardized Taylor diagrams for comprehensive evaluation of ET datasets (Supplement Text S5).
Finally, evapotranspiration fusion was completed using a BMA method. The 30 sets of ET datasets are clustered and then fused. First, we calculated a Pearson correlation coefficient matrix using the residuals from the 30 sets of ET datasets with observations from FLUXNET2015 sites. Second, the 30 sets of ET datasets were clustered based on the residual correlation coefficient matrix (Table S9). Third, for each vegetation type, the BMA fusion of the ET data within each cluster was performed first, and then the BMA fusion of the fused data for each cluster was performed.
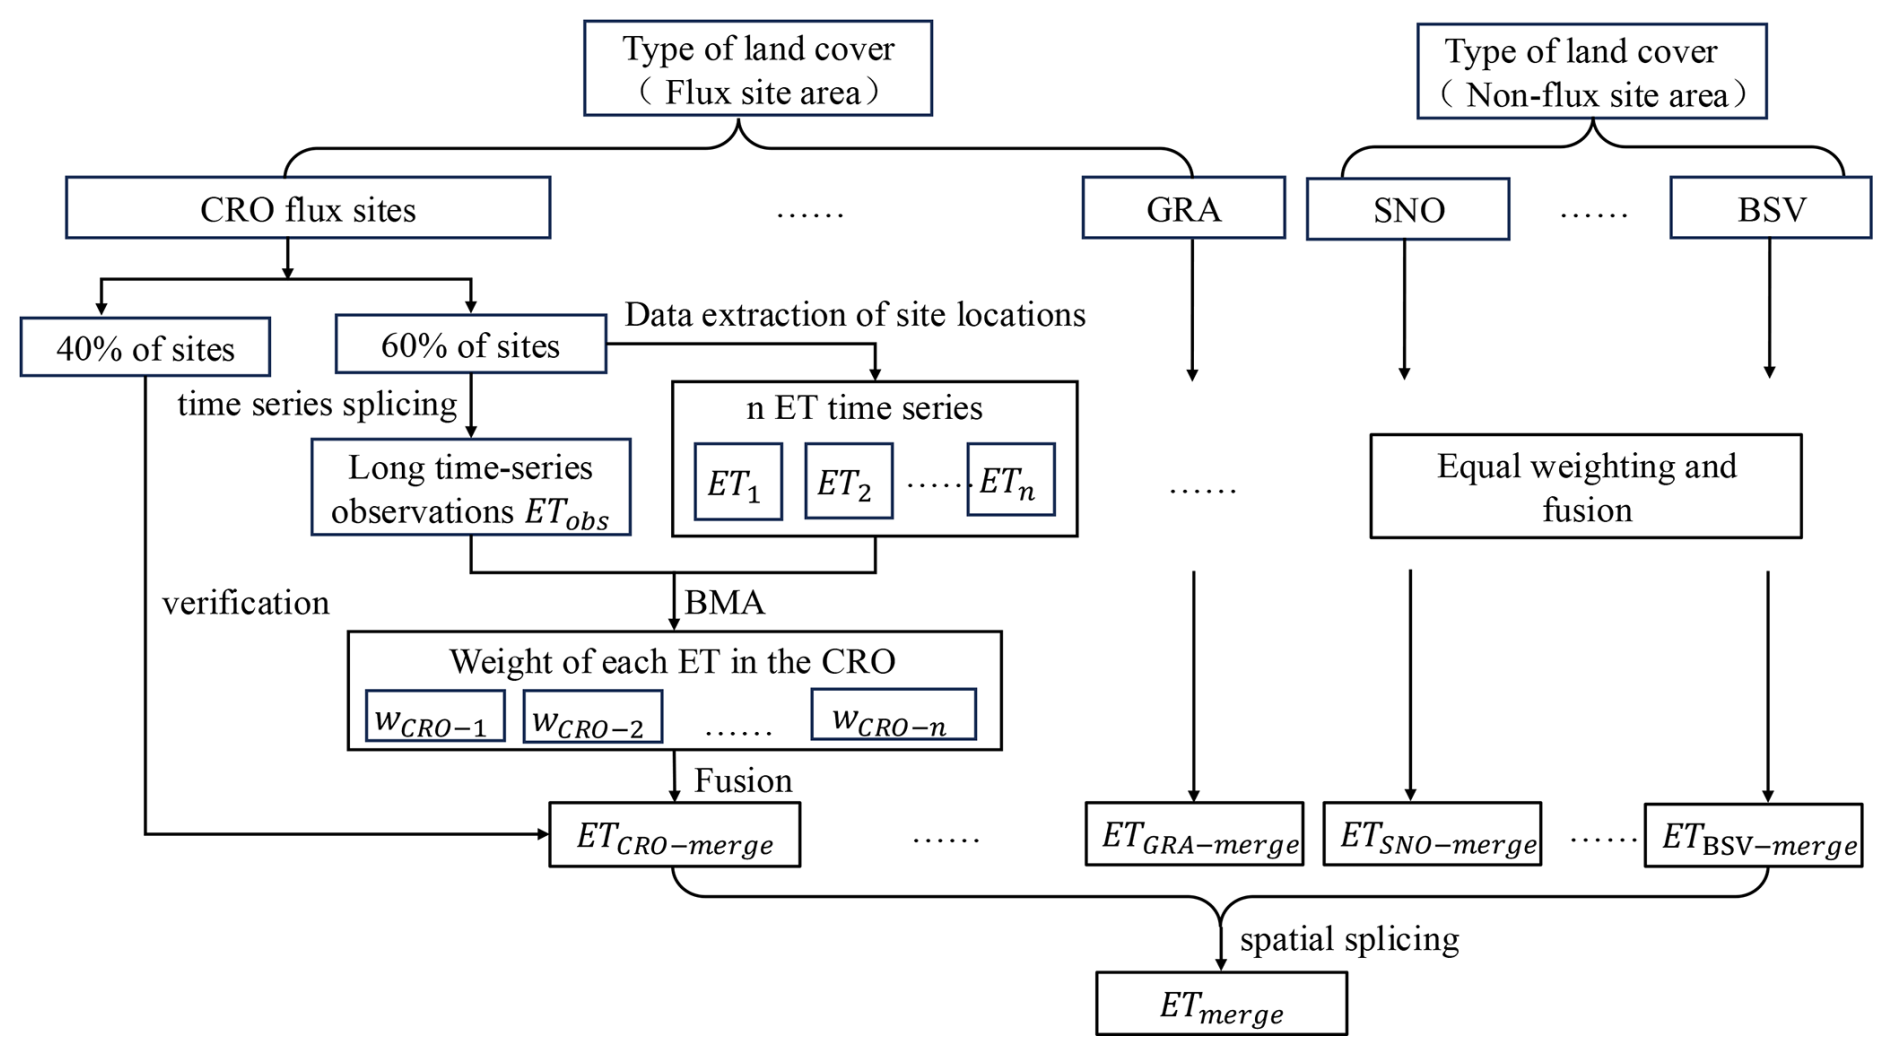
The specific BMA fusion steps are shown in Fig. 2 and are explained as follows: (1) The sites were partitioned according to land cover type. We took cropland (CRO) as an example, a total of 16 CRO sites were involved, and 60 % of the sites (corresponding to 10 sites) were selected to participate in the BMA fusion, while 40 % of the sites (corresponding to 6 sites) were used for validation. (2) Due to the overall short coverage time period of the flux sites, all cropland sites were considered as one site in this study, and the time series were spliced to obtain a longer time series of site observations (ETobs). (3) For each ET dataset, data from the 10 site locations and times identified above were spliced, and this step traversed all the ET datasets, resulting in n time series (ET1…,ETn), with length the same as ETobs, where n refers to the number of ET products. (4) ETobs was used as an observation to perform a BMA analysis of the n ET sequences, thus obtaining the weight of each ET dataset under cropland vegetation type, denoted as wCRO-1…,wCRO-n, where . This weight was applied to all cropland grid points for each ET dataset. (5) Fusion of all ET datasets was achieved using the following: . (6) The above steps 1 to 5 were repeated to obtain the ET fusion datasets for all other vegetation types. (7) The ET fusion datasets for each vegetation type were spliced to obtain the final global ET fusion dataset. (8) The remaining six cropland stations from step 1 were used to validate and evaluate the accuracy of the global ET fusion datasets in cropland. The BMA analyses were carried out based on 1991–2011 (the years of common coverage for the flux station data and the 30 sets of ET datasets). The datasets obtained from the final fusion were denoted as BMA-ET.
It is important to note that land cover types change over time, and 2001 land cover classifications are used in this study. Also, note that 10 vegetation cover types do not cover the entire study area. For areas not covered, an equal weighting approach was taken. Calculation formulas for the BMA algorithm are shown in Supplement Text S6. The weighting scheme for determining years with non-overlapping coverage in the ET fusion process is addressed in Supplement Text S7 and Fig. S5.
3.1 Evaluation of evapotranspiration data
The basic spatial pattern found for evapotranspiration is that it is larger at low equatorial latitudes and smaller at high latitudes and altitudes (Figs. S6 and S7). The global spatial patterns across the 30 evapotranspiration datasets are generally similar, but some differences are apparent (Fig. S6). In the Amazon and Central African regions, evapotranspiration is higher for GLASS, JSBACH, ISBA-CTRIP, and SDGVM and lower for GLDAS-VIC, CLASSIC, and LPX-Bern. In terms of evapotranspiration categories, remote sensing-based ET datasets are larger and machine learning-based ET datasets are smaller in the above regions (Fig. S7). Overall, ET shows a three-peaked distribution of equatorial high and bipolar low, globally. Remote sensing-based evapotranspiration datasets have the largest evapotranspiration near the equator, with mean values of evapotranspiration exceeding 1300 mm in this latitudinal band (Fig. S7). In particular, the greater the multi-year average of global evapotranspiration, the greater the differences among ET datasets (Fig. S8). After considering ET values, ET uncertainty (variation among ET datasets) is greater in the Sahara Desert, the Middle East, the Tibetan Plateau, and Central Australia (Fig. S9). The interannual trends in ET datasets also show large differences (Fig. S9). The largest trends in ET are in ERA5-Land and MERRA-Land, where the decreasing trends in ET exceed 4 mm yr−1 at low latitudes. ET trends of the three FLUXCOM datasets and MTE are small in most parts of the globe, with both increasing and decreasing trends of less than 1 mm yr−1. Overall, machine learning-based ET datasets show a smaller trend during 1982–2011, while reanalysis-based ET datasets have a larger decreasing trend at low equatorial latitudes (Fig. 3). ET shows an increasing trend in regions such as northern North America, Southern Africa, North Asia, and Australia.
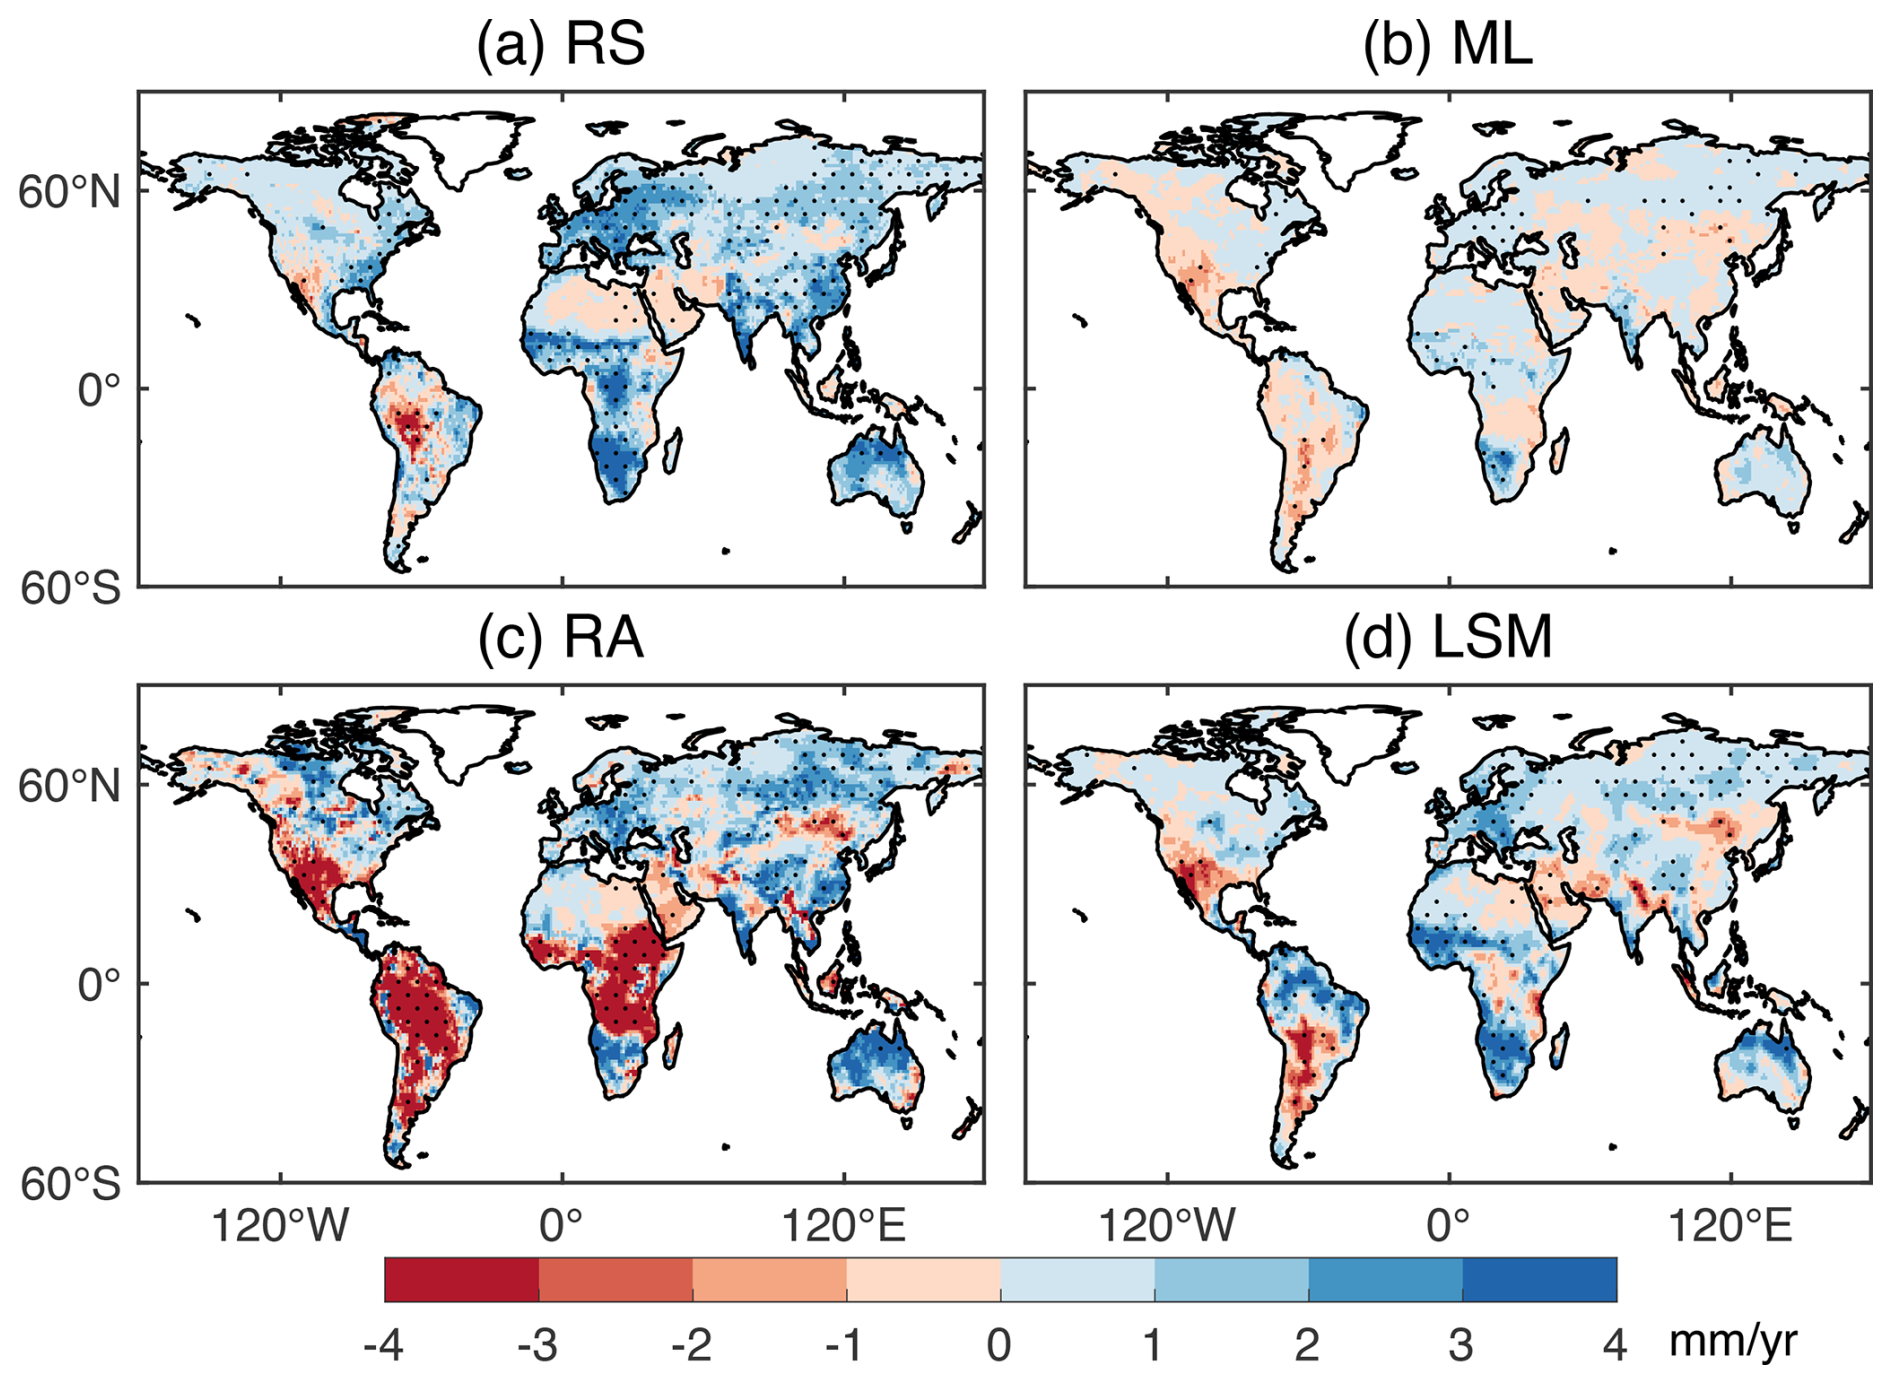
Figure 3Interannual trends of multi-dataset medians in the four categories of evapotranspiration datasets during 1982–2011 (the black dotted areas indicate that the trend in these cells was significant at the 95 % level).
3.1.1 Site scale
Using data from the ET from FLUXNET2015, we evaluated the accuracy of the 30 ET datasets over the globe at site scale. The correlation coefficients for the four types of ET data are similar, but the MAE and RMSE are lower for the land-surface-model-based ET datasets (Fig. 4). The correlation coefficients for PML, GLASS, and MTE data are the highest among the 30 ET datasets, while the MAE and RMSE are the lowest for GLADS-VIC, EDv3, LPJmL, and LPX-Bern. Over 60 % of sites in most of the ET datasets have correlation coefficients of 0.6 or higher, with higher correlation coefficients and lower MAE (less than 10 mm) and RMSE (less than 20 mm) in regions such as Europe and North America (Figs. S10, S11 and S12). These are also the areas with the highest density of flux sites.
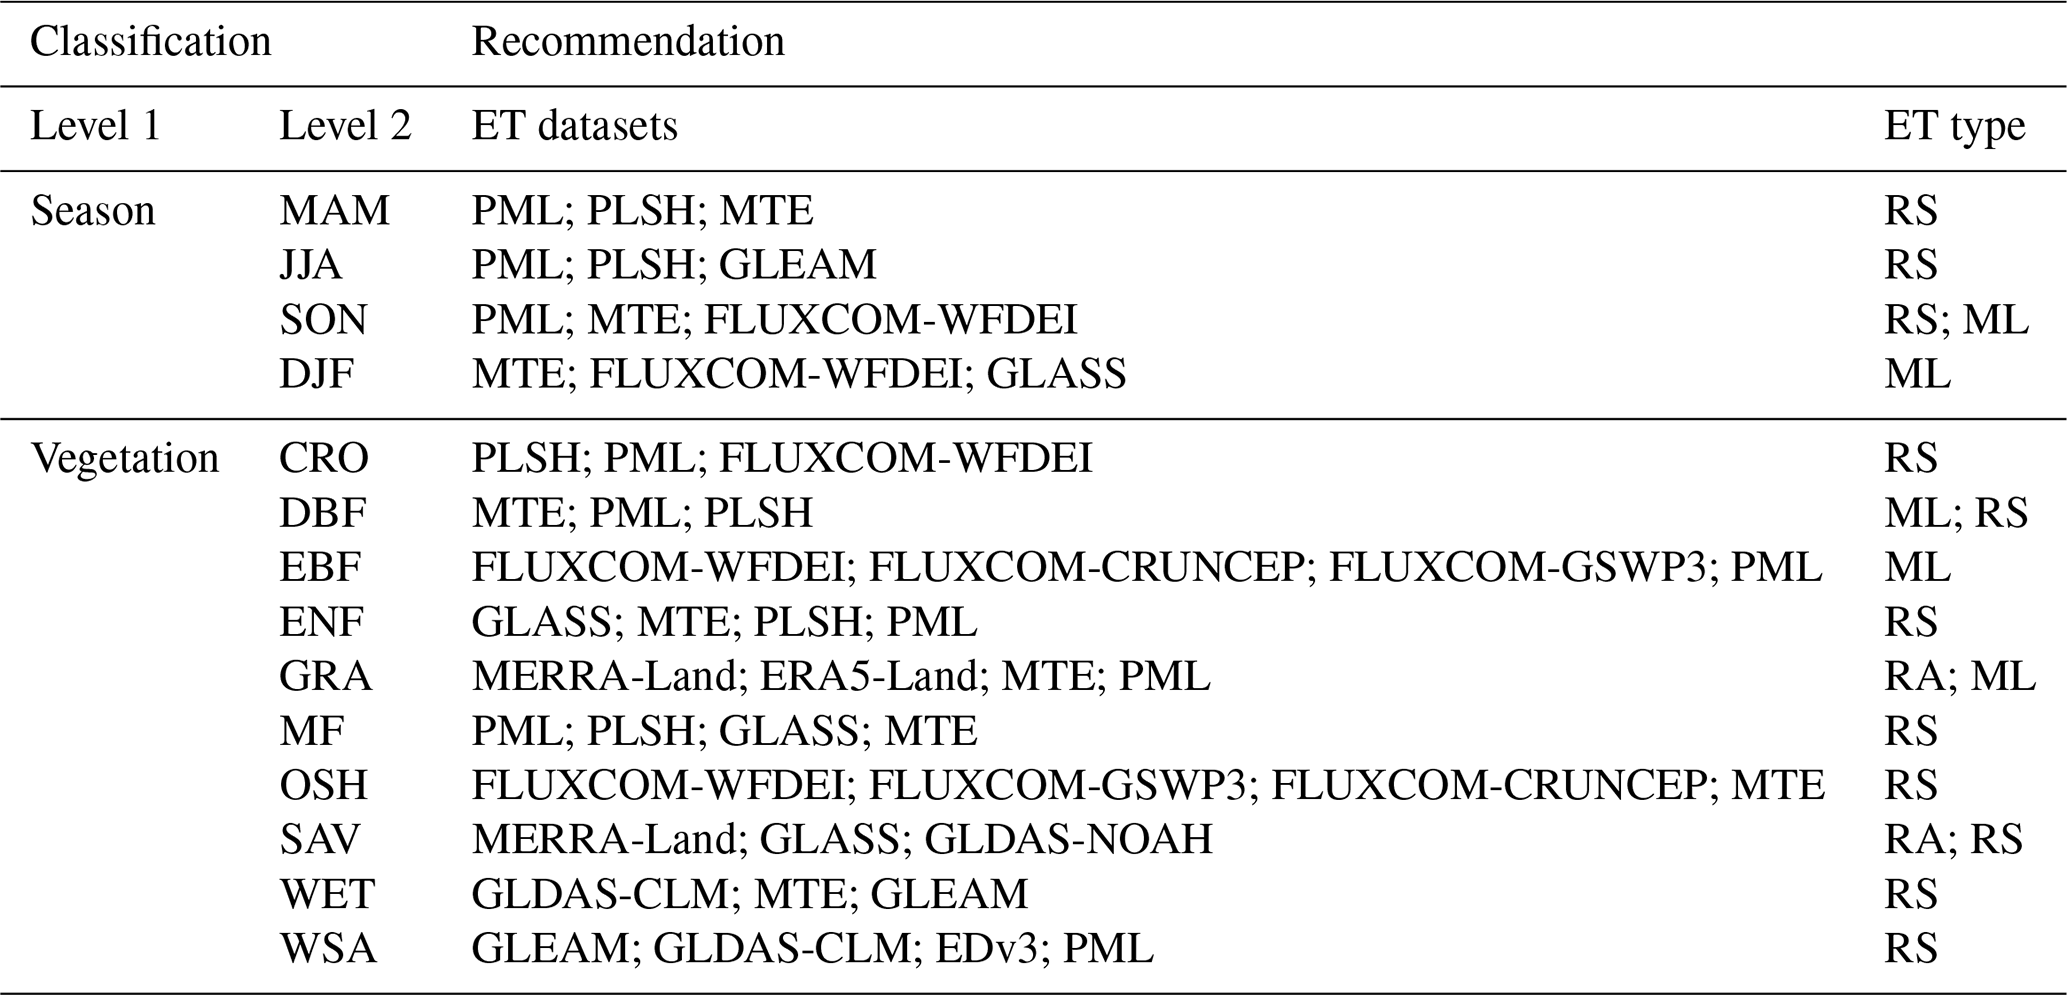
On a seasonal scale, the correlation coefficients between the ET estimates for each ET dataset and the site ET were higher in the Northern Hemisphere fall (September–November), with a mean correlation coefficient of 0.76, and second highest in the Northern Hemisphere spring (March–May), with a mean correlation coefficient of 0.6 (Figs. S13, S14 and S15). In contrast, the correlation coefficients for the northern hemisphere summer (June–August) and winter (December–February) are lower, indicating that the ET datasets perform poorly in summer and winter. Considering both the correlation coefficient and the root mean square error metrics, the overall performance of the PML and MTE datasets is superior in all four seasons compared to the other ET datasets. In the Northern Hemisphere spring (March–May), summer (June–August), and fall (September–November), the remotely sensed inversion-based ET dataset performed better compared to the FLUXNET2015 site ET. The correlation coefficients between the ET estimates from the machine learning-based reconstructed ET datasets and the FLUXNET2015 site ET were higher during the northern hemisphere winter months (December–February), while the root-mean-square errors for these datasets were also lower.
In terms of vegetation types, the MTE dataset performed better in most vegetation types except savannas (SAV), wetlands (WET), and woody savannas (WSA) (Figs. S16, S17 and S18). The PML dataset, on the other hand, performed better in most vegetation types other than CRO, mixed forests (MF) and WSA. For evergreen broadleaf forests (EBF), grasslands (GRA), and SAV, ET datasets reconstructed based on machine learning outperform other ET datasets. In other vegetation types, the remote sensing-based ET dataset performed more prominently. Among the CRO types, the ET dataset based on remote sensing inversion and land surface model simulation performed better. Overall, all ET datasets performed poorly in SAV and WSA, and the correlation coefficients for most datasets were below 0.2 (Fig. S19). Most of the ET datasets performed well in closed shrublands (CSH), GRA and MF, with the remote sensing inversion-based ET datasets performing particularly well in CSH, with correlation coefficients exceeding 0.8.
After considering the performance of each ET dataset in terms of season and vegetation type, we recommend remote sensing- and machine learning-based ET datasets (Table 3).
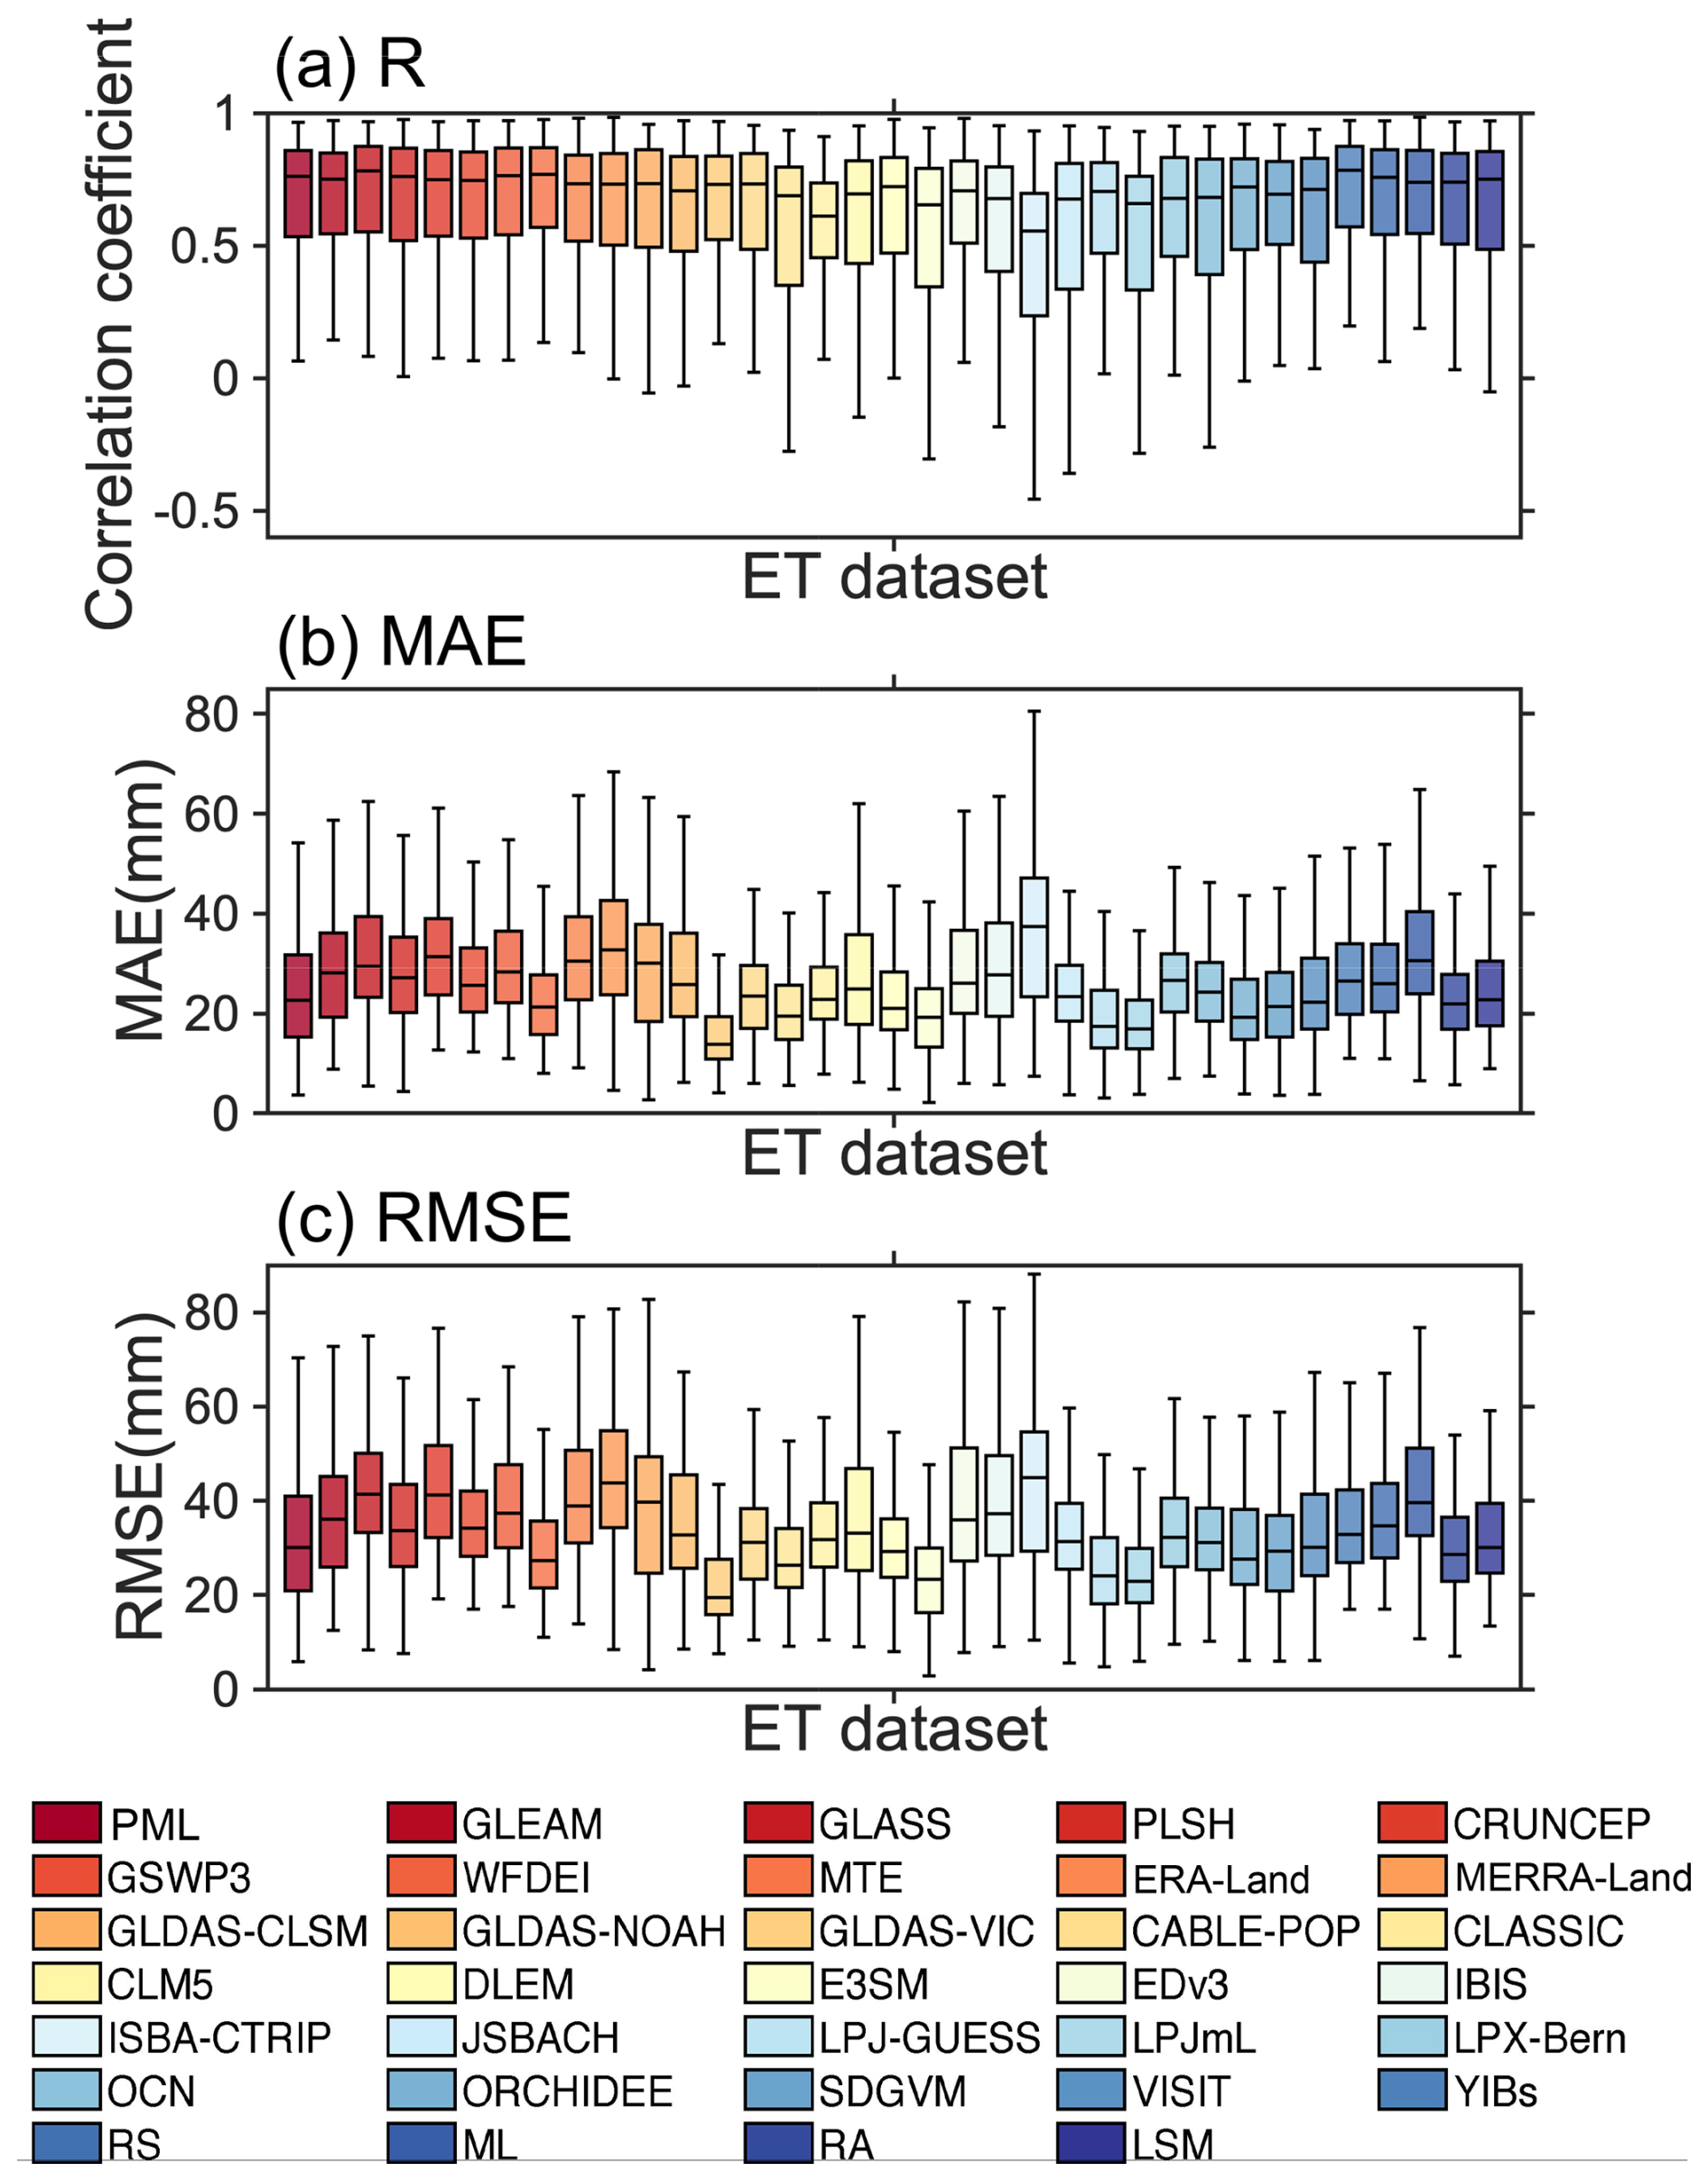
Figure 4Correlation coefficients (R), mean absolute error (MAE), and root-mean-square error (RMSE) for ET from FLUXNET2015 and each ET dataset during 1991–2011 (for each box, the centre horizontal line represents the median of the sample, the upper and lower borders of the line represent the 75th and 25th percentiles, respectively, and the two “whiskers” extend to the maximum and minimum values that are not considered outliers; outliers are plotted separately).
3.1.2 Basin scale
By comparing the multi-year average evapotranspiration from the 30 ET datasets with the multi-year average observed evapotranspiration from the basin water balance, we found that the R2 of the two reached more than 0.8 in most of the ET datasets, except for EDv3 (Fig. S20). In nearly two-thirds of the ET datasets, R2 actually exceeds 0.9. Compared with water balance-based observational ET, ISBA-CTRIP, JSBACH, and GLDAS-CLSM perform better at the basin scale compared to other ET datasets (Fig. S21). Among them, only EDv3 and GLASS have correlation coefficients below 0.9. Remote sensing- and machine learning-based ET datasets have relatively greater TCH uncertainty, especially for PML, GLASS, CRUNCEP, and MTE, and TCH uncertainty is generally greater in low-latitude basins than that in high-latitude basins (Fig. S22). However, in terms of relative uncertainty for TCH, the relative uncertainty is greater for CRUNCEP, MERRA-Land, and MTE (Fig. 5). At the same time, the relative uncertainty of TCH in the low- and high-latitude basins shows the opposite behaviour of the TCH uncertainty, being smaller in the low-latitude basins and larger in the high-latitude basins (Fig. 5). Land-surface-model-based ET datasets have less relative uncertainty of TCH at the basin scale compared to the other three types of ET datasets, whereas machine learning- and reanalysis-based datasets have greater TCH relative uncertainty.
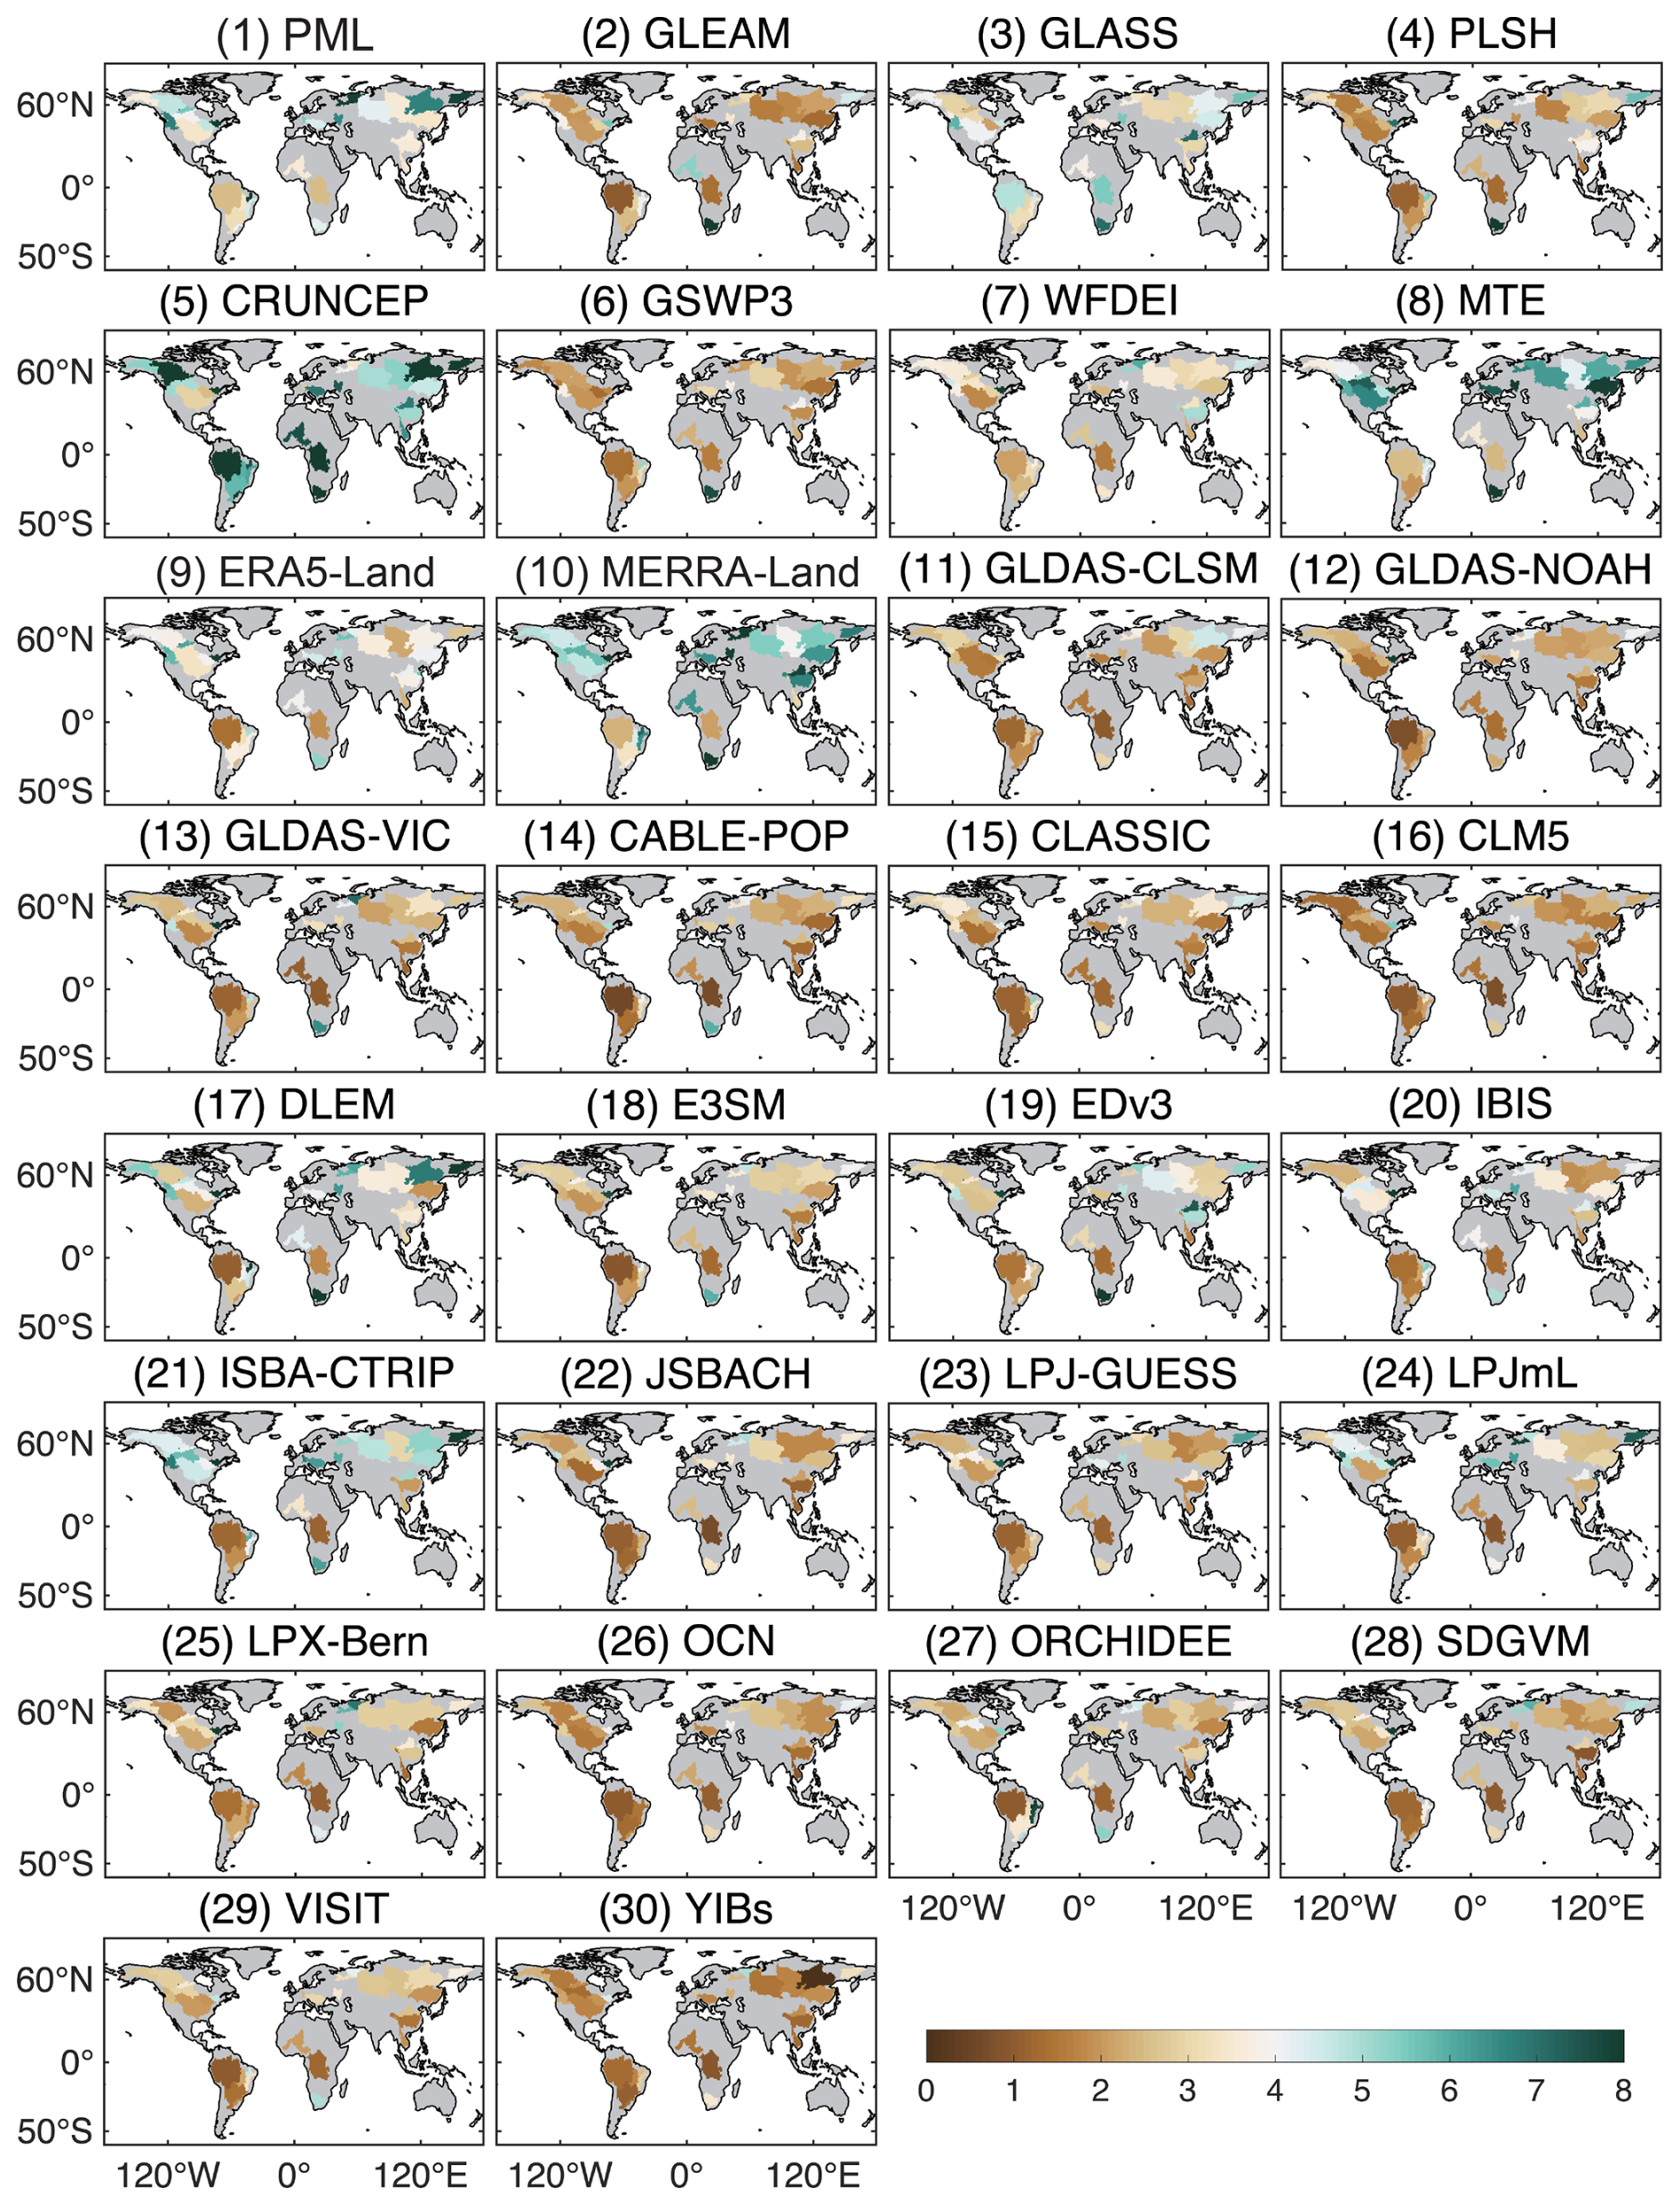
Figure 5Spatial distribution of relative uncertainty of TCH during 1982–2011 for 32 basins (%).
3.1.3 Global scale
The TCH analysis of global ET datasets shows that machine learning–based ET datasets have relatively low uncertainty, especially MTE (Fig. S23). The MTE dataset has less uncertainty at high latitudes and more uncertainty at low latitudes, while the relative uncertainty is the opposite. Uncertainties in the datasets MERRA-Land, CLM5, EDv3 and JSBACH are large, whereas uncertainties in GLDAS-CLSM and SDGVM are smaller in the northern hemisphere and larger in the southern hemisphere. For TCH relative uncertainty, machine learning- and remote sensing-based datasets have less relative uncertainty (Fig. S24). GLDAS-VIC, CLM5, EDv3, and LPX-Bern have large relative uncertainties of TCH, and areas with larger relative uncertainties are predominantly located at high latitudes. Overall, the relative uncertainty is lower in regions with larger ET values, such as the Amazon, Central and Southern Africa, and Southeast Asia.
3.2 Evapotranspiration dataset fusion
Thirty global ET datasets were fused based on the BMA approach, hereafter referred to as BMA-ET (Fig. 6). Areas of high evapotranspiration are mainly found at low equatorial latitudes, such as the Amazon, central Africa, and Southeast Asia. The Sahara Desert, the Middle East, and the Tibetan Plateau have less evapotranspiration. ET trends are positive in most parts of the globe during 1980–2020, and the main regions with high ET trends are the Amazon, Europe, Southern Africa, and the Indian Peninsula. Decreasing trends in ET are apparent in a few regions, such as southern North America, central South America, eastern Africa, western Asia, and eastern India, with some decreasing trends of more than 3 mm yr−1 (Fig. 6). From 1980 to 2020, the global terrestrial averaged ET showed an overall increasing trend of 0.65 (0.51–0.78) mm yr−1 (p<0.01) (Fig. S25).
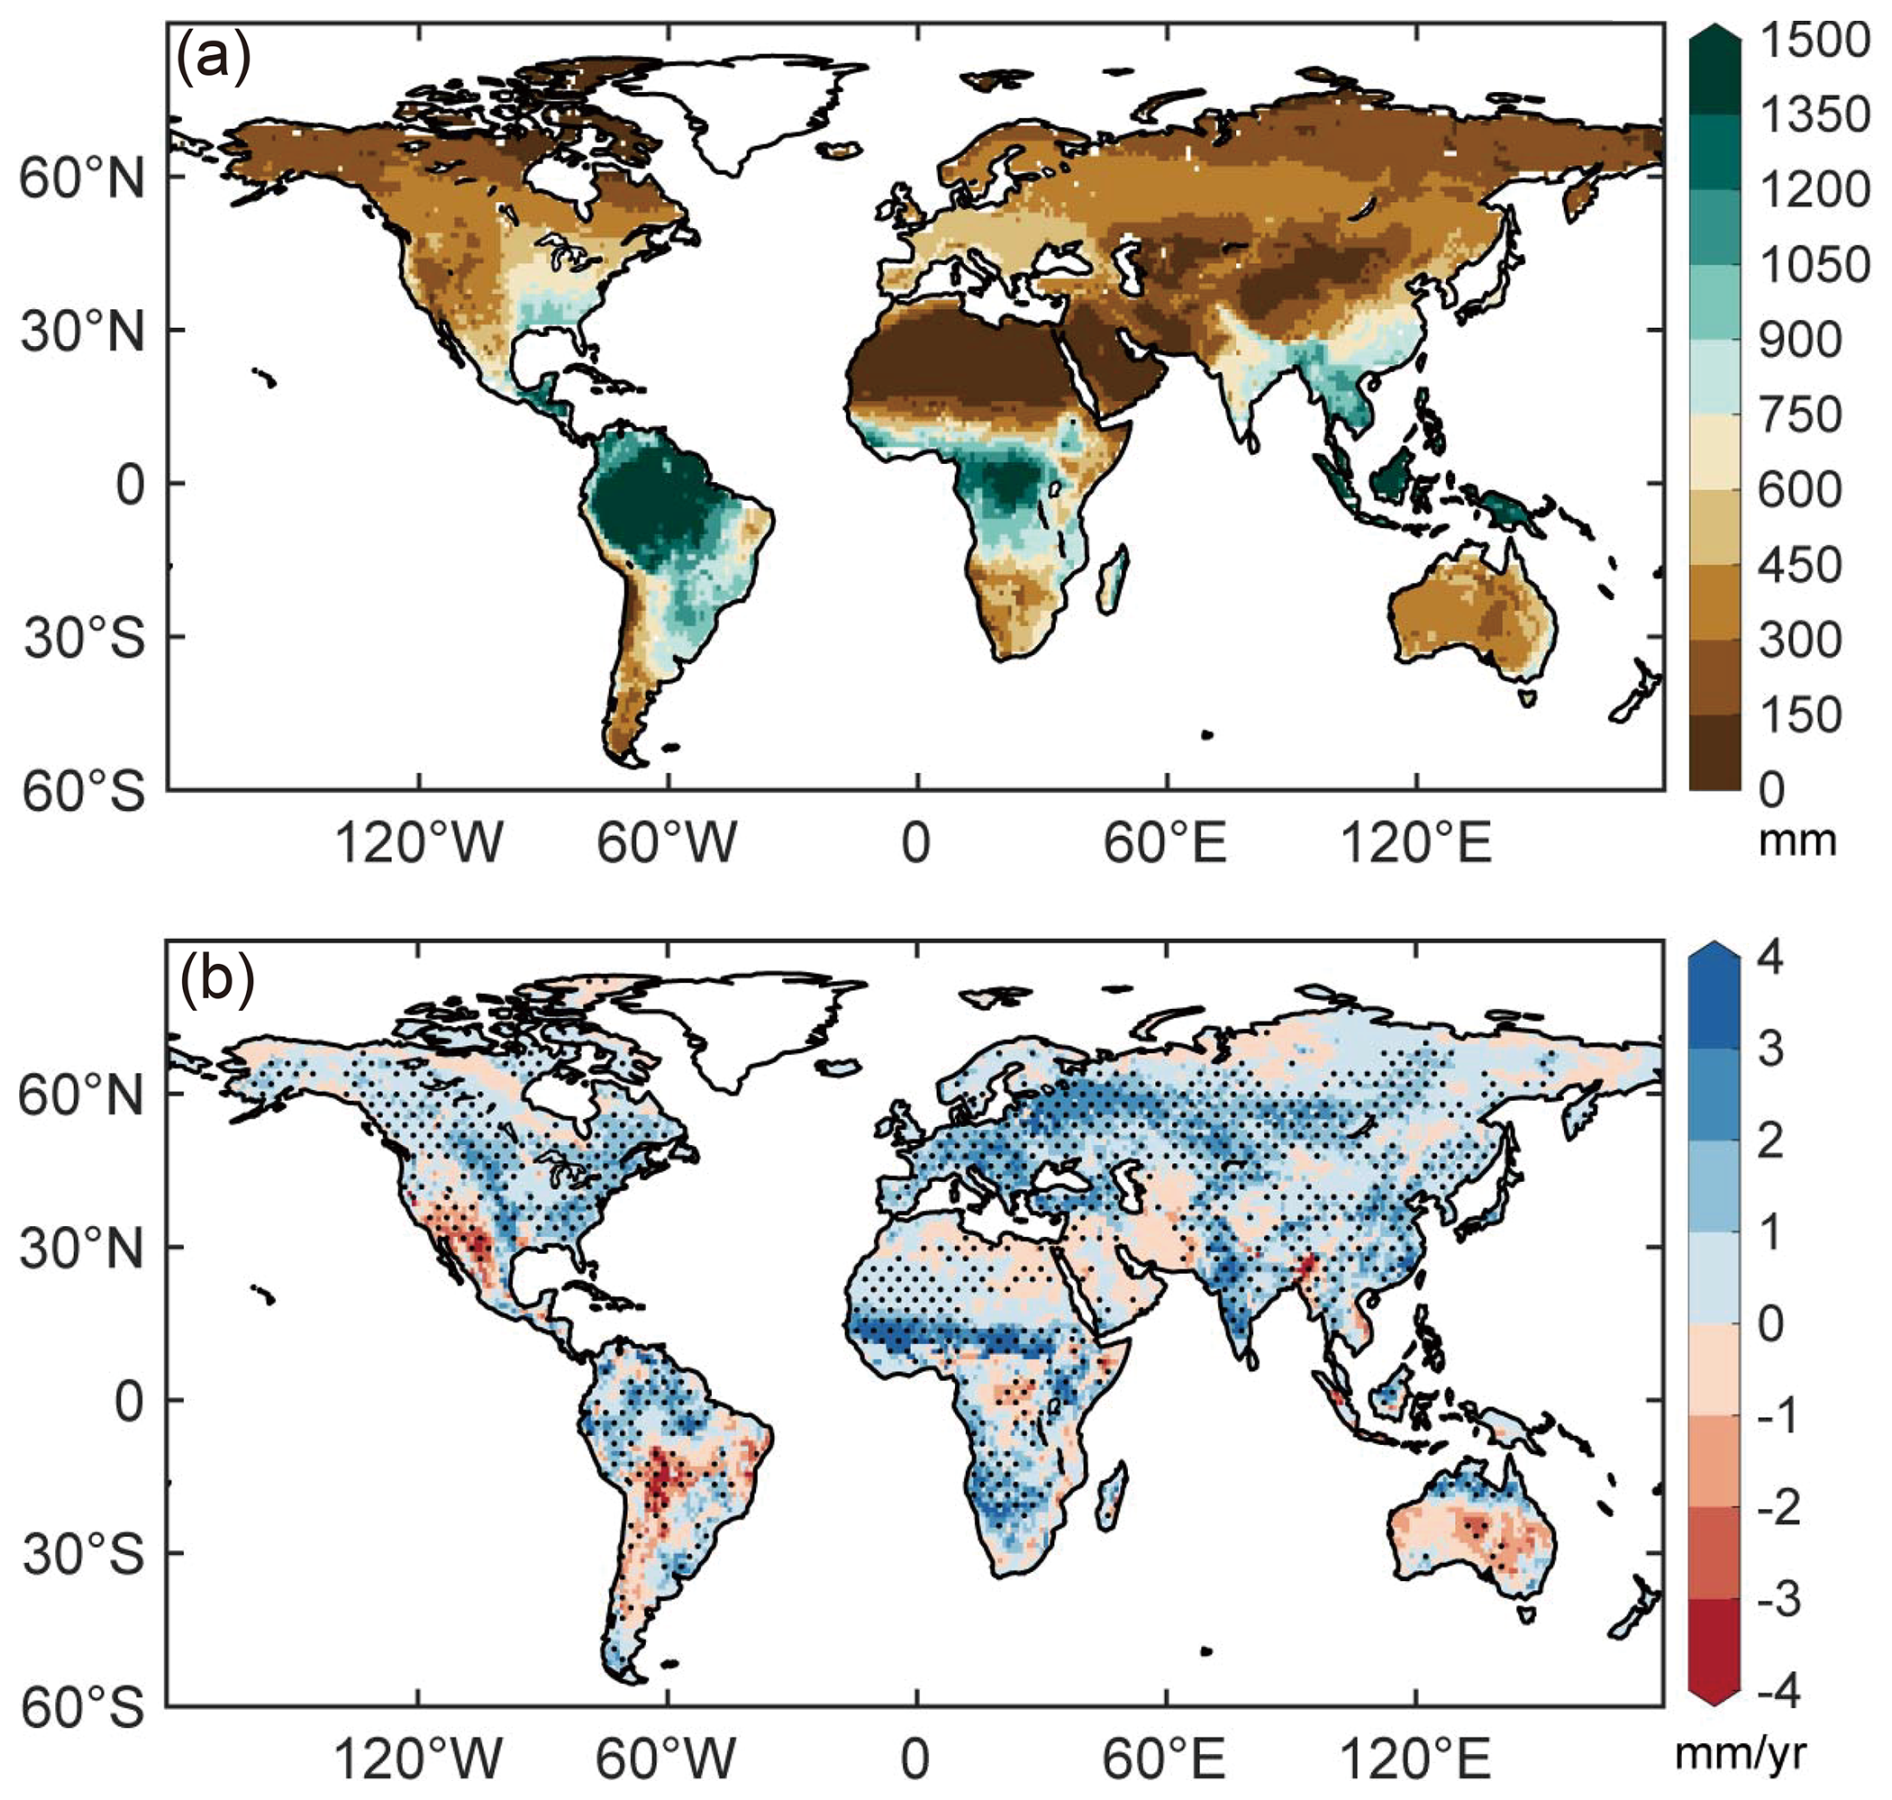
Figure 6Spatial distribution of multi-year averages and trends in BMA-ET during 1980–2020. The black dotted areas indicate the trend passes the significance test (p<0.05) at that grid point.
We have also verified the accuracy of the new fusion dataset, BMA-ET. Validation using FLUXNET2015 ET as reference data shows that more than 70 % of the flux sites have correlation coefficients higher than 0.6 and that the flux sites with high correlation coefficients are mainly located in the mid-to-high latitudes of the northern hemisphere (Fig. S26). Similarly, flux sites with low MAE and RMSE are mainly located in the above areas. The results show that BMA-ET has higher correlation coefficients and lower root-mean-square errors than most of the individual ET datasets (Fig. 7). BMA-ET also performs well in most vegetation types, except for evergreen broadleaf forest (EBF), which has poor performance in all ET datasets (Fig. S27). The correlation coefficients of BMA-ET and FLUXNET2015 ET exceed 0.7 in most vegetation types.
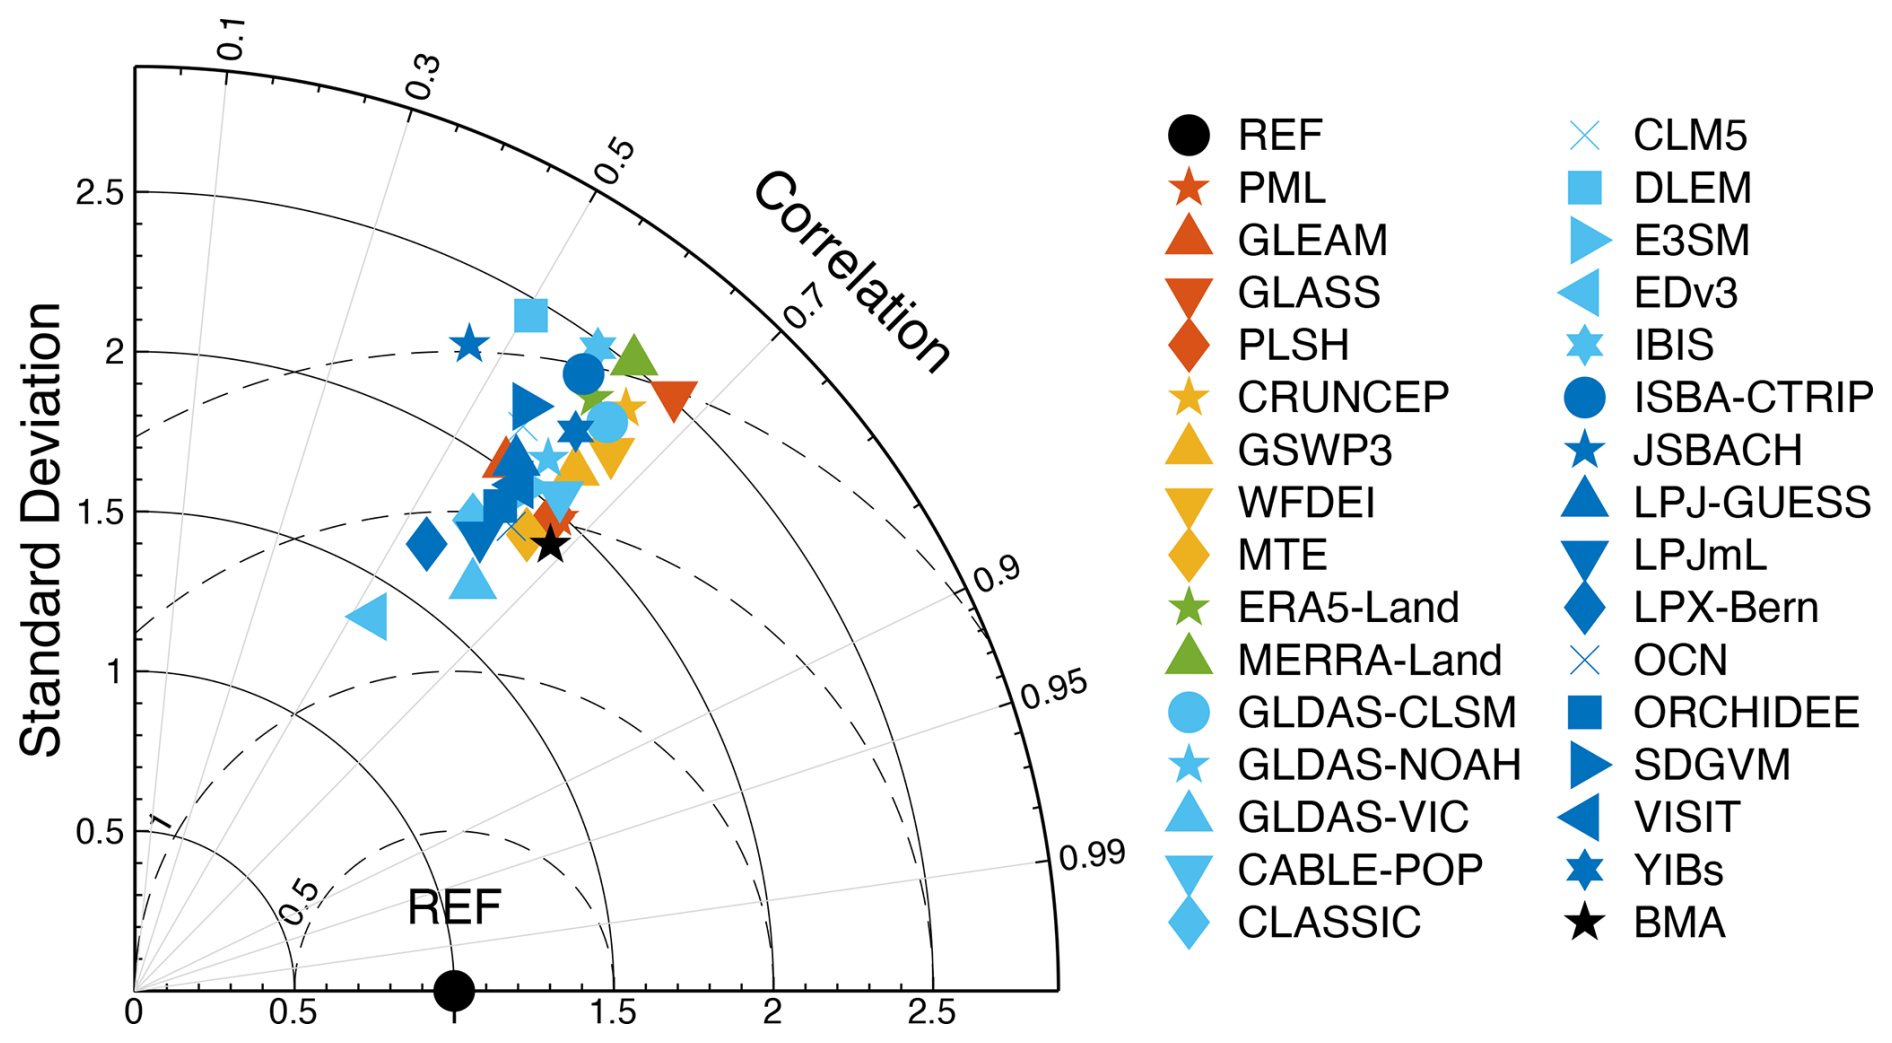
Figure 7Standardized Taylor diagram of ET datasets at all stations from 1991 to 2011. The observation data are ET from FLUXNET2015.
We used independent data sources to validate the fusion dataset BMA-ET, specifically including AmeriFlux, ChinaFlux, and ICOS. Additionally, we also evaluated the accuracy of BMA-ET using FLUXNET2015 data from 2012 to 2015. The results demonstrate that BMA-ET outperforms other external datasets, achieving correlation coefficients of 0.61, 0.72, and 0.74 with site-level ET measurements from AmeriFlux, ChinaFlux, and ICOS, respectively (Fig. 8). Using FLUXNET2015 as reference observations, BMA-ET showed a correlation coefficient of 0.58 with FLUXNET2015 site-level ET during 2012–2015 (Fig. 8), while also demonstrating high accuracy across various vegetation types (Fig. S28).
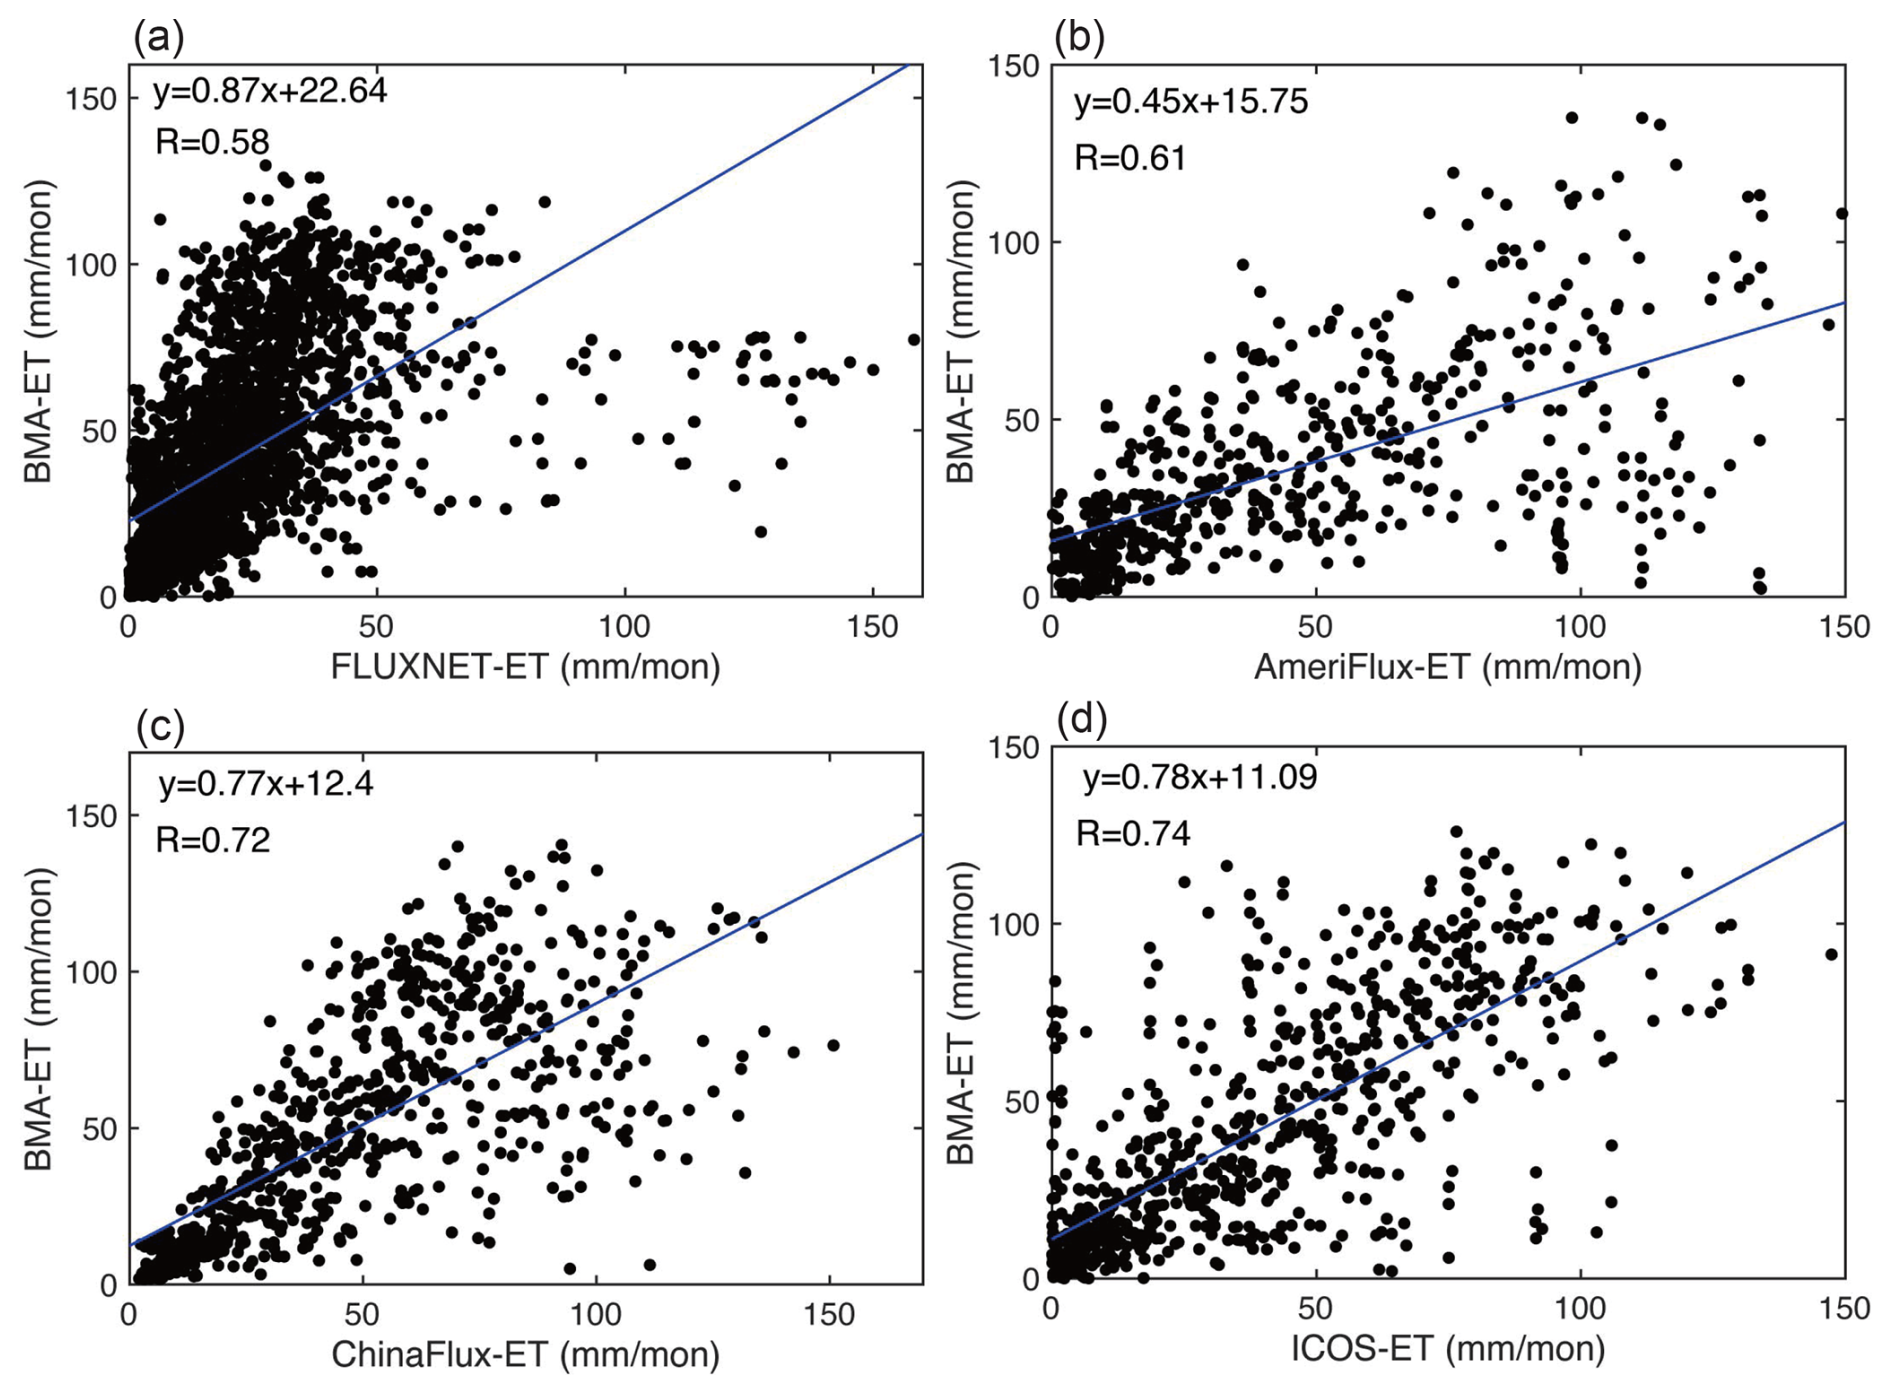
Figure 8Accuracy evaluation of BMA-ET. The observation data is ET from (a) FLUXNET2015 during the period 2012–2015, (b) AmeriFlux during the period 1994–2020, (c) ChinaFlux during the period 2003–2010, (d) ICOS during the period 2003–2010.
4.1 Robustness of results
The global terrestrial averaged ET from BMA-ET in this study showed an overall increasing trend of 0.65 (0.51–0.78) mm yr−1 (p<0.01) from 1980 to 2020. The trend in BMA-ET observed in this study is relatively consistent with the trends seen in some existing studies (Lu et al., 2021; Pan et al., 2020), demonstrating the robustness of the trend results across forcing datasets. From a driving mechanism perspective, long-term changes in ET at the global scale are jointly controlled by water availability (Gu and Adler, 2023) and energy availability (Yuan et al., 2021).
In this study, we use 60 % of station data for training and 40 % of station data for validation. In order to verify the robustness of the results, we performed 2 additional sets of experiments, 70 % of data for training and 30 % of data for validation, 80 % of data for training and 20 % of data for validation, respectively. The results show that the data accuracy of the fusion product BMA-ET is not sensitive to FLUXNET2015 station split. The accuracy evaluation results showed remarkable consistency across different training set proportions (60 %, 70 %, and 80 %), with BMA-ET demonstrating correlation coefficients of 0.67, 0.67, and 0.65 respectively when compared to FLUXNET2015 ET (Fig. S29). In addition, we also evaluate the accuracy of BMA-ET under different vegetation types. The results show that the accuracy of BMA-ET under each vegetation type is not sensitive to the split ratio of the training set (Figs. S30, S31 and S32).
To validate model sensitivity to the stationary land cover assumption, we performed a dynamic comparison of the data set MOD12Q1 for the three periods of 2001, 2010 and 2020 (Fig. S33). We found that the consistency of the land cover types between the years was high, with the proportions of consistency between 2001 and 2010, 2010 and 2020, and 2001 and 2020 being 0.80, 0.86 and 0.78, respectively (Fig. S34). In addition, we also analyzed the percentage of global land area covered by 12 vegetation types (Fig. S35). The results show that the proportion of area covered by various vegetation types does not vary much between years, especially for the four main vegetation types, open shrublands (OSH), WSA, SAV and GRA, which account for a larger proportion of the area.
In order to validate the reasonability of using an equal weighting scheme for the uncovered areas of 10 types of vegetation types, we compared the results of ET fusion of uncovered areas of 10 vegetation types based on the Bayesian-Three Cornered Hat (BTCH) method (Supplement Text S8) and the equal weighting method (Fig. S36). The results showed that the correlation coefficients between the ET estimates based on the equal weighting method and the BTCH-based method were high in the area not covered by the 10 vegetation types, reaching more than 0.9 at most of the grid points (Fig. S36). Moreover, only 11.6 % of the global land area is not covered by 10 vegetation types, the percentage of uncovered areas is small and therefore introduces little error. This type of area is mainly found in North Africa, the Middle East and parts of Central Asia. In summary, in the areas not covered by the 10 vegetation types, it is reasonable for us to use an equal weighting approach to fuse all ET datasets.
We conducted a sensitivity experiment by excluding ET datasets known to use FLUXNET observations during model development and evaluated the impact of this exclusion on the performance of the BMA-ET product. According to Table S10, we identified six ET datasets that utilized FLUXNET observations during their training or validation phases. We then constructed a new ET fused dataset using remaining 24 ET datasets. We evaluated the accuracy of BMA-ET using FLUXNET2015 flux observations. The results show that the correlation coefficient between BMA-ET and FLUXNET2015 observations remained above 0.67 both before and after excluding ET datasets related to FLUXNET (Fig. S37). This indicates that the aforementioned exclusion method had minimal impact on the performance of the BMA-ET product.
4.2 Limitations and future work
The use of site observations to assess large-scale evapotranspiration datasets still has some drawbacks, such as spatial scale mismatch and sparse site distribution. Typically, flux sites only cover a spatial range of a few hundred metres (Soegaard et al., 2003), whereas an image in an ET dataset usually covers a range of several kilometres or even tens of kilometres, which makes a single site unrepresentative of a single image or its neighbouring images. Even though both ET estimates are relatively accurate, the different spatial resolutions can result in large differences in the estimates (Mauser and Schädlich, 1998; Sharma et al., 2016). Due to global climate differences, topographic undulations, and surface heterogeneity, a limited number of stations cannot represent all surface conditions around the globe.
The water balance method is often used as a standard method for estimating ET in watersheds (Liu et al., 2023; Ma et al., 2024). However, there are limitations and uncertainties in assessing the accuracy of ET datasets using this method. For example, the method is able to obtain only the average value of ET in a basin but not the spatial distribution of ET in a basin. Total water storage change (TWSC) cannot be ignored at higher temporal resolution because TWSC greatly affects basin ET estimates. Climate change and human activities have significantly altered the regional water cycle over the past few decades, resulting in dramatic changes in total water storage. In addition, the uncertainty quantified by the TCH method does not reflect the goodness of the modelling of the evapotranspiration datasets, but only the magnitude of the uncertainty, while the relative uncertainty, although indicative of the extent to which the different datasets are modelled, can be larger for areas with smaller evapotranspiration due to the order of magnitude of the datasets.
In future research, high-resolution remote sensing data and machine learning methods can be introduced to construct ET estimation models from site to regional scales to improve the representativeness and accuracy of large-scale ET datasets. To address the lack of observation data for special ecosystems such as deserts and wetlands, more diverse observation data should be acquired in the future using technologies such as unmanned aerial vehicles and mobile observation platforms to improve the spatial coverage and ecological representativeness of ET estimation.
This long-term global terrestrial ET dataset covers the period of 1980–2020. It contains data for spatial resolutions of 0.5° × 0.5° and 1° × 1° covering the domain of −89.75–89.75° N, −180–179.5° E. The NetCDF formatted output files of the BMA-ET dataset are freely accessible at https://doi.org/10.5281/zenodo.15470621 (Wu and Miao, 2025).
In this study, 30 ET datasets were comprehensively evaluated and fused to obtain a new set of global terrestrial ET datasets. The following conclusions were obtained:
-
The inter-annual trends of the grid ET data generated based on different methods are not consistent over the period 1982–2011. The machine learning-based global ET shows a weak downward trend in most parts of the globe, while the reanalysis-based global ET shows a significant downward trend in the equatorial low latitudes. All datasets show significant upward trends in ET in regions such as northern North America, southern Africa, northern Asia, and Australia.
-
After a comprehensive evaluation of ET datasets, ET datasets reconstructed based on remote sensing inversion and machine learning showed higher accuracy, but the specific data selection needs to consider seasonal variations and vegetation types. At the site scale, ET datasets based on remote sensing and machine learning performed particularly well, especially the MTE, PML and PLSH datasets. At the basin scale, most of ET datasets demonstrate superior performance. At the grid point scale, ET datasets based on remote sensing and machine learning has relatively low uncertainty.
-
In this study, a long-time-series (1980–2020) ET fusion dataset (BMA-ET) was generated using a Bayesian model averaging (BMA) method. From 1980 to 2020, the global terrestrial BMA-ET shows an overall increasing trend of 0.65 (0.51–0.78) mm yr−1. The results show that BMA-ET has higher correlation coefficients and lower root-mean-square errors than most of the individual ET datasets included in this study. Validation using ET from FLUXNET2015 as reference data shows that correlation coefficients for more than 70 % of the flux sites exceed 0.6. Validation results based on independent data sources show that the correlation coefficients of BMA-ET with AmeriFlux, ChinaFlux, and ICOS reach 0.61, 0.72, and 0.74, respectively.
Estimating terrestrial evapotranspiration at large scales has always been a challenge for hydrology and ecology because of the heterogeneity of the subsurface and the interaction between the atmosphere and the land surface. In future research, we should focus on the following two aspects: (1) Given the limited availability of site observations, we should improve the spatial resolution of the dataset as much as possible to match the site scale while studying the energy closure problem in depth. Currently, the regional-scale ET estimates have achieved high accuracy by optimising the model parameters, but the global scale still needs to be calibrated to the observed values. Therefore, in future studies, the density of the site distribution and the accuracy of observations will be the main focus for improving the modelling results. (2) It is necessary to focus on the influence of different factors on the estimation of ET under different climate models in order to compare different ET models, to pay attention to the differences between the models, and to optimise or improve the parameters of the models in order to improve the accuracy of the model estimation.
The supplement related to this article is available online at https://doi.org/10.5194/essd-17-6445-2025-supplement.
YW and CM contributed to designing the research; YW implemented the research and wrote the original draft; CM supervised the research; all co-authors revised the manuscript and contributed to the writing.
The contact author has declared that none of the authors has any competing interests.
Publisher’s note: Copernicus Publications remains neutral with regard to jurisdictional claims made in the text, published maps, institutional affiliations, or any other geographical representation in this paper. While Copernicus Publications makes every effort to include appropriate place names, the final responsibility lies with the authors. Also, please note that this paper has not received English language copy-editing. Views expressed in the text are those of the authors and do not necessarily reflect the views of the publisher.
The authors would like to thank the topic editor and the anonymous referees for their constructive comments, which have greatly improved this study and manuscript. We also acknowledge the developers of the evapotranspiration datasets for providing their data, and extend our gratitude to all contributors and external collaborators for their valuable support.
This research was supported by the National Key Research and Development Program of China (2024YFF0809301), the National Natural Science Foundation of China (U24A20572) and the Fundamental Research Funds for the Central Universities.
This paper was edited by Jiafu Mao and reviewed by Shaobo sun and three anonymous referees.
Baldocchi, D., Falge, E., Gu, L., Olson, R., Hollinger, D., Running, S., Anthoni, P., Bernhofer, C., Davis, K., Evans, R., Fuentes, J., Goldstein, A., Katul, G., Law, B., Lee, X., Malhi, Y., Meyers, T., Munger, W., Oechel, W., U, K. T. P., Pilegaard, K., Schmid, H. P., Valentini, R., Verma, S., Vesala, T., Wilson, K., and Wofsy, S.: FLUXNET: A New Tool to Study the Temporal and Spatial Variability of Ecosystem-Scale Carbon Dioxide, Water Vapor, and Energy Flux Densities, Bulletin of the American Meteorological Society, 82, 2415–2434, https://doi.org/10.1175/1520-0477(2001)082<2415:FANTTS>2.3.CO;2, 2001.
Bellido-Jiménez, J. A., Estévez, J., and García-Marín, A. P.: New machine learning approaches to improve reference evapotranspiration estimates using intra-daily temperature-based variables in a semi-arid region of Spain, Agricultural Water Management, 245, 106558, https://doi.org/10.1016/j.agwat.2020.106558, 2021.
Bisht, G., Riley, W. J., Hammond, G. E., and Lorenzetti, D. M.: Development and evaluation of a variably saturated flow model in the global E3SM Land Model (ELM) version 1.0, Geosci. Model Dev., 11, 4085–4102, https://doi.org/10.5194/gmd-11-4085-2018, 2018.
Cai, S., Liu, D., Sulla-Menashe, D., and Friedl, M. A.: Enhancing MODIS land cover product with a spatial–temporal modeling algorithm, Remote Sensing of Environment, 147, 243–255, https://doi.org/10.1016/j.rse.2014.03.012, 2014.
Chai, Y., Miao, C., Slater, L., Ciais, P., Berghuijs, W. R., Chen, T., and Huntingford, C.: Underestimating global land greening: Future vegetation changes and their impacts on terrestrial water loss, One Earth, 8, 101176, https://doi.org/10.1016/j.oneear.2025.101176, 2025.
Chao, L., Zhang, K., Wang, J., Feng, J., and Zhang, M.: A Comprehensive Evaluation of Five Evapotranspiration Datasets Based on Ground and GRACE Satellite Observations: Implications for Improvement of Evapotranspiration Retrieval Algorithm, Remote Sensing, 13, 2414, https://doi.org/10.3390/rs13122414, 2021.
Delire, C., Séférian, R., Decharme, B., Alkama, R., Calvet, J.-C., Carrer, D., Gibelin, A.-L., Joetzjer, E., Morel, X., Rocher, M., and Tzanos, D.: The Global Land Carbon Cycle Simulated With ISBA-CTRIP: Improvements Over the Last Decade, Journal of Advances in Modeling Earth Systems, 12, e2019MS001886, https://doi.org/10.1029/2019MS001886, 2020.
Friedlingstein, P., O'Sullivan, M., Jones, M. W., Andrew, R. M., Bakker, D. C. E., Hauck, J., Landschützer, P., Le Quéré, C., Luijkx, I. T., Peters, G. P., Peters, W., Pongratz, J., Schwingshackl, C., Sitch, S., Canadell, J. G., Ciais, P., Jackson, R. B., Alin, S. R., Anthoni, P., Barbero, L., Bates, N. R., Becker, M., Bellouin, N., Decharme, B., Bopp, L., Brasika, I. B. M., Cadule, P., Chamberlain, M. A., Chandra, N., Chau, T.-T.-T., Chevallier, F., Chini, L. P., Cronin, M., Dou, X., Enyo, K., Evans, W., Falk, S., Feely, R. A., Feng, L., Ford, D. J., Gasser, T., Ghattas, J., Gkritzalis, T., Grassi, G., Gregor, L., Gruber, N., Gürses, Ö., Harris, I., Hefner, M., Heinke, J., Houghton, R. A., Hurtt, G. C., Iida, Y., Ilyina, T., Jacobson, A. R., Jain, A., Jarníková, T., Jersild, A., Jiang, F., Jin, Z., Joos, F., Kato, E., Keeling, R. F., Kennedy, D., Klein Goldewijk, K., Knauer, J., Korsbakken, J. I., Körtzinger, A., Lan, X., Lefèvre, N., Li, H., Liu, J., Liu, Z., Ma, L., Marland, G., Mayot, N., McGuire, P. C., McKinley, G. A., Meyer, G., Morgan, E. J., Munro, D. R., Nakaoka, S.-I., Niwa, Y., O'Brien, K. M., Olsen, A., Omar, A. M., Ono, T., Paulsen, M., Pierrot, D., Pocock, K., Poulter, B., Powis, C. M., Rehder, G., Resplandy, L., Robertson, E., Rödenbeck, C., Rosan, T. M., Schwinger, J., Séférian, R., Smallman, T. L., Smith, S. M., Sospedra-Alfonso, R., Sun, Q., Sutton, A. J., Sweeney, C., Takao, S., Tans, P. P., Tian, H., Tilbrook, B., Tsujino, H., Tubiello, F., van der Werf, G. R., van Ooijen, E., Wanninkhof, R., Watanabe, M., Wimart-Rousseau, C., Yang, D., Yang, X., Yuan, W., Yue, X., Zaehle, S., Zeng, J., and Zheng, B.: Global Carbon Budget 2023, Earth Syst. Sci. Data, 15, 5301–5369, https://doi.org/10.5194/essd-15-5301-2023, 2023.
Gu, G. and Adler, R. F.: Observed variability and trends in global precipitation during 1979–2020, Clim. Dynam., 61, 131–150, https://doi.org/10.1007/s00382-022-06567-9, 2023.
Haverd, V., Smith, B., Nieradzik, L., Briggs, P. R., Woodgate, W., Trudinger, C. M., Canadell, J. G., and Cuntz, M.: A new version of the CABLE land surface model (Subversion revision r4601) incorporating land use and land cover change, woody vegetation demography, and a novel optimisation-based approach to plant coordination of photosynthesis, Geosci. Model Dev., 11, 2995–3026, https://doi.org/10.5194/gmd-11-2995-2018, 2018.
He, X., Xu, T., Xia, Y., Bateni, S. M., Guo, Z., Liu, S., Mao, K., Zhang, Y., Feng, H., and Zhao, J.: A Bayesian Three-Cornered Hat (BTCH) Method: Improving the Terrestrial Evapotranspiration Estimation, Remote Sensing, 12, 878, https://doi.org/10.3390/rs12050878, 2020.
Hu, J., Miao, C., Su, J., Zhang, Q., Gou, J., and Sun, Q.: An upgraded high-precision gridded precipitation dataset for the Chinese mainland considering spatial autocorrelation and covariates, Earth Syst. Sci. Data, 17, 3987–4004, https://doi.org/10.5194/essd-17-3987-2025, 2025.
Ito, A. and Inatomi, M.: Use of a process-based model for assessing the methane budgets of global terrestrial ecosystems and evaluation of uncertainty, Biogeosciences, 9, 759–773, https://doi.org/10.5194/bg-9-759-2012, 2012.
Jasechko, S., Sharp, Z. D., Gibson, J. J., Birks, S. J., Yi, Y., and Fawcett, P. J.: Terrestrial water fluxes dominated by transpiration, Nature, 496, 347–350, https://doi.org/10.1038/nature11983, 2013.
Jung, M., Reichstein, M., Margolis, H. A., Cescatti, A., Richardson, A. D., Arain, M. A., Arneth, A., Bernhofer, C., Bonal, D., Chen, J., Gianelle, D., Gobron, N., Kiely, G., Kutsch, W., Lasslop, G., Law, B. E., Lindroth, A., Merbold, L., Montagnani, L., Moors, E. J., Papale, D., Sottocornola, M., Vaccari, F., and Williams, C.: Global patterns of land-atmosphere fluxes of carbon dioxide, latent heat, and sensible heat derived from eddy covariance, satellite, and meteorological observations, Journal of Geophysical Research: Biogeosciences, 116, G00J07, https://doi.org/10.1029/2010JG001566, 2011.
Jung, M., Koirala, S., Weber, U., Ichii, K., Gans, F., Camps-Valls, G., Papale, D., Schwalm, C., Tramontana, G., and Reichstein, M.: The FLUXCOM ensemble of global land-atmosphere energy fluxes, Sci. Data, 6, 74, https://doi.org/10.1038/s41597-019-0076-8, 2019.
Lawrence, D. M., Thornton, P. E., Oleson, K. W., and Bonan, G. B.: The Partitioning of Evapotranspiration into Transpiration, Soil Evaporation, and Canopy Evaporation in a GCM: Impacts on Land–Atmosphere Interaction, Journal of Hydrometeorology, 8, 862–880, https://doi.org/10.1175/JHM596.1, 2007.
Lawrence, D. M., Fisher, R. A., Koven, C. D., Oleson, K. W., Swenson, S. C., Bonan, G., Collier, N., Ghimire, B., van Kampenhout, L., Kennedy, D., Kluzek, E., Lawrence, P. J., Li, F., Li, H., Lombardozzi, D., Riley, W. J., Sacks, W. J., Shi, M., Vertenstein, M., Wieder, W. R., Xu, C., Ali, A. A., Badger, A. M., Bisht, G., van den Broeke, M., Brunke, M. A., Burns, S. P., Buzan, J., Clark, M., Craig, A., Dahlin, K., Drewniak, B., Fisher, J. B., Flanner, M., Fox, A. M., Gentine, P., Hoffman, F., Keppel-Aleks, G., Knox, R., Kumar, S., Lenaerts, J., Leung, L. R., Lipscomb, W. H., Lu, Y., Pandey, A., Pelletier, J. D., Perket, J., Randerson, J. T., Ricciuto, D. M., Sanderson, B. M., Slater, A., Subin, Z. M., Tang, J., Thomas, R. Q., Val Martin, M., and Zeng, X.: The Community Land Model Version 5: Description of New Features, Benchmarking, and Impact of Forcing Uncertainty, Journal of Advances in Modeling Earth Systems, 11, 4245–4287, https://doi.org/10.1029/2018MS001583, 2019.
Liang, S., Zhao, X., Liu, S., Yuan, W., Cheng, X., Xiao, Z., Zhang, X., Liu, Q., Cheng, J., Tang, H., Qu, Y., Bo, Y., Qu, Y., Ren, H., Yu, K., and Townshend, J.: A long-term Global LAnd Surface Satellite (GLASS) data-set for environmental studies, International Journal of Digital Earth, 6, 5–33, https://doi.org/10.1080/17538947.2013.805262, 2013.
Lienert, S. and Joos, F.: A Bayesian ensemble data assimilation to constrain model parameters and land-use carbon emissions, Biogeosciences, 15, 2909–2930, https://doi.org/10.5194/bg-15-2909-2018, 2018.
Liu, H., Xin, X., Su, Z., Zeng, Y., Lian, T., Li, L., Yu, S., and Zhang, H.: Intercomparison and evaluation of ten global ET products at site and basin scales, Journal of Hydrology, 617, 128887, https://doi.org/10.1016/j.jhydrol.2022.128887, 2023.
Long, D., Longuevergne, L., and Scanlon, B. R.: Uncertainty in evapotranspiration from land surface modeling, remote sensing, and GRACE satellites, Water Resources Research, 50, 1131–1151, https://doi.org/10.1002/2013WR014581, 2014.
Lu, J., Wang, G., Chen, T., Li, S., Hagan, D. F. T., Kattel, G., Peng, J., Jiang, T., and Su, B.: A harmonized global land evaporation dataset from model-based products covering 1980–2017, Earth Syst. Sci. Data, 13, 5879–5898, https://doi.org/10.5194/essd-13-5879-2021, 2021.
Ma, L., Hurtt, G., Ott, L., Sahajpal, R., Fisk, J., Lamb, R., Tang, H., Flanagan, S., Chini, L., Chatterjee, A., and Sullivan, J.: Global evaluation of the Ecosystem Demography model (ED v3.0), Geosci. Model Dev., 15, 1971–1994, https://doi.org/10.5194/gmd-15-1971-2022, 2022.
Ma, N., Zhang, Y., and Szilagyi, J.: Water-balance-based evapotranspiration for 56 large river basins: A benchmarking dataset for global terrestrial evapotranspiration modeling, Journal of Hydrology, 630, 130607, https://doi.org/10.1016/j.jhydrol.2024.130607, 2024.
Ma, Y., Yue, X., Zhou, H., Gong, C., Lei, Y., Tian, C., and Cao, Y.: Identifying the dominant climate-driven uncertainties in modeling gross primary productivity, Science of The Total Environment, 800, 149518, https://doi.org/10.1016/j.scitotenv.2021.149518, 2021.
Martens, B., Miralles, D. G., Lievens, H., van der Schalie, R., de Jeu, R. A. M., Fernández-Prieto, D., Beck, H. E., Dorigo, W. A., and Verhoest, N. E. C.: GLEAM v3: satellite-based land evaporation and root-zone soil moisture, Geosci. Model Dev., 10, 1903–1925, https://doi.org/10.5194/gmd-10-1903-2017, 2017.
Mauser, W. and Schädlich, S.: Modelling the spatial distribution of evapotranspiration on different scales using remote sensing data, Journal of Hydrology, 212–213, 250–267, https://doi.org/10.1016/S0022-1694(98)00228-5, 1998.
Melton, J. R., Arora, V. K., Wisernig-Cojoc, E., Seiler, C., Fortier, M., Chan, E., and Teckentrup, L.: CLASSIC v1.0: the open-source community successor to the Canadian Land Surface Scheme (CLASS) and the Canadian Terrestrial Ecosystem Model (CTEM) – Part 1: Model framework and site-level performance, Geosci. Model Dev., 13, 2825–2850, https://doi.org/10.5194/gmd-13-2825-2020, 2020.
Muñoz-Sabater, J., Dutra, E., Agustí-Panareda, A., Albergel, C., Arduini, G., Balsamo, G., Boussetta, S., Choulga, M., Harrigan, S., Hersbach, H., Martens, B., Miralles, D. G., Piles, M., Rodríguez-Fernández, N. J., Zsoter, E., Buontempo, C., and Thépaut, J.-N.: ERA5-Land: a state-of-the-art global reanalysis dataset for land applications, Earth Syst. Sci. Data, 13, 4349–4383, https://doi.org/10.5194/essd-13-4349-2021, 2021.
Overgaard, J., Rosbjerg, D., and Butts, M. B.: Land-surface modelling in hydrological perspective – a review, Biogeosciences, 3, 229–241, https://doi.org/10.5194/bg-3-229-2006, 2006.
Pan, S., Pan, N., Tian, H., Friedlingstein, P., Sitch, S., Shi, H., Arora, V. K., Haverd, V., Jain, A. K., Kato, E., Lienert, S., Lombardozzi, D., Nabel, J. E. M. S., Ottlé, C., Poulter, B., Zaehle, S., and Running, S. W.: Evaluation of global terrestrial evapotranspiration using state-of-the-art approaches in remote sensing, machine learning and land surface modeling, Hydrol. Earth Syst. Sci., 24, 1485–1509, https://doi.org/10.5194/hess-24-1485-2020, 2020.
Parker, W. S.: Reanalyses and Observations: What's the Difference?, Bulletin of the American Meteorological Society, 97, 1565–1572, https://doi.org/10.1175/BAMS-D-14-00226.1, 2016.
Reichle, R. H., Koster, R. D., De Lannoy, G. J. M., Forman, B. A., Liu, Q., Mahanama, S. P. P., and Toure, A.: Assessment and enhancement of MERRA land surface hydrology estimates, Journal of Climate, 24, 6322–6338, https://doi.org/10.1175/JCLI-D-10-05033.1, 2011.
Reick, C. H., Gayler, V., Goll, D., Hagemann, S., Heidkamp, M., Nabel, J. E., Raddatz, T., Roeckner, E., Schnur, R., and Wilkenskjeld, S.: JSBACH 3-The land component of the MPI Earth System Model: documentation of version 3.2, https://doi.org/10.17617/2.3279802, 2021.
Rodell, M., Houser, P. R., Jambor, U., Gottschalck, J., Mitchell, K., Meng, C.-J., Arsenault, K., Cosgrove, B., Radakovich, J., Bosilovich, M., Entin, J. K., Walker, J. P., Lohmann, D., and Toll, D.: The Global Land Data Assimilation System, Bulletin of the American Meteorological Society, 85, 381–394, https://doi.org/10.1175/BAMS-85-3-381, 2004.
Schaepman-Strub, G., Schaepman, M. E., Painter, T. H., Dangel, S., and Martonchik, J. V.: Reflectance quantities in optical remote sensing – definitions and case studies, Remote Sensing of Environment, 103, 27–42, https://doi.org/10.1016/j.rse.2006.03.002, 2006.
Schaphoff, S., von Bloh, W., Rammig, A., Thonicke, K., Biemans, H., Forkel, M., Gerten, D., Heinke, J., Jägermeyr, J., Knauer, J., Langerwisch, F., Lucht, W., Müller, C., Rolinski, S., and Waha, K.: LPJmL4 – a dynamic global vegetation model with managed land – Part 1: Model description, Geosci. Model Dev., 11, 1343–1375, https://doi.org/10.5194/gmd-11-1343-2018, 2018.
Sharma, V., Kilic, A., and Irmak, S.: Impact of scale/resolution on evapotranspiration from Landsat and MODIS images, Water Resources Research, 52, 1800–1819, https://doi.org/10.1002/2015WR017772, 2016.
Smith, B., Wårlind, D., Arneth, A., Hickler, T., Leadley, P., Siltberg, J., and Zaehle, S.: Implications of incorporating N cycling and N limitations on primary production in an individual-based dynamic vegetation model, Biogeosciences, 11, 2027–2054, https://doi.org/10.5194/bg-11-2027-2014, 2014.
Soegaard, H., Jensen, N. O., Boegh, E., Hasager, C. B., Schelde, K., and Thomsen, A.: Carbon dioxide exchange over agricultural landscape using eddy correlation and footprint modelling, Agricultural and Forest Meteorology, 114, 153–173, https://doi.org/10.1016/S0168-1923(02)00177-6, 2003.
Vuichard, N., Messina, P., Luyssaert, S., Guenet, B., Zaehle, S., Ghattas, J., Bastrikov, V., and Peylin, P.: Accounting for carbon and nitrogen interactions in the global terrestrial ecosystem model ORCHIDEE (trunk version, rev 4999): multi-scale evaluation of gross primary production, Geosci. Model Dev., 12, 4751–4779, https://doi.org/10.5194/gmd-12-4751-2019, 2019.
Wang, K. and Dickinson, R. E.: A review of global terrestrial evapotranspiration: Observation, modeling, climatology, and climatic variability, Reviews of Geophysics, 50, https://doi.org/10.1029/2011RG000373, 2012.
Woodward, F. I. and Lomas, M. R.: Vegetation dynamics – simulating responses to climatic change, Biological Reviews, 79, 643–670, https://doi.org/10.1017/S1464793103006419, 2004.
Wu, Y. and Miao, C.: BMA-ET: A new global terrestrial evapotranspiration dataset from multi-datasets fusion based on Bayesian model averaging covering 1980–2020, Zenodo [data set], https://doi.org/10.5281/zenodo.15470621, 2025.
Xie, Z., Yao, Y., Tang, Q., Liu, M., Fisher, J. B., Chen, J., Zhang, X., Jia, K., Li, Y., Shang, K., Jiang, B., Yang, J., Yu, R., Zhang, X., Guo, X., Liu, L., Ning, J., Fan, J., and Zhang, L.: Evaluation of seven satellite-based and two reanalysis global terrestrial evapotranspiration products, Journal of Hydrology, 630, 130649, https://doi.org/10.1016/j.jhydrol.2024.130649, 2024.
Yu, X., Qian, L., Wang, W., Hu, X., Dong, J., Pi, Y., and Fan, K.: Comprehensive evaluation of terrestrial evapotranspiration from different models under extreme condition over conterminous United States, Agricultural Water Management, 289, 108555, https://doi.org/10.1016/j.agwat.2023.108555, 2023.
Yuan, M., Leirvik, T., and Wild, M.: Global trends in downward surface solar radiation from spatial interpolated ground observations during 1961-2019, Journal of Climate, 1–56, https://doi.org/10.1175/JCLI-D-21-0165.1, 2021.
Yuan, W., Liu, D., Dong, W., Liu, S., Zhou, G., Yu, G., Zhao, T., Feng, J., Ma, Z., Chen, J., Chen, Y., Chen, S., Han, S., Huang, J., Li, L., Liu, H., Liu, S., Ma, M., Wang, Y., Xia, J., Xu, W., Zhang, Q., Zhao, X., and Zhao, L.: Multiyear precipitation reduction strongly decreases carbon uptake over northern China, Journal of Geophysical Research: Biogeosciences, 119, 881–896, https://doi.org/10.1002/2014JG002608, 2014.
Yue, X. and Unger, N.: The Yale Interactive terrestrial Biosphere model version 1.0: description, evaluation and implementation into NASA GISS ModelE2, Geosci. Model Dev., 8, 2399–2417, https://doi.org/10.5194/gmd-8-2399-2015, 2015.
Zaehle, S. and Friend, A. D.: Carbon and nitrogen cycle dynamics in the O-CN land surface model: 1. Model description, site-scale evaluation, and sensitivity to parameter estimates, Global Biogeochemical Cycles, 24, GB1005, https://doi.org/10.1029/2009GB003521, 2010.
Zhang, K., Kimball, J. S., Nemani, R. R., Running, S. W., Hong, Y., Gourley, J. J., and Yu, Z.: Vegetation Greening and Climate Change Promote Multidecadal Rises of Global Land Evapotranspiration, Sci. Rep., 5, 15956, https://doi.org/10.1038/srep15956, 2015.
Zhang, Q., Miao, C., Su, J., Gou, J., Hu, J., Zhao, X., and Xu, Y.: A new high-resolution multi-drought-index dataset for mainland China, Earth Syst. Sci. Data, 17, 837–853, https://doi.org/10.5194/essd-17-837-2025, 2025.
Zhang, Y., Peña-Arancibia, J. L., McVicar, T. R., Chiew, F. H. S., Vaze, J., Liu, C., Lu, X., Zheng, H., Wang, Y., Liu, Y. Y., Miralles, D. G., and Pan, M.: Multi-decadal trends in global terrestrial evapotranspiration and its components, Sci. Rep., 6, 19124, https://doi.org/10.1038/srep19124, 2016.
Zhang, Y., Kong, D., Gan, R., Chiew, F. H. S., McVicar, T. R., Zhang, Q., and Yang, Y.: Coupled estimation of 500 m and 8-day resolution global evapotranspiration and gross primary production in 2002–2017, Remote Sensing of Environment, 222, 165–182, https://doi.org/10.1016/j.rse.2018.12.031, 2019.
Zheng, H., Miao, C., Huntingford, C., Tarolli, P., Li, D., Panagos, P., Yue, Y., Borrelli, P., and Oost, K. V.: The Impacts of Erosion on the Carbon Cycle, Reviews of Geophysics, 63, e2023RG000829, https://doi.org/10.1029/2023RG000829, 2025.