the Creative Commons Attribution 4.0 License.
the Creative Commons Attribution 4.0 License.
 | 18 Nov 2025
Measurement of the ice-nucleating particle concentration with the Portable Ice Nucleation Experiment during the Pallas Cloud Experiment 2022
Alexander Böhmländer
Larissa Lacher
Romy Fösig
Nicole Büttner
Jens Nadolny
David Brus
Konstantinos-Matthaios Doulgeris
The Portable Ice Nucleation Experiment (PINE) was deployed during the Pallas Cloud Experiment (PaCE) 2022 for a three-month-period at the Sammaltunturi station in autumn 2022 (between late September 2022 and late December 2022). The station is located on top of a hill on the edge between sub-Arctic and boreal forest environments, typically receiving air masses from the Arctic and the south. Since clouds are frequently present at the station during autumn, the present aerosol particles can have a direct impact on cloud properties. Ice-nucleating particles (INPs) are aerosol particles that facilitate primary ice nucleation in supercooled cloud droplets. The PINE measured the INP concentration with a high temporal resolution of six minutes at different nucleation temperatures between 240 and 252 K. The INP concentration varied exponentially with the freezing temperature and differences between different months were observed. The highest median INP concentration was measured during December over the whole temperature range, while during November the lowest median INP concentration was measured. The data presented here is useful to study aerosol-cloud interactions for a sub-Arctic location with minimal anthropogenic influence. The high temporal resolution allows to correlate the INP concentration with other measurements, such as size distribution data and meteorological data. In addition, the data provides the ice nucleating ability of ambient aerosol particles, which can be combined with models to study the nature, the source and the age of the INPs.
- Article
(1303 KB) - Full-text XML
- BibTeX
- EndNote


Aerosol-cloud-interactions play a key role in the weather and climate on Earth (e.g., IPCC, 2021). Cloud condensation nuclei (CCN) lead to the nucleation of water droplets from water vapour, enabling cloud formation in the atmosphere (e.g., Tatzelt et al., 2022). Below 0 °C liquid cloud droplets and ice crystals can co-exist (e.g., Pruppacher and Klett, 1997). Primary ice formation can only be initiated homogeneously, i.e. without a foreign substance, below about −38 °C (e.g., Koop et al., 2000). Mixed-phase clouds (MPCs) exist in the temperature range −38–0 °C, where primary ice formation happens heterogeneously due to ice-nucleating particles (INPs). INPs are a rare subset of aerosol particles, which can be characterized by their nucleation temperature, i.e. at which temperature the aerosol particle acts as an INP (e.g., Vali et al., 2015). Even though their abundance is relatively small, INPs have a large impact on the phase of MPCs and with that on the radiative budget of clouds and their precipitation (e.g., Kanji et al., 2017). Precipitation events are linked to the presence of an ice phase in clouds, especially at higher latitudes (e.g., Field and Heymsfield, 2015; Mülmenstädt et al., 2015; Heymsfield et al., 2020). The different radiative properties of mixed-phase clouds have been investigated in relation to their phase in the literature (e.g., Bellouin et al., 2020; Storelvmo, 2017). Fan et al. (2017) studied orographic MPCs and found an increase in precipitation correlated to the INP concentration. In addition, Vergara-Temprado et al. (2018) showed that the INP concentration in the Southern Ocean controls the reflectivity of MPCs. The nature and sources of INPs are understudied, especially in remote regions as the sub-Arctic (e.g., Schmale et al., 2021). Kanji et al. (2017) report various sources of INP, with mineral dust being the dominant INP for nucleation temperatures below about −15 °C (e.g., DeMott et al., 2015) and aerosols of biogenic origin (e.g., pollen, fungi, etc.) being already active as an INP close to 0 °C (e.g., Maki et al., 1974). Previous measurements of the INP concentration in the boreal forest showed a dominant contribution from local biogenic aerosol to the total INP population (Schneider et al., 2021; Vogel et al., 2024), however, given the measurements location in the sub-Arctic, the INP population might be different from the one studied in Hyytiälä. The vast majority of INP concentration measurements in the sub-Arctic and Arctic are filter-based with a low temporal resolution of typically several days (e.g., Wex et al., 2019; Tobo et al., 2024).
The present report details measurements with the Portable Ice Nucleation Experiment (PINE, Bilfinger SE, Möhler et al., 2021) during the Pallas Cloud Experiment (PaCE) 2022 (Brus et al., 2025). The PINE has been deployed in various field and lab studies prior and offers a high temporal resolution over a wide temperature range to study the INP concentration (Kunz et al., 2022; Lacher et al., 2024; Brasseur et al., 2022; Vogel et al., 2024).
The PINE was connected to a total heated inlet alongside other instrumentation at the Sammaltunturi station, which is part of the Pallas Atmosphere-Ecosystem Supersite in Finnish Lapland, hosted by the Finnish Meteorological Institute (FMI) (Asmi et al., 2021; Brus et al., 2025) and part of Global Atmosphere Watch (GAW), Integrated Carbon Observation System (ICOS), European Monitoring and Evaluation Programme (EMEP) and the Aerosol, Clouds and Trace Gases Research Infrastructure (ACTRIS). The station is located on top of a hill about 170 km north of the Arctic Circle (67.9733° N, 24.1157° E, 565 m above sea level, Hatakka et al., 2003). The tree line is approximately 100 m below the station. The vegetation around the station mainly consists of low vascular plants, lichen and moss (e.g., Lohila et al., 2015). The boreal forest below the tree line consists of pine, spruce and birch trees (e.g., Komppula et al., 2005). The anthropogenic impact on the aerosols at the station is minor since it is located inside the Pallas-Yllästunturi National Park and far away from larger settlements (Lohila et al., 2015). Sammaltunturi station is an excellent location to monitor the background air composition in norther Europe for these reasons (e.g., Lohila et al., 2015). During autumn the station is around half of the time inside clouds, making the location ideal to study cloud droplets and crystals as well as their associated aerosol particles (Lohila et al., 2015). Air masses typically originate in the Arctic during autumn (September–October) and winter (November–February) with a frequency of 36 % and 31 %, respectively (Asmi et al., 2011). Southern air masses follow closely with frequencies of 26 % and 28 % during autumn and winter, respectively (Asmi et al., 2011).
The PINE is a portable expansion-type cloud chamber, that is additionally temperature controlled. The PINE is fully automated and can be operatored for longer periods remotely. The measurement principle of PINE is detailed in the following paragraph (see also Möhler et al., 2021). The air upstream of the PINE chamber is dried using two Nafion™ membrane dryers and its dew point temperature is measured directly before entering the chamber. The drying efficiency is controlled by the pressure of the drying air, which was controlled and monitored during the measurement period. The dew point temperature has to be slightly above the temperature that is reached during an expansion, but needs to be low enough that no frost forms on the walls of the chamber. Regular background measurements were performed, where the air stream was filtered using a HEPA filter (HEPA-CAP, Whatman™), to make sure frost does not lead to artefacts in the data. The PINE was remotely controlled using a custom-made LabVIEW Software.
The PINE operates on a fixed schedule, where three different modes cycle: flush, expansion and refill. The flush mode flushes the PINE chamber with ambient air containing the aerosol particles under investigation. This mode runs for 300 s at a flow of 2 Lstd min−1. After the flush mode, the expansion mode starts. The chamber is evacuated to 790 hPa at a flow of 3 L min−1, the outflowing air passes the optical particle counter (OPC, fidas-pine, Palas GmbH), which measures the optical size of all aerosol particles above a certain size (around 2 µm). This lower limit is dependent on the photo multiplier voltage of the detector. A volumetric flow is used for the expansion to keep the velocity of the air constant through the OPC. The trigger voltage of the OPC is adjusted to detect larger liquid cloud droplets as well as the ice crystals formed via immersion freezing if INPs are present, according to the different ambient conditions (i.e. temperature and relative humidity). The immersion freezing is the dominant mode, but, especially at the start of the expansion, ice crystals might also be formed via deposition nucleation. Ice crystals appear larger than liquid droplets in the OPC data, therefore the liquid and solid phases are separated by size. After reaching the set pressure, the chamber is refilled with ambient air during the refill mode at a flow of 2 Lstd min−1. The inlet flow is always kept constant at 2 Lstd min−1. During the PaCE-2022 campaign, the PINE was operated between 240 and 252 K at a temporal resolution of approximately 6 min.
The data of PINE is structured into two data levels: raw data (raw_Data) and level 1 data (L1_data). The first stage contains the raw data from the housekeeping data, i.e. temperature and pressure data as well as the single particle data of the OPC. The L1_data is created by the custom-made Python software PINE INP Analysis (PIA) v2.0.2 (Büttner and Fösig, 2023). The software uses the SaQC Python module to introduce flags to the dataset (Schäfer et al., 2024). The automatic flags are structured into “info”, “warning” and “error” flags. The dataset is carefully evaluated and manually checked. In cases where the automatic flagging was not able to identify an error in the measurement, a manual flag was added.
One critical part of the analysis with the PIA software is the automatic ice threshold finder. The ice crystals are separated from the liquid cloud via their size information. The algorithm calculates the binned size distribution and searches for a minima in the data. This minima is considered the ice threshold above which only ice crystals are optically detected. In rare cases, this minima is not found and manually selected by following the algorithm:
-
A faulty threshold is identified for a given run.
-
Earlier thresholds are observed and if not faulty, the temporally closest threshold is selected.
-
As in 2, later thresholds are observed and if not faulty, the temporally closest threshold is selected.
-
The higher threshold of the two surrounding ones is selected as the new manual threshold.
This algorithm leads to a conservative estimate of the INP concentration with a possible low bias due to selecting the higher threshold in step 4.
The dataset is given as a NetCDF file following the CF-1.11 metadata conventions. It contains the L1_data with the temporal resolution given by the instrument. The minimal temperature reached during an expansion is given in the variable T_min (see also discussion in Möhler et al., 2021). The INP concentration associated with this temperature is given in the variable INP_cn. In addition, the dataset also contains the lower and upper bin boundary for the temperature binned data: temp_low and temp_upp, respectively. The “INP” concentration measured during the flush mode is given in the variable INP_cn_flush. This assumes that all aerosols or ice crystals from the walls that are detected during the flush mode above the ice threshold, might appear as an INP during the expansion. This value is typically much lower than the measured INP concentration (INP_cn) and is flagged as a “warning” if the condition INP_cn_flush >0.5 × INP_cn is true.
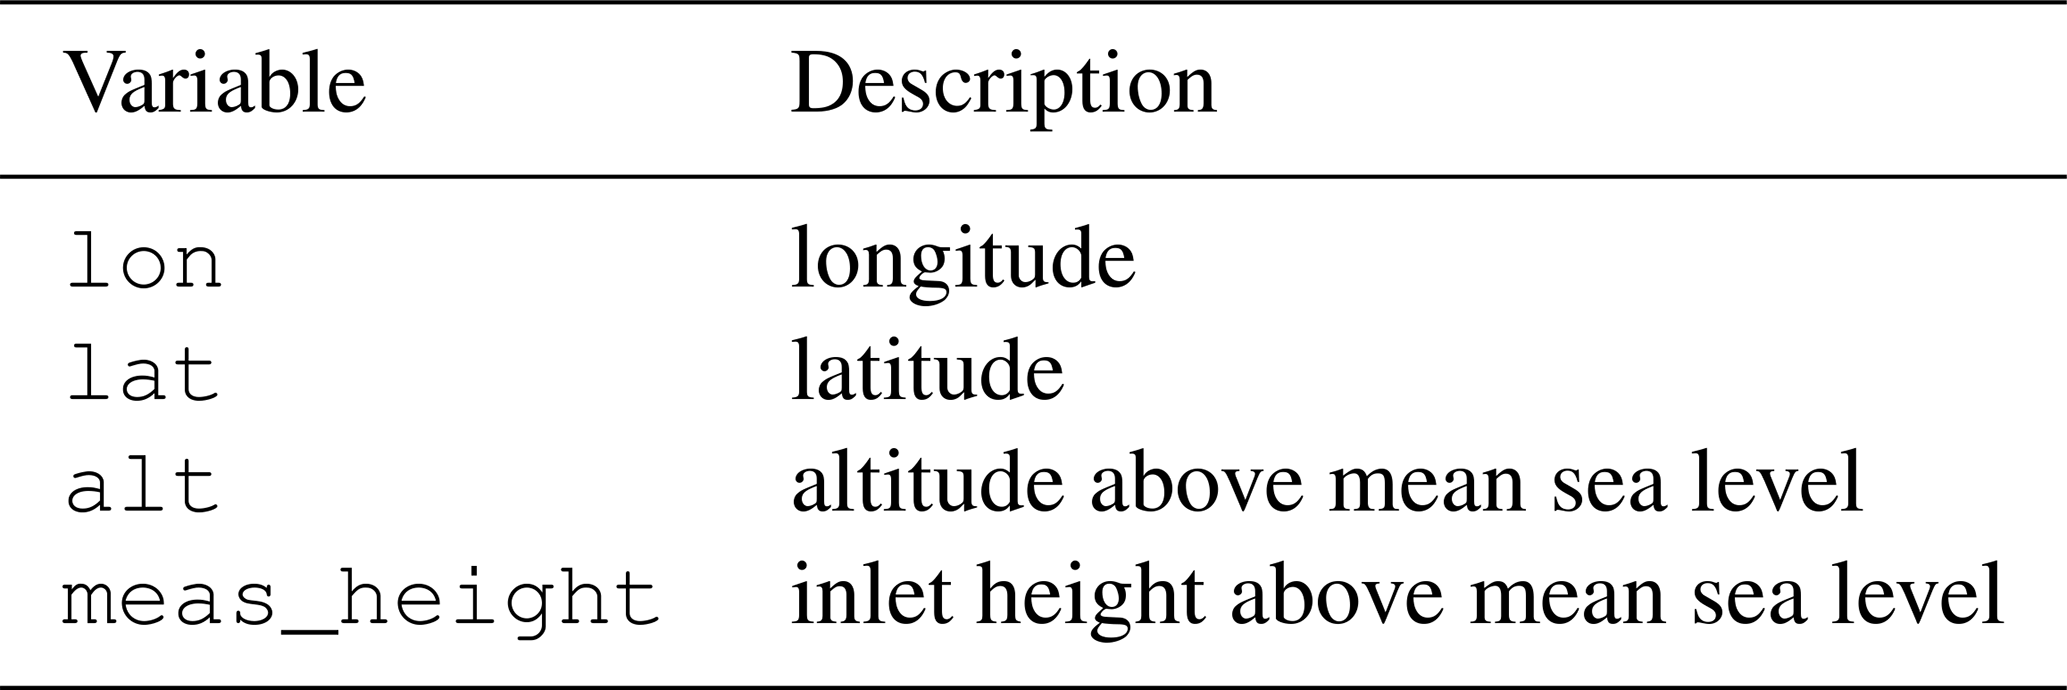
Flags are added under the ancillary variable INP_cn_qc which contains the information on the “warning” and “error” flags provided by the PIA software as well as the manual flags set. Data is considered as invalid if the associated ancillary variable INP_cn_qc contains an “error” and/or a “manual” flag. The invalid data is not removed from the dataset. Additional variables and their description are listed in Table 1.
Table 1Additional variables contained in the associated dataset and their description.
The INP concentration as a time series is shown as a coloured scatter plot in Fig. 1. The colour is associated with the temperature T (T_min) shown on the colour bar. Invalid data is removed in the visualization. Data where the temperature was above T=252 K was also removed for the visualisation (7 expansions). Zeros are not shown in the logarithmic plot, but they amount to around 35 % of the total number of expansions. Zeros happen when the INP concentration is below the sensitivity of PINE, which is around 0.5 , which is especially relevant for higher temperatures (⪆247 K). Between 23 September and 23 December 2022 around 19 600 valid expansions where performed in the temperature range T=239.83 to T=266.34 K. The temperature distribution is shown as a bar plot in Fig. 2. The highest frequency of measurements is in the half-open temperature bin K. The highest concentration of cINP=108.5 was measured on 10 November 2022 07:59:39+0000 UTC at a temperature of T=241.67 K. Large short-term fluctuations of the INP concentration are observed, which would not be visible with filter-based methods, that perform an integral measurement over longer time scales. Looking at hourly INP concentration data measured in the half-open temperature bin K, the mean of the interquartile range is cINP=0.9 with a maximum of the interquartile range of cINP=21.6 . The interquartile range can be used to assess the spread of data. The INP concentration split into the four months is shown in Fig. 3. The temperature T is the middle temperature of the temperature bins as specified in the previous paragraph. In general, the INP concentration is highest during December, while the lowest concentration is seen during November. The median of the four months visualized show large differences, sometimes deviating almost one order of magnitude (see T=242 K and October/November). The overall INP concentration increases exponentially with decreasing temperature. Especially at higher temperatures (i.e. >246 K) the INP concentration is close to the sensitivity limit of PINE for all months except December.
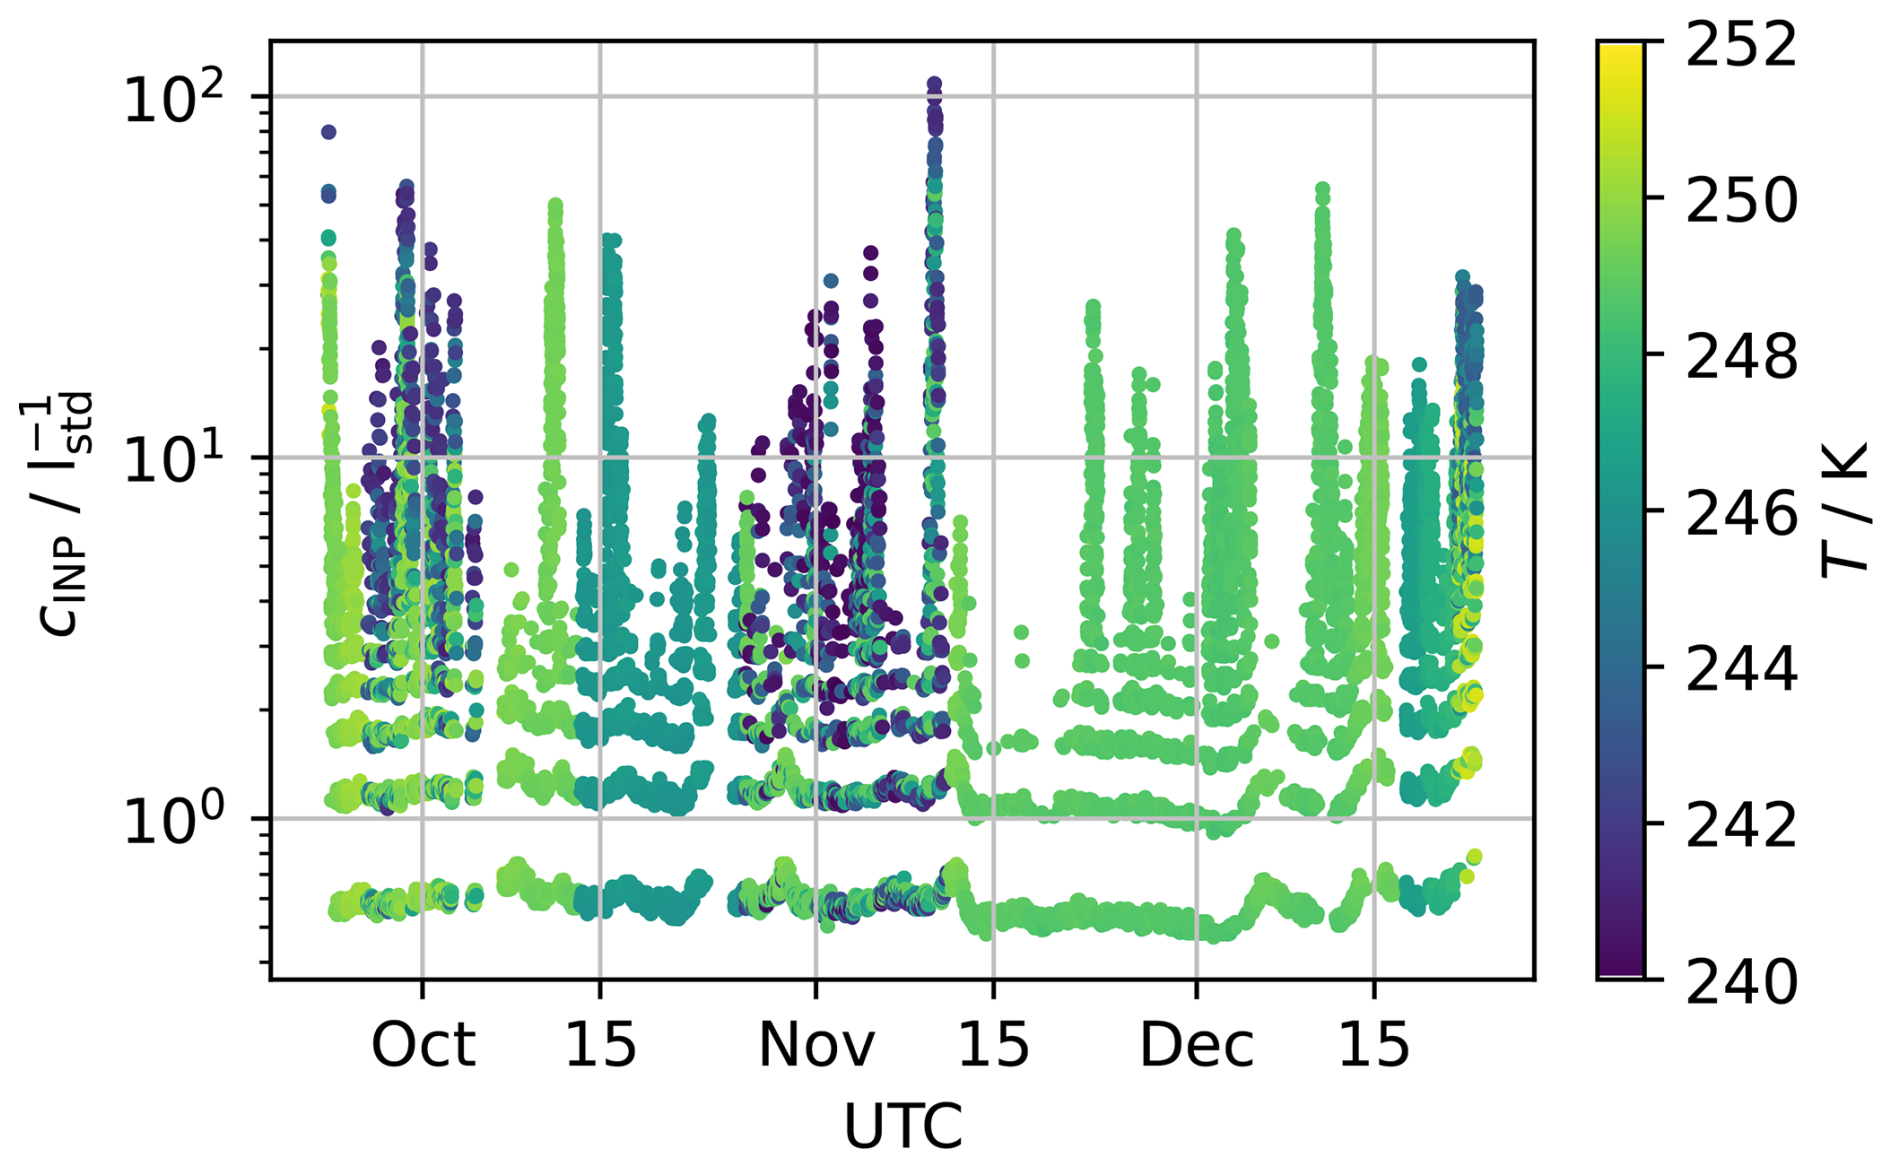
Figure 1The INP concentration measured with PINE during the PaCE-2022 campaign as a timeseries. Each scatter point represents one expansion and its colour is associated with the minimal temperature T during the expansion.
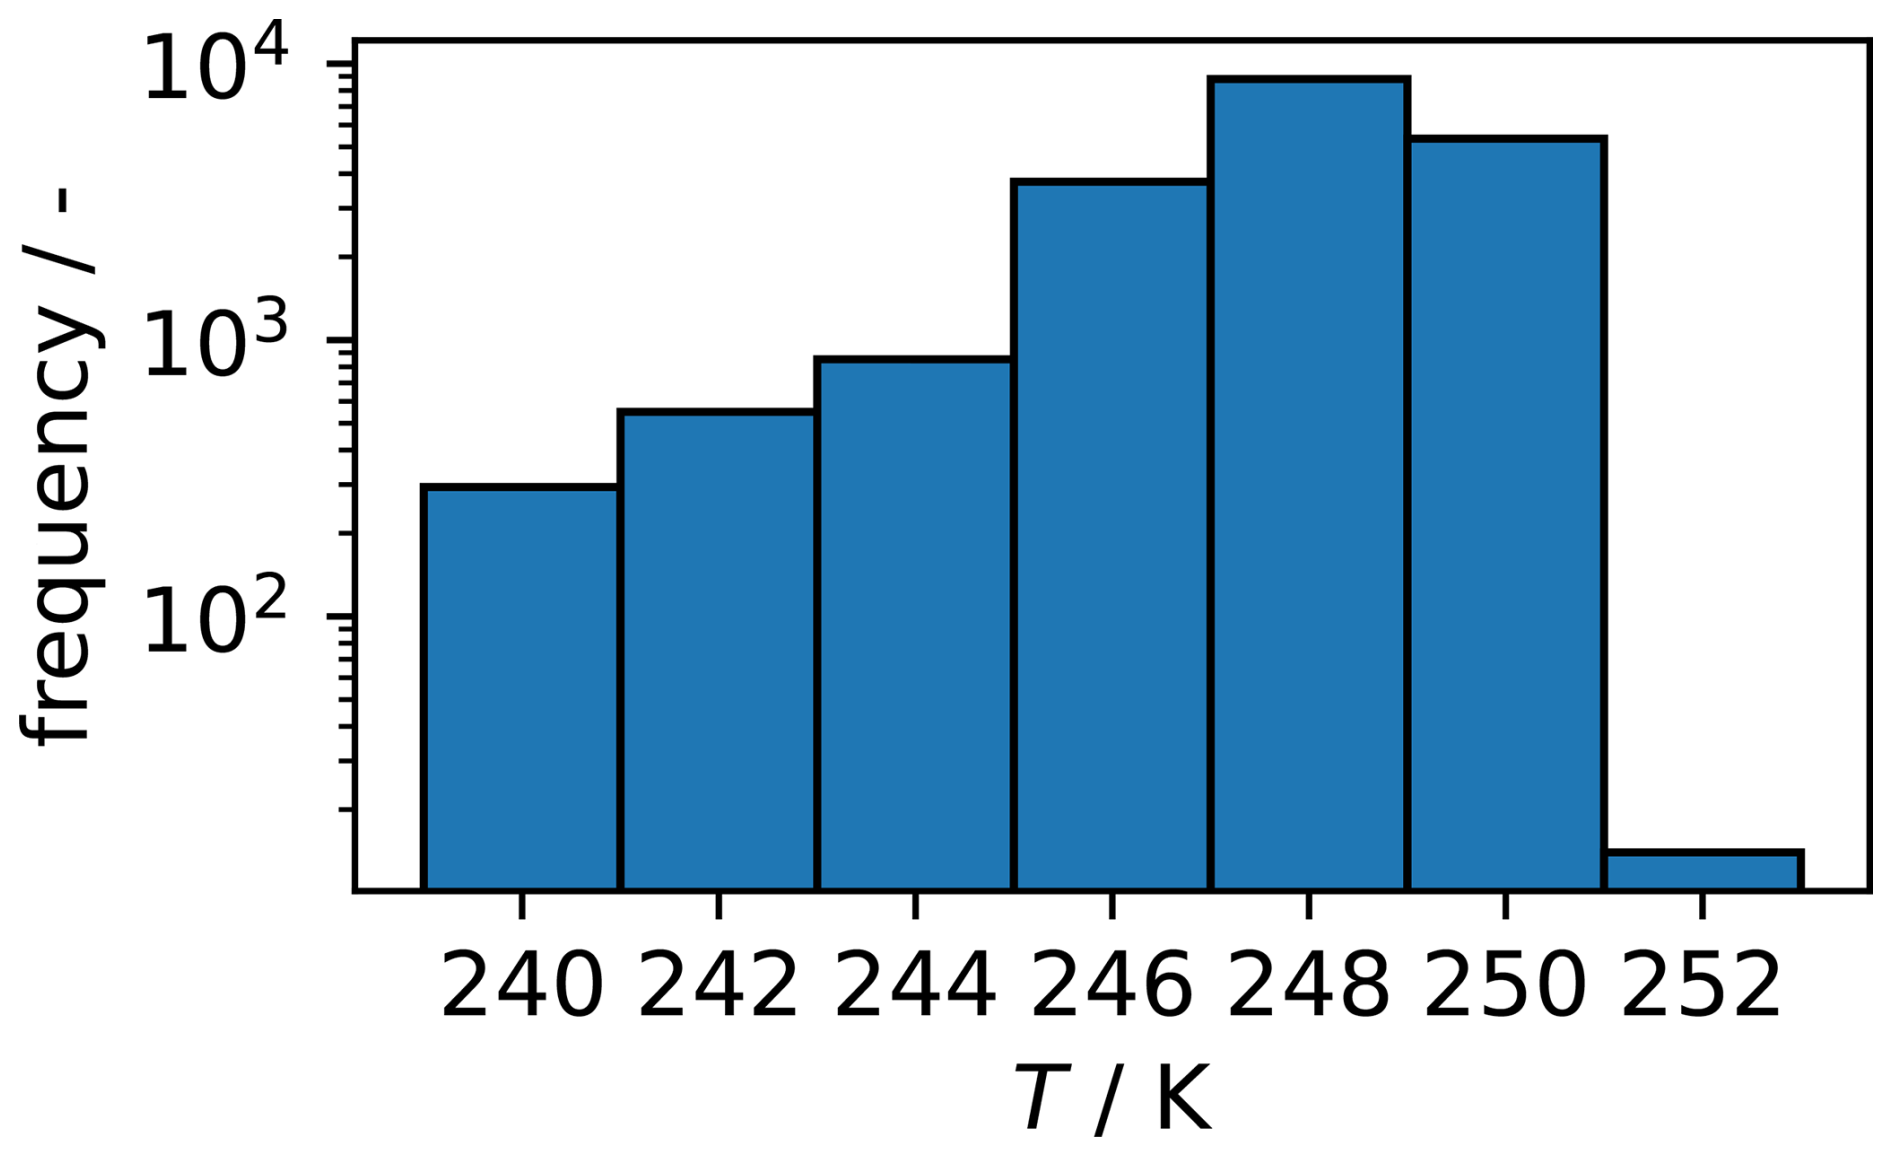
Figure 2The frequency distribution of the minimal temperatures reached by the PINE during expansions during the PaCE-2022 campaign.
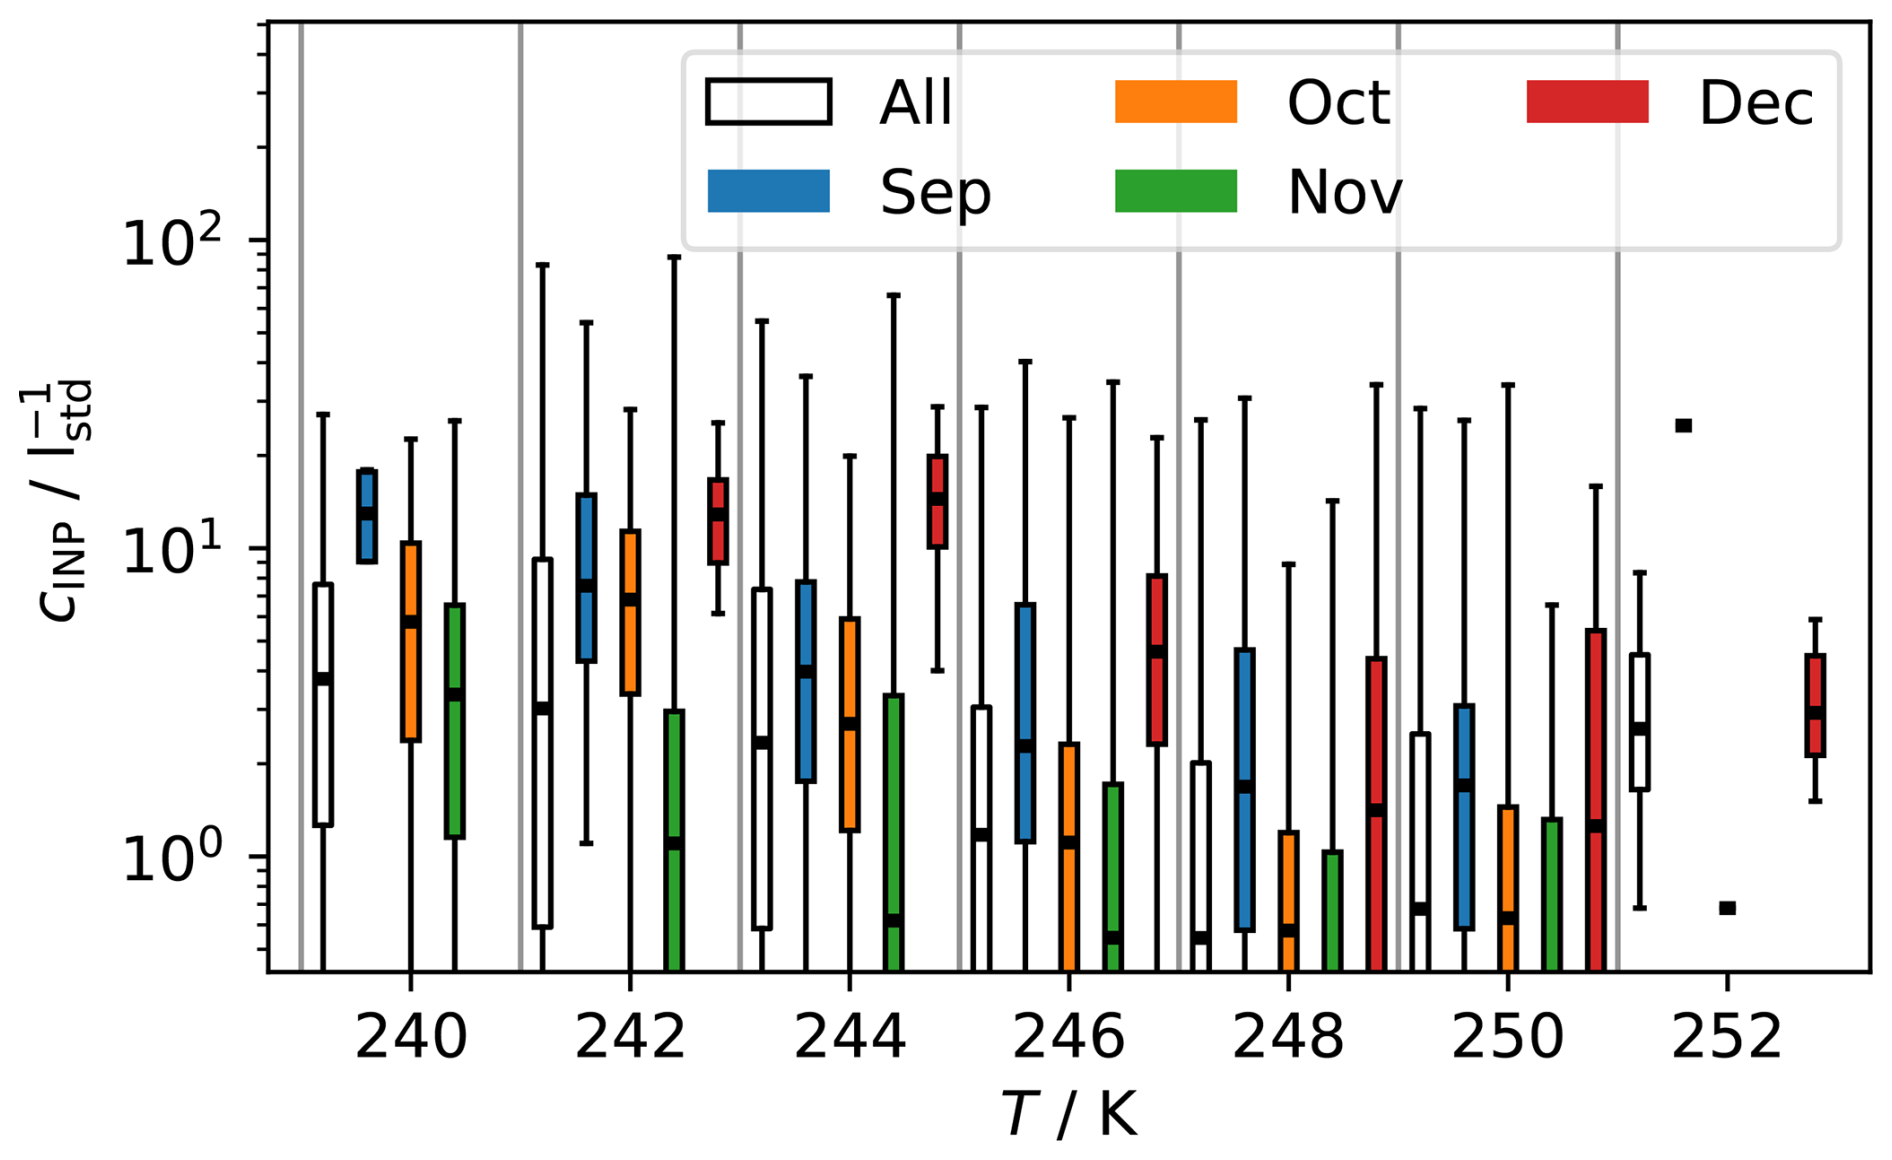
Figure 3Boxplot representation of the INP concentration measured by the PINE during the PaCE-2022 campaign. The whiskers show the (1, 99) percentiles and the fliers are not visible, otherwise standard boxplot notation is used. Medians that are not visible are zero and therefore not visualized on the logarithmic scale.
The uncertainty budget of PINE has a type B uncertainty (according to GUM, 2008) related to the individual uncertainties of the expansion duration t, the expansion flow F and the ice crystal number NINP measured by the OPC
The uncertainty of the expansion flow is given as
where RD and FS denote the reading value and the full scale of the mass flow controller (MFC, EL-FLOW Select F-201CV, Bronkhorst High-Tech B.V.), respectively. The largest value, considering an expansion flow of 3 Lstd min−1, is therefore 0.025 Lstd min−1, which corresponds to a relative uncertainty for the flow of approximately 0.83 %, which is considered to be negligible. The uncertainty of the expansion duration just depends on the response time of the solenoid valve (Solenoid Valve XLS-16, SMC Corporation), which is below 0.2 s, and therefore is also considered to be negligible. The uncertainty of the ice crystal number depends on the OPC (fidas-pine, Palas GmbH). In the prototype version of PINE, a different OPC was used (welas, Palas GmbH, see Möhler et al., 2021). The previous OPC used a T-shaped optical detection volume to detect particles and had an uncertainty of 20 % (Benz et al., 2005). Since the new OPC measures all particles and not just a small percentage of the total particle number, it can be assumed that the uncertainty of the new OPC (fidas-pine) is smaller. We assume a conservative estimate of 10 % for the relative uncertainty of the ice crystal number. In addition, the type A uncertainty is related to a Poisson distribution for the ice crystal number. Combined, this leads to a total uncertainty for the INP concentration of
where the first term is a type B uncertainty and the second term the type A uncertainty.
Datasets are archived under individual DOI at the Zenodo Open Science data archive (https://doi.org/10.5281/zenodo.16882069 Böhmländer et al., 2025), where a dedicated community Pallas Cloud Experiment – PaCE2022 has been established (https://zenodo.org/communities/pace2022/, last access: 28 February 2025). This community houses the data files along with additional metadata on the datasets. The PIA software is published under https://doi.org/10.5281/zenodo.15592431 (Büttner and Fösig, 2025). The SaQC software used for the flagging of the data is published under https://doi.org/10.5281/zenodo.5888547 (Schäfer et al., 2024).
The dataset provided is unique for the Sammaltunturi station. Rapid changes are visible in the dataset, that are not visible when using filter-based methods. Wex et al. (2019) used filter-based methods to investigate the INP concentration at four different Arctic sites. The measurement duration per filter varied between one to two weeks (Alert, Canada), four days (Ny-Alesund, Svalbard, Norway) and seven days (Utqiavik, Alaska, US; Villum Research Station, Greenland, Denmark). The temporal resolution of PINE is higher by a factor of more than 1500, considering a sampling time of seven days. On the contrary, filter-based methods are able to observe lower INP concentrations, especially relevant at higher nucleation temperatures. Additional datasets are available that provide information on the type of aerosol particles, i.e. fluorescent aerosol particles (Gratzl et al., 2025), the size and concentration of aerosol particles and meteorological data (Backman et al., 2025). This enables the use of the data to connect to small-scale modelling, for example using the flexible particle dispersion model (FLEXPART) to estimate the source and age of aerosols (e.g., Pisso et al., 2019). Aerosol data is available as well, providing aerosol concentration and size distribution data. The PINE also adds a source of reference for other data taken during the PaCE-2022 campaign utilizing uncrewed aerial vehicles (UAVs) and balloon-borne setups. The data is provided in its highest temporal resolution, allowing the data to be resampled to a time frame that is relevant for the investigation. In the grand scheme of the PaCE-2022 campaign various interesting cases were observed, which will result in a better understanding of the sources and impact of aerosols, especially in relation to aerosol-cloud interactions.
AB did the data analysis and wrote the manuscript. LL and AB performed the measurements with the PINE during the PaCE-2022 campaign. RF and NB are responsible for the software development of the PIA software. JN developed the LabVIEW software to control and interact with the PINE instrument. DB and KMD prepared and organized the PaCE-2022 campaign. All authors contributed to the proof reading and discussion of the dataset.
The contact author has declared that none of the authors has any competing interestes.
Publisher's note: Copernicus Publications remains neutral with regard to jurisdictional claims made in the text, published maps, institutional affiliations, or any other geographical representation in this paper. While Copernicus Publications makes every effort to include appropriate place names, the final responsibility lies with the authors. Views expressed in the text are those of the authors and do not necessarily reflect the views of the publisher.
This article is part of the special issue “Data generated during the Pallas Cloud Experiment 2022 campaign”. It is not associated with a conference.
The KIT project contribution was supported by the Helmholtz Association through the research program “Changing Earth – Sustaining our Future”. The authors would like to thank the technical team at the Sammaltunturi station for their support during the campaign, and the PINE team at KIT for continuous support in developing and operating the PINE instruments.
This research has been supported by the ACTRIS IMP (grant no. 871115), the ACTRIS-Finland funding (grant no. 358649) through the Ministry of Transport and Communications, and the Atmosphere and Climate Competence Center Flagship funding by the Research Council of Finland (grant no. 337552).
The article processing charges for this open-access publication were covered by the Karlsruhe Institute of Technology (KIT).
This paper was edited by Iolanda Ialongo and reviewed by two anonymous referees.
Asmi, E., Kivekäs, N., Kerminen, V.-M., Komppula, M., Hyvärinen, A.-P., Hatakka, J., Viisanen, Y., and Lihavainen, H.: Secondary new particle formation in Northern Finland Pallas site between the years 2000 and 2010, Atmos. Chem. Phys., 11, 12959–12972, https://doi.org/10.5194/acp-11-12959-2011, 2011. a, b
Asmi, E., Backman, J., Servomaa, H., Virkkula, A., Gini, M. I., Eleftheriadis, K., Müller, T., Ohata, S., Kondo, Y., and Hyvärinen, A.: Absorption instruments inter-comparison campaign at the Arctic Pallas station, Atmos. Meas. Tech., 14, 5397–5413, https://doi.org/10.5194/amt-14-5397-2021, 2021. a
Backman, J., Luoma, K., Servomaa, H., Vakkari, V., and Brus, D.: In-situ aerosol measurements at Sammaltunturi during the Pallas Cloud Experiment 2022, Earth Syst. Sci. Data Discuss. [preprint], https://doi.org/10.5194/essd-2025-284, in review, 2025. a
Bellouin, N., Quaas, J., Gryspeerdt, E., Kinne, S., Stier, P., Watson-Parris, D., Boucher, O., Carslaw, K. S., Christensen, M., Daniau, A.-L., Dufresne, J.-L., Feingold, G., Fiedler, S., Forster, P., Gettelman, A., Haywood, J. M., Lohmann, U., Malavelle, F., Mauritsen, T., McCoy, D. T., Myhre, G., Mülmenstädt, J., Neubauer, D., Possner, A., Rugenstein, M., Sato, Y., Schulz, M., Schwartz, S. E., Sourdeval, O., Storelvmo, T., Toll, V., Winker, D., and Stevens, B.: Bounding Global Aerosol Radiative Forcing of Climate Change, Reviews of Geophysics, 58, https://doi.org/10.1029/2019rg000660, 2020. a
Benz, S., Megahed, K., Möhler, O., Saathoff, H., Wagner, R., and Schurath, U.: T-dependent rate measurements of homogeneous ice nucleation in cloud droplets using a large atmospheric simulation chamber, Journal of Photochemistry and Photobiology A: Chemistry, 176, 208–217, https://doi.org/10.1016/j.jphotochem.2005.08.026, 2005. a
Böhmländer, A. J., Lacher, L., Höhler, K., Brus, D., Doulgeris, K.-M., Girdwood, J., Leisner, T., and Möhler, O.: Measurement of the ice-nucleating particle concentration using a mobile filter-based sampler on-board of a fixed-wing uncrewed aerial vehicle during the Pallas Cloud Experiment 2022, Earth Syst. Sci. Data Discuss. [preprint], https://doi.org/10.5194/essd-2025-87, in review, 2025. a
Brasseur, Z., Castarède, D., Thomson, E. S., Adams, M. P., Drossaart van Dusseldorp, S., Heikkilä, P., Korhonen, K., Lampilahti, J., Paramonov, M., Schneider, J., Vogel, F., Wu, Y., Abbatt, J. P. D., Atanasova, N. S., Bamford, D. H., Bertozzi, B., Boyer, M., Brus, D., Daily, M. I., Fösig, R., Gute, E., Harrison, A. D., Hietala, P., Höhler, K., Kanji, Z. A., Keskinen, J., Lacher, L., Lampimäki, M., Levula, J., Manninen, A., Nadolny, J., Peltola, M., Porter, G. C. E., Poutanen, P., Proske, U., Schorr, T., Silas Umo, N., Stenszky, J., Virtanen, A., Moisseev, D., Kulmala, M., Murray, B. J., Petäjä, T., Möhler, O., and Duplissy, J.: Measurement report: Introduction to the HyICE-2018 campaign for measurements of ice-nucleating particles and instrument inter-comparison in the Hyytiälä boreal forest, Atmos. Chem. Phys., 22, 5117–5145, https://doi.org/10.5194/acp-22-5117-2022, 2022. a
Brus, D., Doulgeris, K.-M., Bagheri, G., Bodenschatz, E., Pohorsky, R., Schmale, J., Böhmländer, A., Möhler, O., Lacher, L., Girdwood, J., Gratzl, J. G., Kaikkonen, V., O'Connor, E., Le, V., Backman, J., and Servomaa, H.: Data generated during the Pallas Cloud Experiment 2022 campaign: an introduction and overview, Earth Syst. Sci. Data Discuss., in preparation, 2025. a, b
Büttner, N. and Fösig, R.: PIA Software (v2.0.2), Zenodo [code], https://doi.org/10.5281/zenodo.15592786, 2023. a
Büttner, N. and Fösig, R.: PIA Software, Zenodo [code], https://doi.org/10.5281/zenodo.15592431, 2025. a
DeMott, P. J., Prenni, A. J., McMeeking, G. R., Sullivan, R. C., Petters, M. D., Tobo, Y., Niemand, M., Möhler, O., Snider, J. R., Wang, Z., and Kreidenweis, S. M.: Integrating laboratory and field data to quantify the immersion freezing ice nucleation activity of mineral dust particles, Atmos. Chem. Phys., 15, 393–409, https://doi.org/10.5194/acp-15-393-2015, 2015. a
Evaluation of measurement data – Guide to the expression of uncertainty in measurement, working Group 1 of the Joint Committee for Guides in Metrology, JCGM 100:2008, https://doi.org/10.59161/JCGM100-2008E, 2008. a
Fan, J., Leung, L. R., Rosenfeld, D., and DeMott, P. J.: Effects of cloud condensation nuclei and ice nucleating particles on precipitation processes and supercooled liquid in mixed-phase orographic clouds, Atmos. Chem. Phys., 17, 1017–1035, https://doi.org/10.5194/acp-17-1017-2017, 2017. a
Field, P. R. and Heymsfield, A. J.: Importance of snow to global precipitation, Geophysical Research Letters, 42, 9512–9520, https://doi.org/10.1002/2015gl065497, 2015. a
Gratzl, J., Brus, D., Doulgeris, K., Böhmländer, A., Möhler, O., and Grothe, H.: Fluorescent aerosol particles in the Finnish sub-Arctic during the Pallas Cloud Experiment 2022 campaign, Earth Syst. Sci. Data, 17, 3975–3985, https://doi.org/10.5194/essd-17-3975-2025, 2025. a
Hatakka, J., Aalto, T., Aaltonen, V., Aurela, M., Hakola, H., Komppula, M., Laurila, T., Lihavainen, H., Paatero, J., Salminen, K., and Viisanen, Y.: Overview of the atmospheric research activities and results at Pallas GAW station, Boreal Environment Research, 8, 365–383, ISBN: 1239-6095, 2003 a
Heymsfield, A. J., Schmitt, C., Chen, C.-C.-J., Bansemer, A., Gettelman, A., Field, P. R., and Liu, C.: Contributions of the Liquid and Ice Phases to Global Surface Precipitation: Observations and Global Climate Modeling, Journal of the Atmospheric Sciences, 77, 2629–2648, https://doi.org/10.1175/jas-d-19-0352.1, 2020. a
IPCC: The Physical Science Basis. Contribution of Working Group 1 to the Sixth Assessment Report of the Intergovernmental Panel on Climate Change, Cambridge University Press, https://doi.org/10.1017/9781009157896, 2021. a
Kanji, Z. A., Ladino, L. A., Wex, H., Boose, Y., Burkert-Kohn, M., Cziczo, D. J., and Krämer, M.: Overview of Ice Nucleating Particles, Meteorological Monographs, 58, 11–133, https://doi.org/10.1175/amsmonographs-d-16-0006.1, 2017. a, b
Komppula, M., Lihavainen, H., Kerminen, V., Kulmala, M., and Viisanen, Y.: Measurements of cloud droplet activation of aerosol particles at a clean subarctic background site, Journal of Geophysical Research: Atmospheres, 110, https://doi.org/10.1029/2004jd005200, 2005. a
Koop, T., Luo, B., Tsias, A., and Peter, T.: Water activity as the determinant for homogeneous ice nucleation in aqueous solutions, Nature, 406, 611–614, https://doi.org/10.1038/35020537, 2000. a
Kunz, M., Abbas, S. S., Bauckholt, M., Böhmländer, A., Feuerle, T., Gasch, P., Glaser, C., Groß, J., Hajnsek, I., Handwerker, J., Hase, F., Khordakova, D., Knippertz, P., Kohler, M., Lange, D., Latt, M., Laube, J., Martin, L., Mauder, M., Möhler, O., Mohr, S., Reitter, R. W., Rettenmeier, A., Rolf, C., Saathoff, H., Schrön, M., Schütze, C., Spahr, S., Späth, F., Vogel, F., Völksch, I., Weber, U., Wieser, A., Wilhelm, J., Zhang, H., and Dietrich, P.: Swabian MOSES 2021: An interdisciplinary field campaign for investigating convective storms and their event chains, Frontiers in Earth Science, 10, https://doi.org/10.3389/feart.2022.999593, 2022. a
Lacher, L., Adams, M. P., Barry, K., Bertozzi, B., Bingemer, H., Boffo, C., Bras, Y., Büttner, N., Castarede, D., Cziczo, D. J., DeMott, P. J., Fösig, R., Goodell, M., Höhler, K., Hill, T. C. J., Jentzsch, C., Ladino, L. A., Levin, E. J. T., Mertes, S., Möhler, O., Moore, K. A., Murray, B. J., Nadolny, J., Pfeuffer, T., Picard, D., Ramírez-Romero, C., Ribeiro, M., Richter, S., Schrod, J., Sellegri, K., Stratmann, F., Swanson, B. E., Thomson, E. S., Wex, H., Wolf, M. J., and Freney, E.: The Puy de Dôme ICe Nucleation Intercomparison Campaign (PICNIC): comparison between online and offline methods in ambient air, Atmos. Chem. Phys., 24, 2651–2678, https://doi.org/10.5194/acp-24-2651-2024, 2024. a
Lohila, A., Penttilä, T., Jortikka, S., Aalto, T., Anttila, P., Asmi, E., Aurela, M., Hatakka, J., Hellén, H., Henttonen, H., Hänninen, P., Kilkki, J., Kyllönen, K., Laurila, T., Lepistö, A., Lihavainen, H., Makkonen, U., Paatero, J., Rask, M., Sutinen, R., Tuovinen, J.-P., Vuorenmaa, J., and Viisanen, Y.: Preface to the special issue on integrated research of atmosphere, ecosystems and environment at Pallas, in: Boreal Environment Research, vol. 20, 431–454, https://jukuri.luke.fi/server/api/core/bitstreams/51ff188d-5c61-4ba6-b85d-7e7da304bd7c/content (last access: 05 November 2025), 2015. a, b, c, d
Maki, L. R., Galyan, E. L., Chang-Chien, M.-M., and Caldwell, D. R.: Ice Nucleation Induced by Pseudomonas syringae, Applied Microbiology, 28, 456–459, https://doi.org/10.1128/am.28.3.456-459.1974, 1974. a
Möhler, O., Adams, M., Lacher, L., Vogel, F., Nadolny, J., Ullrich, R., Boffo, C., Pfeuffer, T., Hobl, A., Weiß, M., Vepuri, H. S. K., Hiranuma, N., and Murray, B. J.: The Portable Ice Nucleation Experiment (PINE): a new online instrument for laboratory studies and automated long-term field observations of ice-nucleating particles, Atmos. Meas. Tech., 14, 1143–1166, https://doi.org/10.5194/amt-14-1143-2021, 2021. a, b, c, d
Mülmenstädt, J., Sourdeval, O., Delanoë, J., and Quaas, J.: Frequency of occurrence of rain from liquid-, mixed-, and ice-phase clouds derived from A-Train satellite retrievals, Geophys. Res. Lett., 42, 6502–6509, https://doi.org/10.1002/2015GL064604, 2015. a
Pisso, I., Sollum, E., Grythe, H., Kristiansen, N. I., Cassiani, M., Eckhardt, S., Arnold, D., Morton, D., Thompson, R. L., Groot Zwaaftink, C. D., Evangeliou, N., Sodemann, H., Haimberger, L., Henne, S., Brunner, D., Burkhart, J. F., Fouilloux, A., Brioude, J., Philipp, A., Seibert, P., and Stohl, A.: The Lagrangian particle dispersion model FLEXPART version 10.4, Geosci. Model Dev., 12, 4955–4997, https://doi.org/10.5194/gmd-12-4955-2019, 2019. a
Pruppacher, H. R. and Klett, J. D.: Microphysics of Clouds and Precipitation, Kluwer Acad. Norwell, Mass., ISBN: 0-306-48100-6, 1997. a
Schäfer, D., Palm, B., Lünenschloß, P., Schmidt, L., Schnicke, T., and Bumberger, J.: System for automated Quality Control – SaQC (v2.6.0), Zenodo [code], https://doi.org/10.5281/zenodo.5888547, 2024. a, b
Schmale, J., Zieger, P., and Ekman, A. M. L.: Aerosols in current and future Arctic climate, Nature Climate Change, 11, 95–105, https://doi.org/10.1038/s41558-020-00969-5, 2021. a
Schneider, J., Höhler, K., Heikkilä, P., Keskinen, J., Bertozzi, B., Bogert, P., Schorr, T., Umo, N. S., Vogel, F., Brasseur, Z., Wu, Y., Hakala, S., Duplissy, J., Moisseev, D., Kulmala, M., Adams, M. P., Murray, B. J., Korhonen, K., Hao, L., Thomson, E. S., Castarède, D., Leisner, T., Petäjä, T., and Möhler, O.: The seasonal cycle of ice-nucleating particles linked to the abundance of biogenic aerosol in boreal forests, Atmos. Chem. Phys., 21, 3899–3918, https://doi.org/10.5194/acp-21-3899-2021, 2021. a
Storelvmo, T.: Aerosol Effects on Climate via Mixed-Phase and Ice Clouds, Annual Review of Earth and Planetary Sciences, 45, 199–222, https://doi.org/10.1146/annurev-earth-060115-012240, 2017. a
Tatzelt, C., Henning, S., Welti, A., Baccarini, A., Hartmann, M., Gysel-Beer, M., van Pinxteren, M., Modini, R. L., Schmale, J., and Stratmann, F.: Circum-Antarctic abundance and properties of CCN and INPs, Atmos. Chem. Phys., 22, 9721–9745, https://doi.org/10.5194/acp-22-9721-2022, 2022. a
Tobo, Y., Adachi, K., Kawai, K., Matsui, H., Ohata, S., Oshima, N., Kondo, Y., Hermansen, O., Uchida, M., Inoue, J., and Koike, M.: Surface warming in Svalbard may have led to increases in highly active ice-nucleating particles, Communications Earth & Environment, 5, https://doi.org/10.1038/s43247-024-01677-0, 2024. a
Vali, G., DeMott, P. J., Möhler, O., and Whale, T. F.: Technical Note: A proposal for ice nucleation terminology, Atmos. Chem. Phys., 15, 10263–10270, https://doi.org/10.5194/acp-15-10263-2015, 2015. a
Vergara-Temprado, J., Miltenberger, A. K., Furtado, K., Grosvenor, D. P., Shipway, B. J., Hill, A. A., Wilkinson, J. M., Field, P. R., Murray, B. J., and Carslaw, K. S.: Strong control of Southern Ocean cloud reflectivity by ice-nucleating particles, Proc. Natl. Acad. Sci., 115, 2687–2692, https://doi.org/10.1073/pnas.1721627115, 2018. a
Vogel, F., Adams, M. P., Lacher, L., Foster, P. B., Porter, G. C. E., Bertozzi, B., Höhler, K., Schneider, J., Schorr, T., Umo, N. S., Nadolny, J., Brasseur, Z., Heikkilä, P., Thomson, E. S., Büttner, N., Daily, M. I., Fösig, R., Harrison, A. D., Keskinen, J., Proske, U., Duplissy, J., Kulmala, M., Petäjä, T., Möhler, O., and Murray, B. J.: Ice-nucleating particles active below −24 °C in a Finnish boreal forest and their relationship to bioaerosols, Atmos. Chem. Phys., 24, 11737–11757, https://doi.org/10.5194/acp-24-11737-2024, 2024. a, b
Wex, H., Huang, L., Zhang, W., Hung, H., Traversi, R., Becagli, S., Sheesley, R. J., Moffett, C. E., Barrett, T. E., Bossi, R., Skov, H., Hünerbein, A., Lubitz, J., Löffler, M., Linke, O., Hartmann, M., Herenz, P., and Stratmann, F.: Annual variability of ice-nucleating particle concentrations at different Arctic locations, Atmos. Chem. Phys., 19, 5293–5311, https://doi.org/10.5194/acp-19-5293-2019, 2019. a, b
- Abstract
- Introduction
- Observation site
- Instrument operation
- Data evaluation and quality control
- Overview of dataset
- Uncertainty budget
- Code and data availability
- Conclusions
- Author contributions
- Competing interests
- Disclaimer
- Special issue statement
- Acknowledgements
- Financial support
- Review statement
- References