the Creative Commons Attribution 4.0 License.
the Creative Commons Attribution 4.0 License.
 | 11 Nov 2025
Landscape reconstructions for Europe during the late Last Glacial (60–20 ka BP): a pollen-based REVEALS approach
Andreas Maier
Nikki Vercauteren
Vegetation change during the Last Glacial period in Europe plays a crucial role in better understanding the ecosystem dynamics response to abrupt climate change. Yet, most quantitative reconstructions of land-cover primarily focus on the Holocene and aim to disentangle the impact of anthropogenic and climatic stress on the vegetation. Here, we present temporally continuous land-cover reconstructions from Europe for the latter half of the Last Glacial period (60–20 ka BP) using the “Regional Estimates of Vegetation Abundance from Large Sites” (REVEALS) model. The pollen-based REVEALS model uniquely factors in plant-specific parameters, such as relative pollen productivity (RPP) and pollen fall speed to model pollen dispersal and thus provides more accurate representation of past vegetation cover than simple relations of fossil pollen counts. We compiled a total of 61 datasets from Europe and its bordering regions to model land-cover estimates across 60 time steps in 1000 year increments (Kern, 2024b). By grouping the 38 analysed taxa into 5 land-cover types (LCTs), we simplify the interpretation of our results, demonstrated in three selected periods during the Last Glacial: Greenland Interstadial 14 (GI-14), Greenland Stadial 9 (GS-9), and the Last Glacial Maximum (LGM). These periods provide insight into stadial-interstadial vegetation variability as well as extreme glacial conditions, which seem to play a fundamental role in the demographic developments of Palaeolithic hunter-gatherers. Additionally, we compare the REVEALS land-cover estimates to raw pollen data, provide REVEALS standard errors, and discuss the reliability of our results as well as potential avenues to further improve the reliability of REVEALS estimates. To facilitate the use and interpretation of our data for a wide scientific audience, we developed the browser-based application PALVEG (https://oakern.shinyapps.io/PALVEG/, last access: 22 October 2025), which requires no prior programming experience and dynamically generates maps based on user input.
- Article
(6536 KB) - Full-text XML
- BibTeX
- EndNote


The quantification of terrestrial vegetation dynamics in response to climatic change remains poorly understood as it necessitates the conversion of fossil pollen data to tangible reconstructions of the past vegetation cover (Dallmeyer et al., 2023). Yet, terrestrial vegetation is one of the major components of the Earth's terrestrial biosphere and a major driver in the global carbon cycle (Masson-Delmotte et al., 2021). Through biogeochemical feedback processes, their role as a mitigation agent is of particular importance in the context of climate change (Anderegg et al., 2020; Harper et al., 2018; Williamson, 2016). Making sense of the past and developing future adaptation and mitigation strategies greatly depend on our understanding of the interaction between climate and vegetation – an integral part of Earth system models (ESMs) employed to generate climate projections (Fisher et al., 2018; McDowell et al., 2020). ESMs often rely on dynamic global vegetation models (DGVMs) that predict changes in land-cover, productivity, biomass, and/or carbon storage as a function of static bioclimatic variables that are provided by climate models (e.g., Shao et al., 2018; Lu et al., 2018; Hopcroft et al., 2017). Evaluating and improving DGVMs requires appropriate data.
An ongoing endeavour is the comparison of DGVM outputs with palaeoproxy records of the past vegetation composition (Shao et al., 2018; Woillez et al., 2013). The primary goals are to evaluate the output DGVMs and, in a next step, to inform DGVMs and thereby improve the accuracy of their predictions. Pollen records from peat deposits, lake sediments, marine sediments, and to a lesser extent from outcrops and archaeological layers represent the most promising empirical data of past vegetation cover (Dallmeyer et al., 2023). Pollen records provide direct evidence of the vegetational composition and are widespread across terrestrial landscapes. However, the pollen-vegetation relationship is non-linear and often biased by taxon-specific characteristics that influence pollen productivity, dispersal, and deposition (Andersen, 1970; Prentice, 1985). Moreover, boundary conditions, such as CO2-levels, atmospheric patterns, and soil properties vary through time and may influence these taxon-specific parameters (Ladeau and Clark, 2006; Wayne et al., 2002) thus hindering a direct comparison with DGVM outputs.
Despite these proxy-specific drawbacks, quantitative vegetation reconstructions have a long history in the geosciences (Chevalier et al., 2020). Over time, different methods have emerged and improved upon, such as biomisation (e.g., Prentice et al., 1996; Binney et al., 2017; Li et al., 2025), the Pseudobiomisation Method (PBM; Fyfe et al., 2010; Woodbridge et al., 2014), modern analogue techniques (MATs; e.g., Zanon et al., 2018), and landscape reconstructions (REVEALS; Sugita, 2007; Githumbi et al., 2022; Serge et al., 2023; Schild et al., 2025). The different approaches have been discussed, compared, and evaluated previously (Chevalier et al., 2020). Here, we focus on the Regional Estimates of Vegetation Abundance from Large Sites (REVEALS; Sugita, 2007). Among the aforementioned techniques, REVEALS uniquely factors in pollen productivity and dispersal properties, yielding land-cover percentages for each individual taxon. Syntheses of regional to continental REVEALS-specific parameters are continually expanded and improved upon (e.g., Githumbi et al., 2022; Mazier et al., 2012; Schild et al., 2025; Serge et al., 2023; Wieczorek and Herzschuh, 2020). In the recent years, REVEALS land-cover simulations were generated on global (Schild et al., 2025) and continental scales for Eurasia, China, and North America (e.g., Roberts et al., 2018; Githumbi et al., 2022; Li et al., 2023). However, previous works have mainly focused on the response of terrestrial ecosystems to anthropogenic stress (e.g., agriculture and deforestation) during the Holocene (11 700 yr BP to present).
The Holocene is a period of relative climate stability and low-amplitude climate fluctuations in comparison with the preceding glacial period (Mayewski et al., 2004). In order to focus on the impact of climatic stressors on the regional vegetation, we direct our attention on the Last Glacial period (ca. 115 000–11 700 yr BP), which features marked climatic fluctuations (Fig. 1) with limited human impact on the environment (Brovkin et al., 2021; Fletcher et al., 2010). The Last Glacial encompasses a wide range of climate states: Following the relatively stable interglacial climates of early Marine Isotope Stage 5 (MIS 5e), phases of climate instability (remainder of MIS 5a–d and MIS 3) alternated with relatively stable glacial climates (MIS 4 and MIS 2; Fig. 1). Particularly the climate in the Northern Hemisphere during MIS 3 is characterised by a marked climate instability that manifested in several periods of abrupt warming that permeated the otherwise glacial climatic conditions (e.g., Rasmussen et al., 2014; Corrick et al., 2020). These periods were termed Greenland Interstadials (GIs) after their discovery in Greenland ice cores (Svensson et al., 2006), while periods in-between GIs are termed Greenland Stadials (GSs), accordingly. While these events are relatively well-studied in the marine realm, their impact on terrestrial palaeoenvironments is still largely unknown (Fletcher et al., 2010; Moreno et al., 2014), especially in Central Europe (Britzius et al., 2024; Kern et al., 2022; Woillard, 1978), a fact that is commonly ascribed to the scarcity of available data. Although the climatic boundary conditions today are different, the response of terrestrial ecosystems to abrupt warming events is of particular interest in the context of modern climate change (Masson-Delmotte et al., 2021). The vegetation response to GI-GS variability raises several questions regarding adaptation, resilience, and extinction/repopulation rates (Alley et al., 2003; O'Neill et al., 2017), the possibility of local/regional plant refugia (Tzedakis et al., 2013; Willis et al., 2000; Willis and van Andel, 2004), and also seems to have high relevance for the large-scale demographic developments of Palaeolithic hunter-gatherers (Maier et al., 2022).
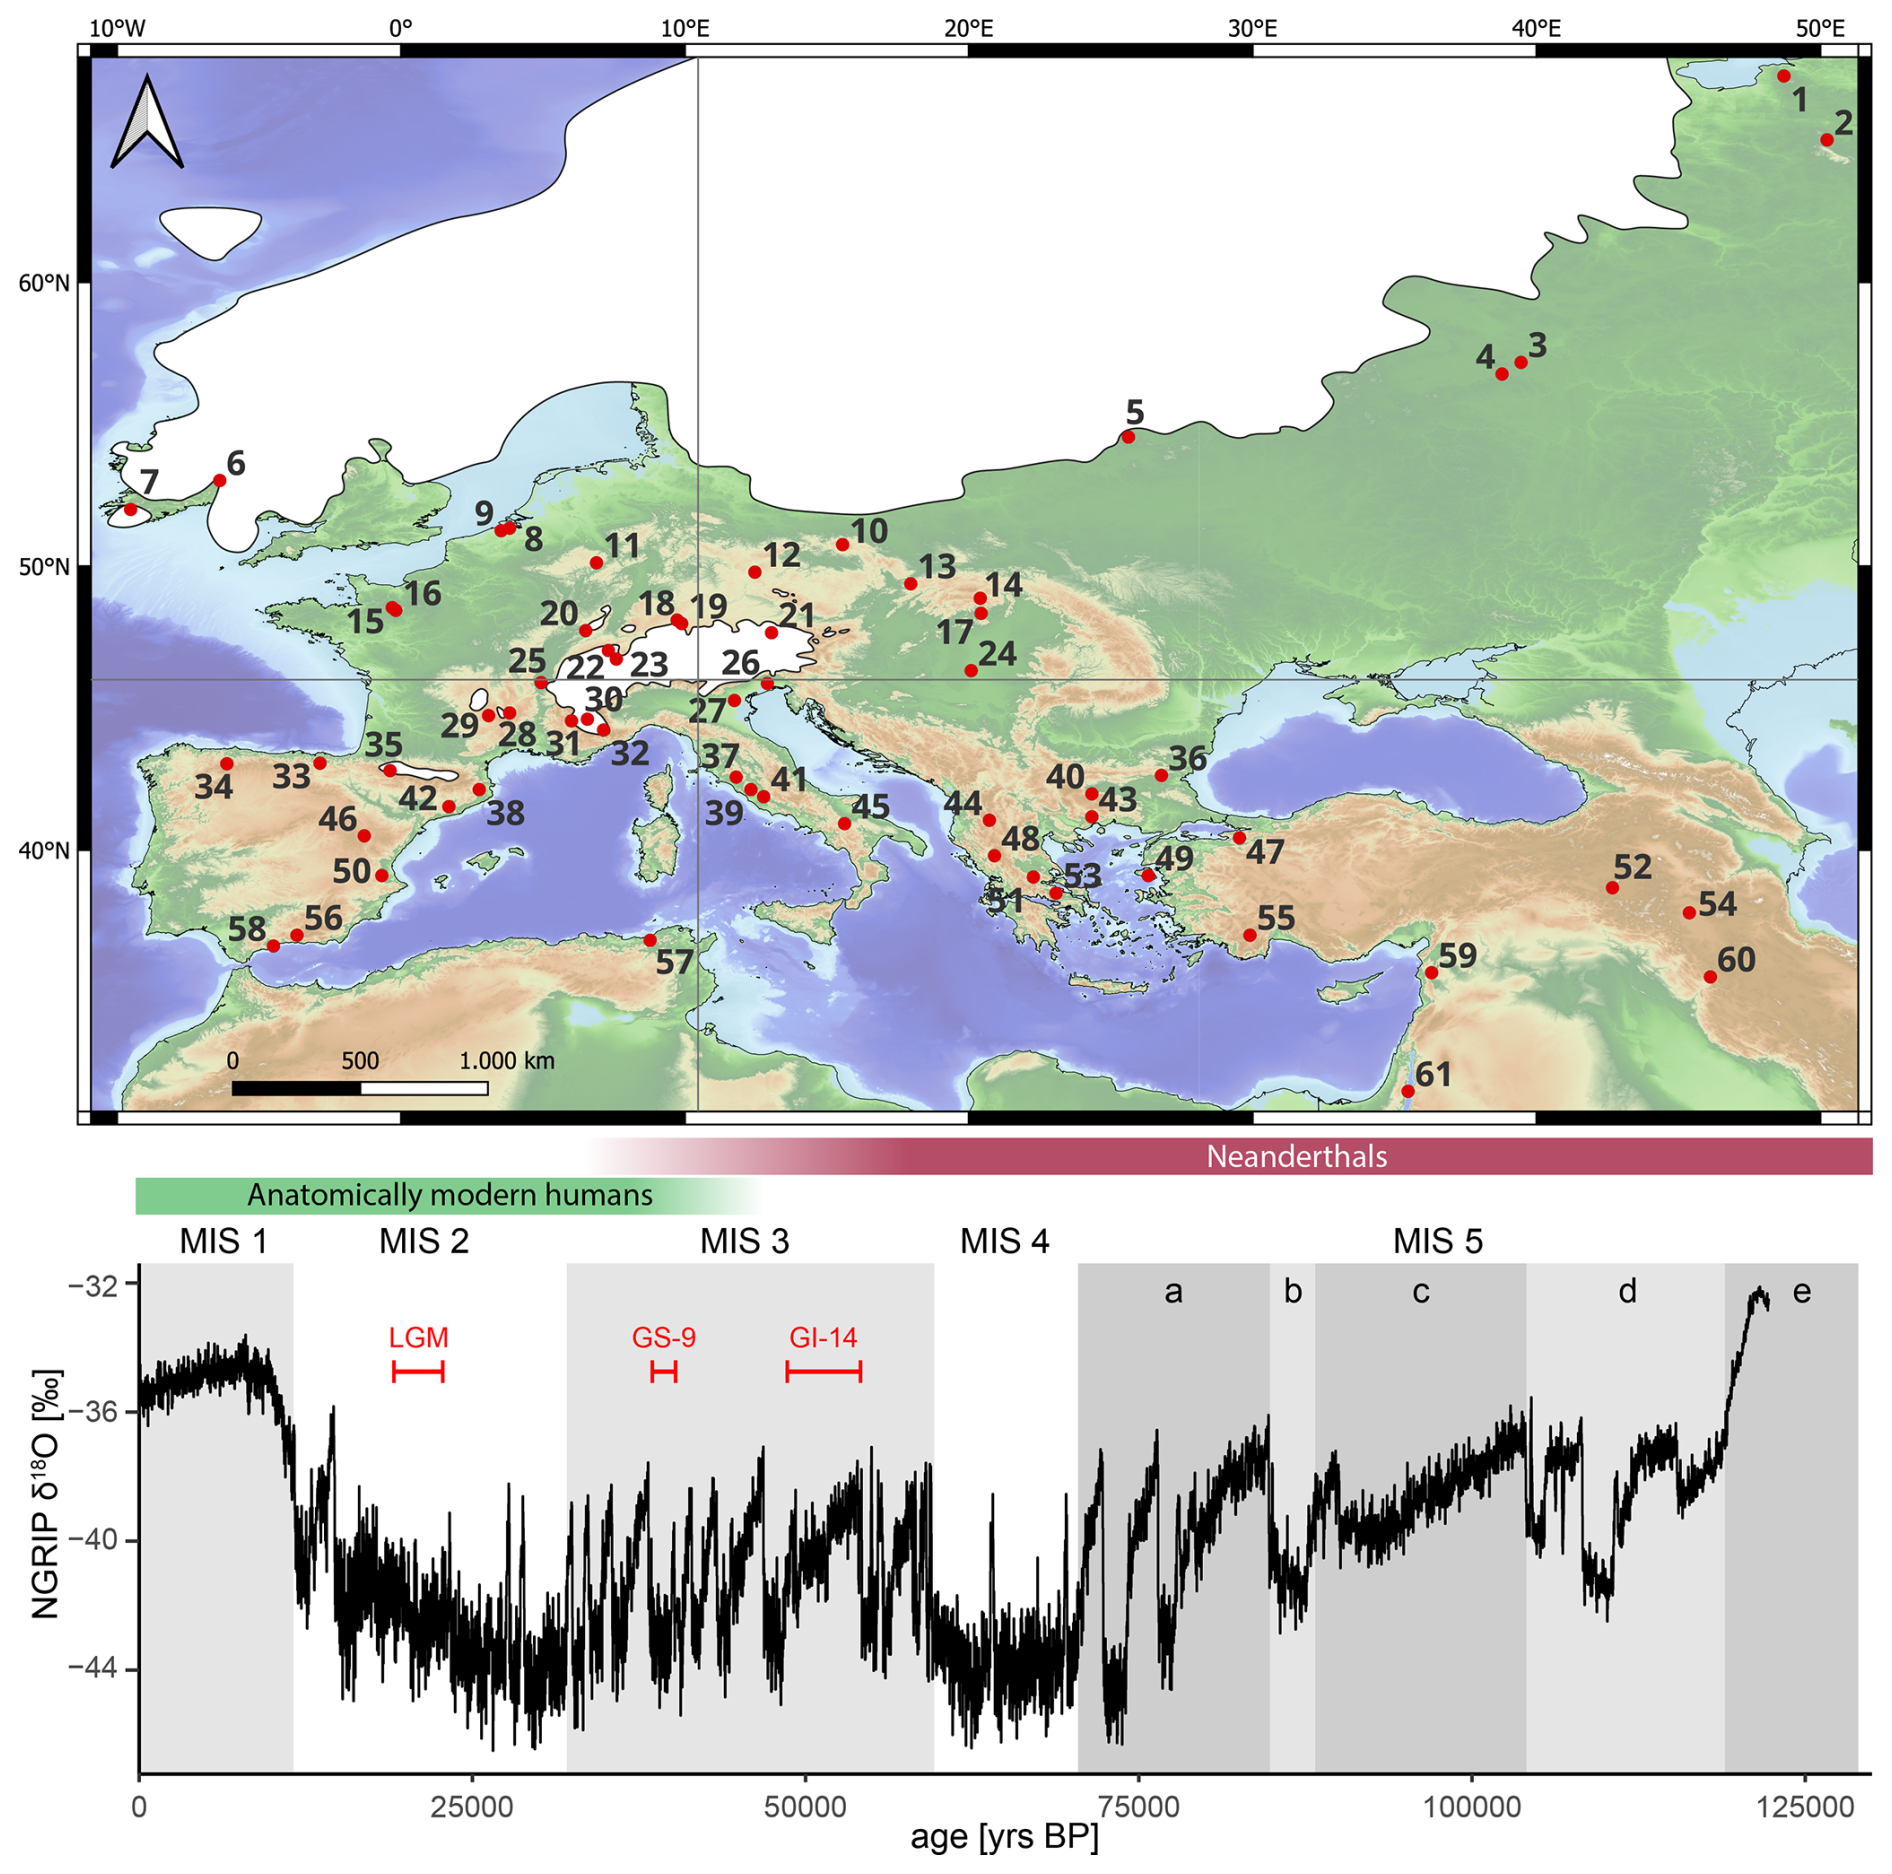
Figure 1Top panel: map of Europe depicting the location of all pollen archives included in this study. The vertical and horizontal grey lines subdivide the study area into four quadrants, which are referenced in the discussion. See Table A1 for a detailed legend and references. Last Glacial Maximum ice-sheet extent redrawn after Ehlers et al. (2011). Bottom panel: Greenland oxygen isotopes (Rasmussen et al., 2014) for the last ca. 125 000 years. Red intervals are referred to in the results and discussion section (Sect. 3). Approximated presence of different human species (Staubwasser et al., 2018) is indicated by the coloured bars. Marine Isotope Stages (MIS) after (Lisiecki and Raymo, 2005).
2.1 Pollen data – sources and preparation
A total of 61 pollen records with data for the 60–20 kyr BP interval were compiled from study sites located in Europe and bordering regions (Fig. 1). The majority of those datasets were obtained from the NEOTOMA database (Williams et al., 2018; Kern, 2025), the ACER pollen and charcoal database (Sánchez Goñi et al., 2017), and PANGAEA (de Beaulieu, 2010; Britzius et al., 2024; Kern, 2021; Koutsodendris et al., 2023a; Miebach et al., 2019a; Sadori et al., 2018). Additional datasets were gathered directly from the respective publications and by personal communication with other researchers. A complete table listing all sites and references can be found in Table A1.
Most datasets were either provided with a robust age-depth model in the corresponding publication or database. Records without a robust chronology were tentatively correlated with well-established records based on the stratigraphic placement of these records in a broader context. Datasets from marine records were excluded due to their overrepresentation of Pinus pollen grains (Heusser and Balsam, 1977). For the purpose of this study, raw pollen counts (compared to e.g., pollen percentages) are required (see Sect. 2.3 for details). However, some datasets only provide pollen percentages and the original data could not be obtained. To maximise the amount of records included in the study, percentage data from these sites were recalculated to a baseline counting sum of 300, which is considered the minimum for statistically robust results and thus often used as a target during palynological analysis (Weng et al., 2006).
Data preparation included the removal of empty and duplicate entries and excluding samples outside of the desired age interval to speed up the REVEALS calculation. Subsequently, all data were aggregated into 1000-year time bins following Githumbi et al. (2022) and Trondman et al. (2016). Since not all pollen records cover the entire target interval, the availability of suitable datasets for each time bin varies with time (see Fig. B1). Data aggregation reduced the input dataset from 5231 to 1632 samples. Afterwards, the harmonisation of nomenclature and pollen morphological types for all datasets was required (Birks et al., 2023). Taxa harmonisation was performed in R using and adapting the taxon harmonisation table supplied by Githumbi et al. (2022).
2.2 REVEALS
The REVEALS model is based on the r-value model (Davis, 1963) and subsequent iterations (Andersen, 1970; Parsons and Prentice, 1981) and its development is described in detail in earlier studies (e.g., Sugita, 2007). In essence, REVEALS reconstructs land-cover estimates for all taxa, factoring in pollen counts, basin parameters, such as basin type (i.e., lake or bog) and basin radius (assuming a circular basin), and plant physiological parameters (pollen productivity and pollen fall speed). Early versions of REVEALS were limited to large lakes (>50 ha) based on the premise that sediments from large lakes accurately represent regional vegetation assemblages (Sugita, 2007). Subsequent development stages of REVEALS then successfully demonstrated that REVEALS estimates from small lakes (<50 ha) and bogs (both small and large) are comparable to those of a large lake in the same region (Trondman et al., 2016). The substantially higher standard deviation for these data can be offset by including multiple small sites, which is consequently highly encouraged (Trondman et al., 2016).
2.3 REVEALS input parameters
The REVEALS model estimates land-cover percentages using raw pollen counts from palaeoclimate archives, supplied on either a depth or an age scale. In addition to pollen data, the REVEALS model requires additional taxa-specific parameters, such as the relative pollen productivity (RPP) estimates and the respective standard deviation as well as the fall speed of pollen (FSP). RPP and FSP values have been previously compiled on continental to global scales (Githumbi et al., 2022; Serge et al., 2023; Wieczorek and Herzschuh, 2020). Moreover, REVEALS land-cover estimates using variable RPP values have been previously validated and optimised through comparison with satellite-based land-cover reconstructions (Hansen et al., 2013; Schild et al., 2025). Here, we use combined RPP and FSP values from Githumbi et al. (2022) and Serge et al. (2023) that are optimised for Europe, but briefly also discuss differences in land-cover estimates by using others sets of RPP and FSP (Table 1). For maximum comparability, we use the same taxa across for all model runs and fill missing values as needed from Githumbi et al. (2022) and Serge et al. (2023).
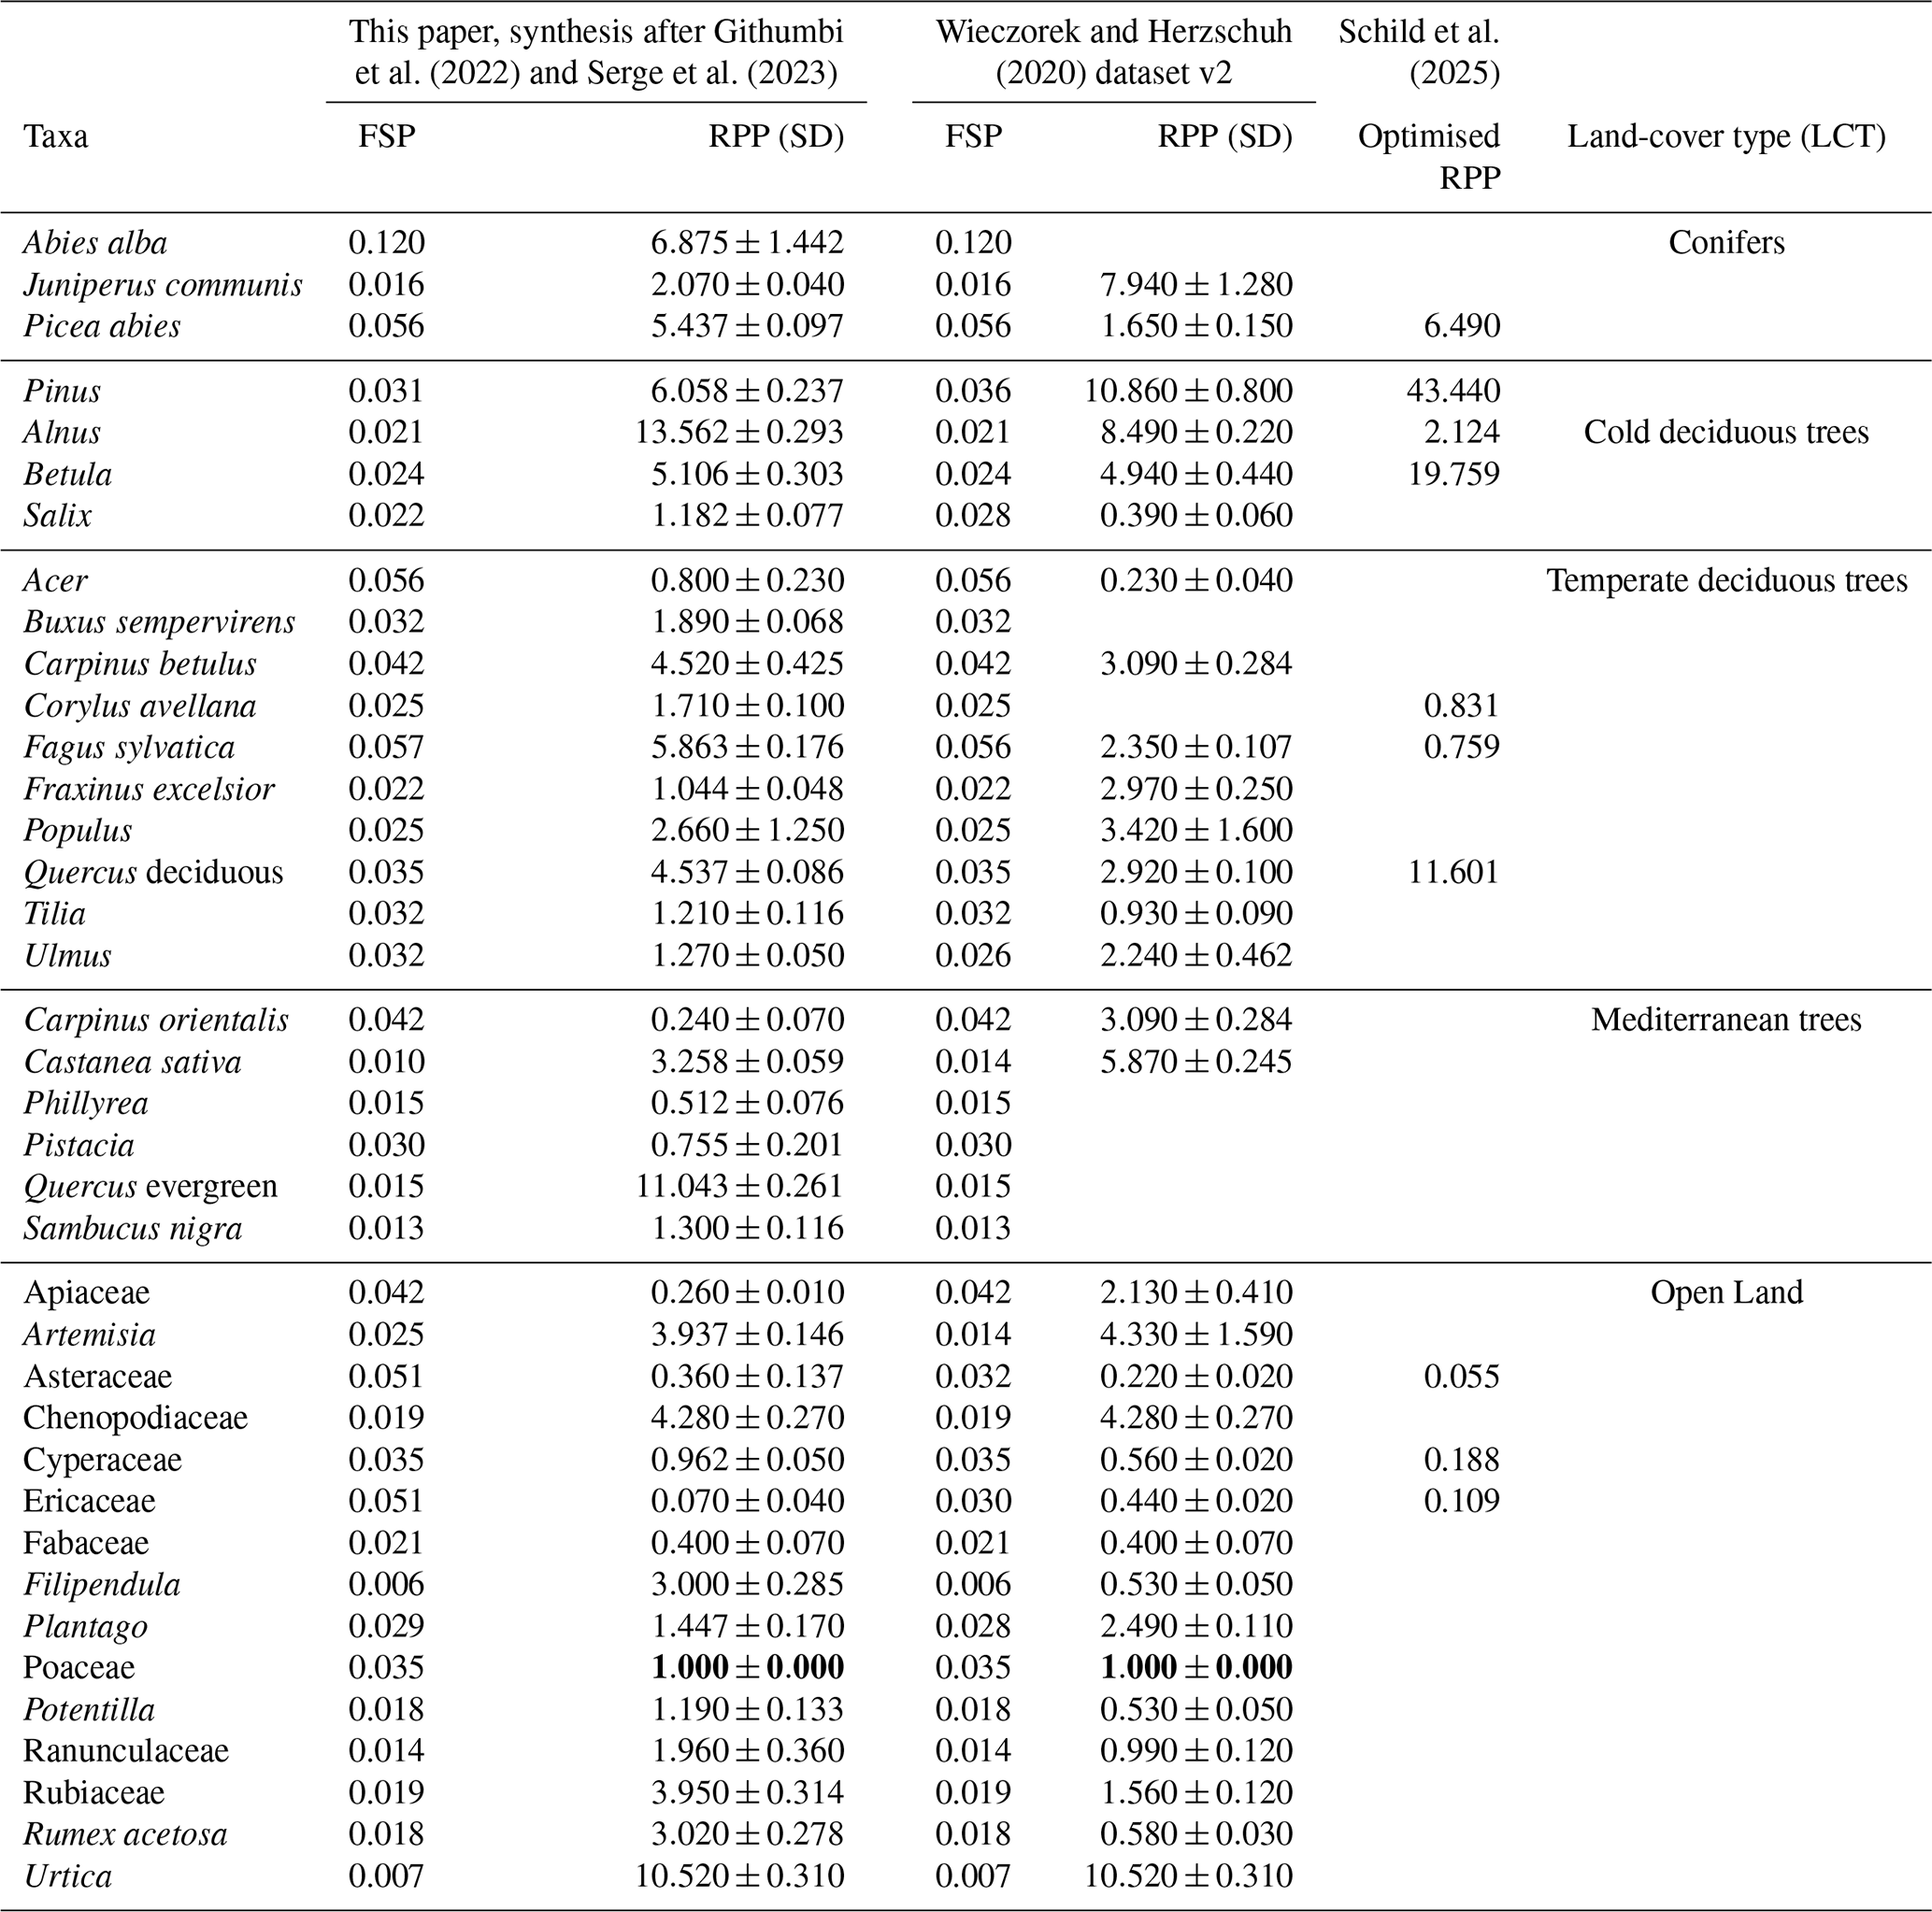
Table 1Fall speed (FSP), relative pollen productivity (RPP) including standard deviation (SD) and associated land-cover type (LCT) for all taxa included in this study. We list three sets of RPP values: a synthesis of RPP values for Europe, modified from Githumbi et al. (2022) and Serge et al. (2023); a global compilation (listed are values for Europe, or, if not available, the Northern Hemisphere; Wieczorek and Herzschuh, 2020, dataset v2), and optimised RPP values using a satellite-based validation and optimization routine (Schild et al., 2025). All values for RPP and SD (RPP) are relative to Poaceae (bold).
The REVEALS model has previously been used to estimate anthropogenic land-cover change during the Holocene and includes taxa of significance for this specific research question, such as Cerealia (cereals) and Secale (rye), which are indicators of agricultural practices. Since agriculture only emerged during the early to mid-Holocene in Europe (Price, 2000; Zeder, 2011), we grouped these taxa together with other Poaceae (grasses) in our analysis. Plantago lanceolata (plantain), while also a common indicator for agricultural practices, is grouped together with other taxa from the genus Plantago, as pollen from this family naturally occur in pollen records from Europe throughout the Last Glacial period. The respective RPP value is calculated as the mean of the available values for different Plantago species (Githumbi et al., 2022).
Pollen data from different archives are typically heterogeneous in terms of nomenclature and the level at which taxa are identified. Tree taxa are most commonly identified on the genus (e.g., Picea) or species level (e.g., Picea abies). However, herbs and grasses are typically identified on the family level (e.g., Ericaceae and Poaceae), owing to the sheer diversity of these groups (the Poaceae family contains more than 10 000 species in over 700 genera), rendering the exact identification using microscopic analysis almost impossible. To include as many data as possible, it was necessary to harmonise the pollen data. Given the limited number of datasets to begin with, we resorted to simplifying all datasets to the most common denominator (family level) rather than excluding datasets to overcome the heterogeneity in pollen data. For some taxa, RPP values for boreal/temperate and Mediterranean specimens exist (Githumbi et al., 2022). Since we focus on the Last Glacial, i.e., a period when mostly cold and dry climates prevailed in Europe, we chose the boreal/temperate values, as we expect Mediterranean taxa to play a subordinate role under glacial conditions compared to their boreal/temperate counterparts. As a result, our final RPP and FSP table consists of entries for 38 taxa (Table 1).
Additional parameters used by REVEALS are basin radius (in m), basin type (i.e., lake or bog), and the geographical location of the archive (in latitudinal and longitudinal coordinates). This information was either taken directly from the respective publications, included in database metadata, or roughly estimated using satellite imagery. During the Last Glacial, peat bogs were much less common than during the Holocene and many lakes transformed into bogs as the climatic conditions became warmer and wetter (e.g., Füramoos, Germany). Hence, we set the basin type to “lake” for all sites with no information, unless the respective publications indicated that a bog was present throughout most of the history of the archive (e.g., Tenaghi Philippon, Greece).
REVEALS also requires two independent parameters: wind speed and the maximum extent of the regional vegetation (Zmax). Following a previous evaluation of REVEALS estimates combined with empirical data, wind speed and Zmax were set to 3 m s−1 and 100 km, respectively (Trondman et al., 2015).
2.4 Implementation of REVEALS
The REVEALS model was implemented using the R package LRA (Abraham et al., 2014). The REVEALS function within LRA distinguishes between data from lakes and bogs and accounts for the taxon-specific FSP and RPP (including standard deviation). LRA offers two different dispersal models: a Gaussian plume model (used in this study; Sutton, 1953) and a Lagrangian stochastic model (Theuerkauf et al., 2016).
Previous studies have mostly implemented a grid-based approach to combine records across 1°×1° grid cells in Europe for a combined mean cover estimate and standard error for all taxa. Owing to the scarcity of datasets available in Europe during the pre-Holocene, such an approach is not feasible, as the typical distance between two pollen archives exceeds 1° in either direction. Hence, we chose not to apply this technique to our dataset and provide site-specific estimates, rather than regional (grid-cell wide) estimates. To provide maximum clarity, we specify which sites are considered “small” (i.e., <50 ha) and advocate for a careful interpretation of REVEALS estimates from these sites.
The REVEALS output generates land-cover estimates (including standard errors) for all taxa from all samples provided. For the purpose of this study, we provide REVEALS estimates from all sites in 1000-year increments, with a ±500-year data aggregation window to account for age-depth model uncertainties. As a result, some sites may not be present during all time slices, depending on their temporal resolution and/or potential gaps in the respective datasets (see Figs. 3–5).
2.5 Land cover types
In the biomisation approach (e.g., Prentice et al., 1996; Binney et al., 2017; Bigelow et al., 2003) each taxon is assigned a plant functional type (PFTs), based on their ecological and climatic preferences. Subsequently, groups of PFTs form different biomes, such as desert, steppe, various types of tundra and forests. To simplify interpretation, PFTs can also be grouped into “Super-PFTs” (Binney et al., 2017) as an alternative to biomes. The REVEALS model only includes a limited number of taxa due to the limited availability of reliable RPP estimates. Therefore, we adapted a simplified approach introduced by Githumbi et al. (2022) and group taxa into five land-cover types (LCTs): Open land (which includes all types of grasses and herbaceous taxa), conifers, cold deciduous trees, temperate deciduous trees, and Mediterranean trees. Additionally, we provide estimates for total trees, calculated as 100 % – Open land. See Table C1 for a detailed list of all taxa included in each LCT. The choice of LCTs is based on the vegetational composition during the glacial conditions of the Late Pleistocene and aims to simplify and illustrate broader changes in the vegetation rather than highlight a single taxon.
2.6 Mapping
The results of the REVEALS land-cover reconstructions are presented as maps in time slices of 1000-year steps for all taxa and all LCTs. Figures 3–5 illustrate exemplary maps during full glacial (LGM, 23 ka BP), interstadial (GI-14, 52 ka BP), and stadial (GS-9, 39 ka BP) conditions for the open land LCT. We selected these time slices for their significance in palaeoclimate research. All maps share common features to facilitate their interpretation: Land-cover percentages (REVEALS-based) and pollen percentages are displayed on a gradual colour scale with varying limits to accommodate the vastly different percentages between LCTs and taxa; the differences between REVEALS estimates and pollen counts are also given in percentages on a diverging colour scale (strong colours denote a strong difference, faded colours denote a small difference, white signals that both values are roughly equal); only sites with data for a given time interval (selected time ± 500 years) are displayed; icon size denotes whether a site is classified as small (<50 ha) or large (>50 ha). Sites marked in red denote unreliable data (see Sect. 4.1 for more details).
2.7 R-based application PALVEG
To facilitate the access to our REVEALS land-cover reconstructions of Europe during the Late Pleistocene, we provide an easy-to-use interactive map-generating application: PALVEG, available at https://oakern.shinyapps.io/PALVEG/ (last access: 22 October 2025). PALVEG is a browser-based application using the shiny R package (Chang et al., 2023) and thus does not require any prior coding experience. PALVEG offers easy access to all REVEALS land-cover reconstructions included in this study in the form of dynamically generated maps based on the inputs chosen. PALVEG will be continuously updated with new REVEALS land-cover estimates as more pollen datasets and REVEALS parameters (e.g., RPP and FSP for additional taxa) become available.
PALVEG allows users to define a time slice between 75 and 15 ka BP, in intervals of 1000 years, and chose a taxon or LCT they are interested in. PALVEG will then visualise the associated REVEALS land-cover percentages of all available datasets for the defined time on a map of Europe (10° E–60° W; 30–70° N). PALVEG can also display the pollen data as raw count-based percentages for the same interval. To highlight the differences between both methods, users also have the option to display the deviation of the REVEALS model from raw pollen counts: Blue (positive) values indicate that the REVEALS model attributes a higher land-cover estimate than the count-based estimate. Accordingly, red (negative) values suggest that the REVEALS model assumes a lower land-cover percentage compared to the pollen data. Lastly, PALVEG offers to display both REVEALS land-cover estimates and pollen data aggregated into 1000-year time bins (default) as well as data based on the sample closest to the chosen time slice (within ±500 years).
We acknowledge the need for intercomparability between different REVEALS land-cover estimate maps, which necessitates a uniform colour scale (i.e., ranging from 0 %–100 %). Yet, land-cover percentages for many taxa are well below e.g., 10 % across Europe and individual differences are masked by a uniform scale. For maximum clarity, PALVEG therefore offers two modes to display REVEALS land-cover estimates: A fixed scale (0 %–100 %) and a dynamic scale that changes depending on the maximum land-cover percentages for a given taxon or LCT. This allows for maximum comparability between individual outputs, while also offering a more detailed and readable display option.
In the following, we discuss the spatio-temporal evolution of land-cover occupied by trees in Europe during the Last Glacial using the RPP synthesis described in Sect. 2.3 (Table 1). For simplicity, we refer to total tree populations, which are predominantly characterised by conifers, while other LCTs play a minor role. In general, we observe a sharp, Europe-wide decrease in land-cover of trees starting with the end of MIS 5 (ca. 70 ka BP; Fig. 2a). During the subsequent MIS 4 (70–60 ka BP), a minimum in tree cover is observed in all regions with the exception of NE Europe, where the land-cover of total trees remains at a moderate level between 30 %–40 %, indicating an open woodland vegetation. During early MIS 3 (ca. 60–50 ka BP), tree populations recover, particularly in NW and SE Europe, in response to the climatic amelioration during prolonged Greenland Interstadials (e.g., GI-16, GI-14, and GI-12). In contrast, tree populations decline in NE Europe or are unaffected (SE Europe) in response to the climatic change. The opposite pattern emerges during the later part of MIS 3 (ca. 40–30 ka BP), when a recovery of tree populations can be observed in NE Europe accompanied by a synchronous, but transient, increase of tree populations in SW Europe. MIS 2 (28–15 ka BP) is generally defined by a subdued variability compared to MIS 3. Land-cover percentages of tree populations in NW and SE Europe are close to their respective minimum for the region, whereas NE and SW Europe signal slightly elevated levels of tree cover.
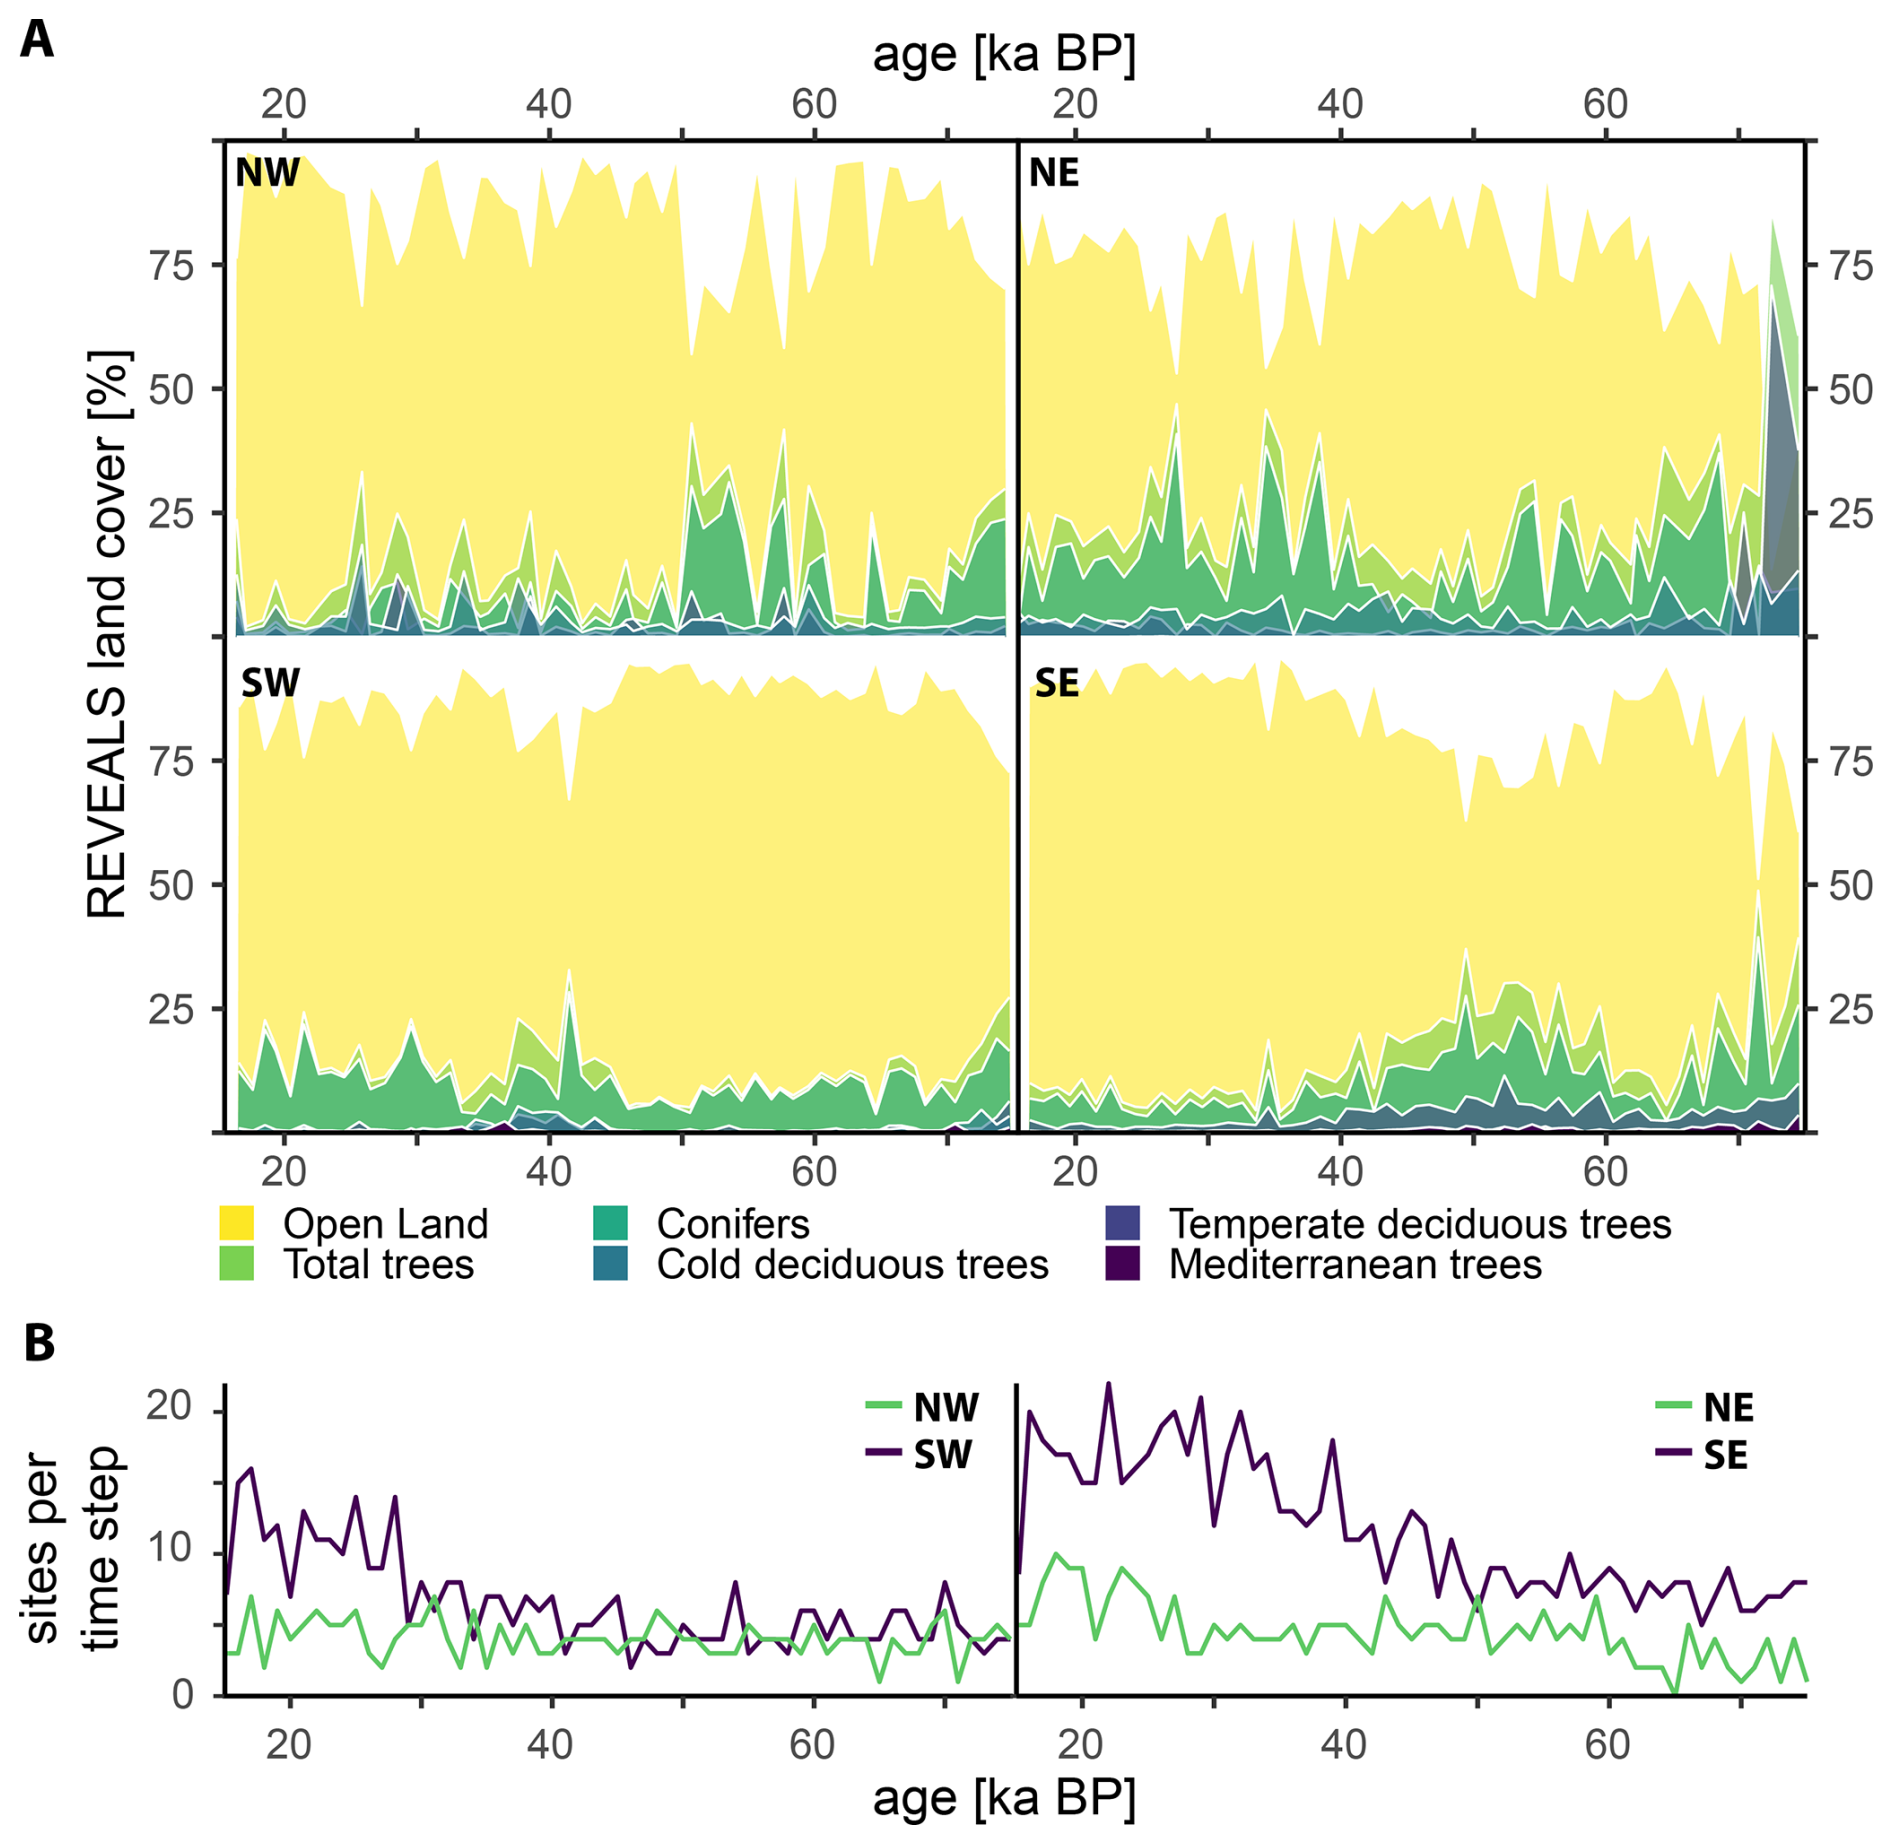
Figure 2(a) Evolution of the mean REVEALS land-cover percentages for all LCTs through time (75–15 ka BP). The data have been categorised in four quadrants split by latitude (>46 and <46° N, ca. North and South of the Alps, respectively) and longitude (>10.5 and <10.5°E, roughly separating the Western Mediterranean from the Central and Eastern Mediterranean). (b) Site availability by quadrant for each time step.
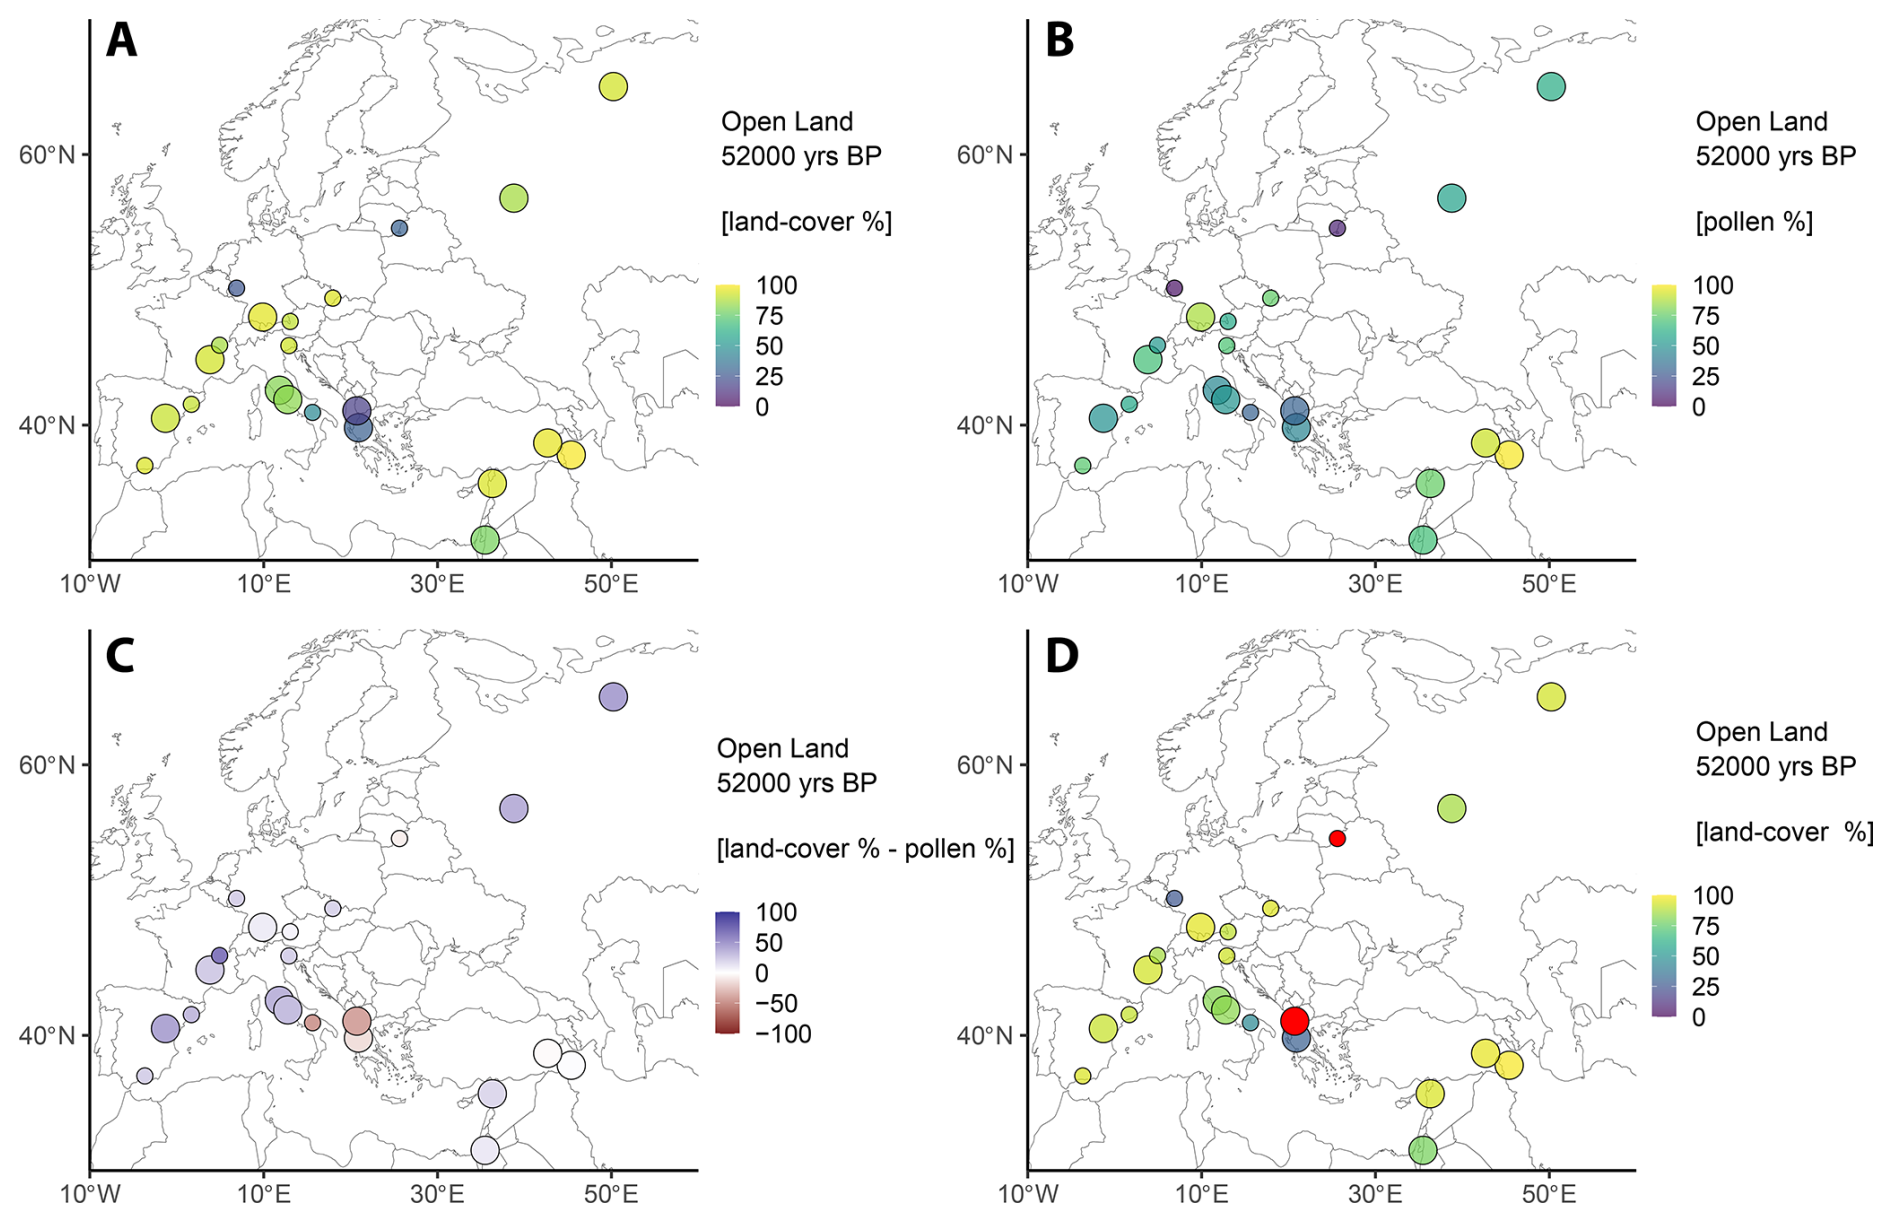
Figure 3Results for the LCT “Open land” during GI-14 (52 ka BP). (a) REVEALS land-cover percentages. (b) Combined open land pollen percentages (see Table 1). (c) Difference between REVEALS land-cover percentages and the combined pollen data. Colours indicate a higher (blue) or lower (red) land-cover representation compared to pollen data. (d) Same as (a), but data considered unreliable are highlighted in red (see Sect. 4.1 for details).
Overall, the regional vegetation across Europe is characterised by a division into two major regimes: in NW and SE Europe, the vegetation pattern follows that of other proxy data such as NGRIP δ18O (Fig. 1; Rasmussen et al., 2014): Periods of warmer and more humid conditions coincide with elevated levels of land-cover occupied by trees and vice versa. This pattern is related to large-scale shifts in atmospheric circulation patterns and thus moisture availability (Florineth and Schlüchter, 2000; Ludwig et al., 2016). Similar observations in speleothems and loess records have been ascribed to shifts in the North Atlantic Oscillation and associated storm tracks responsible for moisture distribution (Luetscher et al., 2015) and dust transport (Schaffernicht et al., 2020) across Europe.
For NE Europe, the opposite pattern emerges. It appears that during the coldest and driest intervals (MIS 4 and MIS 2) of the Last Glacial, tree populations remain at a moderate level and instead decline during the warmer and more humid period of MIS 3. However, we ascribe this pattern to data scarcity rather than climatic variability. Particularly in NE Europe, very few datasets are available (Fig. 2b) and they span a large latitudinal range (from 46 to 67° N). During mid-MIS 3, only limited data are available and thus the mean forest cover is strongly influenced by records from the high latitudes (e.g., Lake Yamozero, site 2, Fig. 1) or in close vicinity to ice sheets (e.g., Nesseltalgraben, site 21, Fig. 1), which tend to signal a very open landscape. During subsequent intervals (i.e., late MIS 3), more records from, e.g., the Carpathian Mountains, are included and thus shift the mean towards higher forest covers. Note that despite the overall site availability in NW Europe being similar or even lower compared to NE Europe (Fig. 2b), these sites span a much smaller geographical area and climatic range. As a consequence, the presence or absence of individual sites has a reduced impact on the regional means.
In the following, we focus on three critical intervals of the Last Glacial, using the LCT “open land” as proxy for vegetation openness: Stadial-interstadial variability, represented by GS-9 (39 ka BP) and GI-14 (52 ka BP), respectively, and the Last Glacial Maximum (LGM, 23 ka BP). To facilitate the comparison, we treat these climatic events as singular time slices centred around their respective mid-points (given in parentheses). Then, we compare the output of the REVEALS model with pollen percentages and highlight some of the major differences in the perception of palaeoenvironments. Lastly, we discuss the reliability of REVEALS estimates in the context of the REVEALS model design and its fundamental ideas.
3.1 Stadial-interstadial variability
For the comparison of interstadial to stadial land cover, we chose the longest interstadial (GI-14) and stadial (GS-9) to fully capture the differences in land-cover composition. Both climatic events are well-documented in numerous records and chronologically well-constrained. Also, shifts between stadial and interstadial conditions and their associated ecological gradients may have had considerable impact on the large-scale distribution of regional populations of hunter-gatherers during the Upper Palaeolithic (Maier et al., 2024).
In contrast to the interstadial conditions of GI-14, average open land percentages increased to 80 % during Greenland Stadial 9 (GS-9, 39 ka BP) and are highest along the northern fringes of the Alpine glaciers (Fig. 4). This increase is primarily due to a rise of Poaceae to 32 %, while Cyperaceae (15 %) and Asteraceae (16 %) remained on similar levels as compared to GI-14. Interestingly, Poaceae percentages not only increased during GS-9, but the geographical distribution of Poaceae spread to most regions of Europe. Notable exceptions are in the Iberian Peninsula, the Alpine Foreland, and the Carpathian Mountains, where a strong local signal of Cyperaceae indicated the presence of wetlands. Asteraceae and Apiaceae are primarily found in the Central Mediterranean and South-West Asia, locally reaching more than >40 % of combined land cover.
Figure 4Results for the LCT “Open land” during GS-9 (39 ka BP). (a) REVEALS land-cover percentages. (b) Combined open land pollen percentages (see Table 1). (c) Difference between REVEALS land-cover percentages and the combined pollen data. Colours indicate a higher (blue) or lower (red) land-cover representation compared to pollen data. (d) Same as (a), but data considered unreliable are highlighted in red (see Sect. 4.1 for details).
Overall, tree populations in Europe collapsed during GS-9. While the western Balkans and Eifel region show a declining presence of tress, locally constrained areas in the Carpathian Mountains (87 % trees) and the Baltics (up to 49 % trees) appear to have served as refugia for Picea abies, Betula, and Pinus during glacial periods (Fig. 4). However, caution is advised for the Carpathian data (Fig. 4d). Small, isolated communities of temperate deciduous trees are present in Northern Africa (13 %), the South-West Asia (13 %) and the Eastern Mediterranean (6 %) and comprise the remainder of land covered by trees during GS-9.
Across all sites, the REVEALS-derived mean land-cover estimate of “open land” during Greenland Interstadial 14 (GI-14, 52 ka BP) was 74 % (Fig. 3). The primary constituents of open land vegetation during GI-14 show distinct geographical patterns: Poaceae (26 %) and Cyperaceae (17 %) are the dominant taxa in Central Europe and the western Mediterranean, whereas Asteraceae (15 %) is found in South-West Asia and the Mediterranean coastal regions. Among other taxa, isolated populations of Apiaceae and Chenopodiaceae are present in South-West Asia and Ranunculaceae reach >10 % in Central European wetlands environments. Other herbs only play subordinate roles.
Although an open steppe-tundra vegetation dominated the European landscapes during GI-14, two distinct forested areas can be identified: The western Balkans and to a lesser extent the Eifel and eastern Baltic regions (Fig. 3a), where conifers constitute the majority of the vegetation. However, caution is advised regarding the reliability of some of these data (Fig. 3d). In contrast, the Italian Peninsula shows a mixed temperate woodland, consisting of deciduous Quercus, Fagus sylvatica, Acer, and Abies alba at the time. North of the Alps, forests composed of boreal tree taxa such as Pinus and Betula constitute a substantial portion of trees while other tree taxa are virtually absent.
Stadial-interstadial variability is primarily characterised by an increase in open-land percentages during stadials and a decrease in open-land percentages during interstadials, but probably also by a more pronounced differentiation of the onset of the vegetation period in the southern parts of Europe during stadials (Maier et al., 2024). Such increases in open-land percentages have led to a southward displacement of the tree line in western Central Europe, while limited tree population in eastern Central Europe persist. During interstadials, decreases in open-land percentages are accompanied with a northward expansion of the tree line. These observations are in line with the interpretation of proxy records across Europe (Fletcher et al., 2010; Landais et al., 2022, Tzedakis et al., 2013). However, the scarcity of available pollen records for GI-9 from Northern and North-eastern Europe substantially hinders our ability to further inquire. Additional pollen records are required to investigate the spatio-temporal framework of tree-line recession in a north-easterly direction during interstadials in more detail.
The arrival and spread of Palaeolithic hunter-gatherers between 43 to 40 ka BP in Europe (Shao et al., 2024) occurred during a phase of pronounced interstadials (ca. GI-12 to GI-9) and therefore relatively mild and humid climate conditions (Rasmussen et al., 2014). This climate state is also reflected in increased tree cover percentages, particularly in Eastern Europe (i.e., the Balkans and along the Danube), where climatically suitable east-west corridors may have temporarily opened up for human dispersal across Europe (Shao et al. 2024). Here, light woodland or a mosaic of open and forested vegetation was prevalent particularly in SE Europe (Fig. 2a). Such ecotones provide ideal conditions for a high faunal biodiversity and are thus attractive habitats for hunter-gatherers. During stadials, the tree line shifted southwards and the landscape in the higher latitudes opened up. At the same time, phenological gradients related to the greening of the landscape in spring became more pronounced in the southern parts of Europe. The gradual cooling of interstadials likely led to a shift in largescale phenological patterns, presumably affecting the spatial distribution of populations and providing incentives to move, for instance, into the more southern areas of the Iberian Peninsula (Maier et al., 2024), or foster retreat to local niches (Timmermann, 2020). Combined with decreasing temperatures and moisture availability, much of Central and Eastern Europe might have become unfavourable for hunter-gatherers during pronounced stadials, such as Heinrich Event 4, and populations may have decreased (Shao et al. 2024). There are hints that Neanderthals had smaller mobility ranges than anatomically modern humans and occupied more fragmented habitats (Timmermann, 2020). Together, this may have fostered sensitivity to climate change during MIS 3 and its implications for ecosystems (Yaworsky et al., 2024), contributing in the long run to their disappearance.
3.2 Last glacial maximum
REVEALS land-cover estimates for the LGM are characterised by uniformly high percentages of open land vegetation (88 %) across most of Europe. The decrease in forested area by 40 % from GS-9 (or 48 % from GI-14) demonstrates the substantial impact of the increasingly cool and dry climates on the European vegetation going from MIS 3 to MIS 2. Similar to the previous intervals, the main constituents are Poaceae (31 %), Cyperaceae (18 %), and Asteraceae (23 %), although their geographic distribution varies substantially. Poaceae is mainly found in southern Central Europe and the Western Mediterranean region, while Cyperaceae is primarily found at higher latitudes (>46° N) and Asteraceae at lower latitudes (<46° N). Similar to previously discussed intervals, Apiaceae is most prominent in South-West Asia (>30 %). Substantial amounts of Artemisia (up to 37 %) and Chenopodiaceae (up to 10 %) are scattered across Europe.
Although tree populations are close to their minimum extent during the LGM (Fig. 5a), two locally constrained glacial refugia exist, where trees constitute more than 30 % land cover: In the Carpathian Mountains, Picea abies and Pinus demarcate an open coniferous woodland vegetation. Similarly, strands of boreal forests composed of Picea abies, Pinus, and Betula prevail in the Balkans. This presence of substantial tree populations highlights the existence of glacial tree refugia with suitable microclimates during the LGM.
Figure 5Results for the LCT “Open land” during the LGM (23 ka BP). (a) REVEALS land-cover percentages. (b) Combined open land pollen percentages (see Table 1). (c) Difference between REVEALS land-cover percentages and the combined pollen data. Colours indicate a higher (blue) or lower (red) land-cover representation compared to pollen data. (d) Same as (a), but data considered unreliable are highlighted in red (see Sect. 4.1 for details).
Among other sites, the total tree-cover during the LGM is very low and reaches a maximum of 25 %. Nonetheless, geographical patterns are discernible from the REVEALS estimates. Small populations of Pinus are present in a punctuated, SW–NE belt spanning from Iberia to Russia, while being absent in the Central and Western Mediterranean as well as North-western Europe. Cold deciduous trees and temperate deciduous trees are scattered across Europe but only occur locally in low percentages (typically <10 %). Noticeable amounts of Mediterranean tree taxa during the LGM are only attested in Greece (Carpinus orientalis; 1.5 %).
3.3 Comparison of REVEALS estimates and pollen data
The direct comparison between REVEALS land-cover estimates and raw pollen percentages highlights the differences between both approaches (Figs. 3c, 4c, and 5c). Expectedly, an overrepresentation of trees in pollen records (and consequently much lower REVEALS land-cover estimates) can be observed (Fig. 6). Accordingly, grasses and herbs are underrepresented in pollen data and achieve much higher REVEALS land-cover estimates. However, on a taxon level, this overarching pattern may not always apply and individual taxon-specific land-cover percentages ultimately depend on the overall vegetational composition. REVEALS estimates may be lower or higher for certain taxa than the respective pollen percentages (e.g., for Poaceae and Cyperaceae). In most cases, this is associated with the taxon-specific RPP values in relation to the overall RPP values of all other taxa present at the site (Table 1). Notable outlier to this pattern is Abies alba, which despite relatively high RPP values is considered underrepresented by the REVEALS model, owing to the high fall speed (FSP) of Abies alba pollen grains and therefore its limited spatial dispersal capabilities.
Figure 6Comparison of REVEALS land-cover percentages for three critical time intervals, using different datasets of relative pollen productivity (RPP) as discussed in Sect. 2.3 (Table 1). The data are compared to the fossil pollen percentages.
As a result of the disparity between REVEALS data and fossil pollen data, the presence of forests and (open) woodlands may be exaggerated when interpreting fossil pollen data. However, the extent of e.g., the over-representation of tree taxa is highly variable through time and land-cover estimates require careful analysis in order to fully utilise their potential. Overall, these observations are in line with the general conception among palynologists and palaeobotanists that fossil pollen data do not reflect the palaeovegetation one-to-one, which ultimately led to the inception of models such as REVEALS (Andersen, 1970; Prentice, 1985; Sugita, 2007).
3.4 The impact of RPP on REVEALS land-cover estimates
In Sect. 2.3 we have discussed the existence of various compilations and syntheses of RPP and FSP values. While our study used a synthesis of RPP data from Githumbi et al. (2022) and Serge et al. (2023), we want to briefly address the differences in REVEALS land-cover estimates using other sets of RPP values (Table 1). All available datasets are established using high-quality estimates of pollen productivity compiled from research of the last decades and all RPP datasets focus on slightly different aspects in terms of regional (e.g., Mediterranean) to global scale, environmental variability, and methodology. Hence, there is no best dataset for all purposes.
In general, all RPP datasets yield a vegetation composition that indicates an overrepresentation of trees in fossil pollen data and consequently much higher land-cover estimates for “open land” (Fig. 6). However, there are several distinct differences between the RPP datasets. First and foremost, the results for the synthesis used in this study and the compilation by Wieczorek and Herzschuh (2020) are strikingly similar, with the latter dataset generating slightly higher land-cover estimates for the different tree LCTs. In contrast, land-cover estimates using the optimised RPP (Schild et al., 2025) result in very low percentages of tree LCTs. In detail, this primarily affects “conifers”, influenced by the vastly higher RPP of Pinus and to a lesser extent Picea abies, which both affect land-cover estimates negatively. Other tree LCTs are in good agreement with those of other RPP datasets. Differences among herbaceous taxa vary across RPP datasets, but are less significant on regional scales.
The reliability of REVEALS land-cover estimates is derived from the standard errors (SEs) that are provided alongside each REVEALS model run (Serge et al., 2023; Trondman et al., 2015). The relative size of SEs is considered a measure of the quality of the REVEALS output. REVEALS land-cover SEs mainly rely on the quantity and quality of the available pollen datasets. This includes both the number of available datasets as well as their individual counting sums for each sample and the classification into large (>50 ha) and small (<50 ha) lakes and bogs (Githumbi et al., 2022; Sugita, 2007). Additionally, the standard deviation of the REVEALS parameter RPP is factored into the estimation of the REVEALS SEs.
A key aspect of previous land-cover reconstructions using the REVEALS model for the Holocene period is to present the results in 1°×1° grid cells, which aggregate data from all sites within a grid cell, based on the type and size of a basin (e.g., Githumbi et al., 2022; Serge et al., 2023; Trondman et al., 2016). The idea is that the quality of REVEALS estimates for a grid cell increases with the number of large lakes present within each grid cell (Sugita, 2007). Later studies have demonstrated that pollen data from small sites (<50 ha) will also improve REVEALS estimates, although to a lesser extent (Fyfe et al., 2013; Trondman et al., 2016). Hence, the quality of vegetation estimates has been related to the number and basin size of the archives where pollen records originate from. For the Last Glacial period, this approach is not feasible due to the low geographical cover of suitable (i.e., chronologically well-constrained) pollen archives in Europe (Fig. 1). Based on the current data compilation, only three 1°×1° grid cells contain more than one pollen archive from the Last Glacial period. Therefore, we provide point-based land-cover estimates that represent the local to regional vegetation within a maximum radius of 100 km around the site (as defined in the REVEALS parameter Zmax).
4.1 Estimation of uncertainty
To evaluate whether REVEALS estimates are reliable, we follow the protocol of Githumbi et al. (2022): If the standard deviation of the REVEALS estimate is equal to or larger than the REVEALS estimate itself, then the data is considered unreliable. This excludes entries with zero counts (and thus a REVEALS land-cover of 0 %), which are considered reliable by definition. In total, 39 % of all non-zero REVEALS land-cover estimates are considered unreliable (Table D1). However, a substantial amount of unreliable data is related to taxa that only appear in very low counts (e.g., Urtica, Rubiaceae, Potentilla, and Filipendula), which are expected to have a high standard error (Sugita, 2007) and/or have high RPP standard deviations (e.g., Abies alba and Populus for which no data is considered reliable). In contrast, taxa that are commonly found in glacial climates such as Poaceae (2 %), Cyperaceae (8 %) or Pinus (2 %) are on average considered highly reliable. Establishing LCTs further increases the reliability compared to the individual reliability of most their constituents, e.g., only 2 % of open land and 14 % of total trees datapoints considered unreliable.
Due to the fact that many taxa are absent in a lot of the samples, the perceived reliability of REVEALS land-cover estimates is much higher. For example, only 8 % of all Urtica samples are considered unreliable if all samples are considered. However, 95 % of datapoints are classified as unreliable if zero-count samples are excluded. Hence, we advise caution regarding the use and interpretation of data from relatively uncommon taxa. Instead, LCTs represent a broader spectrum of the vegetation and their data are more reliable and thus less prone to misinterpretation.
4.2 Data aggregation
Previous studies have suggested to aggregate samples from intervals with a high temporal density in order to increase the size of pollen counts and thus minimise REVEALS SEs (Githumbi et al., 2022; Trondman et al., 2016). In this study, samples ± 500 years around the studied time interval were aggregated into a single sample, which was then used to estimate REVEALS land-cover percentages. As a result, the input dataset shrunk from 5231 to 1632 samples, corresponding to an average aggregation ratio of 3.21 to 1 across all samples. However, due to the unevenly temporally spaced nature of palynological datasets, the number of aggregated samples per bin may vary substantially. The number of sites that contain data for each time step are given in Fig. B2.
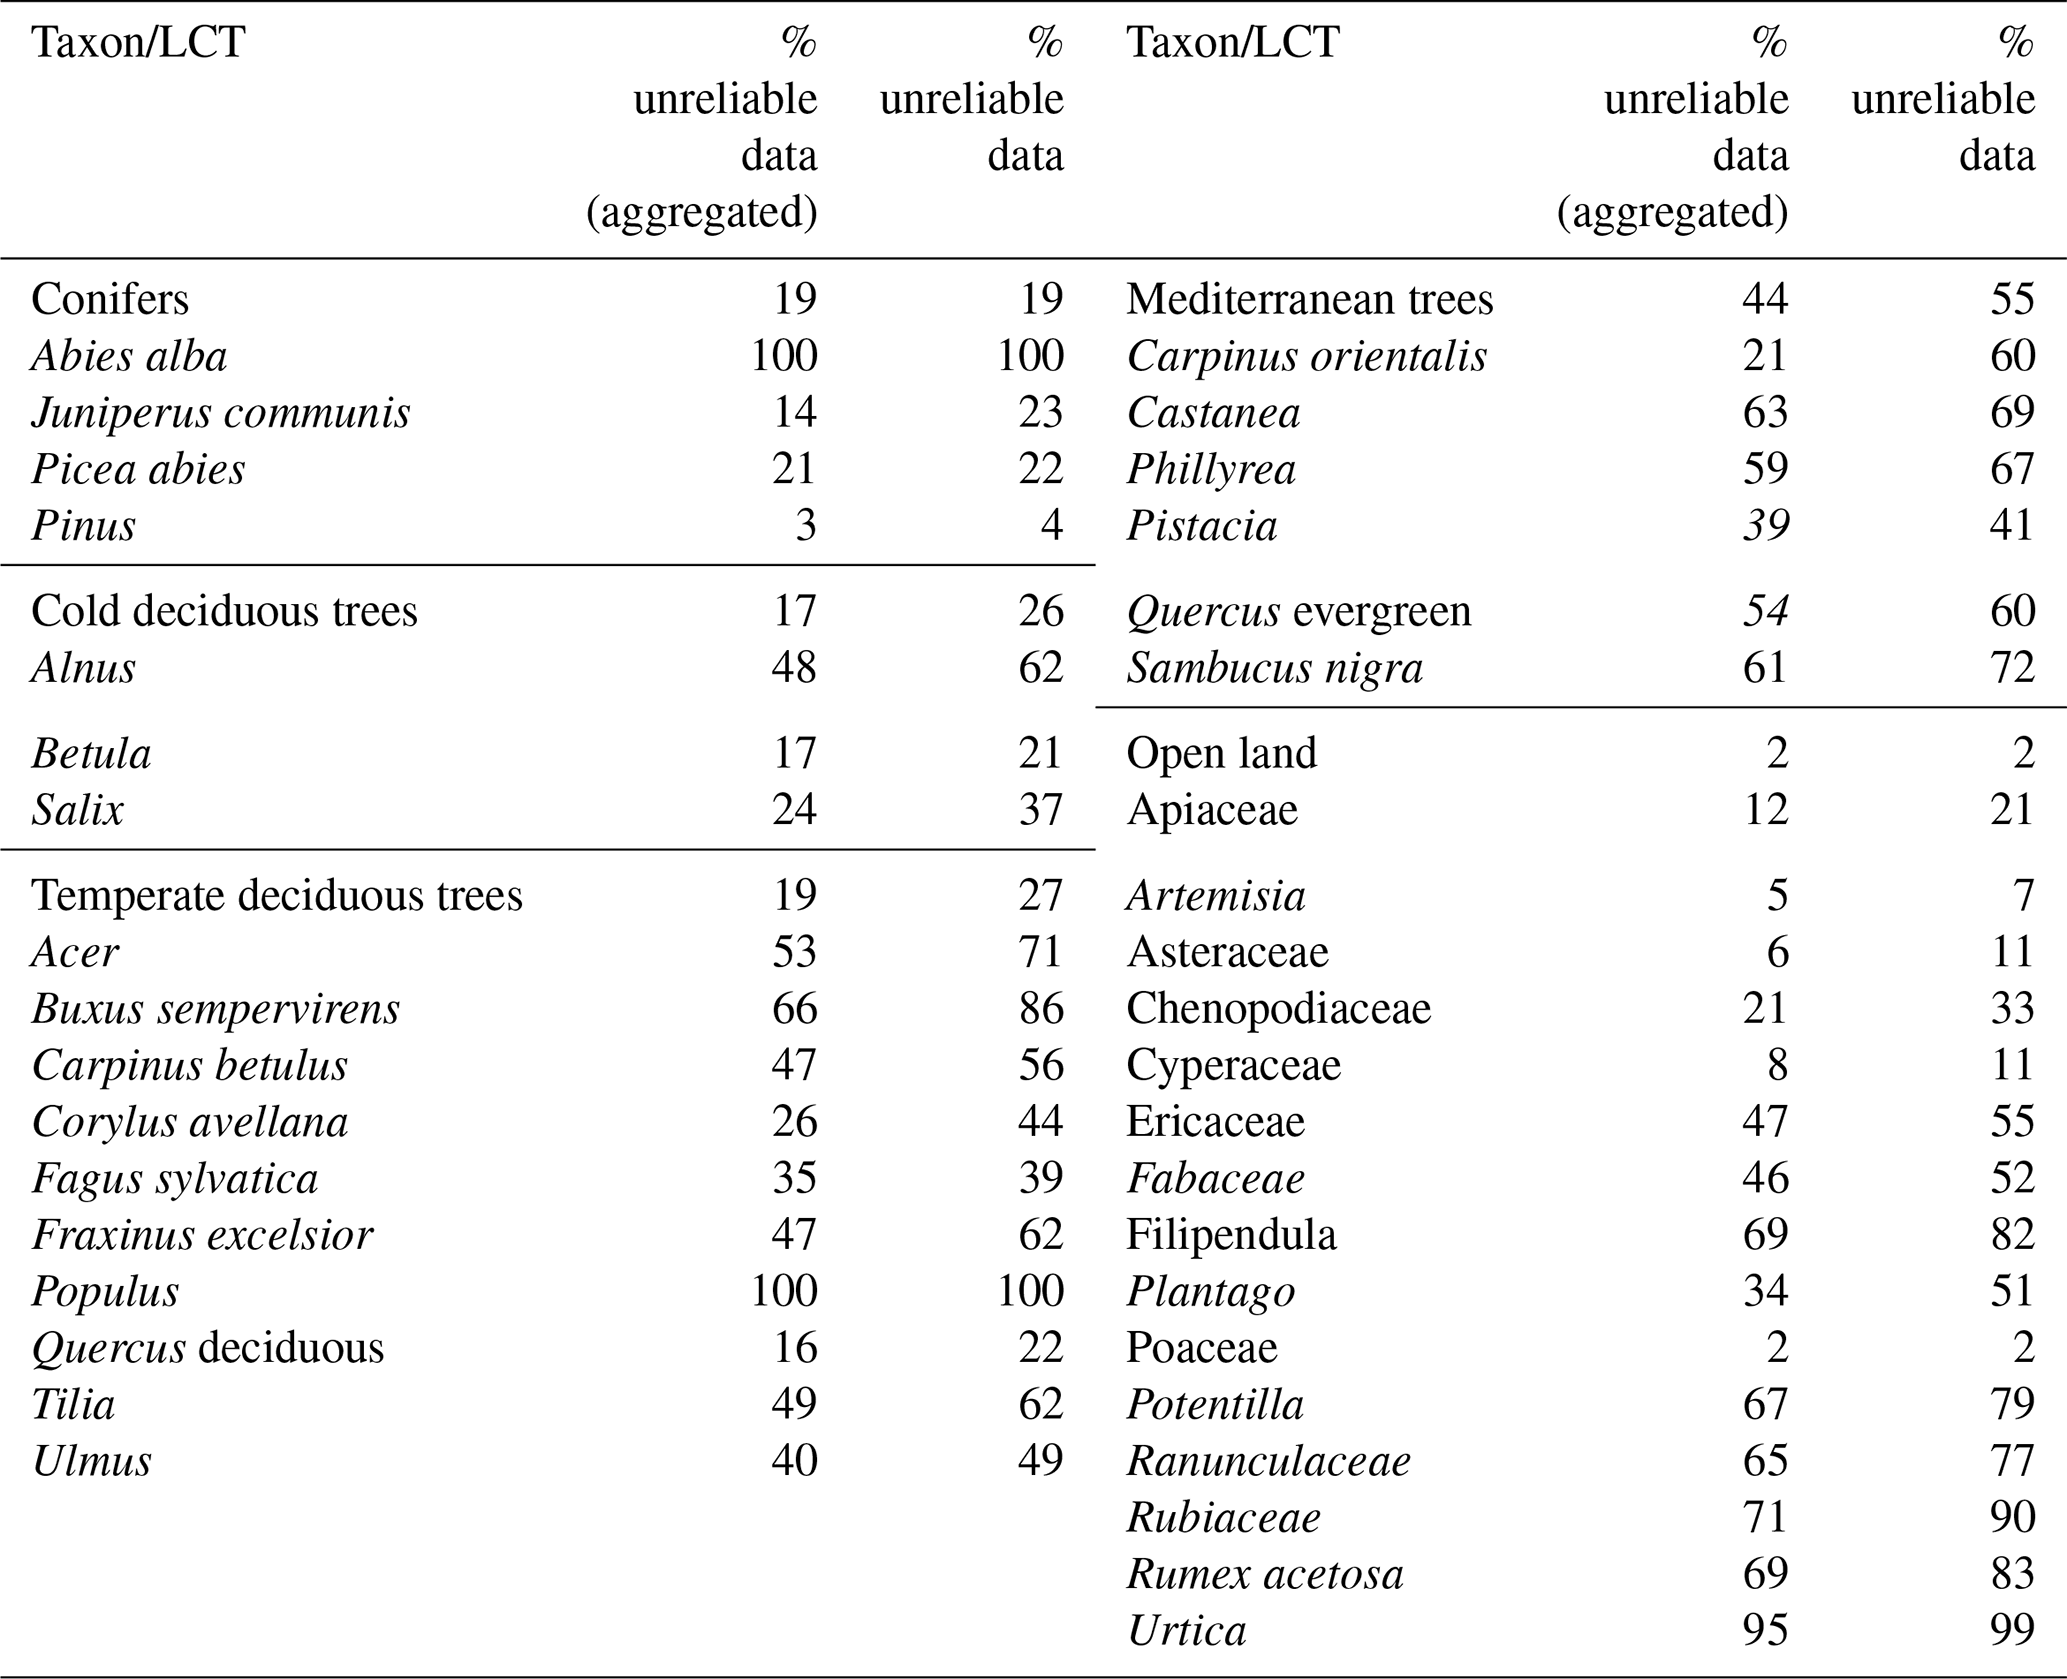
Overall, data aggregation decreased the number of unreliable REVEALS land-cover estimates from 48 % (raw pollen counts) to 40 % (aggregated pollen counts). The percentage of unreliable data was reduced drastically for almost all taxa and LCTSs. The biggest improvements occur for taxa with low to very low counting sums per sample, such as Carpinus orientalis (39 % more reliable), Buxus sempervirens (20 % more reliable), Acer (18 % more reliable). Exceptions are Poaceae (0.3 % less reliable) and Abies alba (no improvement). Among LCTs, the reliability of estimates for cold deciduous trees, temperate deciduous trees, and Mediterranean trees increases (9 %, 8 %, and 11 %, respectively), whereas the reliability of estimates for conifers decreases slightly (0.3 %). In conclusion, data aggregation has substantially improved to REVEALS land-cover estimates among less common taxa and LCTs, whereas estimates for the dominant taxa and LCTs remain virtually unchanged.
The percentages of unreliable REVEALS land-cover estimates for both aggregated and raw data can be found in Table D1. Based on our findings, we suggest to use the REVEALS land-cover estimates from aggregated data due to the predominantly higher data reliability observed. Nonetheless, to provide maximum clarity, we provide REVEALS land-cover estimates for both the aggregated and raw datasets and also include both datasets in the PALVEG application.
The REVEALS function is part of the R package LRA (Abraham et al., 2014), available at https://github.com/petrkunes/LRA (last access: 29 April 2024). The full code used in this study is available on Zenodo (https://doi.org/10.5281/zenodo.12625221, Kern, 2024b). It includes data preparation, taxon harmonization, and data analysis.
The application PALVEG is hosted at https://oakern.shinyapps.io/PALVEG/ (last access: 22 October 2025) and the R code is available on Zenodo (https://doi.org/10.5281/zenodo.12624842, Kern, 2024a).
REVEALS land-cover estimates and REVEALS standard errors generated in this study are available in the PANGAEA database (https://doi.org/10.1594/PANGAEA.973049, Kern et al., 2025). The metadata for pollen datasets are available on Zenodo (https://doi.org/10.5281/zenodo.16812766, Kern, 2025).
Over the recent years, the REVEALS model has been successfully implemented in numerous research projects, such as LandClim (e.g., Githumbi et al., 2022) and PAGES LandCover6k (e.g., Harrison et al., 2020), as well as studies (e.g., Roberts et al., 2018; Kaplan et al., 2017). The results have been utilised in a wide array of research disciplines including but not limited to anthropogenic land-cover change, to evaluate archaeology-based reconstruction of land-use in the past (Morrison et al., 2021), to estimate the impact of mining activities (Schauer et al., 2019), or in the context of biodiversity and regional to local scale vegetation dynamics (Marquer et al., 2017).
For the first time, the REVEALS model has been applied to pollen records from Europe during the latest interval of the Last Glacial period, generating continuous (1000-year intervals) land-cover estimates for 38 taxa and 5 LCTs. The Last Glacial is of particular importance for our understanding of abrupt climate change (i.e., GI/GS variability) and the response of ecosystems (e.g., Fletcher et al., 2010; Landais et al., 2022; Rasmussen et al., 2014). Yet, to this day, vegetation dynamics in Europe during the Last Glacial are far from understood and current hypotheses include rapid re-migration of tree taxa in response to climate amelioration, local refugia providing suitable microclimates that sheltered from the harsh environmental conditions, and complex spatio-temporal combinations of the aforementioned mechanisms (Gavin et al., 2014; Hošek et al., 2024; Tzedakis et al., 2013). Moreover, the Last Glacial saw the disappearance of Neanderthals and the dispersal of Homo sapiens into Europe followed by pronounced demographic fluctuations (Hublin, 2015; Mellars, 2004; Schmidt et al., 2021). It has long been hypothesised to what extent climatic fluctuations have impacted these patterns of population dynamics on both temporal and spatial scales (Maier et al., 2022, 2024; Staubwasser et al., 2018; Timmermann and Friedrich, 2016). Here, corridors for the dispersal of Palaeolithic hunter-gatherers into different parts of Europe may have episodically opened up in relation to the opening of the landscape and shifts in ecological gradients. Furthermore, tree populations have persisted in local refugia in Central and Eastern Europe, where favourable environmental conditions could have provided shelter during subsequent stadial climatic downturns. More sophisticated vegetation reconstructions might shine light on open research questions regarding food and prey availability, hunting and subsistence strategies, and demographic developments (Baker et al., 2024; Ordonez and Riede, 2022; Schmidt and Zimmermann, 2019; Seersholm et al., 2020; Vidal-Cordasco et al., 2023).
With the PALVEG application, we aim to facilitate the access to palaeovegetation reconstructions to a wide scientific audience. PALVEG dynamically generates maps of REVEALS land-cover estimate or pollen data for all sites, taxa, LCTs, and time intervals between 75 and 15 ka BP. PALVEG is browser-based, intuitive, and requires no a priori experience in coding or palaeobotany.
Further improving the REVEALS model highly depends on the availability and quality of plant physiological parameters (RPP and FSP). Researching pollen productivity and dispersal is tedious and relies on numerous field studies and although steady progress has been made over the last couple of years, more RPP and FSP data are required. This is of particular significance for taxa that are presumed to shape the European landscape during glacial times (e.g., differentiating between tree and shrub growth forms for taxa such as Betula and Pinus; Birks, 1968) or those that are well-known for their proportionately high or low pollen productivity (e.g., Salix and Larix; Niemeyer et al., 2015) and are thus misrepresented in pollen records. Hence, the most promising avenue to further improve land-cover estimates is to provide these parameters for more taxa, ideally on the species or genus level, to fully utilise the information that available pollen datasets provide. Specifically for the Late Pleistocene in Europe, more pollen data at a sufficiently high temporal resolution are required to further refine the geographical cover of available data and the inferred palaeoecological reconstructions. Ideally, these new data originate from large lakes (>50 ha) and fill geographical gaps in areas of Europe where the present distance between available archives is particularly large, e.g., Central and Eastern Europe (Fig. 1). A different approach to improve REVEALS-based palaeovegetation models lies optimisation of RPP using remote-sensing techniques, which has already shown promising results and is expect to further improve in the future.
In the face of anthropogenic climate change, generating high-quality palaeovegetation data remains imperative for improving coupled vegetation-climate models. Only then can ESMs provide more accurate predictions of vegetation and ecosystem dynamics in the near future.
Table A1List of all pollen archives, REVEALS land-cover reconstructions and their respective references. “Site ID“ refers to the labels in Fig. 1.
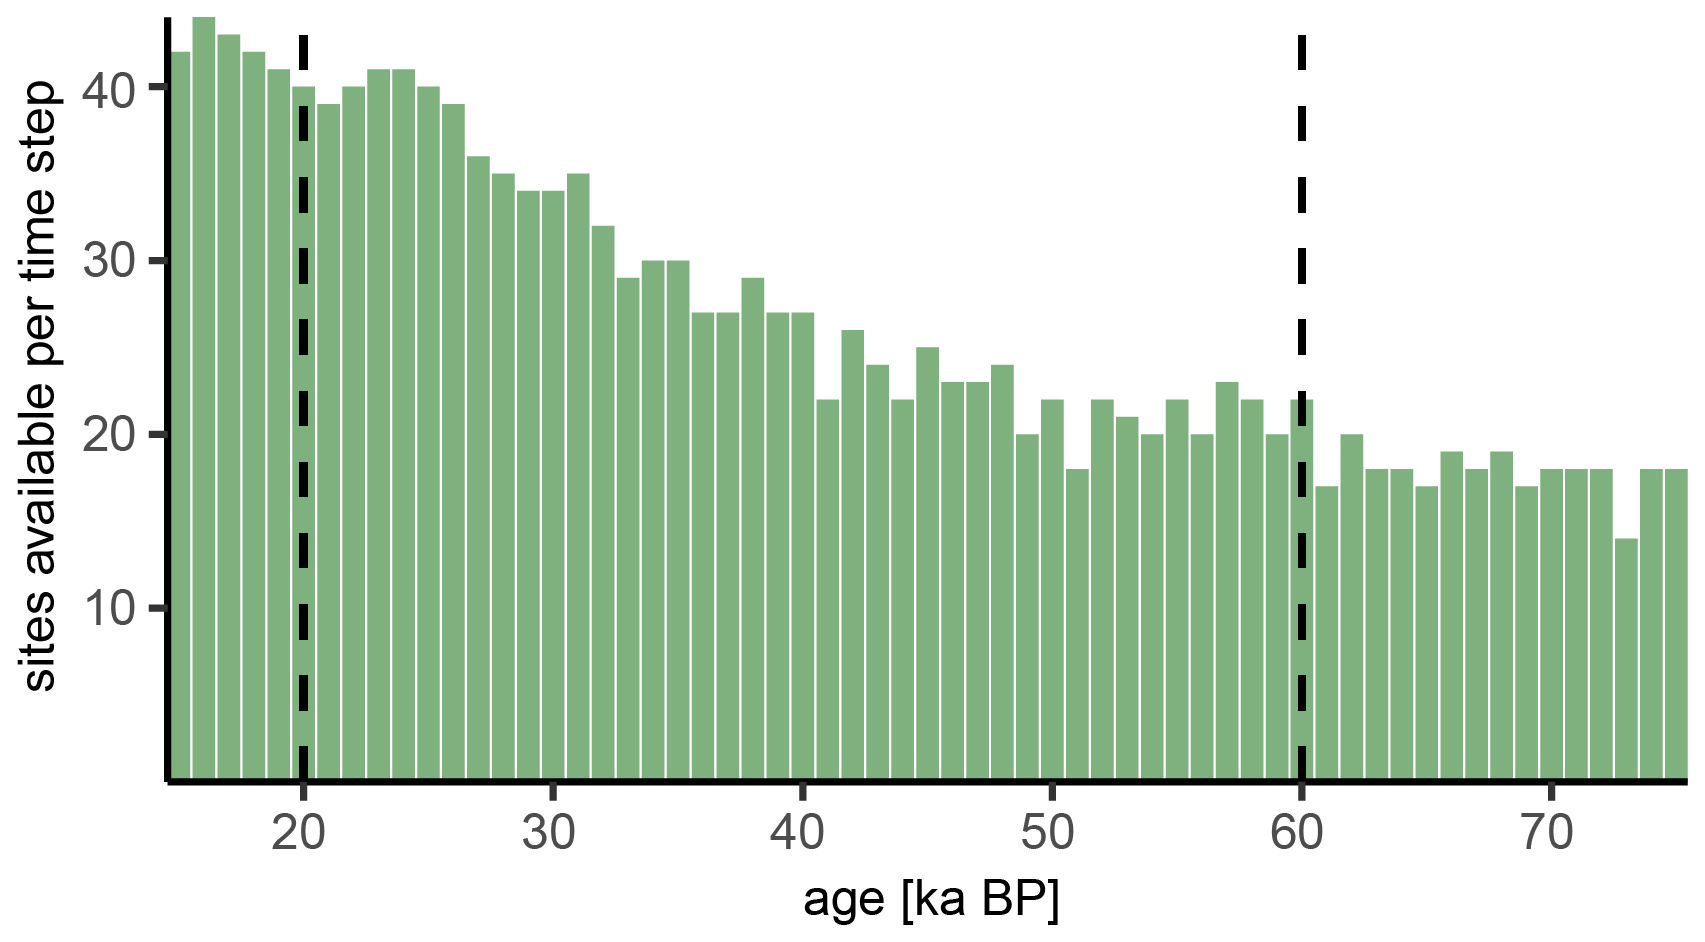
Figure B1Available sites with pollen data for each 1000 year time window. The selection of sites was based on the availability of data between 60 and 20 ka BP (dashed lines).
Table C1Classification of plant taxa, genera, and families into land-cover types (LCTs), adapted from Githumbi et al. (2022) for the Last Glacial period.
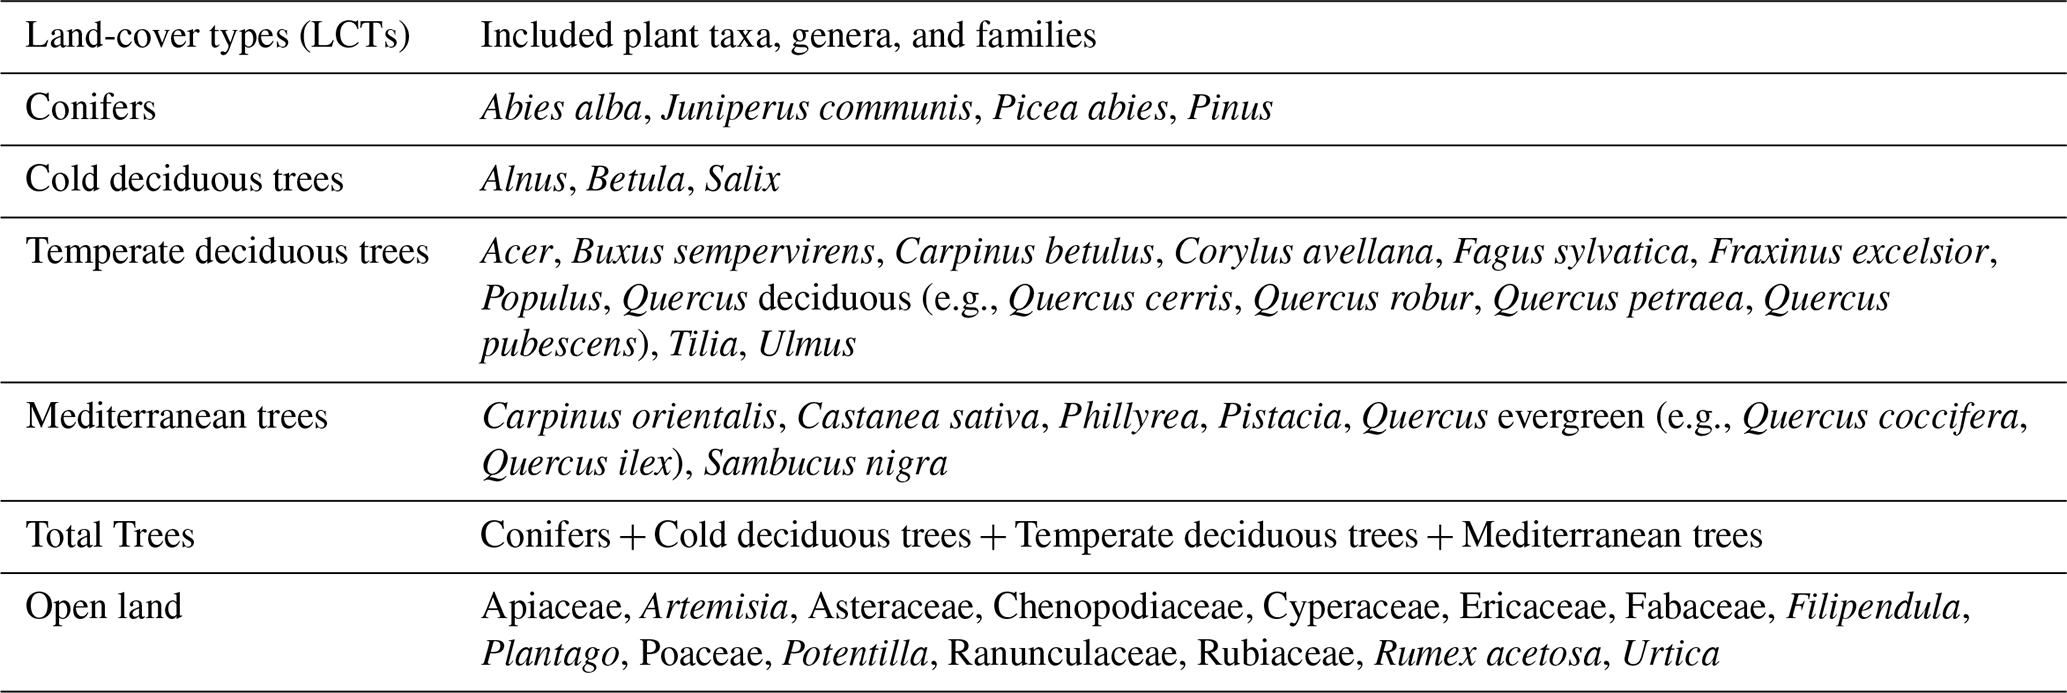
Table D1Comparison of the percentage of unreliable data for all taxa and LCTs before and after data aggregation into 1000 year time bins.
OAK: Conceptualisation, Data curation, Formal analysis, Investigation, Validation, Visualisation, Writing – original draft preparation, Writing – review & editing. AM: Conceptualisation, Supervision, Writing – review & editing. NV: Conceptualisation, Project administration, Supervision, Writing – review & editing.
The contact author has declared that none of the authors has any competing interests.
Publisher's note: Copernicus Publications remains neutral with regard to jurisdictional claims made in the text, published maps, institutional affiliations, or any other geographical representation in this paper. While Copernicus Publications makes every effort to include appropriate place names, the final responsibility lies with the authors. Views expressed in the text are those of the authors and do not necessarily reflect the views of the publisher.
We thank the two anonymous reviewers for their valuable and constructive feedback, which helped with improving our paper. In addition, we thank Jon Camuera, Penélope González-Sampériz, Vaida Šeirienė, and Philipp Stojakowits for providing unpublished pollen data. Moreover, we express our sincerest gratitude to the people involved in managing and curating the ACER, Neotoma, and PalyCZ pollen databases as well as all data contributors for providing their services and data to the public. We also thank Monika Doubrawa, Tilman Hartley, Johanna Hilpert, Philipp Schlüter and Isabell Schmidt for scientific discussions.
The project “HESCOR” is receiving funding from the programme “Profilbildung 2022”, an initiative of the Ministry of Culture and Science of the State of North-Rhine Westphalia, Germany (HESCOR PB22-081). The sole responsibility for the content of this publication lies with the authors.
This open-access publication was funded by Universität zu Köln.
This paper was edited by Birgit Heim and reviewed by two anonymous referees.
Abraham, V., Oušková, V., and Kuneš, P.: Present-Day Vegetation Helps Quantifying Past Land Cover in Selected Regions of the Czech Republic, PLOS ONE, 9, e100117, https://doi.org/10.1371/journal.pone.0100117, 2014.
Alessio, M., Allegri, L., Bella, F., Calderoni, G., Cortesi, C., Dai Pra, G., De Rita, D., Esu, D., Follieri, M., Improta, S., Magri, D., Narcisi, B., Petrone, V., and Sadori, L.: 14C dating, geochemical features, faunistic and pollen analyses of the uppermost 10 m core from Valle di Castiglione (Rome, Italy), Geologica Romana, 25, 287–308, 1986.
Allen, J. R. M., Huntley, B., and Watts, W. A.: The vegetation and climate of north-west Iberia over the last 14 000 yr, J. Quaternary Sci., 11, 125–147, 1996.
Alley, R. B., Marotzke, J., Nordhaus, W. D., Overpeck, J. T., Peteet, D. M., Pielke, R. A., Pierrehumbert, R. T., Rhines, P. B., Stocker, T. F., Talley, L. D., and Wallace, J. M.: Abrupt Climate Change, Science, 299, 2005–2010, https://doi.org/10.1126/science.1081056, 2003.
Ammann, B.: Late-Quaternary palynology at Lobsigensee. Regional vegetation history and local lake development, Gebrüder Borntraeger Verlagsbuchhandlung, Berlin, Stuttgart, 1–157, ISBN 3443640494, ISBN 9783443640491, 1989.
Anderegg, W. R. L., Trugman, A. T., Badgley, G., Anderson, C. M., Bartuska, A., Ciais, P., Cullenward, D., Field, C. B., Freeman, J., Goetz, S. J., Hicke, J. A., Huntzinger, D., Jackson, R. B., Nickerson, J., Pacala, S., and Randerson, J. T.: Climate-driven risks to the climate mitigation potential of forests, Science, 368, eaaz7005, https://doi.org/10.1126/science.aaz7005, 2020.
Andersen, S. T.: The Relative Pollen Productivity and Pollen Representation of North European Trees, and Correction Factors for Tree Pollen Spectra. Determined by Surface Pollen Analyses from Forests, GEUS, 96, 1–99, https://doi.org/10.34194/raekke2.v96.6887, 1970.
Baker, J., Rigaud, S., Pereira, D., Courtenay, L. A., and d'Errico, F.: Evidence from personal ornaments suggest nine distinct cultural groups between 34,000 and 24,000 years ago in Europe, Nat. Hum. Behav., 1–14, https://doi.org/10.1038/s41562-023-01803-6, 2024.
Barbier, D. and Visset, L.: Les spécificités d'un Tardiglaciaire armoricain: étude pollinique synthétique à partir de trois tourbières du nord-est mayennais (France) [Specificities of an armoricain Late Glacial period: synthetic pollen analysis of three peat bogs in northeast Mayenne (France)], Quaternaire, 11, 99–106, https://doi.org/10.3406/quate.2000.1659, 2000.
Bigelow, N. H., Brubaker, L. B., Edwards, M. E., Harrison, S. P., Prentice, I. C., Anderson, P. M., Andreev, A. A., Bartlein, P. J., Christensen, T. R., Cramer, W., Kaplan, J. O., Lozhkin, A. V., Matveyeva, N. V., Murray, D. F., McGuire, A. D., Razzhivin, V. Y., Ritchie, J. C., Smith, B., Walker, D. A., Gajewski, K., Wolf, V., Holmqvist, B. H., Igarashi, Y., Kremenetskii, K., Paus, A., Pisaric, M. F. J., and Volkova, V. S.: Climate change and Arctic ecosystems: 1. Vegetation changes north of 55° N between the last glacial maximum, mid-Holocene, and present, J. Geophys. Res.-Atmos., 108, https://doi.org/10.1029/2002JD002558, 2003.
Binney, H., Edwards, M., Macias-Fauria, M., Lozhkin, A., Anderson, P., Kaplan, J. O., Andreev, A., Bezrukova, E., Blyakharchuk, T., Jankovska, V., Khazina, I., Krivonogov, S., Kremenetski, K., Nield, J., Novenko, E., Ryabogina, N., Solovieva, N., Willis, K., and Zernitskaya, V.: Vegetation of Eurasia from the last glacial maximum to present: Key biogeographic patterns, Quaternary Sci. Rev., 157, 80–97, https://doi.org/10.1016/j.quascirev.2016.11.022, 2017.
Birks, H. J. B.: The identification of Betula nana pollen, New Phytol., 67, 309–314, https://doi.org/10.1111/j.1469-8137.1968.tb06386.x, 1968.
Birks, H. J. B., Bhatta, K. P., Felde, V. A., Flantua, S. G. A., Mottl, O., Haberle, S. G., Herbert, A., Hooghiemstra, H., Birks, H. H., Grytnes, J.-A., and Seddon, A. W. R.: Approaches to pollen taxonomic harmonisation in Quaternary palynology, Rev. Palaeobot. Palynol., 319, 104989, https://doi.org/10.1016/j.revpalbo.2023.104989, 2023.
Bottema, S.: Pollen analytical investigations in Thessaly (Greece), Palaeohistoria, 21, 19–40, 1979.
Bottema, S.: Chronology and climatic phases in the Near East from 16 000 to 10 000 BP, in: Chronologies in the Near East: Relative Chronologies and Absolute Chronology, 16 000–4000 B.P., edited by: Aurenche, O., Evin, J., and Hours, F., British Archaeological Reports, Oxford, 295–310, https://doi.org/10.30861/9780860544876, 1987.
Brauer, A., Allen, J. R. M., Mingram, J., Dulski, P., Wulf, S., and Huntley, B.: Evidence for last interglacial chronology and environmental change from Southern Europe, P. Natl. Acad. Sci. USA, 104, 450–455, https://doi.org/10.1073/pnas.0603321104, 2007.
Britzius, S., Dreher, F., Maisel, P., and Sirocko, F.: Vegetation Patterns during the Last 132,000 Years: A Synthesis from Twelve Eifel Maar Sediment Cores (Germany): The ELSA-23-Pollen-Stack, Quaternary, 7, 8, https://doi.org/10.3390/quat7010008, 2024.
Brovkin, V., Brook, E., Williams, J. W., Bathiany, S., Lenton, T. M., Barton, M., DeConto, R. M., Donges, J. F., Ganopolski, A., McManus, J., Praetorius, S., De Vernal, A., Abe-Ouchi, A., Cheng, H., Claussen, M., Crucifix, M., Gallopín, G., Iglesias, V., Kaufman, D. S., Kleinen, T., Lambert, F., Van Der Leeuw, S., Liddy, H., Loutre, M.-F., McGee, D., Rehfeld, K., Rhodes, R., Seddon, A. W. R., Trauth, M. H., Vanderveken, L., and Yu, Z.: Past abrupt changes, tipping points and cascading impacts in the Earth system, Nat. Geosci., 14, 550–558, https://doi.org/10.1038/s41561-021-00790-5, 2021.
Burjachs, F. and Julià, R.: Abrupt Climatic Changes during the Last Glaciation Based on Pollen Analysis of the Abric Romani, Catalonia, Spain, Quatern. Res., 42, 308–315, https://doi.org/10.1006/qres.1994.1081, 1994.
Camuera, J., Jiménez-Moreno, G., Ramos-Román, M. J., García-Alix, A., Toney, J. L., Anderson, R. S., Jiménez-Espejo, F., Bright, J., Webster, C., Yanes, Y., and Carrión, J. S.: Vegetation and climate changes during the last two glacial-interglacial cycles in the western Mediterranean: A new long pollen record from Padul (southern Iberian Peninsula), Quaternary Sci. Rev., 205, 86–105, https://doi.org/10.1016/j.quascirev.2018.12.013, 2019.
Carrión, J. S. and Van Geel, B.: Fine-resolution Upper Weichselian and Holocene palynological record from Navarrés (Valencia, Spain) and a discussion about factors of Mediterranean forest succession, Rev. Palaeobot. Palynol., 106, 209–236, https://doi.org/10.1016/S0034-6667(99)00009-3, 1999.
Chang, W., Cheng, J., Allaire, J. J., Sievert, C., Schloerke, B., Xie, Y., Allen, J., McPherson, J., Dipert, A., and Borges, B.: shiny: Web Application Framework for R, https://github.com/rstudio/shiny (last access: 22 October 2025), 2023.
Chevalier, M., Davis, B. A. S., Heiri, O., Seppä, H., Chase, B. M., Gajewski, K., Lacourse, T., Telford, R. J., Finsinger, W., Guiot, J., Kühl, N., Maezumi, S. Y., Tipton, J. R., Carter, V. A., Brussel, T., Phelps, L. N., Dawson, A., Zanon, M., Vallé, F., Nolan, C., Mauri, A., de Vernal, A., Izumi, K., Holmström, L., Marsicek, J., Goring, S., Sommer, P. S., Chaput, M., and Kupriyanov, D.: Pollen-based climate reconstruction techniques for late Quaternary studies, Earth-Sci. Rev., 210, 103384, https://doi.org/10.1016/j.earscirev.2020.103384, 2020.
Corrick, E. C., Drysdale, R. N., Hellstrom, J. C., Capron, E., Rasmussen, S. O., Zhang, X., Fleitmann, D., Couchoud, I., and Wolff, E.: Synchronous timing of abrupt climate changes during the last glacial period, Science, 369, 963–969, https://doi.org/10.1126/science.aay5538, 2020.
Cortés-Sánchez, M., Morales-Muñiz, A., Simón-Vallejo, M. D., Bergadà-Zapata, M. M., Delgado-Huertas, A., López-García, P., López-Sáez, J. A., Lozano-Francisco, M. C., Riquelme-Cantal, J. A., Roselló-Izquierdo, E., Sánchez-Marco, A., and Vera-Peláez, J. L.: Palaeoenvironmental and cultural dynamics of the coast of Málaga (Andalusia, Spain) during the Upper Pleistocene and early Holocene, Quaternary Sci. Rev., 27, 2176–2193, https://doi.org/10.1016/j.quascirev.2008.03.010, 2008.
Dallmeyer, A., Poska, A., Marquer, L., Seim, A., and Gaillard, M.-J.: The challenge of comparing pollen-based quantitative vegetation reconstructions with outputs from vegetation models – a European perspective, Clim. Past, 19, 1531–1557, https://doi.org/10.5194/cp-19-1531-2023, 2023.
Davis, M. B.: On the theory of pollen analysis, American Journal of Science, 261, 897–912, https://doi.org/10.2475/ajs.261.10.897, 1963.
de Beaulieu, J.-L.: Pollen profile GPILXX, La Grande Pile, France, PANGAEA [data set], https://doi.org/10.1594/PANGAEA.739275, 2010.
de Beaulieu, J.-L. and Reille, M.: A long Upper Pleistocene pollen record from Les Echets, near Lyon, France, Boreas, 13, 111–132, https://doi.org/10.1111/j.1502-3885.1984.tb00066.x, 1984.
de Beaulieu, J.-L. and Reille, M.: Long Pleistocene pollen sequences from the Velay Plateau (Massif Central, France), Veget. Hist. Archaebot., 1, 233–242, https://doi.org/10.1007/BF00189500, 1992a.
de Beaulieu, J.-L. and Reille, M.: The last climatic cycle at La Grande Pile (Vosges, France) a new pollen profile, Quaternary Sci. Rev., 11, 431–438, https://doi.org/10.1016/0277-3791(92)90025-4, 1992b.
de Beaulieu, J.-L., Pons, A., and Reille, M.: Recherches pollenanalytiques sur l'histoire tardiglaciaire et holocene de la vegetation des Monts d'Aubrac (Massif Central, France), Rev. Palaeobot. Palynol., 44, 37–80, https://doi.org/10.1016/0034-6667(85)90028-4, 1985.
Djamali, M., Beaulieu, J.-L. de, Shah-hosseini, M., Andrieu-Ponel, V., Ponel, P., Amini, A., Akhani, H., Leroy, S. A. G., Stevens, L., Lahijani, H., and Brewer, S.: A late Pleistocene long pollen record from Lake Urmia, Nw Iran, Quatern. Res., 69, 413–420, https://doi.org/10.1016/j.yqres.2008.03.004, 2008.
Ehlers, J., Gibbard, P. L., and Hughes, P. D.: Quaternary Glaciations – Extent and Chronology A Closer Look, Elsevier, ISBN 978-0-444-53447-7, 2011.
Engel, Z., Nývlt, D., Křížek, M., Treml, V., Jankovská, V., and Lisá, L.: Sedimentary evidence of landscape and climate history since the end of MIS 3 in the Krkonoše Mountains, Czech Republic, Quaternary Sci. Rev., 29, 913–927, https://doi.org/10.1016/j.quascirev.2009.12.008, 2010.
Fisher, R. A., Koven, C. D., Anderegg, W. R. L., Christoffersen, B. O., Dietze, M. C., Farrior, C. E., Holm, J. A., Hurtt, G. C., Knox, R. G., Lawrence, P. J., Lichstein, J. W., Longo, M., Matheny, A. M., Medvigy, D., Muller-Landau, H. C., Powell, T. L., Serbin, S. P., Sato, H., Shuman, J. K., Smith, B., Trugman, A. T., Viskari, T., Verbeeck, H., Weng, E., Xu, C., Xu, X., Zhang, T., and Moorcroft, P. R.: Vegetation demographics in Earth System Models: A review of progress and priorities, Global Change Biol., 24, 35–54, https://doi.org/10.1111/gcb.13910, 2018.
Fletcher, W. J., Sánchez Goñi, M. F., Allen, J. R. M., Cheddadi, R., Combourieu-Nebout, N., Huntley, B., Lawson, I., Londeix, L., Magri, D., Margari, V., Müller, U. C., Naughton, F., Novenko, E., Roucoux, K., and Tzedakis, P. C.: Millennial-scale variability during the last glacial in vegetation records from Europe, Quaternary Sci. Rev., 29, 2839–2864, https://doi.org/10.1016/j.quascirev.2009.11.015, 2010.
Florineth, D. and Schlüchter, C.: Alpine Evidence for Atmospheric Circulation Patterns in Europe during the Last Glacial Maximum, Quatern. Res., 54, 295–308, https://doi.org/10.1006/qres.2000.2169, 2000.
Fyfe, R., Roberts, N., and Woodbridge, J.: A pollen-based pseudobiomisation approach to anthropogenic land-cover change, Holocene, 20, 1165–1171, https://doi.org/10.1177/0959683610369509, 2010.
Fyfe, R. M., Twiddle, C., Sugita, S., Gaillard, M.-J., Barratt, P., Caseldine, C. J., Dodson, J., Edwards, K. J., Farrell, M., Froyd, C., Grant, M. J., Huckerby, E., Innes, J. B., Shaw, H., and Waller, M.: The Holocene vegetation cover of Britain and Ireland: overcoming problems of scale and discerning patterns of openness, Quaternary Sci. Rev., 73, 132–148, https://doi.org/10.1016/j.quascirev.2013.05.014, 2013.
Gavin, D. G., Fitzpatrick, M. C., Gugger, P. F., Heath, K. D., Rodríguez-Sánchez, F., Dobrowski, S. Z., Hampe, A., Hu, F. S., Ashcroft, M. B., Bartlein, P. J., Blois, J. L., Carstens, B. C., Davis, E. B., de Lafontaine, G., Edwards, M. E., Fernandez, M., Henne, P. D., Herring, E. M., Holden, Z. A., Kong, W., Liu, J., Magri, D., Matzke, N. J., McGlone, M. S., Saltré, F., Stigall, A. L., Tsai, Y.-H. E., and Williams, J. W.: Climate refugia: joint inference from fossil records, species distribution models and phylogeography, New Phytol., 204, 37–54, https://doi.org/10.1111/nph.12929, 2014.
Giardini, M.: Late Quaternary vegetation history at Stracciacappa (Rome, central Italy), Veget. Hist. Archaeobot., 16, 301–316, https://doi.org/10.1007/s00334-006-0037-y, 2007.
Githumbi, E., Fyfe, R., Gaillard, M.-J., Trondman, A.-K., Mazier, F., Nielsen, A.-B., Poska, A., Sugita, S., Woodbridge, J., Azuara, J., Feurdean, A., Grindean, R., Lebreton, V., Marquer, L., Nebout-Combourieu, N., Stančikaitė, M., Tanţău, I., Tonkov, S., Shumilovskikh, L., and LandClimII data contributors: European pollen-based REVEALS land-cover reconstructions for the Holocene: methodology, mapping and potentials, Earth Syst.Sci. Data, 14, 1581001619, https://doi.org/10.5194/essd-14-1581-2022, 2022.
González-Sampériz, P., Valero-Garcés, B. L., Moreno, A., Jalut, G., García-Ruiz, J. M., Martí-Bono, C., Delgado-Huertas, A., Navas, A., Otto, T., and Dedoubat, J. J.: Climate variability in the Spanish Pyrenees during the last 30,000 yr revealed by the El Portalet sequence, Quatern. Res., 66, 38–52, https://doi.org/10.1016/j.yqres.2006.02.004, 2006.
González-Sampériz, P., Gil-Romera, G., García-Prieto, E., Aranbarri, J., Moreno, A., Morellón, M., Sevilla-Callejo, M., Leunda, M., Santos, L., Franco-Múgica, F., Andrade, A., Carrión, J. S., and Valero-Garcés, B. L.: Strong continentality and effective moisture drove unforeseen vegetation dynamics since the last interglacial at inland Mediterranean areas: The Villarquemado sequence in NE Iberia, Quaternary Sci. Rev., 242, 106425, https://doi.org/10.1016/j.quascirev.2020.106425, 2020.
Hansen, M. C., Potapov, P. V., Moore, R., Hancher, M., Turubanova, S. A., Tyukavina, A., Thau, D., Stehman, S. V., Goetz, S. J., Loveland, T. R., Kommareddy, A., Egorov, A., Chini, L., Justice, C. O., and Townshend, J. R. G.: High-Resolution Global Maps of 21st-Century Forest Cover Change, Science, 342, 850–853, https://doi.org/10.1126/science.1244693, 2013.
Harper, A. B., Powell, T., Cox, P. M., House, J., Huntingford, C., Lenton, T. M., Sitch, S., Burke, E., Chadburn, S. E., Collins, W. J., Comyn-Platt, E., Daioglou, V., Doelman, J. C., Hayman, G., Robertson, E., van Vuuren, D., Wiltshire, A., Webber, C. P., Bastos, A., Boysen, L., Ciais, P., Devaraju, N., Jain, A. K., Krause, A., Poulter, B., and Shu, S.: Land-use emissions play a critical role in land-based mitigation for Paris climate targets, Nat. Commun., 9, 2938, https://doi.org/10.1038/s41467-018-05340-z, 2018.
Harrison, S. P., Gaillard, M.-J., Stocker, B. D., Vander Linden, M., Klein Goldewijk, K., Boles, O., Braconnot, P., Dawson, A., Fluet-Chouinard, E., Kaplan, J. O., Kastner, T., Pausata, F. S. R., Robinson, E., Whitehouse, N. J., Madella, M., and Morrison, K. D.: Development and testing scenarios for implementing land use and land cover changes during the Holocene in Earth system model experiments, Geosci. Model Dev., 13, 805–824, https://doi.org/10.5194/gmd-13-805-2020, 2020.
Henriksen, M., Mangerud, J., Matiouchkov, A., Murray, A. S., Paus, A., and Svendsen, J. I.: Intriguing climatic shifts in a 90 kyr old lake record from northern Russia, Boreas, 37, 20–37, https://doi.org/10.1111/j.1502-3885.2007.00007.x, 2008.
Heusser, L. and Balsam, W. L.: Pollen distribution in the northeast Pacific Ocean, Quatern. Res., 7, 45–62, https://doi.org/10.1016/0033-5894(77)90013-8, 1977.
Hopcroft, P. O., Valdes, P. J., Harper, A. B., and Beerling, D. J.: Multi vegetation model evaluation of the Green Sahara climate regime, Geophys. Res. Lett., 44, 6804–6813, https://doi.org/10.1002/2017GL073740, 2017.
Hošek, J., Pokorný, P., Storch, D., Kvaček, J., Havig, J., Novák, J., Hájková, P., Jamrichová, E., Brengman, L., Radoměřský, T., Křížek, M., Magna, T., Rapprich, V., Laufek, F., Hamilton, T., Pack, A., Di Rocco, T., and Horáček, I.: Hot spring oases in the periglacial desert as the Last Glacial Maximum refugia for temperate trees in Central Europe, Sci. Adv., 10, eado6611, https://doi.org/10.1126/sciadv.ado6611, 2024.
Hublin, J.-J.: The modern human colonization of western Eurasia: when and where?, Quaternary Sci. Rev., 118, 194–210, https://doi.org/10.1016/j.quascirev.2014.08.011, 2015.
Jankovská, V.: Slovak and Moravian Carpathians in the last glacial period – an island of “Siberian taiga” in Europe, Phytopedon, 7, 122–130, 2008.
Kaltenrieder, P., Procacci, G., Vannière, B., and Tinner, W.: Vegetation and fire history of the Euganean Hills (Colli Euganei) as recorded by Lateglacial and Holocene sedimentary series from Lago della Costa (northeastern Italy), Holocene, 20, 679–695, https://doi.org/10.1177/0959683609358911, 2010.
Kaplan, J. O., Krumhardt, K. M., Gaillard, M.-J., Sugita, S., Trondman, A.-K., Fyfe, R., Marquer, L., Mazier, F., and Nielsen, A. B.: Constraining the Deforestation History of Europe: Evaluation of Historical Land Use Scenarios with Pollen-Based Land Cover Reconstructions, Land, 6, 91, https://doi.org/10.3390/land6040091, 2017.
Kern, O. A.: Percentages of pollen data from late MIS 6 to MIS 1 from Füramoos, Southern Germany, PANGAEA [data set], https://doi.org/10.1594/PANGAEA.934305, 2021.
Kern, O. A.: PALVEG – Visualisation tool for pollen-based REVEALS land-cover reconstructions, Zenodo [code], https://doi.org/10.5281/zenodo.12782121, 2024a.
Kern, O. A.: Pollen-based land-cover reconstruction in R using the REVEALS method, Zenodo [code], https://doi.org/10.5281/zenodo.12625222, 2024b.
Kern, O. A.: PALVEG source metadata, Zenodo [data set], https://doi.org/10.5281/zenodo.16812766, 2025.
Kern, O. A., Koutsodendris, A., Allstädt, F. J., Mächtle, B., Peteet, D. M., Kalaitzidis, S., Christanis, K., and Pross, J.: A near-continuous record of climate and ecosystem variability in Central Europe during the past 130 kyrs (Marine Isotope Stages 5–1) from Füramoos, southern Germany, Quaternary Sci. Rev., 284, 107505, https://doi.org/10.1016/j.quascirev.2022.107505, 2022.
Kern, O. A., Maier, A., and Vercauteren, N.: REVEALS land-cover reconstructions for Europe during the Late Pleistocene (75–15 ka BP), PANGAEA [data set], https://doi.org/10.1594/PANGAEA.973049, 2025.
Knipping, M.: Pollenanalytische Untersuchungen zur Siedlungsgeschichte des Oberpfälzer Waldes, MA-Berichte der Deutschen Gesellschaft für Moor-und Torfkunde, 27, 61–74, 1997.
Koutsodendris, A., Dakos, V., Fletcher, W. J., Knipping, M., Kotthoff, U., Milner, A. M., Müller, U. C., Kaboth-Bahr, S., Kern, O. A., Kolb, L., Vakhrameeva, P., Wulf, S., Christanis, K., Schmiedl, G., and Pross, J.: Pollen data from Tenaghi Philippon (Greece) spanning the past 500 kyrs, PANGAEA [data set], https://doi.org/10.1594/PANGAEA.943593, 2023a.
Koutsodendris, A., Dakos, V., Fletcher, W. J., Knipping, M., Kotthoff, U., Milner, A. M., Müller, U. C., Kaboth-Bahr, S., Kern, O. A., Kolb, L., Vakhrameeva, P., Wulf, S., Christanis, K., Schmiedl, G., and Pross, J.: Atmospheric CO2 forcing on Mediterranean biomes during the past 500 kyrs, Na.t Commun., 14, 1664, https://doi.org/10.1038/s41467-023-37388-x, 2023b.
Ladeau, S. L. and Clark, J. S.: Pollen Production by Pinus taeda Growing in Elevated Atmospheric CO2, Funct. Ecol., 20, 541–547, 2006.
Landais, A., Goñi, M. F. S., Toucanne, S., Rodrigues, T., and Naughton, F.: Chapter 24 – Abrupt climatic variability: Dansgaard–Oeschger events, in: European Glacial Landscapes, edited by: Palacios, D., Hughes, P. D., García-Ruiz, J. M., and Andrés, N., Elsevier, 175–180, https://doi.org/10.1016/B978-0-12-823498-3.00056-X, 2022.
Li, C., Dallmeyer, A., Ni, J., Chevalier, M., Willeit, M., Andreev, A. A., Cao, X., Schild, L., Heim, B., Wieczorek, M., and Herzschuh, U.: Global biome changes over the last 21 000 years inferred from model–data comparisons, Clim. Past, 21, 1001–1024, https://doi.org/10.5194/cp-21-1001-2025, 2025.
Li, F., Gaillard, M.-J., Cao, X., Herzschuh, U., Sugita, S., Ni, J., Zhao, Y., An, C., Huang, X., Li, Y., Liu, H., Sun, A., and Yao, Y.: Gridded pollen-based Holocene regional plant cover in temperate and northern subtropical China suitable for climate modelling, Earth Syst. Sci. Data, 15, 95–112, https://doi.org/10.5194/essd-15-95-2023, 2023.
Lisiecki, L. E. and Raymo, M. E.: A Pliocene-Pleistocene stack of 57 globally distributed benthic δ18O records, Paleoceanography, 20, https://doi.org/10.1029/2004PA001071, 2005.
Lotter, A. and Boucherle, M. M.: A late-glacial and post-glacial history of amsoldingersee and vicinity, Switzerland, Schweiz. Z. Hydrol., 46, 192–209, https://doi.org/10.1007/BF02538061, 1984.
Lu, Z., Miller, P. A., Zhang, Q., Zhang, Q., Wårlind, D., Nieradzik, L., Sjolte, J., and Smith, B.: Dynamic Vegetation Simulations of the Mid-Holocene Green Sahara, Geophys. Res. Lett., 45, 8294–8303, https://doi.org/10.1029/2018GL079195, 2018.
Ludwig, P., Schaffernicht, E. J., Shao, Y., and Pinto, J. G.: Regional atmospheric circulation over Europe during the Last Glacial Maximum and its links to precipitation, J. Geophys. Res.-Atmos., 121, 2130–2145, https://doi.org/10.1002/2015JD024444, 2016.
Luetscher, M., Boch, R., Sodemann, H., Spötl, C., Cheng, H., Edwards, R. L., Frisia, S., Hof, F., and Müller, W.: North Atlantic storm track changes during the Last Glacial Maximum recorded by Alpine speleothems, Nat. Commun., 6, 6344, https://doi.org/10.1038/ncomms7344, 2015.
Magri, D.: Late Quaternary vegetation history at Lagaccione near Lago di Bolsena (central Italy), Rev. Palaeobot. Palynol., 106, 171–208, https://doi.org/10.1016/S0034-6667(99)00006-8, 1999.
Magyari, E. K., Kuneš, P., Jakab, G., Sümegi, P., Pelánková, B., Schäbitz, F., Braun, M., and Chytrý, M.: Late Pleniglacial vegetation in eastern-central Europe: are there modern analogues in Siberia?, Quaternary Sci. Rev., 95, 60–79, https://doi.org/10.1016/j.quascirev.2014.04.020, 2014.
Maier, A., Ludwig, P., Zimmermann, A., and Schmidt, I.: The Sunny Side of the Ice Age: Solar Insolation as a Potential Long-Term Pacemaker for Demographic Developments in Europe Between 43 and 15 ka Ago, PaleoAnthropology, 35–51, https://doi.org/10.48738/2022.ISS1.100, 2022.
Maier, A., Tharandt, L., Linsel, F., Krakov, V., and Ludwig, P.: Where the Grass is Greener – Large-Scale Phenological Patterns and Their Explanatory Potential for the Distribution of Paleolithic Hunter-Gatherers in Europe, J. Archaeol. Meth. Theory, 31, 918–945, https://doi.org/10.1007/s10816-023-09628-3, 2024.
Margari, V., Gibbard, P. L., Bryant, C. L., and Tzedakis, P. C.: Character of vegetational and environmental changes in southern Europe during the last glacial period; evidence from Lesvos Island, Greece, Quaternary Sci. Rev., 28, 1317–1339, https://doi.org/10.1016/j.quascirev.2009.01.008, 2009.
Marquer, L., Gaillard, M.-J., Sugita, S., Poska, A., Trondman, A.-K., Mazier, F., Nielsen, A. B., Fyfe, R. M., Jönsson, A. M., Smith, B., Kaplan, J. O., Alenius, T., Birks, H. J. B., Bjune, A. E., Christiansen, J., Dodson, J., Edwards, K. J., Giesecke, T., Herzschuh, U., Kangur, M., Koff, T., Latałowa, M., Lechterbeck, J., Olofsson, J., and Seppä, H.: Quantifying the effects of land use and climate on Holocene vegetation in Europe, Quaternary Sci. Rev., 171, 20–37, https://doi.org/10.1016/j.quascirev.2017.07.001, 2017.
Masson-Delmotte, V., Zhai, P., Pirani, S., Connors, C., Péan, S., Berger, N., Caud, Y., Chen, L., Goldfarb, M., and Scheel Monteiro, P. M.: IPCC, 2021: Summary for policymakers, in: Climate change 2021: The physical science basis. contribution of working group I to the sixth assessment report of the intergovernmental panel on climate change, https://www.cambridge.org/core/books/climate-change-2021-the-physical-science-basis/summary-for-policymakers/8E7A4E3AE6C364220F3B76A189CC4D4C (last access: 22 October 2025), https://doi.org/10.1017/9781009157896.001, 2021.
Mayewski, P. A., Rohling, E. E., Stager, J. C., Karlén, W., Maasch, K. A., Meeker, L. D., Meyerson, E. A., Gasse, F., van Kreveld, S., Holmgren, K., Lee-Thorp, J., Rosqvist, G., Rack, F., Staubwasser, M., Schneider, R. R., and Steig, E. J.: Holocene climate variability, Quatern. Res., 62, 243–255, https://doi.org/10.1016/j.yqres.2004.07.001, 2004.
Mayr, C., Stojakowits, P., Lempe, B., Blaauw, M., Diersche, V., Grohganz, M., Correa, M. L., Ohlendorf, C., Reimer, P., and Zolitschka, B.: High-resolution geochemical record of environmental changes during MIS 3 from the northern Alps (Nesseltalgraben, Germany), Quaternary Sci. Rev., 218, 122–136, https://doi.org/10.1016/j.quascirev.2019.06.013, 2019.
Mazier, F., Nielsen, A. B., Broström, A., Sugita, S., and Hicks, S.: Signals of tree volume and temperature in a high-resolution record of pollen accumulation rates in northern Finland, J. Quatern. Sci., 27, 564–574, https://doi.org/10.1002/jqs.2549, 2012.
McDowell, N. G., Allen, C. D., Anderson-Teixeira, K., Aukema, B. H., Bond-Lamberty, B., Chini, L., Clark, J. S., Dietze, M., Grossiord, C., Hanbury-Brown, A., Hurtt, G. C., Jackson, R. B., Johnson, D. J., Kueppers, L., Lichstein, J. W., Ogle, K., Poulter, B., Pugh, T. A. M., Seidl, R., Turner, M. G., Uriarte, M., Walker, A. P., and Xu, C.: Pervasive shifts in forest dynamics in a changing world, Science, 368, eaaz9463, https://doi.org/10.1126/science.aaz9463, 2020.
Mellars, P.: Neanderthals and the modern human colonization of Europe, Nature, 432, 461–465, https://doi.org/10.1038/nature03103, 2004.
Miebach, A., Niestrath, P., Roeser, P., and Litt, T.: Impacts of climate and humans on the vegetation in northwestern Turkey: palynological insights from Lake Iznik since the Last Glacial, Clim. Past, 12, 575–593, https://doi.org/10.5194/cp-12-575-2016, 2016.
Miebach, A., Stolzenberger, S., Wacker, L., Hense, A., and Litt, T.: Pollen, micro-charcoal, and non-pollen palynomorph counts of Dead Sea core 5017-1-A (88–14 ka BP), PANGAEA [data set], https://doi.org/10.1594/PANGAEA.900564, 2019a.
Miebach, A., Stolzenberger, S., Wacker, L., Hense, A., and Litt, T.: A new Dead Sea pollen record reveals the last glacial paleoenvironment of the southern Levant, Quaternary Sci. Rev., 214, 98–116, https://doi.org/10.1016/j.quascirev.2019.04.033, 2019b.
Mitchell, F. J. and Maldonado-Ruiz, J.: Vegetation development in the Glendalough Valley, eastern Ireland over the last 15,000 years, in: Biology and Environment, Proceedings of the Royal Irish Academy, 55–68, https://doi.org/10.1353/bae.2018.0013, 2018.
Mitchell, F. J. G.: The history and vegetation dynamics of a yew wood (Taxus baccata L.) in S.W. Ireland, New Phytol., 115, 573–577, https://doi.org/10.1111/j.1469-8137.1990.tb00486.x, 1990.
Moreno, A., Svensson, A., Brooks, S. J., Connor, S., Engels, S., Fletcher, W., Genty, D., Heiri, O., Labuhn, I., Perşoiu, A., Peyron, O., Sadori, L., Valero-Garcés, B., Wulf, S., and Zanchetta, G.: A compilation of Western European terrestrial records 60–8 ka BP: towards an understanding of latitudinal climatic gradients, Quaternary Sci. Rev., 106, 167–185, https://doi.org/10.1016/j.quascirev.2014.06.030, 2014.
Morrison, K. D., Hammer, E., Boles, O., Madella, M., Whitehouse, N., Gaillard, M.-J., Bates, J., Linden, M. V., Merlo, S., Yao, A., Popova, L., Hill, A. C., Antolin, F., Bauer, A., Biagetti, S., Bishop, R. R., Buckland, P., Cruz, P., Dreslerová, D., Dusseldorp, G., Ellis, E., Filipovic, D., Foster, T., Hannaford, M. J., Harrison, S. P., Hazarika, M., Herold, H., Hilpert, J., Kaplan, J. O., Kay, A., Goldewijk, K. K., Kolář, J., Kyazike, E., Laabs, J., Lancelotti, C., Lane, P., Lawrence, D., Lewis, K., Lombardo, U., Lucarini, G., Arroyo-Kalin, M., Marchant, R., Mayle, F., McClatchie, M., McLeester, M., Mooney, S., Hoyo, M. M., Navarrete, V., Ndiema, E., Neves, E. G., Nowak, M., Out, W. A., Petrie, C., Phelps, L. N., Pinke, Z., Rostain, S., Russell, T., Sluyter, A., Styring, A. K., Tamanaha, E., Thomas, E., Veerasamy, S., Welton, L., and Zanon, M.: Mapping past human land use using archaeological data: A new classification for global land use synthesis and data harmonization, PLOS ONE, 16, e0246662, https://doi.org/10.1371/journal.pone.0246662, 2021.
Müller, U. C.: A Late-Pleistocene pollen sequence from the Jammertal, south-western Germany with particular reference to location and altitude as factors determining Eemian forest composition, Veget. Hist. Archaebot., 9, 125–131, https://doi.org/10.1007/BF01300062, 2000.
Nakagawa, T.: Études palynologiques dans les Alpes françaises centrales et méridionales: histoire de la végétation tardiglaciaire et holocène, PhD Thesis [unpublished], Université d'Aix-Marseille III, 206 pp., 1998.
Niemeyer, B., Klemm, J., Pestryakova, L. A., and Herzschuh, U.: Relative pollen productivity estimates for common taxa of the northern Siberian Arctic, Rev. Palaeobot. Palynol., 221, 71–82, https://doi.org/10.1016/j.revpalbo.2015.06.008, 2015.
O'Neill, B. C., Kriegler, E., Ebi, K. L., Kemp-Benedict, E., Riahi, K., Rothman, D. S., van Ruijven, B. J., van Vuuren, D. P., Birkmann, J., Kok, K., Levy, M., and Solecki, W.: The roads ahead: Narratives for shared socioeconomic pathways describing world futures in the 21st century, Global Environ. Change, 42, 169–180, https://doi.org/10.1016/j.gloenvcha.2015.01.004, 2017.
Ordonez, A. and Riede, F.: Changes in limiting factors for forager population dynamics in Europe across the last glacial-interglacial transition, Nat. Commun., 13, 5140, https://doi.org/10.1038/s41467-022-32750-x, 2022.
Ortu, E., Brewer, S., and Peyron, O.: Pollen-inferred palaeoclimate reconstructions in mountain areas: problems and perspectives, J. Quatern. Sci., 21, 615–627, https://doi.org/10.1002/jqs.998, 2006.
Parsons, R. W. and Prentice, I. C.: Statistical approaches to R-values and the pollen – vegetation relationship, Rev. Palaeobot. Palynol., 32, 127–152, https://doi.org/10.1016/0034-6667(81)90001-4, 1981.
Paus, A., Svendsen, J. I., and Matiouchkov, A.: Late Weichselian (Valdaian) and Holocene vegetation and environmental history of the northern Timan Ridge, European Arctic Russia, Quaternary Sci. Rev., 22, 2285–2302, https://doi.org/10.1016/S0277-3791(03)00136-7, 2003.
Pérez-Díaz, S. and López-Sáez, J. A.: 33. Verdeospesoa mire (Basque Country, Northern Iberian Peninsula, Spain), Grana, 56, 315–317, https://doi.org/10.1080/00173134.2016.1271824, 2017.
Pèrez-Obiol, R. and Julià, R.: Climatic Change on the Iberian Peninsula Recorded in a 30,000-Yr Pollen Record from Lake Banyoles, Quatern. Res., 41, 91–98, https://doi.org/10.1006/qres.1994.1010, 1994.
Pickarski, N. and Litt, T.: A new high-resolution pollen sequence at Lake Van, Turkey: insights into penultimate interglacial–glacial climate change on vegetation history, Clim. Past, 13, 689–710, https://doi.org/10.5194/cp-13-689-2017, 2017.
Pini, R., Ravazzi, C., and Donegana, M.: Pollen stratigraphy, vegetation and climate history of the last 215 ka in the Azzano Decimo core (plain of Friuli, north-eastern Italy), Quaternary Sci. Rev., 28, 1268–1290, https://doi.org/10.1016/j.quascirev.2008.12.017, 2009.
Prentice, C., Guiot, J., Huntley, B., Jolly, D., and Cheddadi, R.: Reconstructing biomes from palaeoecological data: a general method and its application to European pollen data at 0 and 6 ka, Clim. Dynam., 12, 185–194, https://doi.org/10.1007/BF00211617, 1996.
Prentice, I. C.: Pollen representation, source area, and basin size: Toward a unified theory of pollen analysis, Quatern. Res., 23, 76–86, https://doi.org/10.1016/0033-5894(85)90073-0, 1985.
Price, T. D.: Europe's first farmers, Cambridge University Press, ISBN 9780511607851, https://doi.org/10.1017/CBO9780511607851, 2000.
Rasmussen, S. O., Bigler, M., Blockley, S. P., Blunier, T., Buchardt, S. L., Clausen, H. B., Cvijanovic, I., Dahl-Jensen, D., Johnsen, S. J., Fischer, H., Gkinis, V., Guillevic, M., Hoek, W. Z., Lowe, J. J., Pedro, J. B., Popp, T., Seierstad, I. K., Steffensen, J. P., Svensson, A. M., Vallelonga, P., Vinther, B. M., Walker, M. J. C., Wheatley, J. J., and Winstrup, M.: A stratigraphic framework for abrupt climatic changes during the Last Glacial period based on three synchronized Greenland ice-core records: refining and extending the INTIMATE event stratigraphy, Quaternary Sci. Rev., 106, 14–28, https://doi.org/10.1016/j.quascirev.2014.09.007, 2014.
Roberts, N., Fyfe, R. M., Woodbridge, J., Gaillard, M.-J., Davis, B. A. S., Kaplan, J. O., Marquer, L., Mazier, F., Nielsen, A. B., Sugita, S., Trondman, A.-K., and Leydet, M.: Europe's lost forests: a pollen-based synthesis for the last 11,000 years, Sci. Rep., 8, 716, https://doi.org/10.1038/s41598-017-18646-7, 2018.
Sadori, L., Koutsodendris, A., Panagiotopoulos, K., Masi, A., Bertini, A., Combourieu-Nebout, N., Francke, A., Kouli, K., Joannin, S., Mercuri, A. M., Peyron, O., Torri, P., Wagner, B., Zanchetta, G., Sinopoli, G., and Donders, T. H.: Pollen-based paleoenvironmental and paleoclimatic change at Lake Ohrid (south-eastern Europe) during the past 500 ka, Biogeosciences, 13, 1423–1437, https://doi.org/10.5194/bg-13-1423-2016, 2016.
Sadori, L., Koutsodendris, A., Panagiotopoulos, K., Masi, A., Bertini, A., Combourieu-Nebout, N., Francke, A., Kouli, K., Kousis, I., Joannin, S., Mercuri, A. M., Peyron, O., Torri, P., Wagner, B., Zanchetta, G., Sinopoli, G., and Donders, T. H.: Pollen data of the last 500 ka BP at Lake Ohrid (south-eastern Europe), PANGAEA [data set], https://doi.org/10.1594/PANGAEA.892362, 2018.
Sánchez Goñi, M. F., Desprat, S., Daniau, A.-L., Bassinot, F. C., Polanco-Martínez, J. M., Harrison, S. P., Allen, J. R. M., Anderson, R. S., Behling, H., Bonnefille, R., Burjachs, F., Carrión, J. S., Cheddadi, R., Clark, J. S., Combourieu-Nebout, N., Mustaphi, C. J. C., Debusk, G. H., Dupont, L. M., Finch, J. M., Fletcher, W. J., Giardini, M., González, C., Gosling, W. D., Grigg, L. D., Grimm, E. C., Hayashi, R., Helmens, K., Heusser, L. E., Hill, T., Hope, G., Huntley, B., Igarashi, Y., Irino, T., Jacobs, B., Jiménez-Moreno, G., Kawai, S., Kershaw, A. P., Kumon, F., Lawson, I. T., Ledru, M.-P., Lézine, A.-M., Liew, P. M., Magri, D., Marchant, R., Margari, V., Mayle, F. E., McKenzie, G. M., Moss, P., Müller, S., Müller, U. C., Naughton, F., Newnham, R. M., Oba, T., Pérez-Obiol, R., Pini, R., Ravazzi, C., Roucoux, K. H., Rucina, S. M., Scott, L., Takahara, H., Tzedakis, P. C., Urrego, D. H., van Geel, B., Valencia, B. G., Vandergoes, M. J., Vincens, A., Whitlock, C. L., Willard, D. A., and Yamamoto, M.: The ACER pollen and charcoal database: a global resource to document vegetation and fire response to abrupt climate changes during the last glacial period, Earth Syst. Sci. Data, 9, 679–695, https://doi.org/10.5194/essd-9-679-2017, 2017.
Schaffernicht, E. J., Ludwig, P., and Shao, Y.: Linkage between dust cycle and loess of the Last Glacial Maximum in Europe, Atmos. Chem. Phys., 20, 4969–4986, https://doi.org/10.5194/acp-20-4969-2020, 2020.
Schauer, P., Shennan, S., Bevan, A., Cook, G., Edinborough, K., Fyfe, R., Kerig, T., and Parker Pearson, M.: Supply and demand in prehistory? Economics of Neolithic mining in northwest Europe, J. Anthropol. Archaeol., 54, 149–160, https://doi.org/10.1016/j.jaa.2019.03.001, 2019.
Schild, L., Ewald, P., Li, C., Hébert, R., Laepple, T., and Herzschuh, U.: LegacyVegetation: Northern Hemisphere reconstruction of past plant cover and total tree cover from pollen archives of the last 14 kyr, Earth Syst. Sci. Data, 17, 2007–2033, https://doi.org/10.5194/essd-17-2007-2025, 2025.
Schmidt, I. and Zimmermann, A.: Population dynamics and socio-spatial organization of the Aurignacian: Scalable quantitative demographic data for western and central Europe, PLOS ONE, 14, e0211562, https://doi.org/10.1371/journal.pone.0211562, 2019.
Schmidt, I., Hilpert, J., Kretschmer, I., Peters, R., Broich, M., Schiesberg, S., Vogels, O., Wendt, K. P., Zimmermann, A., and Maier, A.: Approaching prehistoric demography: proxies, scales and scope of the Cologne Protocol in European contexts, Philos. T. Roy. Soc. B, 376, 20190714, https://doi.org/10.1098/rstb.2019.0714, 2021.
Seersholm, F. V., Werndly, D. J., Grealy, A., Johnson, T., Keenan Early, E. M., Lundelius, E. L., Winsborough, B., Farr, G. E., Toomey, R., Hansen, A. J., Shapiro, B., Waters, M. R., McDonald, G., Linderholm, A., Stafford, T. W., and Bunce, M.: Rapid range shifts and megafaunal extinctions associated with late Pleistocene climate change, Nat. Commun., 11, 2770, https://doi.org/10.1038/s41467-020-16502-3, 2020.
Šeiriene, V., Kühl, N., and Kisieliene, D.:Quantitative reconstruction of climate variability during the Eemian (Merkinė) and Weichselian (Nemunas) in Lithuania, Quaternary Research, 82, 229–235, https://doi.org/10.1016/j.yqres.2014.04.004, 2014.
Serge, M. A., Mazier, F., Fyfe, R., Gaillard, M.-J., Klein, T., Lagnoux, A., Galop, D., Githumbi, E., Mindrescu, M., Nielsen, A. B., Trondman, A.-K., Poska, A., Sugita, S., Woodbridge, J., Abel-Schaad, D., Åkesson, C., Alenius, T., Ammann, B., Andersen, S. T., Anderson, R. S., Andrič, M., Balakauskas, L., Barnekow, L., Batalova, V., Bergman, J., Birks, H. J. B., Björkman, L., Bjune, A. E., Borisova, O., Broothaerts, N., Carrion, J., Caseldine, C., Christiansen, J., Cui, Q., Currás, A., Czerwiński, S., David, R., Davies, A. L., De Jong, R., Di Rita, F., Dietre, B., Dörfler, W., Doyen, E., Edwards, K. J., Ejarque, A., Endtmann, E., Etienne, D., Faure, E., Feeser, I., Feurdean, A., Fischer, E., Fletcher, W., Franco-Múgica, F., Fredh, E. D., Froyd, C., Garcés-Pastor, S., García-Moreiras, I., Gauthier, E., Gil-Romera, G., González-Sampériz, P., Grant, M. J., Grindean, R., Haas, J. N., Hannon, G., Heather, A.-J., Heikkilä, M., Hjelle, K., Jahns, S., Jasiunas, N., Jiménez-Moreno, G., Jouffroy-Bapicot, I., Kabailienė, M., Kamerling, I. M., Kangur, M., Karpińska-Kołaczek, M., Kasianova, A., Kołaczek, P., Lagerås, P., Latalowa, M., Lechterbeck, J., Leroyer, C., Leydet, M., Lindbladh, M., Lisitsyna, O., López-Sáez, J.-A., Lowe, J., Luelmo-Lautenschlaeger, R., Lukanina, E., Macijauskaitė, L., Magri, D., Marguerie, D., Marquer, L., Martinez-Cortizas, A., Mehl, I., Mesa-Fernández, J. M., Mighall, T., Miola, A., Miras, Y., Morales-Molino, C., Mrotzek, A., Sobrino, C. M., Odgaard, B., Ozola, I., Pérez-Díaz, S., Pérez-Obiol, R. P., Poggi, C., Rego, P. R., Ramos-Román, M. J., Rasmussen, P., Reille, M., Rösch, M., Ruffaldi, P., Goni, M. S., Savukynienė, N., Schröder, T., Schult, M., Segerström, U., Seppä, H., Vives, G. S., Shumilovskikh, L., Smettan, H. W., Stancikaite, M., Stevenson, A. C., Stivrins, N., Tantau, I., Theuerkauf, M., Tonkov, S., van der Knaap, W. O., van Leeuwen, J. F. N., Vecmane, E., Verstraeten, G., Veski, S., Voigt, R., von Stedingk, H., Waller, M. P., Wiethold, J., Willis, K. J., Wolters, S., and Zernitskaya, V. P.: Testing the Effect of Relative Pollen Productivity on the REVEALS Model: A Validated Reconstruction of Europe-Wide Holocene Vegetation, Land, 12, 986, https://doi.org/10.3390/land12050986, 2023.
Shao, Y., Anhäuser, A., Ludwig, P., Schlüter, P., and Williams, E.: Statistical reconstruction of global vegetation for the last glacial maximum, Global Planet. Change, 168, 67–77, https://doi.org/10.1016/j.gloplacha.2018.06.002, 2018.
Shao, Y., Wegener, C., Klein, K., Schmidt, I., and Weniger, G.-C.: Reconstruction of human dispersal during Aurignacian on pan-European scale, Nat. Commun., 15, 7406, https://doi.org/10.1038/s41467-024-51349-y, 2024.
Stambouli-Essassi, S., Roche, E., and Bouzid, S.: Evolution de la végétation et du climat dans le Nord-ouest, Geo-Eco-Trop, 31, 171–214, 2007.
Staubwasser, M., Drăgu?in, V., Onac, B. P., Assonov, S., Ersek, V., Hoffmann, D. L., and Veres, D.: Impact of climate change on the transition of Neanderthals to modern humans in Europe, P. Natl. Acad. Sci. USA, 115, 9116–9121, https://doi.org/10.1073/pnas.1808647115, 2018.
Aleshinskaya, Z. V., and Gunova, V. S.: History of Nero as reflection on the surrounding landscape dynamics. In: G.P. Kalinin and R.K. Klige (eds.), Problemy Paleohidrologii, Nauka, Moscow, 296 pp, 214–222, https://doi.org/10013/epic.35755.d001, 1976.
Sugita, S.: Theory of quantitative reconstruction of vegetation I: pollen from large sites REVEALS regional vegetation composition, Holocene, 17, 229–241, https://doi.org/10.1177/0959683607075837, 2007.
Sutton, O.: Micrometeorology, Q. J. Roy. Meteorol. Soc., 79, 457–457, https://doi.org/10.1002/qj.49707934125, 1953.
Svensson, A., Andersen, K. K., Bigler, M., Clausen, H. B., Dahl-Jensen, D., Davies, S. M., Johnsen, S. J., Muscheler, R., Rasmussen, S. O., Röthlisberger, R., Peder Steffensen, J., and Vinther, Bo. M.: The Greenland Ice Core Chronology 2005, 15–42 ka. Part 2: comparison to other records, Quaternary Sci. Rev., 25, 3258–3267, https://doi.org/10.1016/j.quascirev.2006.08.003, 2006.
Theuerkauf, M., Couwenberg, J., Kuparinen, A., and Liebscher, V.: A matter of dispersal: REVEALSinR introduces state-of-the-art dispersal models to quantitative vegetation reconstruction, Veget. Hist. Archaeobot., 25, 541–553, https://doi.org/10.1007/s00334-016-0572-0, 2016.
Timmermann, A.: Quantifying the potential causes of Neanderthal extinction: Abrupt climate change versus competition and interbreeding, Quaternary Sci. Rev., 238, 106331, https://doi.org/10.1016/j.quascirev.2020.106331, 2020.
Timmermann, A. and Friedrich, T.: Late Pleistocene climate drivers of early human migration, Nature, 538, 92–95, https://doi.org/10.1038/nature19365, 2016.
Tonkov, S., Lazarova, M., Bozilova, E., Ivanov, D., and Snowball, I.: A 30,000-year pollen record from Mire Kupena, Western Rhodopes Mountains (south Bulgaria), Rev. Palaeobot. Palynol., 209, 41–51, https://doi.org/10.1016/j.revpalbo.2014.06.002, 2014.
Trondman, A.-K., Gaillard, M.-J., Mazier, F., Sugita, S., Fyfe, R., Nielsen, A. B., Twiddle, C., Barratt, P., Birks, H. J. B., Bjune, A. E., Björkman, L., Broström, A., Caseldine, C., David, R., Dodson, J., Dörfler, W., Fischer, E., van Geel, B., Giesecke, T., Hultberg, T., Kalnina, L., Kangur, M., van der Knaap, P., Koff, T., Kuneš, P., Lagerås, P., Latałowa, M., Lechterbeck, J., Leroyer, C., Leydet, M., Lindbladh, M., Marquer, L., Mitchell, F. J. G., Odgaard, B. V., Peglar, S. M., Persson, T., Poska, A., Rösch, M., Seppä, H., Veski, S., and Wick, L.: Pollen-based quantitative reconstructions of Holocene regional vegetation cover (plant-functional types and land-cover types) in Europe suitable for climate modelling, Global Change Biol., 21, 676–697, https://doi.org/10.1111/gcb.12737, 2015.
Trondman, A.-K., Gaillard, M.-J., Sugita, S., Björkman, L., Greisman, A., Hultberg, T., Lagerås, P., Lindbladh, M., and Mazier, F.: Are pollen records from small sites appropriate for REVEALS model-based quantitative reconstructions of past regional vegetation? An empirical test in southern Sweden, Veget. Hist. Archaeobot., 25, 131–151, https://doi.org/10.1007/s00334-015-0536-9, 2016.
Turner, J. and Greig, J. R. A.: Some Holocene pollen diagrams from Greece, Rev. Palaeobot. Palynol., 20, 171–204, https://doi.org/10.1016/0034-6667(75)90020-2, 1975.
Tzedakis, P. C., Frogley, M. R., Lawson, I. T., Preece, R. C., Cacho, I., and de Abreu, L.: Ecological thresholds and patterns of millennial-scale climate variability: The response of vegetation in Greece during the last glacial period, Geology, 32, 109–112, https://doi.org/10.1130/G20118.1, 2004.
Tzedakis, P. C., Emerson, B. C., and Hewitt, G. M.: Cryptic or mystic? Glacial tree refugia in northern Europe, Trends Ecol. Evol., 28, 696–704, https://doi.org/10.1016/j.tree.2013.09.001, 2013.
van Zeist, W. and Bottema, S.: Palynological investigations in western Iran, Palaeohistoria, 19, 19–85, 1977.
van Zeist, W., Woldring, H., and Stapert, D.: Late Quaternary vegetation and climate of southwestern Turkey, Palaeohistoria, 17, 53–143, 1975.
Verbruggen, F., van der Linden, M., Kooistra, L. I., and Beurden, L.: Stille wateren hebben diepe gronden: paleoecologisch onderzoek aan het Pleistoceen en Holoceen van Terneuzen, Nieuwe Sluis, BIAX Consult, 2015.
Vidal-Cordasco, M., Terlato, G., Ocio, D., and Marín-Arroyo, A. B.: Neanderthal coexistence with Homo sapiens in Europe was affected by herbivore carrying capacity, Sci. Adv., 9, eadi4099, https://doi.org/10.1126/sciadv.adi4099, 2023.
Wayne, P., Foster, S., Connolly, J., Bazzaz, F., and Epstein, P.: Production of allergenic pollen by ragweed (Ambrosia artemisiifolia L.) is increased in CO2-enriched atmospheres, Ann. Allergy Asthma Immunol., 88, 279–282, https://doi.org/10.1016/S1081-1206(10)62009-1, 2002.
Weng, C., Hooghiemstra, H., and Duivenvoorden, J. F.: Challenges in estimating past plant diversity from fossil pollen data: statistical assessment, problems, and possible solutions, Divers. Distribut., 12, 310–318, https://doi.org/10.1111/j.1366-9516.2006.00230.x, 2006.
Wieczorek, M. and Herzschuh, U.: Compilation of relative pollen productivity (RPP) estimates and taxonomically harmonised RPP datasets for single continents and Northern Hemisphere extratropics, Earth Syst. Sci. Data, 12, 3515–3528, https://doi.org/10.5194/essd-12-3515-2020, 2020.
Williams, J. W., Grimm, E. C., Blois, J. L., Charles, D. F., Davis, E. B., Goring, S. J., Graham, R. W., Smith, A. J., Anderson, M., Arroyo-Cabrales, J., Ashworth, A. C., Betancourt, J. L., Bills, B. W., Booth, R. K., Buckland, P. I., Curry, B. B., Giesecke, T., Jackson, S. T., Latorre, C., Nichols, J., Purdum, T., Roth, R. E., Stryker, M., and Takahara, H.: The Neotoma Paleoecology Database, a multiproxy, international, community-curated data resource, Quatern. Res., 89, 156–177, https://doi.org/10.1017/qua.2017.105, 2018.
Williamson, P.: Emissions reduction: Scrutinize CO2 removal methods, Nature, 530, 153–155, https://doi.org/10.1038/530153a, 2016.
Willis, K. J. and van Andel, T. H.: Trees or no trees? The environments of central and eastern Europe during the Last Glaciation, Quaternary Sci. Rev., 23, 2369–2387, https://doi.org/10.1016/j.quascirev.2004.06.002, 2004.
Willis, K. J., Rudner, E., and Sümegi, P.: The Full-Glacial Forests of Central and Southeastern Europe, Quatern. Res., 53, 203–213, https://doi.org/10.1006/qres.1999.2119, 2000.
Wohlfarth, B., Tarasov, P., Bennike, O., Lacourse, T., Subetto, D., Torssander, P., and Romanenko, F.: Late Glacial and Holocene Palaeoenvironmental Changes in the Rostov-Yaroslavl' Area, West Central Russia, J. Paleolimnol., 35, 543–569, https://doi.org/10.1007/s10933-005-3240-4, 2006.
Woillard, G. M.: Grande Pile Peat Bog: A Continuous Pollen Record for the Last 140,000 Years, Quatern. Res., 9, 1–21, https://doi.org/10.1016/0033-5894(78)90079-0, 1978.
Woillez, M.-N., Kageyama, M., Combourieu-Nebout, N., and Krinner, G.: Simulating the vegetation response in western Europe to abrupt climate changes under glacial background conditions, Biogeosciences, 10, 1561–1582, https://doi.org/10.5194/bg-10-1561-2013, 2013.
Woodbridge, J., Fyfe, R. M., and Roberts, N.: A comparison of remotely sensed and pollen-based approaches to mapping Europe's land cover, J. Biogeogr., 41, 2080–2092, https://doi.org/10.1111/jbi.12353, 2014.
Yaworsky, P. M., Nielsen, E. S., and Nielsen, T. K.: The Neanderthal niche space of Western Eurasia 145 ka to 30 ka ago, Sci. Rep., 14, 7788, https://doi.org/10.1038/s41598-024-57490-4, 2024.
Zagwijn, W. H.: Vegetation, climate and radiocarbon datings in the Late Pleistocene of the Netherlands. II. Middle Weichselian, Mededelingen van de Rijks Geologische Dienst, Nieuwe Serie 14(2) and 25(3), Rijks Geologische Dienst, 1974.
Zanon, M., Davis, B. A. S., Marquer, L., Brewer, S., and Kaplan, J. O.: European Forest Cover During the Past 12,000 Years: A Palynological Reconstruction Based on Modern Analogs and Remote Sensing, Front. Plant Sci., 9, https://doi.org/10.3389/fpls.2018.00253, 2018.
Zeder, M. A.: The Origins of Agriculture in the Near East, Curr. Anthropol., 52, S221–S235, https://doi.org/10.1086/659307, 2011.
- Abstract
- Introduction
- Methods
- Results and discussion
- Data reliability
- Code availability
- Data availability
- Conclusions
- Outlook
- Appendix A: Pollen archives used in this study
- Appendix B: Site availability per time window
- Appendix C: Taxon classification and land-cover types (LCTs)
- Appendix D: Data reliability per taxon/LCT before and after data aggregation
- Author contributions
- Competing interests
- Disclaimer
- Acknowledgements
- Financial support
- Review statement
- References