the Creative Commons Attribution 4.0 License.
the Creative Commons Attribution 4.0 License.
 | 10 Feb 2025
cigFacies: a massive-scale benchmark dataset of seismic facies and its application
Xiaoming Sun
Mingcai Hou
Hang Gao
Guangyu Wang
Hanlin Sheng
Seismic facies classification is crucial for seismic stratigraphic interpretation and hydrocarbon reservoir characterization but remains a tedious and time-consuming task that requires significant manual effort. Data-driven deep-learning approaches are highly promising for automating the seismic facies classification with high efficiency and accuracy, as they have already achieved significant success in similar image classification tasks within the field of computer vision (CV). However, unlike the CV domain, the field of seismic exploration lacks a comprehensive benchmark dataset for seismic facies, severely limiting the development, application, and evaluation of deep-learning approaches in seismic facies classification. To address this gap, we propose a comprehensive workflow to construct a massive-scale benchmark dataset of seismic facies and evaluate its effectiveness in training a deep-learning model. Specifically, we first develop a knowledge graph of seismic facies based on geological concepts and seismic reflection configurations. Guided by the graph, we then implement the three strategies of field seismic data curation, knowledge-guided synthesization, and generative adversarial network (GAN)-based generation to construct a benchmark dataset of 8000 diverse samples for five common seismic facies. Finally, we use the benchmark dataset to train a network and then apply it to two 3-D seismic data for automatic seismic facies classification. The predictions are highly consistent with expert interpretation results, demonstrating that the diversity and representativeness of our benchmark dataset are sufficient to train a network that can be generalized well in seismic facies classification across field data. We have made this dataset (https://doi.org/10.5281/zenodo.10777460, Gao et al., 2024a), the trained model, and the associated codes (https://doi.org/10.5281/zenodo.13150879, Gao et al., 2024b) publicly available for further research and validation of intelligent seismic facies classification.
- Article
(18402 KB) - Full-text XML
- BibTeX
- EndNote


Seismic facies classification aims to delineate individual units based on specific reflection characteristics (e.g., reflection configuration, continuity, amplitude, and frequency contents), which is a fundamental and essential step in seismic stratigraphic analysis and contributes to the interpretation of sedimentary environments and hydrocarbon reservoir distributions (Sheriff, 1976; Sangree and Widmier, 1977; Veeken, 2006; Jia et al., 2007; Xu and Haq, 2022). With the dramatic increase in the amount of 3-D seismic data, the manual interpretation method is typically labor-intensive and relies heavily on experienced experts. Thus, automatic seismic facies classification is the trend. Moreover, the development of automatic seismic facies classification approaches benefits accurate and efficient analyses of depositional environments and lithologic distributions.
In recent years, many methods have been proposed for automatic seismic facies classification by using supervised, semi-supervised, and unsupervised learning. Supervised learning methods (Wrona et al., 2018; Zhao, 2018; Liu et al., 2018; Zhang et al., 2021) first use large amounts of labeled data to train a convolutional neural network (CNN) model and then use the trained model for automatic seismic facies classification. Semi-supervised learning methods (Qi et al., 2016; Dunham et al., 2020; Liu et al., 2020) use both labeled and unlabeled data to train the network to learn the features and distributions characterizing seismic facies. Unsupervised learning methods (Qian et al., 2018; Zhao et al., 2018; Duan et al., 2019; Puzyrev and Elders, 2022; Li et al., 2023) first extract the nonlinear, discriminant, and invariant features from the unlabeled data and then cluster or classify these features for automatic seismic facies classification. The supervised learning methods often exhibit weak generalization capabilities across different surveys due to a lack of labeled samples, while the semi-supervised and unsupervised methods frequently encounter issues with high uncertainty in the prediction results. In addition, seismic facies can be classified into several different categories based on different attribute parameters, which leads to challenges in the construction of seismic facies datasets and the assessment of the results.
To solve these problems, developing a knowledge graph of seismic facies and using it to provide guidelines for constructing a benchmark dataset is considered an effective methodology. A knowledge graph is a graphical representation model consisting of entities (nodes) and relationships (edges) that aims to represent knowledge in the form of graphs (Paulheim, 2017; Fensel et al., 2020; Hogan et al., 2021). To date, knowledge-driven geoscience big-data studies have been successfully applied in various kinds of geoscience data-mining tasks (Zhou et al., 2021; Ma et al., 2023; Zhang et al., 2023; Hu et al., 2023). In this work, we construct a knowledge graph of seismic facies that is grounded in geological concepts and seismic reflection patterns. This graph guides our processes of data selection, label generation, analysis, and result assessment.
Currently, the construction of the dataset relies primarily on manually interpreted field data and labeled synthetic data. To address the lack of representative benchmark datasets for seismic facies and to improve the automatic classification, we implement a comprehensive workflow of three strategies (field data curation, knowledge-guided synthesization, and generative adversarial network (GAN)-based generation) shown in the left blue box in Fig. 1 to construct a massive-scale, feature-rich, and high-realism benchmark dataset of seismic facies and use it to train a CNN model for the accurate and efficient seismic facies classification shown in the right red box in Fig. 1.
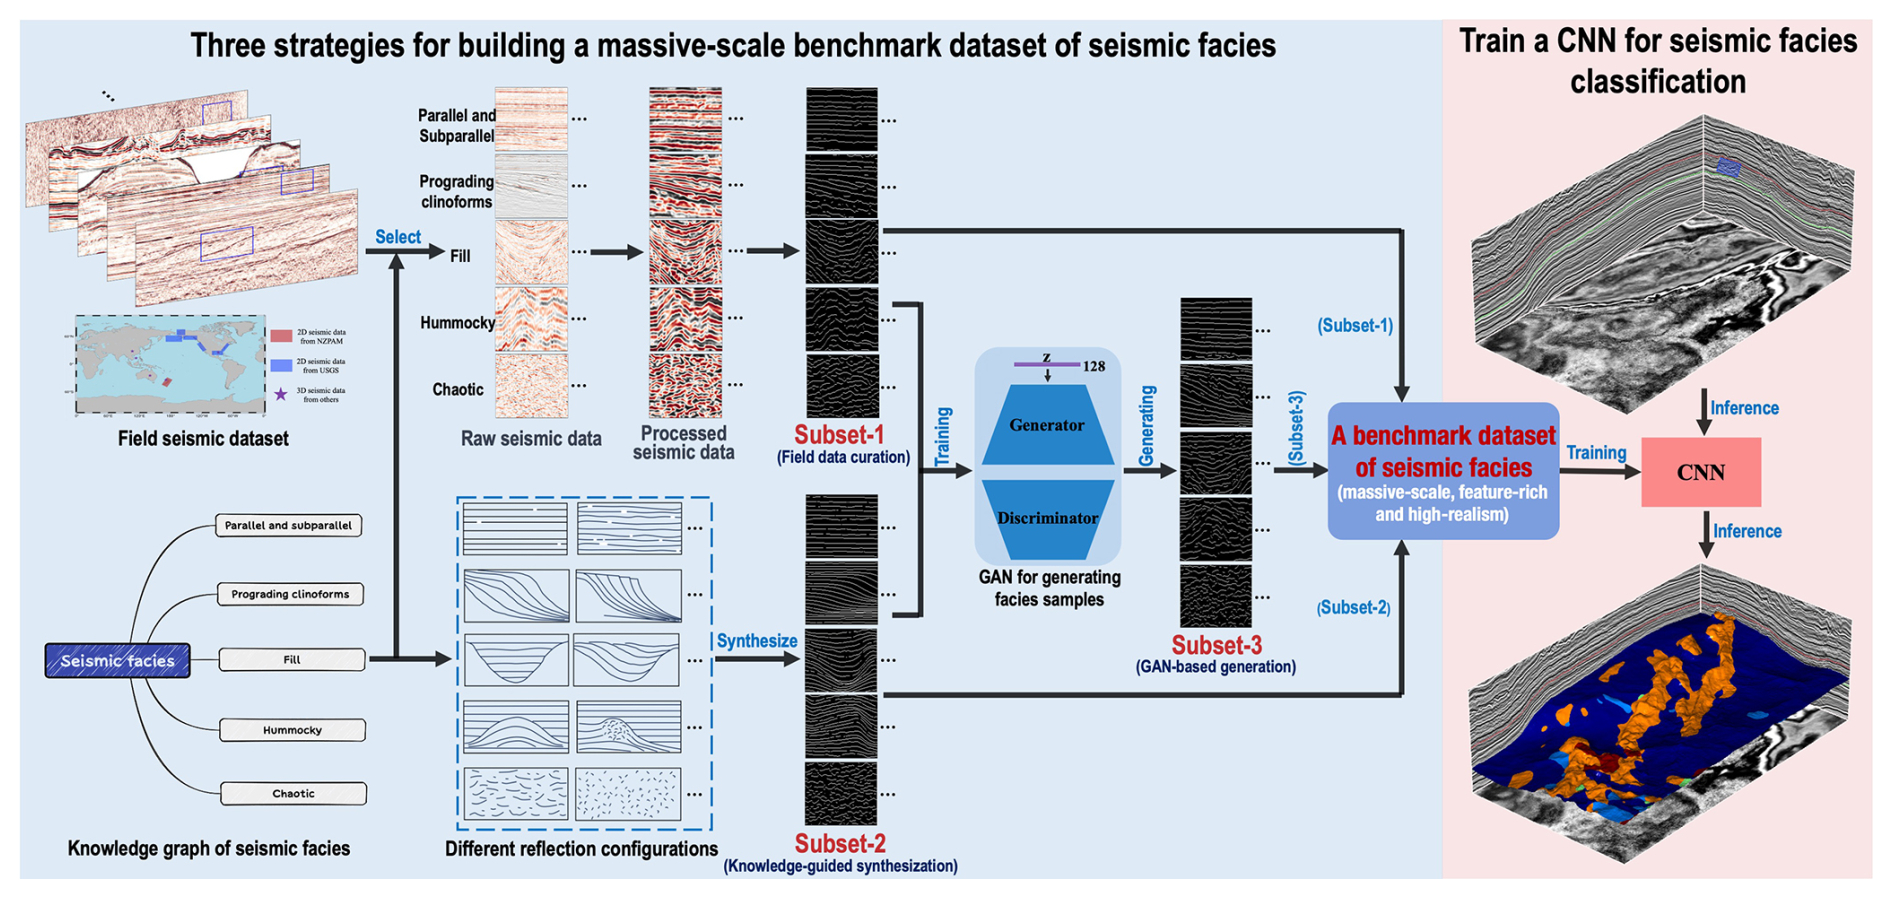
Figure 1The workflow for constructing a massive-scale, feature-rich, and high-realism benchmark dataset of seismic facies (blue box) and deep learning for seismic facies classification (red box). We first develop a knowledge graph of seismic facies based on geological concepts and seismic facies configurations. Guided by the graph, we implement the three strategies of field seismic data curation, knowledge-guided synthesization, and AI-based generation to construct a massive-scale benchmark dataset. Finally, we use the benchmark dataset to train a CNN model and then apply it to 3-D field seismic data for automatic seismic facies classification.
In this section, we initially construct a knowledge graph of seismic facies based on the geological concepts and seismic facies configurations. Guided by the graph, we develop three strategies to construct the benchmark dataset of seismic facies (Fig. 1). The first strategy is to build field samples from field data curation with raw data collection, data standardization, and skeletonization processes. The second strategy is to build synthetic samples from knowledge-guided synthesization by synthesizing geological structural curves. The final strategy is to build synthetic samples from artificial intelligence (AI)-based generation with a GAN model.
2.1 Knowledge graph of seismic facies
Before constructing the massive-scale benchmark dataset of seismic facies, it is necessary to develop a knowledge graph of seismic facies based on the geological concepts and seismic reflection configurations, which can provide guidelines for preparing representative dataset samples and assessing facies classification results. Based on specific seismic reflection configurations, seismic facies can be roughly divided into parallel and subparallel, prograding clinoforms, fill, hummocky, chaotic, divergent, wave, and reflection-free (Mitchum et al., 1977a, b; Veeken, 2006; Xu and Haq, 2022) (Fig. 2). These seismic facies can be subdivided further based on several independent parameters, such as reflection configurations, continuity, amplitude, and frequency. For example, parallel and subparallel reflections can be subdivided into 27 different types based on frequency (high, middle, and low), amplitude (strong, moderate, and week) and continuity (excellent, medium, and poor). Based on different reflection patterns, prograding clinoforms, fill, and hummocky can be subdivided further into five (sigmoid, oblique, shingled, parallel, and complex), six (onlap, prograded, mounded onlap, divergent, chaotic, and complex), and four (fan complex, mound, blanking, and chaotic) types, respectively.
As shown in Fig. 2, we develop a knowledge graph of seismic facies and illustrate the typical seismic reflection configurations for eight types of seismic facies. However, considering the requirements for data amount and diversity in this work, we take the five most common seismic facies (parallel and subparallel, prograding clinoforms, fill, hummocky, and chaotic) as examples to explain how to construct a massive-scale, feature-rich, and high-realism benchmark dataset of seismic facies from field data curation, knowledge-guided synthesization, and GAN-based generation.

Figure 2Knowledge graph of seismic facies and the corresponding typical seismic reflection configurations (Mitchum et al., 1977a, b; Xu and Haq, 2022). In this graph, we roughly divided the seismic facies into eight types (parallel and subparallel, prograding clinoforms, fill, hummocky, chaotic, divergent, wave, and reflection-free) based on specific seismic reflection configurations. In addition, we subdivided these seismic facies based on several independent parameters such as reflection configuration, continuity, amplitude, and frequency, and we illustrate the typical seismic reflection configurations for each type of seismic facies.
2.2 Building facies samples by field data curation
We start building our benchmark dataset by employing the field seismic data curation strategy with a series of steps, i.e., raw data collection, manual interpretation and classification, bandpass filtering, resampling, amplitude equalization, and skeletonization. We first collect almost 4000 global publicly available 2-D seismic profiles and 10 3-D seismic data from the United States Geological Survey (USGS), New Zealand Petroleum & Minerals (NZPAM), the South Australian Resources Information Gateway (SARIG), and the Society of Exploration Geophysicists (SEG). These 2-D and 3-D seismic data amount to around 130 G and are primarily located in the Gulf of Mexico, on the eastern and western coasts of the United States, in Alaska, in the Bering Sea, in the Beaufort Sea, in New Zealand, in South Australia, and in the Sichuan Basin (see the data distribution map in Fig. 1).
We then manually select, crop, and classify these field seismic data based on the knowledge graph (Fig. 2). As shown in the raw seismic data of Fig. 3, in total we collect 1000, 700, 500, 500, and 700 2-D raw seismic data for five common seismic facies. However, due to the different data sources, depositional environments, and data processing methods, these raw seismic data have large differences in their sampling rates, amplitudes, and frequency distributions (as shown in Figs. 3 and 4a) among the same and different classes of seismic facies. These data variations and uncertainties are not related to the seismic facies. Moreover, they may pose significant obstacles to deep-learning models when learning crucial features such as texture patterns and reflection configurations, which are essential for identifying seismic facies categories. To eliminate such uncertainties in building our standard benchmark dataset, we introduce the data standardization process (Fig. 4) for each raw seismic datum, including filtering, resampling, amplitude equalization, and frequency equalization. After applying the data standardization process, the processed seismic data are significantly improved in the consistency of the sampling rates, amplitudes, and frequency distributions (as shown in Figs. 3b and 5). Finally, we retain the main geological structure information of strata by keeping only the waveform peaks as ones and setting zeros elsewhere to obtain the corresponding field skeletonization images shown in Figs. 3c and 6.
Compared to the skeletonization images (Fig. 4d) obtained directly from the raw seismic data, the ones (Fig. 4c) with data standardization can more clearly reflect the geological structure characteristics and enhance the consistency among the same and different classes of seismic facies. The whole curation strategy, particularly the data standardization processes and skeletonization, eliminates uncertainties inherent in field data from various surveys. This approach only retains the texture patterns associated with seismic facies to produce standardized images for constructing the benchmark dataset. The same processing techniques will also be applied to inference data to ensure that a deep-learning model trained on this dataset achieves consistent predictions.
However, the facies samples from these field seismic datasets only are imbalanced in the categories and lack diversity, and therefore they are not sufficient for building a massive-scale and representative benchmark dataset. For example, parallel and subparallel data are more common than fill or hummocky data in field seismic datasets. Additionally, some specific patterns (e.g., parallel prograding clinoforms, chaotic fill, complex fill, and blanking hummocky) are rare in these publicly available field seismic data.
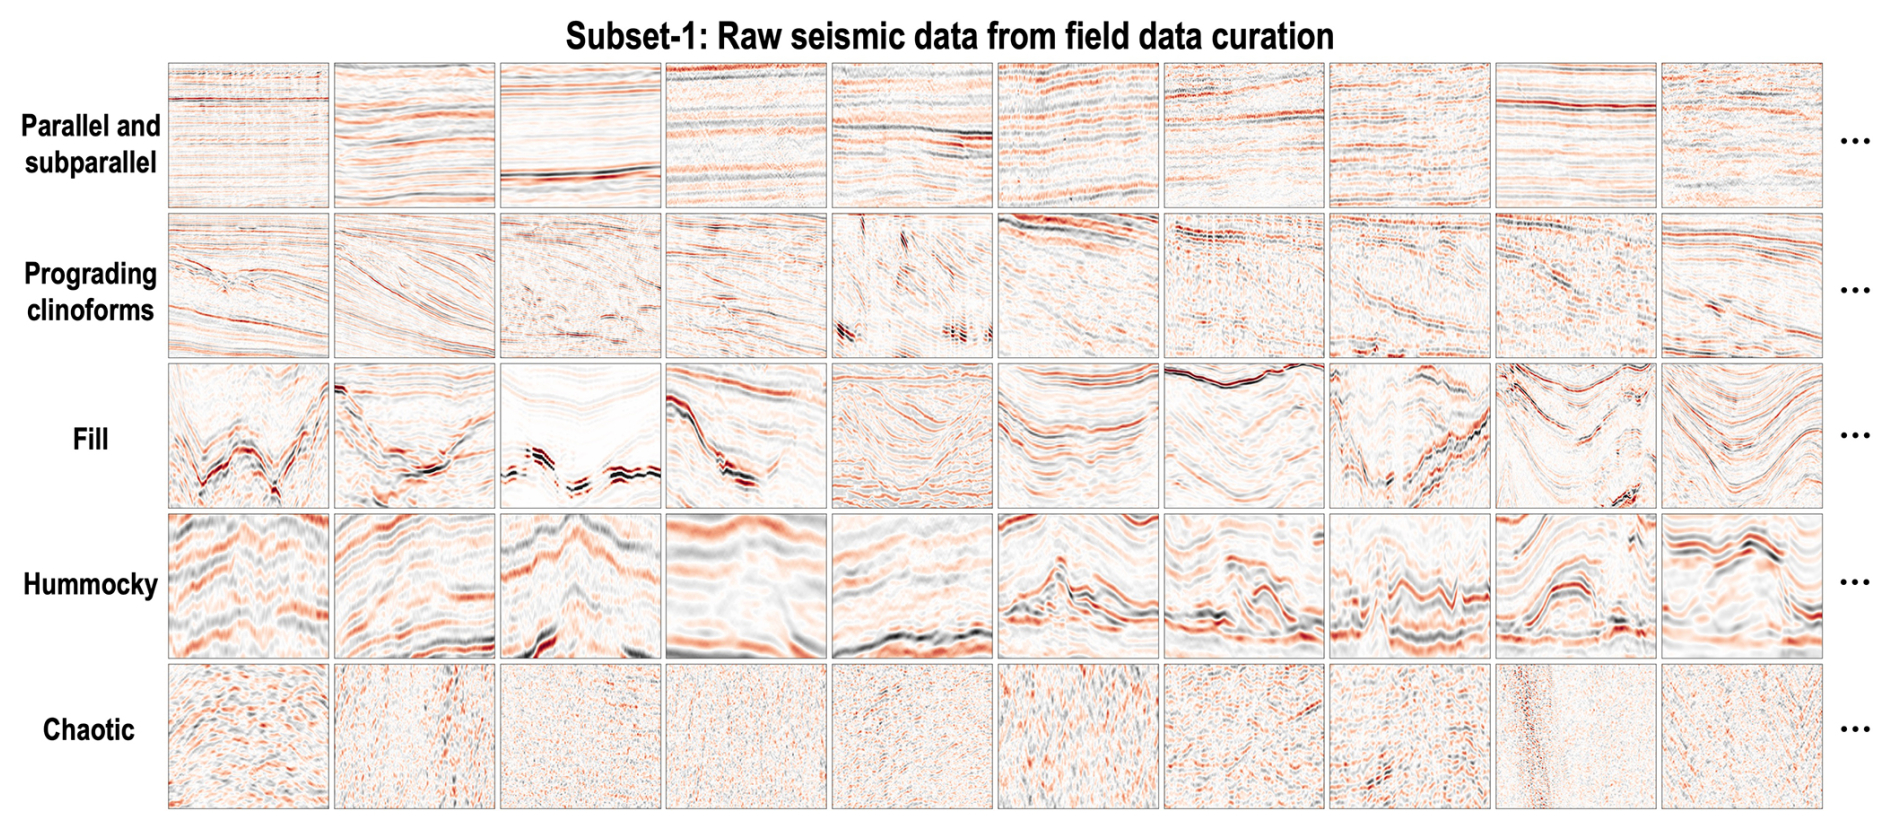
Figure 3Subset-1: raw seismic data manually collected and interpreted from the large number of publicly available seismic datasets. In total, we select, crop, and classify 1000, 700, 500, 500, and 700 2-D raw seismic data for parallel and subparallel, prograding clinoforms, fill, hummocky, and chaotic, respectively.
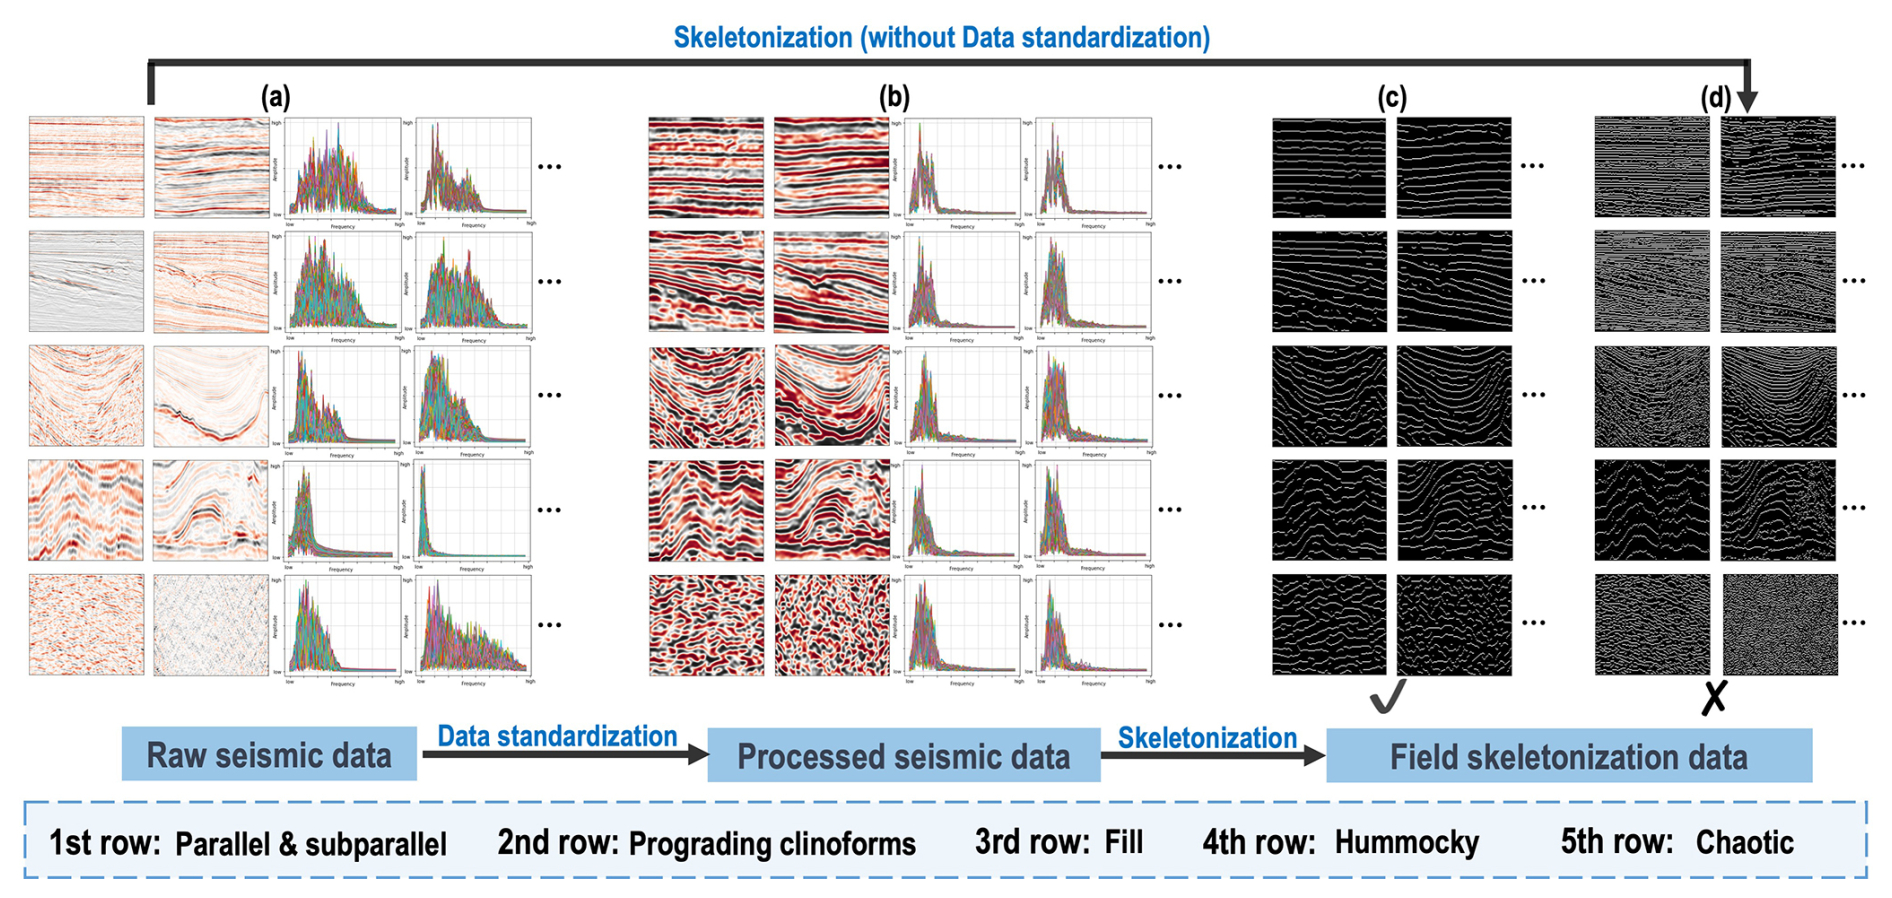
Figure 4The workflow for constructing the field samples from field seismic data curation. We first manually collect and interpret raw seismic data (a). Then we introduce a data standardization process for all the raw seismic data to improve the consistency of the sampling rates, amplitudes, and frequency distributions. After obtaining the processed seismic data (b), we retain the main geological structure information of the strata by keeping the waveform peaks as ones and setting zeros elsewhere to obtain the corresponding field skeletonization images (c). Furthermore, the skeletonization images (d) obtained directly from the raw seismic data (without standardization) exhibit significant uncertainties and variations.
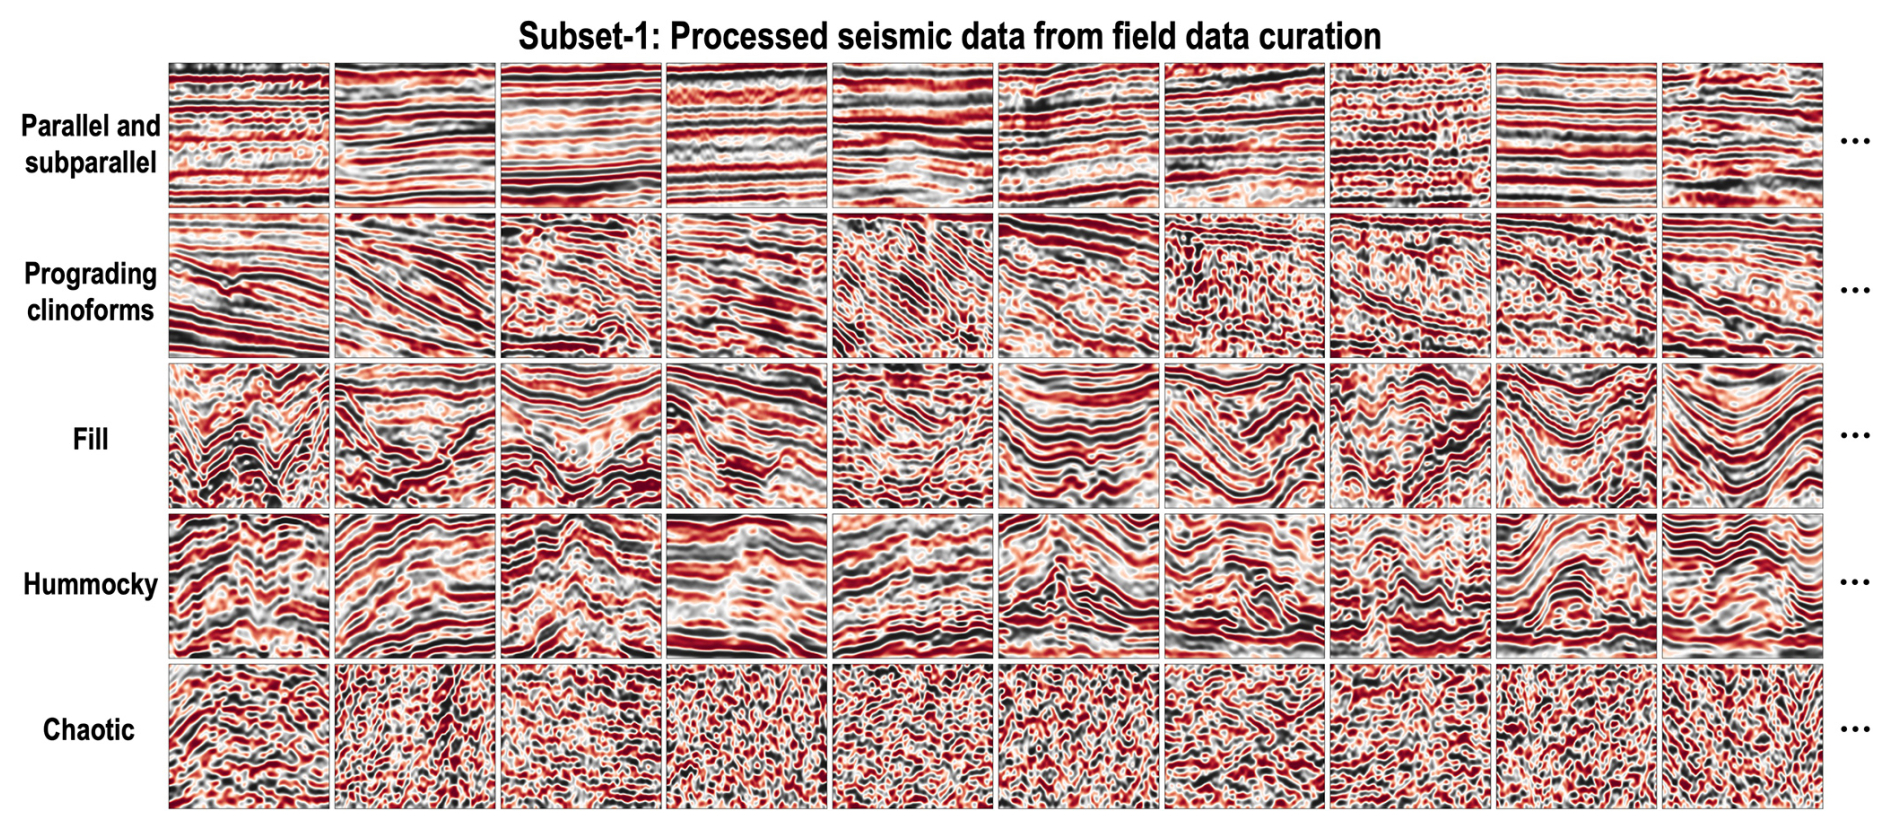
Figure 5Subset-1: processed seismic data generated from the raw seismic data by applying the data standardization processes. Compared to the raw seismic data, the processed seismic data exhibit significant improvements in the consistency of the sampling rates, amplitudes, and frequency distributions.

Figure 6Subset-1: field facies samples generated from the processed seismic data by applying the skeletonization process. After obtaining the processed seismic data, we retain the main geological structure information of the strata to generate the corresponding field skeletonization images. Finally, we use the first strategy to manually select 1000, 700, 500, 500, and 700 field facies samples for five common seismic facies.
2.3 Building facies samples from knowledge-guided synthesization
In order to overcome the sample imbalance and improve the diversity of the dataset, we further develop the second strategy to automatically generate synthetic facies samples based on the knowledge graph of seismic facies and independent seismic reflection configurations. We first define the different geological structural curves by using the following geometric functions:
where x and z represent the positions in the crossline and depth directions, respectively. Other parameters (z0, k0, k1, k2, and k3) are used to control the geometry and distribution of the geological structural curves. We then set different combinations of geological structural curves based on different seismic facies categories. Additionally, we randomly set shape parameters for these geological structural curves and combine them at random intervals to enhance their diversity. Furthermore, we first define some key points for some complex geological structures and then generate the corresponding geological structural curves by applying an interpolation process. After generating these different geological structural curves, we add random noise and apply a random local mask to each curve to improve the realism of the synthetic curves. Finally, we set ones on the geological structural curves and zeros elsewhere to generate the corresponding synthetic skeletonization data.
In this way, we randomly generate synthetic facies samples for each type of seismic facies, especially some specific patterns that are rare in field data curation, thus complementing the benchmark dataset of seismic facies. Finally, we automatically generate 500 synthetic facies samples for the five common seismic facies shown in Fig. 7. Compared to the field facies samples shown in Fig. 6, the synthetic facies samples generated from knowledge-guided synthesization contain more diverse patterns and reduce sample imbalance. However, these synthetic facies samples may be ideally patterned and lack realism.
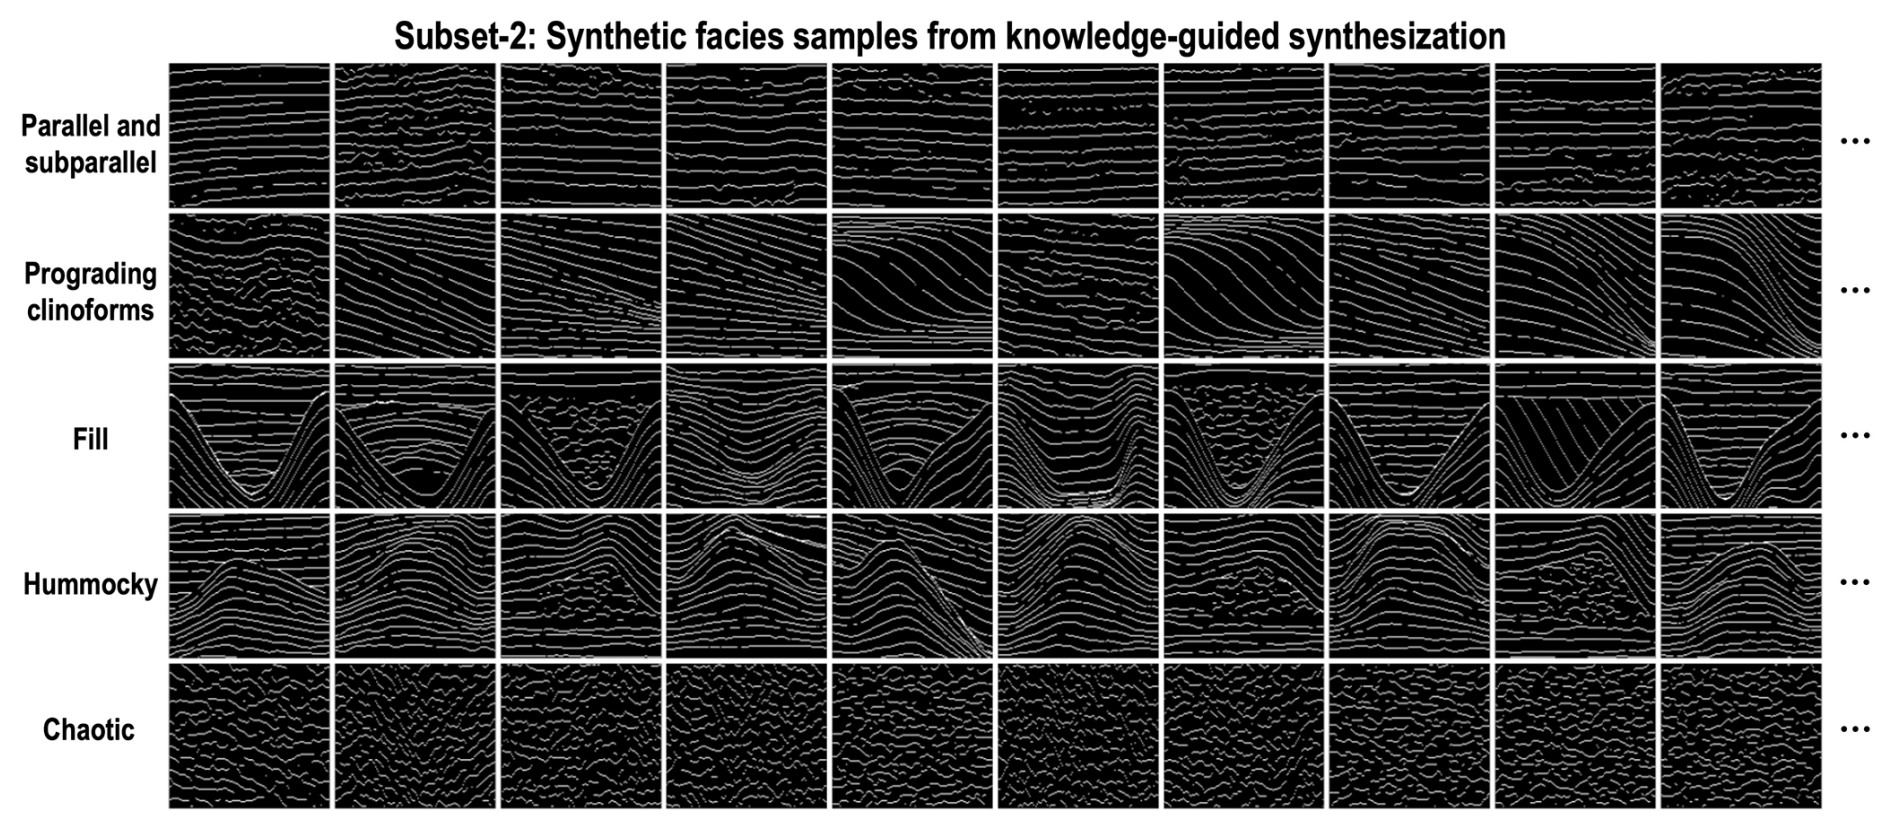
Figure 7Subset-2: synthetic facies samples generated from knowledge-guided synthesization. In this strategy, we first construct some geological structural curves from geometric functions or interpolation processes. Then we add random noise and a mask for each curve to improve the realism of the synthetic facies samples. Finally, we use the second strategy to automatically generate 500 synthetic facies samples with more diverse patterns for each seismic facies.
2.4 Building facies samples from GAN-based generation
As shown in subset-1 and subset-2 in Figs. 6, 7, and 8a, b, the field facies samples have high realism but low diversity, while the synthetic facies samples have high diversity but low realism. In order to construct a comprehensive benchmark dataset of seismic facies, we develop the final strategy of GAN-based generation (Fig. 8) to build more facies samples with both high diversity and high realism.
As shown in Fig. 8c, the architecture of the deep-learning network used in this work is modified from the progressive growing of GANs proposed by Karras et al. (2017). Traditionally, progressive growing of GANs consists of a generator model (G) and a discriminator model (D), where G is used to capture the data distribution and generate fake images to resemble the training dataset (real images) and D is used to assess the probability of images being real or fake. G is composed of a Gen-1 module, five Gen-2 modules, and a Conv1×1 layer, where the Gen-1 module consists of a 4×4 convolutional layer and a 3×3 convolutional layer and the Gen-2 module consists of an upsampling layer and two 3×3 convolutional layers. D is composed of a Conv1×1 layer, five Dis-1 modules, and a Dis-2 module, where the Dis-1 module consists of two 3×3 convolutional layers and an average pooling layer and the Dis-2 module consists of a minibatch stddev layer, a 3×3 convolutional layer, a 4×4 convolutional layer, a flattened layer, and a linear layer. Compared to traditional GANs, the progressive growing of GANs does not directly generate high-resolution images but starts by generating simple low-resolution images and then continuously increasing the resolution of the generated images during the network training. This training strategy allows the network to learn the features of the training dataset from coarse to fine scales, resulting in a faster training speed, higher stability, and better-quality images. In addition, we use the Wasserstein GAN with a gradient penalty (WGAN-GP) loss proposed by Gulrajani et al. (2017) as the GANs loss function ℒ(G, D) to optimize the network.
We combine subset-1 and subset-2 as training datasets to train the progressive growing of GANs. Initially, we first train a simple network consisting of a Gen-1 module, two Conv1×1 layers, and a Dis-2 module to generate and access the real and fake facies samples at a 4×4 scale. After stabilizing the training of this simple network, we incorporate a Gen-2 module and a Dis-1 module into it to double the resolutions of G and D. In this way, our network will progressively grow to steadily generate high-resolution (128×128) facies samples. Finally, we use the trained G to automatically generate 500 facies samples for each type of seismic facies shown in subset-3 in Figs. 8d and 9. Compared to subset-1 and subset-2, the facies samples constructed by the GAN-based generation have both high diversity and high realism.
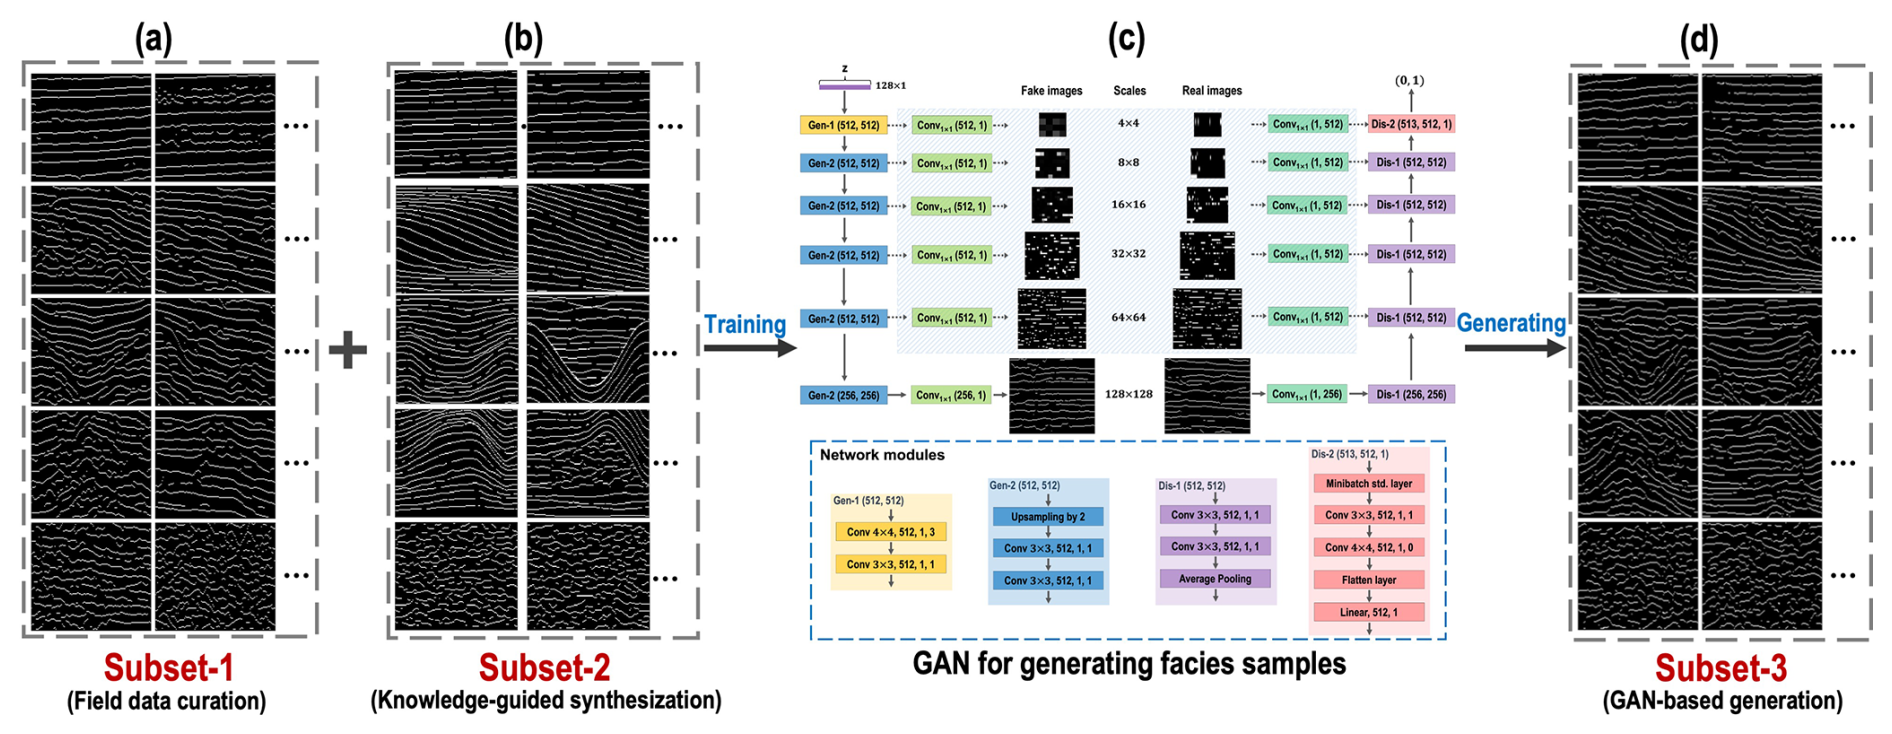
Figure 8The workflow for constructing the synthetic samples from GAN-based generation. In this strategy, we first use subset-1 (a) and subset-2 (b) generated with the first and second strategies to train the progressive growing of GANs (c), and then we use the trained G to automatically generate synthetic facies samples (d) for each type of seismic facies.
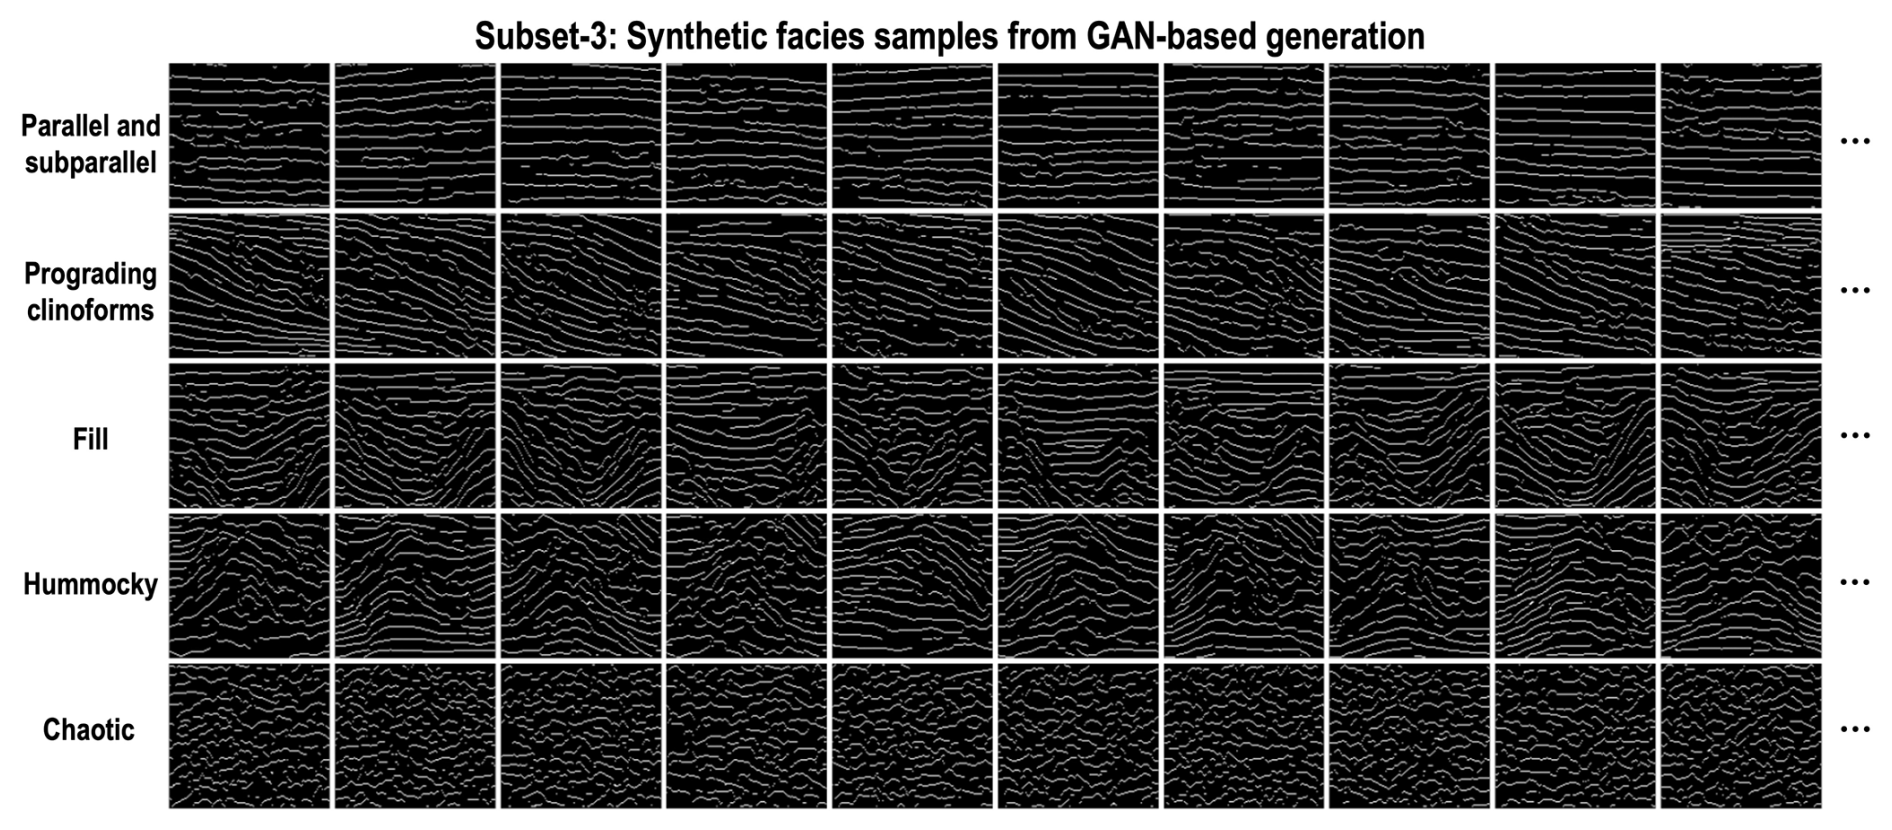
Figure 9Subset-3: synthetic facies samples from GAN-based generation. In total, we use the third strategy to automatically generate 500 synthetic facies samples with both high diversity and high realism for each type of seismic facies.
2.5 The final benchmark dataset of seismic facies
After applying the three strategies of field data curation, knowledge-guided synthesization, and GAN-based generation to generate diverse facies samples, we construct a massive-scale, feature-rich, and high-realism benchmark dataset of seismic facies, and we display some facies samples in Figs. 6–9. As shown in Fig. 10, finally we generate totals of 2000, 1500, 1500, 1500, and 1500 diverse facies samples (128 [inline] × 128 [time]) for five common seismic facies (parallel and subparallel, prograding clinoforms, fill, hummocky, and chaotic). The final benchmark dataset, named cigFacies, has been made publicly available at https://doi.org/10.5281/zenodo.10777460 (Gao et al., 2024a).
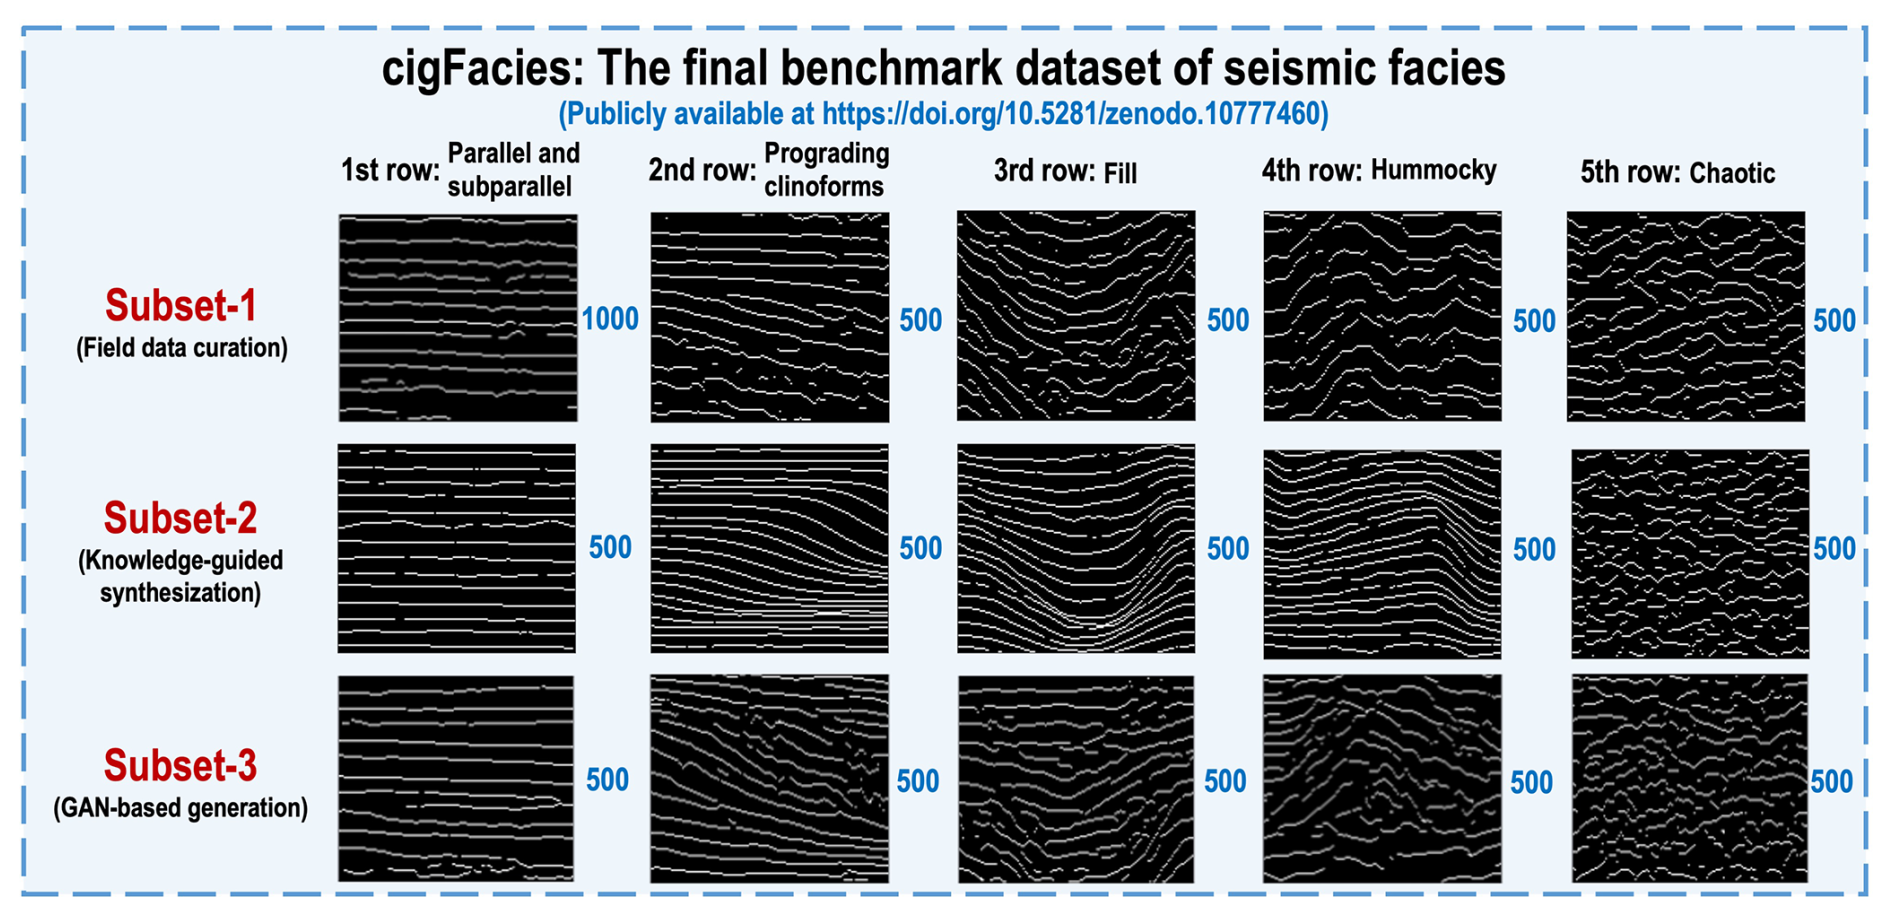
Figure 10cigFacies: the final benchmark dataset of seismic facies constructed from the three strategies of field data curation, knowledge-guided synthesization, and GAN-based generation. In this dataset, we generate totals of 2000, 1500, 1500, 1500, and 1500 diverse facies samples (128 [inline] × 128 [time]) for five common seismic facies (parallel and subparallel, prograding clinoforms, fill, hummocky, and chaotic).
After constructing the comprehensive benchmark dataset of seismic facies (Fig. 10), we use it to train a simple CNN for the seismic facies classification task shown in the right red box in Fig. 1. In this study, we first use 6400 samples to train the model and another 1600 samples for the validation. Then we develop a prediction workflow to apply the trained network to automatic seismic facies classification in the 3-D field seismic data.
3.1 Training and validation
We consider seismic facies classification to be an image classification problem with the goal of classifying 3-D field seismic data according to the corresponding seismic facies (e.g., parallel and subparallel, prograding clinoforms, fill, hummocky, and chaotic). In this study, we use a simple deep-learning network (ResNet-50) proposed by He et al. (2016) (Fig. 11a) to implement automatic seismic facies classification. We train and validate our CNN model by using 6400 and 1600 random pairs of facies samples. In addition, in order to improve the diversity of the dataset, we apply random data augmentation strategies (e.g., flip, translation, crop, or resize) for each facies sample before feeding them into the network. We train our network by using the following cross-entropy loss function ℒ:
where N denotes the number of classes and xi and yi represent the one-hot prediction and label for the ith class. Considering the computation time and memory, we set the batch size to 32 and use the Adam optimizer to optimize the network parameters. In the training process, we start the learning rate at 0.01 and adaptively reduce the learning rate by half when the training metric stagnates within two epochs. As shown in Fig. 11b, c, both the training loss and validation loss converge to 0.006 and 0.1, while the learning rate decreases from 0.01 to 0.00001 after 200 epochs.
To verify the performance of the trained network, we first apply it to the validation dataset, which is not included in the training dataset. As shown in Fig. 11d, the predicted results are highly consistent with the labels. In addition, the predicted accuracies for the five common seismic facies in the validation dataset can be up to 97.75 %, 99 %, 99.67 %, 97.33 %, and 98.33 %, which indicates that the trained network has successfully learned automatic seismic facies classification.
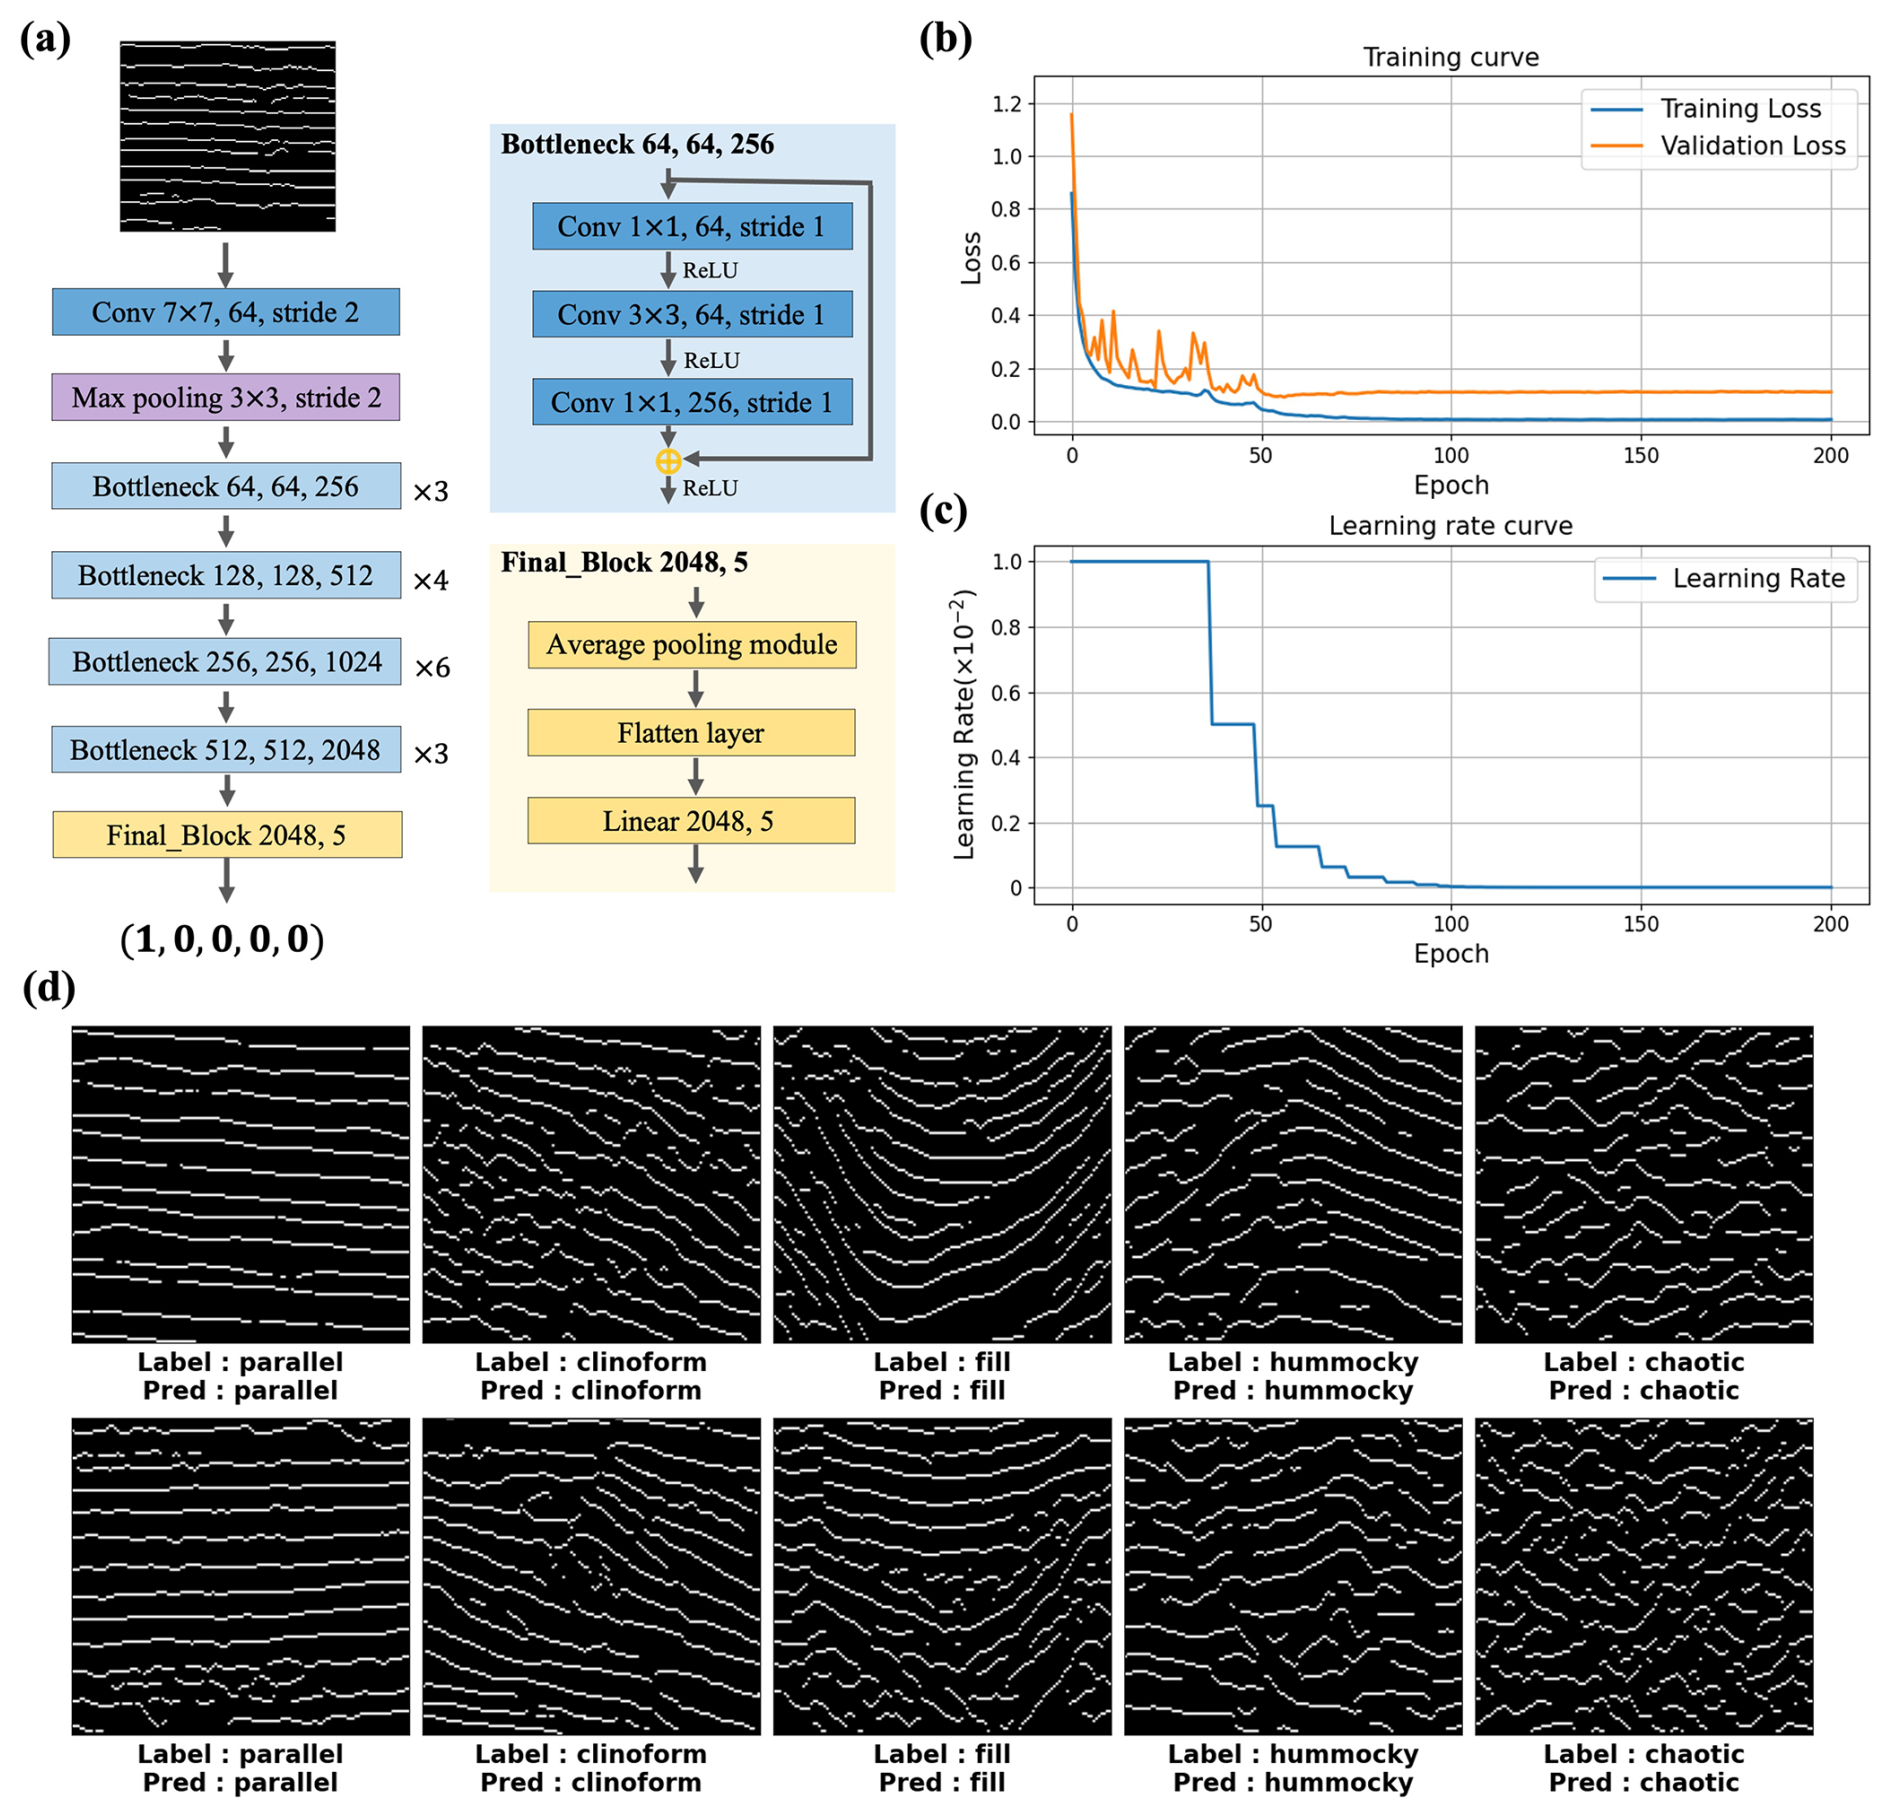
Figure 11(a) The architecture of the deep neural network (ResNet-50) used in this work for automatic seismic facies classification. The training (blue) and validation (orange) loss curves (b) and the learning rate curve (c) during network training are shown. After training the network, we apply it to the validation dataset to verify its performance. The predicted results are consistent with the labels (d), which demonstrates that the trained network has successfully learned to automatically classify the seismic facies.
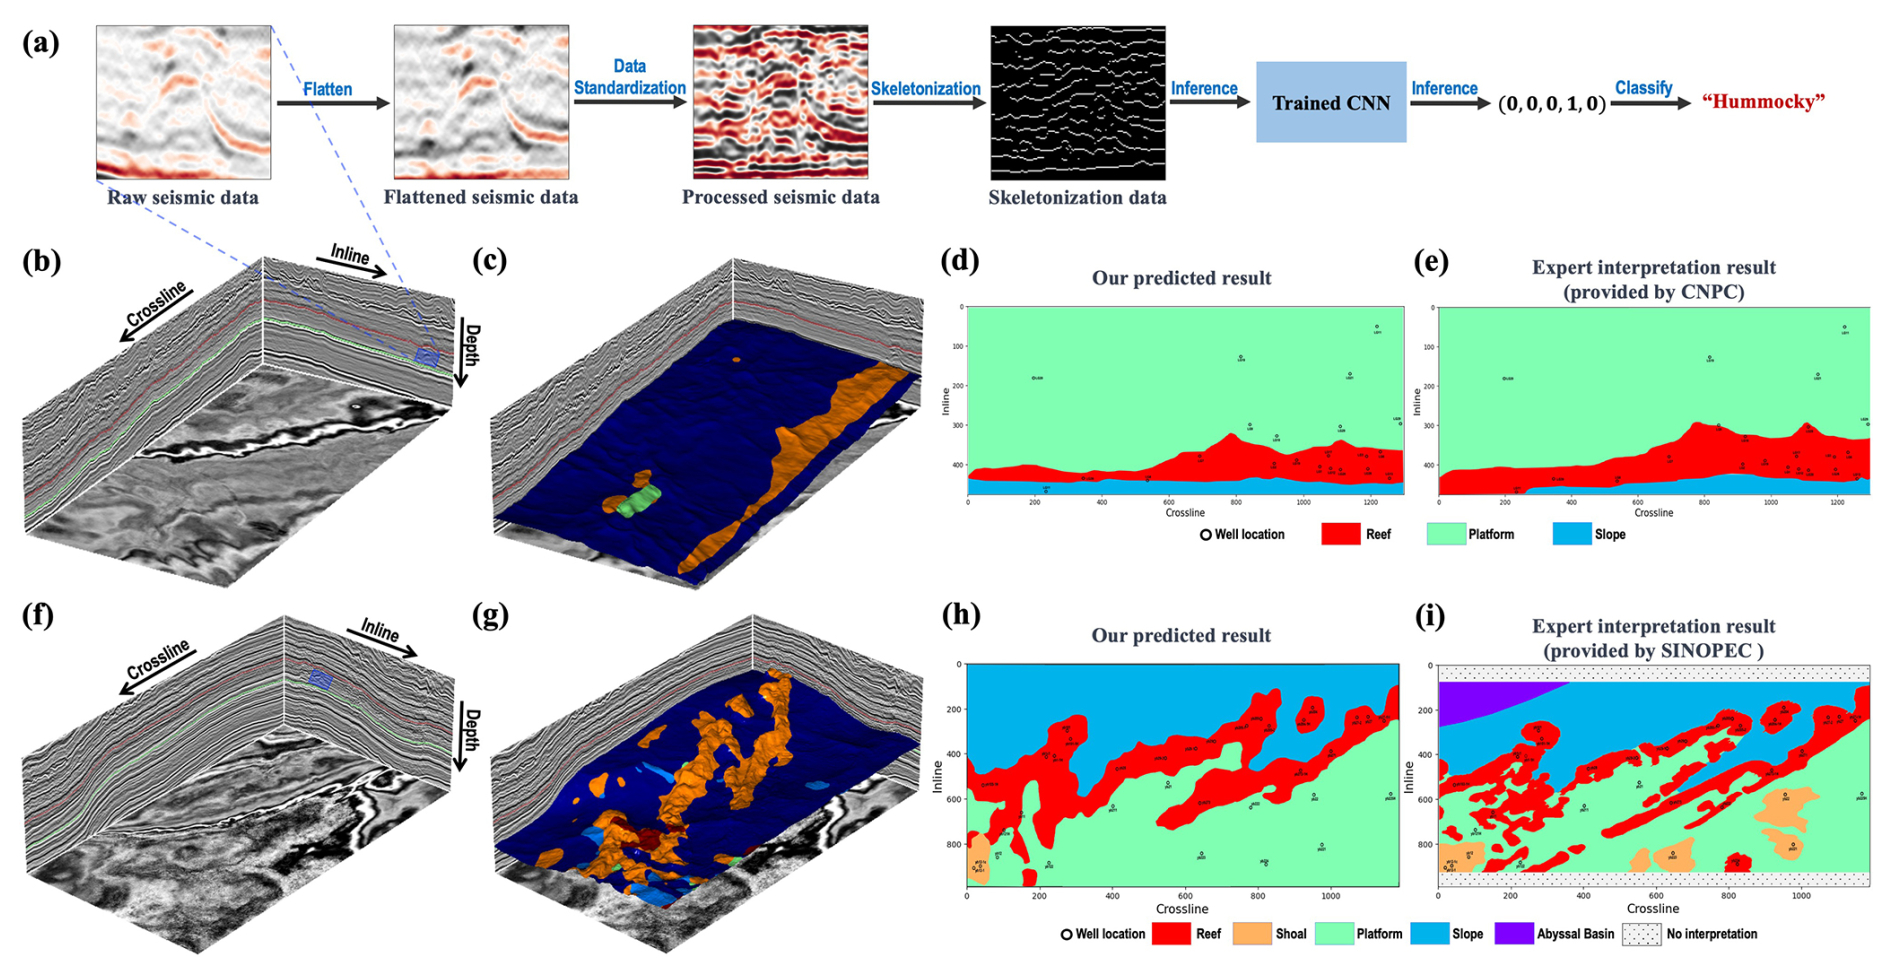
Figure 12We employ the prediction workflow (a) with a sliding window scanning the entire 3-D target section in the 3-D seismic data (b, f), yielding the seismic facies classification results (c, g). Then we obtain the corresponding sedimentary facies results (d, h) based on the predicted seismic facies results, well log information, seismic data, and geological and geophysical knowledge. Compared to the expert interpretation results (e, i), our predicted sedimentary facies results are highly consistent.
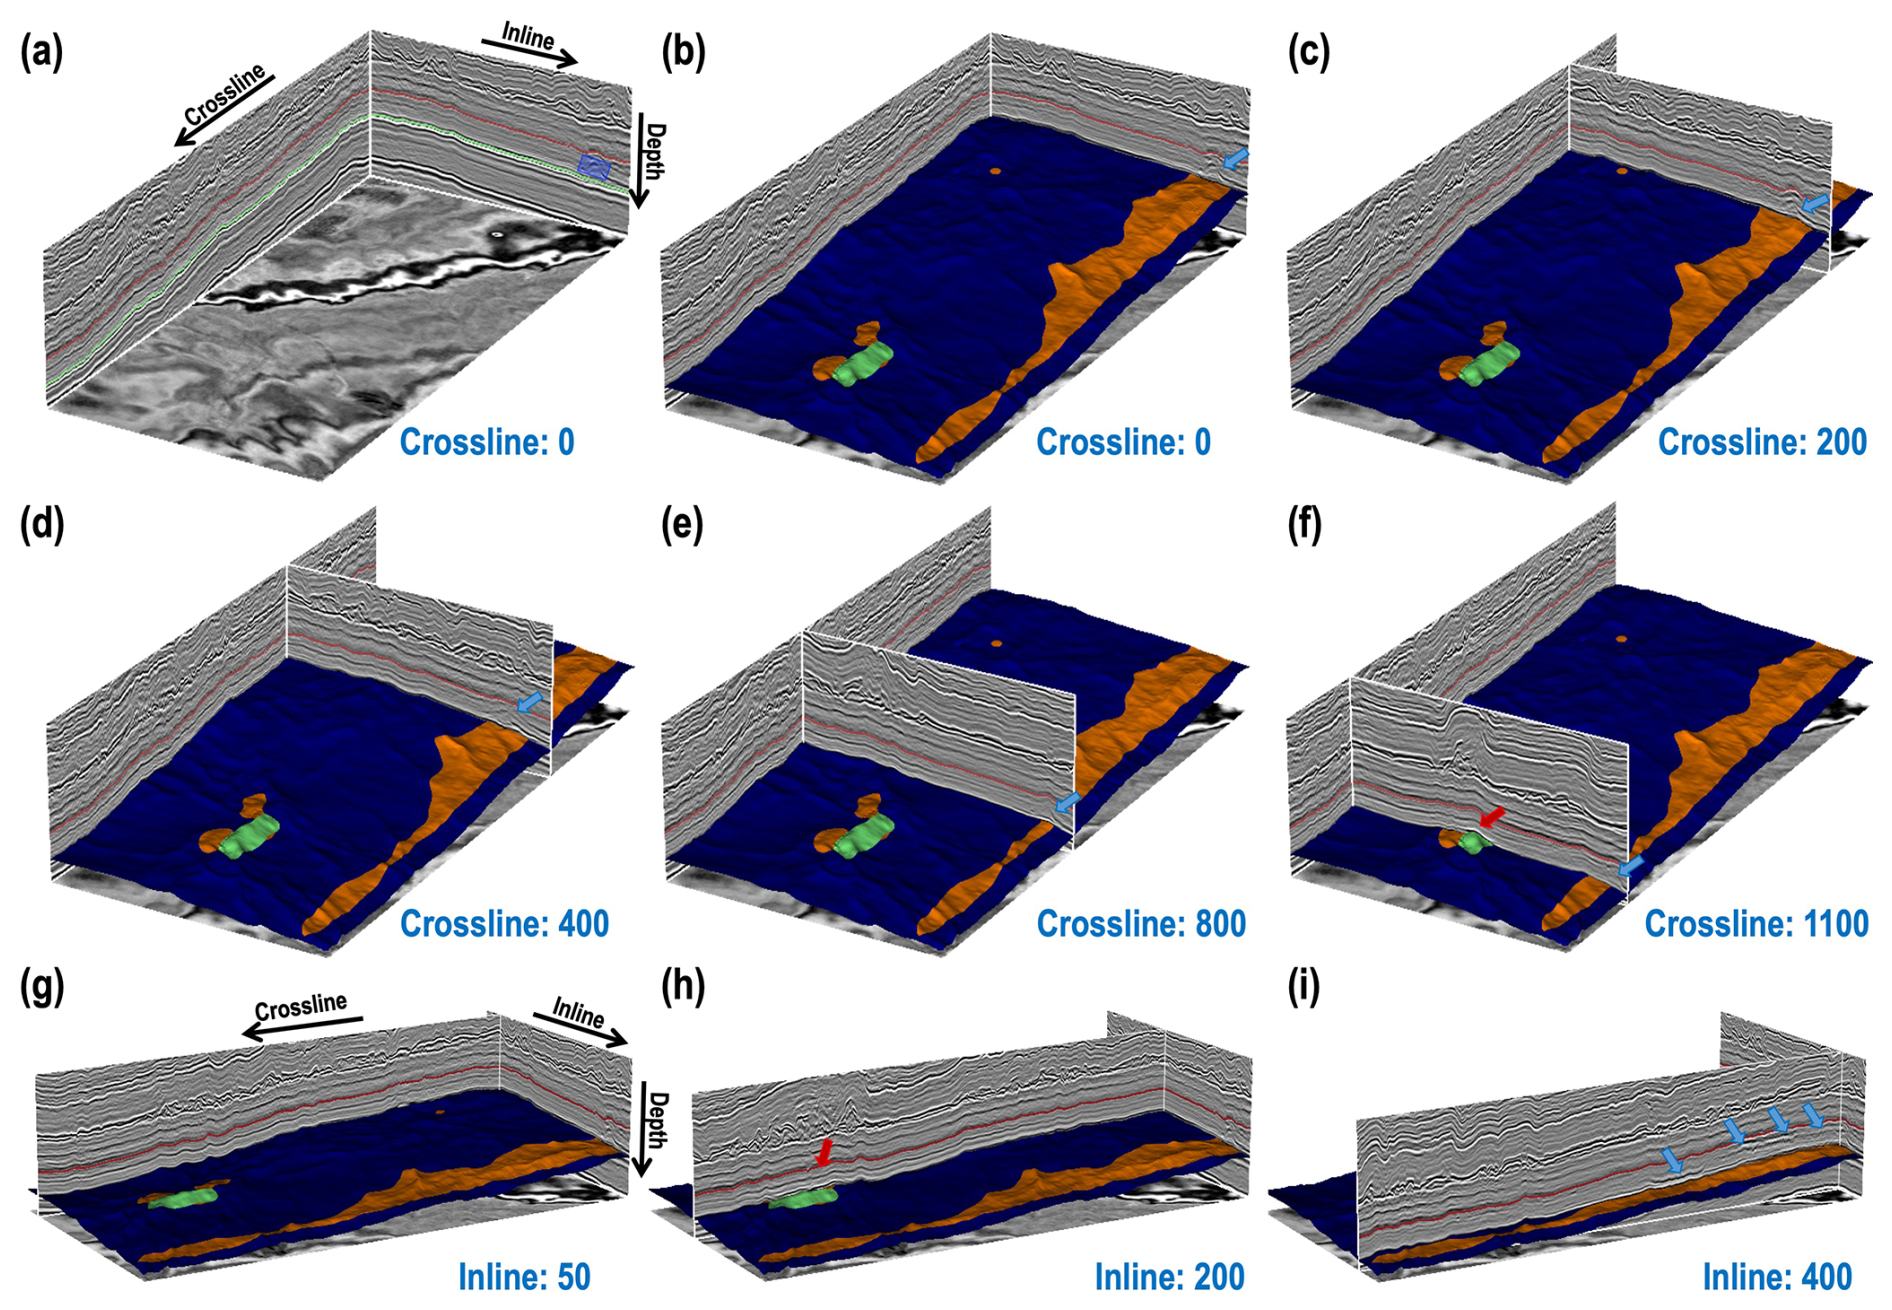
Figure 13(a) Three-dimensional Longgang (LG) seismic data (991 [inline] × 1187 [crossline] × 501 [time]) and the corresponding top and bottom horizons of the target strata shown in red and green curves. (b–f) Different 2-D seismic profiles in the different crossline directions (0, 200, 400, 800, and 1100) and inline directions (50, 200, and 400), overlaid with the predicted result. The blue arrows indicate areas where the predicted results align with the geological structural uplift in different 2-D views.
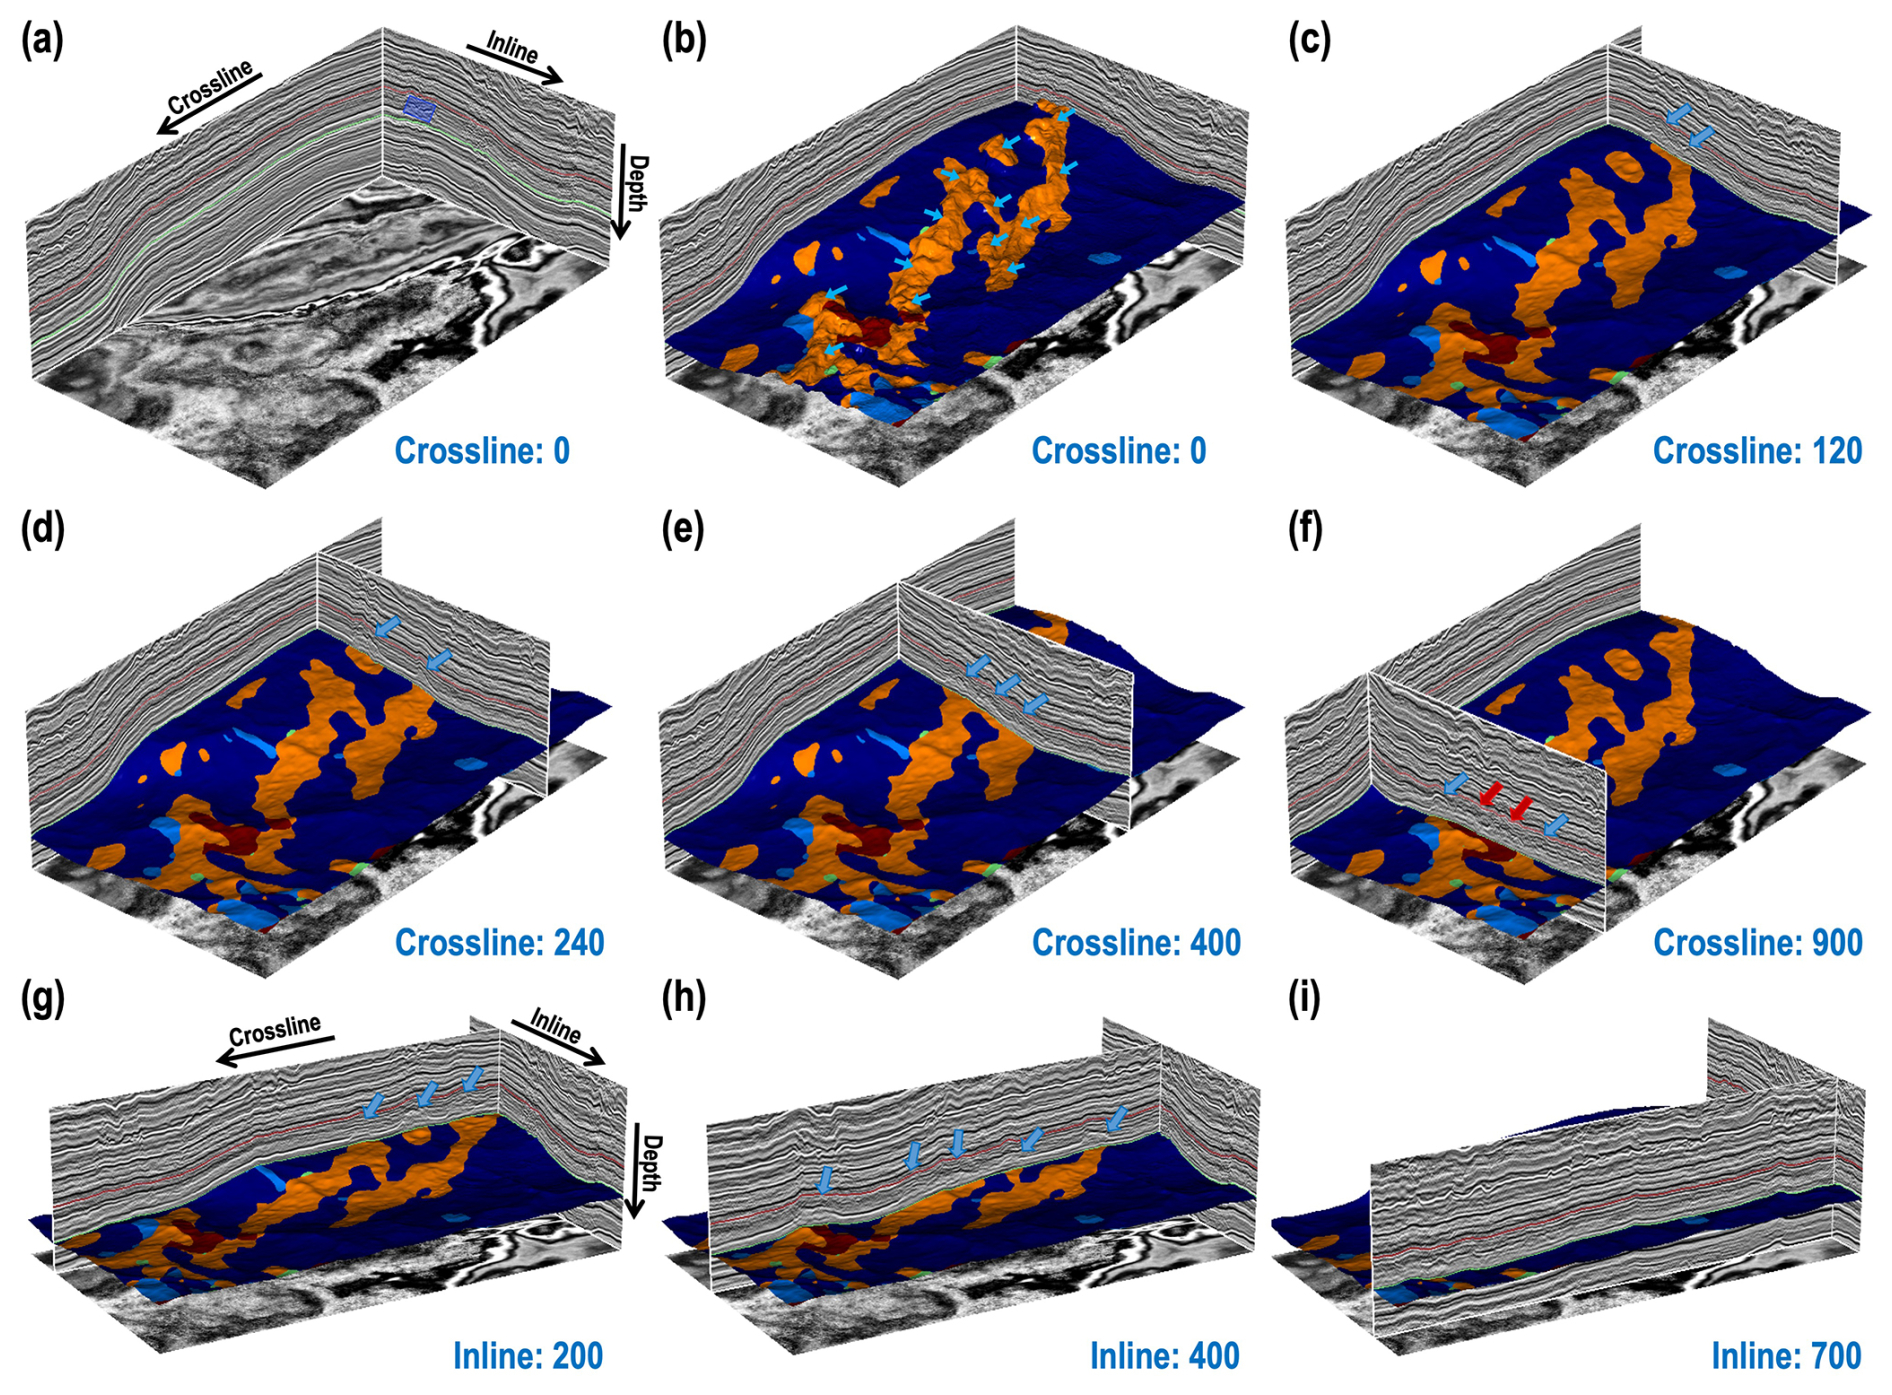
Figure 14(a) Three-dimensional Yuanba (YB) seismic data (1300 [inline] × 475 [crossline] × 600 [time]) and the corresponding top and bottom horizons of the target strata shown in red and green curves. (b) Three-dimensional predicted results overlaid on an expert-interpreted horizon; the distributions of the hummocky seismic facies are consistent with the uplifted areas indicated by the blue arrows. (c–i) Various 2-D views of seismic data with different combinations of crossline (120, 240, 400, and 900) and inline (200, 400, and 700) directions, together with the predicted results.
3.2 Testing on the 3-D field seismic data
To further verify the performance of the trained model, we develop a prediction workflow shown in Fig. 12a for automatic seismic facies classification in 3-D field seismic data. We first use an automatic horizon-picking method (Wu and Fomel, 2018) to extract the top and bottom surfaces (green and red curves in Fig. 12b) of the target section in the 3-D field seismic data. Then we flatten the field seismic data with the bottom surface to eliminate the influence of the geological structures. In addition, we set a sliding window (blue box in Fig. 12b) centered on the midpoint of the top and bottom horizons and bounded by these surfaces in order to extract a 2-D raw seismic image pixel by pixel (or trace by trace). The width of the sliding window mainly depends on the size of the classified object within the target section and is typically slightly greater than the widths of the objects. We also apply the standardization and skeletonization processes to the flattened image to make it consistent with the training dataset. Finally, we feed the corresponding skeletonization image into the trained network for automatic seismic facies classification.
In this work, we apply the trained network to two distinct 3-D field seismic data (Longang and Yuanba) with complex geological structures. The Longgang (LG) and Yuanba (YB) areas in the Sichuan Basin develop a huge number of platform margin reef complexes, which have emerged as an important field for oil and gas exploration (Chen et al., 2012; Xu et al., 2015; Tan et al., 2020). The first study case is the Permian Changhsingian formation of the LG 3-D seismic data (991 [inline] × 1187 [crossline] × 501 [time]) shown in Figs. 12b and 13a. We employ the prediction workflow (Fig. 12a) with a sliding window traversing all the 3-D target strata, yielding the seismic facies classification result shown in Fig. 12c. In addition, we display the predicted results with different 2-D profiles in the crossline and inline directions in Fig. 13b–i. The regions indicated by the blue arrows are correctly predicted to be hummocky facies, which is roughly consistent with the geological structural uplift in the corresponding 2-D seismic profiles. However, some artifacts or inaccurate predictions still appear in some areas indicated by the red arrows in Fig. 13f and h, which is mainly due to the incomplete flattening of the strata. As shown in Fig. 13i, we can clearly observe a distinct reef–top interface reflection axis indicated by blue arrows. The trend of this reflection axis indicates that the reef gradually moves backwards in the increasing crossline direction, which closely matches the trends observed in both our predicted results and the expert interpretation results. Finally, we obtain the corresponding sedimentary facies result (Fig. 12d) based on the predicted seismic facies result, well log information, seismic data, and geological and geophysical knowledge. Our final sedimentary facies result (Fig. 12d) is highly consistent with the expert interpretation of sedimentary facies shown in Fig. 12e.
The second study case is the Permian Changhsingian formation of the YB 3-D seismic data (1300 [inline] × 475 [crossline] × 600 [time]), as shown in Figs. 12f and 14a. The YB data consist of more complex geological structures compared to the LG 3-D seismic data. Using the same prediction workflow as the previous case, we obtain the corresponding distributions of seismic facies and overlay the result with a manually interpreted horizon shown in Figs. 12g and 14b. The predicted distribution of hummocky seismic facies is consistent with the uplifted areas on the manually interpreted horizon. This high consistency can also be demonstrated in Fig. 14b–i, which display additional 2-D seismic profiles with the predicted result in a different 3-D view. In particular, the areas indicated by the blue arrows in Fig. 14g and h demonstrate that our method accurately captures the distribution of the patch reef and platform reef zone. Moreover, our predicted results are consistent with expert interpretation results of the reef distribution along the complex platform margin. However, some regions indicated by the red arrows (Fig. 14f) are incorrectly classified as other seismic facies, which is probably due to the unsuitable scale of the sliding window for these local regions, the influence of boundary effects from the sliding window, and incomplete flattening of the stratum. Finally, we also generate the corresponding sedimentary facies results shown in Fig. 12h, where the platform margin reef is clearly and reasonably resolved and the spatial distribution of the platform margin is highly consistent with the expert interpretation in Fig. 12i.
In this work, we present a benchmark dataset and a deep-learning-based approach for automatic seismic facies classification. Our method utilizes a knowledge graph of seismic facies to guide the construction of the dataset, which includes a combination of field data curation, knowledge-guided synthesization, and GAN-based generation. These strategies avoid problems such as sample imbalance, poor diversity, and low realism that usually result from traditional dataset construction methods. In addition, the data standardization and skeletonization processes successfully mitigate all potential data uncertainties (not related to seismic facies) across diverse data sources. This enables a deep-learning model trained by the dataset to be applied effectively to field data across various surveys, thereby enhancing its generalizability. Applications to the validation dataset and two distinct 3-D field seismic data (LG and YB) demonstrate that the simple CNN model trained with the benchmark dataset achieves promising performance and great generalization ability for automatic seismic facies classification tasks.
Although our method constructs a comprehensive benchmark dataset of the seismic facies and achieves promising classification results, some limitations remain in the dataset construction and model application processes. In the data construction processes, we initially develop a knowledge graph primarily categorized by geological structure, emphasizing the role of structural information in seismic facies classification. However, the knowledge graph overlooks other important multi-attribute parameters, such as amplitude, continuity, frequency, and wave patterns, which also contain rich information. Additionally, constructing the 2-D skeletonization dataset for seismic facies classification does not fully consider the information contained in the seismic data in the inline direction, which may lead to lateral discontinuities in 3-D applications.
In the model application process, a special geological structure and the introduction of a sliding window may also cause the inaccurate results. The normal or reverse faults in the 3-D seismic data probably introduce unreasonable geological structures when flattening the seismic data, thus resulting in inaccurate predictions. We simplify the classification of the 3-D field seismic data by classifying the stratigraphic skeletonization information within the 2-D sliding window without fully utilizing the 3-D information in the inline direction, which may lead to instability in the predicted results, especially in the direction perpendicular to the sliding window. In addition, the proper size of the sliding window has a significant effect on the results, which need to appropriately match the scale of the key seismic facies in the field data. Furthermore, due to the predicted result being obtained by scanning pixel by pixel (trace by trace), some inaccurate predicted results may occur on the boundaries between the different seismic facies, where the sliding window only contains the partial geological structure.
The benchmark dataset of seismic facies has been uploaded to Zenodo and is freely available at https://doi.org/10.5281/zenodo.10777460 (Gao et al., 2024a). The corresponding codes for constructing the dataset and training the model have been uploaded to Zenodo and are freely available at https://doi.org/10.5281/zenodo.13150879 (Gao et al., 2024b).
We have developed three strategies guided by a knowledge graph to build a benchmark dataset that is vast in scale, is rich in features, and offers high realism. To the best of our knowledge, this dataset is the most extensive dataset of seismic facies that is currently available. The seismic facies knowledge graph, developed based on a comprehensive literature review, summarizes various typical seismic facies types, along with their corresponding geological origins and seismic response features. This knowledge graph provides comprehensive guidance for the three strategies employed in building the benchmark dataset, ensuring the comprehensiveness and representativeness of the data sample construction. The first strategy of field seismic data curation yields the first subset that is authentic but exhibits some imbalance and limited diversity. The second strategy of sample synthesis, informed by the knowledge graph, generates a second subset of samples containing any category and pattern features, thereby addressing the issues of uneven sample type distribution and lack of diversity in the first subset. However, the synthesized samples also face the problem of being overly idealized and not sufficiently realistic. Consequently, a third strategy, based on AI generation, is adopted to refine the dataset construction. This strategy involves training a GAN model using the already constructed first and second subsets and then leveraging it to derive a third subset with diverse patterns and realistic features. By merging these three subsets, we have ultimately constructed a dataset containing 2000, 1500, 1500, 1500, and 1500 samples for five common seismic facies. This benchmark dataset has been demonstrated to effectively train a CNN model that achieves notable performance in seismic facies classification across two distinct 3-D field datasets. We have made this benchmark dataset publicly available, encouraging its further enhancement and utilization by others in the development and evaluation of deep-learning approaches for seismic facies characterization.
In the future, we can construct a more comprehensive and refined knowledge graph of seismic facies based on multi-attribute parameters such as reflection configuration, continuity, amplitude, frequency, and wave pattern. Then, we can also construct 3-D seismic datasets with multi-attribute features for more refined seismic facies classification tasks, instead of 2-D skeletonization datasets that only have structural information and a lack of variations in the inline direction. Additionally, we can develop a multiscale 3-D network for automatic seismic facies classification, which can enhance both the accuracy and stability of predicted results, particularly for different seismic facies boundaries and 3-D field seismic data.
HG, XW, XS, and MH initiated the idea of building the benchmark dataset of seismic facies and its application. HG, XW, and XS initiated the idea of three strategies for constructing the benchmark dataset of seismic facies. HG, XW, XS, HS, and HG implemented the first strategies of field data curation to build the field facies samples. HG and XW tested and modified the code for the second and third strategies for building synthetic facies samples. HG carried out the experiments for the training and validation datasets. HG, HG, and GW applied the trained network to the field seismic data. XW, XS, and MH gave advice on the benchmark dataset preparation and predicted the results from a geological perspective. HG and XW prepared the paper with contributions from all the co-authors.
The contact author has declared that none of the authors has any competing interests.
Publisher's note: Copernicus Publications remains neutral with regard to jurisdictional claims made in the text, published maps, institutional affiliations, or any other geographical representation in this paper. While Copernicus Publications makes every effort to include appropriate place names, the final responsibility lies with the authors.
We thank the CNPC and SINOPEC for providing the seismic data and expert interpretation results. We also thank the USTC supercomputing center for providing the computational resources for this project. We sincerely appreciate the constructive and insightful suggestions from reviewers Lorenzo Lipparini and Tao Zhao, as well as the thoughtful guidance from the editor Andrea Rovida on this paper.
This research has been supported by the National Natural Science Foundation of China (grant nos. 42050104 and 42374127).
This paper was edited by Andrea Rovida and reviewed by Lorenzo Lipparini and Tao Zhao.
Chen, L., Lu, Y.-C., Guo, T.-L., and Deng, L.-S.: Growth characteristics of Changhsingian (Late Permian) carbonate platform margin reef complexes in Yuanba gas Field, northeastern Sichuan Basin, China, Geol. J., 47, 524–536, 2012. a
Duan, Y., Zheng, X., Hu, L., and Sun, L.: Seismic facies analysis based on deep convolutional embedded clustering, Geophysics, 84, IM87–IM97, 2019. a
Dunham, M., Malcolm, A., and Welford, J.: Toward a semisupervised machine learning application to seismic facies classification, in: EAGE 2020 Annual Conference & Exhibition Online, 2020, 1–5, European Association of Geoscientists & Engineers, 2020. a
Fensel, D., Simsek, U., Angele, K., Huaman, E., Kärle, E., Panasiuk, O., Toma, I., Umbrich, J., and Wahler, A.: Knowledge graphs, Springer, https://doi.org/10.1007/978-3-030-37439-6, 2020. a
Gao, H., Wu, X., Sun, X., and Hou, M.: cigFacies datasets: the massive-scale benchmark dataset of seismic facies, Zenodo [data set], https://doi.org/10.5281/zenodo.10777460, 2024a. a, b, c
Gao, H., Wu, X., Sun, X., and Hou, M.: cigFacies codes: cigFaciesNet for data generation and model training, Zenodo [code], https://doi.org/10.5281/zenodo.13150879, 2024b. a, b
Gulrajani, I., Ahmed, F., Arjovsky, M., Dumoulin, V., and Courville, A. C.: Improved training of wasserstein gans, ArXiv [preprint], 30, https://doi.org/10.48550/arXiv.1803.01541, 2017. a
He, K., Zhang, X., Ren, S., and Sun, J.: Deep residual learning for image recognition, in: Proceedings of the IEEE conference on computer vision and pattern recognition, 26 June–1 July 2016, Las Vegas, USA, 770–778, https://doi.org/10.48550/arXiv.1512.03385, 2016. a
Hogan, A., Blomqvist, E., Cochez, M., d’Amato, C., Melo, G. D., 75 Gutierrez, C., Kirrane, S., Gayo, J. E. L., Neumaier, S., Polleres, A., Navigli, R., Ngomo, A.-C. N., Rashid, S. M., Rula, A., Schmelzeisen, L., Sequeda, J., Staab, S., and Zimmermann, A.: Knowledge graphs, ACM Computing Surveys (Csur), 54, 1–37, https://doi.org/10.1145/3447772, 2021. a
Hu, X., Xu, Y., Ma, X., Zhu, Y., Ma, C., Li, C., Lü, H., Wang, X., Zhou, C., and Wang, C.: Knowledge System, Ontology, and Knowledge Graph of the Deep-Time Digital Earth (DDE): Progress and Perspective, J. Earth Sci., 34, 1323–1327, 2023. a
Jia, C. Z., Zhao, W. Z., Zou, C. N., Feng, Z. Q., Yuan, X. J., Chi, Y. L., Tao, S. Z., and Xue, S. H.: Geological Theory and Exploration Technology for Lithostratigraphic Hydrocarbon Reservoirs, Pet. Explor. Develop., 34, 257–272, 2007. a
Karras, T., Aila, T., Laine, S., and Lehtinen, J.: Progressive Growing of GANs for Improved Quality, Stability, and Variation, ArXiv [preprint], abs/1710.10196, https://doi.org/10.48550/arXiv.1710.10196, 2017. a
Li, J., Wu, X., Ye, Y., Yang, C., Hu, Z., Sun, X., and Zhao, T.: Unsupervised contrastive learning for seismic facies characterization, Geophysics, 88, WA81–WA89, 2023. a
Liu, J., Dai, X., Gan, L., Liu, L., and Lu, W.: Supervised seismic facies analysis based on image segmentation, Geophysics, 83, O25–O30, 2018. a
Liu, M., Jervis, M., Li, W., and Nivlet, P.: Seismic facies classification using supervised convolutional neural networks and semisupervised generative adversarial networks, Geophysics, 85, O47–O58, 2020. a
Ma, C., Kale, A. S., Zhang, J., and Ma, X.: A knowledge graph and service for regional geologic time standards, Geosci. Front., 14, 101453, https://doi.org/10.1016/j.gsf.2022.101453, 2023. a
Mitchum Jr., R. M., Vail, P. R., and Sangree, J. B.: Seismic stratigraphy and global changes of sea level: Part 6. Stratigraphic interpretation of seismic reflection patterns in depositional sequences: Section 2. Application of seismic reflection configuration to stratigraphic interpretation, AAPG Bulletin, 26, 117–133, https://doi.org/10.1306/M26490C8, 1977a. a, b
Mitchum Jr., R. M., Vail, P. R., and Thompson III, S.: Seismic stratigraphy and global changes of sea level: Part 2. The depositional sequence as a basic unit for stratigraphic analysis: Section 2. Application of seismic reflection configuration to stratigraphic interpretation, AAPG Bulletin, 26, 53–62, https://doi.org/10.1306/M26490C4, 1977b. a, b
Paulheim, H.: Knowledge graph refinement: A survey of approaches and evaluation methods, Semantic web, 8, 489–508, 2017. a
Puzyrev, V. and Elders, C.: Unsupervised seismic facies classification using deep convolutional autoencoder, Geophysics, 87, IM125–IM132, 2022. a
Qi, J., Lin, T., Zhao, T., Li, F., and Marfurt, K.: Semisupervised multiattribute seismic facies analysis, Interpretation, 4, SB91–SB106, 2016. a
Qian, F., Yin, M., Liu, X.-Y., Wang, Y.-J., Lu, C., and Hu, G.-M.: Unsupervised seismic facies analysis via deep convolutional autoencoders, Geophysics, 83, A39–A43, 2018. a
Sangree, J. and Widmier, J.: Seismic stratigraphy and global changes of sea level: Part 9. Seismic interpretation of clastic depositional facies: Section 2. Application of seismic reflection configuration to stratigraphic interpretation, AAPG Bulletin, 62, 752–771, https://doi.org/10.1306/C1EA4E46-16C9-11D7-8645000102C1865D, 1977. a
Sheriff, R.: Inferring stratigraphy from seismic data, AAPG Bulletin, 60, 528–542, 1976. a
Tan, L., Liu, H., Tang, Y., Luo, B., Zhang, Y., Yang, Y., Liao, Y., Du, W., and Yang, X.: Characteristics and mechanism of Upper Permian reef reservoirs in the eastern Longgang Area, northeastern Sichuan Basin, China, Petroleum, 6, 130–137, 2020. a
Veeken, P. C.: Seismic stratigraphy, basin analysis and reservoir characterisation, Elsevier, 37, 1–522, ISBN 9780080453118, 2006. a, b
Wrona, T., Pan, I., Gawthorpe, R. L., and Fossen, H.: Seismic facies analysis using machine learning, Geophysics, 83, O83–O95, 2018. a
Wu, X. and Fomel, S.: Least-squares horizons with local slopes and multigrid correlations, Geophysics, 83, IM29–IM40, 2018. a
Xu, G. and Haq, B. U.: Seismic facies analysis: Past, present and future, Earth-Sci. Rev., 224, 103876, https://doi.org/10.1016/j.earscirev.2021.103876, 2022. a, b, c
Xu, G., Xie, G., Long, K., and Song, X.: Sedimentary features and exploration targets of Middle Permian reservoirs in the SW Sichuan Basin, Natural Gas Industry B, 2, 415–420, 2015. a
Zhang, H., Chen, T., Liu, Y., Zhang, Y., and Liu, J.: Automatic seismic facies interpretation using supervised deep learning, Geophysics, 86, IM15–IM33, 2021. a
Zhang, L., Hou, M., Chen, A., Zhong, H., Ogg, J. G., and Zheng, D.: Construction of a fluvial facies knowledge graph and its application in sedimentary facies identification, Geosci. Front., 14, 101521, https://doi.org/10.1016/j.gsf.2022.101521, 2023. a
Zhao, T.: Seismic facies classification using different deep convolutional neural networks, in: SEG International Exposition and Annual Meeting, 14–19 October 2018, Anaheim, California, USA, SEG–2018, SEG, https://doi.org/10.1190/segam2018-2997085.1, 2018. a
Zhao, T., Li, F., and Marfurt, K. J.: Seismic attribute selection for unsupervised seismic facies analysis using user-guided data-adaptive weights, Geophysics, 83, O31–O44, 2018. a
Zhou, C., Wang, H., Wang, C., Hou, Z., Zheng, Z., Shen, S., Cheng, Q., Feng, Z., Wang, X., Lv, H., Fan, J., Hu, X., Hou, M., and Zhu, Y.: Geoscience knowledge graph in the big data era, Sci. China Earth Sci., 64, 1105–1114, 2021. a