the Creative Commons Attribution 4.0 License.
the Creative Commons Attribution 4.0 License.
China coastal GNSS network: advancing precipitable water vapor monitoring and applications in climate analysis
Bofeng Li
Qingyuan Liu
Yanxiong Liu
Huayi Zhang
Dongxu Zhou
Yang Liu
The Global Navigation Satellite System (GNSS) offers precise, continuous monitoring of atmospheric water vapor, essential for weather forecasting and climate research. This study presents a high-accuracy precipitable water vapor (PWV) dataset from 55 GNSS stations along China's coast (2009–2019). PWV retrievals utilized weighted mean temperature (Tm) and zenith hydrostatic delay (ZHD) derived from fifth-generation European Reanalysis (ERA5) data. After rigorous quality control, the dataset achieved an average completeness rate of 70 %. Validation against ERA5 PWV products showed strong agreement (mean bias: 0.88 mm; RMS error: 2.59 mm), while comparisons with radiosonde profiles yielded a mean bias of 0.90 mm and an RMS error of 3.06 mm, confirming its accuracy and reliability. Spatial analysis of China coastal PWV showed that minimum values decrease with increasing latitude, while maximum values are concentrated in the subtropical and tropical monsoon climate zones. Temporal patterns exhibited prominent annual and semi-annual cycles, particularly in higher latitudes. PWV showed a strong positive correlation with sea surface temperature (SST; r= 0.76), with a 1 K SST increase leading to a 2.4 mm (7 %) PWV rise. This dataset supports high-precision applications, including PWV validation, extreme weather prediction, and climate trend analysis. The processed ZTD and PWV datasets from 55 GNSS stations are accessible at https://doi.org/10.5281/zenodo.17012498 (Wu et al., 2025).
- Article
(18205 KB) - Full-text XML
- BibTeX
- EndNote
Water vapor is a crucial component of the atmosphere, playing a significant role in the energy budget, hydrological cycle, weather forecasting, and climate change (Galewsky et al., 2016; Dirmeyer and Brubaker, 2007; Karl and Trenberth, 2003). A precise understanding of precipitable water vapor (PWV) is essential for advancing knowledge in these areas. PWV can be measured using several techniques, including ground-based microwave radiometers (Elgered and Jarlemark, 1998), radiosondes (Ross and Elliott, 2001), and satellite remote sensing (Gao and Kaufman, 2003; Wu et al., 2024). The use of the Global Navigation Satellite System (GNSS) for water vapor sensing was first introduced by Bevis (Bevis et al., 1994, 1992). Since then, numerous studies have been conducted, establishing GNSS as one of the primary methods for measuring PWV (Wu et al., 2022b; Wang et al., 2016b).
Compared to other water vapor sensing techniques, GNSS meteorology (GNSS/MET) offers distinct advantages, including all-weather capability, low cost, and high temporal resolution. These features have made it a widely applied tool in numerical weather prediction assimilation (Gendt et al., 2004) and extreme weather forecasting (Tsushima and Ohta, 2014). Additionally, due to its ability to provide continuous and high-accuracy PWV measurements, GNSS/MET has been extensively utilized in climate change research based on long-term GNSS-derived PWV datasets. For instance, Wang et al. (2016a) analyzed global water vapor trends from 1988 to 2011 using GPS measurements. Alshawaf et al. (2017) evaluated climate evolution over Germany based on GNSS-derived PWV time series. Wang et al. (2018) investigated the relationship between GNSS-derived PWV and sea surface temperature (SST), as well as its response to El Niño–Southern Oscillation (ENSO). Yang et al. (2024) investigated the PWV spatiotemporal distribution across four major climate regions in China using GNSS data from 248 stations over a 10-year period (2011–2020), which provided high temporal and spatial resolution for understanding regional atmospheric conditions. Their findings indicate that GNSS-derived PWV can serve as a valuable indicator for monitoring the evolution of climate change.
Many countries and organizations have established ground-based GNSS networks to monitor long-term variation in PWV. Examples include SuomiNet in the United States (Ware et al., 2000), European National Meteorological Services (EUMETNET) E-GVAP system (Jones et al., 2023), the GEONET system operated by the Geospatial Information Authority of Japan (Sato et al., 2013), and the ground-based observation network operated by China Meteorological Administration (CMA) (Bai et al., 2021). Recent research has utilized GNSS observations to generate high-accuracy PWV data, e.g., Bosser et al. (2021) proposing PWV products from 49 GNSS stations of the EUREC4A (Elucidate the Couplings Between Clouds, Convection and Circulation) project. Yuan et al. (2023) generated high-quality global PWV dataset from 12 552 ground-based GNSS stations in 2020.
Since 2009, the Ministry of Natural Resources (MNR) of China has launched and maintained the China coastal continuous operating GNSS network (CGN). Initially designed to monitor land deformation at tidal stations and measure absolute sea level rise, the network also provides valuable data on water vapor exchange between oceans and land (Zhou et al., 2016; Zhou et al., 2022). Additionally, zenith total delays (ZTD) or PWV values derived from the CGN have been used to validate satellite remote sensing measurements (Zhu et al., 2021; Wu et al., 2022a; Chen et al., 2018), shipborne GNSS PWV estimates (Wu et al., 2022b), typhoon event forecasting (Zhao et al., 2018), and long term climate analysis (Wang et al., 2017).
These studies underscore the diverse applications of atmospheric water vapor data derived from CGN observations. For instance, Wang et al. (2017) analyzed the spatiotemaporal distribution of water vapor across 27 CGN stations using a six-year GNSS PWV dataset. However, comprehensive long-term evaluations of CGN PWV data across all stations remain limited, and the GNSS PWV retrieval methodologies require further refinement. To address these gaps, this study focuses on a decade-long (2009–2019), high-resolution dataset specific to China's coastal regions, employing a refined PWV retrieval algorithm. The processing methodology for China's coastal GNSS data is thoroughly detailed, and the dataset has undergone rigorous quality control to ensure reliability. This high-accuracy dataset offers significant potential for validating satellite remote sensing measurements, enhancing extreme weather prediction capabilities, and advancing long-term climate research.
This paper is structured as follows: Sect. 2 introduces the design and implementation of the CGN, along with the GNSS water vapor retrieval algorithm. Additionally, the fifth-generation European Reanalysis (ERA5) data and radiosonde profiles used to evaluate the GNSS-derived PWV are described. Section 3 evaluates the performance of GNSS water vapor estimates and analyzes the spatial and temporal characteristics based on a decade-long GNSS PWV dataset. Finally, the summary and conclusions are presented in Sect. 4.
2.1 China Coastal Continuous Operating GNSS Network and Data Processing
2.1.1 China Coastal Continuous Operating GNSS Network
The CGN project was proposed in 2008 and completed in 2009 by the MNR of China. The mission of CGN includes monitoring global mean sea level, measuring water vapor, providing reference positions for coastal research, and offering early warnings for tsunamis and seabed earthquakes. To fulfill these responsibilities, the GNSS site locations were required to meet the following criteria:
-
Proximity to tidal stations;
-
Open areas with sufficient satellite visibility at a cutoff angle of 5°;
-
Regions with stable geological structures;
-
Accessibility to power and communication networks.
The survey and site selection for the GNSS stations began in March 2008 and was completed in June 2008. Observations were collected using TPS NET-G3 GNSS receivers, with 24 h data collection, and the TEQC software was used to assess data quality. Ultimately, 55 GNSS stations were established, and their geographical distributions are shown in Fig. 1 (blue circles in the left panel). Figure 2 illustrates the locations of the CGN stations, which are primarily situated close to the ocean. The stations cover regions with various climate types, including the temperate monsoon (in circles), subtropical monsoon (in rectangles), and tropical monsoon climates (in triangles).
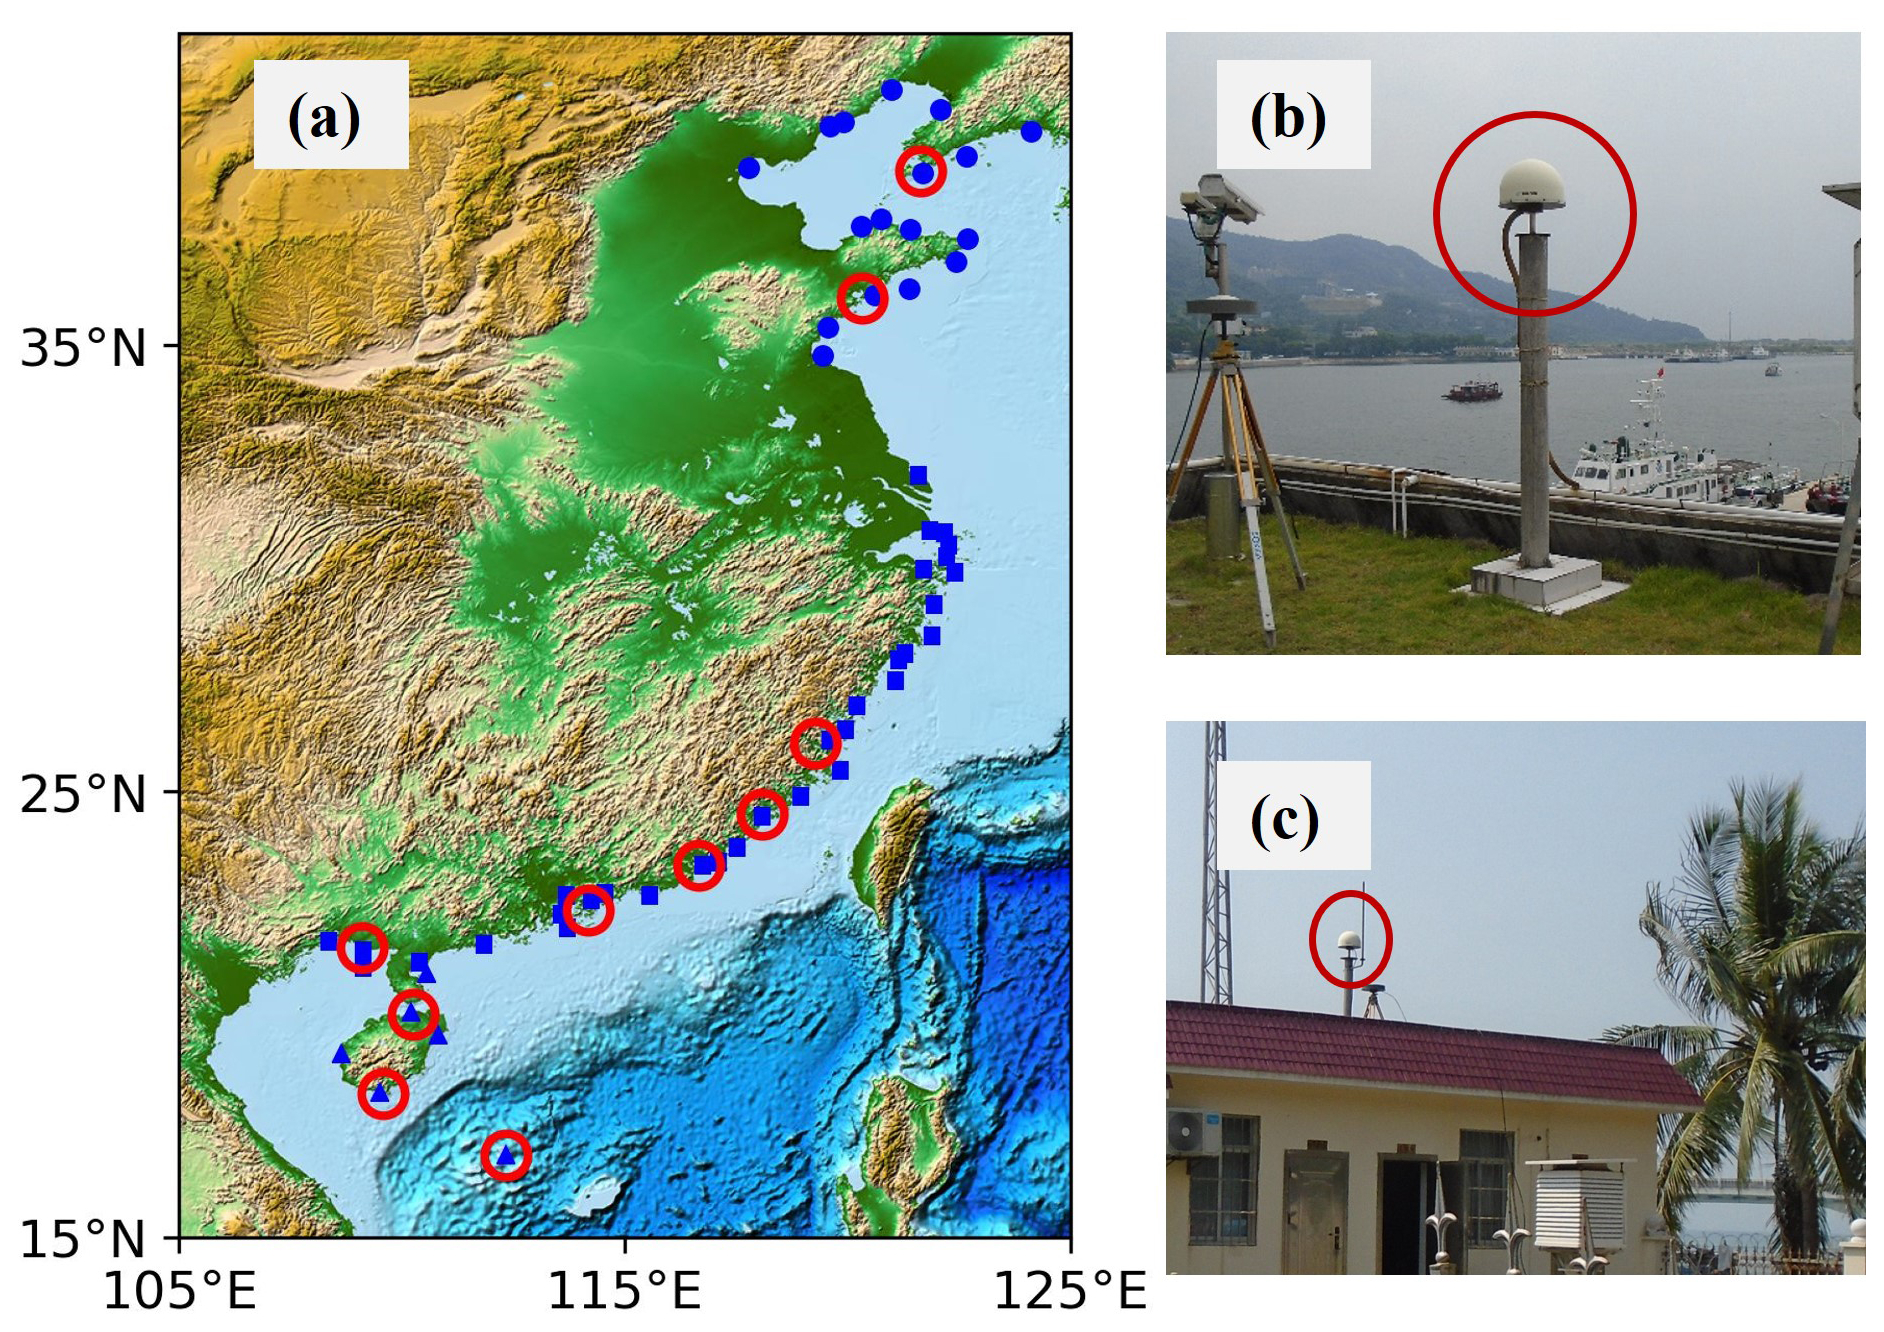
Figure 1Geographical distribution of the China coastal GNSS network: Overview of GNSS station locations (a), and locations of two example CGN stations: NSZN (b) and NXSA (c), respectively. In the left panel, blue circles indicate GNSS stations in temperate monsoon climates, blue rectangles represent stations in subtropical monsoon climates, blue triangles denote stations in tropical monsoon climates, and red circles indicate radiosonde stations.
Most GNSS sites were initially equipped with Topcon TPS NET-G3 receivers featuring choke-ring antennas. At the outset, only observations from GPS and GLONASS were available. In recent years, with the advancement of the Galileo and BeiDou-3 systems and the upgrade of GNSS receivers at CGN sites, observations from four constellations have been collected. These multi-GNSS observations were archived and processed by the GNSS Data and Analysis Center at the First Institute of Oceanography (FIO), MNR of China.
2.1.2 GNSS ZTDs Retrieval Algorithm
GNSS observations with a 30 s sampling rate from 55 GNSS stations were collected and processed by the FIO, MNR of China. FIO routinely processes GNSS observations by the Positioning And Navigation Data Analyst (PANDA) released by Wuhan University (Shi et al., 2008; Liu and Ge, 2003) using the static precise point positioning (PPP) model (Zumberge et al., 1997).
- a.
GNSS Data Processing Strategies. The first-order ionospheric delays effect were removed by undifferenced ionospheric-free (IF) combinations of dual-frequency pseudorange and carrier phase observations. The cut-off angle for GNSS observation was 7°, and an elevation-dependent weighting function was applied. The precise satellite orbits and clocks were from the European Space Agency (ESA) second reprocessing products (2009–2014) and operational final products (2014–2019) for both high accuracy and internal consistency between the orbit and clock solutions (Springer et al., 2014; Schönemann et al., 2024). The errors caused by the solid Earth tide, the ocean tide loading, and the pole tide were corrected based on the International Earth Rotation and Reference Systems Service (IERS) 2010 (Petit and Luzum, 2010), while the non-tidal ocean loading and atmosphere loading were not corrected. Antenna phase center offset (PCO) and phase center variation (PCV) were corrected by the International GNSS service (IGS) antenna files (Schmid et al., 2016). The phase wind-up was also corrected according to Wu et al. (1993).
The tropospheric delays were modelled with a prior ZTD and global mapping function (GMF) (Böhm et al., 2006). The ZTD consists of a hydrostatic part and a wet part, and the prior values were derived based on the Saastamoinen model (Saastamoinen, 1972) with meteorological data (pressure and temperature) provided by Global Pressure and Temperature (GPT) (Böhm et al., 2007). The zenith wet delay (ZWD) was processed as an unknown piece-wise constant parameter with an interval of 60 min. The tropospheric horizontal gradient was processed as an unknown piece-wise constant parameter with an interval of 720 min (Chen and Herring, 1997). A batch least-squares estimation method was used to estimating the GNSS station static coordinate, epoch-wise clock offsets, and tropospheric delay at a 1 h interval.
- b.
Outlier Detection. To ensure the reliability and accuracy of the retrieved GNSS ZTD data, a two-step screening process was conducted:
- -
Step 1: General Range Check. A range-based screening was implemented to eliminate apparent outliers. Using hourly ERA5 ZTD values based on layer-level pressure data for coastal areas in China from 2009 to 2019, the observed ZTD values ranged from 2278.3 to 2771.5 mm. As such, we set the ZTD range between 2000 and 3000 mm, resulting in the removal of 0.02 % of GNSS ZTD values.
- -
Step 2: Station-Specific Thresholds. Additionally, a moving window outlier detection approach, based on the interquartile range (IQR) rule proposed by Yuan et al. (2023), was applied. The threshold for outlier detection was defined as Q1–3⋅ IQR to Q3+3 ⋅ IQR. The IQR represents Q3-Q1, Q1 and Q3 are the 25th and 75th percentiles of all 5 min ZTD data within a 15 d window centered on the target day. This moving window approach was implemented across all stations, leading to the removal of 0.29 % of GNSS ZTD outliers.
- -
- c.
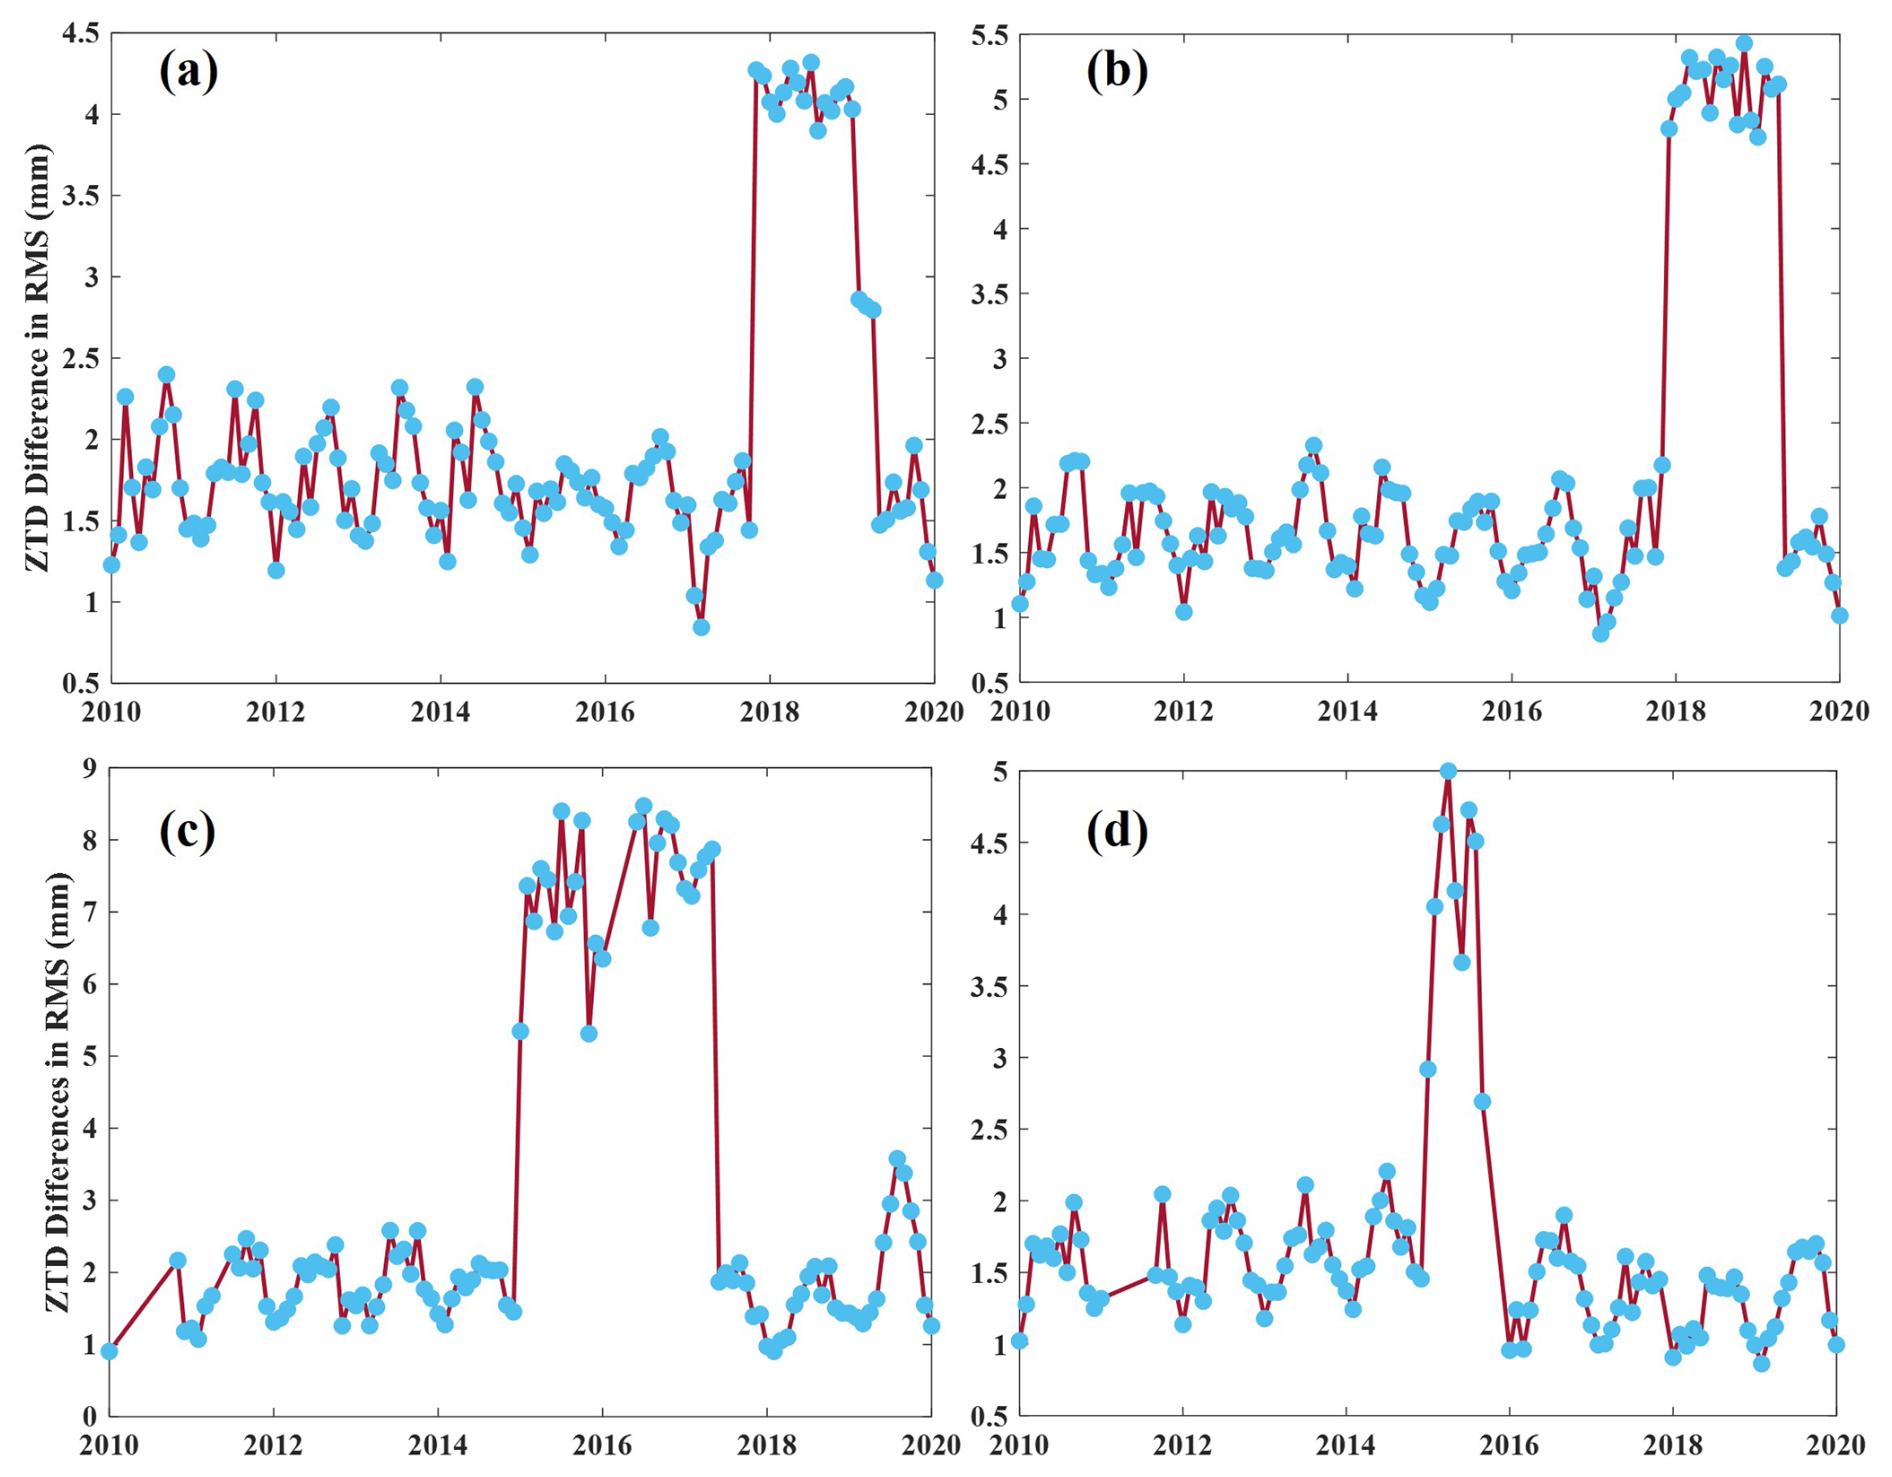
Validation of GNSS ZTDs Based on ERA5 Products. ERA5-derived ZTDs, known for their stability, were used to validate the GNSS ZTDs. Four GNSS stations (DBJO, DCHM, DDJS, and DPTN) exhibit significantly abnormal root mean square (RMS) differences in ZTD compared to the ERA5 ZTDs, as shown in Fig. 2. Although the average RMS difference between GNSS ZTD and ERA5 ZTD is less than 2 cm, the RMS errors for these four stations exceeded 3 cm, leading to the exclusion of GNSS ZTD data from these stations for the period under consideration.
After applying the aforementioned screening criteria, we compared the GNSS ZTD estimates with the ERA5 ZTDs. As illustrated in Fig. 3, the GNSS ZTDs demonstrate a strong agreement with the ERA5 ZTDs, exhibiting an RMS difference of 1.52 cm and a mean bias of −0.04 cm. Notably, the concordance between GNSS ZTDs and ERA5 ZTDs is significantly better in high-latitude regions. The largest observed difference being 2.4 cm at the NXSA station, as presented in Fig. 4, which depicts the differences across each station. Generally, GNSS ZTDs are lower than those from ERA5 at most GNSS stations, with the mean bias at the DDCN station reaching at 1.7 cm.
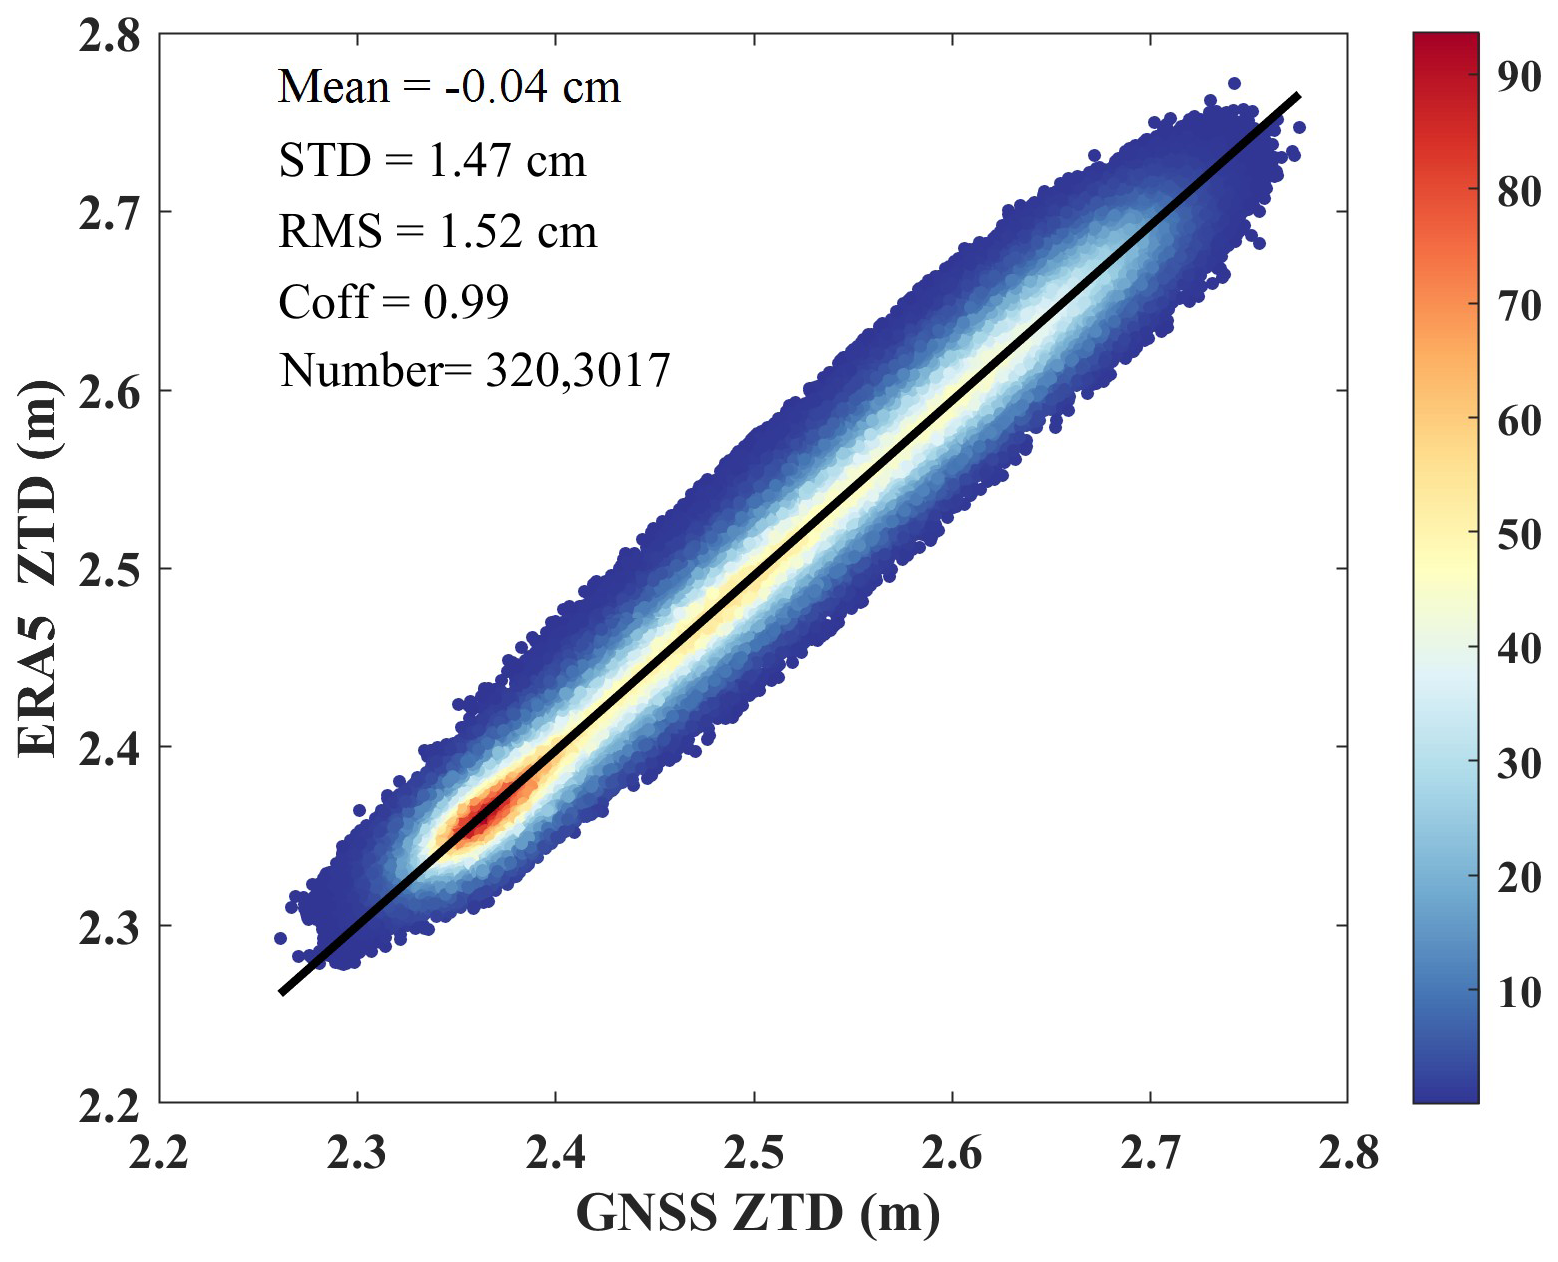
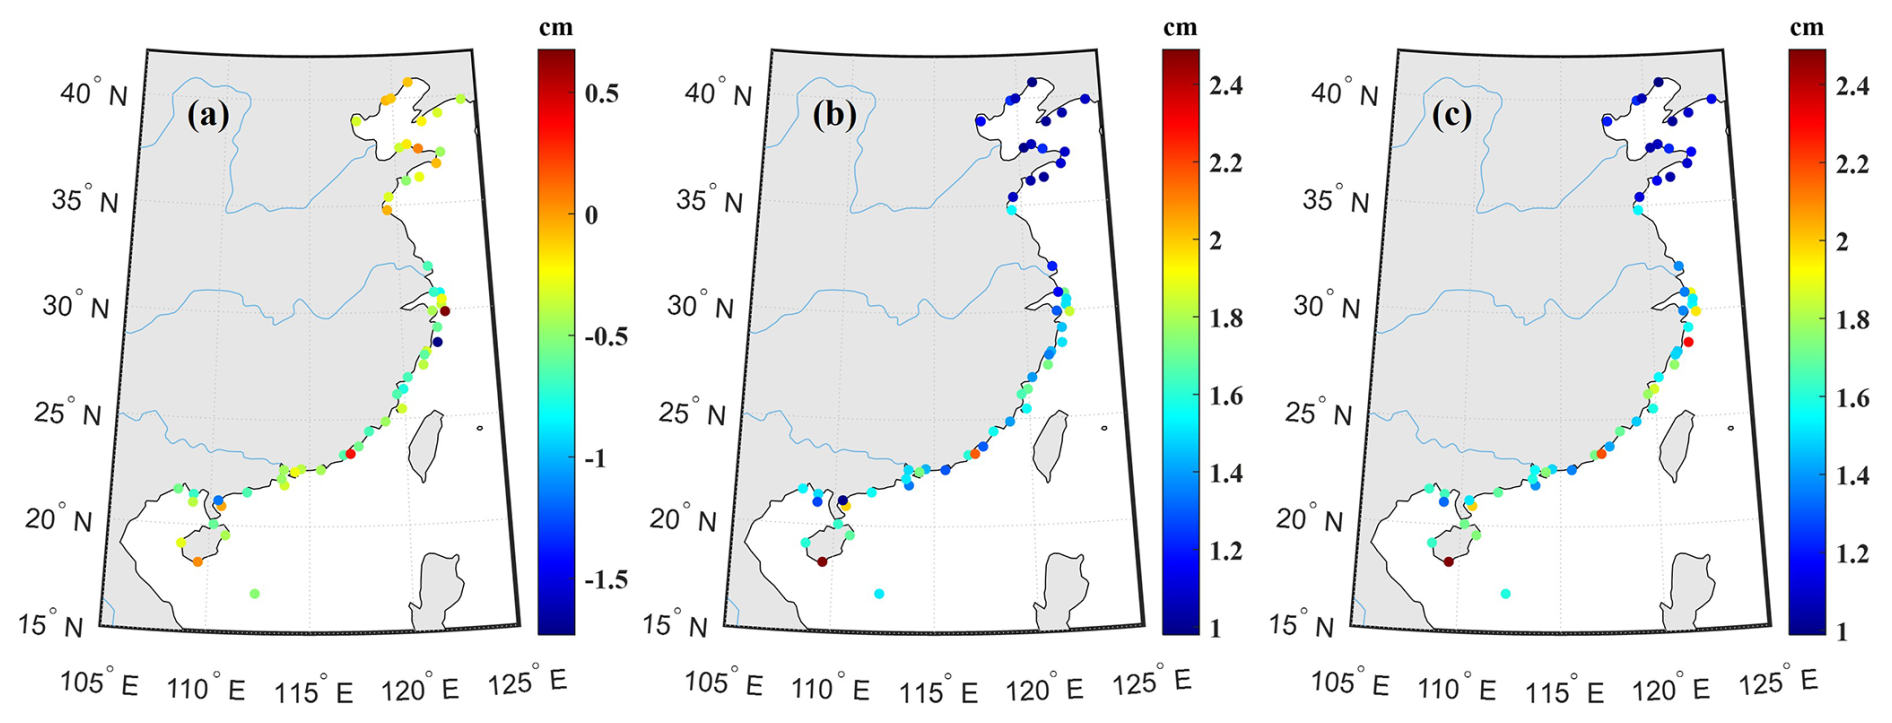
Figure 4Comparison between GNSS ZTDs and ERA5 ZTDs: mean bias (a), STD (b), and RMS (c).
2.1.3 Water Vapor Retrieval Algorithm
After obtaining accurate GNSS ZTD estimates, PWV values were calculated based on the following equation:
where ρlw denotes the liquid water density; Rv represent the water vapor specific gas constant Rv= 461.495 J (kg K)−1; (17 ± 10) K hPa−1 and k3= (3.776 ± 0.004) 105 K2 hPa−1 are the atmospheric refractivity constants (Zhang et al., 2019). Tm is derived from the ERA5 layer data and is shown as follows:
where e (in hPa) is the water partial pressure, Zw is the wet term of refraction that taken as 1 (Schuler, 2001), and T (in K) is the temperature in the layer.
The algorithm to derive ZHD values was based on ERA5 hourly data on 37 pressure levels with the following equation:
where k1= 77.604 K hPa−1, Pi is the atmospheric pressure (hPa), ei is the vapor pressure (hPa), Ti is the temperature (K), hi is the specific humidity.
2.1.4 Water Vapor Data Quality Control
A two-step screening process, similar to the ZTD screening method, was conducted to ensure the reliability and accuracy of the retrieved GNSS PWV data. A range-based screening was implemented to eliminate apparent outliers. Using 1 h ERA5 PWV data from coastal areas of China during the period 2009–2019, the observed PWV values ranged between 0.72 and 86.21 mm. Since GNSS retrievals are easily affected by clouds and heavy rain, and the low PWV is unlikely to decrease to around 0 mm in coastal China, particularly in subtropical and tropical monsoon climate regions (Bonafoni and Biondi, 2016; Solheim et al., 1999), the accepted PWV range for our dataset was defined as 0–80 mm for the temperate monsoon climate area and 3–80 mm for the subtropical and tropical monsoon areas, excluding 0.09 % of the total dataset.
In addition, a station-specific outlier detection method was employed. This involved applying a moving IQR rule to detect anomalies. For each station, the median PWV value was calculated within a 15 d moving window centered on the specific day. The outlier thresholds were defined as: Q1–3 ⋅ IQR to Q1+3 ⋅ IQR. PWV values falling outside this range were flagged and removed. This step resulted in the rejection of an additional 0.26 % of the data points across all stations.
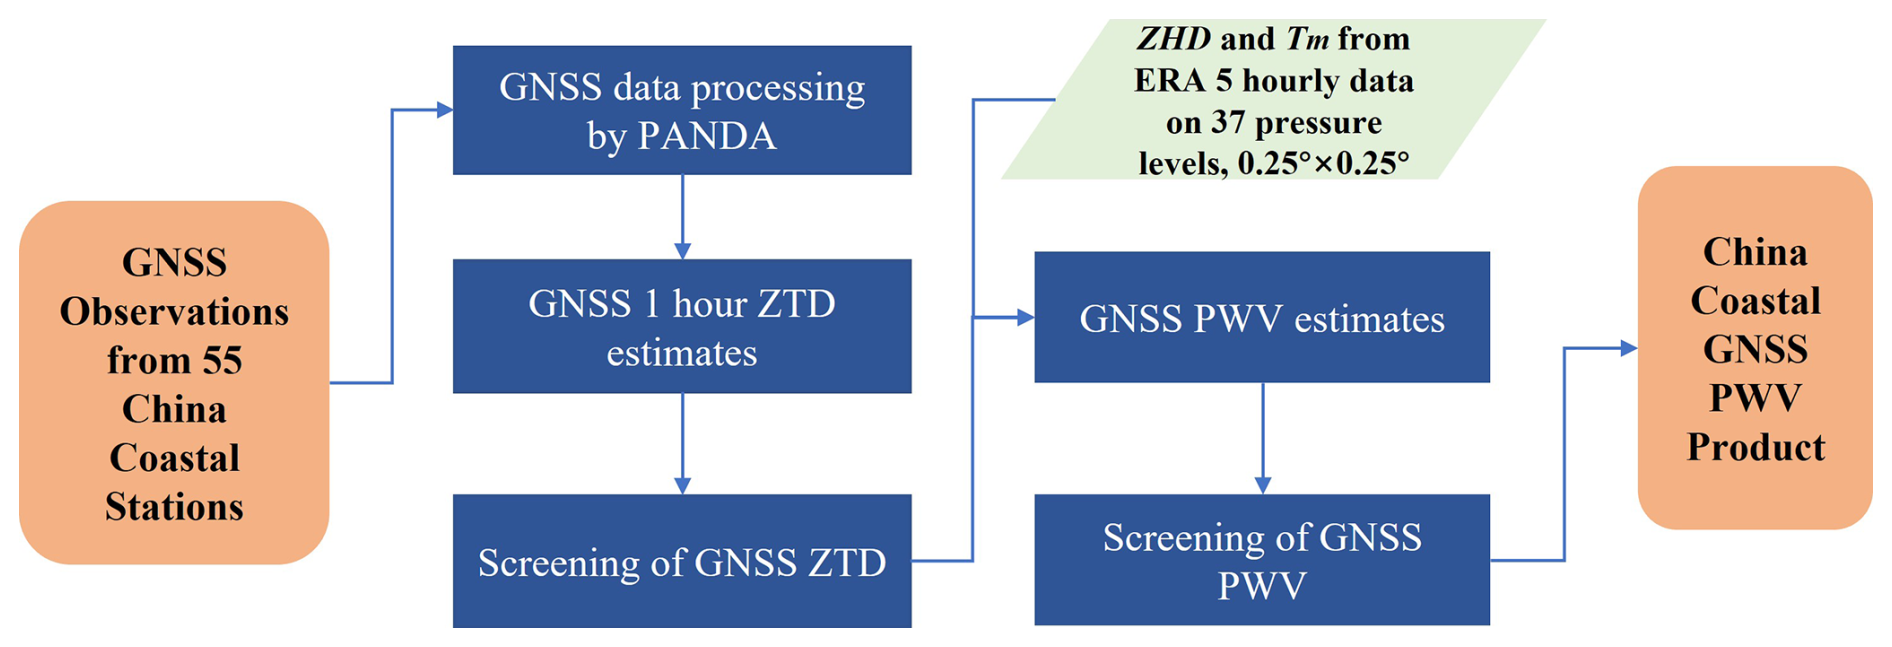
2.1.5 China Coastal GNSS PWV Product
Figure 5 summarizes the workflow for generating the GNSS-based PWV products for the China coastal region. The analysis used GNSS observations with a 30 s sampling rate from 55 coastal GNSS sites in China, covering the period from 2009 to 2019. Hourly GNSS ZTD estimates were obtained using the PANDA processing software. Following a screening process for the GNSS ZTD data, the ZHD and weighted-mean temperature were derived from ERA5 data, based on 37 pressure levels. This method has shown significantly better accuracy compared to the values derived from the Saastamoinen and Bevis equations (Yuan et al., 2023). The GNSS ZTD values were then converted into GNSS PWV estimates. Finally, the China coastal PWV products for the period 2009 to 2019 were generated, with further screening applied to ensure data quality.
2.2 Validation Datasets
2.2.1 ERA5 Reanalysis Product
The study employed the ERA5 reanalysis data from the European Centre for Medium-Range Weather Forecasts (ECMWF). ERA5 is the fifth-generation reanalysis product, offering comprehensive data for the land, ocean, and atmosphere (Hersbach et al., 2020). In this study, a single-level product with a temporal resolution of 1 h and a spatial resolution of 0.25° × 0.25° was used to validate the GNSS PWV data. Additionally, ERA5 layer products with the same temporal and spatial resolutions were utilized to derive the GNSS ZHD and weighted-mean temperature. Bilinear interpolation was applied in the horizontal direction to extract the parameters corresponding to the coordinates of the GNSS stations. Furthermore, hourly SST data provided by ERA5 were used to investigate the relationship between SST and coastal PWV.
2.2.2 Radiosonde Profile
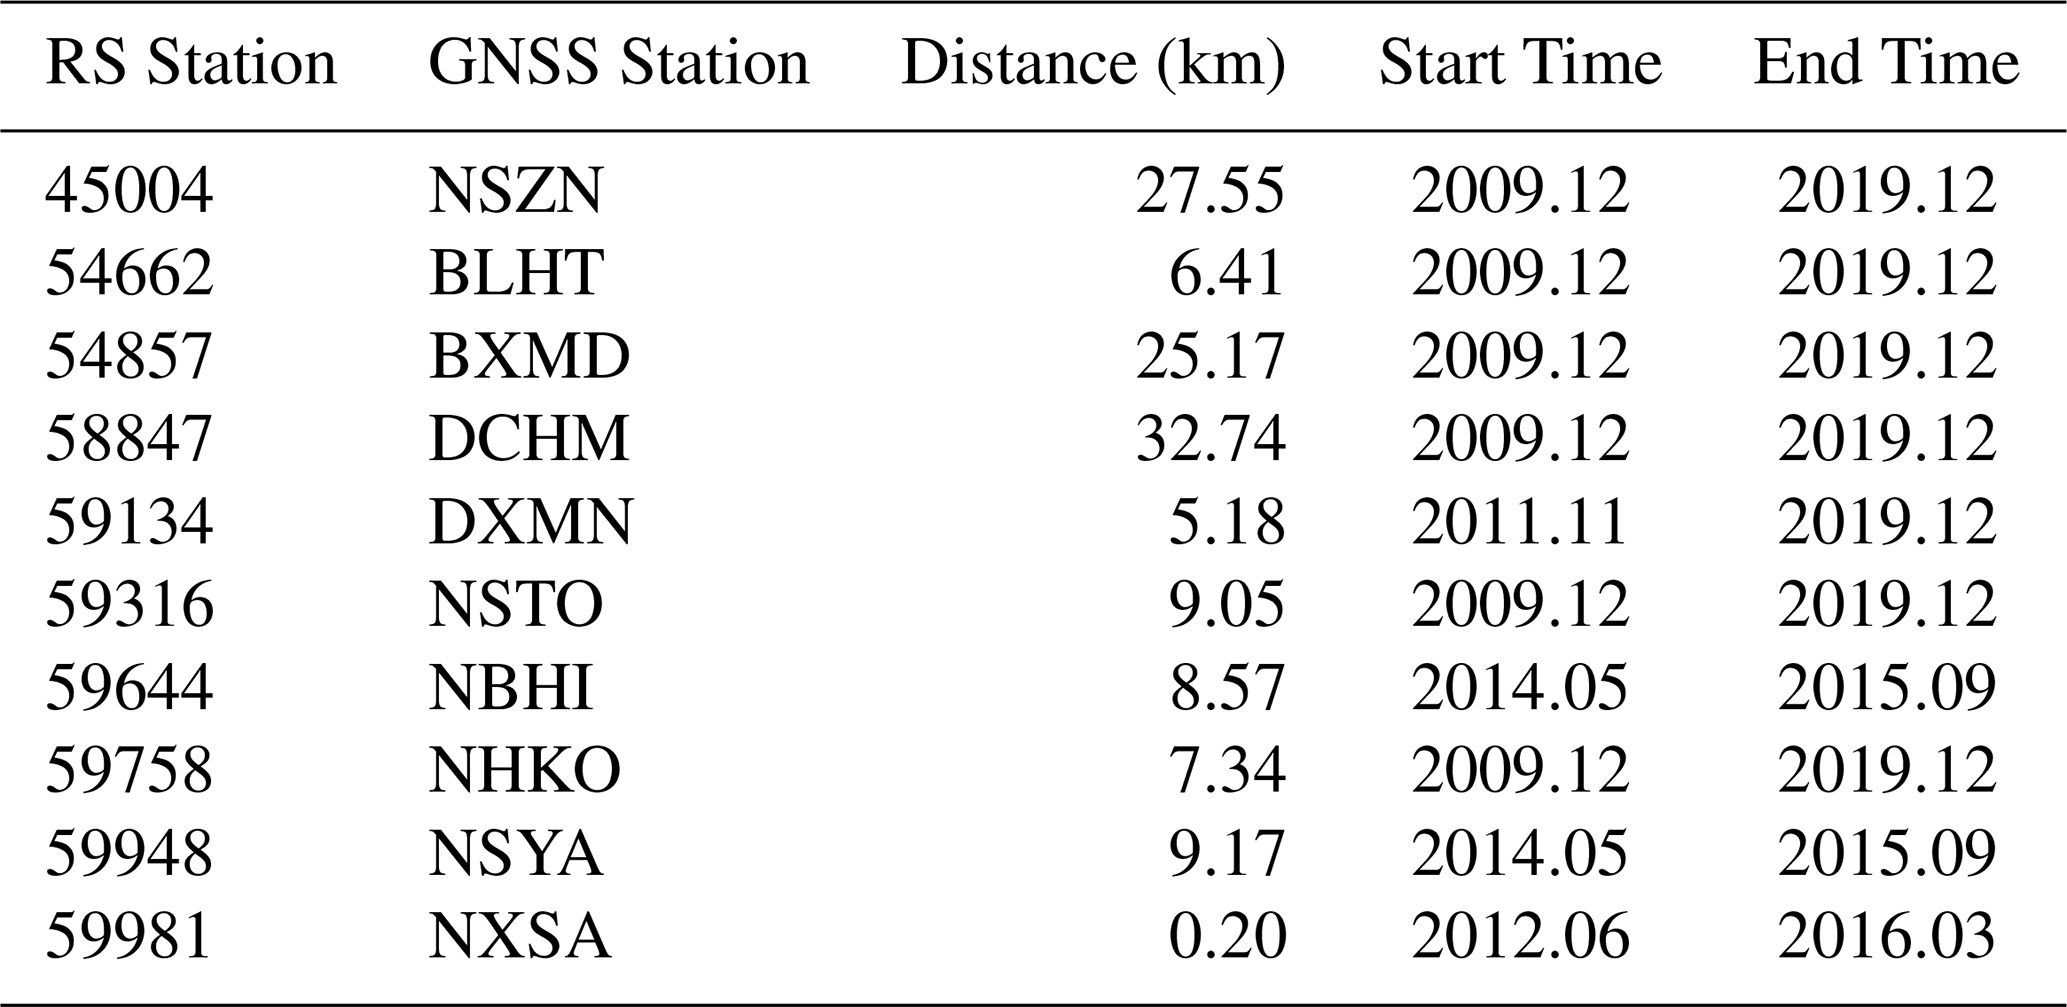
In this study, radiosonde (RS) profiles were used to validate the GNSS PWV data. These profiles were obtained from the Integrated Global Radiosonde Archive (IGRA), which is accessible at (https://www.ncei.noaa.gov/products/weather-balloon/integrated-global-radiosonde-archive, last access: 20 November 2024). IGRA is one of the most comprehensive radiosonde datasets, encompassing over 2800 stations worldwide. Of these, 770 stations provided regular daily observations at 00:00 and 12:00 UTC (Durre et al., 2018). A distance threshold of 30 km and a time threshold of 1 h were applied to select the matching radiosonde stations. As a result, 10 radiosonde stations were selected for validation, which are highlighted in red circles in Fig. 1. Detailed information about the radiosonde and GNSS stations is provided in Table 1.
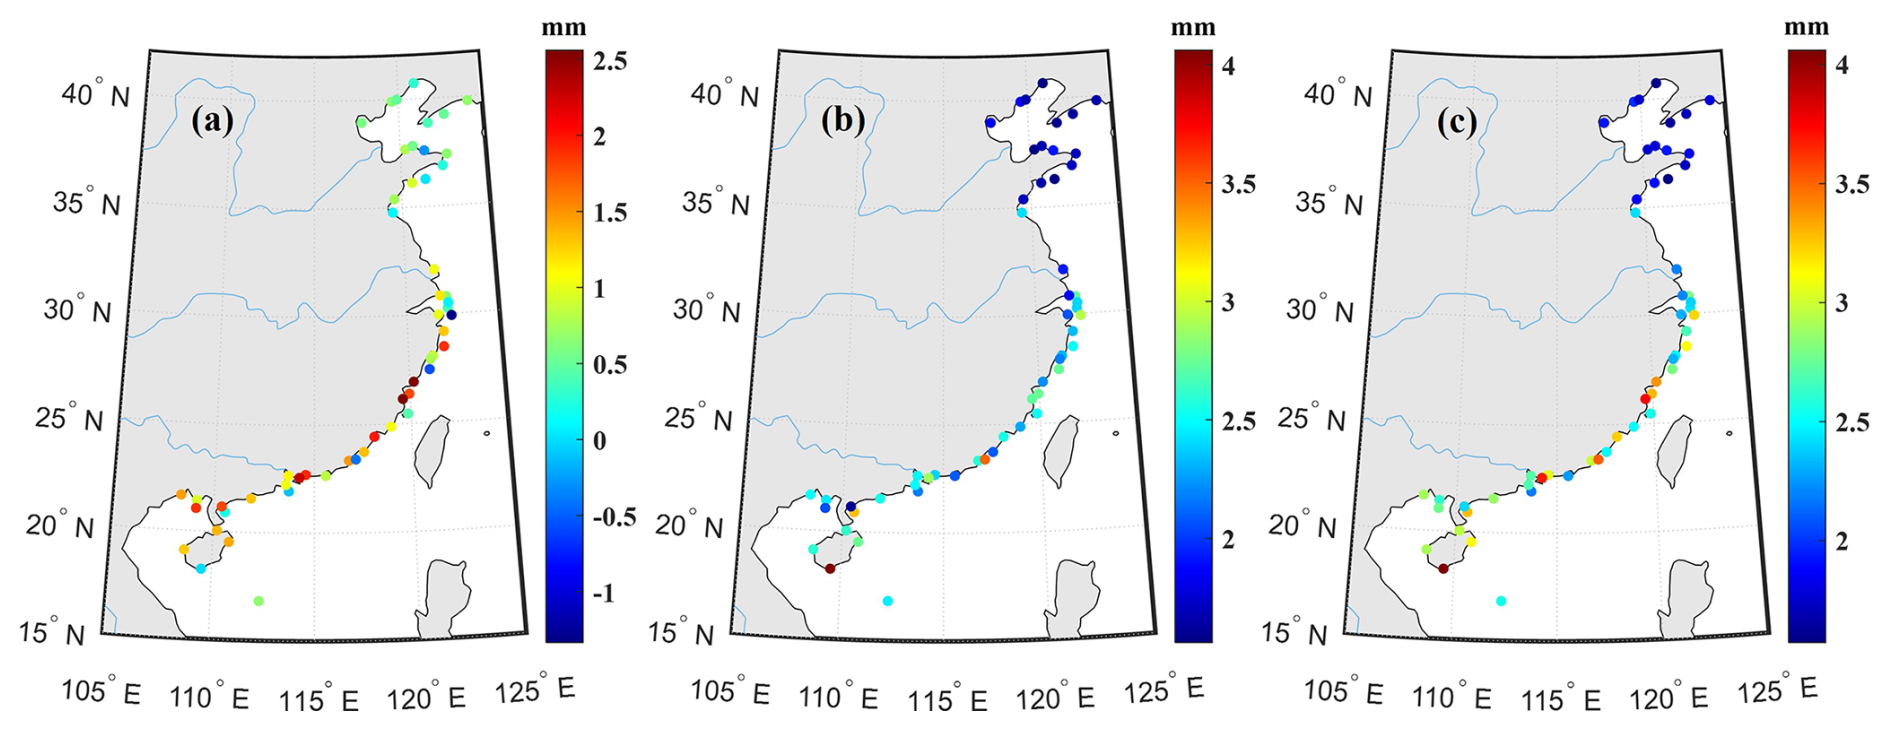
Figure 7Comparison between GNSS PWV and ERA5 PWV: mean bias (a), STD (b), and RMS (c).
The temperature and relative humidity (RH) profiles were obtained from the IGRA dataset, and strict quality control criteria were applied to ensure data reliability. The following conditions were used for quality assurance (Zheng et al., 2022):
-
The profile should extend from the surface to a pressure level of at least 300 hPa.
-
The profile should contain data for more than five pressure levels below 100 hPa.
-
The pressure gap between adjacent layers should not exceed 200 hPa.
-
Contain data at all 10 mandatory levels and significant levels.
After applying these quality control procedures to the radiosonde profiles, the water vapor was derived as follows:
3.1 Evaluation of GNSS Water Vapor Estimates
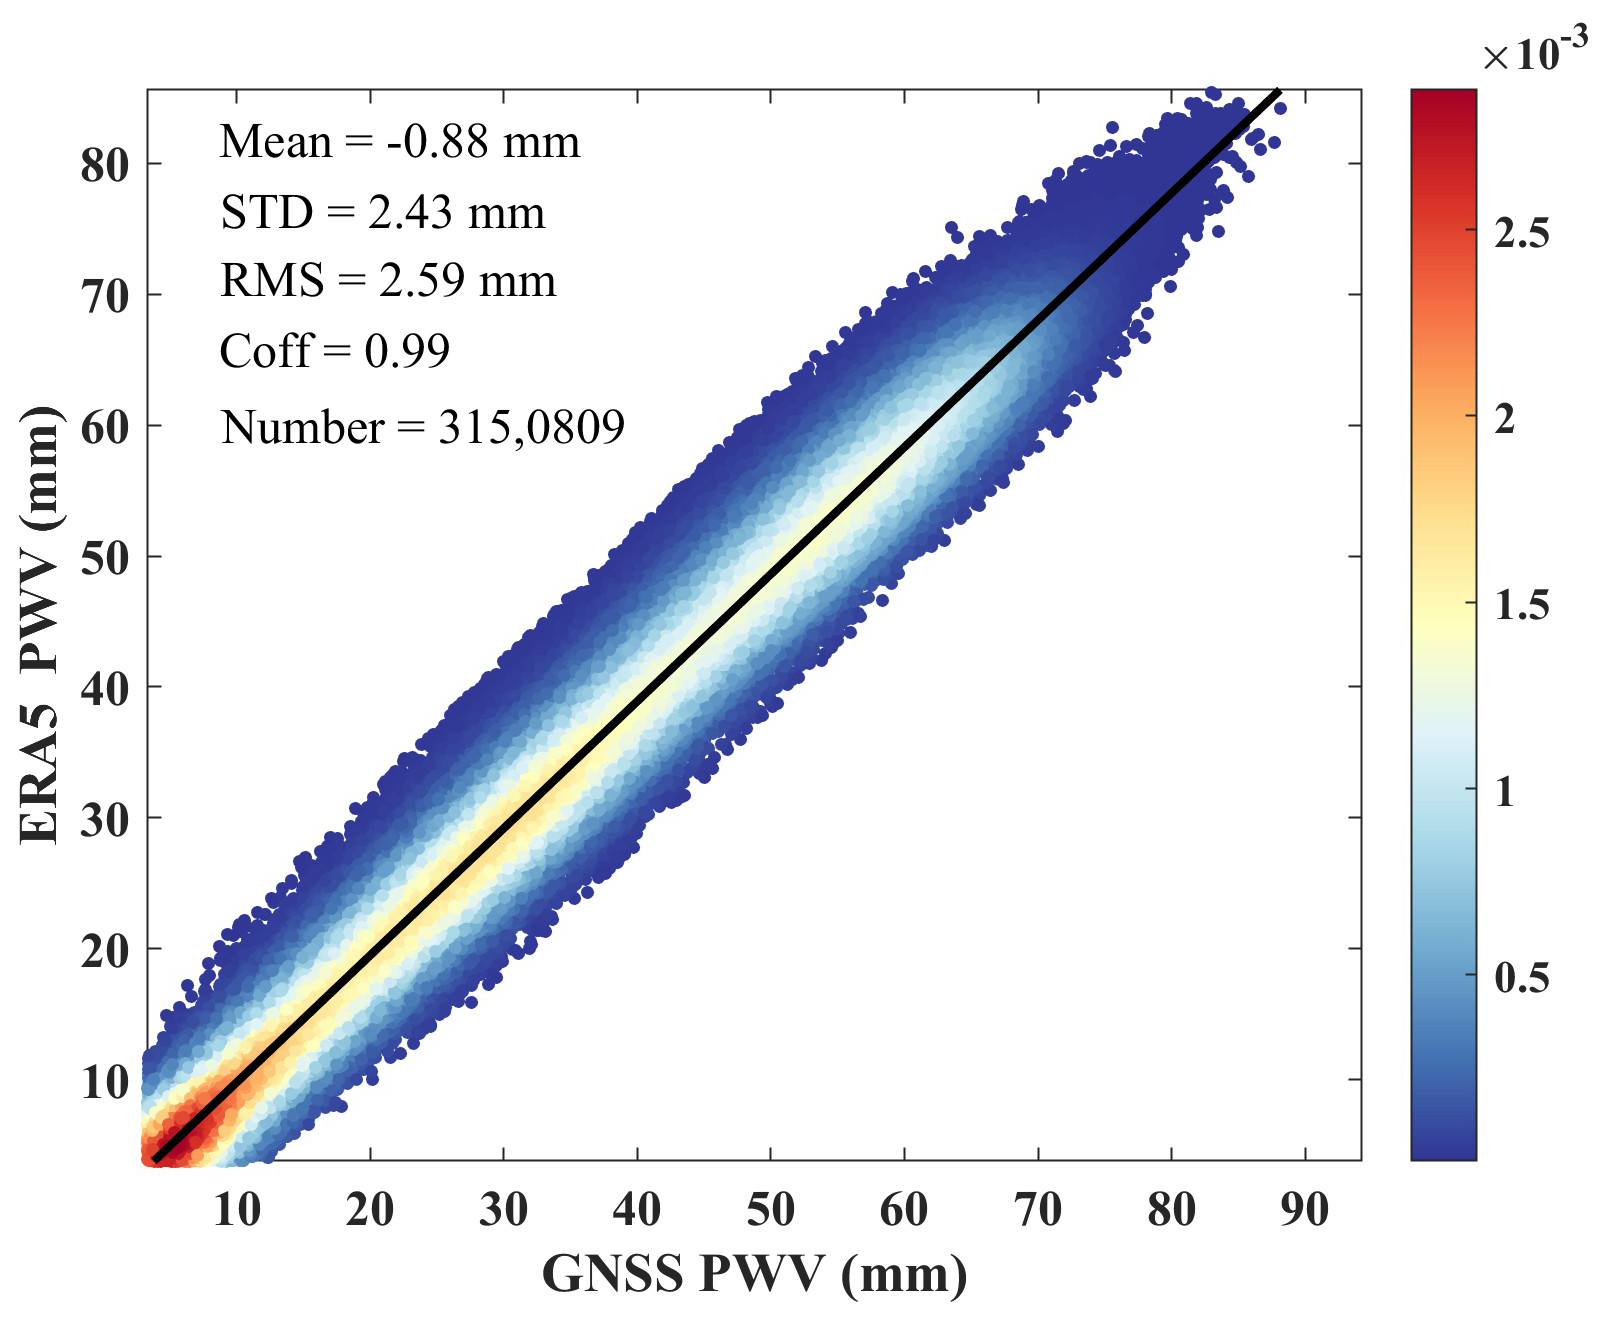
3.1.1 Comparison with ERA5 PWV Products
To validate the GNSS-derived PWV estimates, we compared them with single-level PWV products from ERA5. Before the comparison, a height correction was applied to the GNSS PWV data. The corresponding values for each GNSS station were obtained using bilinear interpolation in the horizontal dimension. Outliers in the GNSS PWV data were removed using the two-sigma rule. The results of this comparison are shown in Fig. 6. The GNSS PWV estimates exhibit excellent agreement with the ERA5 PWV, with an RMS difference of 2.59 mm. On average, the GNSS PWV is slightly lower than the ERA5 PWV by 0.88 mm. Additionally, the correlation coefficient between the GNSS and ERA5 PWV is 0.99, indicating a very high level of consistency between the datasets.
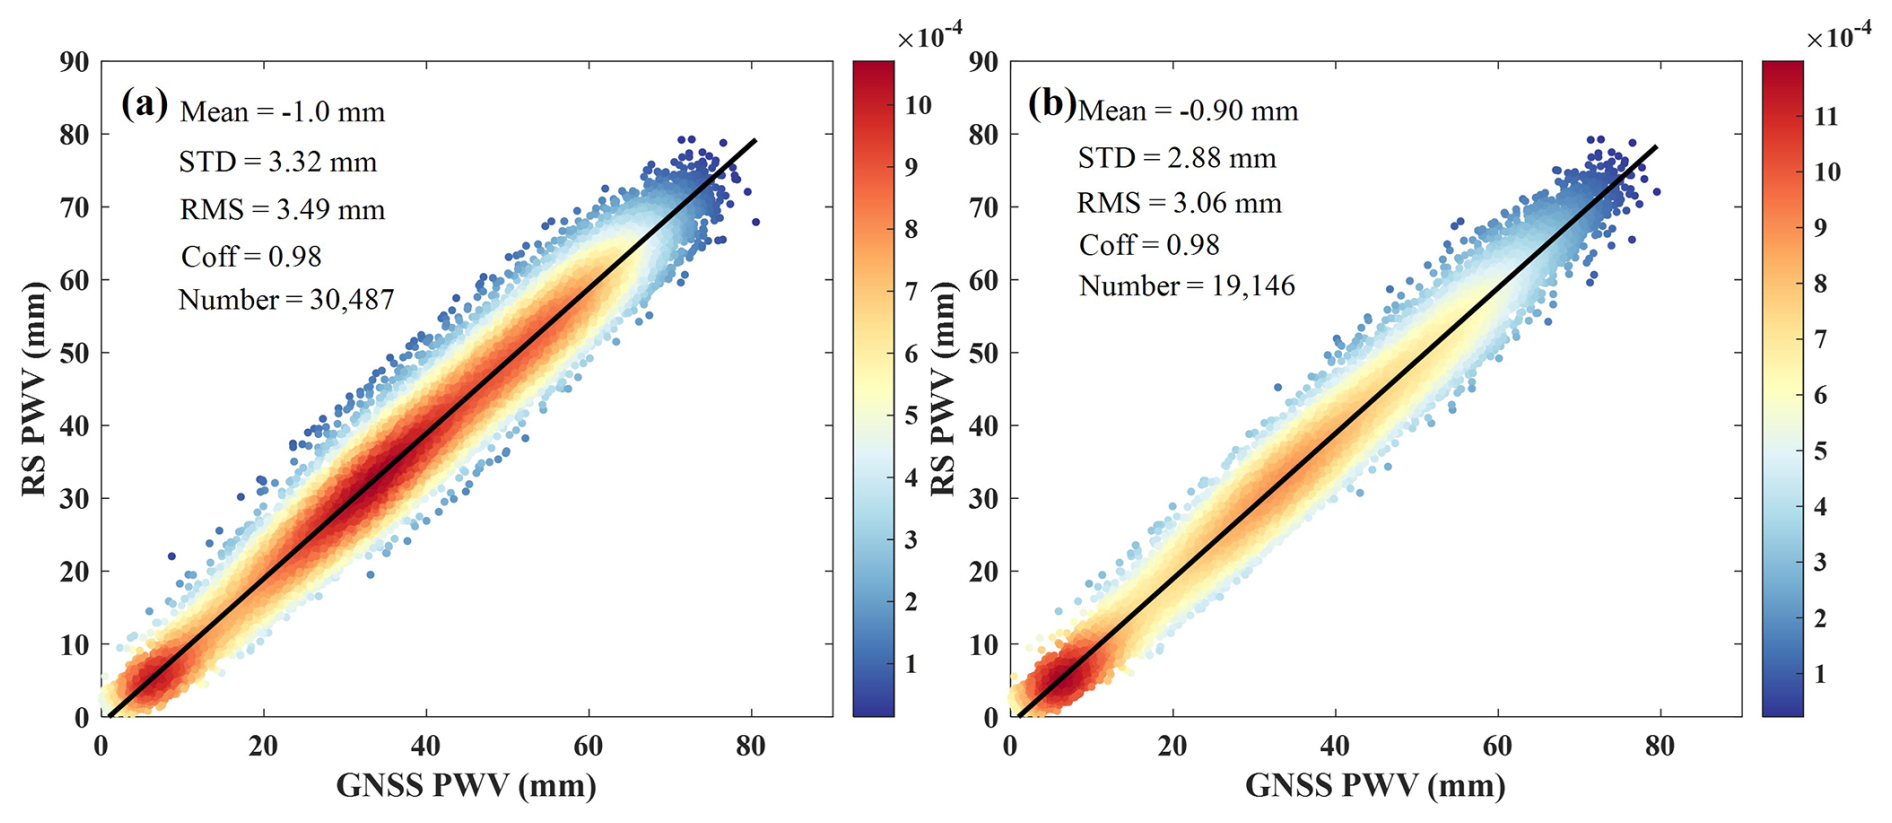
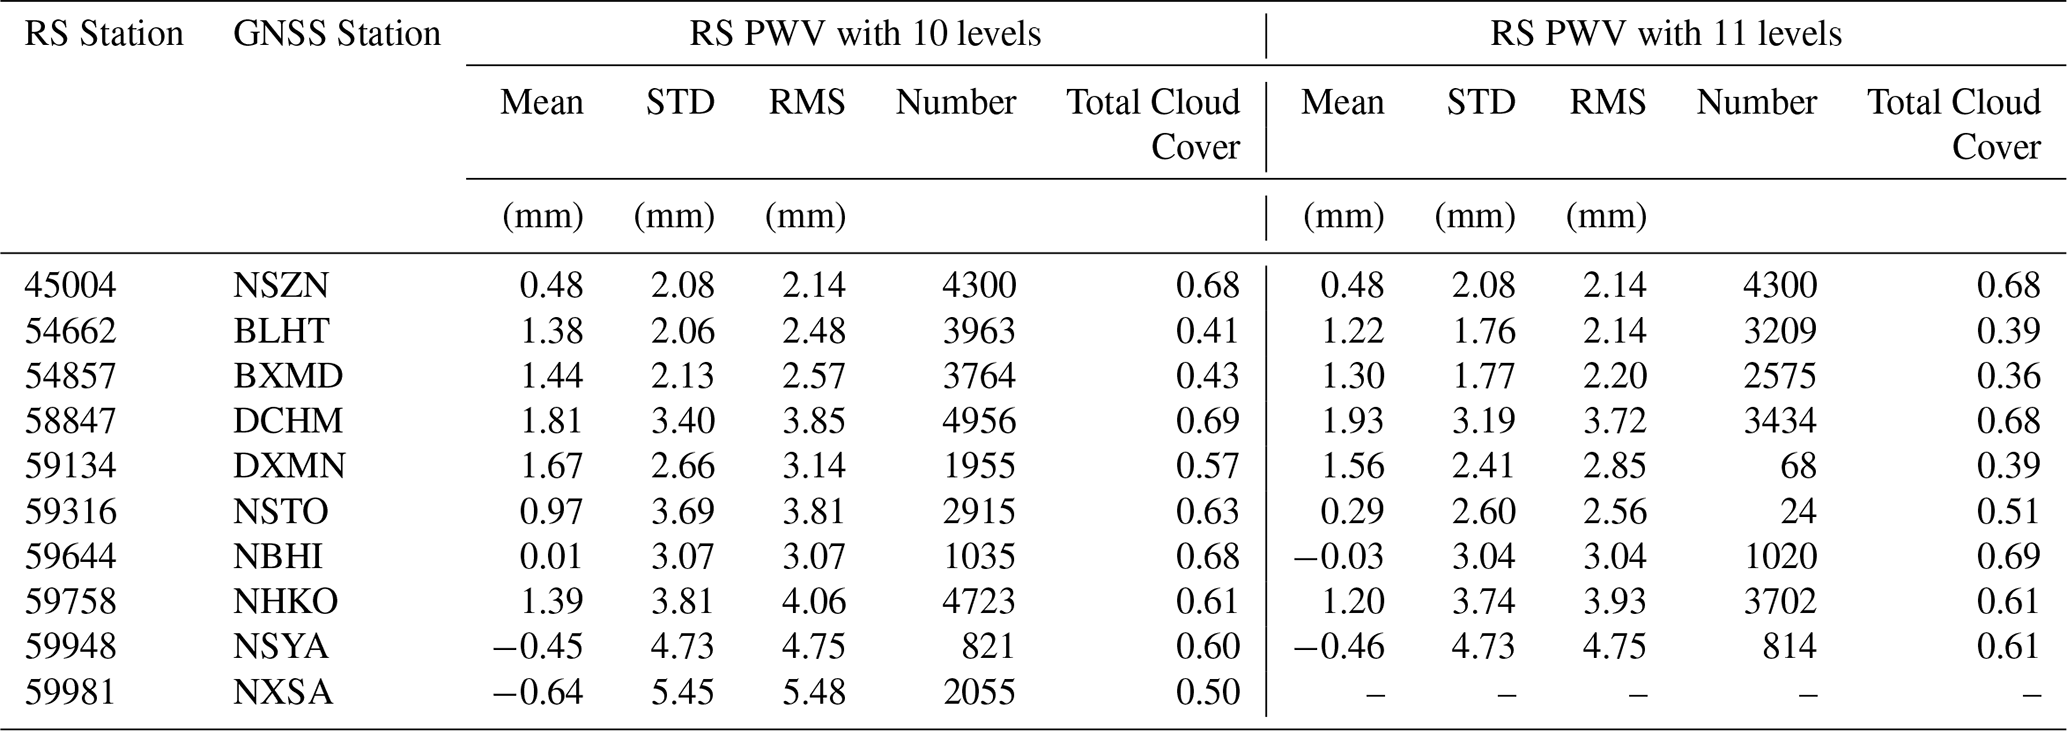
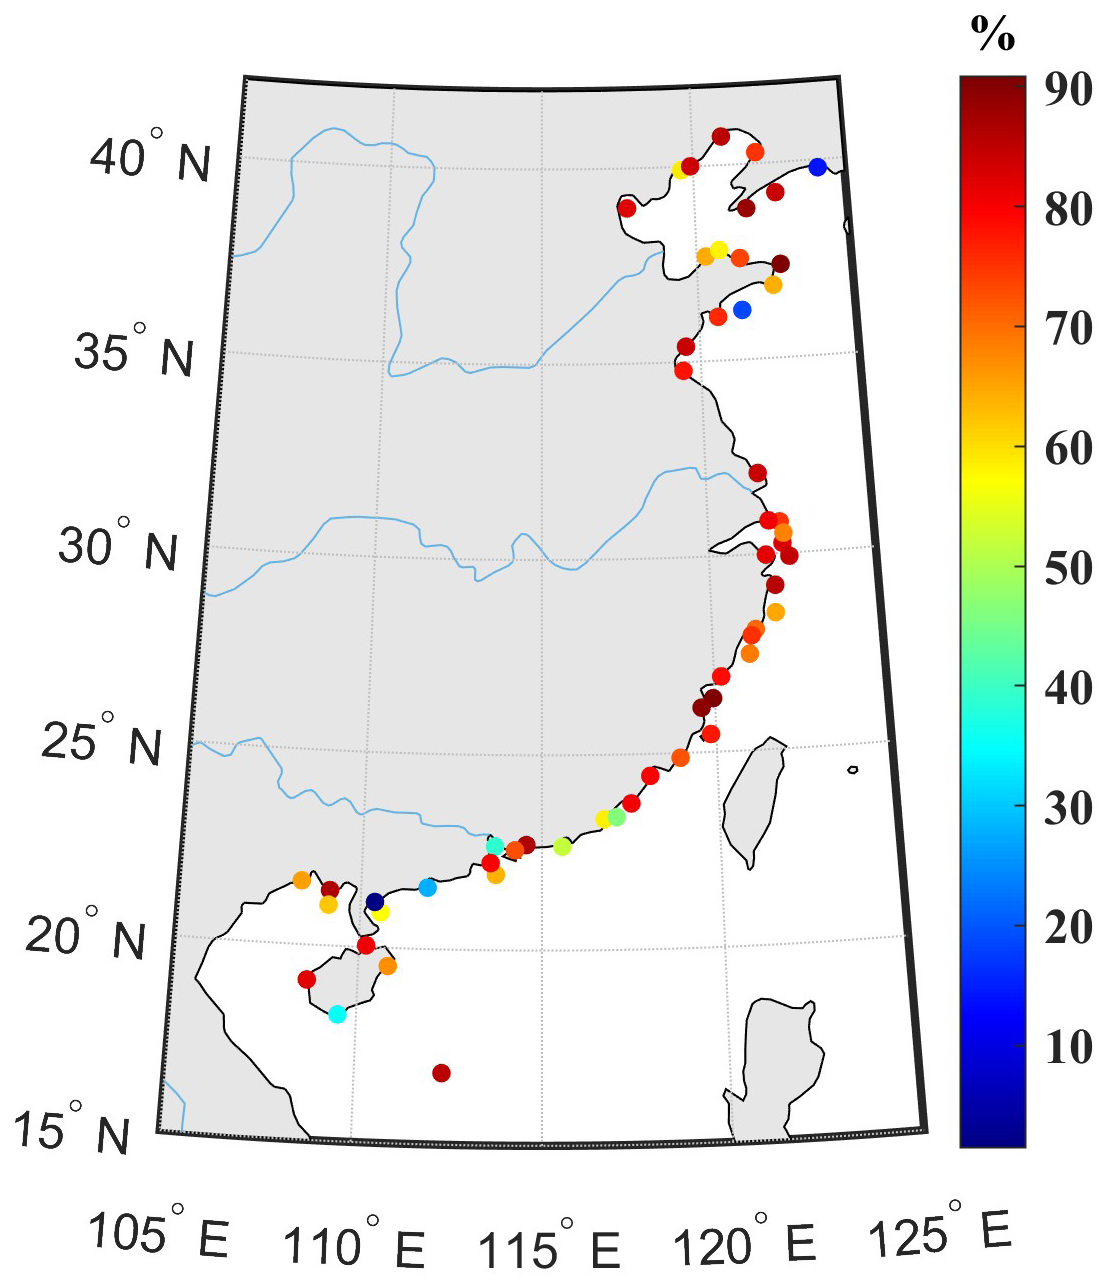
Figure 10Completeness of GNSS PWV at each station.
Additionally, the performance of GNSS-derived PWV at each site was evaluated, as shown in Fig. 7. The results indicate that GNSS sites located between 35 and 45° N, covering the Bohai Sea and the northern Yellow Sea, exhibit significantly better agreement than other sites. In these regions, the mean biases are close to zero, and the standard deviation (STD) values are less than 2 mm. These areas, characterized by a temperate monsoon climate, show more stable variations in water vapor. Furthermore, the ionosphere in these regions is less active compared to other areas. In contrast, for GNSS sites located in regions with subtropical and tropical monsoon climates, the discrepancies are more pronounced, with mean biases exceeding 1 mm and RMS differences greater than 2.5 mm.
3.1.2 Comparison with Radiosonde Profiles
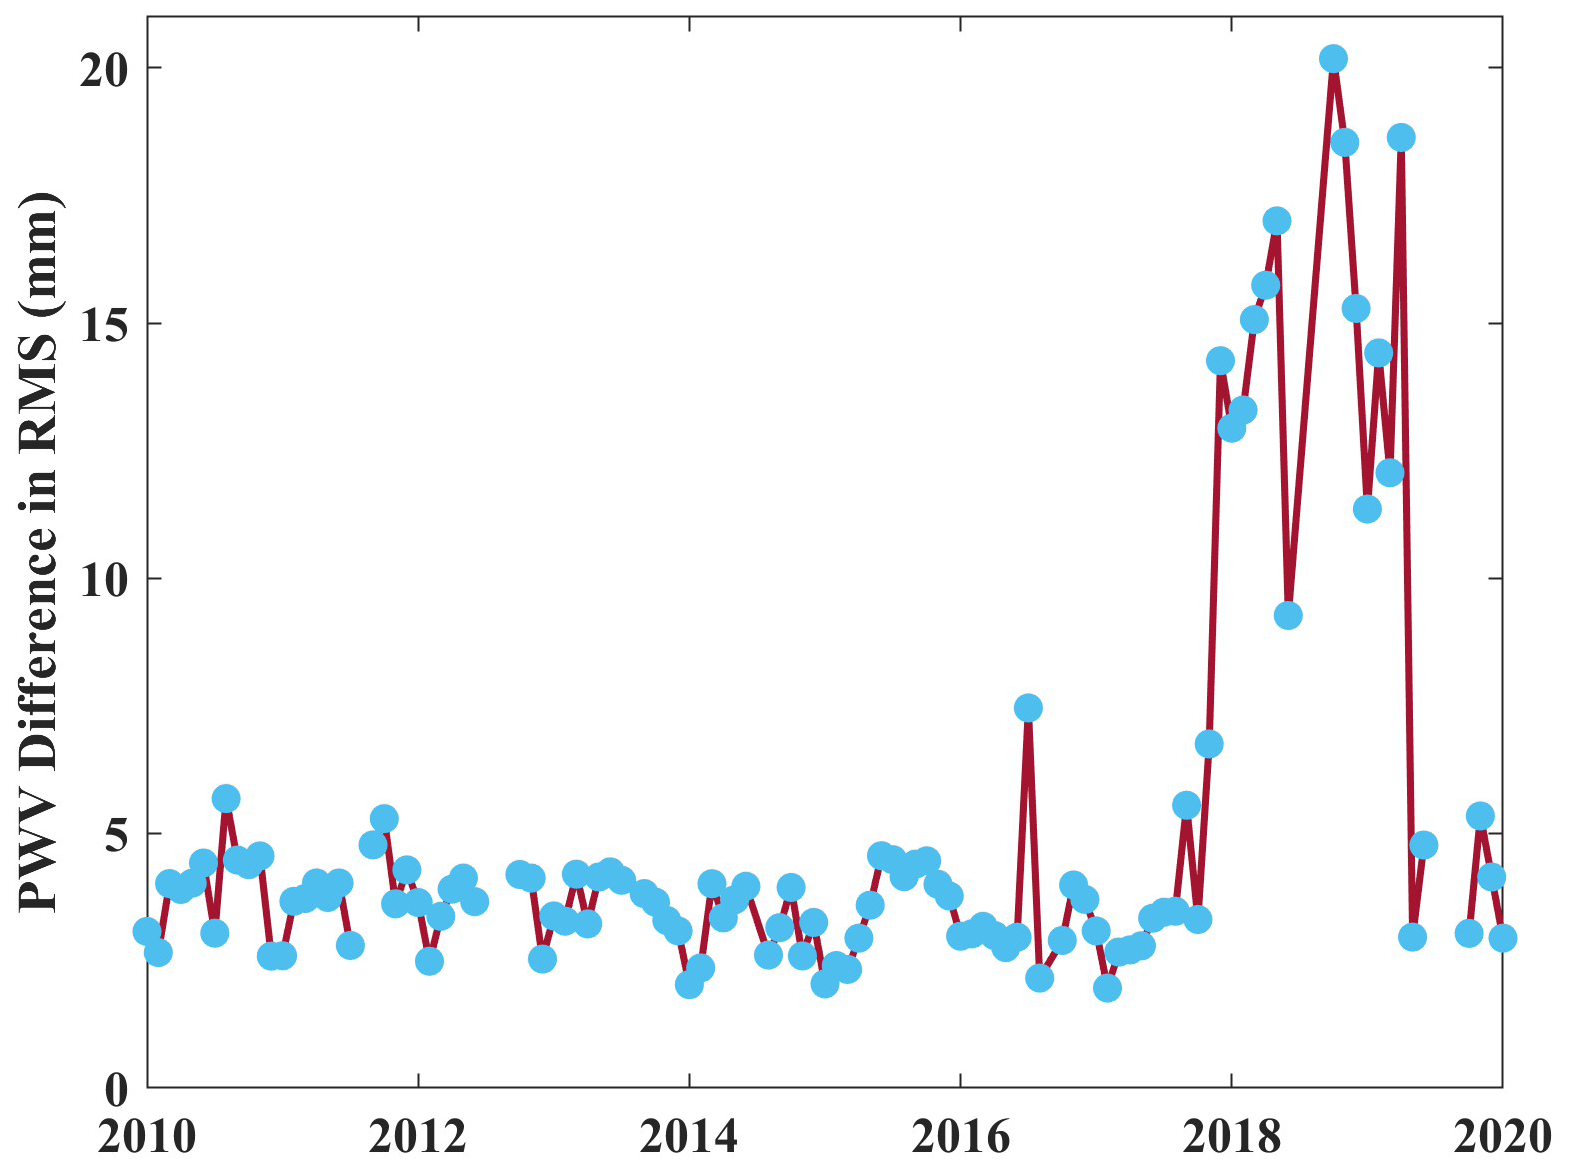
Furthermore, PWV data derived from RS profiles were used to evaluate the GNSS PWV estimates. As mentioned in Sect. 2.1.4, GNSS ZTDs at the DCHM dataset exhibit significant discrepancies compared to the ERA5 ZTDs. To assess the accuracy of the GNSS PWV data, we compared the PWV estimates from the DCHM GNSS station with those from a nearby RS station. The monthly differences in the RMS values are shown in Fig. 8. It is evident that during the period from October 2017 to March 2018, the monthly RMS differences exceeded 10 mm, which further suggests that the quality of the GNSS observations from the DCHM station during this period is unreliable.
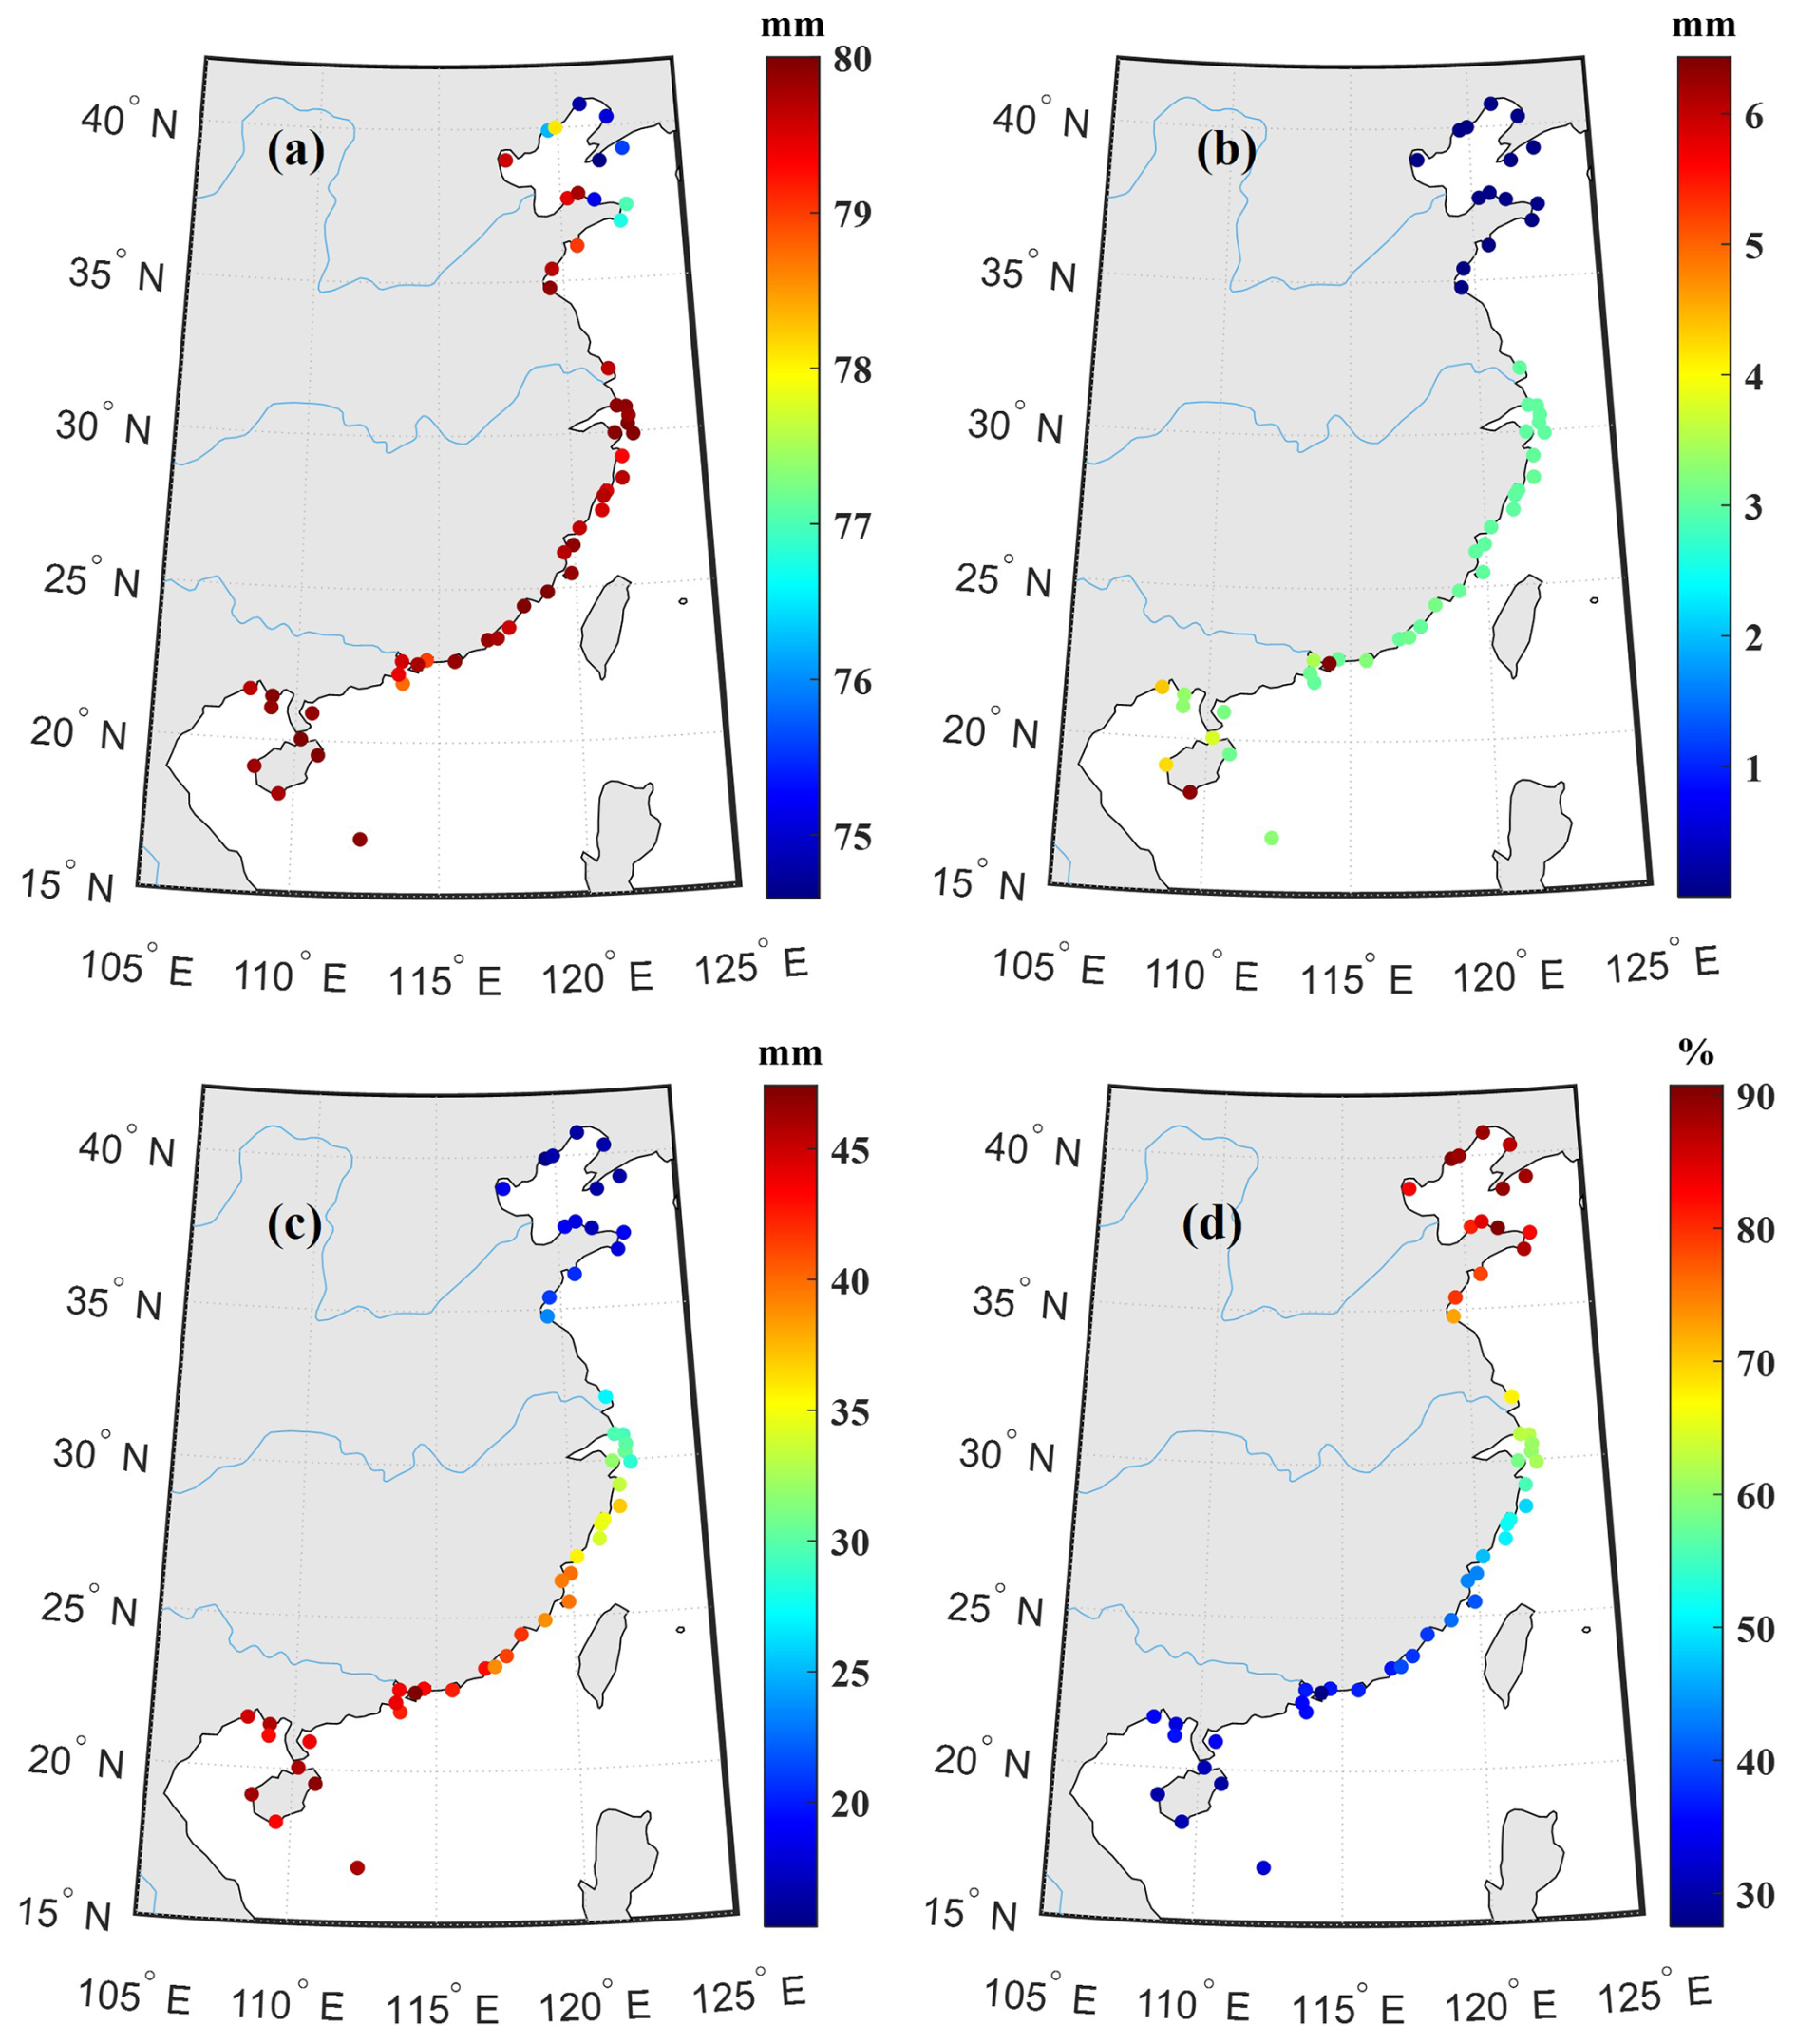
Figure 11Maxima (a), minima (b), mean values (c), and coefficients of variations (d) for hourly PWV products of China coastal GNSS stations.
The overall comparison between RS-derived PWV and GNSS PWV is presented in Fig. 9a. The RMS difference is 3.49 mm, which is larger than the difference when compared to ERA5 PWV. This discrepancy may be attributed to the nature of ERA5 data, which is a reanalysis product, while RS profiles provide only one or two observations per day. Additionally, the quality of the RS profiles may contribute to the larger biases observed. As shown in Fig. 9b, when the mandatory levels of RS profiles are increased from 10 to 11, the RMS difference decreases to 3.06 mm. This suggests that stricter quality control of RS profiles improves the agreement with GNSS PWV. However, this stricter filtering significantly reduces the number of comparison points (see Table 2). Notably, RS profiles near the DXMN, NTSO, and NXSA stations show a marked reduction in data points, indicating that the quality of the RS data from these stations is relatively poorer. We also examined total cloud cover from ERA5 (the fraction of the sky occupied by clouds, 0–1) at the comparison times. Stations in the temperate–monsoon regime generally show lower cloud-cover values than the other sites – DXMN is an exception because most of its match-ups occur in spring. The larger PWV biases seen at the cloudier stations likely stem from the differing sampling geometries of the two sensors: GNSS estimates average water vapor over a conical footprint roughly 20 km in diameter that can encompass both clear and cloudy areas, whereas the radiosonde ascends directly through the local cloud or rain column.
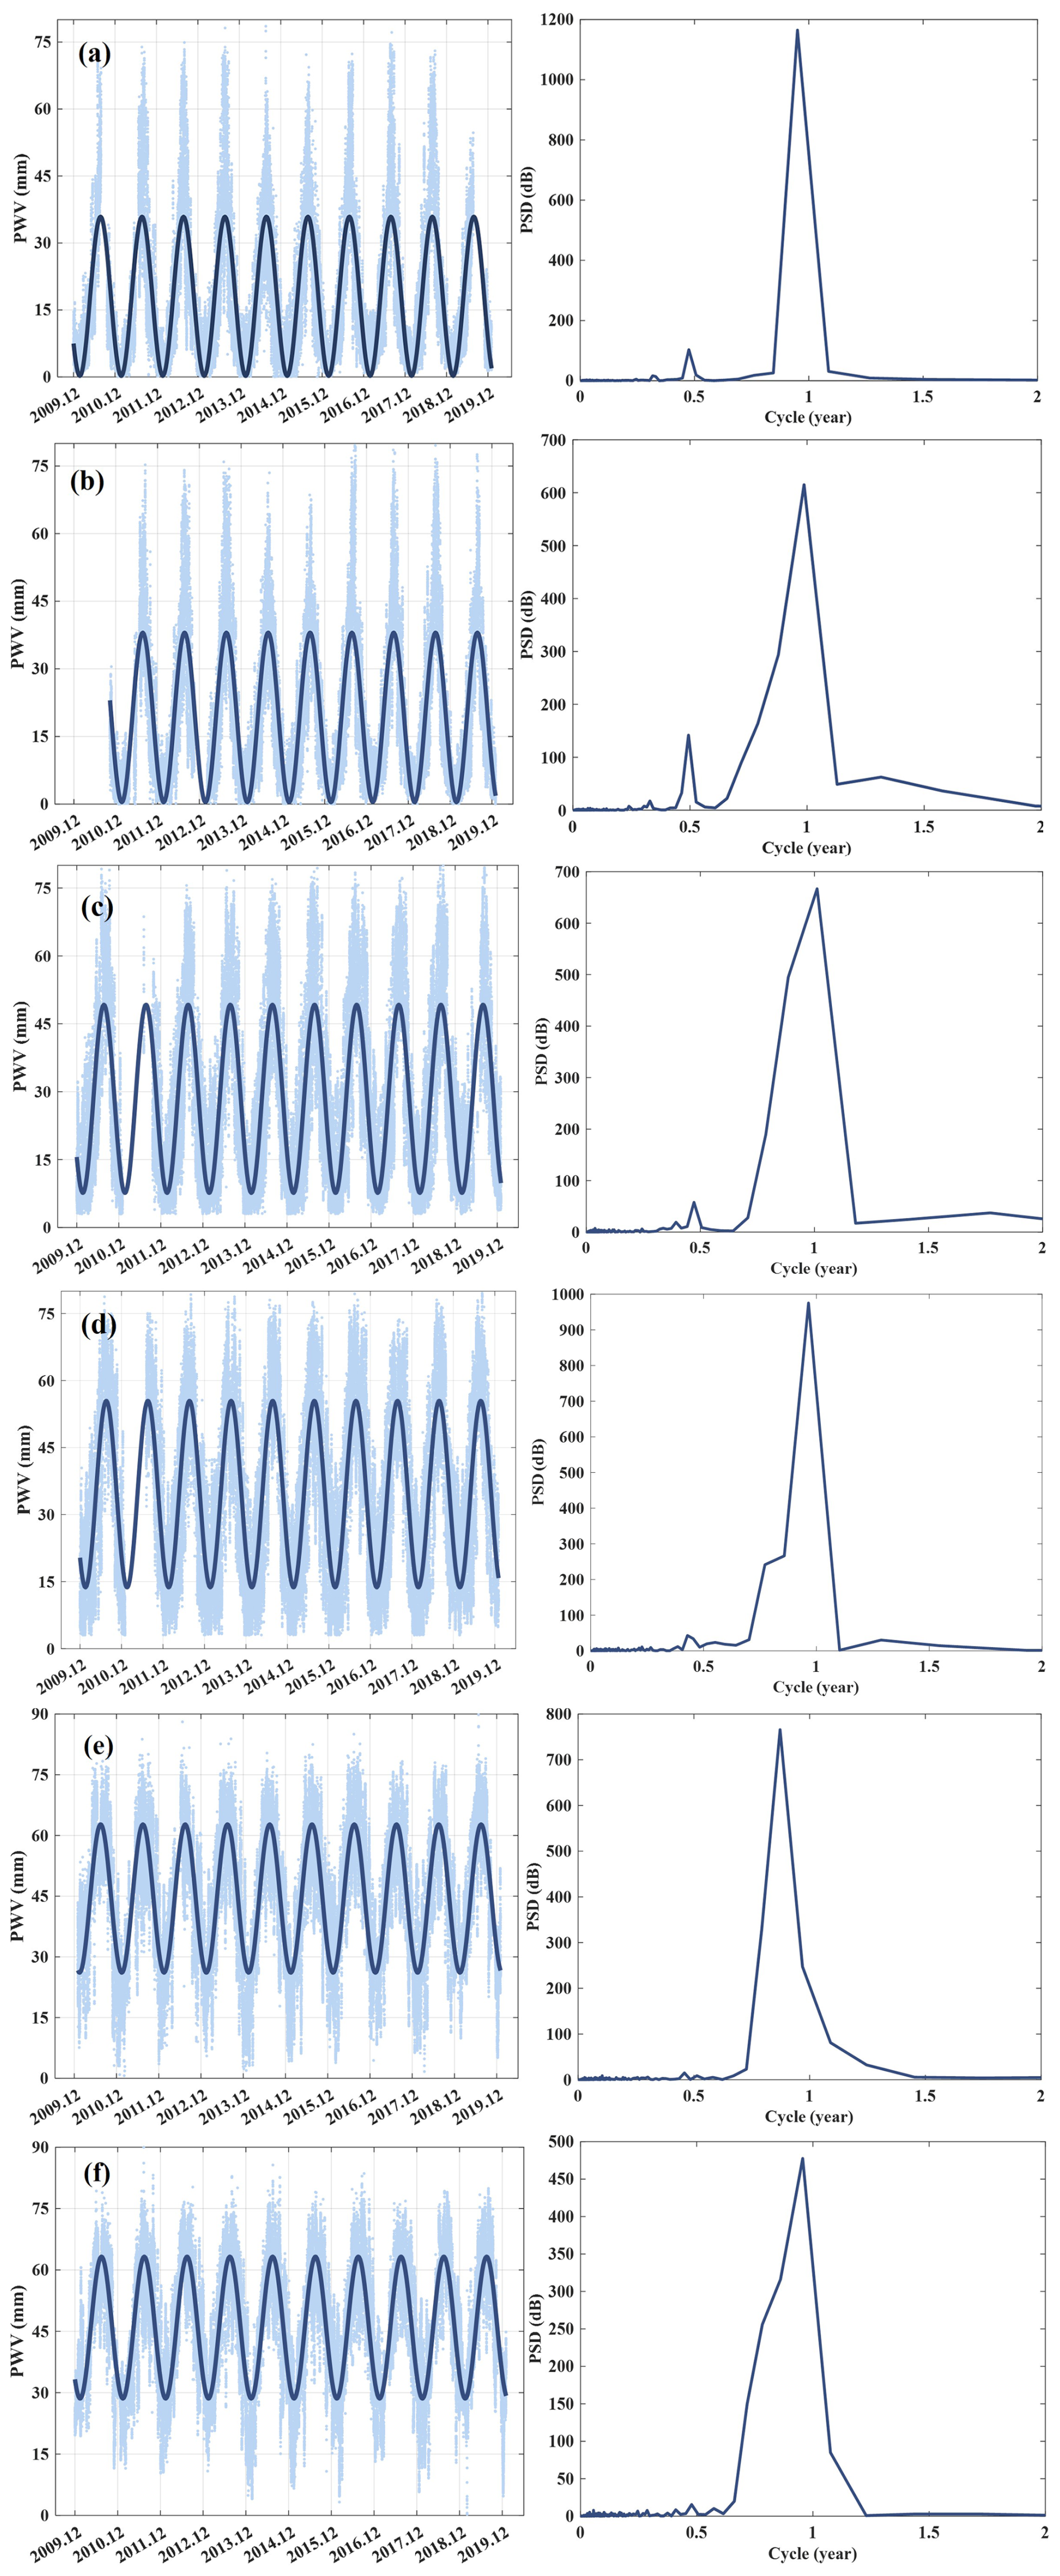
Figure 12PWV time series and corresponding spectrum analysis at BLHT (a), BTGU (b), DLSI (c), DSPU (d), NHZH (e), and NWZU (f).
3.2 Spatiotemporal Characteristics of China Coastal GNSS PWV
After applying strict quality control to the GNSS PWV data from each station and validating the results using ERA5 products and RS profiles, we generated the China coastal GNSS PWV products. The spatial characteristics of the hourly GNSS PWV time series were analyzed using several metrics, including maximum value, minimum value, mean value, and the coefficient of variation (CV), defined as the ratio of the STD to the mean value. The completeness of the GNSS PWV data at each station is presented in Fig. 10. Most stations have a completeness rate exceeding 70 %, with the average completeness of the GNSS PWV products at 69.5 %. However, the completeness for some stations is as low as 15 %. To minimize the impact of missing data, only GNSS stations with data spanning at least three years and covering at least one full year were selected, resulting in a total of 51 coastal GNSS stations.
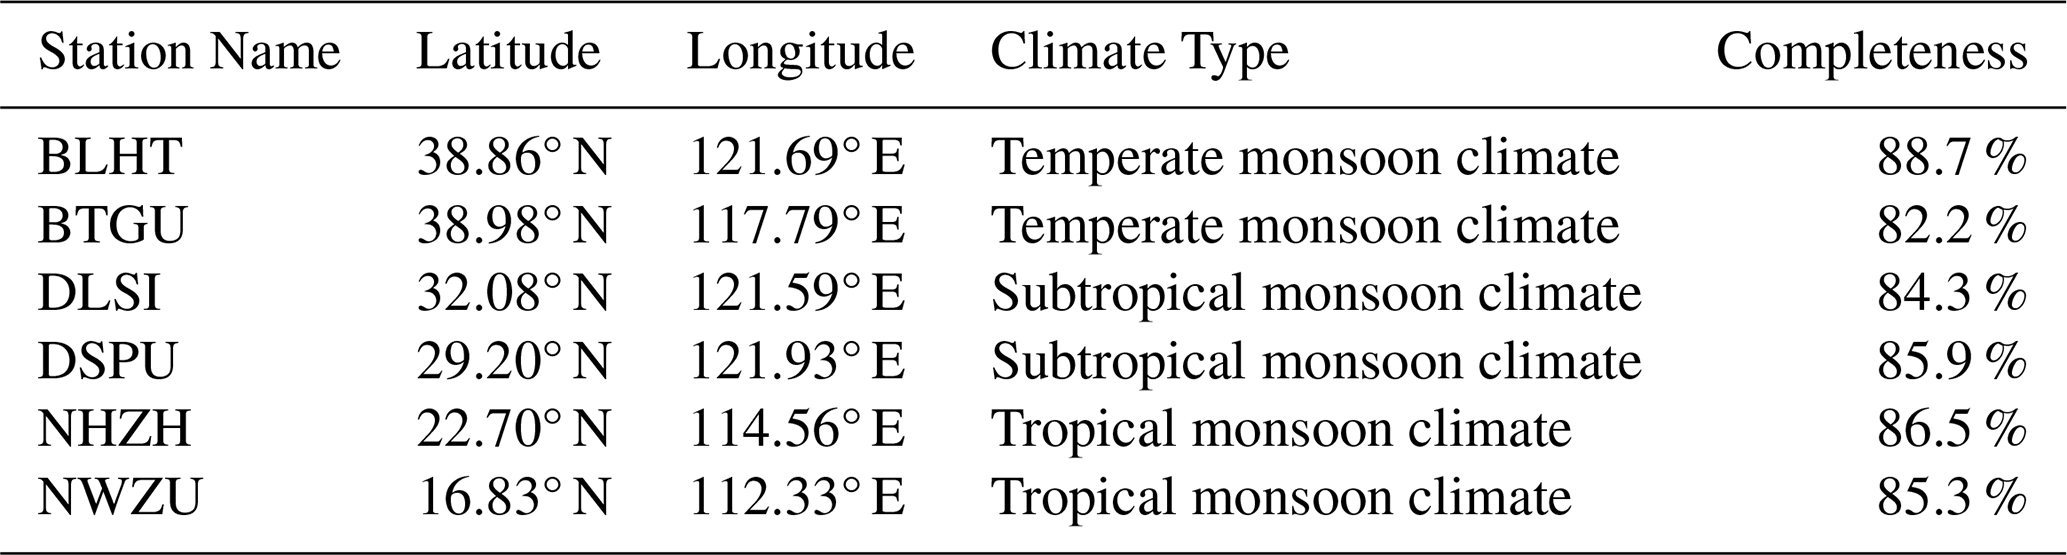
Table 3Detailed information of selected coastal GNSS stations.
As shown in Fig. 11, the minimum values of China coastal GNSS PWV generally decrease with latitude, with the lowest value of approximately 0.01 mm observed at the station near Dalian, as shown in Fig. 10b. The minimum values in subtropical and tropical monsoon climate areas are around 3 mm due to the lower threshold for these areas. The spatial distribution of the maximum values, however, is more complex. GNSS stations in the Bohai Sea and northern Yellow Sea exhibit the smallest maximum values, typically less than 80 mm. In contrast, maximum values of coastal GNSS PWV around the Yangtze River estuary are larger. This increase may be attributed to the higher frequency of typhoons in this region. For other GNSS stations located between 30 and 15° N, the maximum values range from 78 to 80 mm.
The mean PWV values show a clear increasing trend as one moves toward the Equator. In the Bohai Sea, the mean values are generally less than 20 mm, while in regions between 25 and 15° N, the mean values are typically above 40 mm. The lowest mean value, 15.3 mm, is observed at BQHD in Qinghuangdao, Hebei Province, while the highest mean value, 47.4 mm, is found at NQLN in Qinglan, Hainan Province. In contrast, the CV values are higher at lower latitude regions, with the largest CV value of 90.7 % observed at BZFD in Yantai. The lowest CV value, 27.5 %, is found at NSZN in Shenzhen. This suggests that the STD of PWV in areas with higher mean values is relatively smaller in proportion to the mean value.
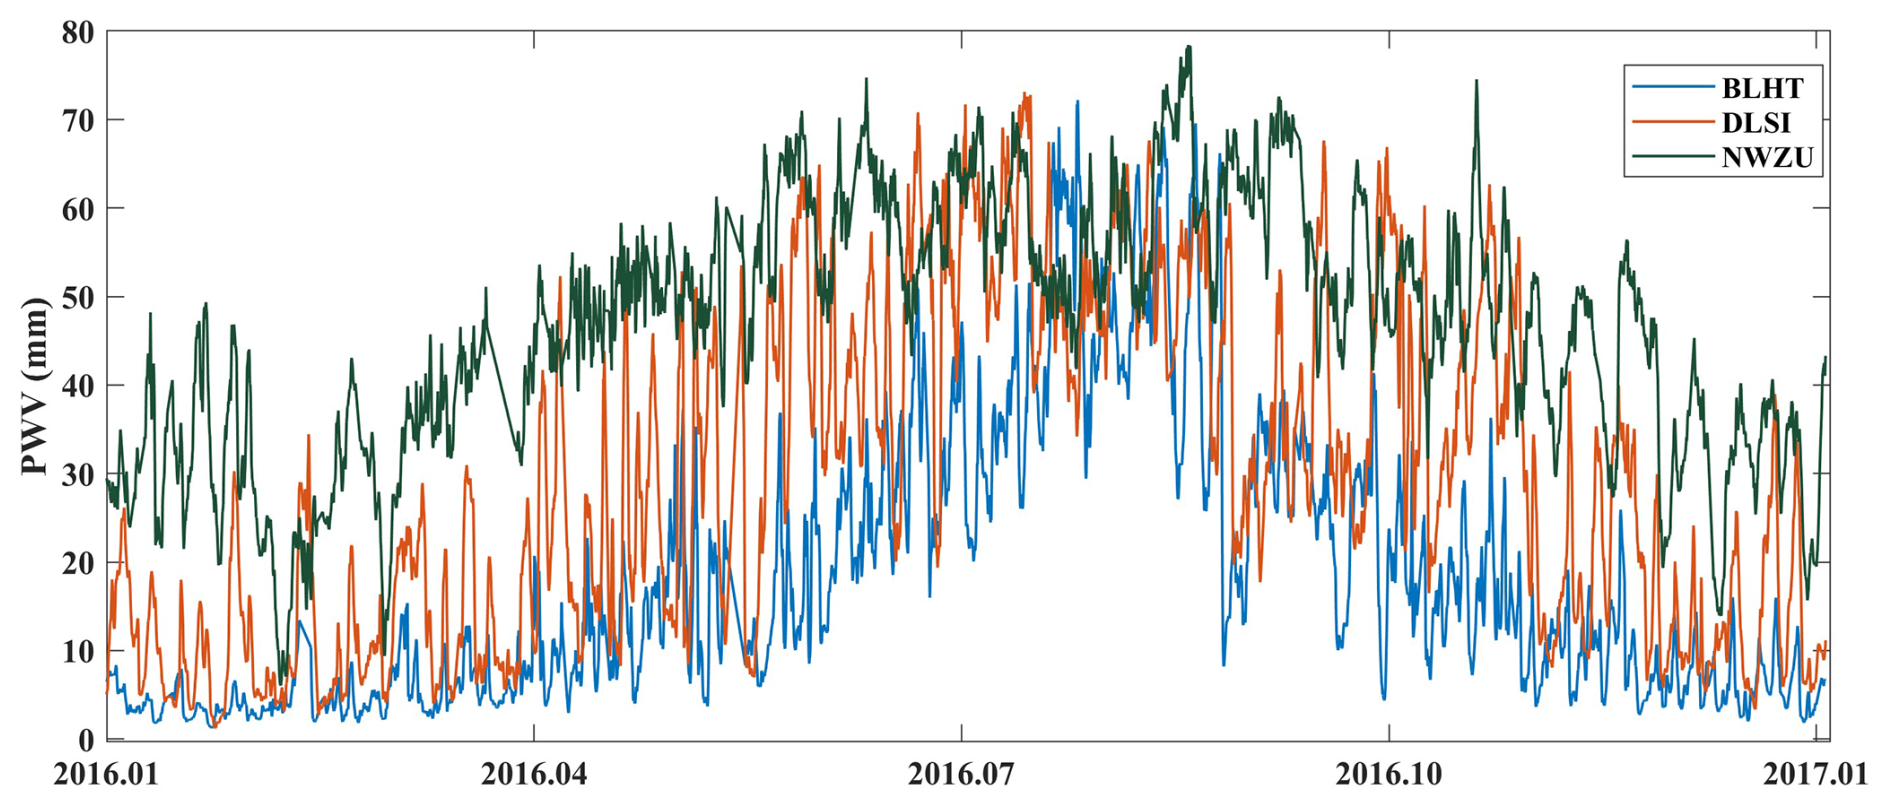
To analyze the temporal characteristics of GNSS PWV, six coastal GNSS stations were selected, ranging from high to low latitudes and representing three distinct climate patterns. Each station has a completeness rate exceeding 80 %. Detailed information about the selected GNSS stations is provided in Table 3. The PWV time series and their fitted trends are shown in the left panel of Fig. 12, while the results of Fourier spectrum analysis are presented in the right panel. As shown in Fig. 12, the PWV time series at all stations exhibit a clear annual variation. However, stations located in high-latitude regions display a more pronounced semi-annual pattern in addition to the annual cycle. In contrast, the PWV time series at stations influenced by a tropical monsoon climate (Fig. 12e and f) predominantly show an annual cycle with no significant semi-annual component. In addition, we analyze the PWV series for the year 2016 at the GNSS stations BLHT, DLSI, and NWZU. The variation in PWV at BLHT is significantly greater than that observed at DLSI and NWZU. Furthermore, the station situated in a tropical monsoon climate, NWZU, consistently exhibits PWV values exceeding 20 mm. The highest PWV values across these stations occur around August, coinciding with the peak typhoon season.
3.3 Relationship Between Sea Surface Temperature and Coastal GNSS PWV
In the context of global warming, the climate impact of ENSO has intensified. ENSO events are typically monitored using SST, and variations in water vapor are strongly linked to ENSO activity. Therefore, we investigated the relationship between coastal PWV from 51 GNSS stations with data spanning at least three years and nearby SST. The correlation coefficients between GNSS PWV and SST are presented in Fig. 14. As observed, the correlation coefficients between PWV and SST exceed 0.7 for all stations, with seven stations showing values greater than 0.8. The mean correlation coefficient is 0.76, indicating a strong positive relationship between the two datasets. Furthermore, the correlation coefficients for GNSS stations in subtropical monsoon climates are generally lower than those in areas with a temperate monsoon climate. This may be due to the lower frequency of extreme weather events, such as typhoons, in subtropical regions compared with temperate regions.
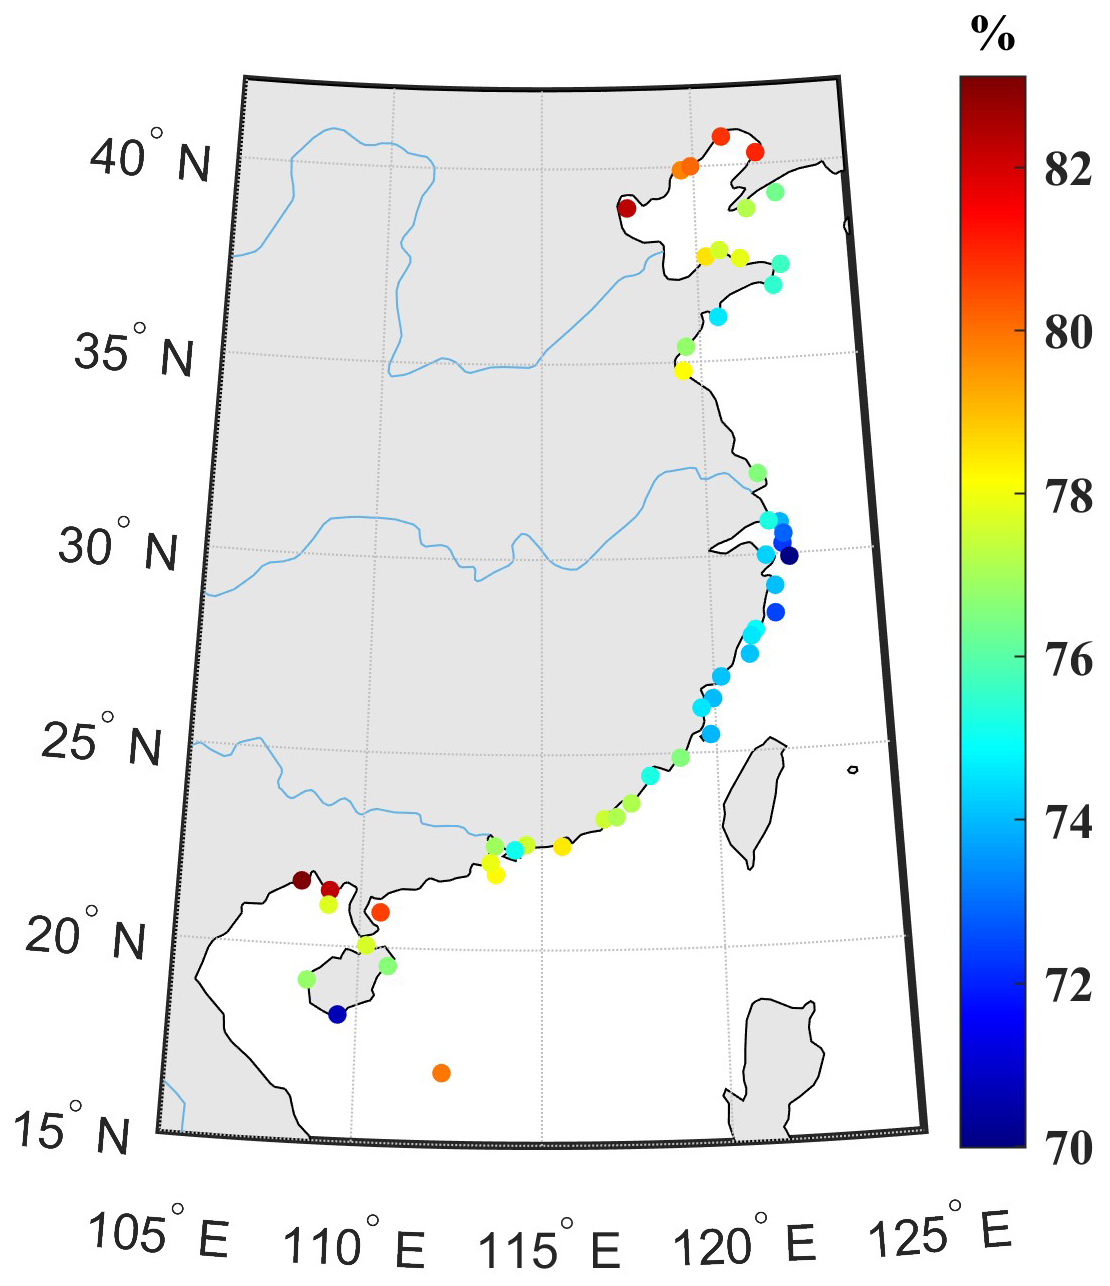
Figure 14Correlation coefficients between GNSS PWV and SST.
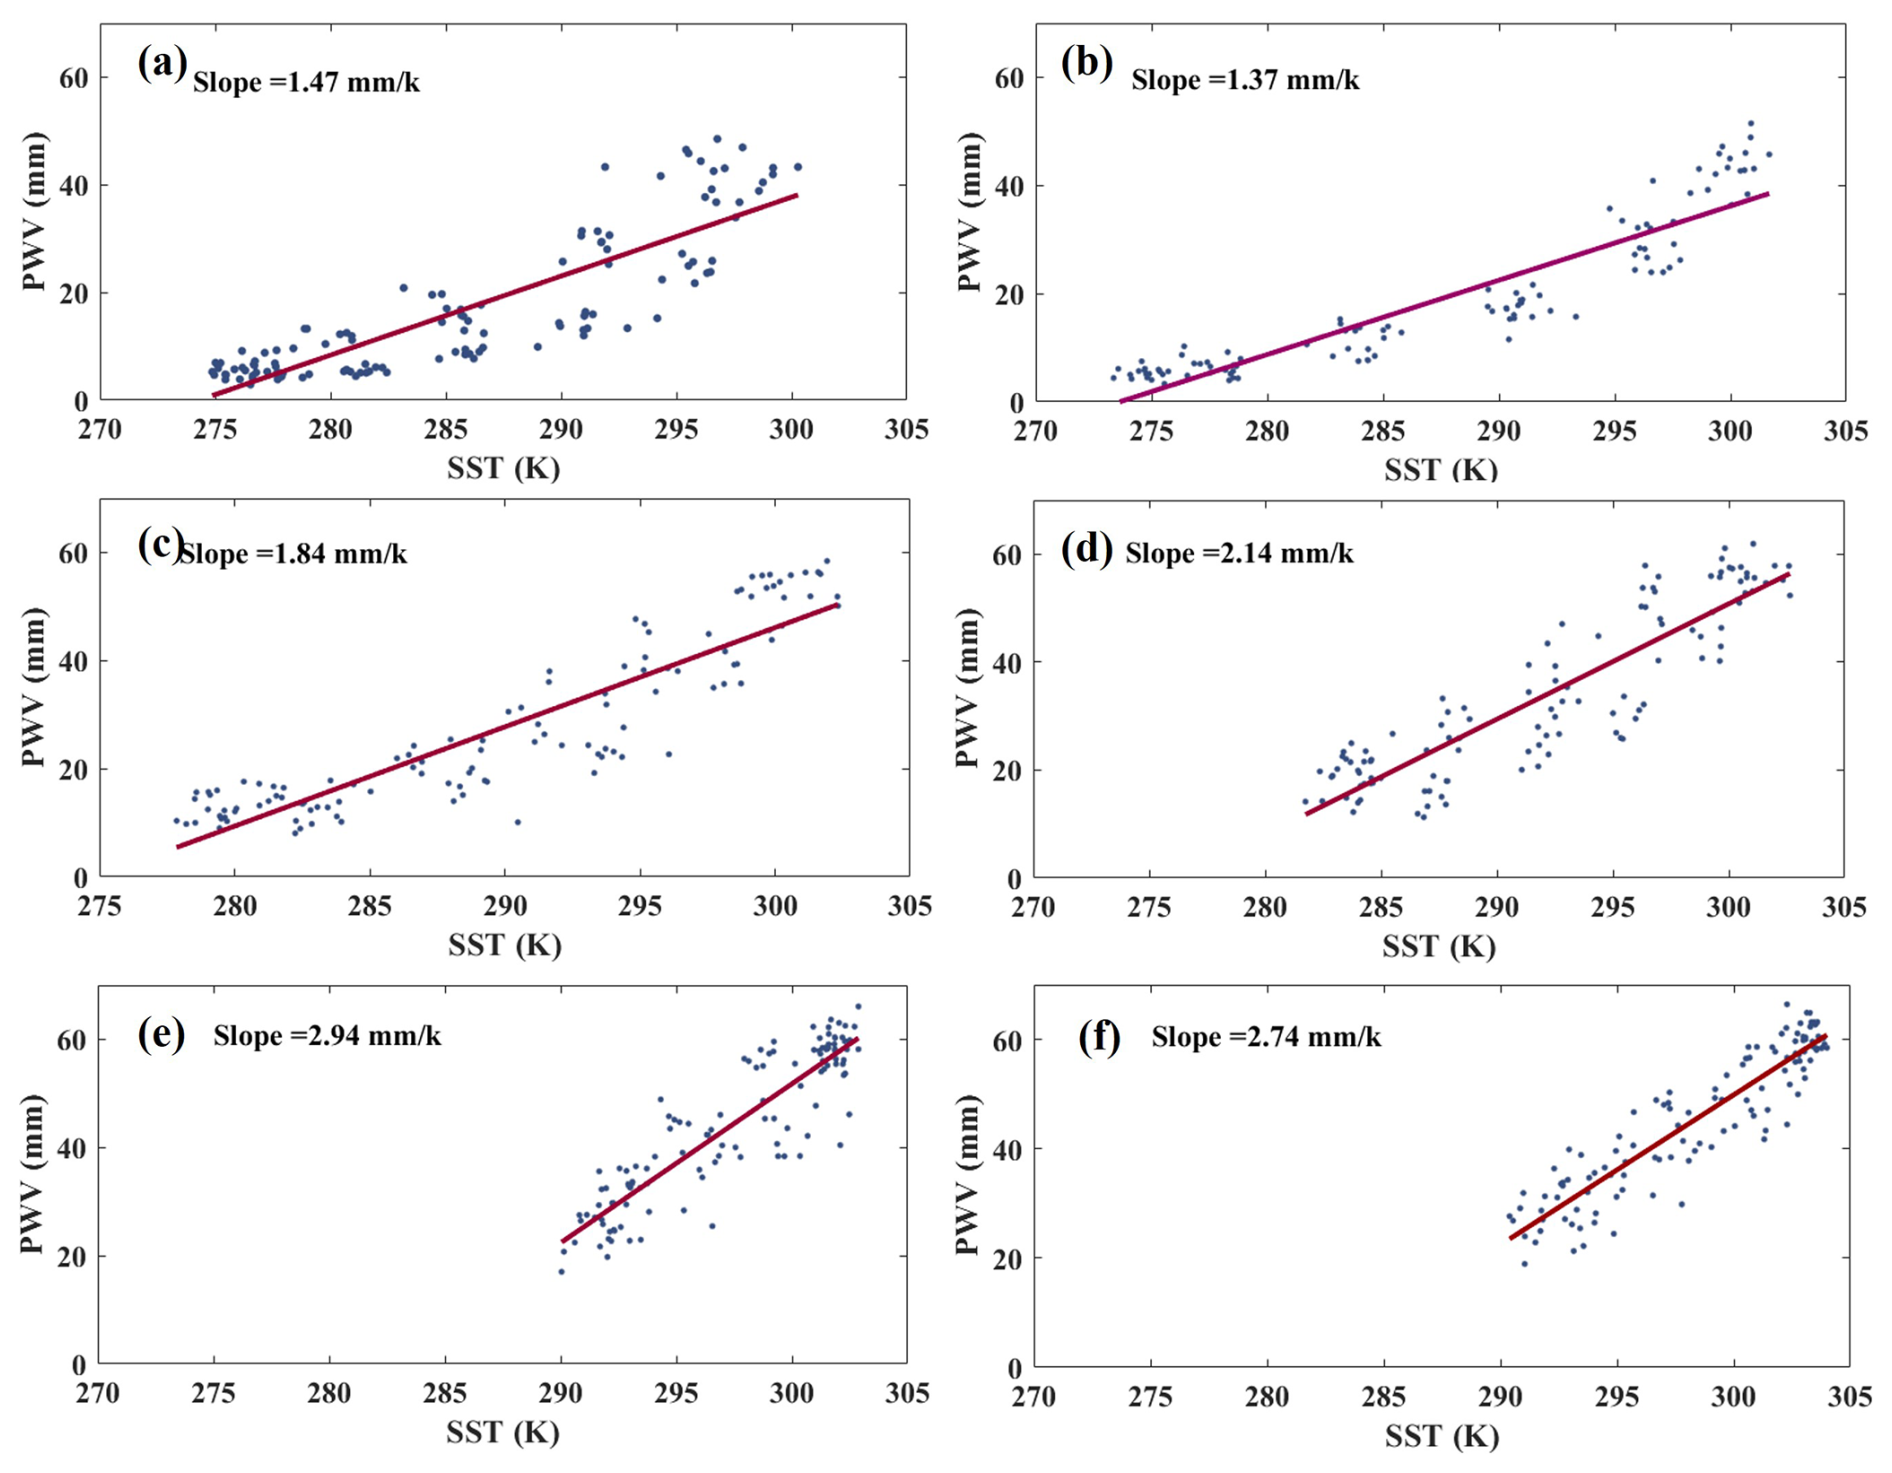
Figure 15Scatter plot of GNSS PWV versus SST for six GNSS stations: BLHT (a), BTGU (b), DLSI (c), DSPU (d), NHZH (e), NWZU (f).
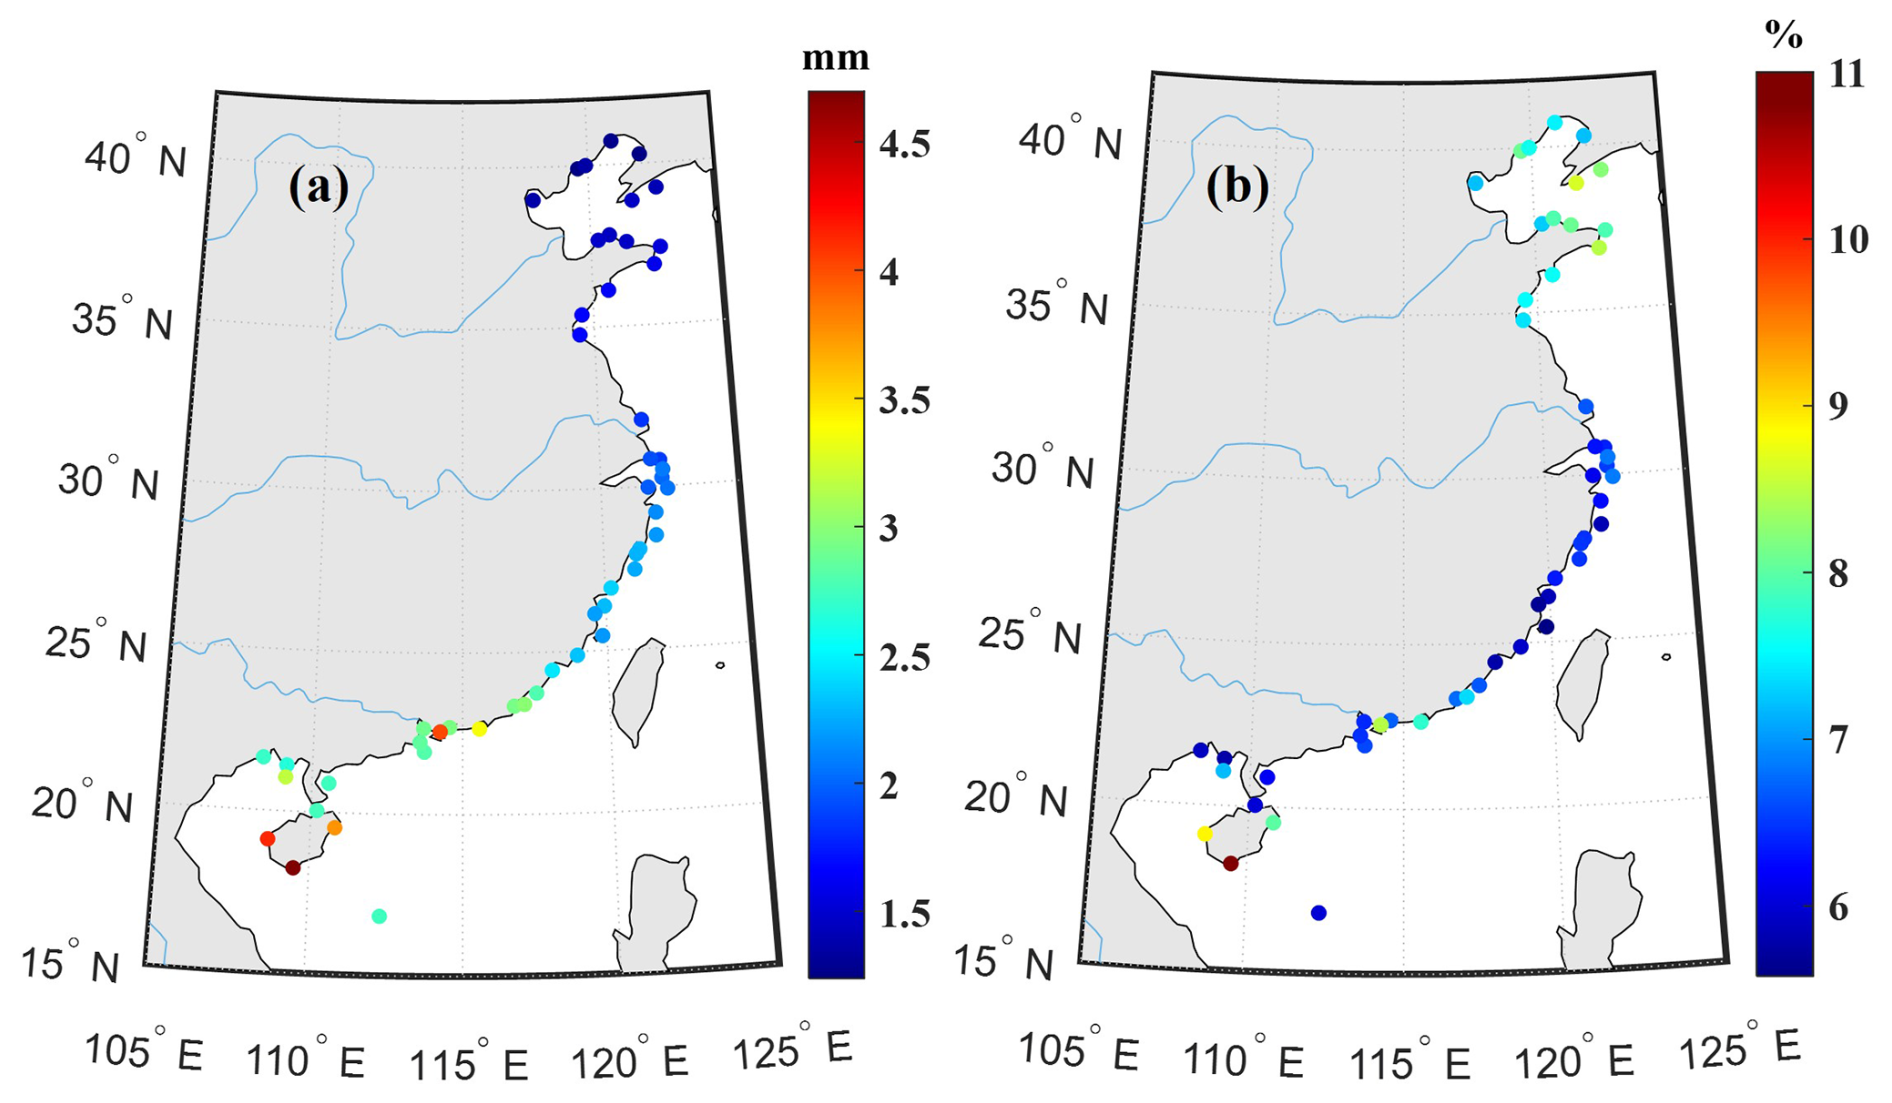
Figure 16PWV increasing value by 1 K SST (a) and relative PWV increasing value by 1 K SST (b).
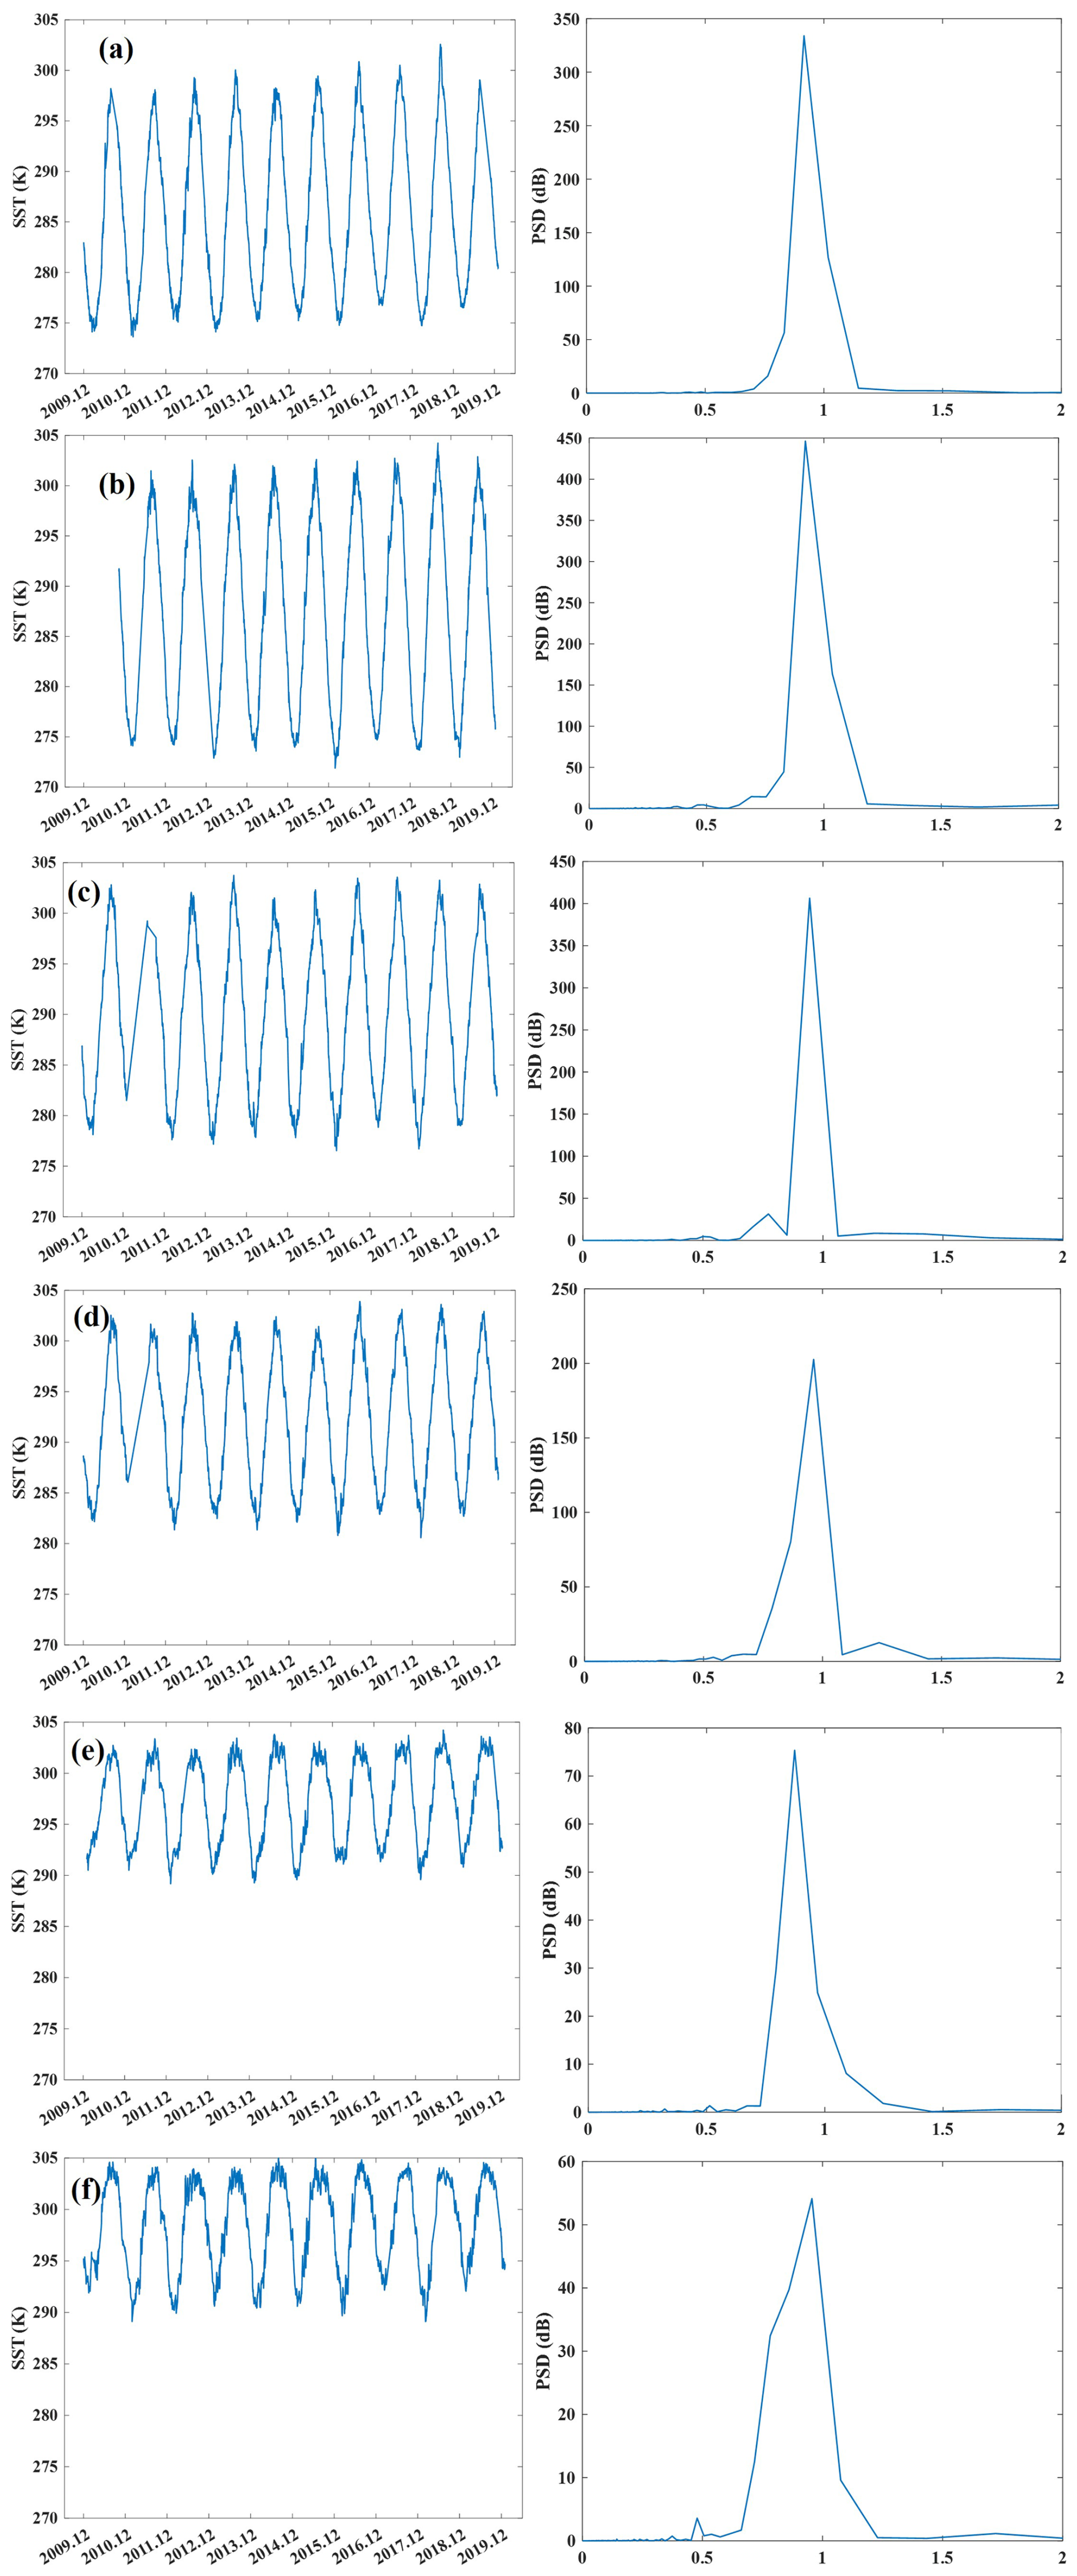
Figure 17SST time series and corresponding spectrum analysis at BLHT (a), BTGU (b), DLSI (c), DSPU (d), NHZH (e), and NWZU (f).
Additionally, we used six GNSS stations, as mentioned in Sect. 3.2, to illustrate the linear relationship between GNSS PWV and SST (see Fig. 15). The data clearly show a strong linear relationship between the two variables, with the slope of the relationship being steeper in lower-latitude areas. Furthermore, we calculated the increase in PWV associated with a 1 K rise in SST for all coastal GNSS stations in China. As shown in Fig. 16a, a 1 K increase in SST results in a PWV increase ranging from 1.5 to 4.5 mm, with an average increase of 2.4 mm. The PWV increase is more pronounced in low-latitude regions. Moreover, Fig. 16b shows that a 1 K SST increase causes an average 7 % rise in PWV, with relatively lower percentages in subtropical monsoon regions.
Additionally, the variations in SST were analyzed based on the six selected GNSS stations. The SST time series are shown in the left panel, while their Fourier spectrum analysis are presented in the right panel of Fig. 17. It is evident that all SST values around the GNSS stations exhibit a clear annual variation. However, the semi-annual pattern is not as prominent across the stations, which contrasts with the pattern observed in the PWV variation. Furthermore, minimum SST values increase toward lower latitudes, with values around 275 K in high-latitude areas and approximately 290 K in low-latitude regions.
China coastal GNSS PWV products generated in this research is openly available at https://doi.org/10.5281/zenodo.17012498 (Wu et al., 2025).
GNSS has become an indispensable technique in numerical weather prediction assimilation, extreme weather forecasting, and climate change monitoring. Many countries and organizations have established GNSS-based ground networks for PWV monitoring. This study introduces the China coastal GNSS continuous observation system, established by the MNR. The strategies for processing GNSS data are outlined. After rigorous quality control, the GNSS ZTDs demonstrated good agreement with ERA5 products, exhibiting a mean bias of 0.04 cm and an RMS error of 1.52 cm. PWV estimates were derived based on Tm and ZHD from hourly ERA5 pressure level data. A decade-long set of hourly GNSS PWV products (2009–2019) for 55 coastal GNSS stations was generated using a dedicated data screening algorithm. The GNSS PWV estimates exhibited a mean difference of 0.88 mm and an RMS error of 2.59 mm when compared to ERA5 data. A comparison with RS profiles, using at least 11 atmospheric levels, resulted in a mean bias of 0.90 mm and an RMS error of 3.06 mm. These results confirm the stability and high accuracy of the coastal GNSS PWV estimates.
In addition, the spatiotemporal characteristics of coastal PWV in China were analyzed. The minimum values decrease with latitude, while maximum values are primarily found in regions with subtropical and tropical monsoon climates. The PWV time series exhibit a clear annual cycle, with a more pronounced semi-annual cycle in higher-latitude regions. Additionally, analysis of the relationship between coastal GNSS PWV and SST revealed a strong positive correlation, with a mean correlation coefficient of 0.76. Furthermore, a 1 K increase in SST leads to a PWV increase ranging from 1.4 to 4.5 mm, with an average increase of 7 % across the CGN stations.
Water vapor is a critical factor in weather forecasting and climate change analysis. This study highlights the significant potential of coastal GNSS PWV data for long-term climate pattern analysis, including ENSO, and its impacts.
WZ and YL designed the experiments. QL developed the model code. YL, HZ, and DZ validated the experiment results. WZ and BL prepared the manuscript with contributions from all co-authors.
The contact author has declared that none of the authors has any competing interests.
Publisher’s note: Copernicus Publications remains neutral with regard to jurisdictional claims made in the text, published maps, institutional affiliations, or any other geographical representation in this paper. While Copernicus Publications makes every effort to include appropriate place names, the final responsibility lies with the authors. Also, please note that this paper has not received English language copy-editing. Views expressed in the text are those of the authors and do not necessarily reflect the views of the publisher.
We thank the China coastal continuous operating GNSS Network of MNR, for GNSS observations, and GNSS Data and Analysis Center at First Institute of Oceanography, MNR for providing the GNSS ZTDs. We also thank ESA for satellite precise clock and orbit products, ECMWF for ERA5 products, and IGRA for RS profiles.
This research is financially supported by the National Key R&D Program of China (grant no. 2023YFB3907201), Basic Scientific Fund for National Public Research Institutes of China (grant no. 2022S03), the National Natural Science Foundation of China (grant nos. 42204018, 42304010), and the Industrial Collaborative Innovation Project (Technology) of Shanghai Municipality (grant no. XTCX-KJ-2024-03).
This paper was edited by Graciela Raga and reviewed by David Adams and one anonymous referee.
Alshawaf, F., Balidakis, K., Dick, G., Heise, S., and Wickert, J.: Estimating trends in atmospheric water vapor and temperature time series over Germany, Atmos. Meas. Tech., 10, 3117–3132, https://doi.org/10.5194/amt-10-3117-2017, 2017.
Bai, J., Lou, Y., Zhang, W., Zhou, Y., Zhang, Z., and Shi, C.: Assessment and calibration of MODIS precipitable water vapor products based on GPS network over China, Atmospheric Research, 254, 105504, https://doi.org/10.1016/j.atmosres.2021.105504, 2021.
Bevis, M., Businger, S., Herring, T. A., Rocken, C., Anthes, R. A., and Ware, R. H.: GPS meteorology: Remote sensing of atmospheric water vapor using the Global Positioning System, Journal of Geophysical Research: Atmospheres, 97, 15787–15801, https://doi.org/10.1029/92JD01517, 1992.
Bevis, M., Businger, S., Chiswell, S., Herring, T. A., Anthes, R. A., Rocken, C., and Ware, R. H.: GPS meteorology: Mapping zenith wet delays onto precipitable water, Journal of Applied Meteorology, 33, 379–386, 1994.
Böhm, J., Niell, A., Tregoning, P., and Schuh, H.: Global Mapping Function (GMF): A new empirical mapping function based on numerical weather model data, Geophysical Research Letters, 33, L07304, https://doi.org/10.1029/2005GL025546, 2006.
Böhm, J., Heinkelmann, R., and Schuh, H.: Short note: a global model of pressure and temperature for geodetic applications, Journal of Geodesy, 81, 679–683, 2007.
Bonafoni, S. and Biondi, R.: The usefulness of the Global Navigation Satellite Systems (GNSS) in the analysis of precipitation events, Atmospheric Research, 167, 15–23, 2016.
Bosser, P., Bock, O., Flamant, C., Bony, S., and Speich, S.: Integrated water vapour content retrievals from ship-borne GNSS receivers during EUREC4A, Earth Syst. Sci. Data, 13, 1499–1517, https://doi.org/10.5194/essd-13-1499-2021, 2021.
Chen, B., Dai, W., Liu, Z., Wu, L., and Xia, P.: Assessments of GMI-derived precipitable water vapor products over the south and east China seas using radiosonde and GNSS, Advances in Meteorology, 2018, 7161328, https://doi.org/10.1155/2018/7161328, 2018.
Chen, G. and Herring, T.: Effects of atmospheric azimuthal asymmetry on the analysis of space geodetic data, Journal of Geophysical Research: Solid Earth, 102, 20489–20502, 1997.
Dirmeyer, P. A. and Brubaker, K. L.: Characterization of the global hydrologic cycle from a back-trajectory analysis of atmospheric water vapor, Journal of Hydrometeorology, 8, 20–37, 2007.
Durre, I., Yin, X., Vose, R. S., Applequist, S., and Arnfield, J.: Enhancing the data coverage in the integrated global radiosonde archive, Journal of Atmospheric and Oceanic Technology, 35, 1753–1770, 2018.
Elgered, G. and Jarlemark, P. O.: Ground-based microwave radiometry and long-term observations of atmospheric water vapor, Radio Science, 33, 707–717, 1998.
Galewsky, J., Steen-Larsen, H. C., Field, R. D., Worden, J., Risi, C., and Schneider, M.: Stable isotopes in atmospheric water vapor and applications to the hydrologic cycle, Reviews of Geophysics, 54, 809–865, https://doi.org/10.1002/2015RG000512, 2016.
Gao, B. C. and Kaufman, Y. J.: Water vapor retrievals using Moderate Resolution Imaging Spectroradiometer (MODIS) near-infrared channels, Journal of Geophysical Research: Atmospheres, 108, https://doi.org/10.1029/2002JD003023, 2003.
Gendt, G., Dick, G., Reigber, C., Tomassini, M., Liu, Y., and Ramatschi, M.: Near real time GPS water vapor monitoring for numerical weather prediction in Germany, Journal of the Meteorological Society of Japan. Ser. II, 82, 361–370, https://doi.org/10.2151/jmsj.2004.361, 2004.
Hersbach, H., Bell, B., Berrisford, P., Hirahara, S., Horányi, A., Muñoz-Sabater, J., Nicolas, J., Peubey, C., Radu, R., and Schepers, D.: The ERA5 global reanalysis, Quarterly Journal of the Royal Meteorological Society, 146, 1999–2049, https://doi.org/10.1002/qj.3803, 2020.
Jones, J., Vedel, H., de Haan, S., and Lewis, O.: E-GVAP: The EIG EUMETNET GNSS Water Vapour Programme, AGU Fall Meeting Abstracts, A13I-2268, https://ui.adsabs.harvard.edu/abs/2023AGUFM.A13I2268J/abstract (last access: 6 June 2025), 2023.
Karl, T. R. and Trenberth, K. E.: Modern global climate change, Science, 302, 1719–1723, 2003.
Liu, J. and Ge, M.: PANDA software and its preliminary result of positioning and orbit determination, Wuhan University Journal of Natural Sciences, 8, 603, https://doi.org/10.1007/BF02899825, 2003.
Petit, G. and Luzum, B.: IERS Conventions (2010) IERS Tech Note 36, Verlag des Bundesamtes für Geodäsie und Kartographie, Frankfurt am Main, https://apps.dtic.mil/sti/html/tr/ADA535671/ (last access: 6 June 2025), 2010.
Ross, R. J. and Elliott, W. P.: Radiosonde-based Northern Hemisphere tropospheric water vapor trends, Journal of Climate, 14, 1602–1612, 2001.
Saastamoinen, J.: Atmospheric correction for the troposphere and stratosphere in radio ranging satellites, The Use of Artificial Satellites for Geodesy, 15, 247–251, https://doi.org/10.1029/GM015p0247, 1972.
Sato, K., Realini, E., Tsuda, T., Oigawa, M., Iwaki, Y., Shoji, Y., and Seko, H.: A high-resolution, precipitable water vapor monitoring system using a dense network of GNSS receivers, Journal of Disaster Research, 8, 37–47, 2013.
Schmid, R., Dach, R., Collilieux, X., Jäggi, A., Schmitz, M., and Dilssner, F.: Absolute IGS antenna phase center model igs08. atx: status and potential improvements, Journal of Geodesy, 90, 343–364, 2016.
Schönemann, E., Gini, F., Enderle, W., Dilßner, F., Mayer, V., van Kints, M., Romero, I., Springer, T., and Traiser, B.: ESA/ESOC IGS Analysis Centre Technical Report 2023, IGS Central Bureau and University of Bern, 67, Bern Open Publishing, https://doi.org/10.48350/191991, 2024.
Schuler, T.: On ground-based GPS tropospheric delay estimation, Ph.D. Thesis, Studiengang Geodsie und Geoinformation, Universitt der Buundeswehr Munchen, https://athene-forschung.unibw.de/doc/85240/document.pdf, (last access: 5 October 2025), 2001.
Shi, Z., Q., Geng, J., Lou, Y., Ge, M., and Liu, J.: Recent development of PANDA software in GNSS data processing, International Conference on Earth Observation Data Processing and Analysis (ICEODPA), Wuhan, China, 72851S, https://doi.org/10.1117/12.816261,, 2008.
Solheim, F. S., Vivekanandan, J., Ware, R. H., and Rocken, C.: Propagation delays induced in GPS signals by dry air, water vapor, hydrometeors, and other particulates, Journal of Geophysical Research: Atmospheres, 104, 9663–9670, 1999.
Springer, T., Flohrer, C., Otten, M., and Enderle, W.: ESA reprocessing: advances in GNSS analysis, IGS workshop, Pasadena, USA, https://files.igs.org/pub/resource/pubs/workshop/2014/ (last access: 5 October 2025), 2014.
Tsushima, H. and Ohta, Y.: Review on near-field tsunami forecasting from offshore tsunami data and onshore GNSS data for tsunami early warning, Journal of Disaster Research, 9, 339–357, 2014.
Wang, J., Dai, A., and Mears, C.: Global water vapor trend from 1988 to 2011 and its diurnal asymmetry based on GPS, radiosonde, and microwave satellite measurements, Journal of Climate, 29, 5205–5222, 2016a.
Wang, X., Zhang, K., Wu, S., Fan, S., and Cheng, Y.: Water vapor-weighted mean temperature and its impact on the determination of precipitable water vapor and its linear trend, Journal of Geophysical Research: Atmospheres, 121, 833–852, 2016b.
Wang, X., Zhang, K., Wu, S., Li, Z., Cheng, Y., Li, L., and Yuan, H.: The correlation between GNSS-derived precipitable water vapor and sea surface temperature and its responses to El Niño–Southern Oscillation, Remote Sensing of Environment, 216, 1–12, 2018.
Wang, Z., Zhou, X., Liu, Y., Zhou, D., Zhang, H., and Sun, W.: Precipitable water vapor characterization in the coastal regions of China based on ground-based GPS, Advances in Space Research, 60, 2368–2378, 2017.
Ware, R. H., Fulker, D. W., Stein, S. A., Anderson, D. N., Avery, S. K., Clark, R. D., Droegemeier, K. K., Kuettner, J. P., Minster, J. B., and Sorooshian, S.: SuomiNet: A real-time national GPS network for atmospheric research and education, Bulletin of the American Meteorological Society, 81, 677–694, 2000.
Wu, J.-T., Wu, S. C., Hajj, G. A., Bertiger, W. I., and Lichten, S. M.: Effects of antenna orientation on GPS carrier phase, Manuscripta Geodaetica, 18, 91–98, 1993.
Wu, Z., Liu, Y., Liu, Y., Lu, C., He, X., Jin, K., and Xu, W.: Rapid calibration of HY-2A satellite-borne microwave radiometer using coastal GNSS observations, Journal of Geodesy, 96, 1–13, https://doi.org/10.1007/s00190-022-01617-w, 2022a.
Wu, Z., Lu, C., Zheng, Y., Liu, Y., Liu, Y., Xu, W., Jin, K., and Tang, Q.: Evaluation of Shipborne GNSS Precipitable Water Vapor Over Global Oceans From 2014 to 2018, IEEE Transactions on Geoscience Remote Sensing, 60, 1–15, https://doi.org/10.1109/TGRS.2022.3142745, 2022b.
Wu, Z., Li, B., Ge, H., Yuan, L., and Liu, Y.: Satellite-based remote sensing of atmospheric water vapor over oceans: an inter-comparison against shipborne GNSS observations, IEEE Transactions on Geoscience and Remote Sensing, https://doi.org/10.1109/TGRS.2024.3432774, 2024.
Wu, Z., Li, B., and Liu, Y.: China Coastal GNSS Network: Advancing Precipitable Water Vapor Monitoring and Applications in Climate Analysis, Tongji University [data set], https://doi.org/10.5281/zenodo.17012498, 2025.
Yang, F., Gong, X., Li, Z., Wang, Y., Song, S., Wang, H., and Chen, R.: Spatiotemporal distribution and impact factors of GNSS-PWV in China based on climate region, Advances in Space Research, 73, 4187–4201, 2024.
Yuan, P., Blewitt, G., Kreemer, C., Hammond, W. C., Argus, D., Yin, X., Van Malderen, R., Mayer, M., Jiang, W., and Awange, J.: An enhanced integrated water vapour dataset from more than 10 000 global ground-based GPS stations in 2020, Earth Syst. Sci. Data, 15, 723–743, https://doi.org/10.5194/essd-15-723-2023, 2023.
Zhang, W., Zhang, H., Liang, H., Lou, Y., Cai, Y., Cao, Y., Zhou, Y., and Liu, W.: On the suitability of ERA5 in hourly GPS precipitable water vapor retrieval over China, Journal of Geodesy, 93, 1897–1909, 2019.
Zhao, Q., Yao, Y., and Yao, W.: GPS-based PWV for precipitation forecasting and its application to a typhoon event, Journal of Atmospheric Solar-Terrestrial Physics, 167, 124–133, 2018.
Zheng, Y., Lu, C., Wu, Z., Liao, J., Zhang, Y., and Wang, Q.: Machine Learning-Based Model for Real-Time GNSS Precipitable Water Vapor Sensing, Geophysical Research Letters, 49, e2021GL096408, https://doi.org/10.1029/2021GL096408, 2022.
Zhou, D., Zhou, X., Zhang, H., Wang, Z., and Tang, Q.: Analysis of the Vertical Deformation of China Coastal Tide Stations Using GPS Continuous Observations, Geomatics and Information Science of Wuhan University, 41, 516–522, 2016.
Zhou, D., Liu, Y., Feng, Y., Zhang, H., Fu, Y., Liu, Y., and Tang, Q.: Absolute sea level changes along the coast of China from tide gauges, GNSS and satellite altimetry, Journal of Geophysical Research: Oceans, e2022JC018994, https://doi.org/10.1029/2022JC018994, 2022.
Zhu, L., Yang, L., Xu, Y., Zhang, H., Wu, Z., and Wang, Z.: Independent Validation of Jason-2/3 and HY-2B Microwave Radiometers Using Chinese Coastal GNSS, IEEE Transactions on Geoscience Remote Sensing, https://doi.org/10.1109/TGRS.2021.3106650, 2021.
Zumberge, J., Heflin, M., Jefferson, D., Watkins, M., and Webb, F. H.: Precise point positioning for the efficient and robust analysis of GPS data from large networks, Journal of Geophysical Research: Solid Earth, 102, 5005–5017, https://doi.org/10.1029/96JB03860, 1997.