the Creative Commons Attribution 4.0 License.
the Creative Commons Attribution 4.0 License.
 | 24 Oct 2025
The Northern Eurasian Riverbank Migration multi-tool dataset (NERM)
Victor Ivanov
Danila Shkolnyi
Ekaterina Pavlyukevich
Michal Habel
Anna Kurakova
Dmitry Botavin
Aleksandra Chalova
Pavel Golovlev
Arseny Kamyshev
Roman Kolesnikov
Uliana Koneva
Nadezda Mikhailova
Elizaveta Tuzova
Kristina Prokopeva
Aleksandr Zavadsky
Rituparna Acharyya
Aleksandr Varenov
Leonid Turykin
Anna Tarbeeva
Daidu Fan
Roman S. Chalov
Riverbank erosion monitoring and modeling have a long-standing tradition in Earth system science. The current body of research primarily relies on observations at the basin and site levels. We endeavored to compile a comprehensive dataset of riverbank migration observations using a variety of measurement techniques, with both field-based and remote sensing data. The dataset comprises information from 12 extensive river basins situated in Northern Eurasia, encompassing rivers that drain into the Baltic Sea, the Arctic and Pacific oceans, and the Caspian Sea, specifically the catchments of the Vistula, Volga, Ural, Ob, Nadym, Yenisey, Lena, Indigirka, Yana, Kolyma, Amur, and Kamchatka rivers. The rivers included in the dataset vary in terms of environmental conditions and have average discharges of between 0.3 and 19 700 m3 s−1. This study examined approximately 140 000 km of rivers in Northern Eurasia, covering small, medium, and large rivers, with data from up to 70 years of water classifications obtained from satellite images, including those from Landsat and Keyhole, across 626 772 river channel segments. The dataset collected average and maximum bank retreat rates (m yr−1), average areas of bank retreat (m2 yr−1), and gross bank-erosion sediment yield (t yr−1). It also recorded possible drivers, encompassing both hydrological and catchment factors like permafrost, natural land zones, and geology. Our study showed that river discharge and permafrost distribution are the primary indicators of riverbank erosion in Northern Eurasia. These data will enhance comprehension of bank erosion processes and their underlying factors, thereby facilitating the development of more accurate predictive models of river channels. The dataset is available open access via the Zenodo repository (https://doi.org/10.5281/zenodo.15965461) (Chalov et al., 2025a).
- Article
(13506 KB) - Full-text XML
- BibTeX
- EndNote


Approximately 2.5 billion individuals globally reside near major rivers and utilize them for water supply, transportation, and power generation (Musie and Gonfa, 2023). Characteristics of rivers change over time and in different locations, as noted in Knighton (2014) and Bracken et al. (2015). Specifically, alterations in their spatial limits are associated with hydromorphological processes occurring at various spatial scales, such as bank scale, reach scale, and floodplain scale, and involve vertical and horizontal modifications of river channels (Alabyan and Chalov, 1998). The latter results in the most hazardous river-related phenomena, specifically lateral (riverbank) erosion, which leads to land loss and the conversion of floodplains into active channels.
Riverbank erosion has long been viewed as a threat to structures, engineering projects, infrastructure, and agricultural operations. This phenomenon can significantly contribute to sediment loads in rivers, thus serving as a crucial factor in sediment flux models (Kronvang et al., 2013; Wilkinson et al., 2009). Long-lasting effects on riverbank migration are caused by both natural and human-made changes to water and sediment supply, with the river's channel shape adjusting to new conditions (Alexeevsky et al., 2013; Brandt, 2000). Riverbanks serve as both a source (by erosion) and a reservoir (by deposition on them) for sediment, highlighting the effects of fluctuating sediment supply (Kronvang et al., 2013). Furthermore, chemicals such as metals and carbon stored in riverbank sediments are transported downstream to coastal seas due to bank deterioration (Reid and Dunne, 2016), in some cases significantly impacting terrestrial flux (Chalov and Ivanov, 2023; Chalov et al., 2023b; Gautier et al., 2021).
Researchers globally have investigated river planform transformations over the course of time to identify evolutionary patterns, evaluate influencing factors, and control the fluvial ecosystem, which has led to a variety of measurement techniques. Laboratory flume experiments and detailed field measurements with erosion pins have validated methods for measuring river movement at reach scales (Guy et al., 1966; Thorne, 1981). The conventional method of measuring bank erosion involves a thorough historical examination of riverbeds, taking into account available cartographic records and aerial images to evaluate changes in the river's shape (Fuller et al., 2003; Mandarino et al., 2019), which encompasses georeferencing of images, interpreting photos, digitizing morphological features, and performing vector and raster geospatial analysis. Remote sensing data, including repeated LiDAR and optical remote sensing, notably improve the ability to track channel dynamics over large spatial areas and at decadal time intervals. These methods are based on retreat area detection, which involves assessing the movement of rivers by observing how channelized areas and regions without channels (like floodplains) evolve over time (Langhorst and Pavelsky, 2023). Comparisons of satellite images are used to create bank retreat polygons (Kurakova and Chalov, 2019) or centerlines (Greenberg et al., 2023). Current methods of measuring river mobility through remote sensing focus mainly on meandering rivers with a single channel and primarily emphasize bank movement (Donovan and Belmont, 2019; Sylvester et al., 2019). Furthermore, recent techniques like particle image velocimetry (PIV) (Chadwick et al., 2023) are being extensively utilized for monitoring bank erosion.
Studies on bank erosion are crucial, yet data on this topic are scarce due to the high expense of collecting and interpreting them, and available data are mostly confined to specific river sections and watersheds. Datasets employed in riverbank erosion research include the GSWE – Global Surface Water Explorer, which uses a supervised classification of Landsat 5, Landsat 7, and Landsat 8 satellite imagery from 1984 to the present (Pekel et al., 2016), as well as the Global Land Analysis and Discovery (GLAD) dataset, wherein water surface was calibrated with RapidEye imagery (Pickens et al., 2020). Global datasets designed to compile a consistent record of riverbank migration worldwide have been introduced by Ielpi and Lapôtre (2020), utilizing a sample of 983 meanders, and by Langhorst and Pavelsky (2023), who created REAL (Riverbank Erosion and Accretion from Landsat) – a global dataset of riverbank erosion covering over 370 000 km of major rivers, based on GSWE and GLAD data.
These datasets are restricted to decadal-scale average riverbank erosion and rivers with widths exceeding 150 m whilst also concentrating solely on the surface water occurrence dataset obtained from Landsat satellite imagery; as a result, more extensive observations of contemporary riverbank erosion rates are needed, encompassing different methods and rivers. It is notably significant that about a quarter of areas with extremal bank erosion that are recorded in the Langhorst and Pavelsky (2023) database are located in Northern Eurasia.
Recent studies on riverbank migration have been conducted for the biggest rivers in Northern Eurasia as part of international collaborative projects (Babiński et al., 2014; Lappalainen et al., 2018). Results of these studies, with rare exceptions (Alexeevskii et al., 2008; Alexeevsky et al., 2013), have not been made accessible to the international scientific community. The current work enables the presentation of a multi-tool dataset of channel erosion rates that encompasses rivers within the major catchments in Northern Eurasia, covering a total length of more than 140 000 km of river networks, and is also presented as an online GIS map (https://map.giscarta.com/viewer/93a6a4b3-179f-450f-be02-a31ca6db245b, last access: 14 October 2025).
The purpose of this research is to provide a multi-scale dataset featuring outputs from the use of multiple tools to identify changes in planform at various scales, encompassing extreme values of bend migration at localized spots, estimates with a spatial resolution of 10 to 100 m at the site scale, and basin-scale averages with 1 km resolution. Following the dataset attribute description, we present a comparative analysis of contemporary riverbank erosion rates across different catchments and river sizes. We examine extreme variations in river channel changes across the entire dataset, focusing on large catchments such as the Ob River, and specific environments, like the Lena River delta, as well as long-term changes in bank erosion rates. We illustrates how the dataset can be employed to calculate the gross bank-erosion sediment yield.
2.1 Rivers
This paper presents a dataset compiled from field-based observations and satellite images, including from Landsat and Keyhole, that spans over 140 000 km of rivers in Northern Eurasia. The dataset covers small, medium, and large rivers and was compiled using different methods of image classification and digitization from bank transitions acquired over a 60-year interval. The dataset comprises more than 626 772 river channel sites, as detailed in Table 1, covering rivers belonging to the watersheds of the Baltic Sea, Arctic and Pacific oceans, and Caspian Sea. In total, over 250 rivers were examined across 28 distinct subdatasets, each of which focuses on a separate river section, a group of rivers with similar landscape characteristics, the largest rivers within a major watershed, or deltas as distinct distributary systems (Table 1). Each subdataset was derived through one of the methods detailed below and was identified by a unique ID within the dataset, ranging from 1 to 28. The compiled data were employed in both statistical and qualitative examinations. The river distribution allows the categorization of rivers based on factors like geology, hydrology, permafrost, and vegetation to analyze how the rivers reflect the characteristics of their surrounding environment.
Table 1Description of rivers included in the dataset.
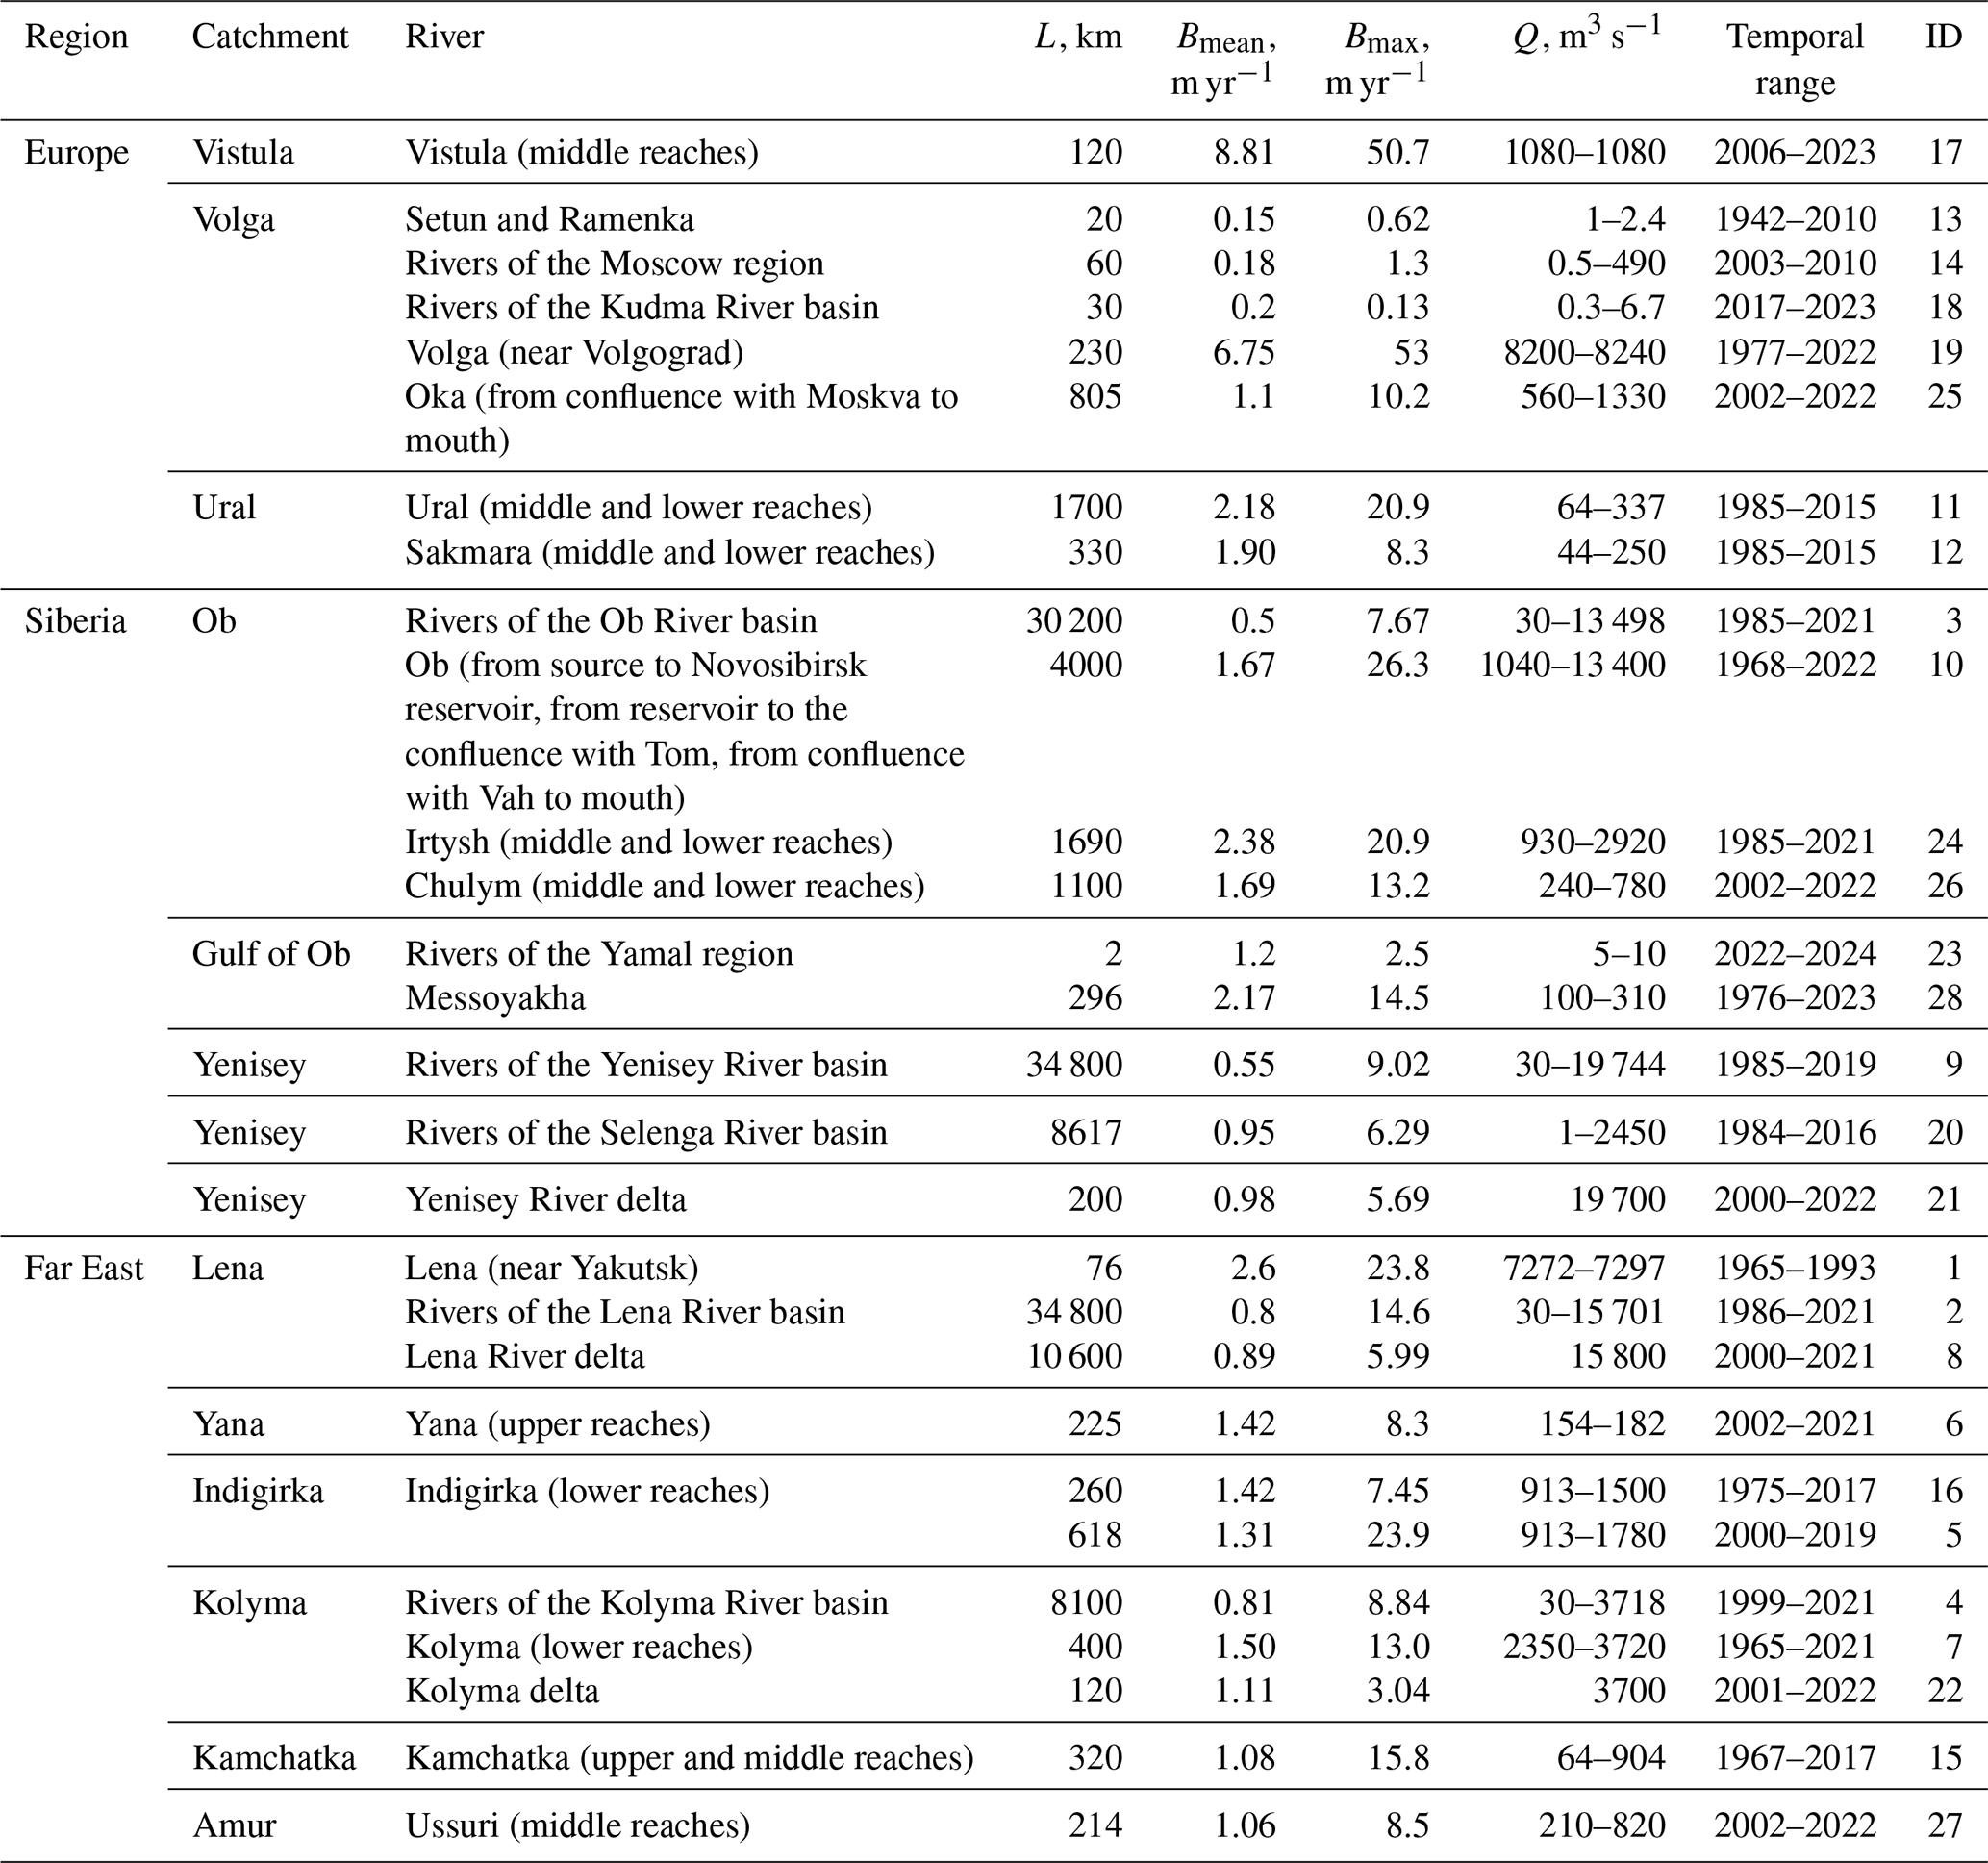
Explanations: L – length of subdataset river sections [km]; Bmean – average bank retreat rates [m yr−1]; Bmax – maximum bank retreat value [m yr−1]; Amean – average area of bank retreat [m2 yr−1]; Qmean – annual mean river water runoff [m3 s−1] (Lehner and Grill, 2013).
The rivers in the dataset present contrasting conditions (Fig. 1) of channel erosion. The Vistula River (#17) case study reach extends over 120 km of the middle section of the Vistula River, between the mouth of the Radomka River and the Narew River (km 430–551 of waterway). This section is partially trained by transverse and longitudinal river groins (medium-water-level riverbed) and flood embankments (high-water-level riverbed). In the urban section, the riverbed is strongly confined, having been narrowed to embankments (e.g., in Warsaw), and incised (Bujakowski and Falkowski, 2019).
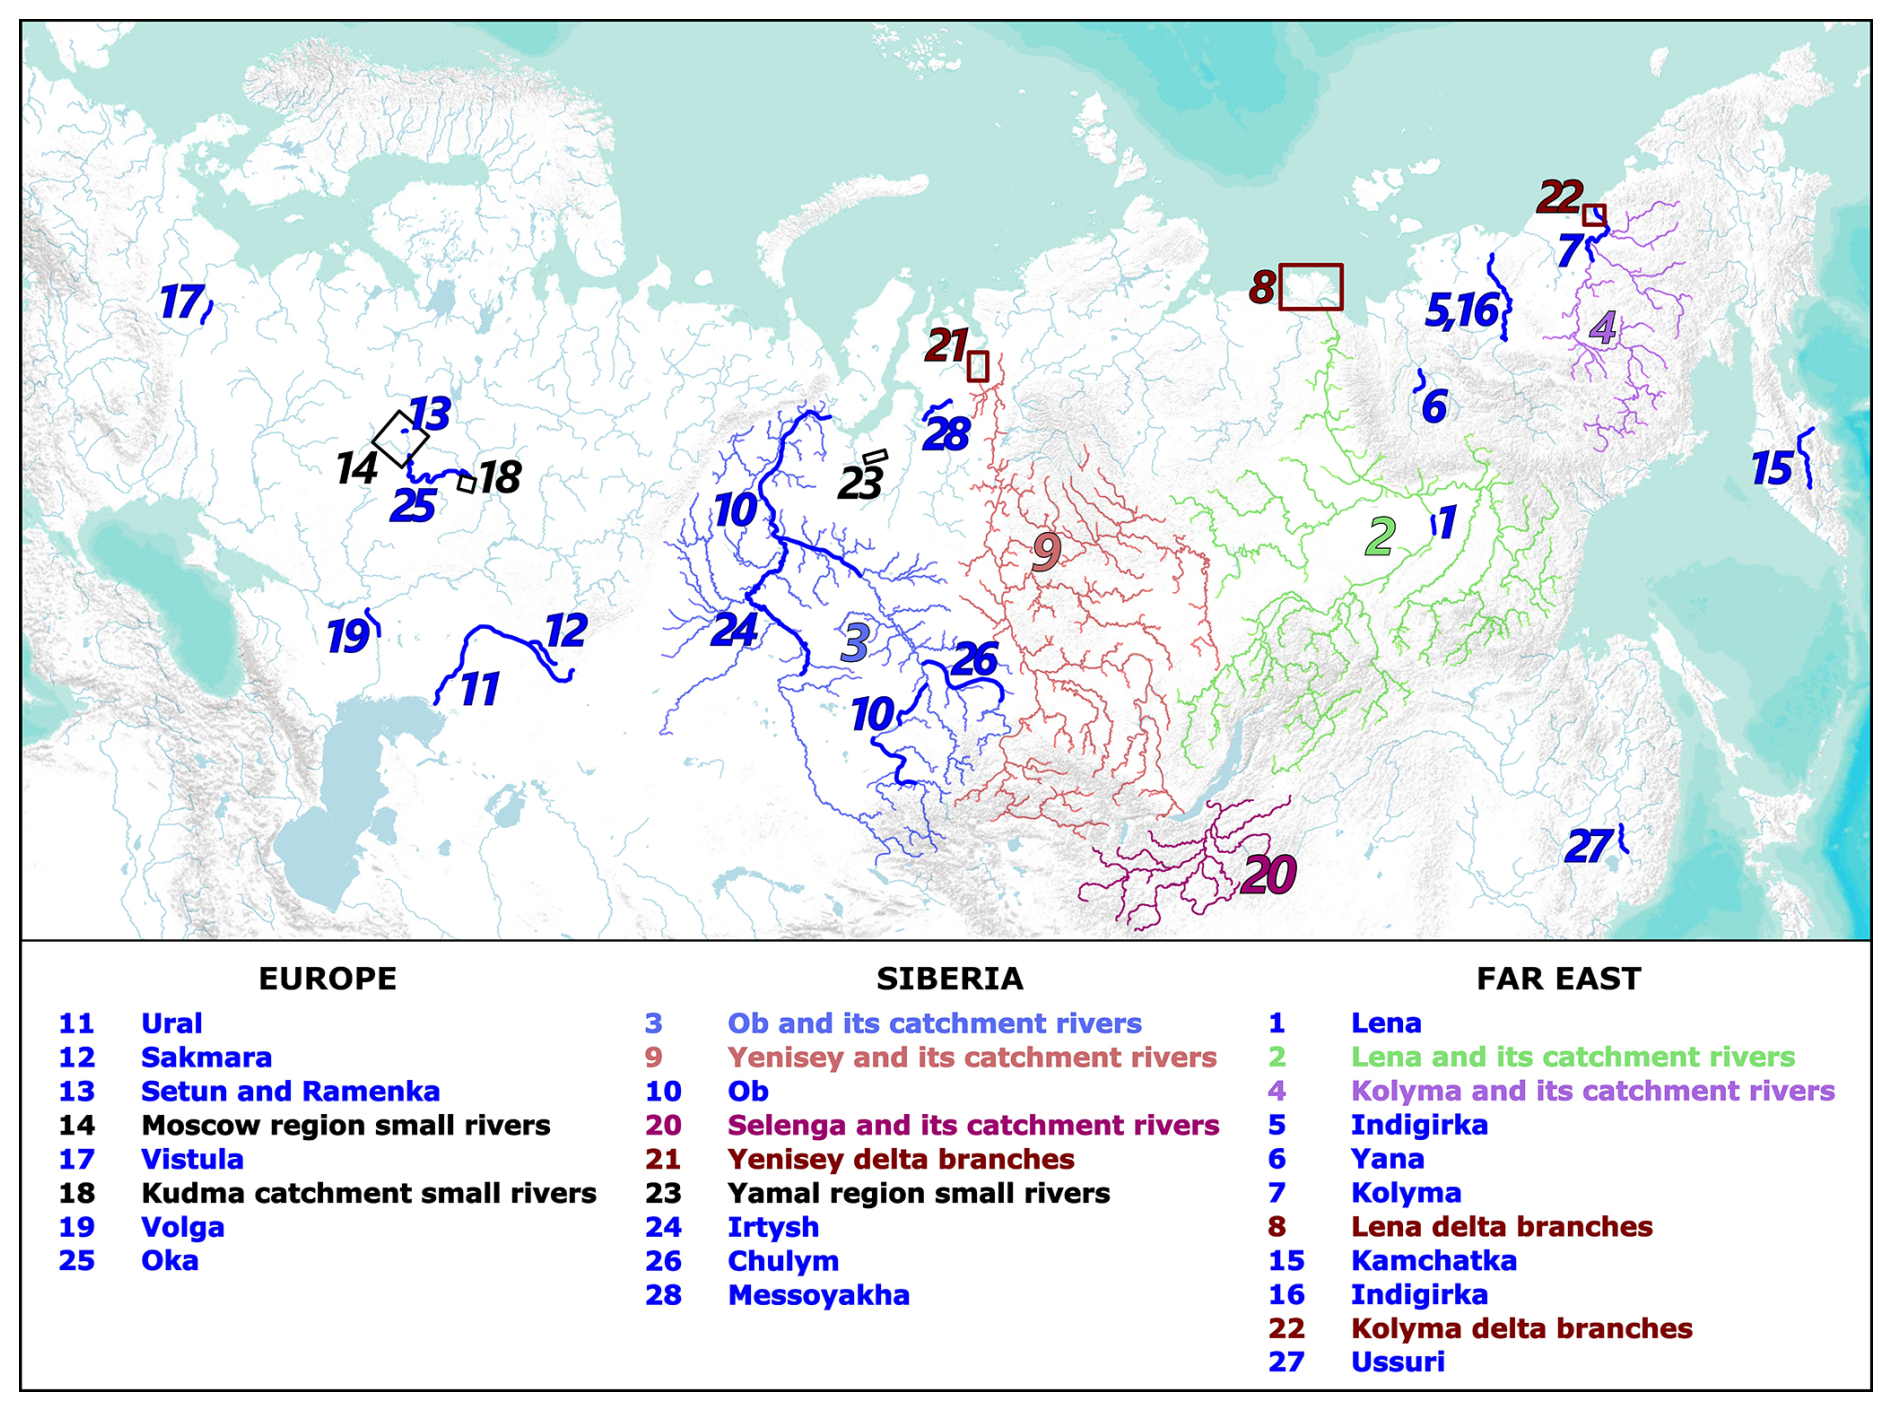
Figure 1Locations of river sections included in the dataset (©Esri Terrain). Explanations: solid blue lines indicate separately analyzed river reaches; light blue, red, green, purple, and pink lines indicate analyzed rivers in separate basins; red rectangles indicate locations of analyzed deltaic branches; black rectangles indicate locations of groups of analyzed sites on small rivers.
The Volga River's largest right tributary, the Oka River (#25), is a vital waterway in the East European Plain, where a dense population has led to substantial human-induced pressure and notable changes in water and channel conditions. Sand mining in riverbed quarries is a highly influential activity that can significantly impact the stability of a channel (Berkovich et al., 2023). The Oka River has a total length of 1500 km, with 805 km of that distance located in the middle and lower parts between the confluence points of the Moskva and Klyazma rivers and included in the dataset. Here, Oka's course winds through a primarily expansive floodplain. Additionally, data of the 230 km of the downstream Volga River (#19) between the cities of Volgograd and Astrakhan are included in the dataset. Here, the river flows through the steppe zone, and closer to the south its banks are conquered by semi-desert and it is characterized by an alluvial sandy channel. Here the dam located at Volgograd significantly influences the hydrological regime by decreasing both average and maximal discharges, lowering water levels and causing a release wave passage where water level variation immediately downstream of the dam can reach 2.5 m d−1.
Small rivers located in the Moscow region (#14), including a few rivers within the city of Moscow (#13) and rivers in the central part of the Nizhny Novgorod region (#18), are also located within the Volga River basin. In the Nizhny Novgorod region, the case study includes the Kudma River and its tributaries – the Ozerka, Setchuga, and Pechet' rivers. The Kudma River is a right tributary of the Volga River downstream of the confluence with the Oka River. The total length of the river is 144 km. The Ozerka River, which is 74 km long, is the largest tributary of the Kudma River. Setchuga and Pechet' are small tributaries of the Kudma and Ozerka rivers, respectively.
The Setun River (#13) is the largest right tributary of the Moskva River within the city of Moscow. It flows into the Moskva River at 174 km from its mouth. The total length of the river is 38 km; 18 km from its confluence with Moskva, it crosses the Moscow Ring Road and then flows through the city. Its main tributary is the Ramenka River (#13), which is also included in the dataset.
The Ural River (#11) and its principal tributary, the Sakmara (#12), form the border between Europe and Asia and flow through parts of Russia and Kazakhstan. The Ural is currently the only major river that flows freely into the Caspian Sea. Channel erosion within the Ural catchment has been the focus of relatively few studies (Sergaliev and Akhmedenov, 2014), which propose relatively high values in comparison to nearby rivers, primarily attributed to the river's course through a vast steppe region.
Approximately 4000 km of the primary course of the Ob River (#10) was incorporated into the dataset. The Ob River is situated within the West Siberian Plain, where the geological and geomorphological conditions are relatively uniform. The floodplain and terraces are comprised of alluvial deposits, including sand, sandy clay, and light loam. This results in active riverbank erosion. The bedrock of the Ob River, predominantly found in its lower course, typically comprises solid loamy sediment deposits (Kurakova and Chalov, 2019). The two longest tributaries of the Ob are also part of the dataset. The lower reaches of the Irtysh (#24), a key transboundary river, have been added to the dataset, specifically the section between the Russian–Kazakh border and its mouth. The river's meandering channel has evolved over the past decades under low-water conditions, partly due to the regulation of its upper sections by reservoirs. The second longest tributary of the Ob, Chulym (#26), has the lower reach section included, 1100 km upstream of its mouth to the city of Achinsk, where it originates from the low-lying Arga Ridge and extends into the plain, subsequently meandering through a vast floodplain that is flanked by taiga forests and bogs. Furthermore, more than 220 000 bank erosion sections with a total length of 30 200 km of all rivers in the Ob River basin (#3) and annual discharge values of at least 30 m3 s−1 was studied.
The low plains' adjacent tundra–taiga regions are situated east of the Ob river mouth area. Rivers originate in expansive sandy alluvial deposits consisting of marine loam and alluvial sands (Sidorchuk, 2019). With the seasonally thawed layer reaching about 2 m deep, this area is one of the most severely gullied landscapes in the Russian Arctic, with a gully density of up to 1–2 km km−2, and rivers here have very unstable channels. Channel monitoring sites were set up in 2022 at the Sedayakha, Tyjakha, and Khaduta rivers, which are small to medium in size (#23). The Messoyakha (#28), which is the largest river of the Gydan Peninsula, was also included in the dataset from the confluence with the Nyangusyakha River to the head of its delta. Under similar circumstances, it has a much greater flow rate, and the river channel's processes are managed by the shifting base level resulting from the expansion of the river delta during the Holocene period. This process results in significantly higher rates of horizontal deformation along the river than would be typically expected in this natural region.
34 800 km of rivers of the Yenisey River basin (#9) was analyzed; this subdataset consists of 98 542 eroded sections of all rivers of the Yenisey River basin that exceed the value of annual discharge of 30 m3 s−1. The Yenisei River and its tributaries have mainly incised relatively straight channels with occasional braided sections and meanders, which are related to the geological structure of its valley. The banks of this river are composed of massive crystal rocks of Permo-Triassic origin (Saunders et al., 2005). The delta of the Yenisey River (#21) is 50 km wide and 200 km long. The present study considers over 200 km of the Yenisey River delta distributary channels.
The Selenga River basin (#20) is the largest tributary of Lake Baikal and belongs hydrographically to the Yenisey River catchment. The Selenga River is situated between the mountain systems of Southern Siberia (Sayan, Khangai) and the plains of central Mongolia, draining both southern taiga, forest–steppe, steppe, and semi-desert. In the Selenga River basin, there are a wide variety of geological and geomorphological conditions for the origin of different types of channels, from wide floodplains to incised ones. The total length of channels of rivers of the Selenga River basin, which was considered in this dataset, is 8617 km.
The Ussuri River (#27) is a major right tributary of the Lower Amur, and for much of its length it straddles the border between Russia and China. A significant part of the watershed lies in the Sikhote-Alin Mountains, and the basin includes the large Lake Khanka. A 214 km section of the river (with a total length of 897 km) is presented in the database between the Siniy and Wandashan ranges, where it has an actively meandering channel and flows through the broad, swampy Ussuri Plain.
34 800 km of rivers of the Lena River basin (#3) was analyzed; this subdataset consists of 132 666 eroded sections of all rivers of the Lena River basin that exceed the value of annual discharge of 30 m3 s−1. Geological differences between the riverbeds of the Lena River basin influence the channel processes. The upper reaches of the Lena River, together with the Vitim, Olekma, and incised channels, characterize the upper reaches of the Aldan, and bedrock-controlled erosion and stable channels dominate the Vilyuy, while the middle and lower reaches of the Lena River experience active lateral migration, sediment accumulation, and floodplain development. For example, the Lena River near Yakutsk (#1), which is middle course, is mainly anabranching with sandy sediments. Previous studies on channel migration in catchment areas are maintained in works by Gautier et al. (2021), which suggest significant rates of bank retreat in this region and the key role of permafrost degradation in channel erosion processes. Additionally, the Lena Rive delta (#8) is the largest distributary channel pattern in the Arctic region, extending to 32 000 km2 with 6000 branches, of which a total of 14 600 km is specifically focused on in the dataset. The baseline conditions of channel formation in the Lena River delta are controlled by river–sea interaction and meteorological factors, as well as past formation features and the continuous presence of permafrost (Chalov et al., 2023a). The largest parts of the ice complex (or yedoma) are located here. The bank erosion estimate covers 90 % of the delta terrain, with only 3300 km2 excluded from the analysis. Four main branches were analyzed for the Lena River delta: the channels of the Bykovskaya (100 km length), Trofimovskaya (120 km), Tumatskaya (140 km), and Olenekskaya (170 km).
The Yana River (#6) is examined in its upper reaches, covering a 225 km stretch from its origin at the confluence of the Dulgalakh and Sartang rivers to the confluence with the Adycha River, out of the river's total length of 872 km. This area features a meandering channel that occurs in a broad and deep valley situated within the intermountain depression between the foothills of the Yana Plateau. Permafrost comprises the majority of the eroding banks' length, primarily made up of frozen alluvium, which contains distinct separate ice wedges.
Analysis of the Indigirka River (#16, #5) was conducted employing diverse techniques (both manual and automated) over a 618 km segment from the point where the river enters the lowland, characterized by a sudden decrease in channel slope and a transition in channel type from branching to predominantly meandering, to the beginning of the delta. This area is marked by a broad valley dominated by a large floodplain and the first river terrace, complicated by individual water channels with considerable lengths and relatively low water levels.
For the Kolyma River basin (#7), the dataset provides estimates for the 300 km downstream sections of the river system and its estuary. In this area, the Kolyma has a mainly meandering sandy channel with significant outcrops of yedoma sediments with high ice content (Strauss et al., 2021). Sparse evidence suggests (Murton et al., 2015) that channel dynamics have increased over recent years due to the climate-driven collapse of yedoma outcrops. In addition, 8100 km with 113 875 eroded sections of all rivers of the Kolyma River basin (#4) that exceed the value of the annual discharge of 30 m3 s−1 was analyzed. Significantly smaller than the Lena River delta, the Kolyma River delta (#22) consists of two main branches and is also formed by the accumulation of sediments from the river and from the erosion and abrasion of ancient landforms due to sea-level fluctuations and tectonic movements of the Earth's crust. The total length of the estimated channel distributary network in the Kolyma River delta is 120 km, covering over 3200 km2 of the delta.
The Kamchatka River (#15), located at the easternmost point of the dataset, is the largest river of the Kamchatka Peninsula situated in the Russian Far East. The 580 km section that was analyzed spans approximately 77 % of the total river length, commencing where the river exits the mountains and enters the Central Kamchatka Plain and terminating in a river gorge within the Kumroch range, just before the river's mouth area begins.
2.2 Bank erosion dataset and methods
Owing to differences in river sizes and the limitation of the analyses to particular river reaches, the compiled dataset relies on five main tools applied at various spatial levels (Table 2). Compatibility and validation of the tools are discussed in the next section. All methods provided data on bank erosion rates (m yr−1), whereas area-based approaches provided additional data on the eroded area (m2 yr−1) and volume of the eroded sediments (m3 yr−1), as well as the gross bank-erosion sediment yield (t yr−1).
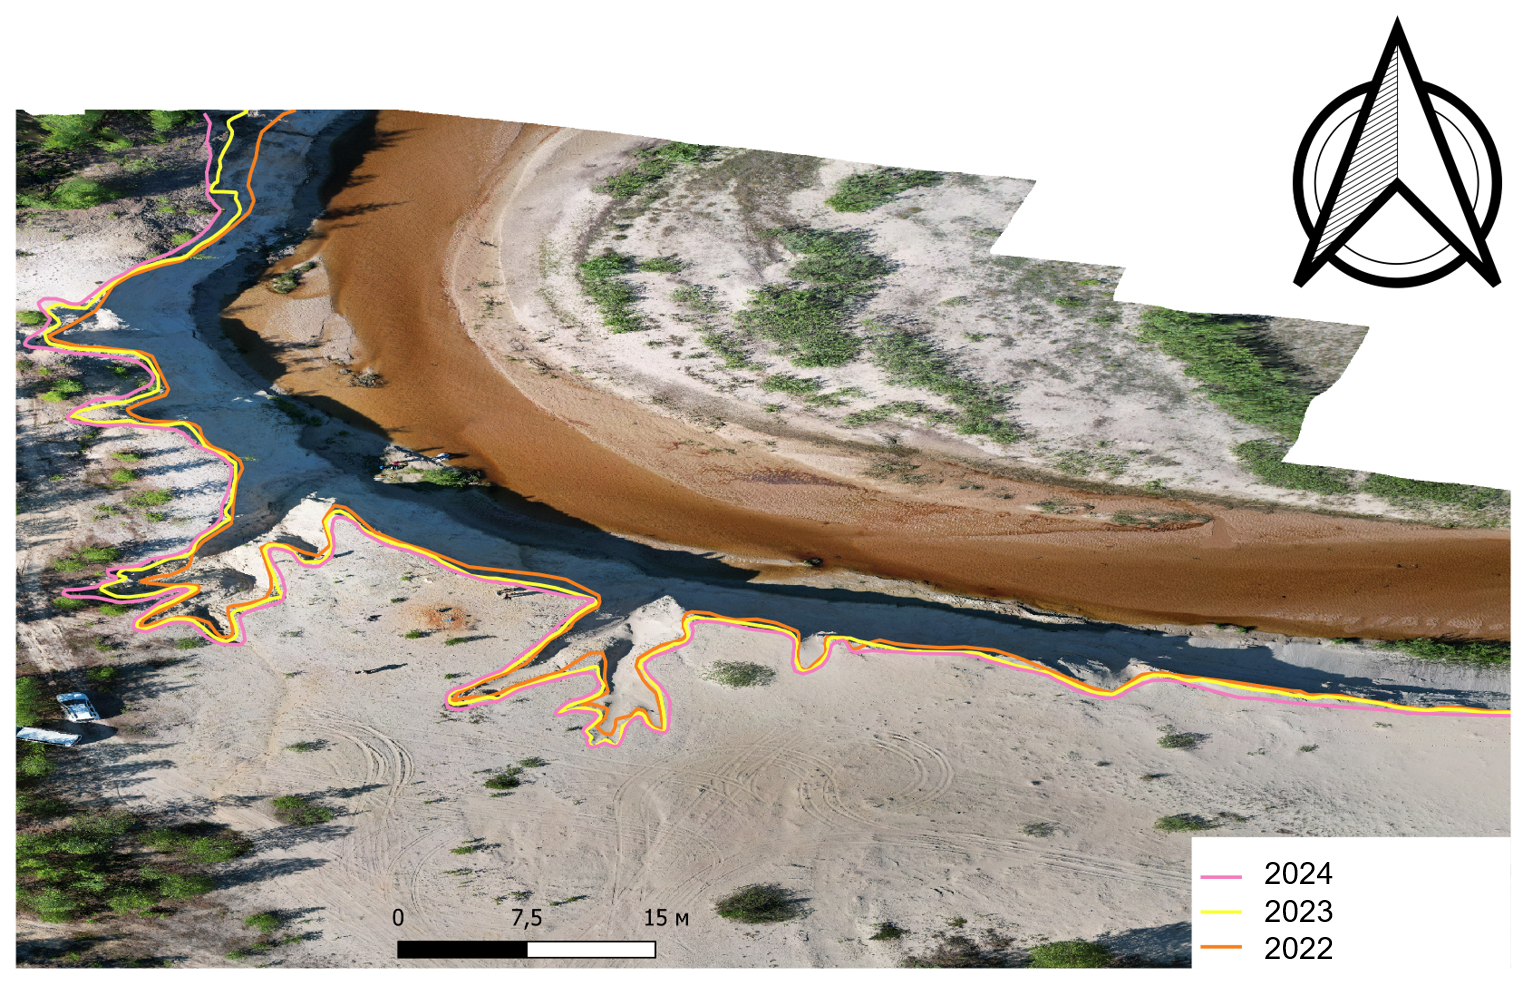
Figure 2Location of the bankline revealed from UAV at the Tayakha River at Yamal (orange – September 2022; yellow – August 2023; pink – July 2024).
Table 2Overview of applied tools.
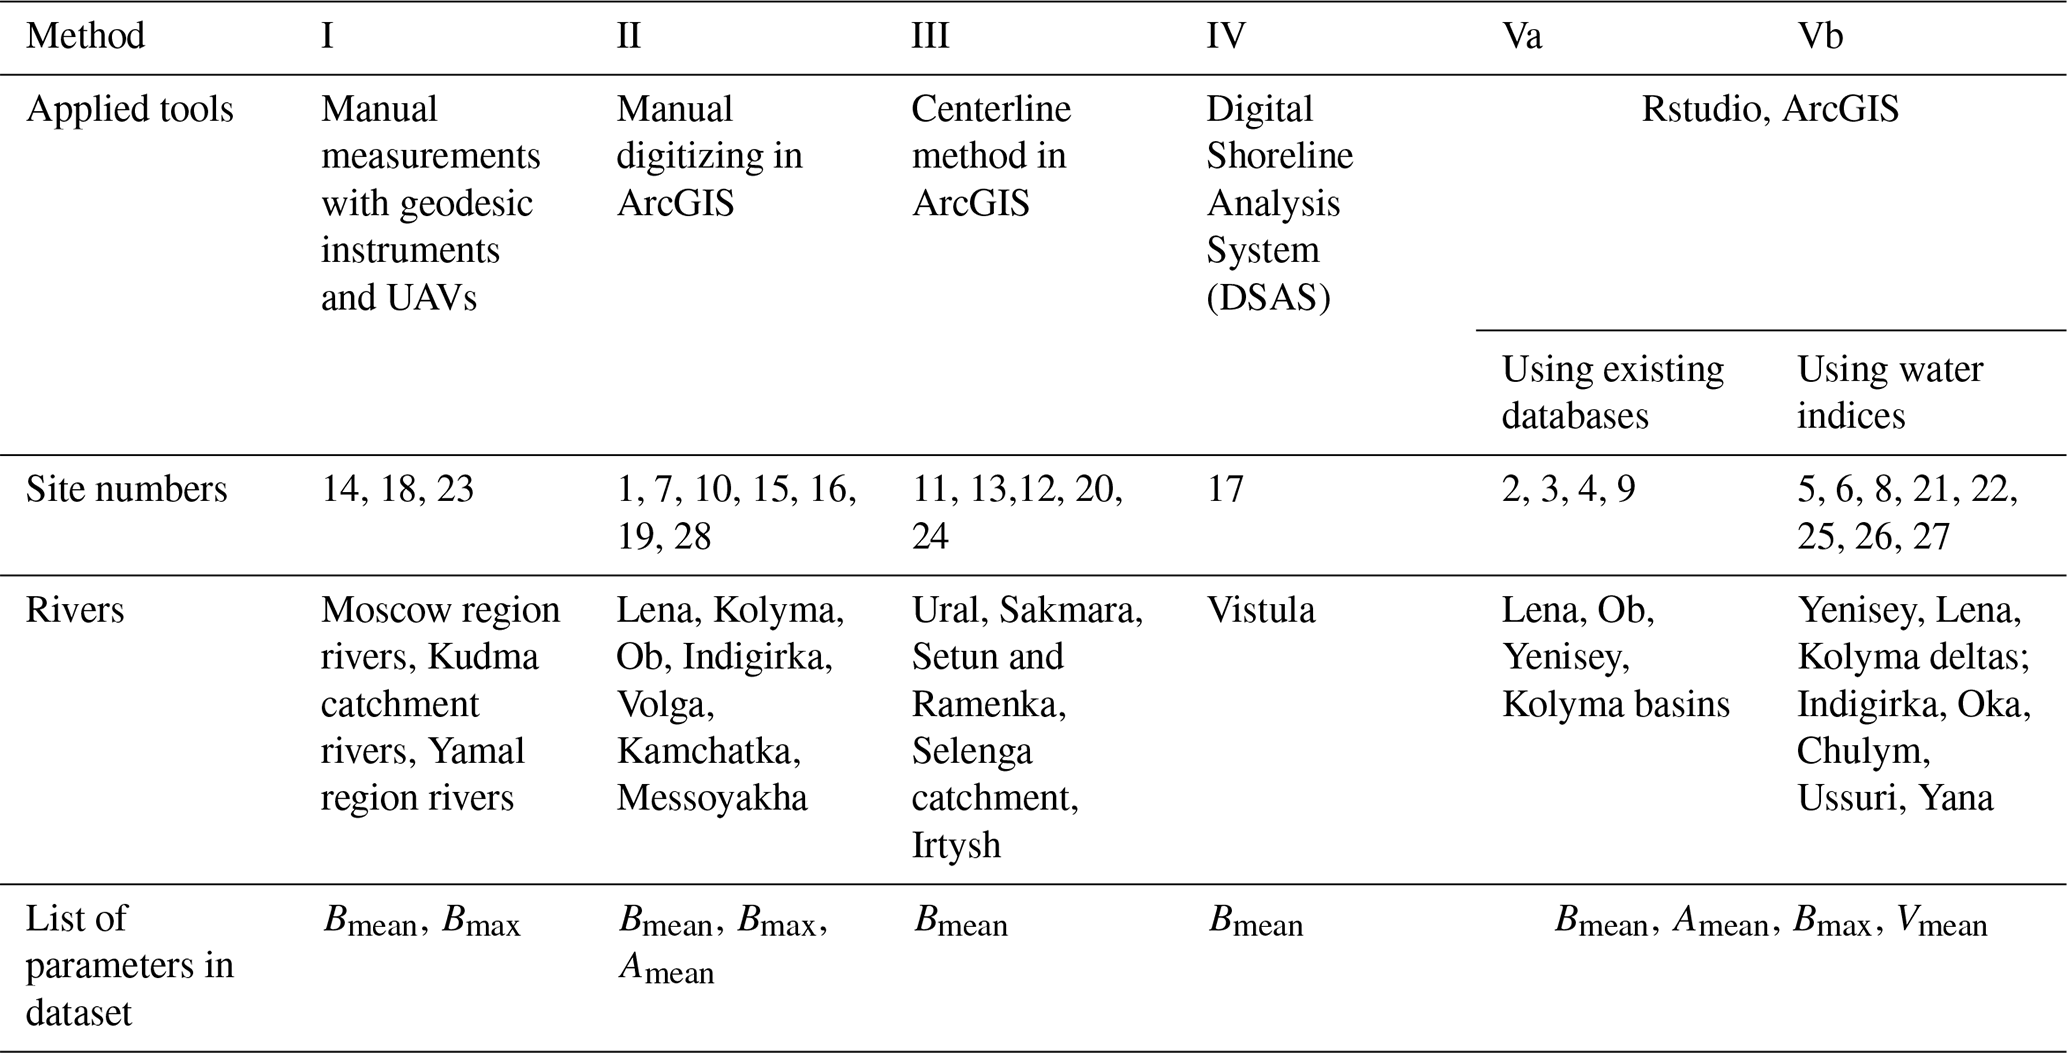
Explanations: Bmean – average bank retreat rates [m yr−1]; Bmax – maximum bank retreat value [m yr−1]; Amean – average area of bank retreat [m2 yr−1]; Vmean – mass of channel erosion in metric tons per year [t yr−1].
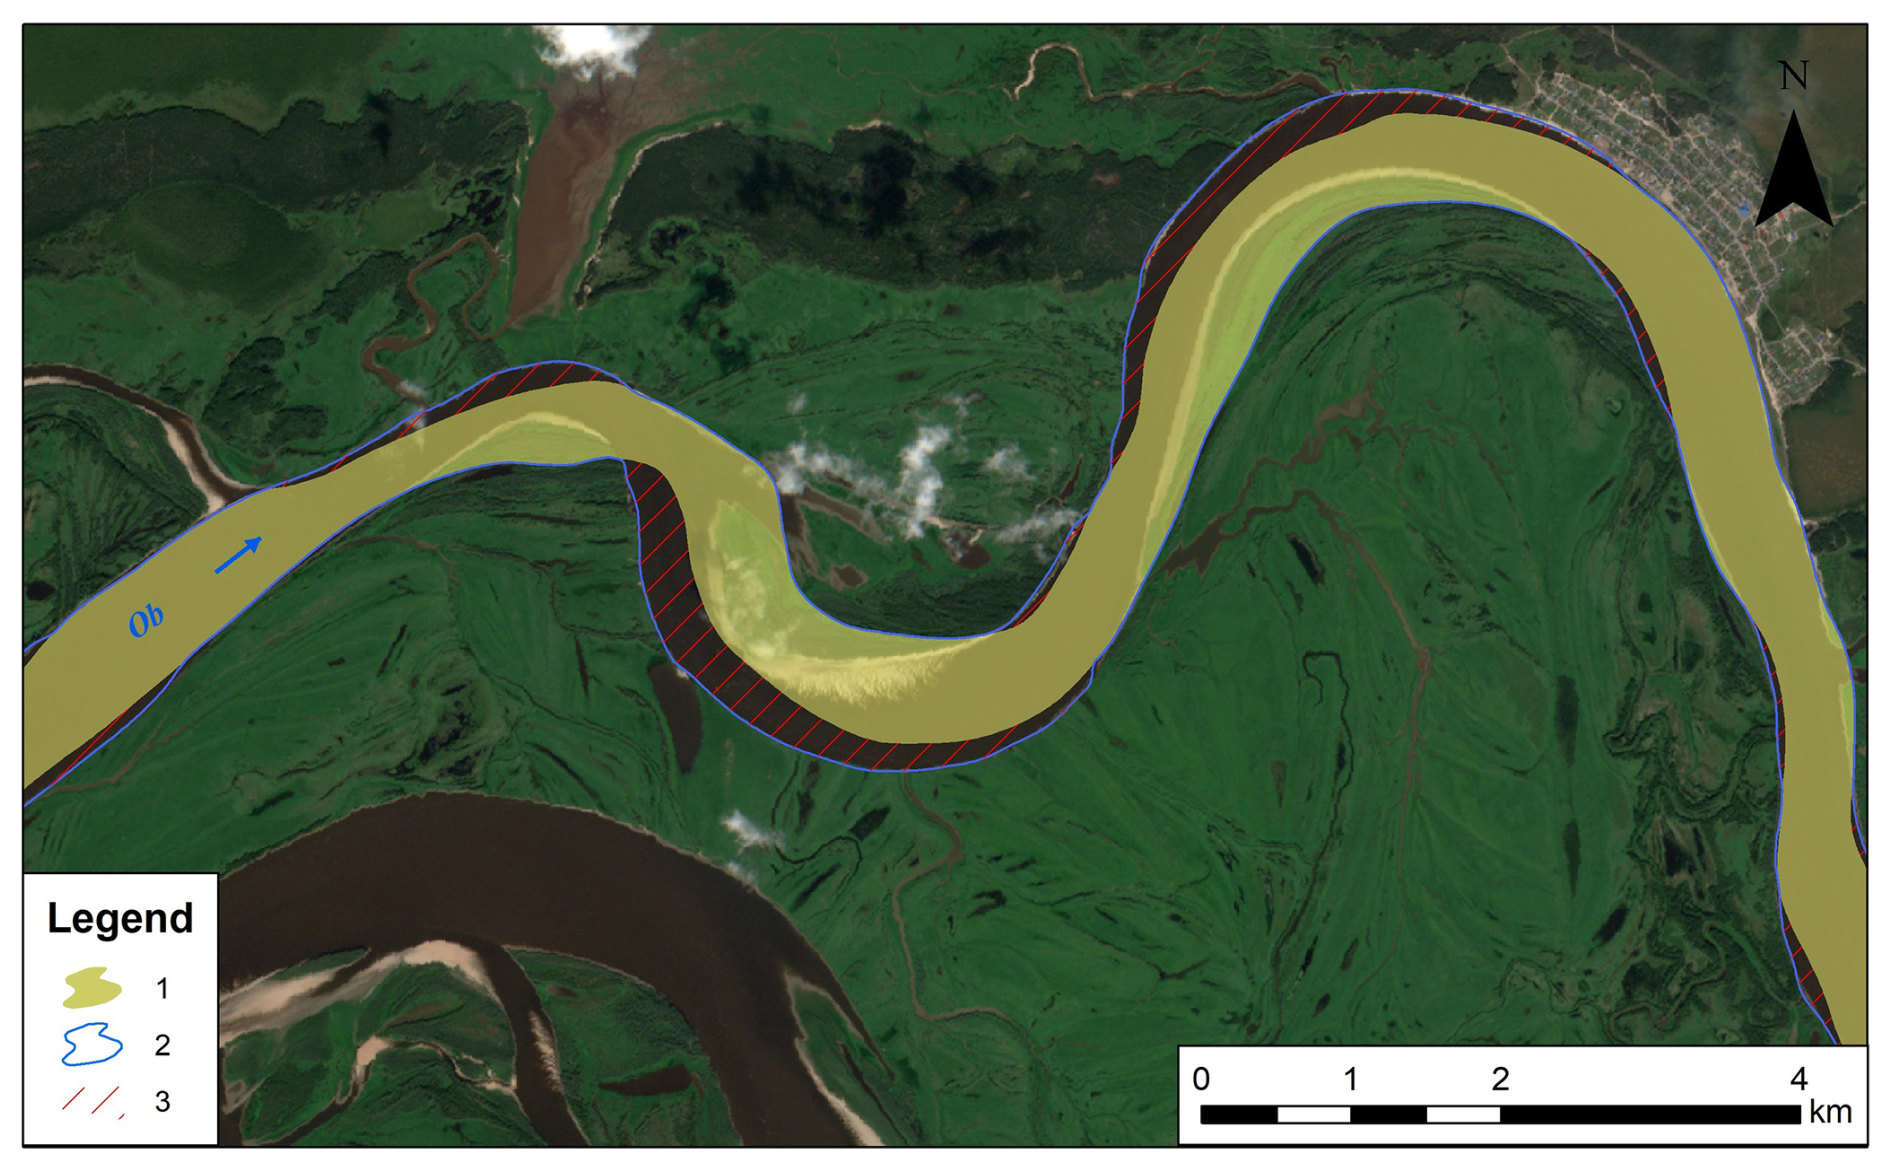
Figure 3Comparison of positions of the riverbank line of the Ob (#10) middle reach: 1 – 1970, 2 – 2018, 3 – calculated channel erosion areas (1970–2018) (© Esri Imagery).
-
method I: on-site local measurements based on field-based measurements of bank erosion in a particular reach;
-
methods II, III, and IV: linear methods, which are applied to extended river reaches based on tools that either track the banklines (obtained by manual digitizing (method II) or by the application of a specific GIS digitizing algorithm (method IV)) or stream centerlines (method III);
-
method V: area-based approaches, which are based on classifications of water and land from satellite images and further applied to quantify riverbank erosion as transitional pixels from land to the river.
- i.
On-site local measurements. Measurements taken directly on-site rely on regular surveys of a river's planform, a method suitable to detecting small river channel changes (#14, #18). Rods are positioned along the banks, especially those that have eroded, at a certain distance from them to create a grid that spans the area to be mapped. Two tapes were utilized to record data along the transect: one measured the distance between two rods, while the second tape measured the perpendicular distance from the first tape to specific points on the eroded bank (the top, toe, etc.) at intervals between the rods. The site's bank erosion intensity data could be obtained with a level of accuracy of 1 cm. Orthophotography and a digital elevation model (DEM) surface were also generated annually via UAV-based surveys during field campaigns (Fig. 2), covering the Yamal Peninsula rivers (#23). Estimates of some rivers within the city of Moscow (such as the Setun, Ramenka, #13) – particularly unaltered and non-channelized sections – were combined with satellite imagery processing. A combination of aerial images from 1942 and Google Earth images from 2010 was made.
- ii.
Manual digitizing. This method of conducting riverbank migration analyses was undertaken by comparing satellite images captured at times of similar water flow rates (low-water periods in August or September) with a deviation of 5 % from standard discharge levels. Satellite images from the CORONA series, which have a resolution of 1.8 m, and those from the Landsat 5 satellite with a 30 m resolution, were chosen as the earliest available images. The current position of the riverbank line was evaluated using multispectral satellite images obtained from Sentinel-2 with a resolution of 10 m and Landsat 7 and Landsat 8 with resolutions ranging from 15 to 30 m. The methodology involved comparing the positions of riverbank lines that had been digitized from satellite images taken in various years, as shown in Fig. 3. Consequently, we identified riverbank erosion fronts and used ArcGIS tools to determine the mean and maximum annual erosion rates, as well as the area of erosion. Riverside bank retreats were also calculated using manual image analysis of Keyhole imagery dating back to around 1964–1975 and subsequent detailed analysis of Quickbird, Worldview, and Spot satellite images from approximately 2012–2018.
- iii.
Tracking river centerline movement. This method of tracking long-term channel migration was based on river centerline calculation from satellite images in ArcGIS. The methodology was based on the classification of satellite imagery using the maximum likelihood method, which involves identifying and digitizing three training sets: (a) the water surface or fluvial bed; (b) island banks, bars, and areas without vegetation and sand; and (c) islands covered by perennial vegetation. These training sets are used to generate a classified raster output for each satellite image. The water surface was automatically extracted from a combination of visible red, NIR, and SWIR channels, and erosion polygons were calculated as the positive difference between the 2019 and 2000 water surface rasters. For each erosion polygon, the centerline was constructed and then smoothed using a Savitzky–Golay linear filter, which allowed the construction of near-parallel transects that were used to parameterize the erosion rate for points every 10 m. This approach was implemented along 8617 km of rivers in the Selenga River basin (#20) and Irtysh (#24), Ural (#11), and Sakmara (#12) rivers.
- iv.
Digital Shoreline Analysis System (DSAS) in ArcGIS. For some of the case studies, the application of the Digital Shoreline Analysis System (DSAS) was tested based on an automated statistical model deployed to estimate riverbank erosion/accretion along a selected reach of the Vistula River's middle stream. The DSAS model developed by USGS as a key component of its “Coastal Change Hazards” program calculates a comprehensive array of regression statistics within a systematic, readily repeatable method that can be implemented on a large number of data. The DSAS model is operated based on statistical estimation methods to calculate the rate-of-change statistics from satellite data. DSAS calculates erosion and accretion based on a time series of vectorized shoreline positions marked by transects generated from a reference baseline (Himmelstoss et al., 2021). In this study, bankline assessment was carried out using two different measurement calculations: the endpoint rate (EPR) and the shoreline change envelope (SCE). The EPR is calculated by dividing the distance between two given shorelines by the time elapsed between the oldest and most recent shoreline, whereas SCE reports a distance (in meters) and does not document a change rate. In this analysis, the DSAS model was employed in the selected study area, utilizing distinct Landsat images of the Vistula River spanning 2006 to 2023 to quantify riverbank erosion and accretion by (Fig. 4). First of all, the persistent bankline of distinct years (2006 and 2023) was delineated using Landsat images to assess erosion/accretion via DSAS. The generated binary raster datasets were then transformed into vector data, and the land–water boundary was demarcated. DSAS needs a single land–water boundary as input, which is called the “baseline”, and the erosion/accretion is calculated relative to the baseline. The baselines created for both the right and the left banks had a buffer of 200 m, and the transects were cast perpendicularly to the baseline at intervals of 100 m (Fig. 4).
- v.
Area-based approach for rivers. The area-based method used to assess river planform changes was similar to the SCREAM method (Rowland et al., 2016) and REAL dataset (Langhorst and Pavelsky, 2023). Channel erosion was measured as a bank retreat along the studied rivers based on the Global Surface Water Explorer (GSWE hereinafter) automatic image interpretation dataset, which provides global data on the location and persistence of surface water and its changes from 1984 to 2021. For each year, there are 14–22 space images (raster layers) that characterize periods of different water flow. In our research, the “Water Transitions” layer was used, which provides an estimate of long-term water history by identifying transitions between permanent water, seasonal water, and land classes between the first and last years. Water surface area changes in the images are mainly caused by water balance fluctuations; however, in the regional context of river channels, channel erosion can be described as a new permanent waterbody adjacent to the modern river channel.
Another GSWE layer, “Occurrence Change Intensity”, provides information on where the surface water occurrence increased, decreased, or remained the same for 1984–1999 and 2000–2021, whereas the “Transitions” layer divides these changes into eight classes based on seasonality and stability. Both classifications were compatible and were used similarly (Fig. 5). To obtain the migration rate [m yr−1] for each site, the bank migration surface was divided by the length of the oldest of the two channel banks and then by the number of years of the analyzed time interval.
A manual area-based approach for distributary channels was also used by comparing two Landsat satellite images with similar water flow conditions for deltas of the Yenisey, Lena, and Kolyma rivers and long meandering stretches of the Indigirka, Oka, Chulym, Ussuri, and Yana rivers in homogeneous landscapes and flow conditions. Bank locations were identified using the Automated Water Extraction Index (AWEI), which allow us to clearly distinguish the boundary between water and land and highlight hidden details that are poorly visible when using only visible channels, including submerged shallows and shadowed sections (Feyisa et al., 2014).
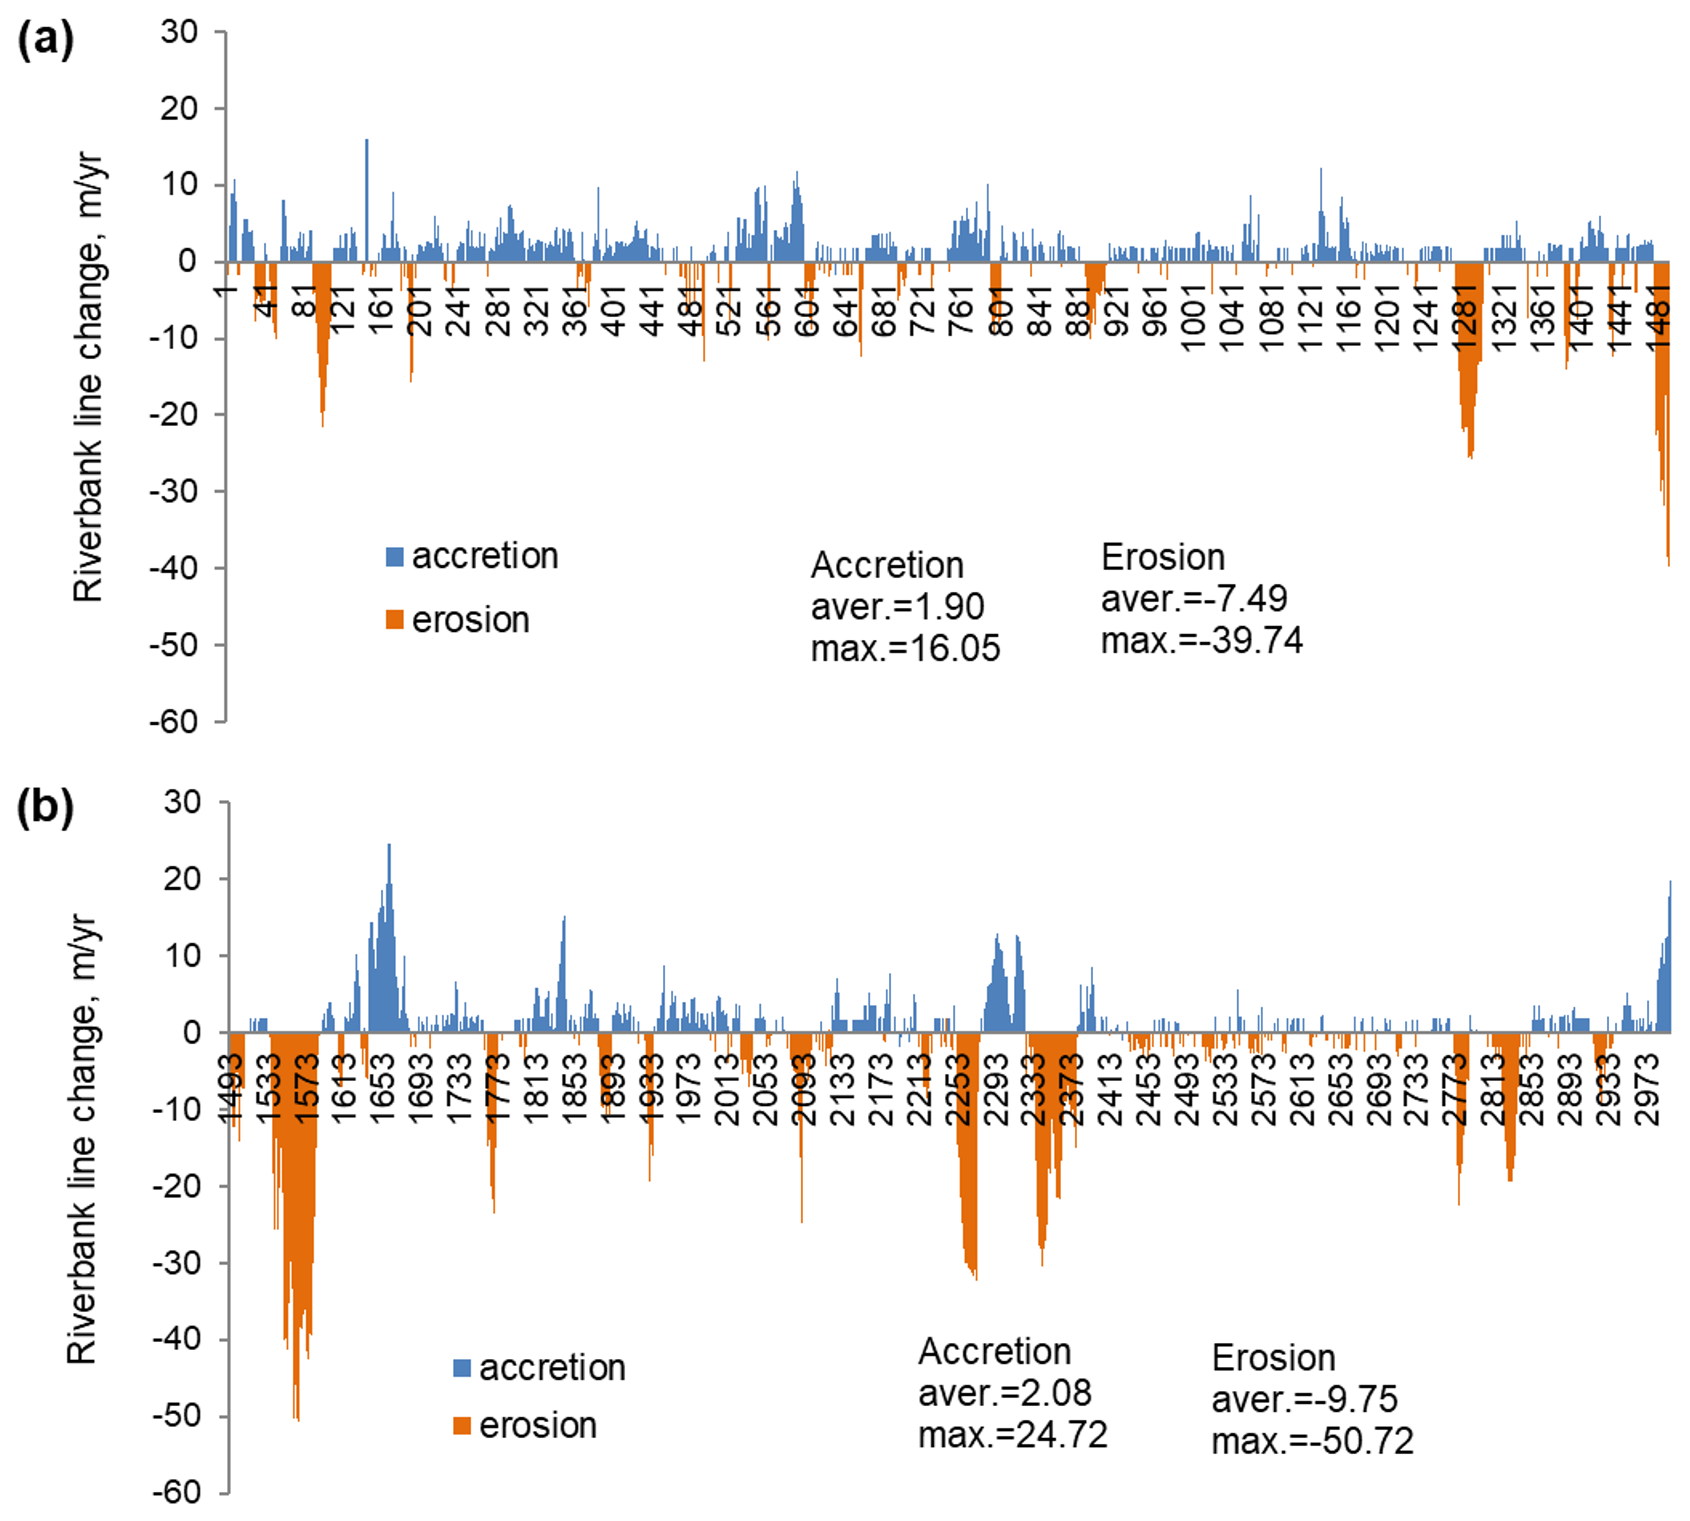
Figure 4Endpoint rate (EPR) calculation curve generated from DSAS for riverbank line change (m yr−1) of the Vistula River (#17) in the middle section between the mouth of the Radomka River (km 430) and of the Narew River (km 551): (a) left bank and (b) right bank. The x axis shows the transect number. The numbering of the transects increases from south to north.
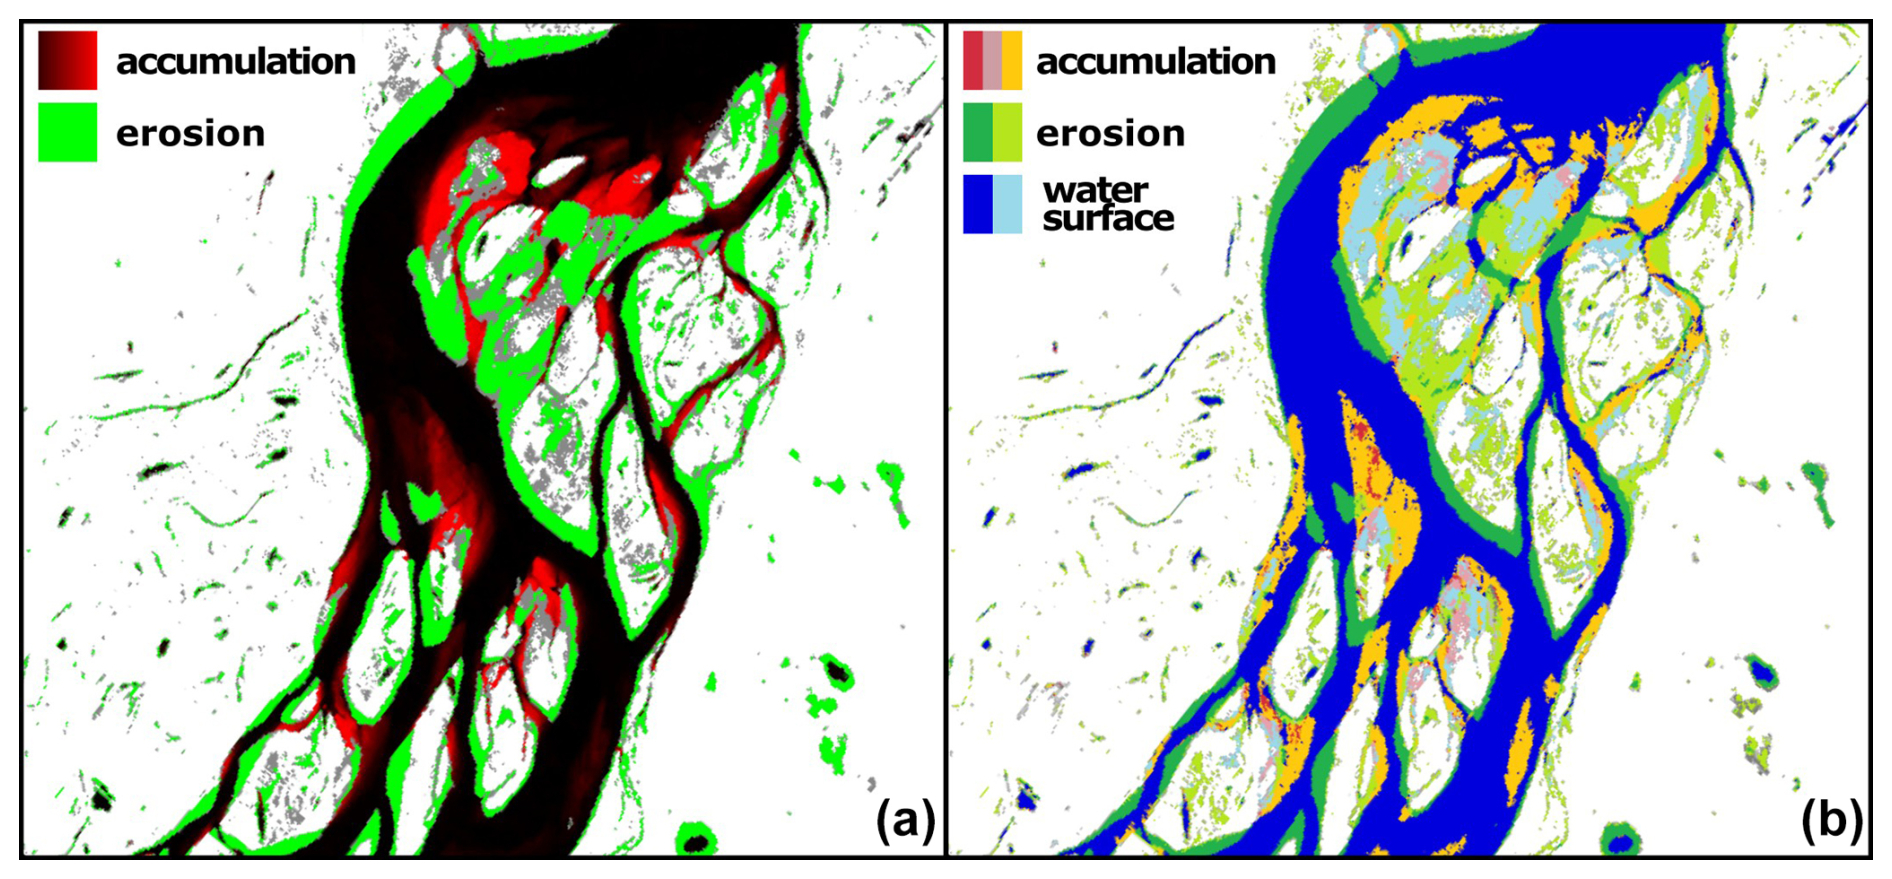
Figure 5Bank erosion classification according to the GSWE map – change intensity (a) and transitions (b) (Lena River case study). Explanations: the change intensity layer classifies water surface from Landsat imagery collection into three types – stable water surface, erosion, and accumulation areas (the accumulation color is more saturated for more permanent areas over time). Transition layers classify water surface in more detail according to seasonality, which allow the separation of erosion and accumulation for stable banks and shoals, sandbanks, etc.
2.3 Compatibility of different method applications and uncertainty estimate
The construction of the dataset involved a combination of manual and semi-automatic methods for estimating bank erosion, incorporating both field-based and remote sensing data; consequently, multiple sources of uncertainty could affect the results. The dataset primarily showcases the potential of employing various methods to measure channel displacement rates and qualitatively comparing them across territories with diverse natural conditions and spatial factors driving erosion. Considering the scale of the observed phenomena, it is worthwhile to examine the extent of bank retreat extremes. In studies of bank erosion, the maximum values of bank retreat often receive the most attention; however, during the process of automatically defining a bank's edge, an increase in retreat distance typically results in a corresponding increase in error values or the likelihood of bank position error. Consequently, the results of automatic delineation necessitate thorough verification in this analysis due to disparities in bank failure patterns and the bank slope's configuration and incline.
Manual digitizing of high-resolution satellite or aerial imagery is the most accurate technique for bank retreat calculations, yet it is also the most time-consuming process and offers limited accessibility compared to Landsat and Sentinel databases (Piégay et al., 2020). The availability of archived satellite and aerial imagery enables a substantial expansion of undertaking such comparison. The accuracy of manual delineation is influenced by the reference scale used during the process, which is often referred to as the “eye altitude”, and error typically remains below 1–2 m. The primary causes of manual digitization mistakes are tied to the precision of georeferencing (both the primary and the secondary images) and variations in tilt angle. In a case study of the Mekong Delta, Van Binh et al. (2020) found that the total digitization error was no more than 2.8 m. Up to this point, numerous methods have been devised for categorizing optical images and determining landscape boundaries from them, resulting in levels of accuracy comparable to those of manual digitization, specifically 0.4 % to 12.7 % for the erosion area in the Colville River case study (Payne et al., 2018).
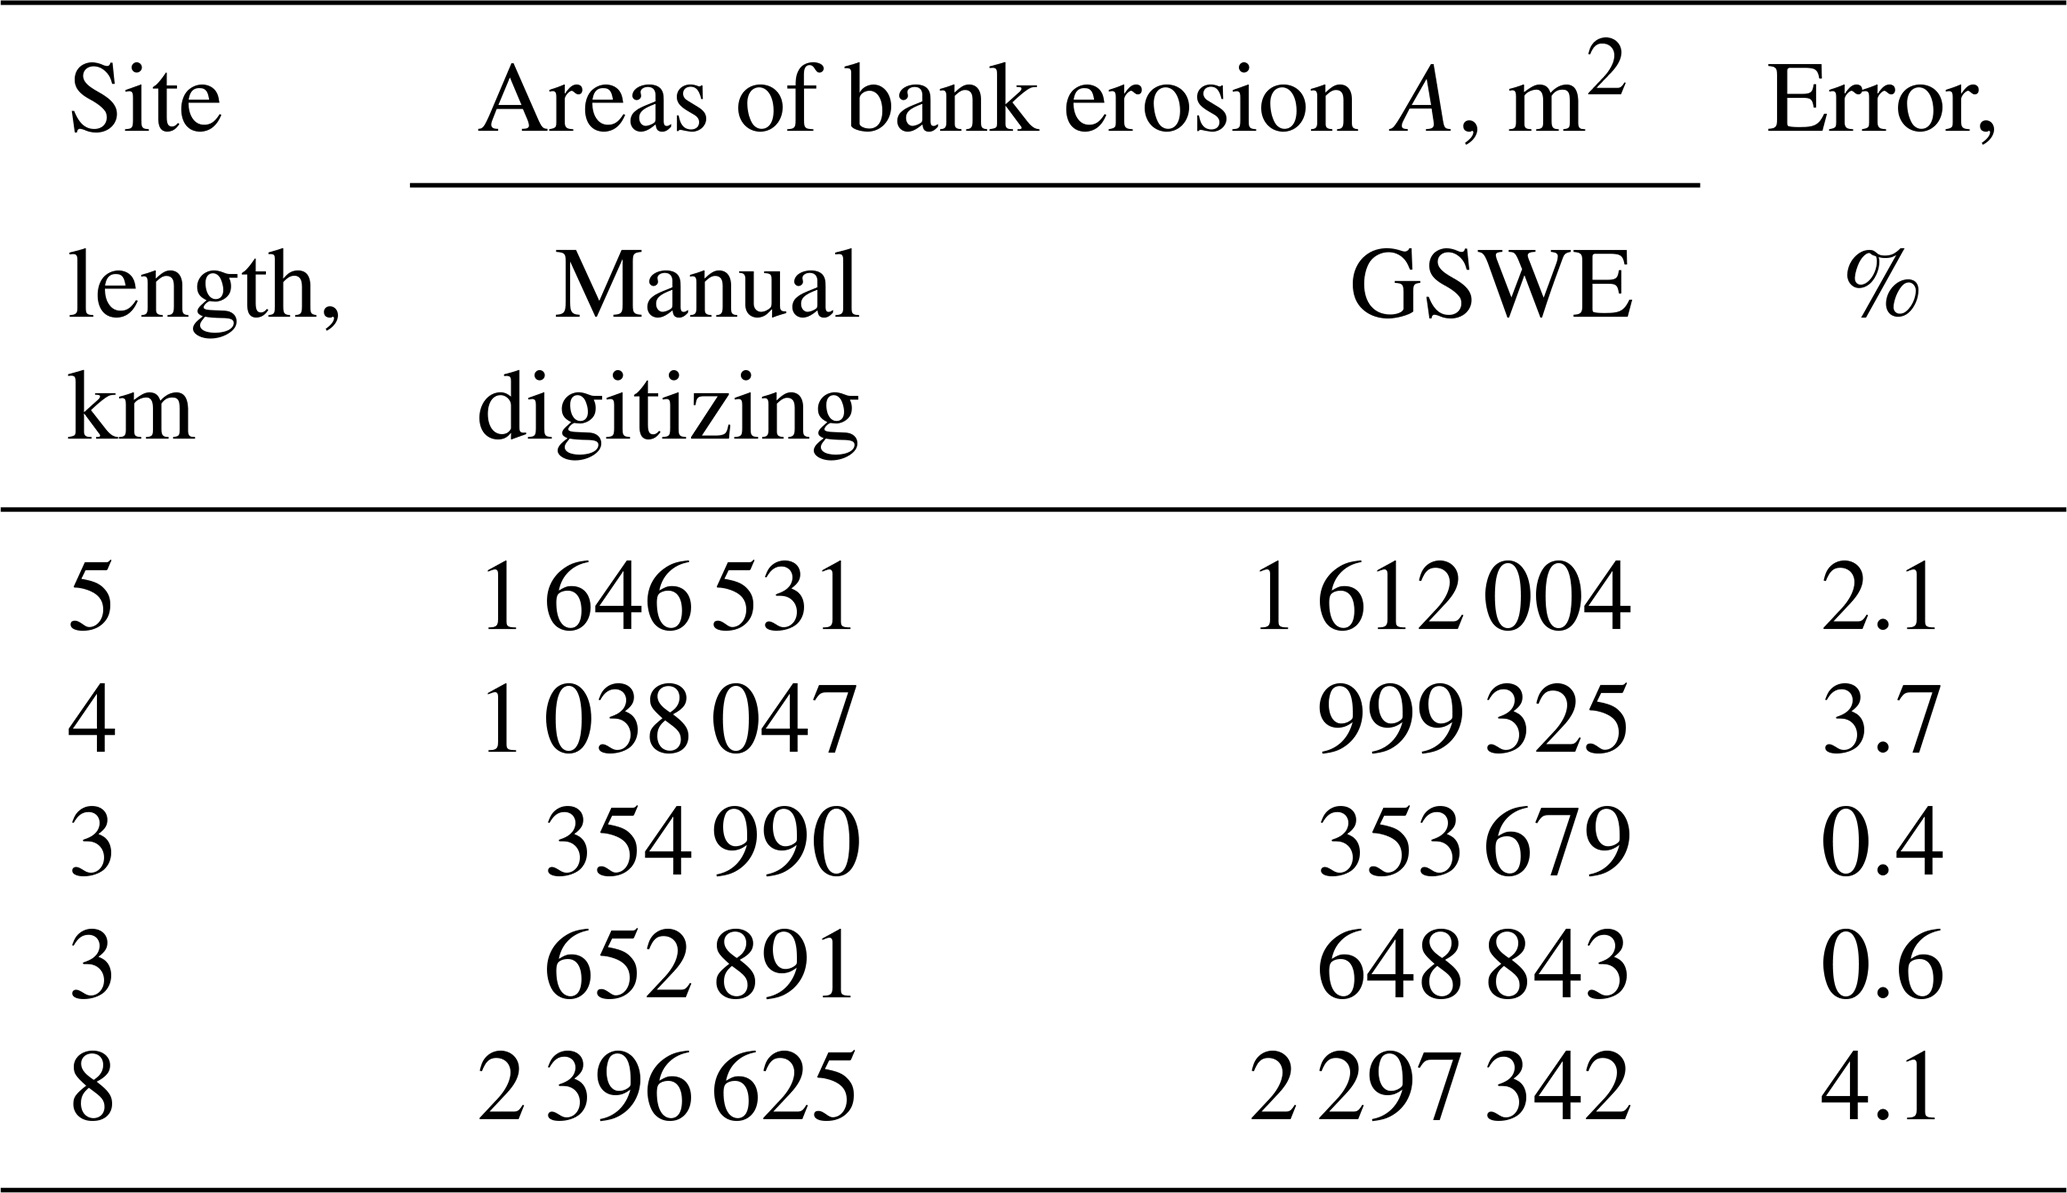
The accuracy of our riverbank migration estimates was assessed by determining the bank erosion rate for several river stretches using multiple approaches. The middle course (#1) of the Lena River included several sites that were observed on islands and on both the right and the left banks, as shown in Table 3. Images captured by Landsat 5 in August 1999 and Landsat 7 in August 2020, both taken when water levels were low, were manually digitized to verify the GSWE results for the corresponding time frame. The error was determined by comparing it to the percentage discrepancy between manual tracing and erosion detection. The findings suggest a compatibility range of 0.4 % to 4.1 %, thereby supporting the idea of compatibility among the tools used in this study.
Table 3Validation of area-based calculations for the Lena River.
Previous studies (Albertini et al., 2022; Huang et al., 2018; Laonamsai et al., 2023; Liu et al., 2022; Zhou et al., 2017) have evaluated the precision of different water surface definition indices in identifying the precise location of riverbanks, with results showing that indices like MNDWI and AWEI yield an average error rate of up to 5 %. The results indicated that automatic computations can be applied when the rate of streamflow surpasses 100 m3 s−1, thus enabling the calculation of outcomes with an accuracy of under 10 %. The accuracy of optical extraction is constrained by various morphological features of the banks, such as sandbars and debris resulting from bank material collapse near the edge, the shadows cast by the banks and trees, and fallen tree trunks. A similar investigation was carried out for the portion of the Yana River that was examined, employing multispectral (Landsat 8) and optical (Worldview-2) images acquired on 21 June 2021, as shown in Fig. 6. Banks were automatically classified using unsupervised classification and AWEI in Landsat imagery. For the comparison, the images were also digitized at a scale of 1:500. The research shows that automated methods for marking bank positions result in minimal average errors when dealing with uniformly well lit slopes and the water–dry land boundary, but the error rate increases for other conditions. At the same time, the average error for the 6 assessed locations (after smoothing the bankline using the Savitzky–Golay method) was 7.5 m for automatic classification and 3 m for AWEI. Annual retreat rates combined with prolonged periods of comparison will lead to extremely low total percentages, specifically less than 1 %.
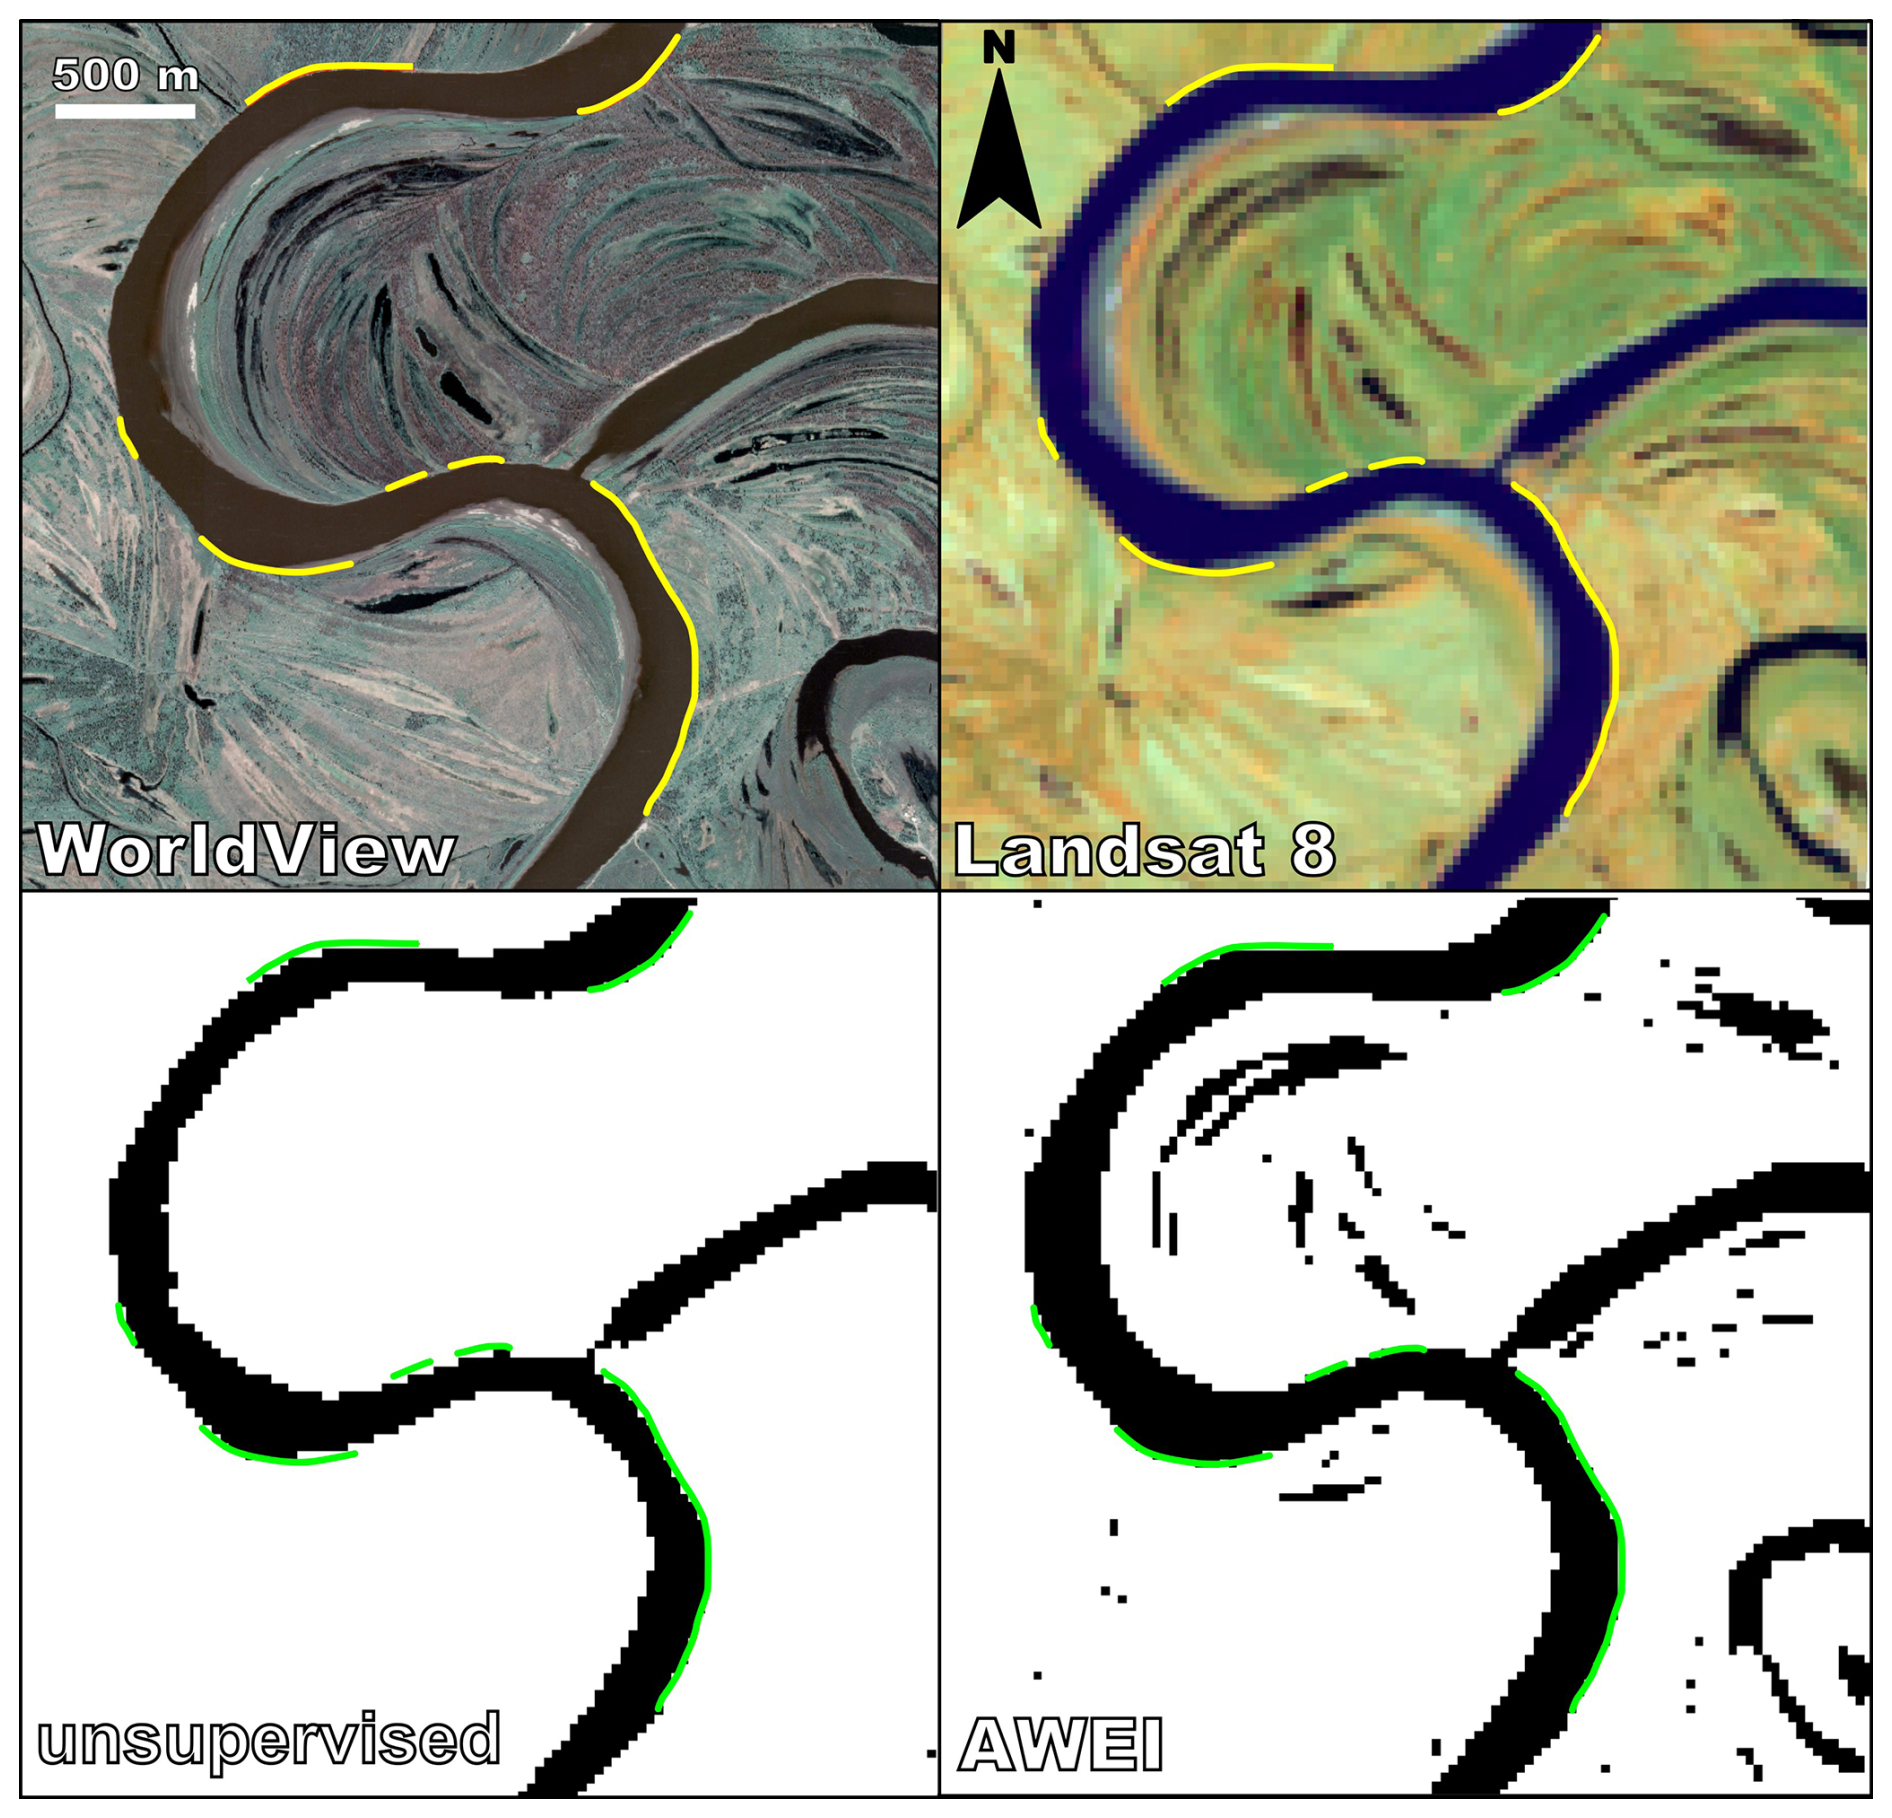
Figure 6The Yana River section near the Batagay settlement in satellite images from 21 June 2021 with digitized position of the riverbanks in the erosion area (top panels, yellow lines) and an example of their automatic detection by automatic classification (bottom-left panel) and with application of AWEI (bottom-right panel), with manual digitized bank positions imposed (green lines).
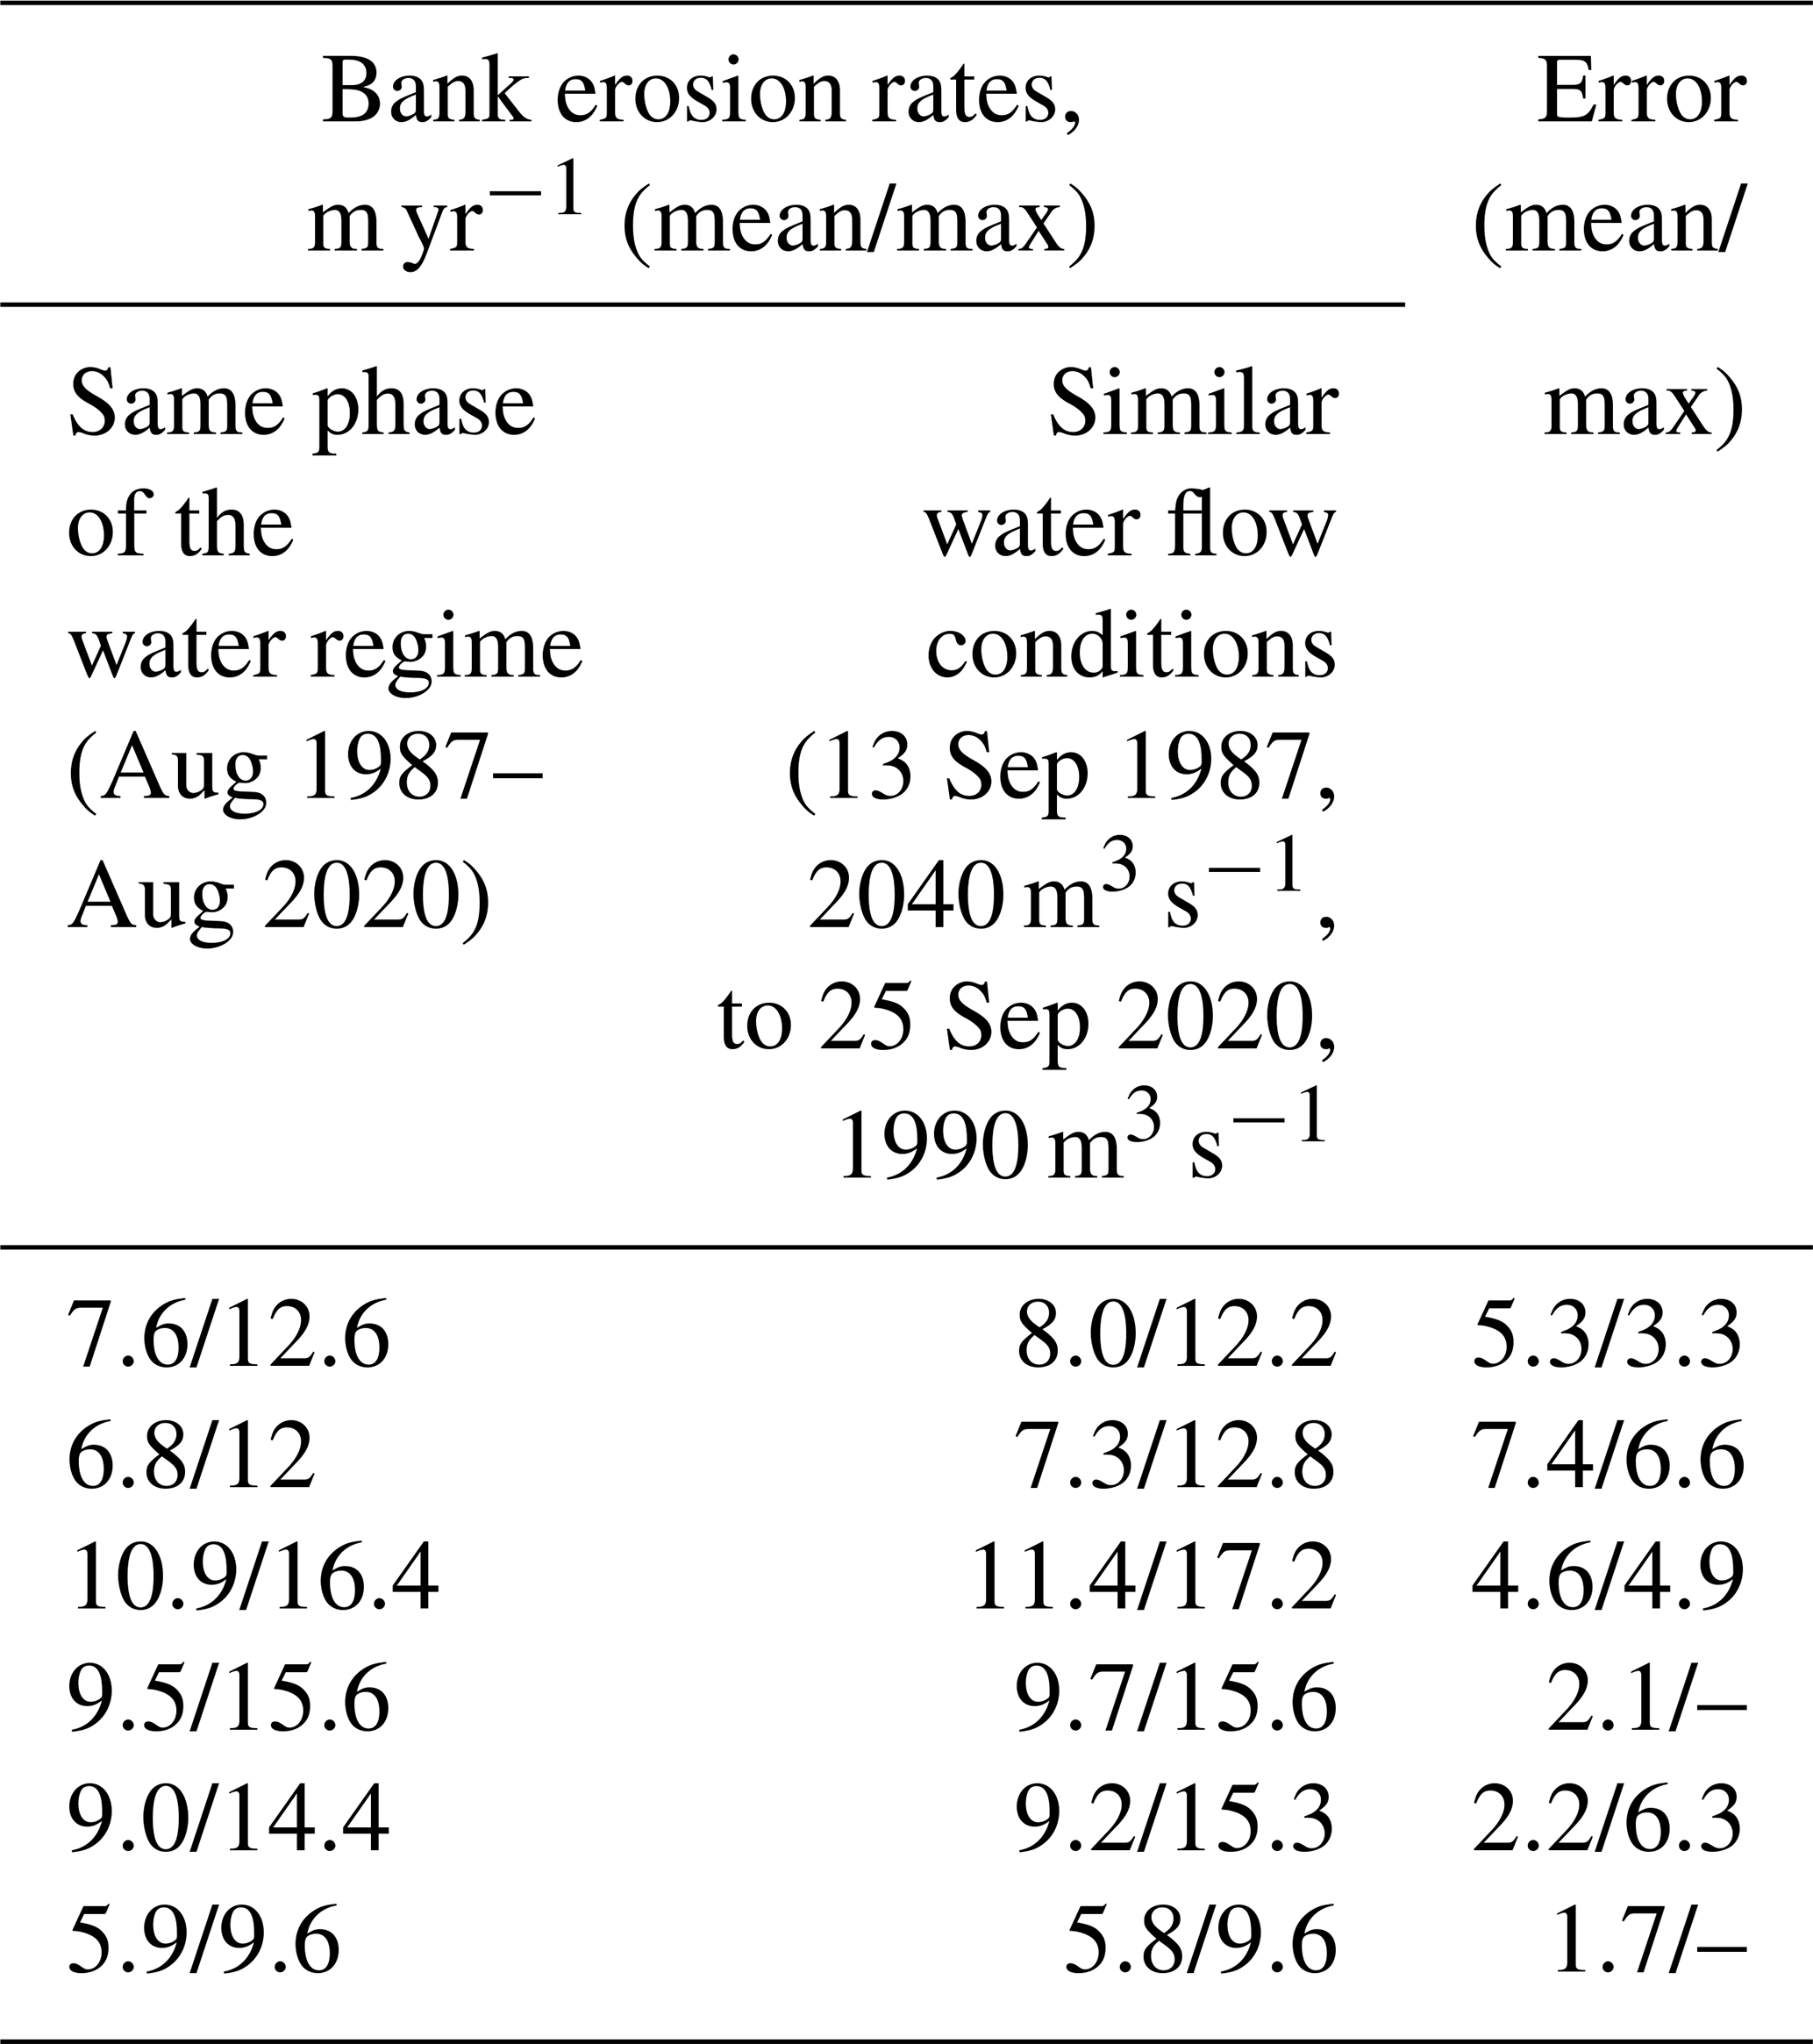
Uncertainty can also be attributed to fluctuations in river water levels. To minimize this source of error, discharge estimates for all rivers were utilized for the dates when the satellite image was created, ensuring conditions with a discrepancy of less than 5 %. The greatest inaccuracies are typically seen when employing the centerline migration approach, primarily due to variations in flow rate. The placement of centerlines is influenced not only by the local characteristics of the erosion site but also by the entire width of the channel, making low-water images unsuitable for this approach, and it is essential to select an image taken on a date with discharges similar to those in bankfull conditions. The error was estimated by comparing the results of manual digitization for different sections of the Irtysh River, using pairs of images taken on different dates, with one pair corresponding to the same stage of the water regime and another pair to similar discharge levels. The analysis revealed discrepancies of up to 7.4 % in average annual retreat rates and up to 6.3 % in maximum rates when comparing yearly rates calculated from different image pairs (Table 4).
Table 4Validation of erosion-rate-based calculations in the Irtysh River.
We compared retreat rates from key river sections using both semi-automatic and manual methods across various time periods to evaluate the hypothesis that retreat characteristics become more consistent with longer comparison intervals. The data collected at the key sites on the rivers within the Ob River basin (#10) were found to be similar when obtained using both semi-automatic and manual methods and allowed for results with an acceptable error margin of up to 10 %. Statistical analysis of the 260 km Indigirka River section, which was digitized both manually (using high-resolution images from Keyhole and Worldview over a 42-year period from 1975 to 2017) and semi-automatically (using Landsat imagery over a 19-year period from 2000 to 2019), revealed that at cross-sections with a 30 m frequency, the error in the mean retreat rate is approximately zero for half of the sections with either small or extreme retreat rates, even when comparing different periods (as shown in Fig. 7). Automated retreat rates for the longer time period are overestimated by approximately 6.5 % compared to manually calculated ones. Based on the above comparisons, we conclude that the retreat rates, aggregated in the presented database, are comparable to each other despite using different spatial approaches and timescales, and the total error of the obtained rates does not exceed 10 %.
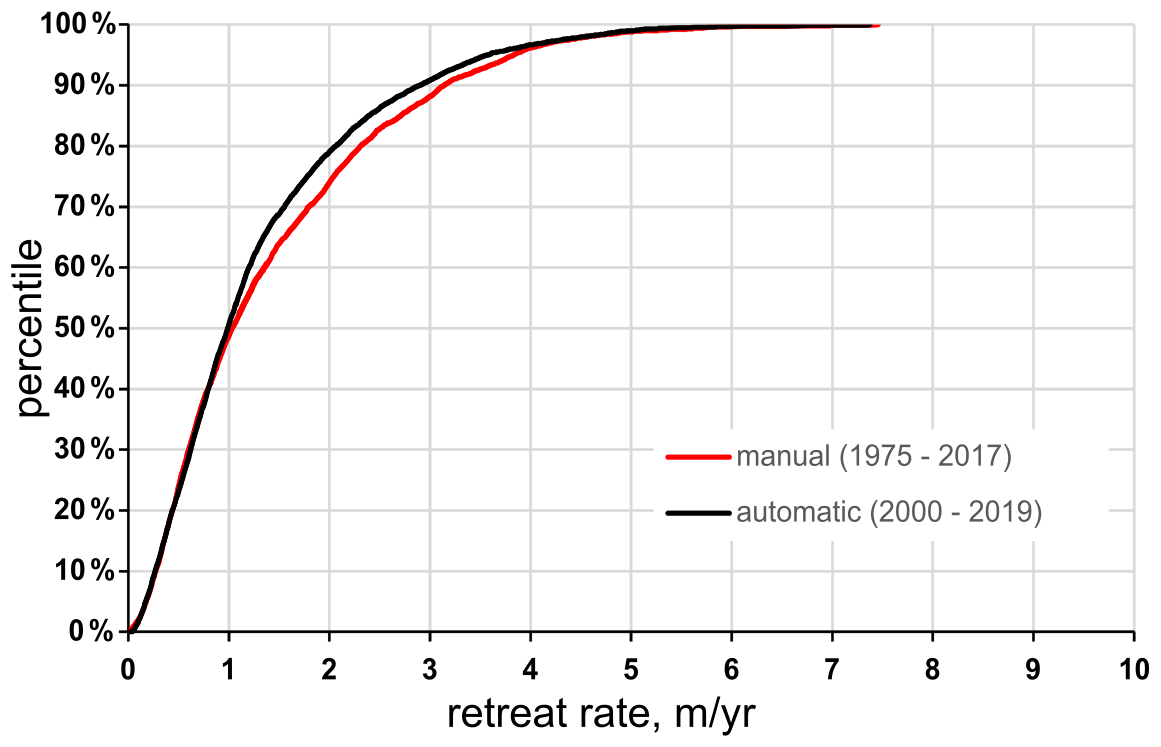
Figure 7Percentile curves of the retreat rates for manual (#5) and semi-automatic (#16) delineation of banks on the same section of the Indigirka River.
The DSAS approach (method IV) was verified by comparing measurements from three control cross-sections using geodetic measurements with a GNSS RTK receiver for the Wistula River. The 2006 data came from measurement cross-sections provided by the State Water Holding Polish Waters – the water management authority in Poland. The validation results show that DSAS signifies its utility and reliability – the correlation coefficients ranged from 0.95 to 0.99. For example, in a study by Lima et al. (2021), the in-built EPR4Q for QGIS was validated with DSAS, depicting a high correlation coefficient range of 0.98–1.00 across various types of shorelines, thereby affirming the accuracy of DSAS in shoreline change assessment, and ODSAS (“Open Digital Shoreline Analysis System”) was developed and compared with DSAS, which yielded similar results (Gómez-Pazo et al., 2021). These studies highlight the credibility of DSAS in bankline and shoreline assessments.
2.4 Estimate of gross bank-erosion sediment yield
The estimation of bank erosion in terms of eroded area enables us to calculate source of sediments by lateral erosion per unit of channel length per unit of time (gross bank-erosion sediment yield, Wch). This calculation involves determining the eroded area through manual satellite data processing or automatic image classification data from GSWE:
with ρsed denoting riverbank sediments density [kg m−3], Δt the time gap between satellite images (year), Ser the eroded area from satellite data [m2], hb bank height [m], and hd river depth [m].
The bank height (above-average iced low-flow period water level hb) was obtained from ArcticDEM with a resolution of 2 m (Morin et al., 2016). The bank height calculation was made using programming in the R language (terra and sf packages). For each group of adjusted pixels of channel erosion area Ser, a buffer zone of 50 m radius was created from which the maximum and mean values of absolute height were calculated using ArcticDEM data. To exclude the influence of canopy, buildings, and other outlier errors, values of 0.95 and 0.05 quantiles were used. The difference between maximum (0.95 Q) and minimum (0.05 Q) values of elevation of each buffer zone can be described as the difference between the low-flow period level of the river and the present bank and floodplain height.
The underwater part of the bank slope was obtained as a mean depth of the river using the 1D Shezi formula (Eqs. 2–4) based on data obtained from the global datasets HYDROAtlas (Linke et al., 2019) and GRWL (Allen and Pavelsky, 2018) under average-annual-flow conditions. Data of the mean annual discharge and water slope were obtained from HYDROAtlas with a mean resolution of ∼4 km. Data of the mean river width were obtained from GRWL with a mean resolution ∼3 km. Manning's roughness coefficient is assumed to be constant for all rivers at 0.045 (Baryshnikov, 1990).
with Q denoting water discharge [m3 s−1]; ω the cross-section square [m2]; C the Shezi coefficient [m0.5 s−1]; R the hydraulic radius [m], which is similar to river width B; I the slope; and n the roughness coefficient.
An evaluation of the bulk density of riverbank sediments comprised of typical river sediment values from Karaushev (1977) and was included in the dataset as additional parameterization (see Sect. 2.5). Also, the height of the eroded bank edges was obtained from the ArcticDEM elevation model. Bank edge height is calculated automatically using the extreme difference estimator method in the R environment. This involves searching for graph inflections (corresponding to the seam and the edge of the coastal slope) and recording the difference in the heights of the inflection points in each transect. The output is erosion sections, formalized into points located along their central line with the required density. Each point contains all the required information for further processing – erosion width, erosion wall height, and distance along the bankline.
2.5 River site classifications
Additionally, each river section was categorized by several environmental and hydrological characteristics that potentially influence channel behavior such as water discharge, permafrost extent, prevailing vegetation, and types of sediments. The annual water discharge and river characteristics were taken from the HydroATLAS database (Linke et al., 2019) with a spatial resolution of 10 km. Attribution of rivers to natural zones was done based on the Köppen climate classification (Peel et al., 2007), which is indexed based on three letters of the classification scheme (e.g., BSk relates to a dry (B), semi-arid (S), cold (k) climate). Permafrost zones were categorized based on the actual area underlain by permafrost from Obu et al. (2019). Finally, rivers were classified by channel pattern distribution according to the map “Channel morphology regime of rivers of USSR” (Chalov et al., 2018) and further classified by dominant bed deposit types. Each bed deposit class (from sand to gravel) was characterized by specific values of grain density (see Table 5), which is used to estimate gross bank-erosion sediment yield. The database did not include a particular description of the channel patterns as this process would require significant additional studies. In the future, a presented database will involve channel pattern categorization based on ongoing regional research (e.g., see Chalov and Chalova, 2024).
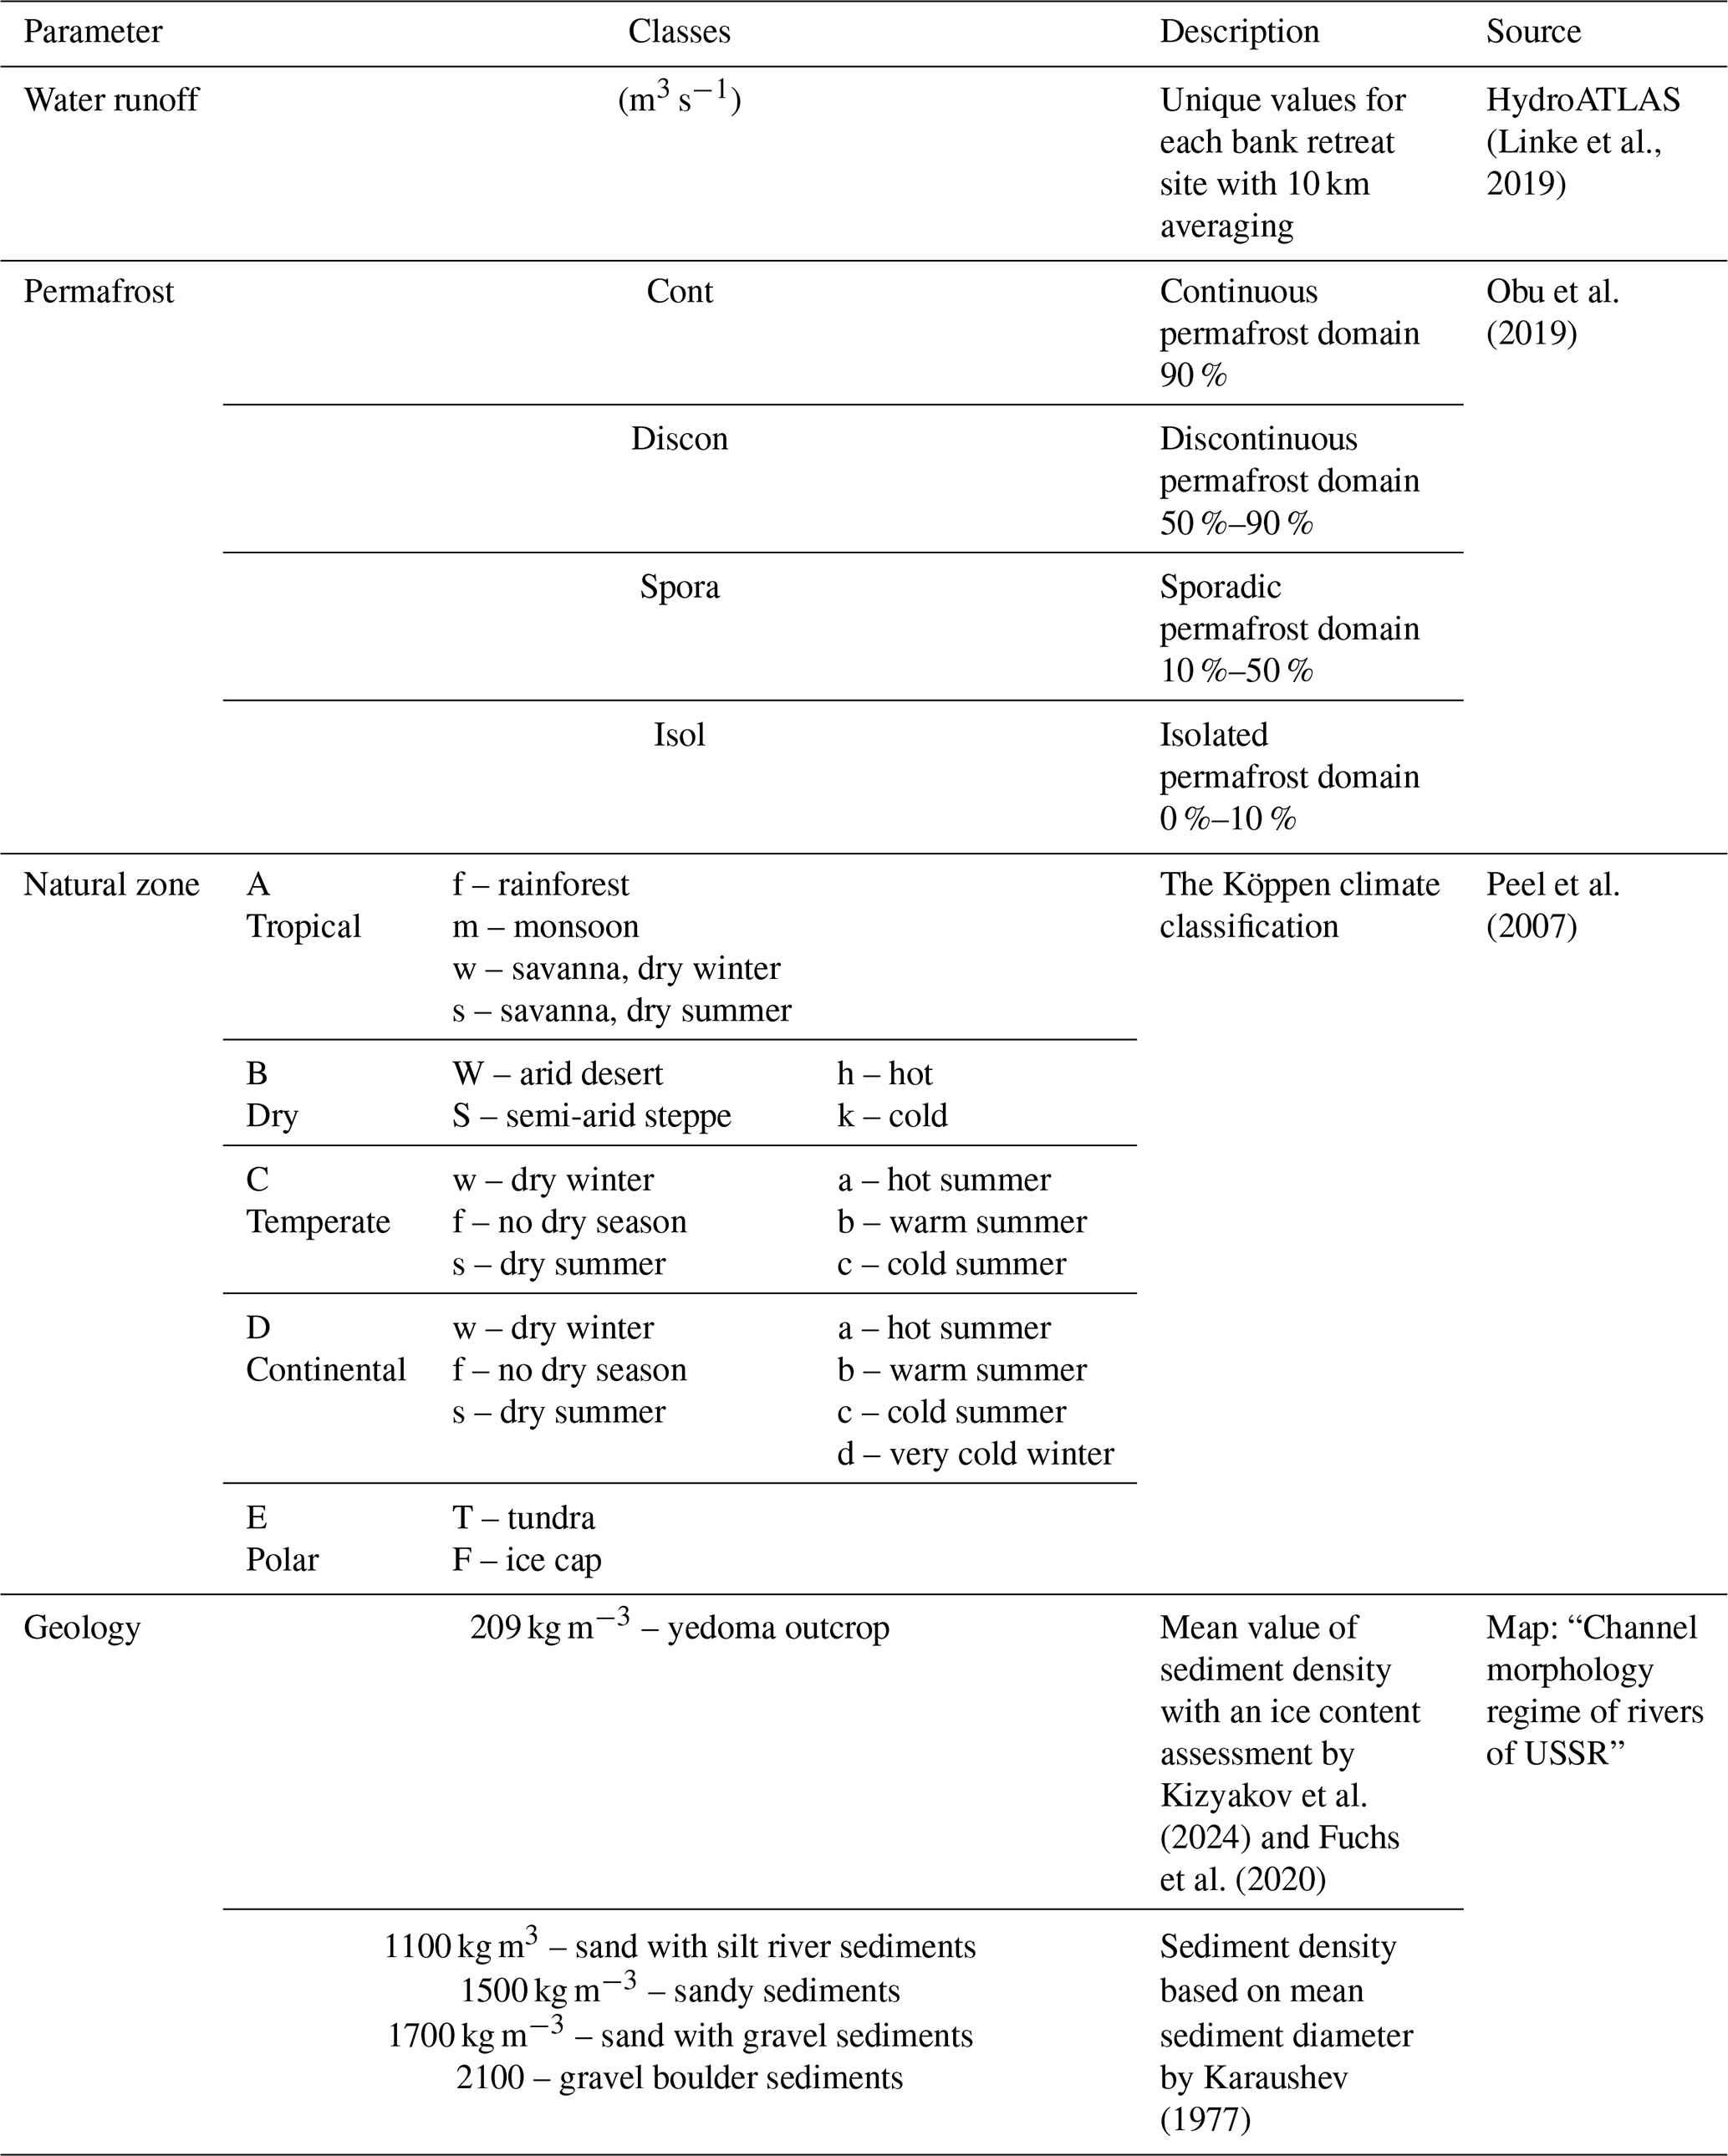
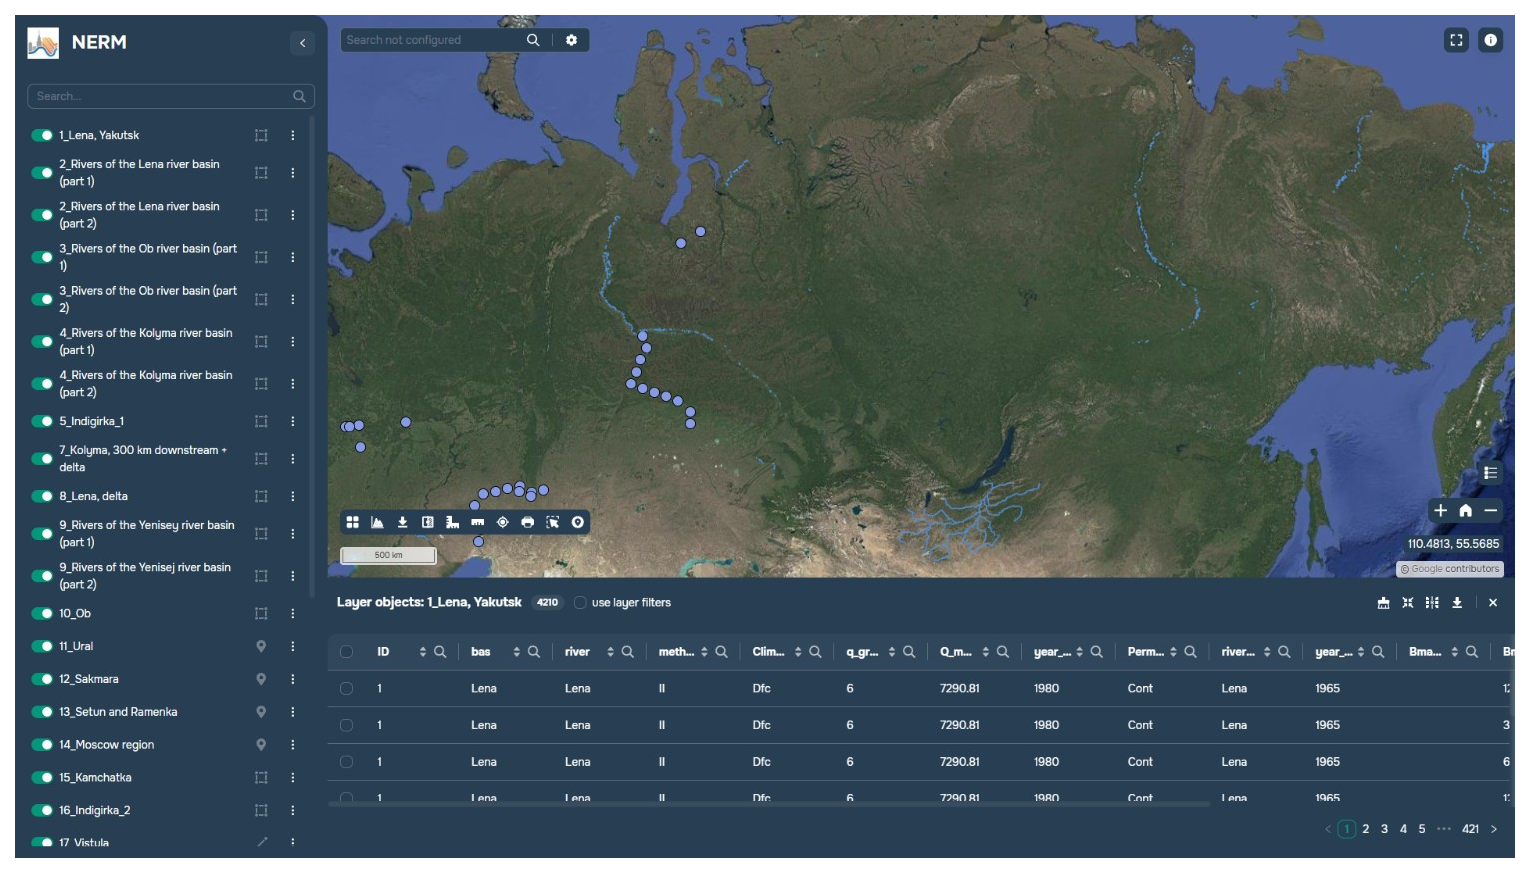
Figure 8GISCARTA platform screenshot.
2.6 Online platform
The multi-tool dataset on large Northern Eurasian riverbank migration (Northern Eurasian Riverbank Migration, NERM) is realized via the platform GISCARTA, which provides online access to the dataset, the dataset's visualization, and download of data as GEOJSON and text files of attributive tables (Fig. 8). All features of the database, polygons of bank retreat, and points of maximum values of bank erosion centerlines have their attribute parameters each in a separate column. There are values of bank retreat rates in meters per year (Bmean), channel erosion area in square meters per year (Amean), mass of channel erosion in metric tons per year (Vmean), maximum values of bank retreat (Bmax), start and end years of satellite images (year_start, year_end), name of the river (river), and mean annual water discharge (m3 s−1). The platform is available via the following link: https://map.giscarta.com/viewer/93a6a4b3-179f-450f-be02-a31ca6db245b (last access: 14 October 2025). The dataset is constantly updated and includes broader results than those discussed in the paper. In addition, it is possible to get access to the data in Zenodo, where Esri shape files are stored (https://doi.org/10.5281/zenodo.15965461) (Chalov et al., 2025a). Using large datasets and considering evolutionary trends, aggregating data via boxplots provided an effective method for synthesizing results and addressing key discussion points.
In total, this dataset consists of a multi-tool dataset of channel erosion rates for 257 rivers and three deltas with annual mean water runoff data from less than 0.2 m3 s−1 in small rivers of the Moscow city region to 19 700 m3 s−1 in the Yenisey downstream region. It covers 626 772 sites with defined bank retreat rates for 20–30 years and more. The spatial resolution of the sites in the dataset is from 10 m to 2 km.
Values of mean bank erosion rates for the whole dataset range from 0.01 to 53 m yr−1 (with the exception of the Kudma catchment (#18), for which this parameter was not counted). The mean value is 1.38 m yr−1, and the median value is 0.83 m yr−1. The quartile of 75 % has a value of 1.62 m yr−1, and for the 25 % quartile this value is 0.54 m yr−1. The distribution of the observed riverbank migration rate is approximately gamma (Fig. 9).
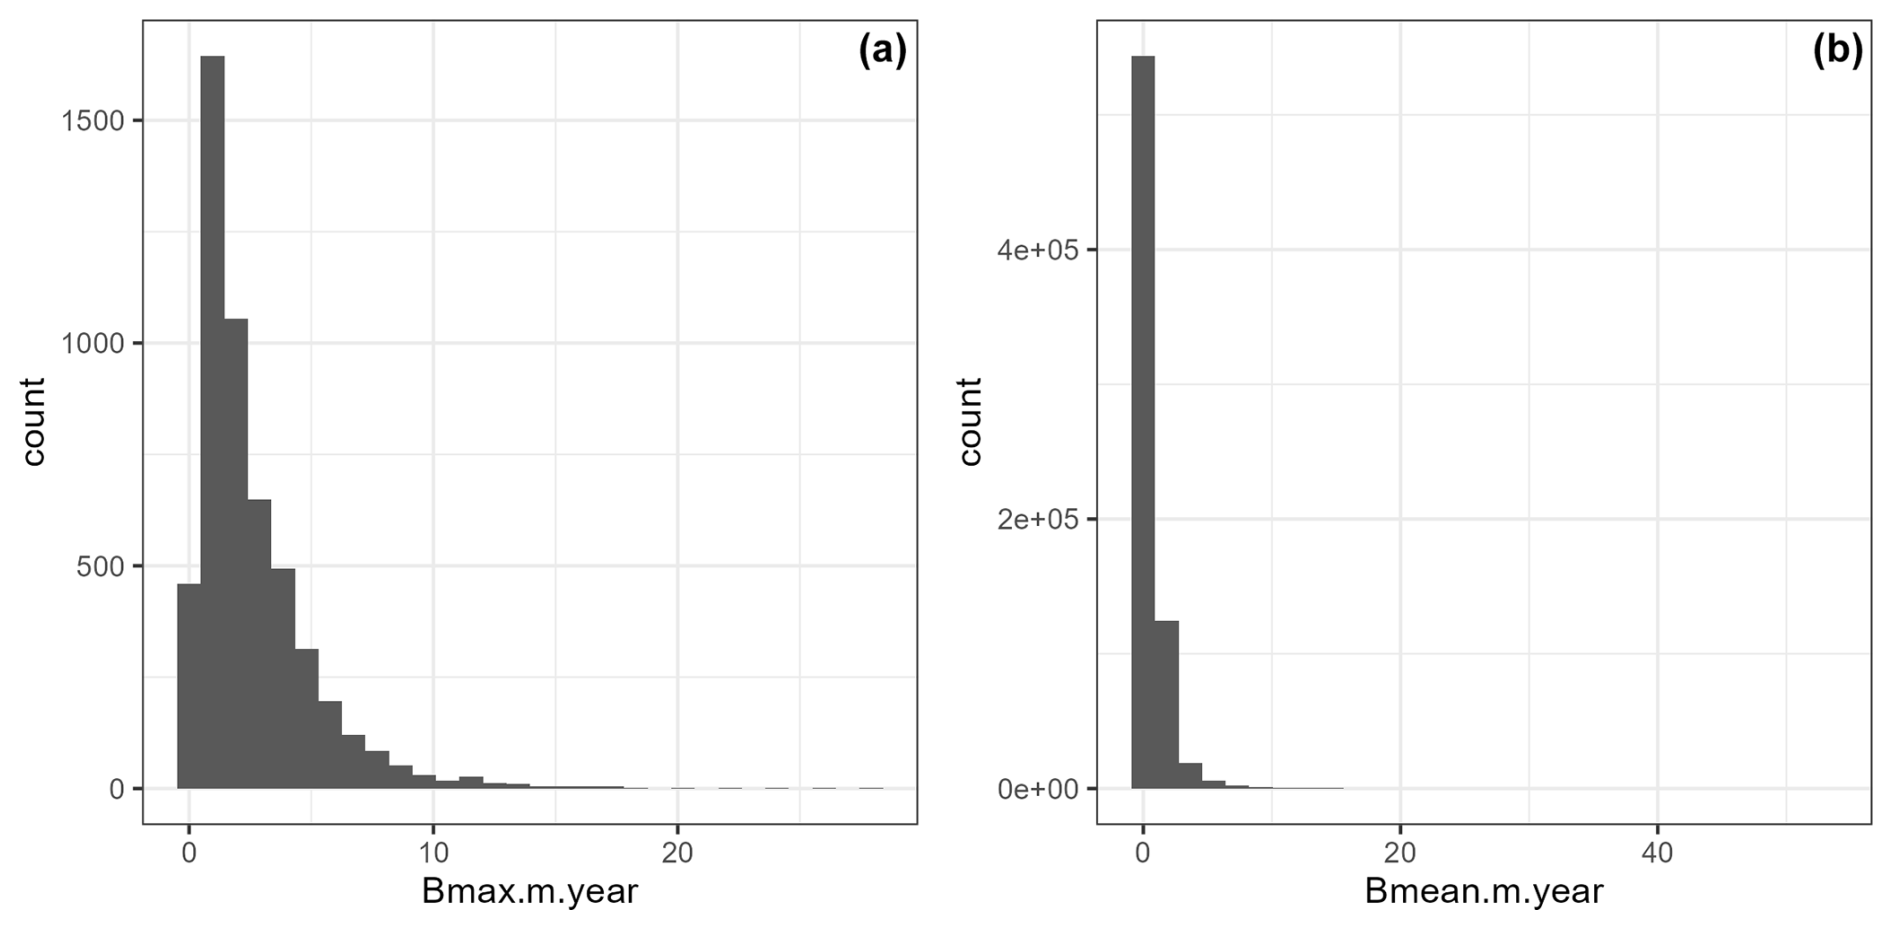
Figure 9Distribution of observed riverbank erosion rates in Northern Eurasia (a – maximal bank retreat B [m yr−1]; b – annual bank retreat B [m yr−1]).
Maximum bank retreat values (m yr−1) for the small rivers were detected through methods I and II. For 21 rivers processed by this approach (n=2859), values of maximum bank retreat for whole rivers are between 0.01 and 26.3 m yr−1, with a mean value of 2.53 m yr−1. The quartile of 75 % has a value of 3.39 m yr−1, and its 25 % value is 0.88 m yr−1. The distribution is log-normal.
To describe this dataset, the boxplot method was used to describe Bmean, Bmax, and Amean (Figs. 10, 12, and 15). The boxplot content here comprises the “minimum” value (Q1 − IQR), first quartile (Q1), median (line), mean (cross), third quartile (Q3), “maximum” value (Q1 + IQR), and outliers (point) of the sediment flux rate (Mt yr−1 km−1). IQR is the interquartile range (IQR) or the 50 % of data points lying above the first quartile and below the third quartile. The largest values of mean bank erosion are for the Vistula and Volga rivers (Fig. 10).
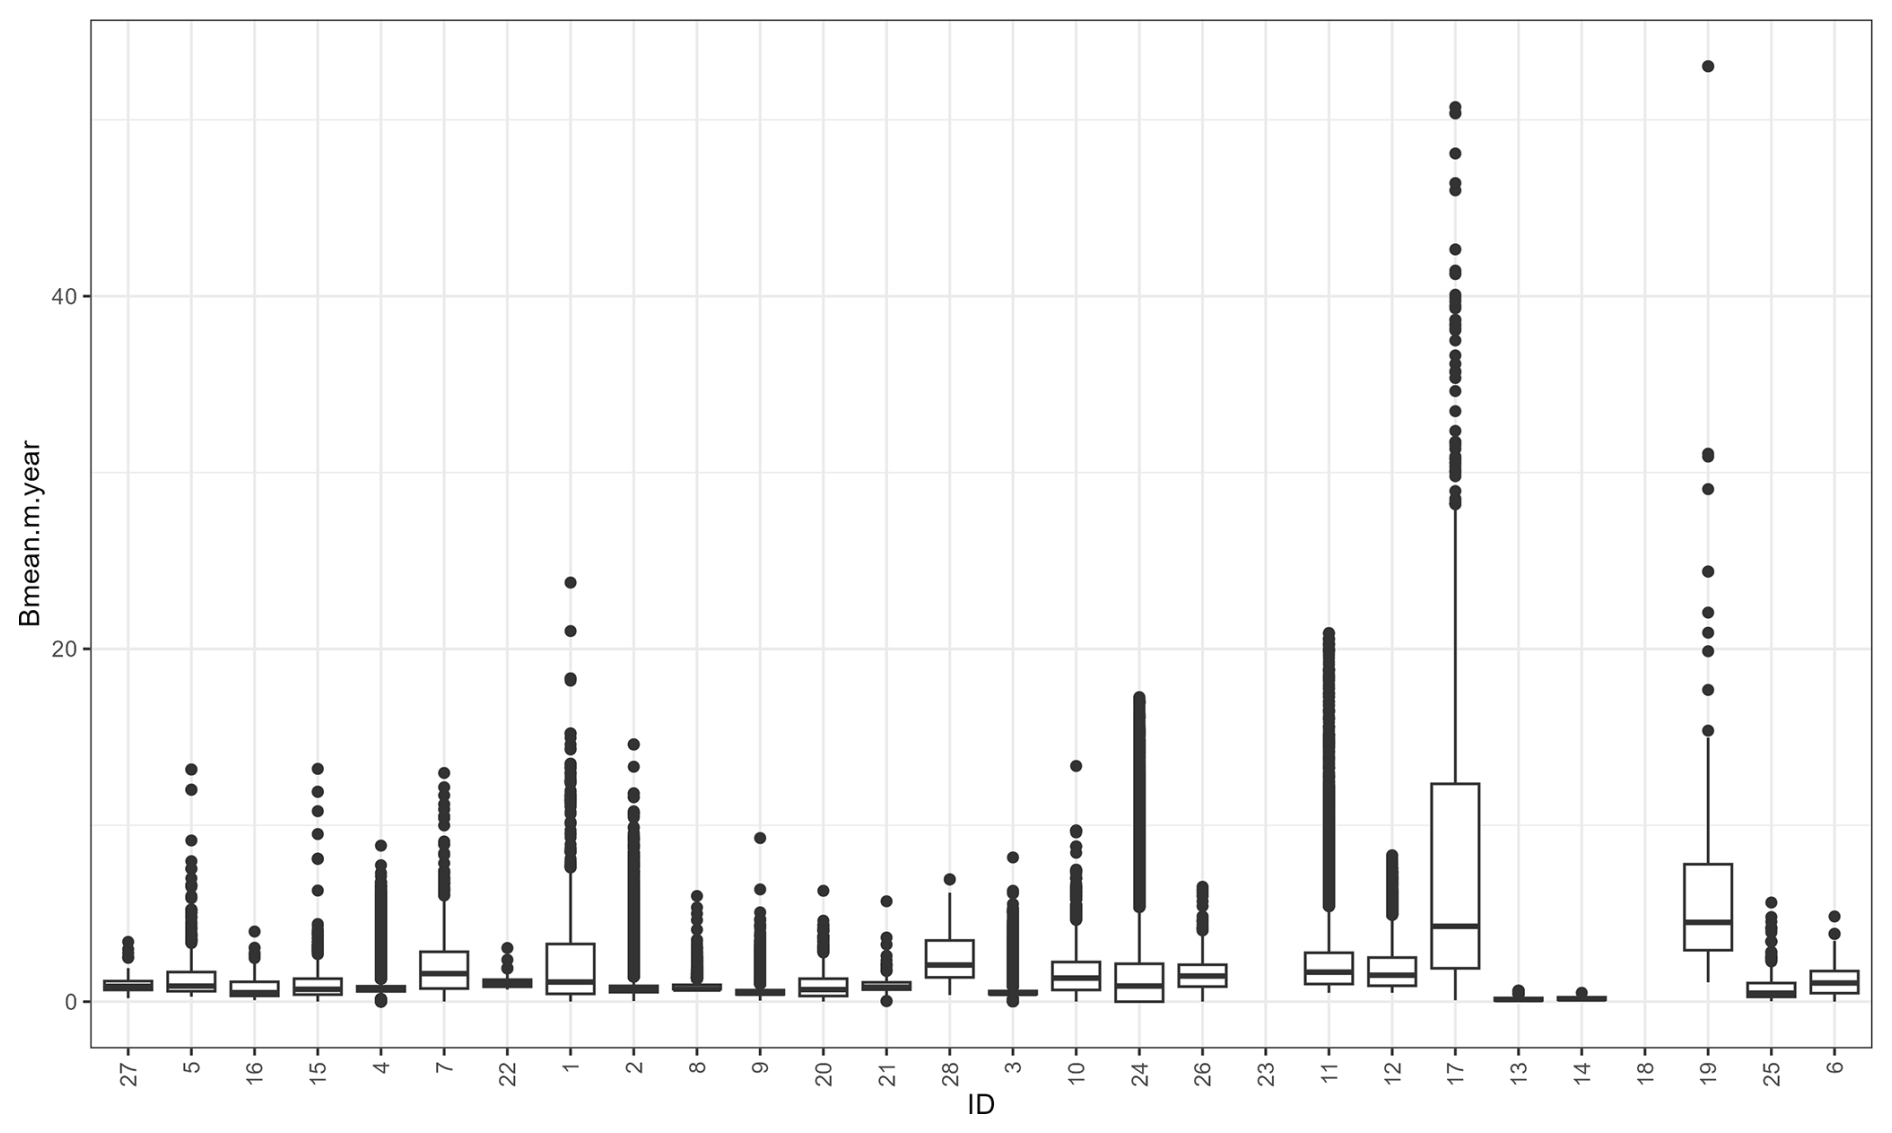
The largest values of maximum bank retreat were found at the Ob, Kamchatka, and Indigirka rivers. The area of bank retreat (Amean) for all the riverbank ranges between 0.01 and 226 000 m2 yr−1. This parameter was estimated for 15 rivers that were processed by methods II, III, and V. The mean value of this maximum bank retreat is 913 m2 yr−1; the median values is 46 m2 yr−1. The quartile of 75 % has a value of 130 m2 yr−1, and its 25 % value is 28 m2 yr−1.
Values of the mean volume of the eroded sediments (Vmean) from the riverbanks are in the range between 0.01 and 11×106 t yr−1. This parameter was estimated for eight rivers that were processed by method III. The mean value of Vmean is 17 000 t yr−1; the median value is 889 t yr−1. The quartile of 75 % has a value of 2500 t yr−1, and its 25 % value is 407 t yr−1. The largest values of maximum bank retreat are for the Lena and Kolyma rivers.
The recurrence of different bank erosion rates along the length of the eroded river sections was estimated. Their total length for the studied rivers ranges from 24 % to 49 % of the total length of the banks, reaching maximum values at sections with completely unrestricted meandering. Resulting percentile curves show the comparative rarity of extreme bank retreat rates (Chalov and Shkolnyi, 2018), which, at the same time, determine the main portion of eroded areas and sediment source in the considered rivers (Fig. 11).
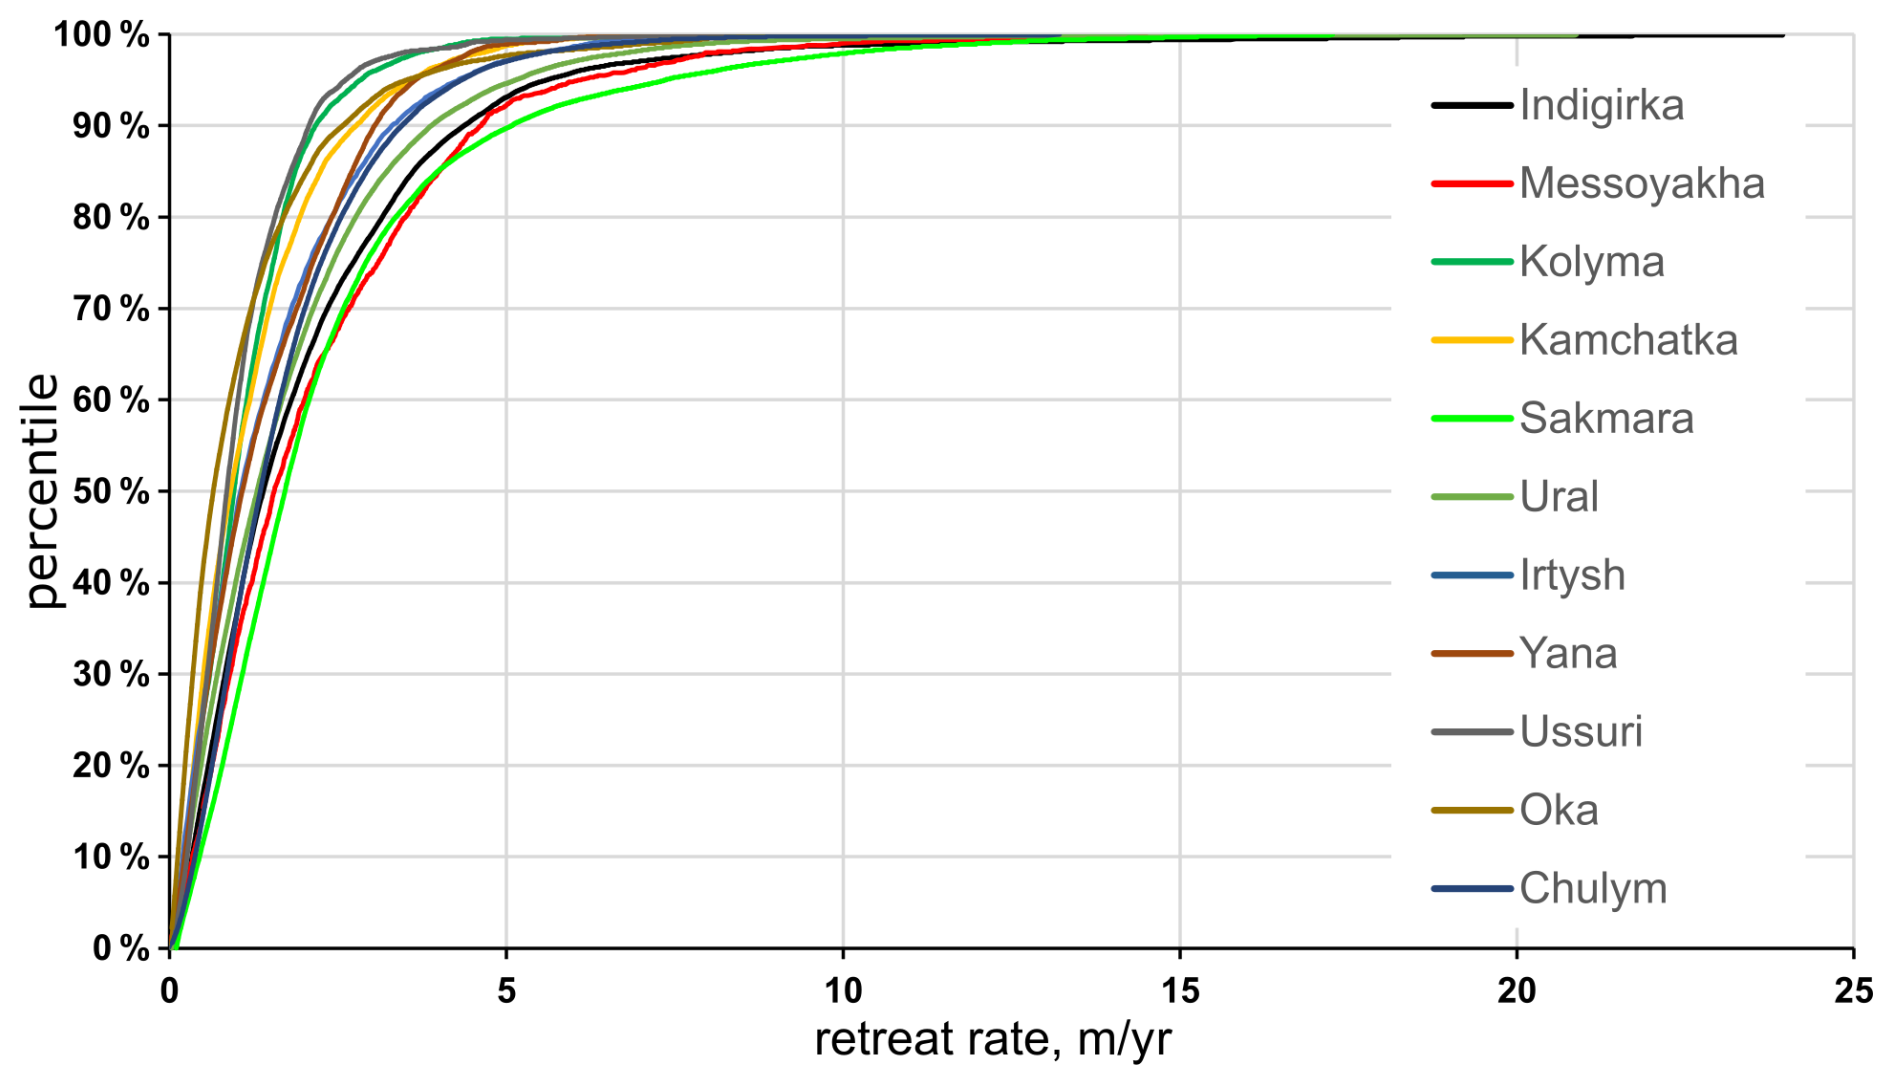
Figure 11Percentile curves of the retreat rates for the observed rivers' eroding sections.
The combined length of the studied sections allows statistical assessment of retreat rates, which entails determining the frequencies of different retreat rates along the eroded sections. Their total length for the studied rivers comprises between 24 % and 49 % of their total length along their banks, with the highest percentages being found in sections with completely unrestricted meandering. The resulting percentile curves demonstrate the comparative scarcity of extreme bank retreat rates (Chalov and Shkolnyi, 2018), which, concurrently, account for the majority of eroded areas and sediment sources in the studied rivers (Fig. 11).
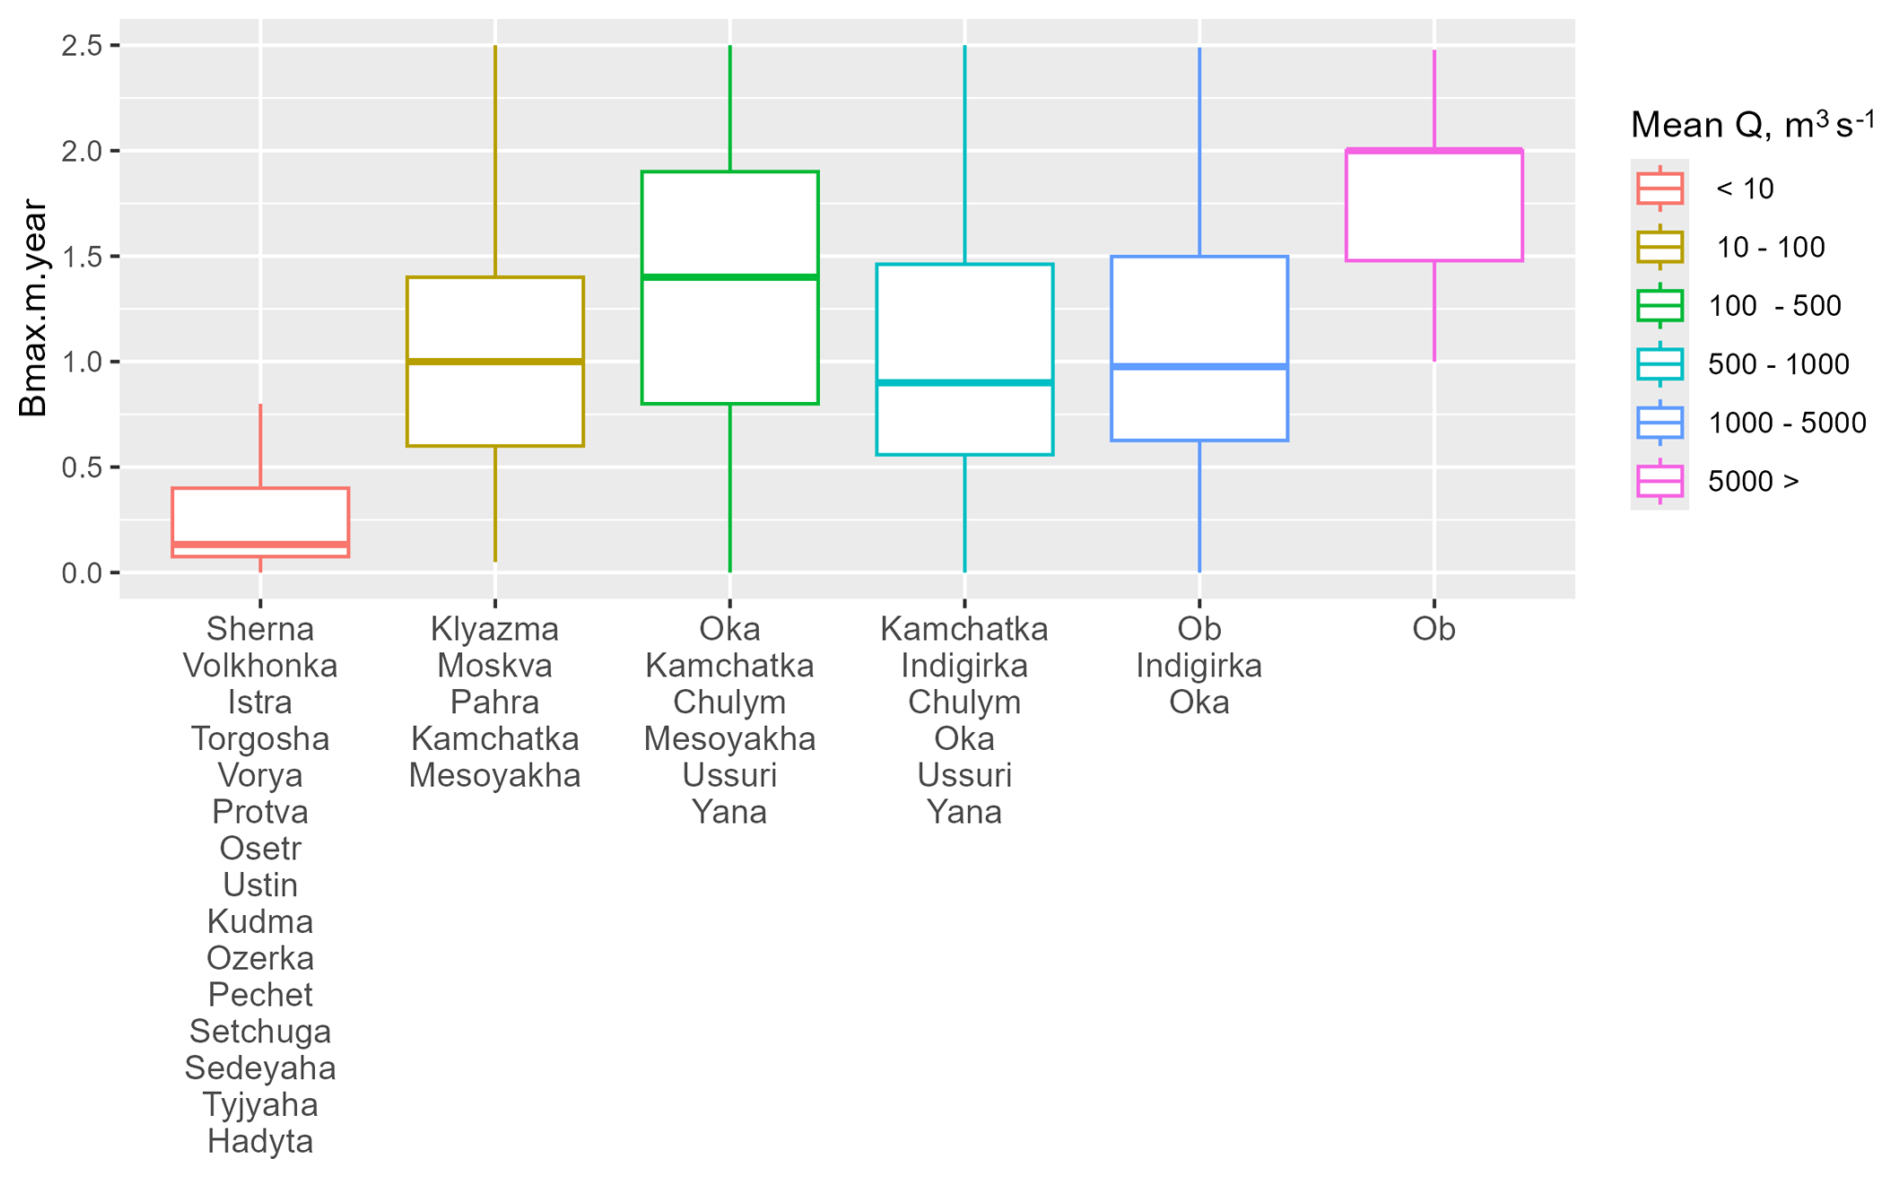
Figure 12Boxplot of site-averaged maximum bank retreat rates with respect to river size (annual discharge Q [m3 s−1]).
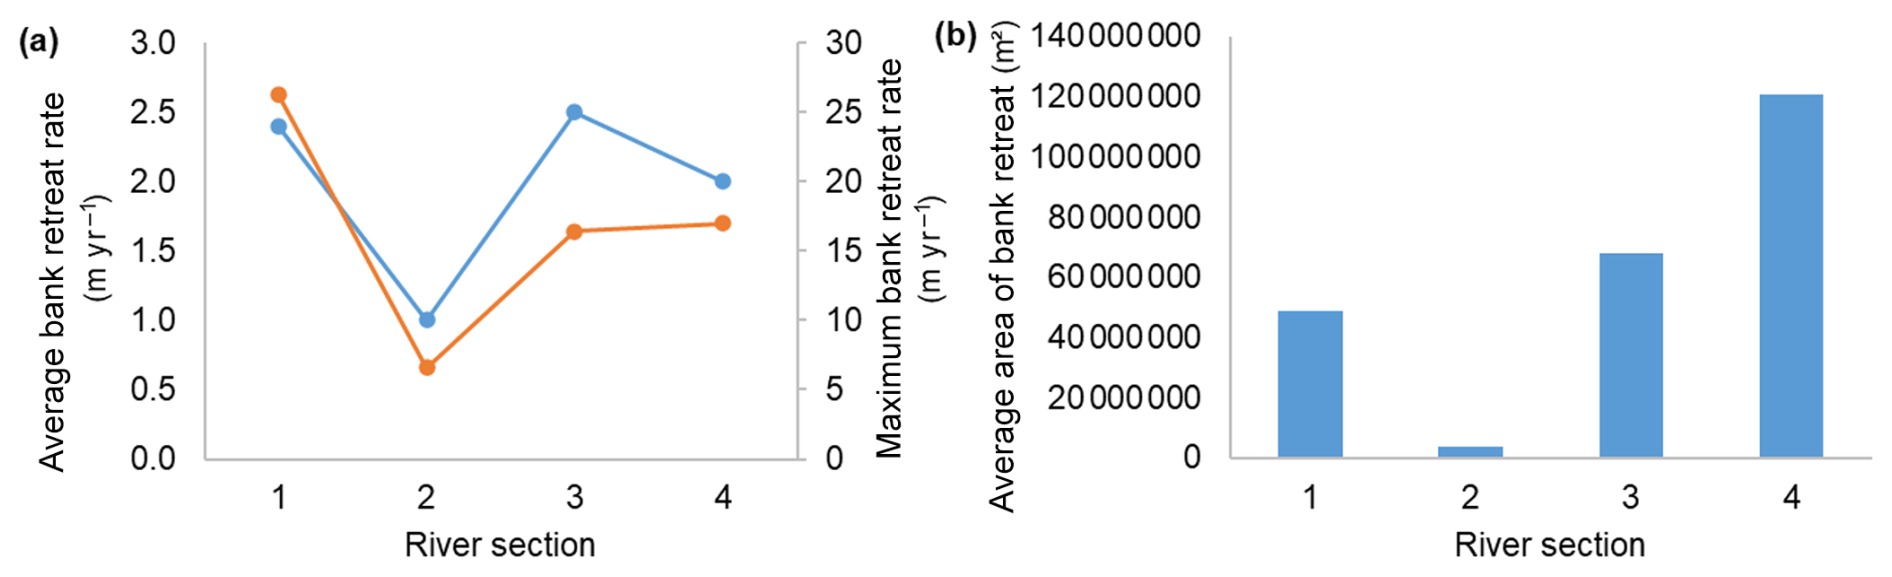
Figure 13Riverbank erosion of the Ob River: (a) average bank retreat rates and (b) average area of bank retreat. 1 – upstream Ob River; 2 – middle stream of the Ob River from the Novosibirsk reservoir to the confluence of the Ob River and the Tom River; 3 – middle stream of the Ob River from the confluence of the Ob River and the Vakh River to the confluence of the Ob River and the Irtysh River; 4 – downstream Ob River from the confluence of the Ob River and the Irtysh River to the city of Salekhard.
4.1 Drivers of riverbank migration across Northern Eurasia
The difference between the presented dataset and previous studies is that it aims to generalize bank erosion rates by processing information on small, medium, and large rivers. By attributing maximum bank retreat rates to annual discharges (Fig. 12), our results confirm that size is the first-order control on riverbank erosion at large scales following previous estimates of large rivers (Langhorst and Pavelsky, 2023). The general relationship between Bmean and annual discharge Q is explained by quadratic law: Bmean=f(Q2). The influence of river size control is rather uncertain because riverbank erosion is complex, with many different processes and mechanisms depending on multiple forcing parameters working in tandem and varying both spatially and temporally. Such aspects include channel patterns and stream geometry, bank composition, water temperature, and soil moisture, which all impact, both separately and jointly, bank erosion rates, and are also related to climatic, geological, and other drivers.
The NERM dataset provides sufficient information to assess the in-catchment impacts on bank erosion mechanisms. For example, the bank migration of the Ob River, which is the longest river in Northern Eurasia, with an average Bmean of 2 m yr−1 (Fig. 13a), illustrates regional variability in the planform changes. The mean annual erosion rate of banks in the upstream Ob is 2.4 m yr−1, while the maximum annual erosion rate is 26.3 m yr−1. In the sections of the Ob River located downstream of the Novosibirsk reservoir, erosion rates decrease (mean annual erosion rate is 1 m yr−1, maximum annual erosion rate is 6.6 m yr−1). The latitudinal section of the Ob River (from the confluence of the Ob River and the Vakh River to the confluence of the Ob River and the Irtysh River) shows an increase in average rates of bank migration to 2.5 m yr−1 and a maximum rate of erosion of 16.4 m yr−1. The downstream Ob shows similar riverbank migration rates to the latitudinal section of the Ob River (mean annual erosion rate is 2 m yr−1; maximum annual erosion rate is 17 m yr−1). The area of erosion on the Ob River has increased from almost 4×10⁶ m2 in the sections located downstream of the Novosibirsk reservoir to over 120×106 m2 on the downstream Ob (Fig. 13b).
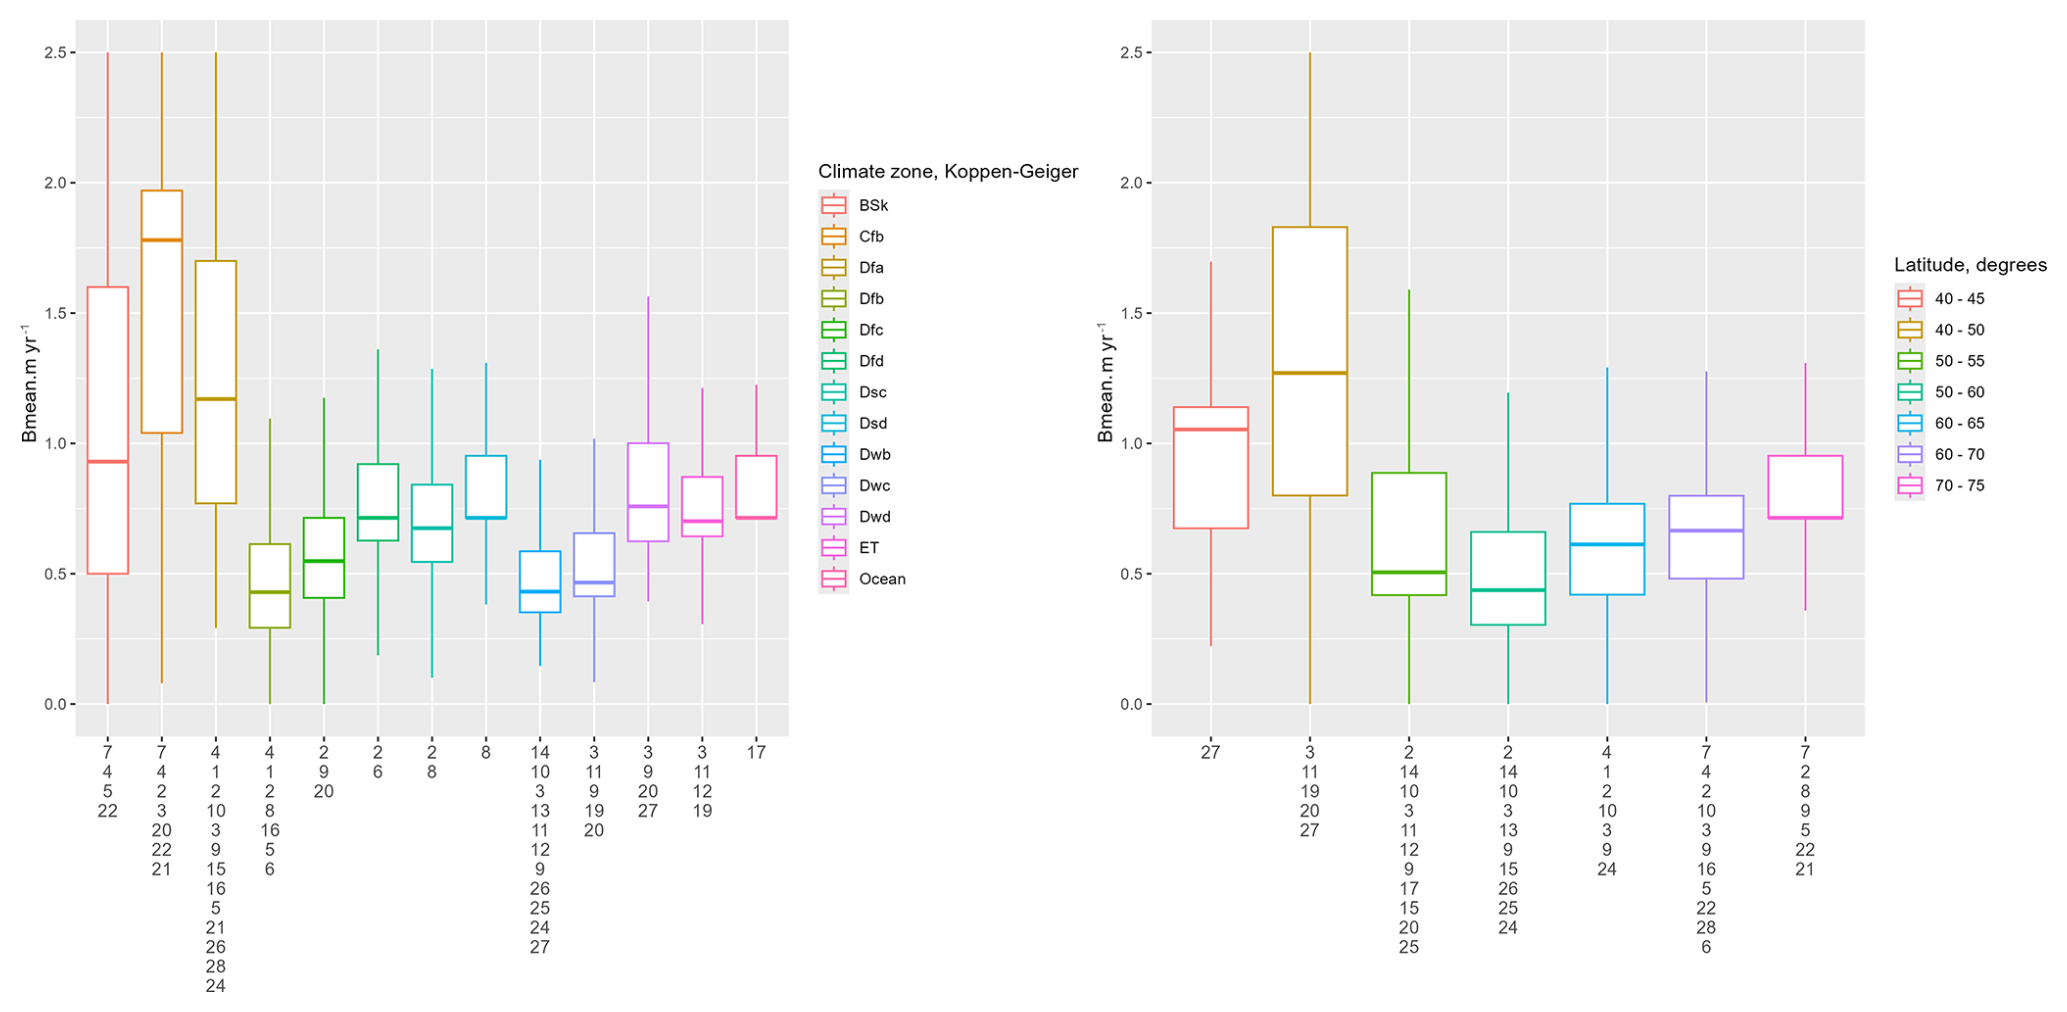
Figure 14Boxplot of site-averaged bank retreat rates with respect to climate zones by Köppen classification (see explanations in the text) and latitude.
The mean rates of bank retreat are predicted by a gamma distribution due to the presence of extreme rates of riverbank migration. Extreme bank erosion on large Northern Eurasia rivers is observed rather more frequently than average due to certain factors, such as low-density material like pyroclastic sand found on the Kamchatka River (Chalov et al., 2021) or permafrost impacts (Gautier et al., 2021). The greatest rates of platform change are typically found on large rivers featuring complex anabranching channels, which emphasizes the importance of further categorizing rivers by channel patterns. The spatial analysis of erosion rates along rivers reveals extreme bank retreat rates that significantly exceed the 95th percentile. On average, the river's retreat is typically around 2 % of its width annually, with a yearly rate of between 2 and 15 m for the larger rivers in the study. In the area surrounding the Partizan settlement, near the Lena River, extreme values of long-term measurements reach 35 m yr−1. This is particularly evident where discharge from various branches converges into a single channel, causing a significant bend evolution with a curvature ratio of approximately 2. The Indigirka River at Sypnoy Yar exhibits annual retreat rates of up to 24 m; in this location, the receding right bank of the river is a 30 m high plateau ledge formed from frozen sands. In the two described regions, erosion results in the delivery of 106 t of sediment annually, which in turn leads to the formation of riffles downstream. Bank erosion rates of the Kamchatka River are characterized by a maximum annual retreat of up to 7 m, but it can still cause the river width to decrease by 10 % or more each year, resulting in quick movement and cyclical meander cutoff (Chalov et al., 2021).
The NERM dataset provides information on other drivers at the scale of Northern Eurasia – e.g., it also shows the importance of climatic impacts which can be seen on graphs dividing retreat rates into climate zones by Köppen classification and latitudes (Fig. 14). Mean annual bank retreat rates are decreasing from south to north (from 1.9±0.8 m yr−1 within the 40–50° zone to 0.5±0.2 m yr−1 within the 70–75° zone).
Another natural driver that plays an important role in the channel evolution of Northern Eurasia rivers is permafrost (Rowland et al., 2010). The distribution of bank erosion rates in different permafrost zones reflects contrasting impacts of permafrost on riverbank migration. The average rate of bank retreat (Bmean [m yr−1]) varies in NERM from 1.3±0.8 m yr−1 in the permafrost-free zone to nearly 1 m yr−1 where permafrost exists. By contrast, the areas of riverbank retreat (A [m2 yr−1]) increase with the increase in permafrost distribution (Fig. 15). This enables us to conclude that thermal erosion in combination with mechanical erosion determines the greater susceptibility of riverbanks to destruction in the permafrost distribution zone, but the erosion rates of banks composed of permafrost soils are lower due to the soil adhesion mechanism. This thesis is generally in line with Rowland et al. (2023), who not only found for the past that erosion rates in permafrost-affected rivers were on average 9 times lower than in non-permafrost-affected systems, but also argue that, with local observations, permafrost primarily acts to slow (Geyman et al., 2024) river migration. We suggest that categorizing rivers by permafrost extent over a global scale as in this study provides a general view of permafrost effects that can be contrasting at certain rivers and lead to conflicting observations.
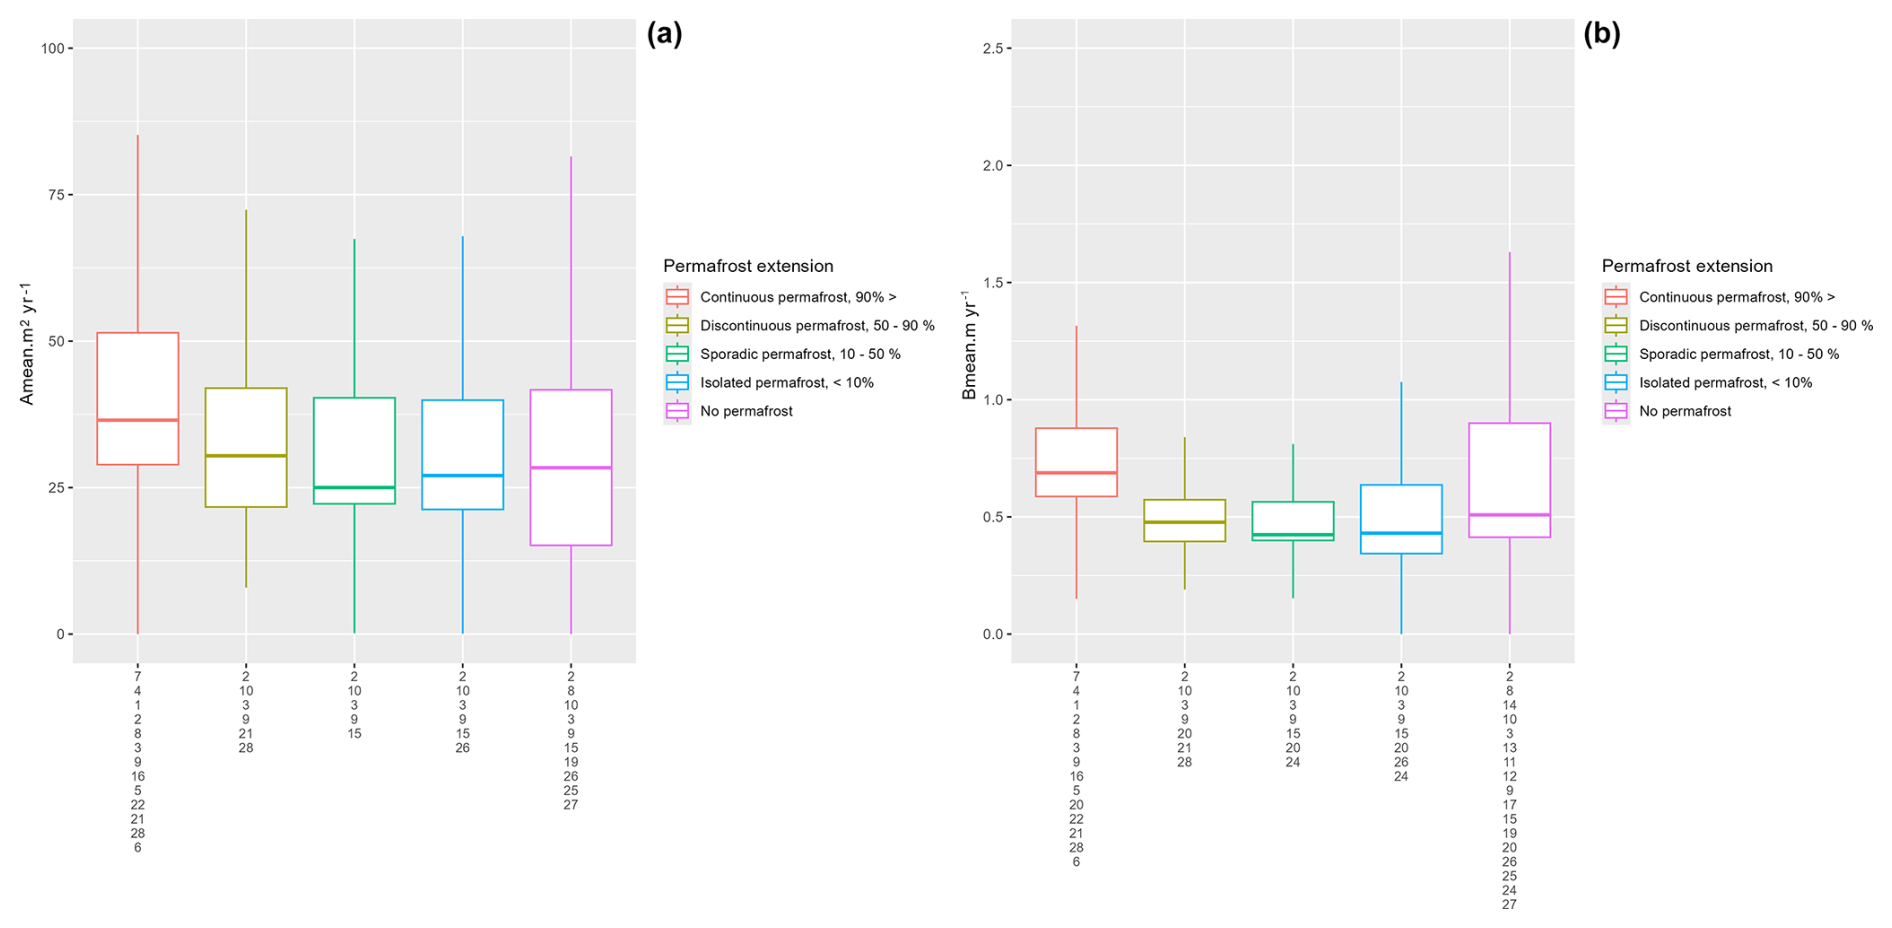
Figure 15Boxplot of site-averaged bank retreat rates with respect to permafrost (a – bank areas destroyed by bank erosion; b – average rates of bank erosion).
These findings related to permafrost impact are confirmed for permafrost-affected rivers where data of channel changes were extended from 1950 to 1970 with the use of manual digitizing by Keyhole images. In the Lena River delta (#8), the highest bank migration rates are related to the ice complex (or yedoma) areas. Specifically, up to 15 % of the bankline may be eroded in the downstream parts of the Trofimovskaya and Olenekskaya branches (Fig. 16). The highest mean annual erosion rates occurred in yedoma on Sobo-Sise Island, with erosion area amounting to 0.58 km2 over 21 years. The mean annual erosion rate is 4.74 m yr−1, and the maximum rate increases to 15 m yr−1. Due to a rise in air temperature from 0.86 °C per decade from 1979 to 2021 to 1.61 °C per decade during 2000–2021 (Chalov et al., 2023a; Gelfan et al., 2017) and probably heat flux (Vasilenko et al., 2022), there was an increase of 1.95 m yr−1 (or 95 %) in 2000–2021 compared to 1964–2000 (Fig. 16). The most significant increase in erosion rates (3 times between periods) is observed in the Olenekskaya branch and is also related to the ice complex on Kurungnakh Island. It is important to note that along ice-wedge complexes, the high rates of bank retreat remain stable (Sobo-Sise Island). Previous studies on channel migration for the Lena River delta have concentrated on the yedoma permafrost cliff on Sobo-Sise Island in the Sardakhskaya branch (Fuchs et al., 2020). The cliff length is 1660 m, and the vertical heights are up to 30 m above the mean river water level. The authors manually digitized the upper cliff line in the images from 1965 to 2018. Erosion rates vary from 4.8 to 15.7 m yr−1 at different parts of the cliff, and the mean annual erosion rate is 6.1 m yr−1.
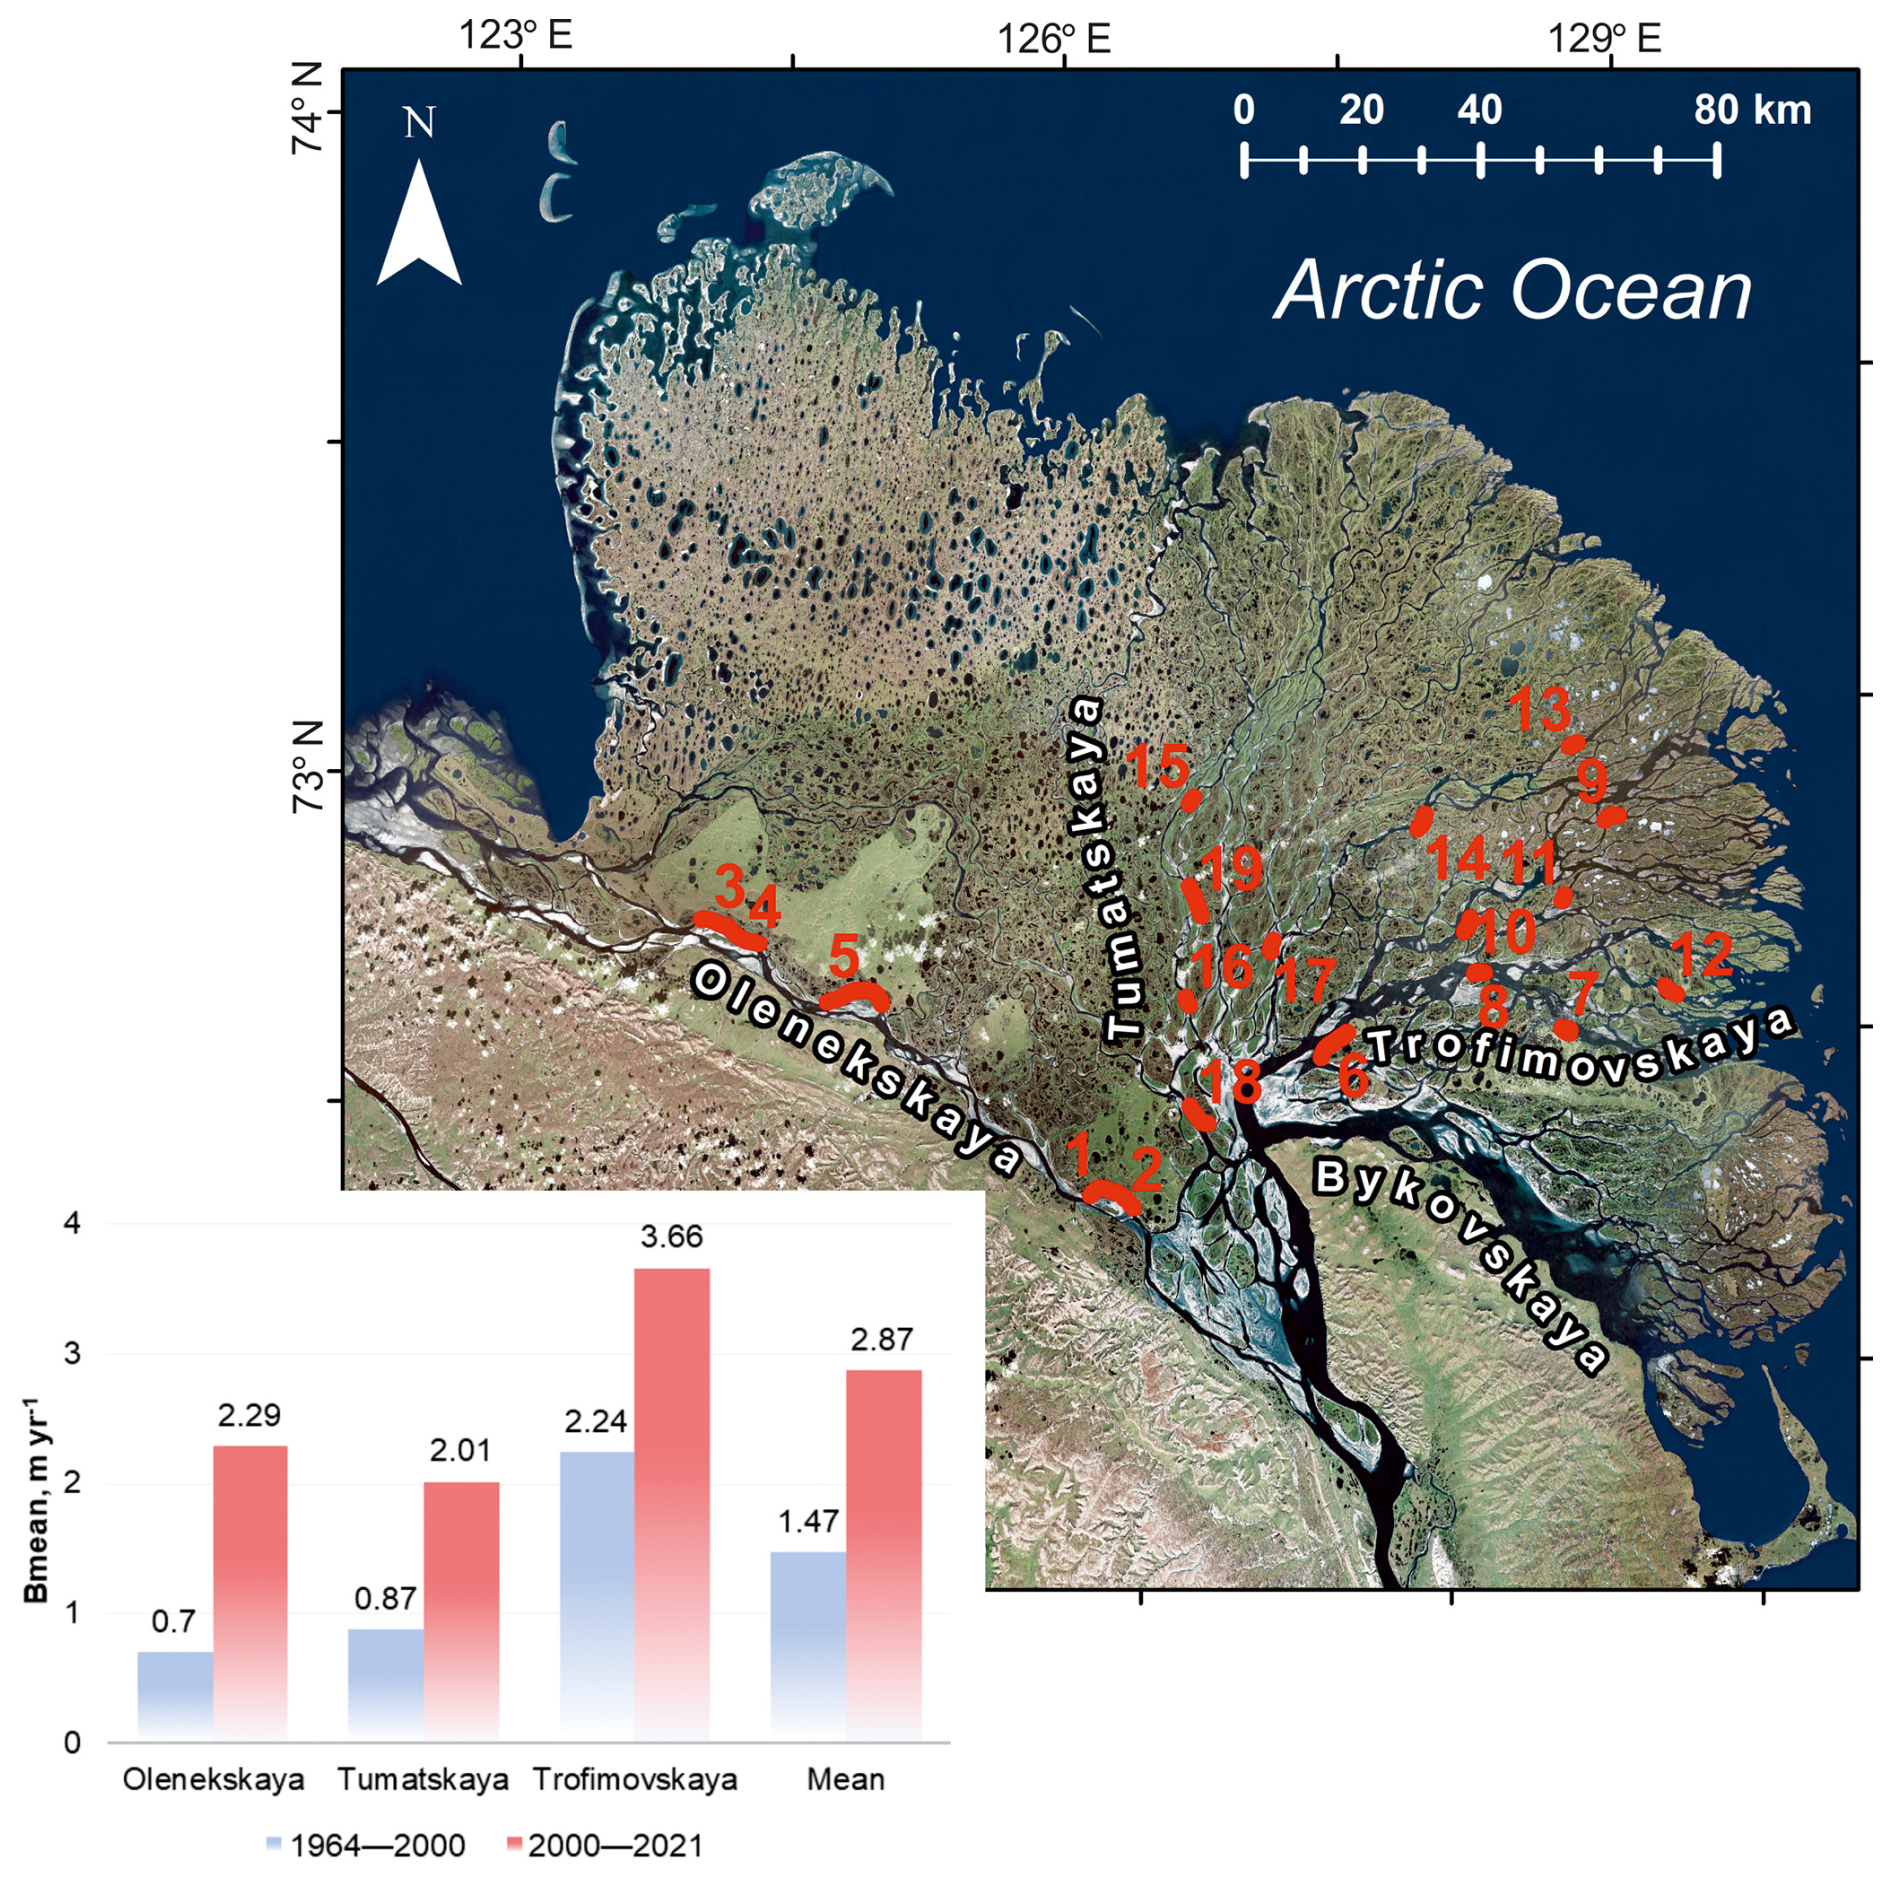
Figure 16Bank migration rates over the Lena River delta: location of sites with estimates (map; sites are indicated by numbers) and values for different time spans (bottom left) (© Esri Imagery).
Similar patterns are observed at the part of the Kolyma River studied, where a significant increase in riverbank migration rates upstream of the delta and within the delta was detected (Chalov et al., 2025b). Similar climatic drivers here both influence the stability of ice-wedge complexes widely distributed along channel banks (Murton et al., 2015; Szumińska et al., 2023) and explain the increase in riverbank migration rates. It is interesting to note that the rates of channel migration were significantly higher within the delta during all considered periods (Fig. 17).
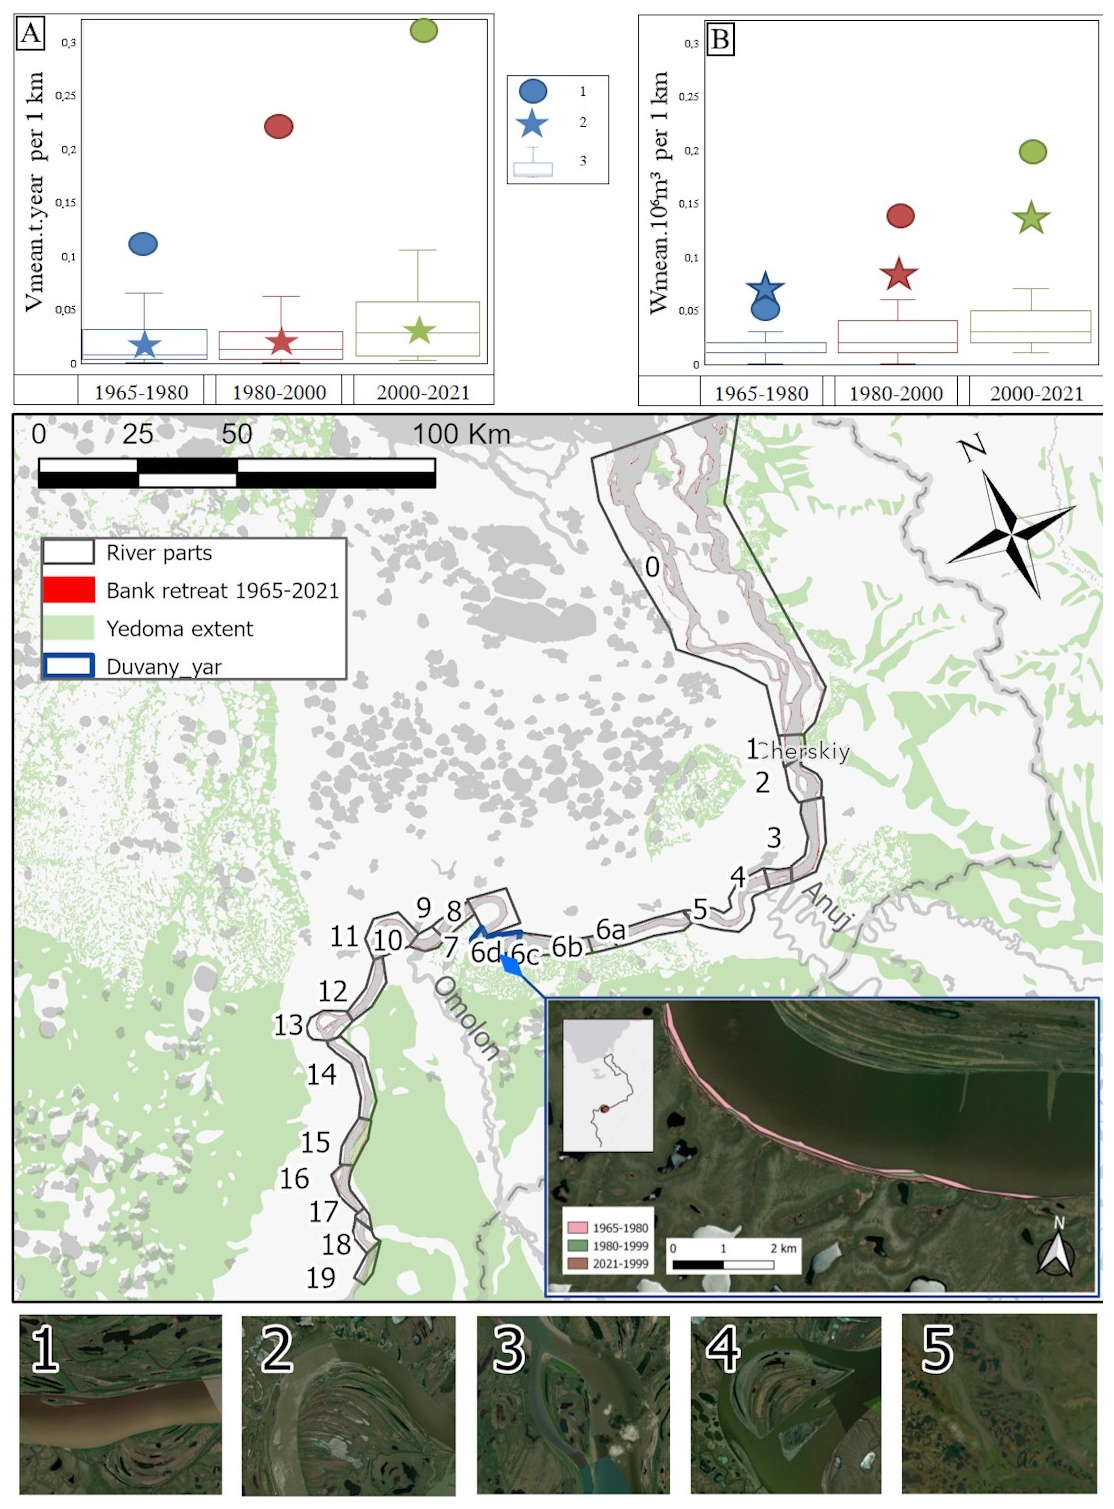
Figure 17Boxplot comparing the distribution of volume of bank retreat (a) and gross bank-erosion sediment yield (t yr−1) (b) in 1965–1980, 1981–2000, and 2000–2021 in the Kolyma upstream of the delta (boxplots) and within the delta (dots, site 0 on the map). Stars indicate site 6 on the map (Duvanny Yar yedoma complex) (© Esri Imagery).
4.2 Gross bank-erosion sediment yield
The gross bank-erosion sediment yield is estimated at 151×106 t yr−1 in the 1680 km section of the lower Ob, 15.9×10⁶ t yr−1 in the 1500 km section of the Yenisei, and 338×106 t yr−1 in the 1800 km section of the Lena. In the Selenga and the Kamchatka, the gross bank-erosion sediment yield is comparable to the values typical of the lower course of the Yenisey River. On the Kamchatka River, the total eroded area during the comparison period (from 23 to 50 years, depending on the availability of satellite images for river sections) was 23.5 km2, which corresponds to an annual 670 000 m2 yr−1 of bank degradation. Thus for the Kamchatka, t of sediments per year enters the channel due to bank erosion. In some years, this value may increase because of the bend cutoff.
Sections of a braided channel exert the greatest influence on gross bank-erosion sediment yield. In the Selenga River basin, the maximum values of bank retreat (on average at the tops of bends from 9 to 16 m yr−1) are mainly situated in the section of the braided channel. At the same time, along anabranching channels more than half of all the eroded banks are related to river island degradation. On the Lena River section from the city of Pokrovsk to the city of Zhigansk, 60 % of the gross bank-erosion sediment yield is caused by island degradation (11 000 m2 yr−1 km−1), and 40 % is due to erosion of the bedrock. The left and right banks have equal ratios of 20 % (3700 m2 yr−1 km−1). On all rivers, the ratio of the intensity of bank erosion of the right and left banks is approximately the same. For the left bank of the Kamchatka River, the distributions of the eroded floodplain between the left and right banks are 37 % to 44 %, respectively.
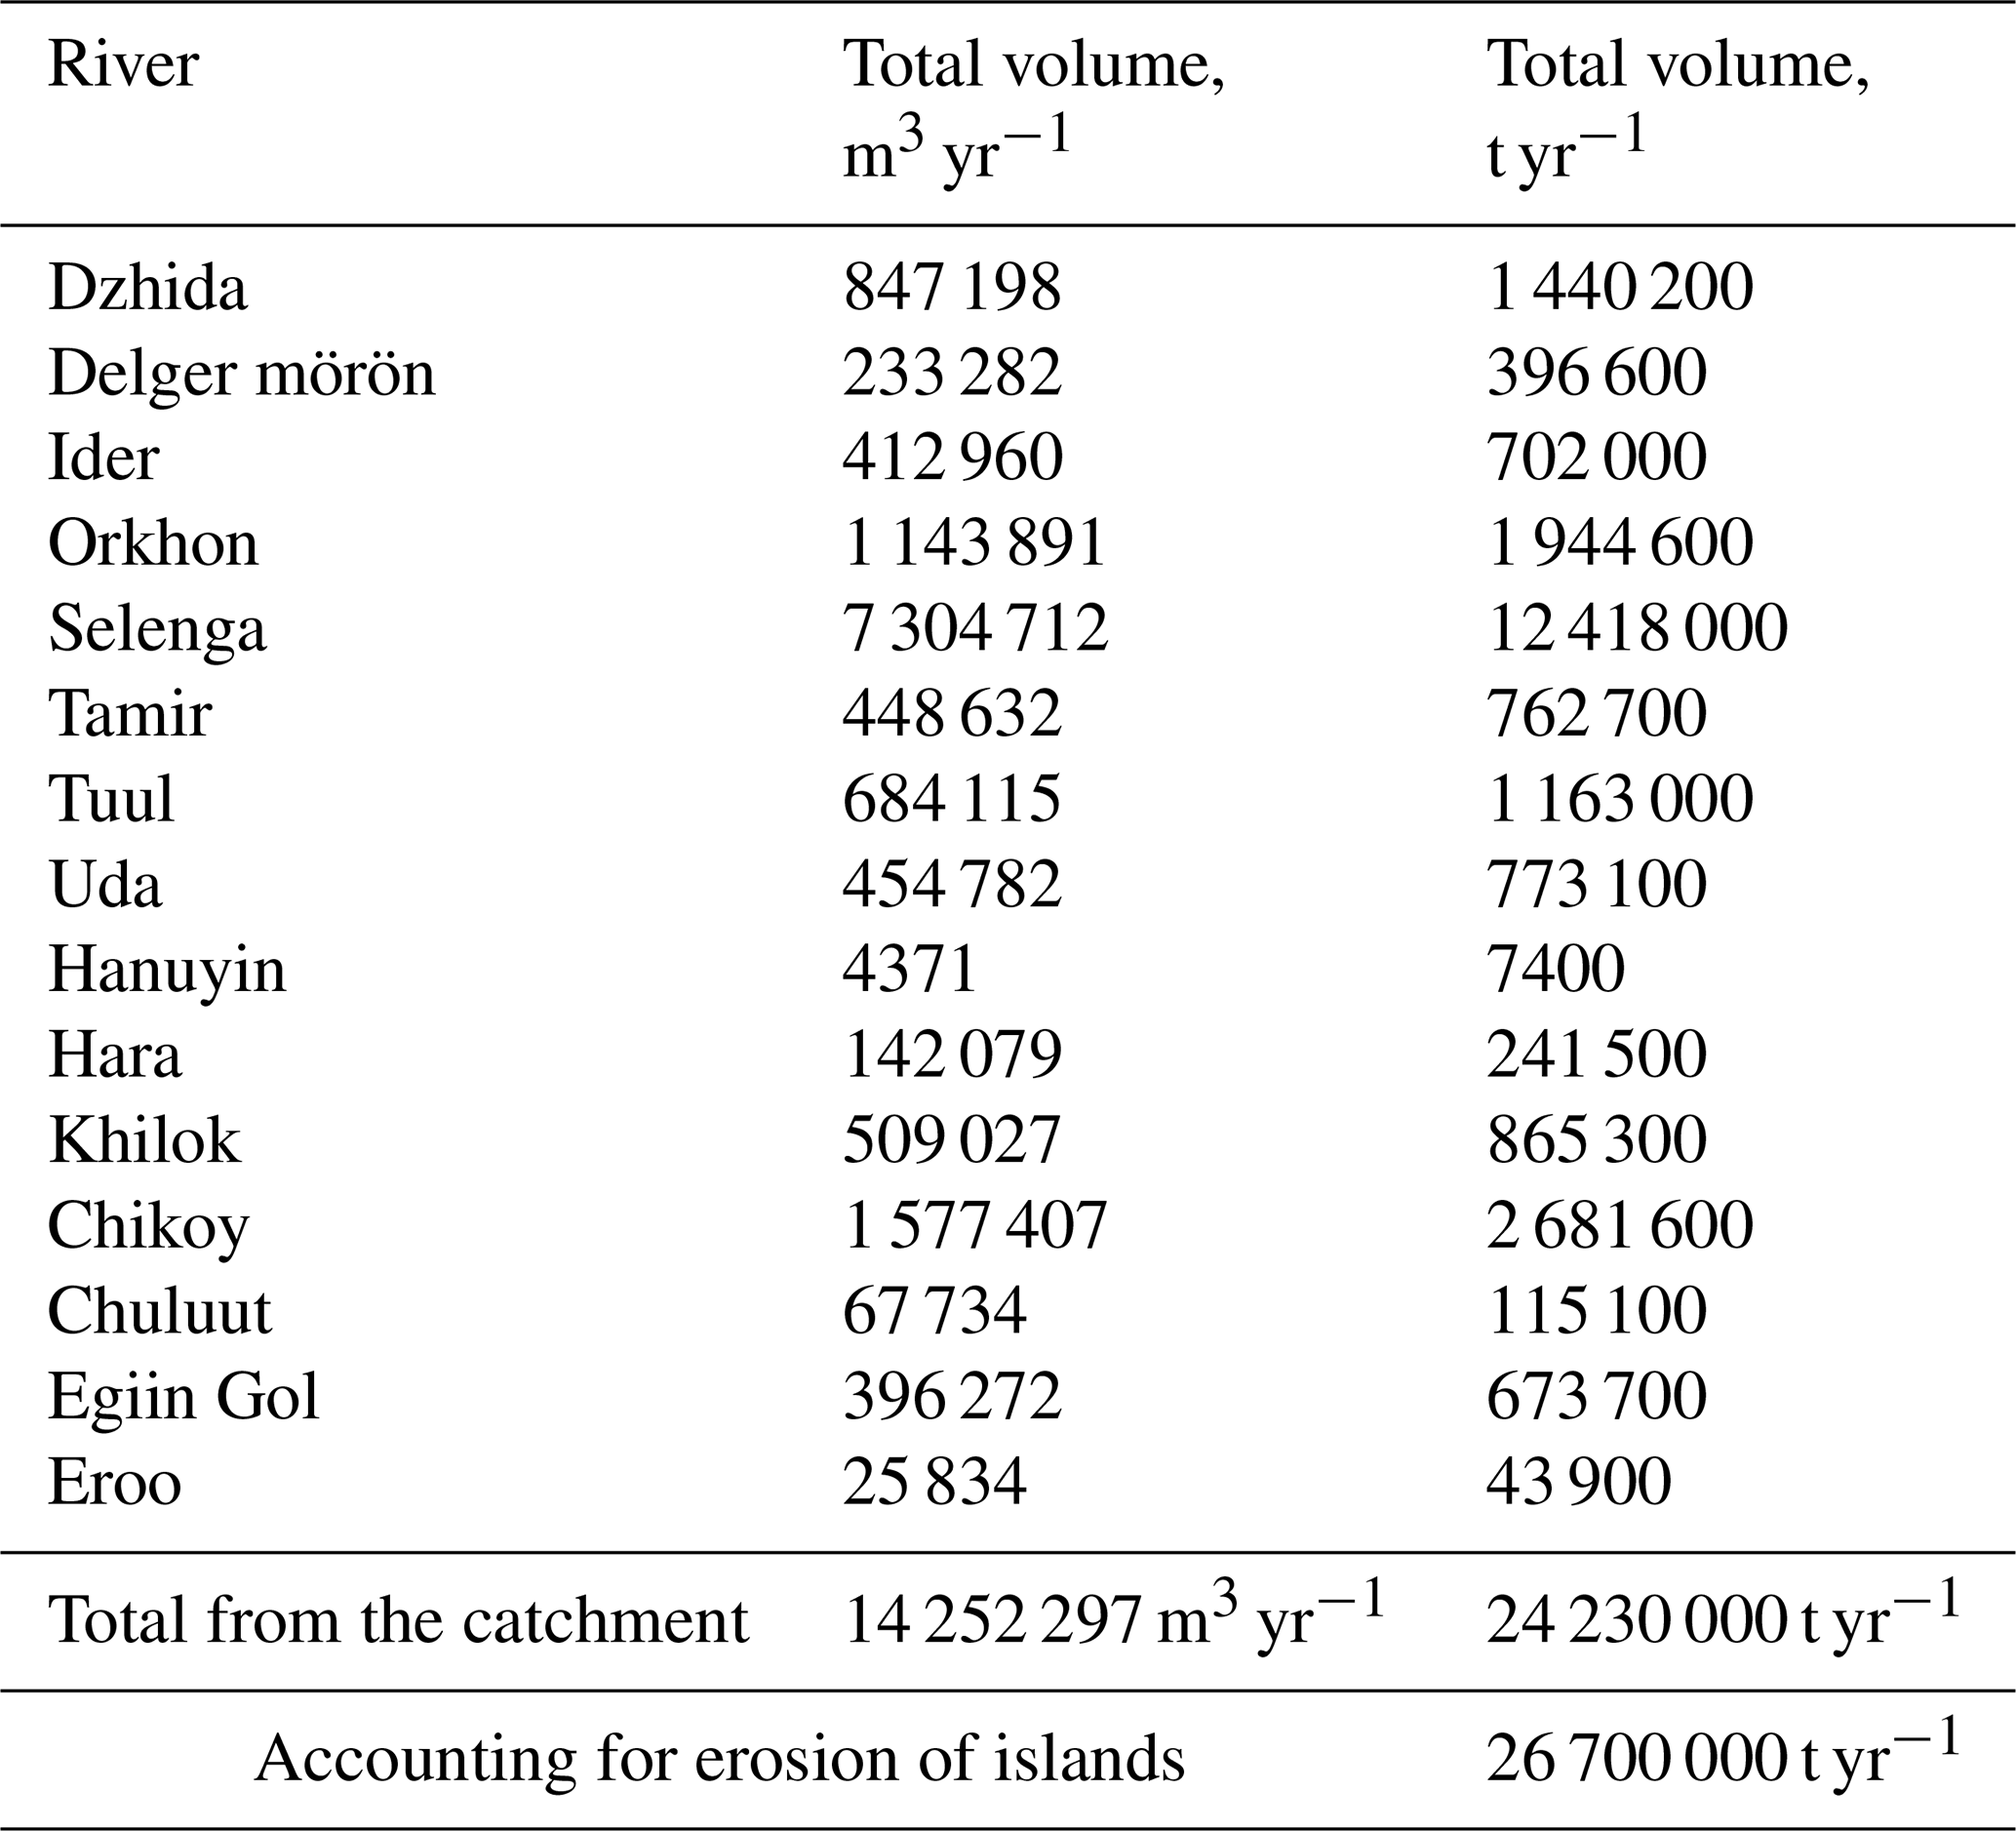
These combined results offer significant insights into the sediment budget of large river basins. In the lower reaches of the world's biggest rivers, the gross bank-erosion sediment yield is similar to the net sediment yield. The gross bank-erosion sediment yield exhibits latitudinal zonality and is influenced by large-scale factors, which in turn are affected by river size. In the Ob River's middle and downstream sections (below where it meets the Vakh River), approximately 33.5×10⁶ t yr−1 of sediment enters the channel yearly due to channel planform changes, which is lower than the sediment load at the river's mouth. The gross bank-erosion sediment yield within the river basins of southern rivers, where unstable channels are common, often far surpasses the net sediment yield, as seen in the Selenga River basin, where it is 11-fold more (Table 6). In the foothills, gross bank-erosion sediment yield is high. In the Kamchatka River basin, gross bank-erosion sediment yield is twice as high as sediment transport rates at the downstream sections of the river, with at least half of this material accumulating in the riverbeds.
Table 6Gross bank-erosion sediment yield of the Selenga River and its tributaries.
The presented datasets are available open access via the Zenodo repository (https://doi.org/10.5281/zenodo.15965461) (Chalov et al., 2025a).
The NERM dataset offers comprehensive riverbank migration assessment for particular areas. We utilized a unified dataset to examine statistical data on bank erosion, river discharge, and catchment factors, including permafrost extent and natural zones, using multiple analytical tools. River size was discovered to be a key factor in riverbank erosion. Confirmation of the role of secondary controls in Northern Eurasia has been established, encompassing permafrost distribution and diverse climatic/natural zones. NERM serves as a case study to refine and verify theoretical models, offering insights into sediment origins in river systems by integrating gross bank-erosion sediment yield estimates. The comprehensive dataset presented offers potential insights that further research employing multi-statistical methods could reveal: quantitative laws governing riverbank migration at regional or catchment scales, influenced by geological, hydrological, and climatic factors. Here an important step forward could be further combination of the dataset with detailed geomorphological and channel pattern classification of the studied rivers.
SRC: conceptualization, investigation, methodology, supervision, writing – original draft preparation, writing – review & editing; VI: formal analysis, methodology, investigation, visualization, writing – original draft preparation, writing – review & editing; DS: investigation, methodology, writing – original draft preparation, writing – review & editing; EP: writing – review & editing, investigation; MH: investigation, writing – original draft preparation; AK: investigation, writing – original draft preparation; RSC, DB, AC, PG, AK, RK, UK, NM, ET, KP, AZ, RA, AV, LT, AT, and DF: investigation. All authors reviewed the manuscript.
The contact author has declared that none of the authors has any competing interests.
Publisher's note: Copernicus Publications remains neutral with regard to jurisdictional claims made in the text, published maps, institutional affiliations, or any other geographical representation in this paper. While Copernicus Publications makes every effort to include appropriate place names, the final responsibility lies with the authors. Views expressed in the text are those of the authors and do not necessarily reflect the views of the publisher.
The authors are grateful to the GISCARTA platform team for hosting the dataset and providing tools for its visualization and export in user-friendly formats. We are also grateful to Ilya Kovalev (MSU) for UAV imagery analysis of Yamal rivers.
The authors used the Paperpal AI Microsoft Word plugin and Trinka AI Writing and Grammar Checker Tool for English grammar improvement of an earlier version of this article.
This work was supported by a grant of the Government of the Russian Federation (agreement no. 075-15-2025-008 from 27 February 2025). Publisher's note: the article processing charges for this publication were not paid by a Russian or Belarusian institution.
This paper was edited by Birgit Heim and reviewed by Anirban Mukhopadhyay and Edgardo Latrubesse.
Alabyan, A. and Chalov, R.: Types of river channel patterns and their natural controls, Earth Surf. Proc=. Land,, 23, 467–474, 1998.
Albertini, C., Gioia, A., Iacobellis, V., and Manfreda, S.: Detection of Surface Water and Floods with Multispectral Satellites, Remote Sens., 14, https://doi.org/10.3390/rs14236005, 2022.
Alexeevskii, N. I., Berkovich, K. M., and Chalov, R. S.: Erosion, sediment transportation and accumulation in rivers, Int. J. Sediment Res., 23, https://doi.org/10.1016/S1001-6279(08)60009-8, 2008.
Alexeevsky, N. I., Chalov, R. S., Berkovich, K. M., and Chalov, S. R.: Channel changes in largest Russian rivers: Natural and anthropogenic effects, Int. J. River Basin Manage., 11, 175–191, https://doi.org/10.1080/15715124.2013.814660, 2013.
Allen, G. H. and Pavelsky, T.: Global extent of rivers and streams, Science, 361, 585–588, https://doi.org/10.1126/science.aat0636, 2018.
Babiński, Z., Habel, M., and Chalov, S.: Prediction of the vistula channel development between Wloclawek and Torun: Evaluation with regard to the new geological survey, Quaest. Geogr., 33, 7–15, https://doi.org/10.2478/quageo-2014-0025, 2014.
Baryshnikov, N. B.: Dynamics of channel flows and protection of natural waters, Leningrad, http://elib.rshu.ru/files_books/pdf/img-210120829.pdf (last access: 14 October 2025), 1990.
Berkovich, K. M., Zlotina, L. V. and Turykin, L. A.: In-stream Mining in Alluvial River Channels: Response, Consequences and Perspectives, Proceedings of the Russian Geographical Society, 13–20, https://doi.org/10.31857/S0869607123010032, 2023.
Bracken, L. J., Turnbull, L., Wainwright, J., and Bogaart, P.: Sediment connectivity: A framework for understanding sediment transfer at multiple scales, Earth Surf. Proc. Land., https://doi.org/10.1002/esp.3635, 2015.
Brandt, S. A.: Classification of geomorphological effects downstream of dams, Catena, 40, 375–401, https://doi.org/10.1016/S0341-8162(00)00093-X, 2000.
Bujakowski, F. and Falkowski, T.: Hydrogeological analysis supported by remote sensing methods as a tool for assessing the safety of embankments (case study from Vistula River valley, Poland), Water, 11, https://doi.org/10.3390/w11020266, 2019.
Chadwick, A. J., Greenberg, E., and Ganti, V.: Remote Sensing of Riverbank Migration Using Particle Image Velocimetry, J. Geophys. Res.-Earth, 128, https://doi.org/10.1029/2023JF007177, 2023.
Chalov, R. S. and Chalova, E. R.: Fluvial processes of Yamal and their mapping, Bull. Udmurt Univ. Ser. Biol. Earth Sci., 34, 308–314, https://doi.org/10.35634/2412-9518-2024-34-3-308-314, 2024.
Chalov, R. S. and Shkolnyi, D.: Extreme and specific manifestations of channel processes: Concepts, classifications, assessment criteria, Izv. Ross. Akad. Nauk. Seriya Geogr., 31–41, https://doi.org/10.7868/S2587556618010034, 2018.
Chalov, S. and Ivanov, V.: Catchment and in-channel sources in three large Eurasian Arctic rivers: Combining monitoring, remote sensing and modelling data to construct Ob', Yenisey and Lena rivers sediment budget, Catena, 230, 107212, https://doi.org/10.1016/j.catena.2023.107212, 2023.
Chalov, S., Prokopeva, K., Magritsky, D., Grigoriev, V., Fingert, E., Habel, M., Juhls, B., Morgenstern, A., Overduin, P. P., and Kasimov, N.: Climate change impacts on streamflow, sediment load and carbon fluxes in the Lena River delta, Ecol. Indic., 157, https://doi.org/10.1016/j.ecolind.2023.111252, 2023a.
Chalov, S., Ivanov, V., Danila, S., Pavlyukevich, E., Habel, M., Botavin, D., Chalova, A., Golovlev, P., Kamyshev, A., Kolesnikov, R., Koneva, U., Kurakova, A., Mikhailova, N., Tuzova, E., Prokopeva, K., Zavadsky, A., Acharyya, R., Chalov, R., Varenov, A., Turykin, L., Tarbeeva, A. and Fan, D.: Multi-tool dataset on Northern Eurasian Riverbank Migration (NERM), Zenodo [data set], https://doi.org/10.5281/zenodo.15965461, 2025a.
Chalov, S., Prokopeva, K., Efimov, V., Ivanov, V., Koffi, B., Botavin, D., Babinski, Z., Zimov, N., Pavlyukevich, E., and Habel, M.: Implications of Yedoma bank outcrop on the Arctic river sediment transport, Sci. Rep., 15, 19320, https://doi.org/10.1038/s41598-025-02614-7, 2025b.
Chalov, S. R., Liu, S., Chalov, R. S., Chalova, E. R., Chernov, A. V., Promakhova, E. V., Berkovitch, K. M., Chalova, A. S., Zavadsky, A. S., and Mikhailova, N.: Environmental and human impacts on sediment transport of the largest Asian rivers of Russia and China, Environ. Earth Sci., 77, 1–14, https://doi.org/10.1007/s12665-018-7448-9, 2018.
Chalov, S. R., Chalova, A. S., and Shkolnyi, D. I.: Quantitative Assessment of Channel Planform Changes of the Kamchatka River, Izv. Ross. Akad. Nauk. Seriya Geogr., 85, https://doi.org/10.31857/S2587556621020035, 2021.
Chalov, S. R., Prokopeva, K. N., Shkolnyi, D. I., and Tsyplenkov, A. S.: Assessment of the Impact of Open-Cast Mining on the Vyvenka River Basin (Kamchatka Krai), Bull. Irkutsk State Univ. Ser. Earth Sci., 45, 127–149, https://doi.org/10.26516/2073-3402.2023.45.127, 2023b.
Donovan, M. and Belmont, P.: Timescale dependence in river channel migration measurements, Earth Surf. Proc. Land., 44, https://doi.org/10.1002/esp.4590, 2019.
Feyisa, G. L., Meilby, H., Fensholt, R., and Proud, S. R.: Automated Water Extraction Index: A new technique for surface water mapping using Landsat imagery, Remote Sens. Environ., 140, 23–35, https://doi.org/10.1016/j.rse.2013.08.029, 2014.
Fuchs, M., Nitze, I., Strauss, J., Günther, F., Wetterich, S., Kizyakov, A., Fritz, M., Opel, T., Grigoriev, M. N., Maksimov, G. T., and Grosse, G.: Rapid Fluvio-Thermal Erosion of a Yedoma Permafrost Cliff in the Lena River Delta, Front. Earth Sci., 8, https://doi.org/10.3389/feart.2020.00336, 2020.
Fuller, I. C., Large, A. R. G., and Milan, D. J.: Quantifying channel development and sediment transfer following chute cutoff in a wandering gravel-bed river, Geomorphology, https://doi.org/10.1016/S0169-555X(02)00374-4, 2003.
Gautier, E., Dépret, T., Cavero, J., Costard, F., Virmoux, C., Fedorov, A., Konstantinov, P., Jammet, M., and Brunstein, D.: Fifty-year dynamics of the Lena River islands (Russia): Spatio-temporal pattern of large periglacial anabranching river and influence of climate change, Sci. Total Environ., 783, https://doi.org/10.1016/j.scitotenv.2021.147020, 2021.
Gelfan, A., Gustafsson, D., Motovilov, Y., Arheimer, B., Kalugin, A., Krylenko, I., and Lavrenov, A.: Climate change impact on the water regime of two great Arctic rivers: modeling and uncertainty issues, Climatic Change, 141, https://doi.org/10.1007/s10584-016-1710-5, 2017.
Geyman, E. C., Douglas, M. M., Avouac, J.-P., and Lamb, M. P.: Permafrost slows Arctic riverbank erosion, Nature, 634, 359–365, https://doi.org/10.1038/s41586-024-07978-w, 2024.
Gómez-Pazo, A., Payo, A., Paz-Delgado, M., and Delgadillo Calzadilla, M. A.: Open Digital Shoreline Analysis System: ODSAS v1.0, J. Mar. Sci. Eng., 10, 26, https://doi.org/10.3390/jmse10010026, 2021.
Greenberg, E., Chadwick, A. J., and Ganti, V.: A Generalized Area-Based Framework to Quantify River Mobility From Remotely Sensed Imagery, J. Geophys. Res.-Earth, 128, https://doi.org/10.1029/2023JF007189, 2023.
Guy, H. P., Simons, D. B., and Richardson, E. V.: Summary of Alluvial Channel Data From Flume Experiments, 1956–61, US Geol. Surv. 1–104, US Geological Survey, https://doi.org/10.1017/S0016756800049062, 1966.
Himmelstoss, E. A., Henderson, R. E., Kratzmann, M. G. and Farris, A. S.: Digital Shoreline Analysis System (DSAS) version 5.1 user guide: U.S. Geological Survey Open-File Report 2021–1091, 104 p., https://doi.org/10.3133/ofr20211091, 2021.
Huang, C., Chen, Y., Zhang, S., and Wu, J.: Detecting, Extracting, and Monitoring Surface Water From Space Using Optical Sensors: A Review, Rev. Geophys., 56, 333–360, https://doi.org/10.1029/2018RG000598, 2018.
Ielpi, A. and Lapôtre, M. G. A.: A tenfold slowdown in river meander migration driven by plant life, Nat. Geosci., 13, https://doi.org/10.1038/s41561-019-0491-7, 2020.
Karaushev, A. V.: Theory and methods of calculation of river sediments, Hydrometeo, Leningrad, 271 pp., http://elib.rshu.ru/files_books/pdf/img-214172340.pdf (last access: 14 October 2025), 1977.
Kizyakov, A. I., Korotaev, M. V., Wetterich, S., Opel, T., Pravikova, N. V., Fritz, M., Lupachev, A. V., Günther, F., Shepelev, A. G., Syromyatnikov, I. I., Fedorov, A. N., Zimin, M. V., and Grosse, G.: Characterizing Batagay megaslump topography dynamics and matter fluxes at high spatial resolution using a multidisciplinary approach of permafrost field observations, remote sensing and 3D geological modeling, Geomorphology, 455, 109183, https://doi.org/10.1016/j.geomorph.2024.109183, 2024.
Knighton, D.: Fluvial Forms and Processes: A New Perspective, Routledge, London, 400 pp., https://doi.org/10.4324/9780203784662, 2014.
Kronvang, B., Andersen, H. E., Larsen, S. E., and Audet, J.: Importance of bank erosion for sediment input, storage and export at the catchment scale, J. Soils Sediments, 13, https://doi.org/10.1007/s11368-012-0597-7, 2013.
Kurakova, A. and Chalov, R. S.: Coast washouts in the latitudinal section of the Middle Ob and their connection with the morphology of the riverbed, Geogr. Bull., 3, 34–47, https://doi.org/10.17072/2079-7877-2019-3-34-47, 2019.
Langhorst, T. and Pavelsky, T.: Global Observations of Riverbank Erosion and Accretion From Landsat Imagery, J. Geophys. Res.-Earth, 128, https://doi.org/10.1029/2022JF006774, 2023.
Laonamsai, J., Julphunthong, P., Saprathet, T., Kimmany, B., Ganchanasuragit, T., Chomcheawchan, P., and Tomun, N.: Utilizing NDWI, MNDWI, SAVI, WRI, and AWEI for Estimating Erosion and Deposition in Ping River in Thailand, Hydrology, 10, https://doi.org/10.3390/hydrology10030070, 2023.
Lappalainen, H. K., Altimir, N., Kerminen, V.-M., Petäjä, T., Makkonen, R., Alekseychik, P., Zaitseva, N., Bashmakova, I., Kujansuu, J., Lauri, A., Haapanala, P., Mazon, S. B., Borisova, A., Konstantinov, P., Chalov, S., Laurila, T., Asmi, E., Lihavainen, H., Bäck, J., Arshinov, M., Mahura, A., Arnold, S., Vihma, T., Uotila, P., De Leeuw, G., Kukkonen, I., Malkhazova, S., Tynkkynen, V.-P., Fedorova, I., Hansson, H. C., Dobrolyubov, S., Melnikov, V., Matvienko, G., Baklanov, A., Viisanen, Y., Kasimov, N., Guo, H., Bondur, V., Zilitinkevich, S., and Kulmala, M.: Pan-Eurasian EXperiment (PEEX) program: an overview of the first 5 years in operation and future prospects, Geogr. Environ. Sustain., 11, 6–19, https://doi.org/10.24057/2071-9388-2018-11-1-6-19, 2018.
Lehner, B. and Grill, G.: Global river hydrography and network routing: baseline data and new approaches to study the world's large river systems, Hydrological Processes, 27, 2171–2186, https://doi.org/10.1002/hyp.9740, 2013.
Lima, L., Fernández-Fernández, S., Espinoza, J., da Guia Albuquerque, M., and Bernardes, C.: End point rate tool for QGIS (EPR4Q): Validation using DSAS and AMBUR, Int. J. Geo-Inf., 10, 162, https://doi.org/10.3390/ijgi10030162, 2021.
Linke, S., Lehner, B., Ouellet Dallaire, C., Ariwi, J., Grill, G., Anand, M., Beames, P., Burchard-Levine, V., Maxwell, S., Moidu, H., Tan, F., and Thieme, M.: Global hydro-environmental sub-basin and river reach characteristics at high spatial resolution, Sci. Data, https://doi.org/10.1038/s41597-019-0300-6, 2019.
Liu, H., Hu, H., Liu, X., Jiang, H., Liu, W., and Yin, X.: A Comparison of Different Water Indices and Band Downscaling Methods for Water Bodies Mapping from Sentinel-2 Imagery at 10-M Resolution, Water, 14, https://doi.org/10.3390/w14172696, 2022.
Mandarino, A., Maerker, M., and Firpo, M.: Channel planform changes along the Scrivia River floodplain reach in northwest Italy from 1878 to 2016, Quatern. Res., 1–18, https://doi.org/10.1017/qua.2018.67, 2019.
Morin, P., Porter, C., Cloutier, M., Howat, I., Noh, M.-J., Willis, M., Bates, B., Willamson, C., and Peterman, K.: ArcticDEM; A Publically Available, High Resolution Elevation Model of the Arctic, Geophys. Res. Abstr., https://ui.adsabs.harvard.edu/abs/2016EGUGA..18.8396M/ (last access: 14 October 2025), 2016.
Murton, J. B., Goslar, T., Edwards, M. E., Bateman, M. D., Danilov, P. P., Savvinov, G. N., Gubin, S. V., Ghaleb, B., Haile, J., Kanevskiy, M., Lozhkin, A. V., Lupachev, A. V., Murton, D. K., Shur, Y., Tikhonov, A., Vasil'chuk, A. C., Vasil'chuk, Y. K., and Wolfe, S. A.: Palaeoenvironmental Interpretation of Yedoma Silt (Ice Complex) Deposition as Cold-Climate Loess, Duvanny Yar, Northeast Siberia, Permafrost Periglac. Process., 26, 208–288, https://doi.org/10.1002/ppp.1843, 2015.
Musie, W. and Gonfa, G.: Fresh water resource, scarcity, water salinity challenges and possible remedies: A review, Heliyon, 9, e18685, https://doi.org/10.1016/j.heliyon.2023.e18685, 2023.
Obu, J., Westermann, S., Bartsch, A., Berdnikov, N., Christiansen, H. H., Dashtseren, A., Delaloye, R., Elberling, B., Etzelmüller, B., Kholodov, A., Khomutov, A., Kääb, A., Leibman, M. O., Lewkowicz, A. G., Panda, S. K., Romanovsky, V., Way, R. G., Westergaard-Nielsen, A., Wu, T., Yamkhin, J., and Zou, D.: Northern Hemisphere permafrost map based on TTOP modelling for 2000–2016 at 1 km2 scale, Earth-Sci. Rev., https://doi.org/10.1016/j.earscirev.2019.04.023, 2019.
Payne, C., Panda, S., and Prakash, A.: Remote Sensing of River Erosion on the Colville River, North Slope Alaska, Remote Sens., 10, https://doi.org/10.3390/rs10030397, 2018.
Peel, M. C., Finlayson, B. L., and McMahon, T. A.: Updated world map of the Köppen–Geiger climate classification, Hydrol. Earth Syst. Sci., 11, 1633–1644, https://doi.org/10.5194/hess-11-1633-2007, 2007.
Pekel, J.-F., Cottam, A., Gorelick, N., and Belward, A. S.: Global Surface Water Explorer, http://data.europa.eu/89h/jrc-gswe-global-surface-water-explorer-v1 (last access: 14 October 2025), 2016.
Pickens, A. H., Hansen, M. C., Hancher, M., Stehman, S. V., Tyukavina, A., Potapov, P., Marroquin, B., and Sherani, Z.: Mapping and sampling to characterize global inland water dynamics from 1999 to 2018 with full Landsat time-series, Remote Sens. Environ., 243, 111792, https://doi.org/10.1016/j.rse.2020.111792, 2020.
Piégay, H., Arnaud, F., Belletti, B., Bertrand, M., Bizzi, S., Carbonneau, P., Dufour, S., Liébault, F., Ruiz-Villanueva, V., and Slater, L.: Remotely sensed rivers in the Anthropocene: state of the art and prospects, Earth Surf. Proc. Land., 45, 157–188, https://doi.org/10.1002/esp.4787, 2020.
Reid, L. M. and Dunne, T.: Sediment budgets as an organizing framework in fluvial geomorphology, in: Tools in Fluvial Geomorphology, Wiley, 357–380, https://doi.org/10.1002/9781118648551.ch16, 2016.
Rowland, J. C., Jones, C. E., Altmann, G., Bryan, R., Crosby, B. T., Geernaert, G. L., Hinzman, L. D., Kane, D. L., Lawrence, D. M., Mancino, A., Marsh, P., McNamara, J. P., Romanovsky, V. E., Toniolo, H., Travis, B. J., Trochim, E., and Wilson, C. J.: Arctic landscapes in transition: Responses to thawing permafrost, Eos, Washington, D.C., 91, https://doi.org/10.1029/2010EO260001, 2010.
Rowland, J. C., Shelef, E., Pope, P. A., Muss, J., Gangodagamage, C., Brumby, S. P., and Wilson, C. J.: A morphology independent methodology for quantifying planview river change and characteristics from remotely sensed imagery, Remote Sens. Environ., 184, https://doi.org/10.1016/j.rse.2016.07.005, 2016.
Rowland, J. C., Schwenk, J. P., Shelef, E., Muss, J., Ahrens, D., Stauffer, S., Pilliouras, A., Crosby, B., Chadwick, A., Douglas, M. M., Kemeny, P. C., Lamb, M. P., Li, G. K., and Vulis, L.: Scale-Dependent Influence of Permafrost on Riverbank Erosion Rates, J. Geophys. Res.-Earth, 128, https://doi.org/10.1029/2023JF007101, 2023.
Saunders, A. D., England, R. W., Reichow, M. K., and White, R. V.: A mantle plume origin for the Siberian traps: Uplift and extension in the West Siberian Basin, Russia, Lithos, 79, https://doi.org/10.1016/j.lithos.2004.09.010, 2005.
Sergaliev, N. Kh. and Akhmedenov, K.: Dynamics of river bed processes of the Ural River in Western Kazakhstan, Water Practice & Technology, 9, 457–463, https://doi.org/10.2166/wpt.2014.050, 2014.
Sidorchuk, A.: The Potential of Gully Erosion on the Yamal Peninsula, West Siberia, Sustainability, 12, 260, https://doi.org/10.3390/su12010260, 2019.
Strauss, J., Laboor, S., Schirrmeister, L., Fedorov, A. N., Fortier, D., Froese, D., Fuchs, M., Günther, F., Grigoriev, M., Harden, J., Hugelius, G., Jongejans, L. L., Kanevskiy, M., Kholodov, A., Kunitsky, V., Kraev, G., Lozhkin, A., Rivkina, E., Shur, Y., Siegert, C., Spektor, V., Streletskaya, I., Ulrich, M., Vartanyan, S., Veremeeva, A., Anthony, K. W., Wetterich, S., Zimov, N., and Grosse, G.: Circum-Arctic Map of the Yedoma Permafrost Domain, Front. Earth Sci., 9, https://doi.org/10.3389/feart.2021.758360, 2021.
Sylvester, Z., Durkin, P., and Covault, J. A.: High curvatures drive river meandering, Geology, 47, https://doi.org/10.1130/G45608.1, 2019.
Szumińska, D., Kozioł, K., Chalov, S. R., Efimov, V. A., Frankowski, M., Lehmann-Konera, S., and Polkowska, Ż.: Reemission of inorganic pollution from permafrost? A freshwater hydrochemistry study in the lower Kolyma basin (North-East Siberia), L. Degrad. Dev., 34, https://doi.org/10.1002/ldr.4866, 2023.
Thorne, C. R.: Field measurements of rates of bank erosion and bank material strength, in: Eros. sediment Transp. Meas. Proc. Florence Symp. June 1981, International Assoc. Hydrol. Sci., IAHS-AISH Publ. 512, https://iahs.info/Publications-News/?dmsSearch_pubno=292 (last access: 14 October 2025), 1981.
Van Binh, D., Wietlisbach, B., Kantoush, S., Loc, H. H., Park, E., Cesare, G., Cuong, D. H., Tung, N. X., and Sumi, T.: A Novel Method for River Bank Detection from Landsat Satellite Data: A Case Study in the Vietnamese Mekong Delta, Remote Sens., 12, https://doi.org/10.3390/rs12203298, 2020.
Vasilenko, A. N., Magritsky, D. V., Frolova, N. L., and Shevchenko, A. I.: Features Of A Long-Term Heat Flux Formation Of The Large Russian Arctic Rivers And Its Transformations In Estuaries Under The Influence Of Climate-Induced And Dam-Induced Effects, Geogr. Environ. Sustain., 15, 4, https://doi.org/10.24057/2071-9388-2022-105, 2022.
Wilkinson, S. N., Prosser, I. P., Rustomji, P., and Read, A. M.: Modelling and testing spatially distributed sediment budgets to relate erosion processes to sediment yields, Environ. Model. Softw., 24, 489–501, https://doi.org/10.1016/j.envsoft.2008.09.006, 2009.
Zhou, Y., Dong, J., Xiao, X., Xiao, T., Yang, Z., Zhao, G., Zou, Z., and Qin, Y.: Open Surface Water Mapping Algorithms: A Comparison of Water-Related Spectral Indices and Sensors, Water, 9, https://doi.org/10.3390/w9040256, 2017.