the Creative Commons Attribution 4.0 License.
the Creative Commons Attribution 4.0 License.
 | 22 Oct 2025
Modern pollen dataset of the Tibetan Plateau
Mengna Liao
Kai Li
Yili Jin
Lina Liu
Xianyong Cao
Modern pollen datasets can provide invaluable data for interpreting temporal variations in climate, vegetation, land cover, and plant diversity from fossil pollen. Here we present 555 pollen count data, identified from topsoil collected within plant plots across a vast area of the Tibetan Plateau (TP) and along the southern margin of Xinjiang that borders the TP. This dataset fills a geographical gap in the published datasets that offer pollen count data for this area. Ordination analysis and multiple regression reveal that precipitation is the primary factor influencing the spatial distribution of pollen assemblages across the entire study area. Furthermore, ordination analysis indicates that pollen assemblages can be used to distinguish vegetation types in the southeastern TP, such as coniferous forest, alpine shrubland, and alpine meadow, from vegetation types found in other regions of TP. Additionally, it is possible to distinguish vegetation types that have low precipitation or moisture requirements based on pollen assemblages. Generalized additive models demonstrate that six commonly used pollen ratios, involving taxa such as Artemisia, Amaranthaceae, Cyperaceae, and Poaceae, are not sufficiently reliable for reflecting changes in annual precipitation. Nevertheless, they can provide some indication of changes in vegetation or landscape. This dataset holds various potential applications in paleoecological and paleoclimatic research. It not only offers a scientific foundation for reconstructing changes in climate and vegetation over time, but also enables the assessment of the reliability of pollen assemblages in representing the dynamics of vegetation cover, functional traits, and plant diversity, by integrating data on simultaneously measured plot-level plant communities and functional traits. Data from this study, including pollen count data for each sample and site, alongside the geographical coordinates, altitude, local vegetation type of each sampling site, dry weight of each sample used for pollen extraction, Lycopodium (marker) grains per tablet, and the identified number of Lycopodium spores, are available at https://doi.org/10.11888/Paleoenv.tpdc.302015 (Liao and Ni, 2025).
- Article
(7479 KB) - Full-text XML
- BibTeX
- EndNote


Modern pollen samples, cross-referenced with current distributions of climate and vegetation, provide invaluable data for interpreting temporal variations in climate, terrestrial vegetation, and land cover from fossil pollen data (Prentice et al., 1996; Zhu et al., 2010; Fyfe et al., 2015; Kaufman and Broadman, 2023; Liu et al., 2024). Over the past four decades, modern pollen datasets have been progressively established at continental or subcontinental scales, such as the European Modern Pollen Database (Davis et al., 2013), Eurasian Modern Pollen Database (Davis et al., 2020), East Asian Pollen Database (Zheng et al., 2014), Modern Pollen Dataset of China (Chen et al., 2021), modern pollen data from North America and Greenland (Whitmore et al., 2005), and Latin American pollen database (Flantua et al., 2015). Public availability of these modern pollen data can facilitate quantitative reconstructions of past climate, biomes, land cover, and plant diversity, and additionally aid in creating benchmarks for evaluating vegetation and climate simulations.
Tibetan Plateau (TP), known as the world's “Third Pole” and the cradle of East Asian flora, constitutes the largest area of uplifted crust on Earth. It plays a pivotal role in the formation of the climate pattern and hydrological system in East Asia (Yao et al., 2012), as well as in the evolution of flora, fauna and biodiversity (Ding et al., 2020). Besides, TP is highly sensitive to global climate change, and its landscapes are fragile (Chen et al., 2015; Ehlers et al., 2022). Due to its unique environment, TP has been a hotspot for studying present and past changes in climate and vegetation (Herzschuh et al., 2009; Li et al., 2022; Zhou et al., 2024), and for investigating interactions between human and environmental change (Gao et al., 2022; Zhang et al., 2022). Over the past two decades, modern pollen datasets from TP (Yu et al., 2001; Herzschuh et al., 2010; Lu et al., 2011; Cao et al., 2014; Cao et al., 2021; Wang et al., 2022; Ma et al., 2024b) or those from China or the world that include a substantial number of modern pollen samples collected from TP have been published (Zheng et al., 2014; Davis et al., 2020; Chen et al., 2021; Cui et al., 2024). Some of these datasets are publicly accessible, including lake surface sediment pollen datasets on the eastern, central, and western TP (Cao et al., 2021; Ma et al., 2024b), the Modern Pollen Dataset of China (Chen et al., 2021), and the Eurasian Modern Pollen Database (Davis et al., 2020). However, most of these data have either been digitized or converted into percentages, and collected from multiple sources, making it difficult to evaluate their quality and potentially introduce additional bias or uncertainties into the results of further analysis.
Here we present modern pollen count data identified by the team from 555 topsoil samples collected within plant plots on TP and in the southern margin of Xinjiang bordering the northern plateau. We aim to: (i) fill a geographical gap left by previous datasets that provided pollen count data from the TP, and (ii) propose potential uses of this dataset and necessary considerations for its application. This modern pollen dataset not only provides a probability to comprehensively dissect the linkages between pollen assemblage and climatic variables, as well as vegetation, across large gradients of climate and vegetation, but also helps improve the accuracy of reconstructions of regional climate, vegetation, and land cover.
The study area covers a wide geographical range from 28 to 40° N latitude and from 75 to 103° E longitude, including large areas of the TP and the southern margin of Xinjiang, which borders the northern plateau (Fig. 1). Due to the synthetic effects of various factors such as altitude, topography, and atmospheric circulation, TP shows a prominent gradient in climate (China Meteorological Data Service Centre, https://data.cma.cn, last access: 6 November 2024). The TP is characterized by a thermal deficiency, with mean annual temperature (MAT) across the surface plateau almost below 0 °C. The MAT decreases from eastern to western TP, where the MAT on the northern and eastern parts of the TP ranges from 0 to 10 °C but decreases to about −10 °C in western TP. The precipitation generally decreases from the southeast, which is impacted by the Indian Summer Monsoon, to the northwest, which is influenced by dry westerly. The mean annual precipitation reaches several hundred to even over a thousand millimetres on the southeastern TP, but decreases to below 50 mm on the northwestern TP. Additionally, precipitation on TP exhibits distinct seasonal variations, with the majority of the annual precipitation occurring during the summer. Due to the pronounced climate gradients, the vegetation on the plateau transitions successively from montane forest in the southeast to alpine shrub and meadow, followed by alpine steppe in the middle, and finally alpine desert in the northwest. In the northeastern TP and the southern margin of Xinjiang, where the altitude is relatively low, the vegetation is predominantly temperate and consists primarily of meadow, steppe, and desert.
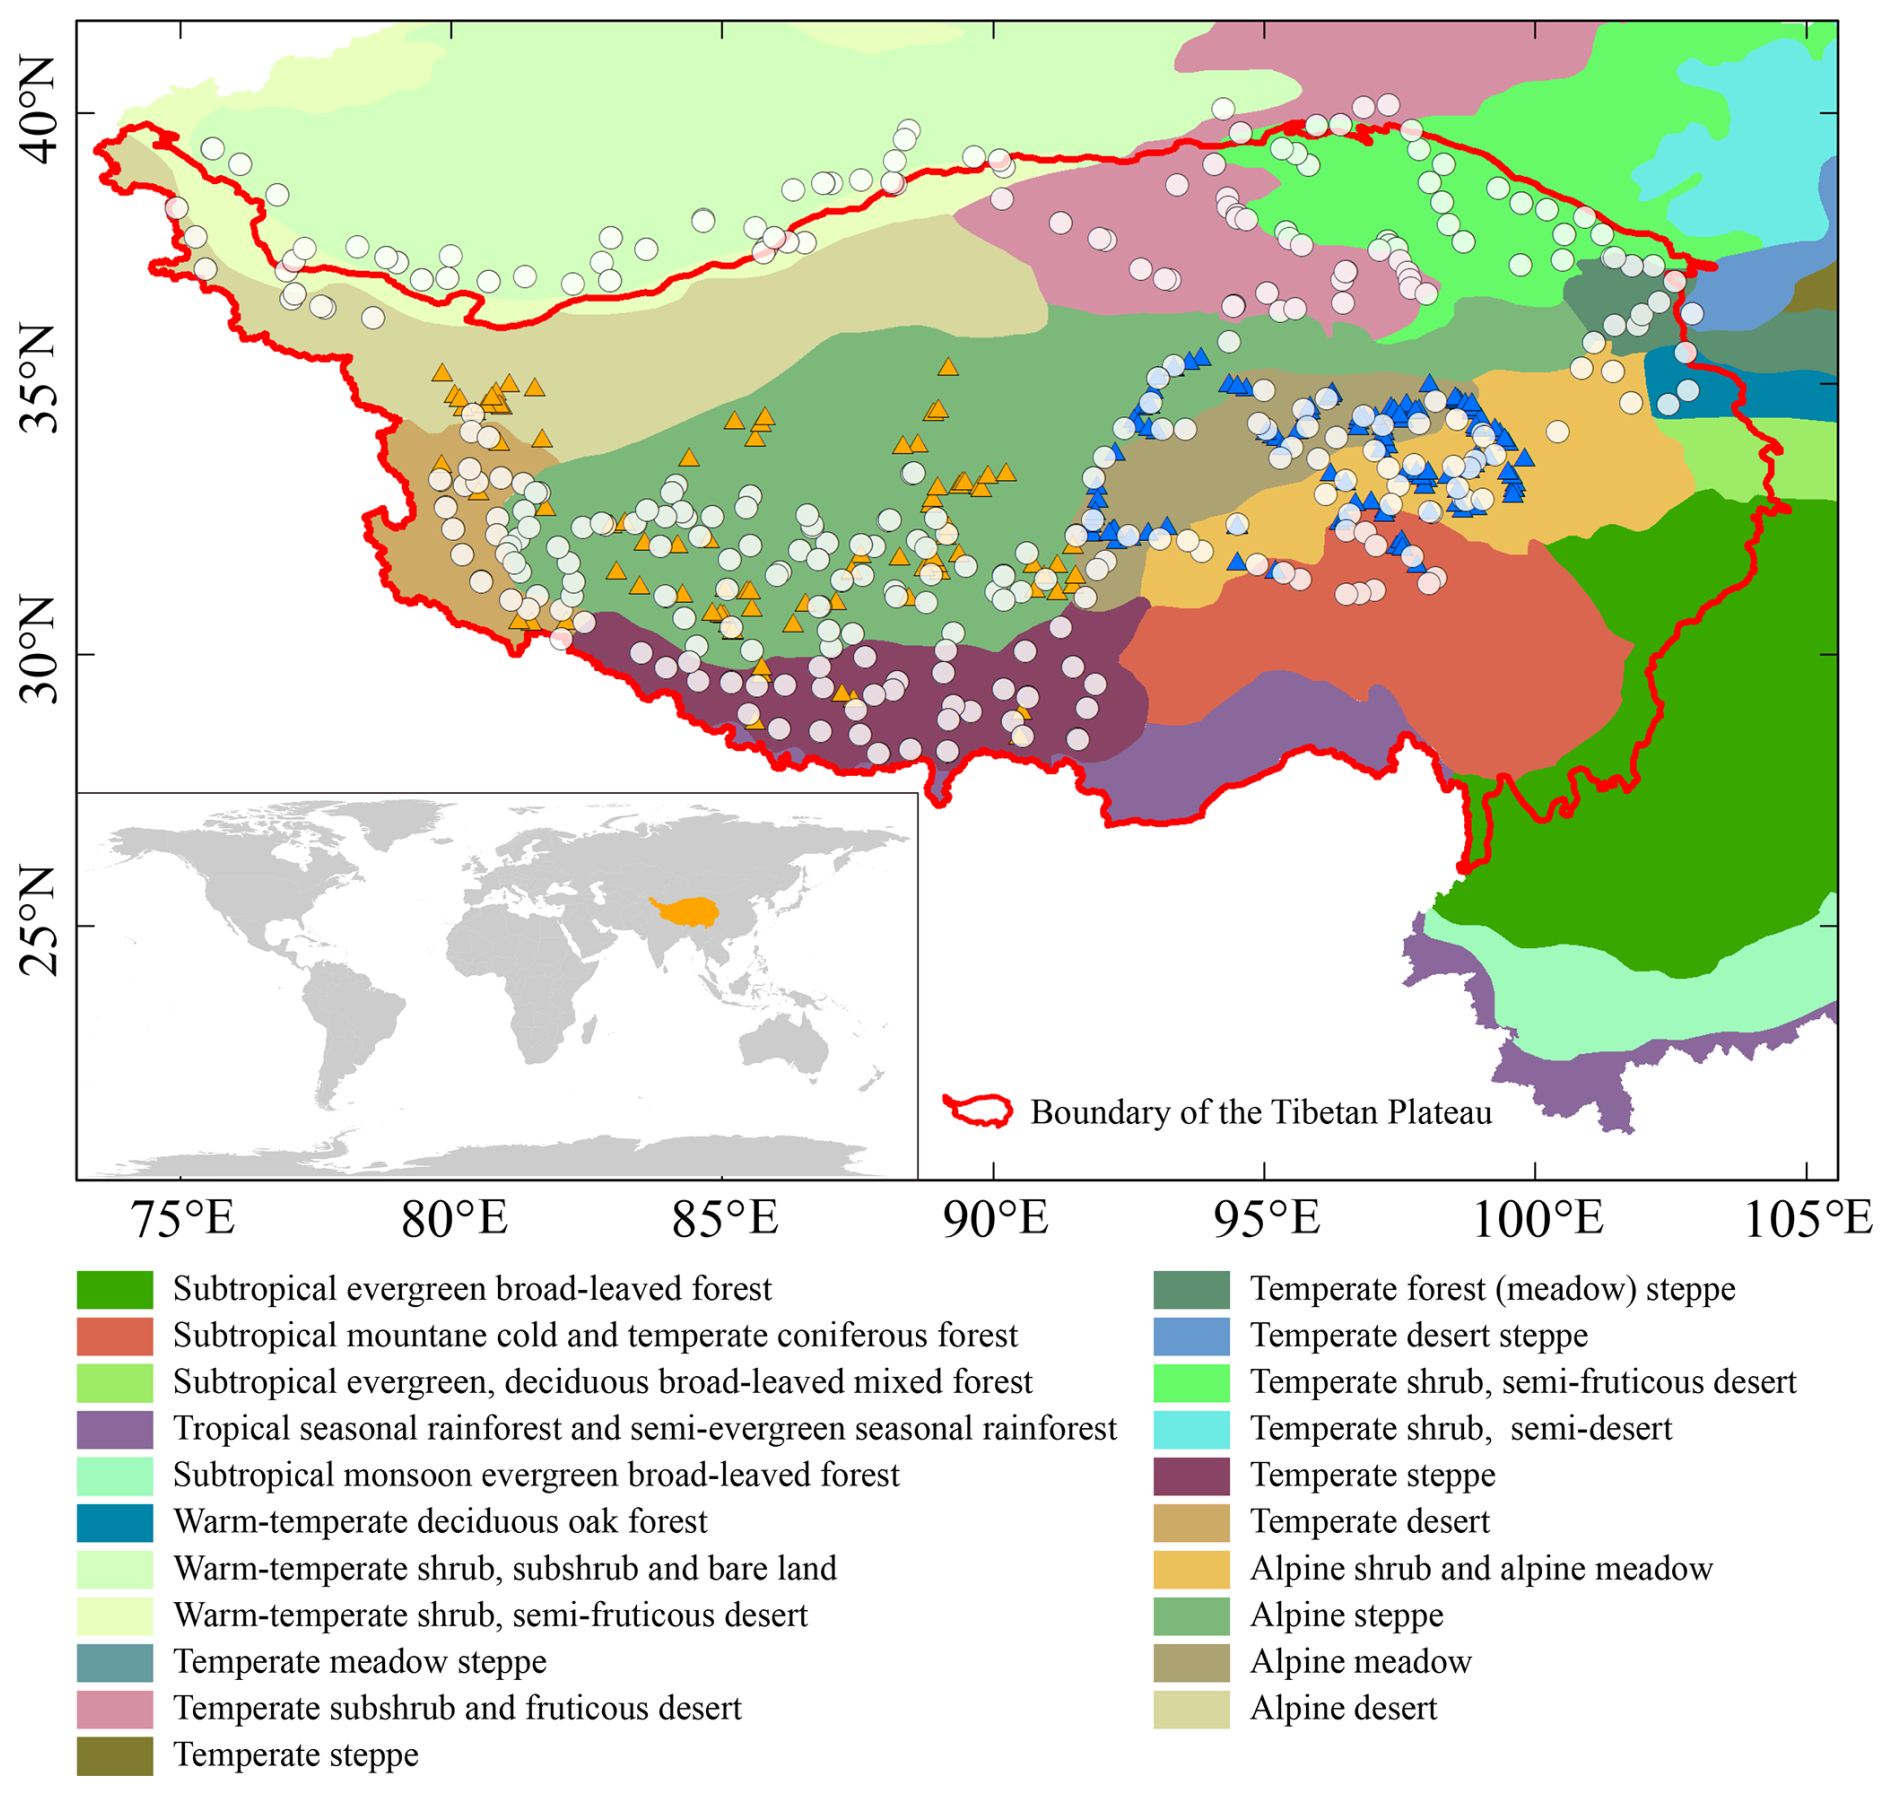
Figure 1Geographical location of the Tibetan Plateau (TP) and spatial distribution of modern pollen samples (white dots: samples from our dataset; yellow triangles: lake surface sediment samples in the dataset of Cao et al., 2021; blue triangles: lake surface sediment samples in the dataset of Ma et al., 2024b). The background map shows the distribution of modern vegetation across the TP and its surrounding regions in China (Zhang, 2007). The boundary of the TP was obtained from Zhang et al. (2021).
3.1 Sample collection
A total of 664 topsoil samples were collected from 307 sites across the study area between 2018 and 2022 (Fig. 1). The sampling sites cover diverse vegetation types and span a broad altitude range. The sample sites in alpine vegetation are generally located above 3000 m a.s.l., while those in temperate vegetation are located between 800 and 3000 m a.s.l. (Jin et al., 2022). Based on the local vegetation surrounding the sampling sites (Jin et al., 2022), the samples can be classified into eight groups: coniferous forest (3 samples from 3 sites), alpine shrubland (54 samples from 35 sites), alpine meadow (136 samples from 80 sites), alpine steppe (191 samples from 89 sites), alpine desert (38 samples from 15 sites), temperate meadow (21 samples from 15 sites), temperate steppe (18 samples from 9 sites), and temperate desert (94 samples from 61 sites). It should be noted that the geographical coverage of the samples collected in 2018 for this dataset overlaps with that of the dataset published by Cao et al. (2021). However, the geographical locations of the samples in the two datasets are different. Additionally, the samples collected by our team are topsoil samples, whereas those collected by Cao et al. (2021) are from lake/pond surface sediments.
3.2 Pollen analysis
The samples were pretreated using the heavy liquid flotation method (Moore et al., 1991; Nakagawa et al., 1998) involving five main steps: removing carbonate with 10 % HCl, removing humic substances with 10 % KOH, sieving through a 125 µm mesh to remove gravels and plant roots, performing heavy liquid flotation with a zinc bromide solution (ZnBr2 at approximately 2.2 g mL−1), and removing cellulose with acetolysis. Lycopodium spores (27 560 grains per tablet for samples collected in 2018, and 10 315 grains per tablet for samples collected in 2019, 2020, 2021) were added to each sample prior to the pretreatment. Pollen identification referred to the Chinese pollen books (Wang et al., 1995; Tang et al., 2016). It is noted that for the samples collected in 2018, those obtained from different plots within the same site were thoroughly mixed prior to being used for pollen extraction. Therefore, despite having collected 664 topsoil samples, a total of 555 pretreated samples were ultimately used for pollen identification. In the dataset, sample identities that differ only in their suffix letters indicate that they were collected from different quadrats within the same site.
3.3 Numerical analyses
When performing numerical analyses, we considered only terrestrial pollen types. Additionally, we used pollen data aggregated per sampling site rather than per individual sample for the analyses. Pollen percentages were determined by calculating the proportion of each pollen type relative to the total number of terrestrial pollen grains identified in each site, and these percentages were subsequently utilized for numerical analyses. To explore the similarities among pollen assemblages, we performed non-metric multidimensional scaling (NMDS) using Bray-Curtis distance as the distance measure between different pollen assemblages. Additionally, to assess the relations of bioclimatic variables and the intensity of human disturbance to the first two ordination axes of the NMDS, we conducted multiple regression analysis with bioclimatic variables as explanatory and the ordination axes as dependent variables. The statistical significance of the relationships was assessed using a permutation test (with 999 iterations). There are 23 bioclimatic variables that can be extracted from a 1 km resolution climate dataset over China (Hu et al., 2024). To avoid the collinearity among different bioclimatic variables, a threshold-based (Pearson's pairwise correlation coefficient) approach was used in this study to remove highly correlated variables (R>0.8). Finally, 7 bioclimatic variables were selected, including BIO1 (Annual Mean Temperature), BIO2 (Mean Diurnal Range), BIO3 (Isothermality), BIO4 (Temperature Seasonality), BIO12 (Annual Precipitation), BIO14 (Precipitation of Driest Month), and BIO23 (Moisture Index). The intensity of human disturbance estimated for each sampling site was extracted from the published plot-level vegetation dataset (Jin et al., 2022). In the vegetation dataset, the intensity of human disturbance was classified into three levels: “weak”, “moderate”, and “strong”. For the regression analysis, we converted these levels into dummy variables, assigning values of 1, 2, and 3 to represent “weak”, “moderate”, and “strong”, respectively. NMDS and multiple regression analysis were conducted using the R package “vegan” (Oksanen et al., 2022).
Six commonly used pollen ratios, including Artemisia Amaranthaceae (A Am), Artemisia Cyperaceae (A Cy), Poaceae Artemisia (Po A), Cyperaceae Poaceae (Cy Po), Cyperaceae (Poaceae+Artemisia) (Cy (Po+A)), and Poaceae (Artemisia+Amaranthaceae) (Po (A+Am)), were selected to investigate their relationships with annual precipitation. Given that the relationships between these pollen ratios and annual precipitation may be nonlinear, we applied generalized additive models (GAMs) to uncover these relationships. GAMs are nonparametric data-driven regression models that can effectively assess nonlinear relationships between response and predictor variables without any restrictive assumptions (Hastie and Tibshirani, 1987). When performing GAMs, only sites (n=298) with pollen counts exceeding 200 grains were retained to ensure the reliability of the data. The significance of these relationships was tested using F-tests, and a significance level ≤ 0.05 was considered significant. The R package “mgcv” (Wood, 2011) was used for performing the GAMs.
4.1 Pollen count and taxa
The number of identified pollen grains in this dataset varies greatly, with a minimum of 6 grains per sample (or 10 grains per site) and a maximum of 1331 grains per sample (or 2626 grains per site). Samples or sites with relatively low pollen count are mainly from some plots on hillside distributed in the southwestern and northeastern TP (Fig. 2). Therefore, we strongly recommend performing data filtering before using this dataset in reflecting vegetation composition. According to the frequency distributions of the pollen counts, samples with pollen counts exceeding 300 grains constitute approximately 56 % of the total samples, while those with counts between 200 and 300 grains account for approximately 31 % (Fig. 2). Samples with pollen counts below 100 grains comprise about 6 % of the total samples. When taking into account the total counts at each sampling site, approximately 88 % of the sites contain pollen counts exceeding 300 grains, while less than 1 % (n=3) of the sites have counts below 100 grains (Fig. 2).
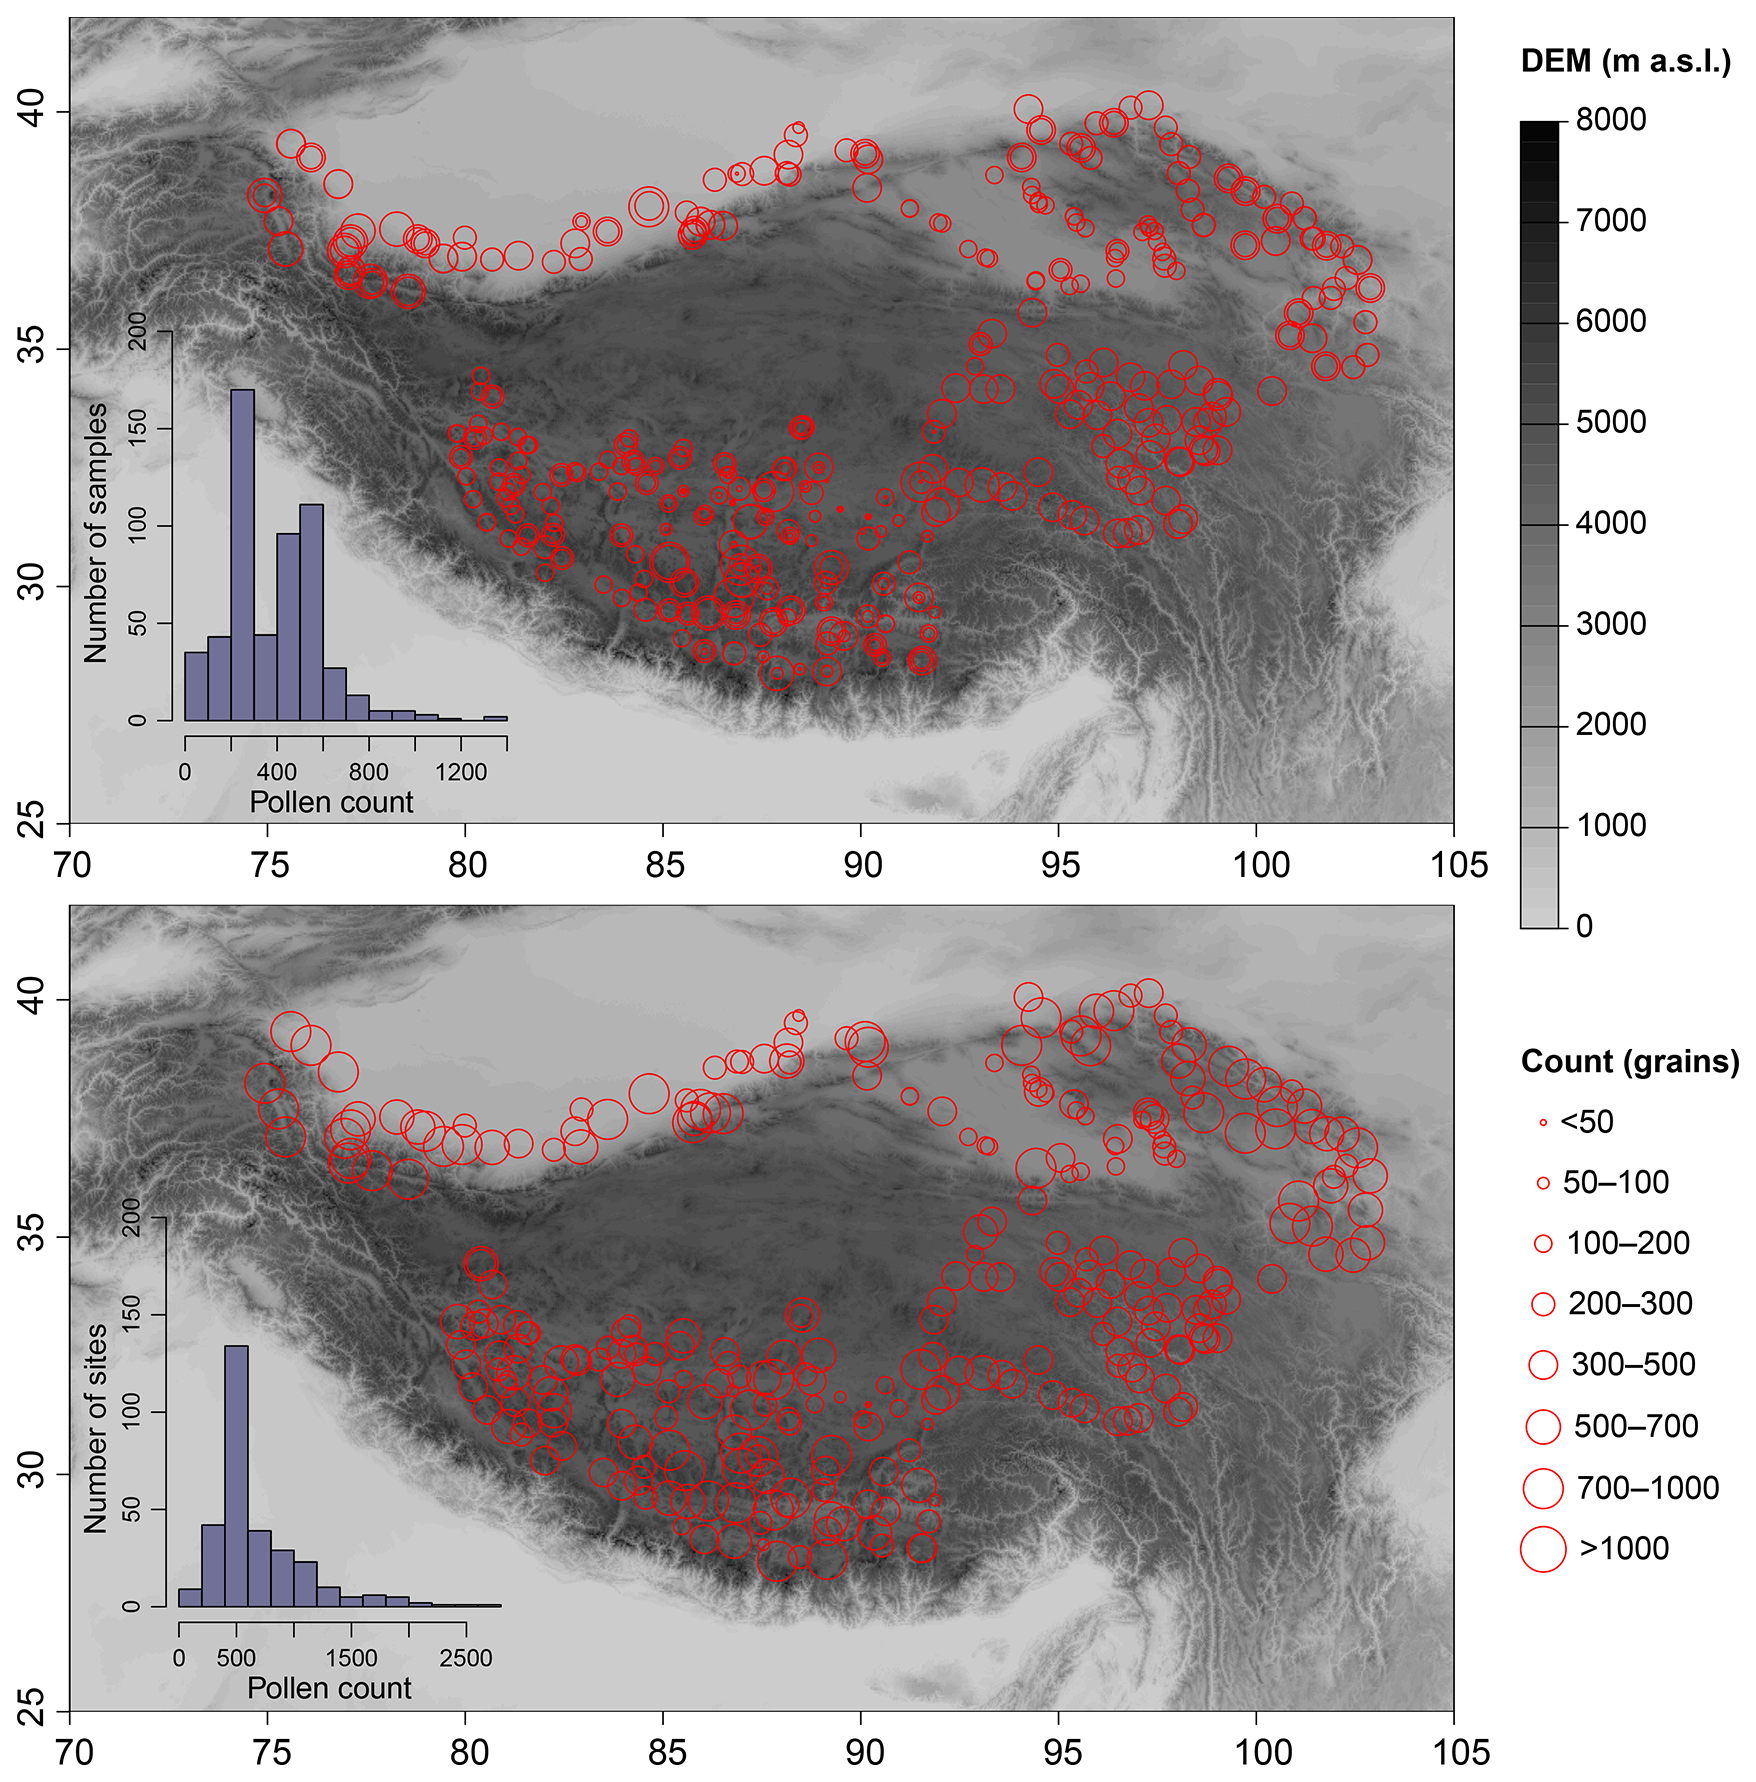
Figure 2Spatial distributions of the number of pollen grains identified from each sample (upper panel) and from each site (lower panel). The inserted histograms show the frequency distributions of the pollen count.
A total of 145 identified pollen types have been recorded in the dataset. Based on the distribution of median values across different vegetation types, samples collected from coniferous forest, alpine shrubland, alpine meadow, and temperate steppe contain a relatively large number of pollen taxa (Fig. 3). When considering the total number of identified pollen types at each sampling site, sites in temperate steppe generally contain a distinctly larger number of pollen taxa compared to those in other vegetation types, whereas sites in temperate meadow and desert contain the fewest pollen taxa (Fig. 3). It should be noted that, due to the limited sample size (n=3) from coniferous forest, the observed abundance of pollen taxa for this vegetation type may be subject to underestimation. Additionally, issues related to differences in pollen production and dispersal capacity may also influence the abundance of identified pollen taxa. Pollen types with a high pollen production and wide dispersal commonly dominate a pollen assemblage, thereby reducing the probability of detecting pollen types with a poorer representation and/or a low production in the pollen source area (Odgaard, 1999; Weng et al., 2006). Since the pollen samples collected annually between 2018 and 2021 were identified by different individuals, there are minor discrepancies in taxonomic resolution among the data. For example, Abies and Picea were not differentiated in the samples collected in 2018, whereas they were taxonomically resolved in the samples collected during 2019–2021. Given that this dataset may be used by researchers with varying data processing requirements, we opted to maintain the original integrity of the data without standardizing it. Specifically, we refrained from homogenizing taxonomy at the family or genus level and retain counts for unidentified pollen types (marked as “Unknown” in the dataset). The nomenclature of pollen types in our dataset generally follows the conventions outlined in the Flora of China (https://www.iplant.cn/, last access: 7 November 2024). However, we have retained the pollen type Chenopodiaceae despite its current taxonomic replacement within the family Amaranthaceae as per the latest Angiosperm Phylogeny Group (APG) classification. Therefore, if researchers intend to integrate our dataset with others, they should pay particular attention to standardizing the nomenclature of pollen types.
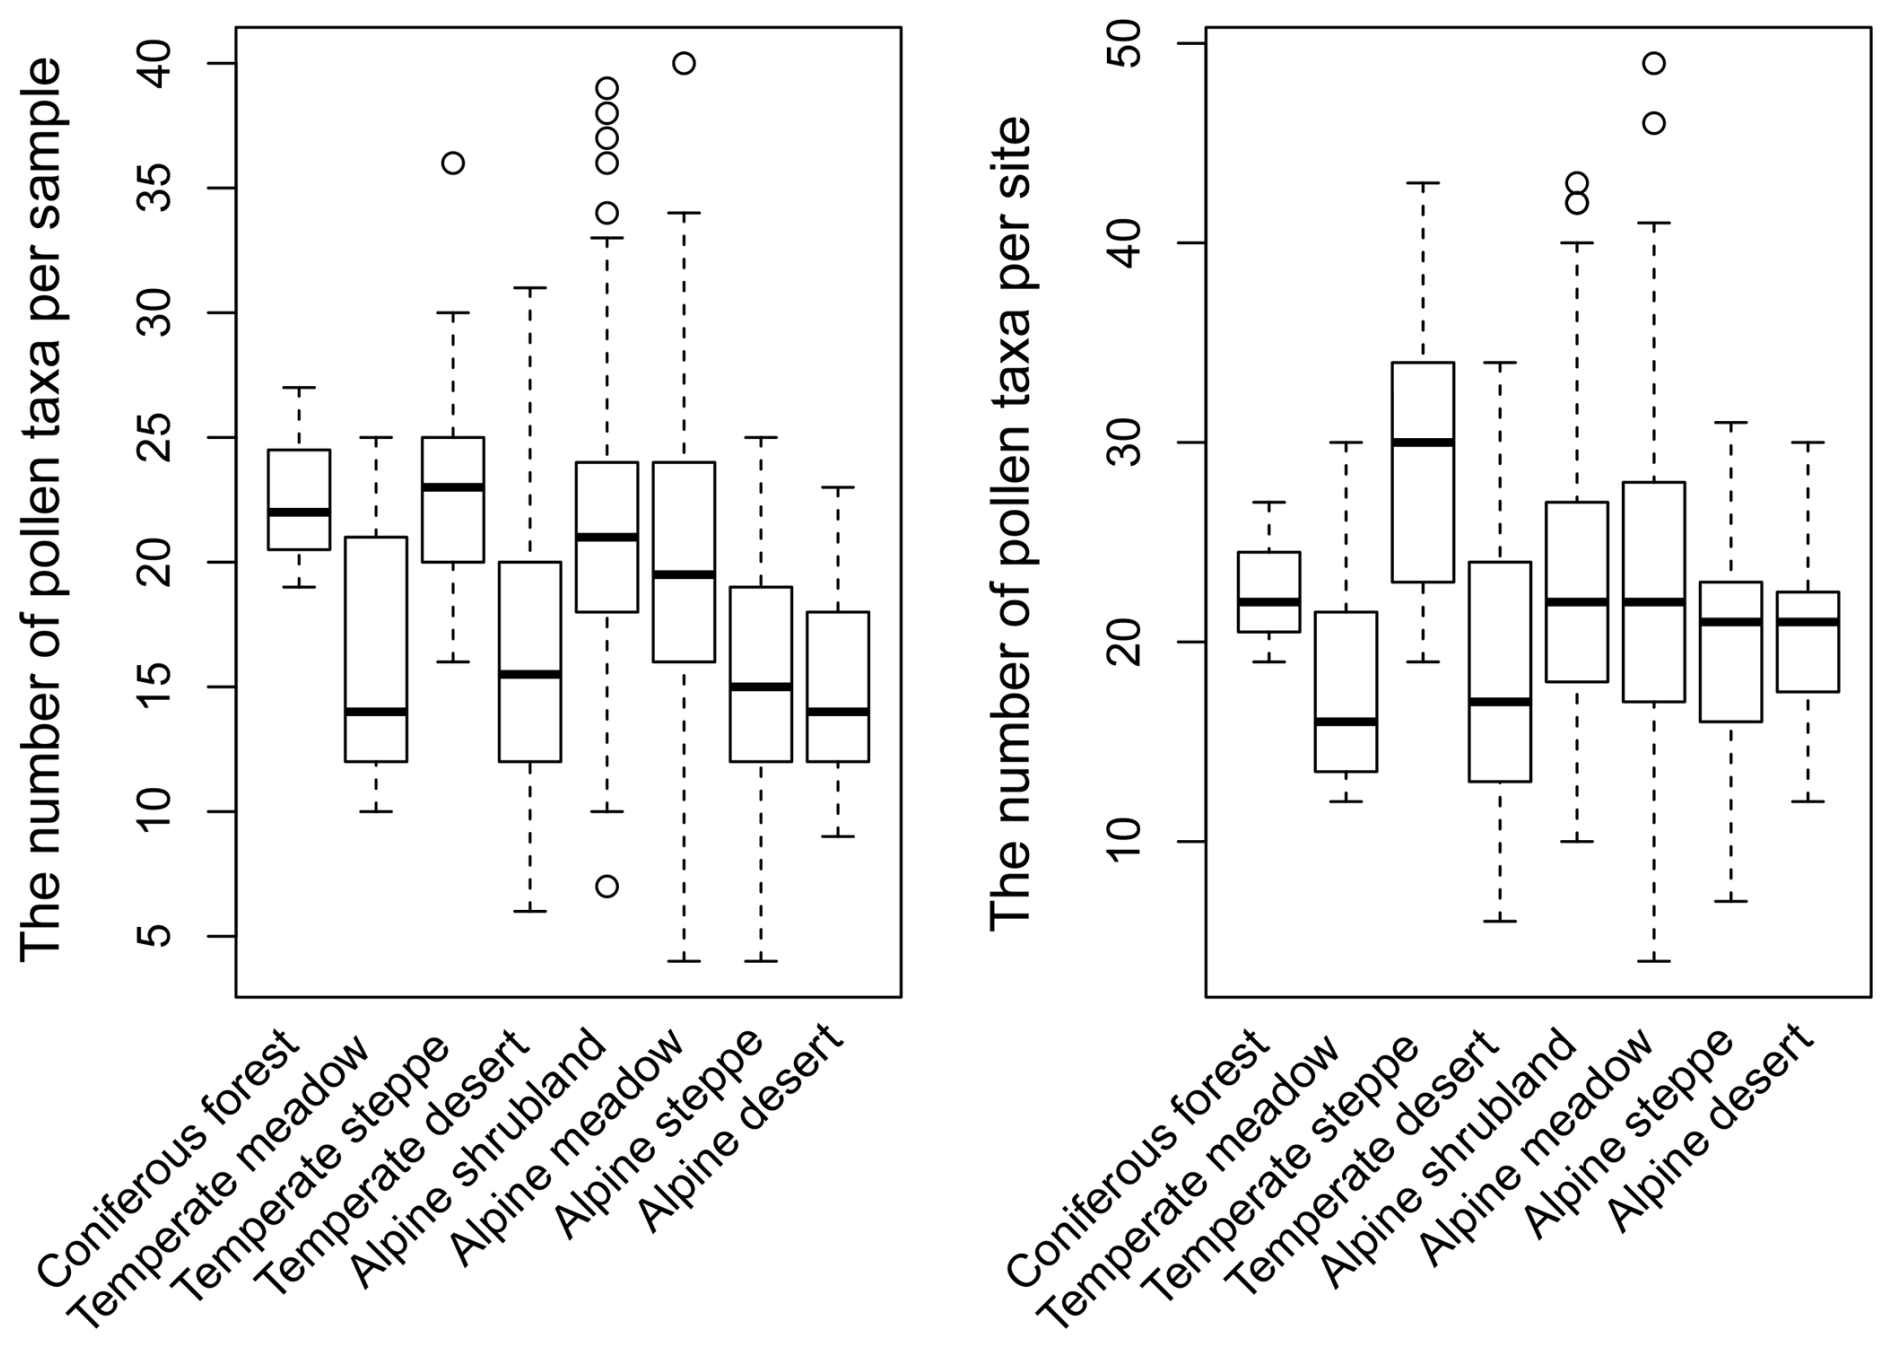
Figure 3Boxplots showing the distribution of the number of identified pollen taxa from different vegetation types.
4.2 Distributions of major pollen taxa
The percentage abundance of the main pollen types exhibits different spatial distribution patterns (Fig. 4). Pinus reaches a maximum percentage of approximately 47 %, with percentages between 20 % and 30 % and between 30 % and 50 % primarily observed in the northeastern and southwestern TP, respectively. Ephedra has a relatively high percentage (> 30 %) in the central and eastern parts of the southern margin of Xinjiang. Amaranthaceae displays relatively high percentages primarily in the northeastern and southwestern TP, as well as along the southern margin of Xinjiang. Artemisia is relatively abundant in the central part of the southern margin of Xinjiang, as well as in the northeastern, northwestern, and southern regions of TP. Cyperaceae exhibits a distinct spatial pattern, with high percentages observed in the eastern, southeastern, and southern areas of TP. Ranunculaceae has notable high percentages at a few sites along the southern margin of Xinjiang. A few sampling sites with relatively high percentages of Tamarix are located in the Qaidam Basin, a relatively low-altitude area in the northeastern TP. For the remaining pollen taxa, most of them are below 10 %, and there is no obvious difference in their spatial distributions.
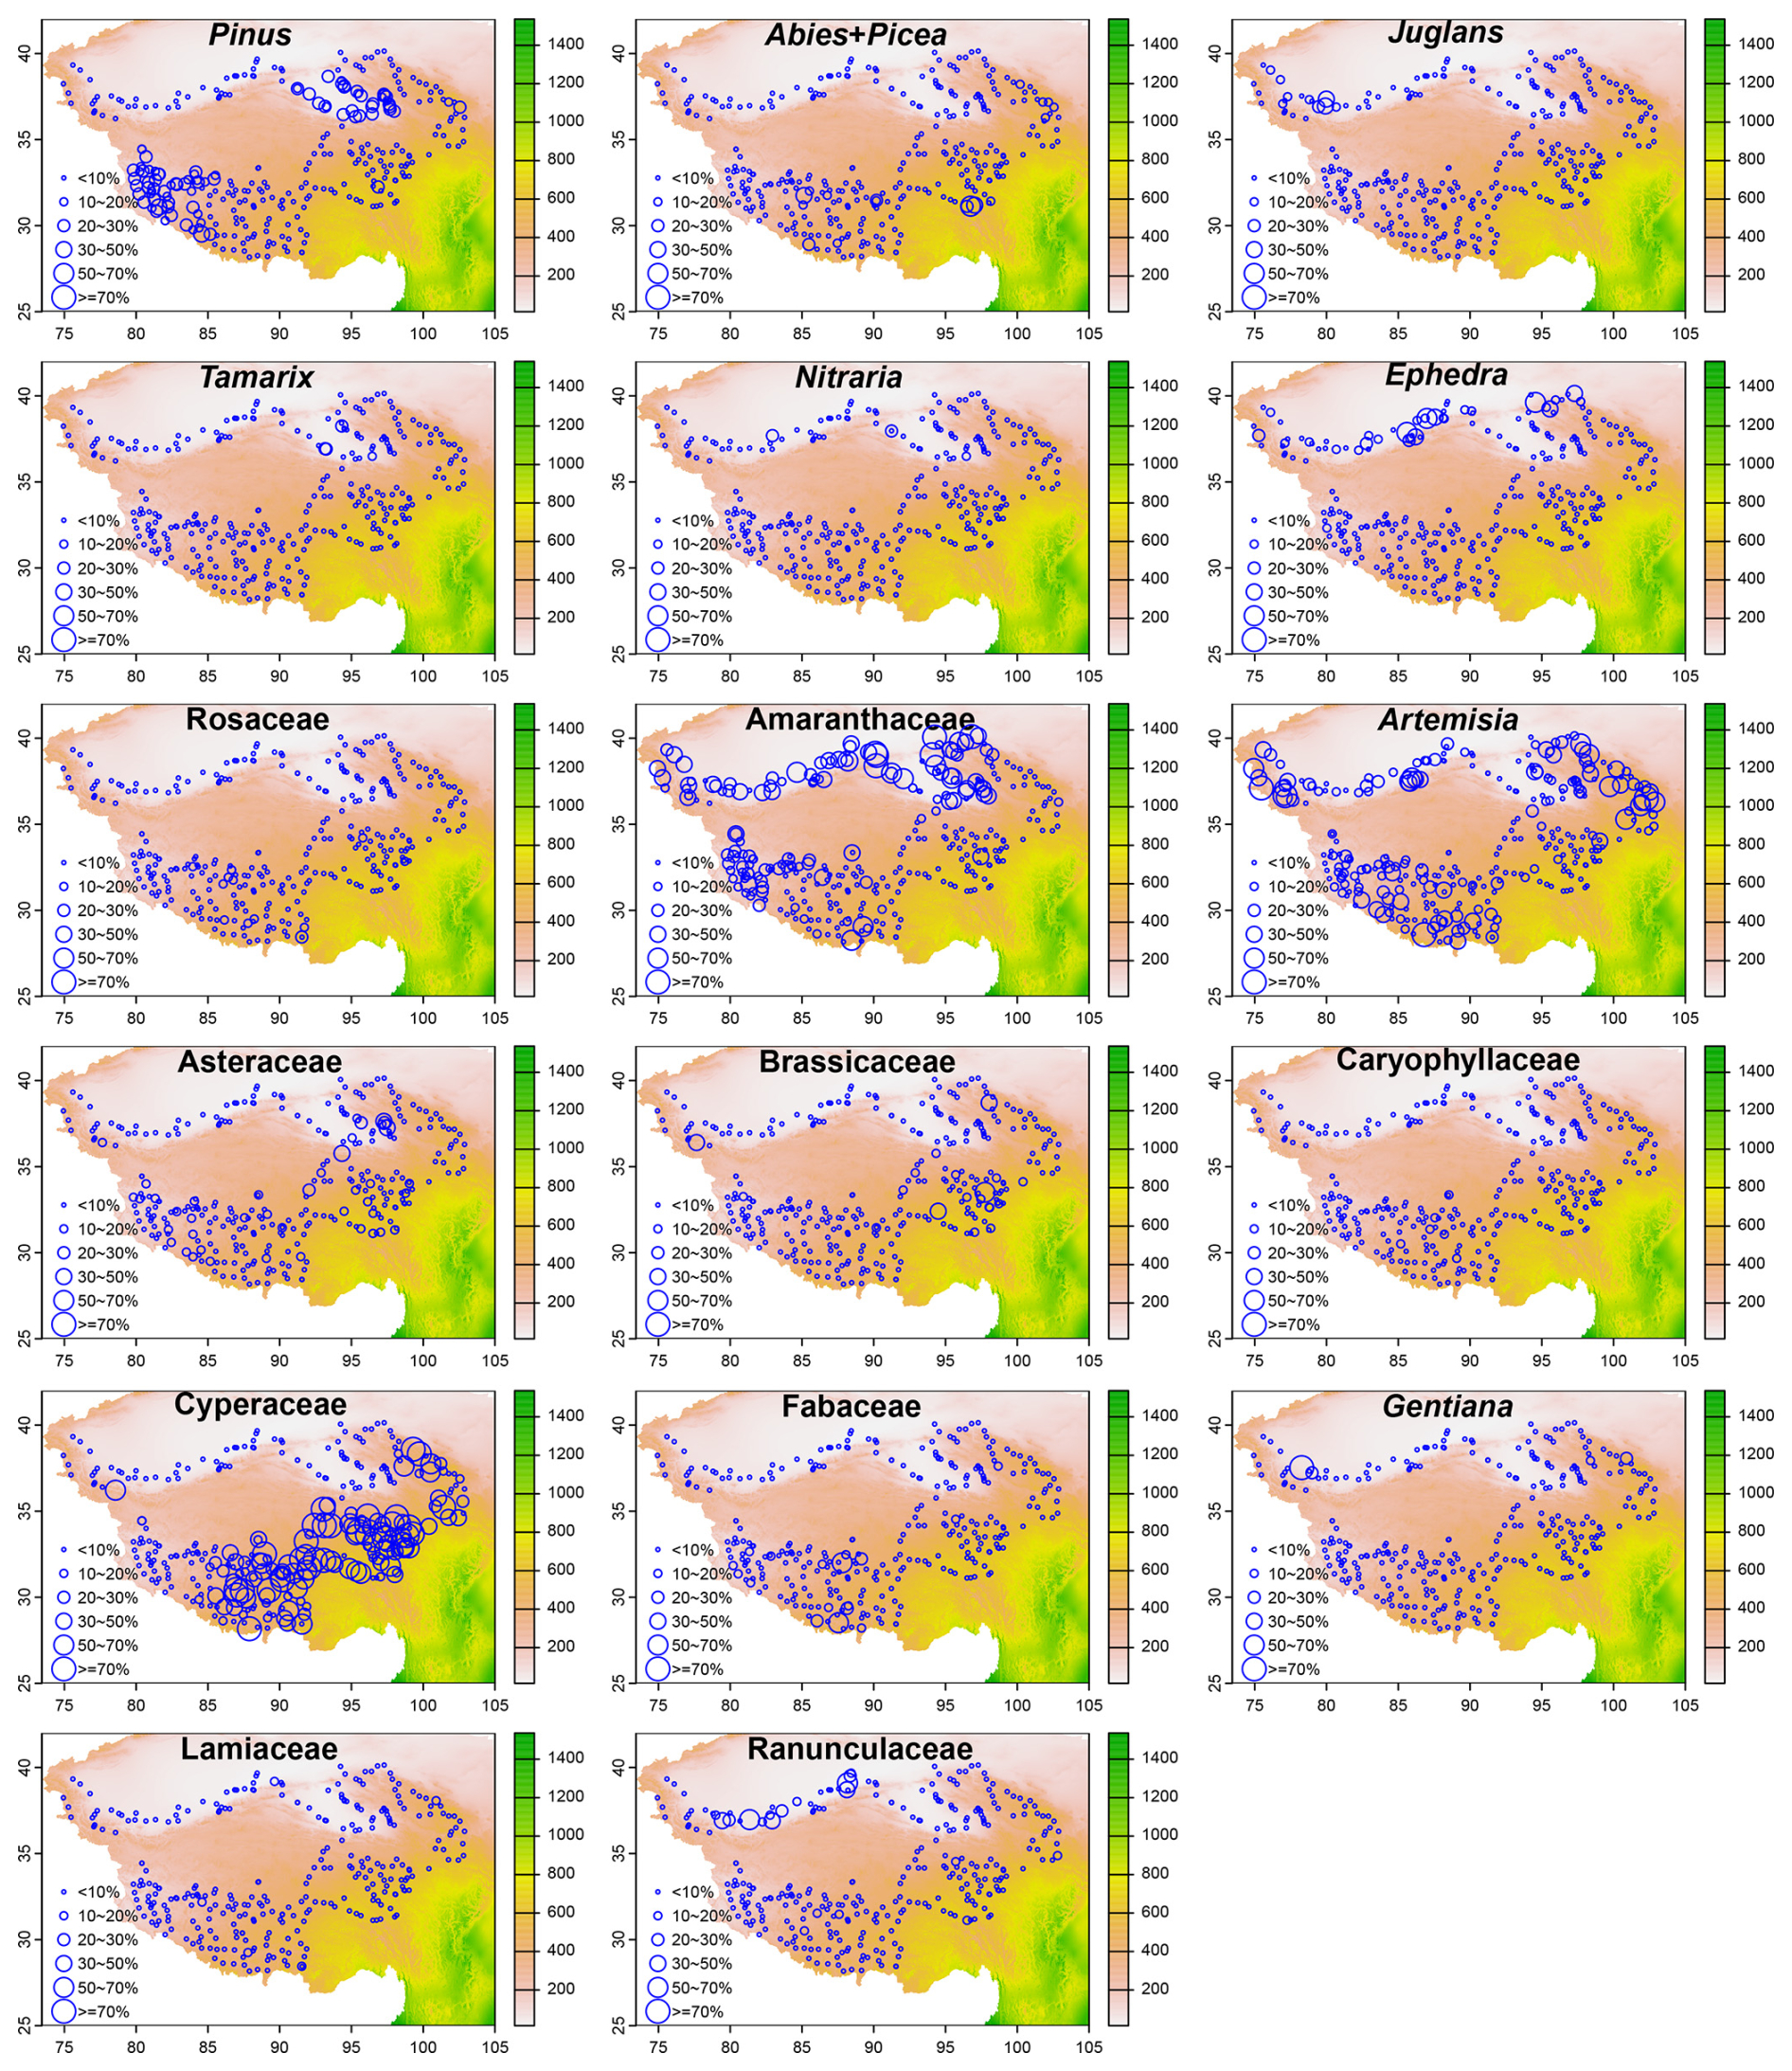
Figure 4Spatial distribution patterns of seventeen major pollen taxa (maximum percentage ≥ 10 % and ≥ 3 samples with percentage ≥10 %). The background map illustrates the distribution of annual precipitation (mm) across the study area (Hu et al., 2024).
The modern pollen dataset of TP has several potential uses, particularly for assessing the reliability of the pollen assemblages in reflecting climatic and vegetation changes (in terms of composition, vegetation coverage, functional traits, and biodiversity). Based on the distribution patterns of the main pollen taxa (Fig. 4) and the NMDS results (Fig. 5), it is possible to distinguish between sites with temperate vegetation and those with alpine vegetation, except for alpine deserts. Additionally, vegetation types with low precipitation or moisture requirements and high temperature seasonality can likely be distinguished, as indicated by the sites that score relatively high on the first axis (NMDS1) (Fig. 5). Pollen assemblages of these sites are characterized by relatively high percentages of Amaranthaceae, Ephedra, Nitraria, Aster, Tamarix, Pinus, Crassulaceae (Figs. 4, 5). However, sites representing different vegetation types within the alpine zone or within the temperate zone cannot be distinguished along the first two NMDS axes. Furthermore, even after the exclusion of arboreal pollen taxa and forested sampling sites from the dataset, distinguishing between these vegetation types remains impossible (Fig. 5). One potential cause is that in open landscapes, the pollen-source area expands and the proportion of long-distance dispersal pollen increases, leading to overlap between pollen assemblages among distinct vegetation types. Therefore, caution is warranted when using this pollen dataset to infer vegetation types. It should be noted that the first two NMDS axes cannot distinguish between samples collected from forested and non-forested areas (Fig. 5). This limitation may stem from several factors, including the partially nested distributions of these vegetation types, the long-distance dispersal of arboreal pollen taxa, and/or the limited sample size, which collectively reduce the accuracy of the pollen composition in representing forests.
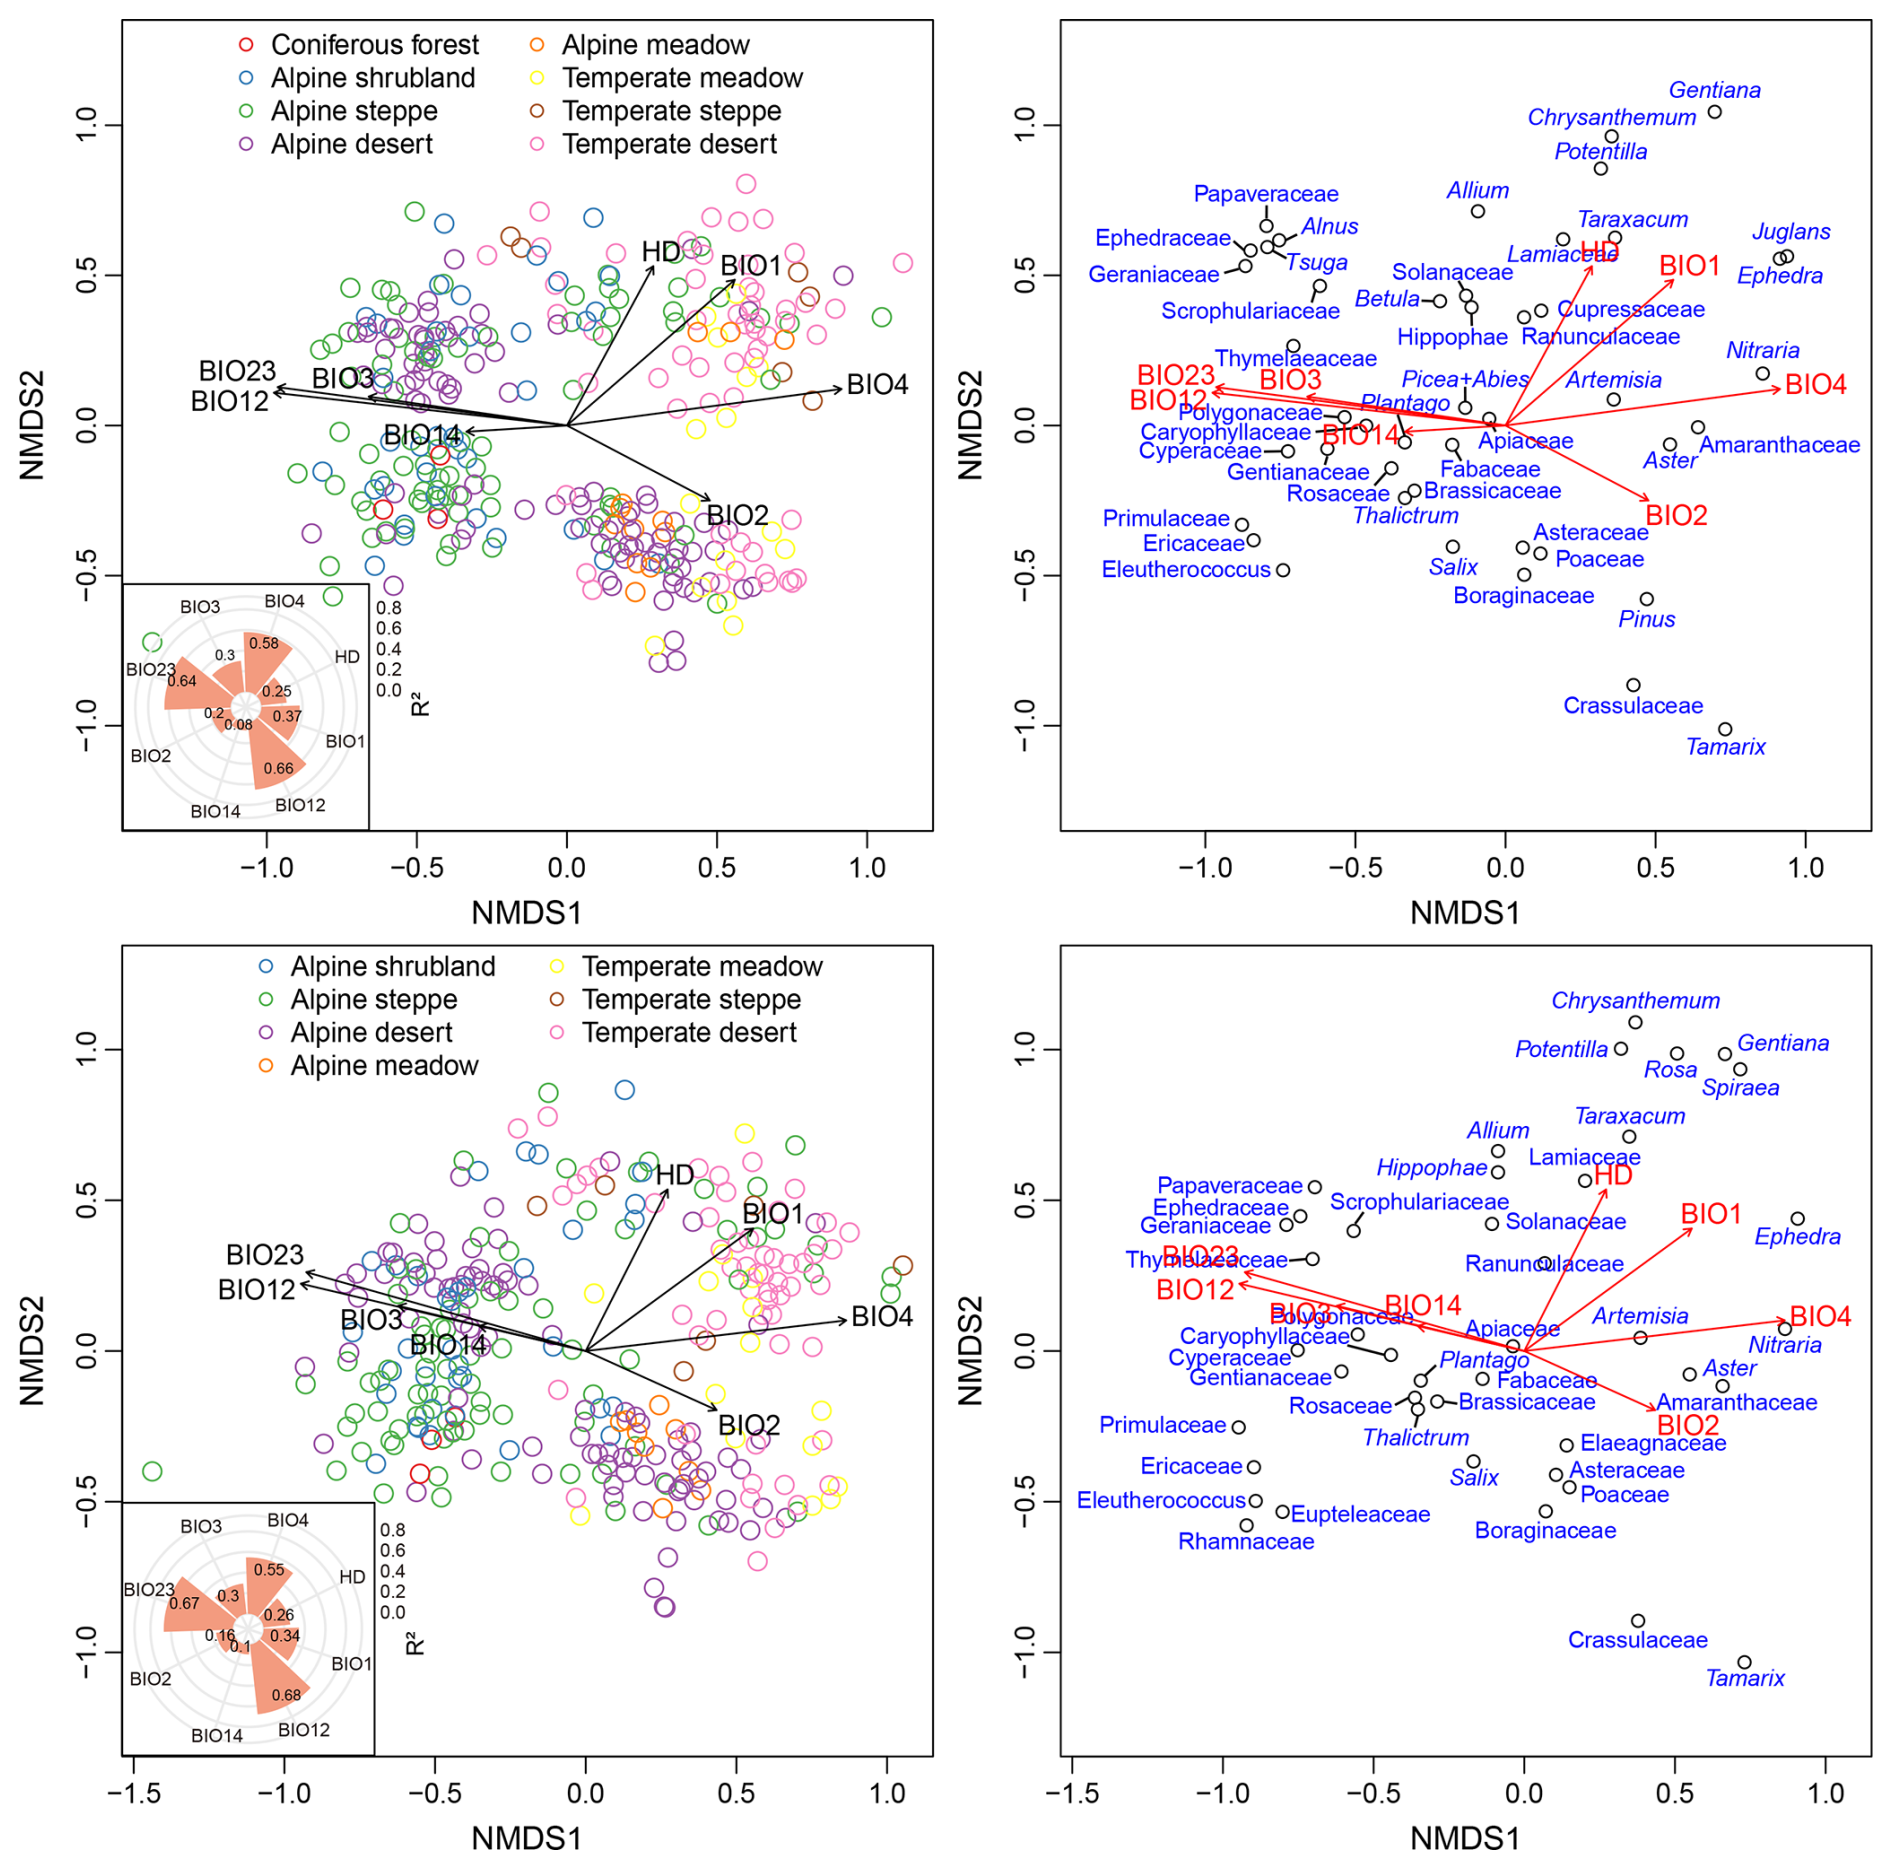
Figure 5Biplots for the non-metric multidimensional scaling (NMDS) displaying the sites (left panel) and the main pollen taxa (right panel). The inserted polar plots showing the coefficient of determination (R2) of the first two ordination axes to each selected bioclimatic variable and the intensity of human disturbance (HD). The upper panel displays the results from all sampling sites, while the lower panel shows the results excluding sites in coniferous forest, taxa from arboreal trees, and those with pollen counts of less than 200 grains. BIO1: Annual Mean Temperature, BIO2: Mean Diurnal Range, BIO3: Isothermality, BIO4: Temperature Seasonality, BIO12: Annual Precipitation, BIO14: Precipitation of Driest Month, BIO23: Moisture Index.
Multiple regression analyses reveal that all selected bioclimatic variables exhibit significant correlations (p<0.001) with the first two axes of the NMDS. These results support the findings from previous studies (Lu et al., 2011; Ma et al., 2024a), confirming that pollen assemblages on the TP can reliably estimate climatic parameters. Based on coefficient of determination (R2 values), BIO12 shows the strongest relationship with pollen composition across the study area, followed by BIO23 and BIO4, then BIO1 and BIO3 (Fig. 5). There are nine sites in our pollen dataset with pollen counts of fewer than 200 grains each. Additionally, samples collected from open landscapes, especially those originating from desert regions, contain a certain proportion of long-distance arboreal pollen taxa. These factors may adversely affect the accuracy of pollen assemblages in reflecting the surrounding vegetation, subsequently undermining the reliability of the relationship between pollen composition and climate. However, the results obtained using data that include only non-forest sampling sites, exclude arboreal pollen taxa, and have pollen counts exceeding 200 grains resemble those based on all data in the dataset (Fig. 5). This demonstrates that differences in the sampling density and pollen counts in our dataset have limited impact on the pollen-climate relationships. In addition, regression analysis indicates that HD explains a certain proportion of the variation in pollen composition (Fig. 5). This suggests that the signal of human disturbance may potentially be deciphered from the pollen data.
Pollen ratios have commonly been used to indicate changes in landscape and climate. GAMs reveal that the relationships of pollen ratios (except for Po A) with annual precipitation exhibit significant but weak correlations for each pair (Fig. 6). This demonstrates that, across the entire study area, none of these ratios are reliable indicators of annual precipitation changes (Fig. 6). However, when comparing these ratios across different vegetation types, it is evident that they can reflect changes in vegetation or landscape to some extent (Fig. 6). Specifically, the A Am ratio shows relatively high values in alpine shrubland, alpine desert, and alpine steppe. The A Cy ratio in alpine steppe, temperate steppe, and temperate desert displays distinctly high values compared to that in other vegetation types. The Po A ratio and Po (A+Am) ratio of samples from temperate steppe and temperate desert are notably low compared to samples from other vegetation types. The Cy Po ratio and Cy (Po+A) ratio reflect a similar pattern across vegetation types, showing relatively high values in alpine shrubland and alpine desert.
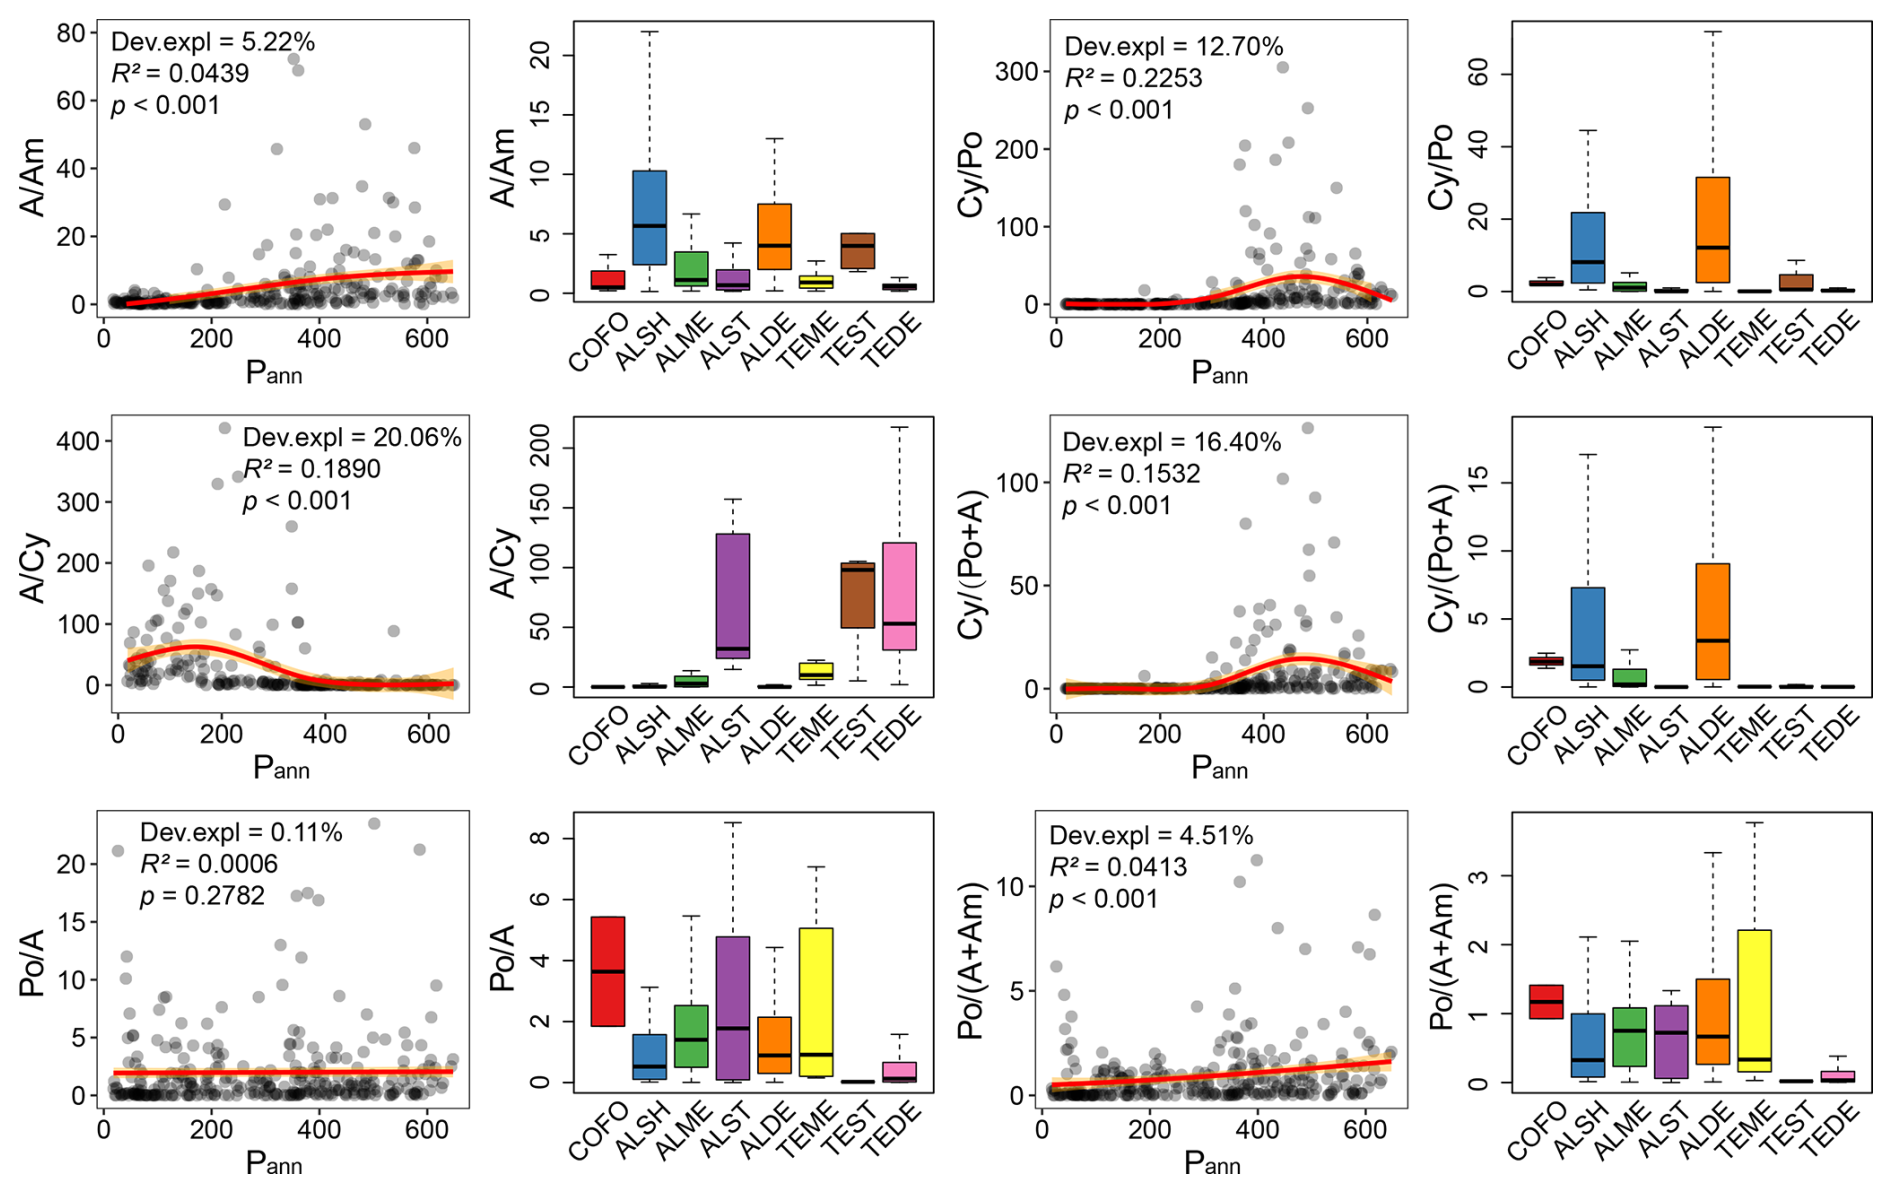
Figure 6Results from the generalized additive models (GAMs) illustrating relationships between of pollen ratios to annual precipitation (Pann, mm) and boxplots comparing pollen ratio across different vegetation types. COFO: coniferous forest, ALSH: alpine shrub, ALME: alpine meadow, ALST: alpine steppe, ALDE: alpine desert, TEME: temperate meadow, TEST: temperate steppe, TEDE: temperate desert.
A current theme in pollen analysis research is the quantitative reconstruction of land cover using models of the relationships between pollen assemblages and the surrounding vegetation (Sugita, 2007a, b; Xu et al., 2016; Liu et al., 2023). Previous studies have demonstrated the potential of pollen assemblages to reflect dynamics of vegetation cover on the central and eastern TP (Liu et al., 2023) and on the northeastern TP (Wang et al., 2023). The samples recorded in our dataset distribute across a wide spatial range, spanning from the southwest to the northeast of TP, and are accompanied by the published plot-level vegetation data, which includes species identities, the abundance and/or cover degree of each species (Jin et al., 2022). Therefore, we believe that the combination of our dataset with the published plant community dataset will undoubtedly benefit relevant research conducted on a broader scale. Besides, Liu et al. (2023) proposed that pollen concentration is superior to pollen percentage for the quantitative reconstruction of vegetation cover. Our dataset includes the dry weight of each sample alongside the counted numbers of Lycopodium spores in each sample, which allows the estimation of the pollen concentration for each sample or site. Consequently, we believe that this dataset holds the potential to improve the accuracy of vegetation cover reconstruction on TP.
Pollen-assemblage diversity has been extensively applied to reconstruct variations in floristic diversity over time, although the reliability of the modern pollen-plant diversity relationship varies considerably among different regions (Meltsov et al., 2011; Goring et al., 2013; Felde et al., 2016; Reitalu et al., 2019; Connor et al., 2021; Cui et al., 2023; Liao et al., 2024). This modern pollen dataset, coupled with its corresponding plant community dataset (Jin et al., 2022), has already been used to investigate the associations between pollen richness and evenness and plot-level plant richness and evenness, as well as with climatic variables, landscape characteristics, and human disturbances (Liao et al., 2024). Further research can delve into other diversity metrics, such as the Shannon index (or Shannon-Wiener index), and β diversity indices, to comprehensively assess the reliability of the pollen-plant diversity relationship on TP.
In recent years, trait paleoecology, which couples modern data on plant functional traits to fossil pollen assemblages, has aroused widespread interest among palynologists and paleoecologists (Carvalho et al., 2019; Birks, 2020; Adeleye et al., 2023; Wang et al., 2024). Our dataset, along with corresponding datasets on plot-level functional traits (Jin et al., 2023) and plant communities (Jin et al., 2022), provides a valuable opportunity to assess the reliability of this approach in reflecting the long-term ecological properties of ecosystems on TP. Phylogenetic diversity, another aspect of biodiversity, has rarely been used in pollen analysis but has potential to enhance our understanding of long-term patterns of community assembly (Blaus et al., 2020). By leveraging published phylogeny data for tens of thousands of plant species (Zanne et al., 2014; Smith and Brown, 2018), it is possible to use our modern dataset and the corresponding plant community dataset to evaluate the relationships between phylogenetic diversity estimated from pollen and plant assemblages. Such an assessment can further provide a foundation for applying this approach to elucidate community responses to long-term changes in climate and human disturbance.
The dataset includes pollen count data of each sample and each site, along with geographic coordinates, altitude, and local vegetation type. The dataset is openly accessible at https://doi.org/10.11888/Paleoenv.tpdc.302015 (Liao and Ni, 2025).
We present and analyse 555 pollen data, identified from topsoil collected within plant plots across a vast area of TP and along the southern margin of Xinjiang that borders the plateau. This dataset provides count data for each pollen taxon in each sample and site, along with location details (latitude, longitude, altitude) of each sampling site. Ordination analysis and multiple regression reveal that annual precipitation, moisture index, and temperature seasonality are the primary factors influencing the spatial distribution of pollen assemblages across the entire study area. Additionally, ordination analysis demonstrates that samples from coniferous forest, alpine shrubland, and alpine meadow can be distinguished from those from other vegetation types, while samples from arid ecosystems (characterized by low precipitation moisture availability and high temperature seasonality) are also clearly separable from the remaining samples in the dataset. Generalized additive models demonstrate that the six commonly used pollen ratios (A Am, A Cy, Po A, Cy Po, Cy (Po+A), and Po (A+Am)) are not sufficiently reliable in reflecting precipitation changes at a geographical scale across the entire study area. Nevertheless, they can provide some insight into changes in vegetation or landscape. In addition to reconstructing changes in climate and vegetation, this modern pollen dataset can also be used to assess the reliability of pollen assemblages in representing dynamics of vegetation cover, functional traits, and plant diversity (from taxonomic diversity to functional and genetic diversity), by integrating corresponding datasets of plot-level plant communities and functional traits. The modern pollen dataset presented here encompasses the majority of the TP, with the exception of the Hoh Xil uninhabited area in the northern hinterland of the plateau and forested areas in the southeastern part. It fills a geographical gap in the published datasets that provide pollen count data for TP and its surrounding areas. In addition, our team has collected 314 topsoil samples from the Hengduan Mountains, a region characterized by its morphometric complexity and the largest elevation difference in the southeastern part of the plateau. We are currently in the process of identifying pollen from these samples and hope to soon incorporate them into the existing pollen datasets from TP.
ML, KL and JN designed the study. KL led the field trip. KL and YJ collected the samples. XC, LL and KL treated the samples and guided the pollen identification. ML analysed the data and drafted the manuscript. KL, JN, YJ, LL and XC reviewed the manuscript.
The contact author has declared that none of the authors has any competing interests.
Publisher’s note: Copernicus Publications remains neutral with regard to jurisdictional claims made in the text, published maps, institutional affiliations, or any other geographical representation in this paper. While Copernicus Publications makes every effort to include appropriate place names, the final responsibility lies with the authors. Also, please note that this paper has not received English language copy-editing. Views expressed in the text are those of the authors and do not necessarily reflect the views of the publisher.
We thank Xinxin Zhou, Ang Liu, Linfeng Wei, Kai Wu, Jie Xia, Haoyan Wang, Deyu Xu, Lobsang Thubten, Budorje Tsedan, Pingyu Sun, Yezi Sheng, Borui Zhou, Jing Hu, Ying Hou, Yang Yang, Hailu Zhong, and all the other students for their assistance with plant investigation and sample collection during the field work from 2018 to 2021, as well as with pretreatment in the labs. We appreciate Nannan Wang, Yaqin Hu, and Yumei Li for their help with pollen identification.
This research was financially supported by the Second Tibetan Plateau Scientific Expedition and Research Program (grant no. 2019QZKK0402) and the Strategic Priority Research Program of the Chinese Academy of Sciences (grant no. XDA2009000003).
This paper was edited by Hanqin Tian and reviewed by three anonymous referees.
Adeleye, M. A., Haberle, S. G., Gallagher, R., Andrew, S. C., and Herbert, A.: Changing plant functional diversity over the last 12,000 years provides perspectives for tracking future changes in vegetation communities, Nat. Ecol. Evol., 7, 224–235, https://doi.org/10.1038/s41559-022-01943-4, 2023.
Birks, H. J. B.: Reflections on the use of ecological attributes and traits in quaternary botany, Front. Ecol. Evol., 8, 166, https://doi.org/10.3389/fevo.2020.00166, 2020.
Blaus, A., Reitalu, T., Gerhold, P., Hiiesalu, I., Massante, J. C., and Veski, S.: Modern pollen–plant diversity relationships inform Palaeoecological reconstructions of functional and phylogenetic diversity in calcareous fens, Front. Ecol. Evol., 8, 207, https://doi.org/10.3389/fevo.2020.00207, 2020.
Cao, X.-Y., Herzschuh, U., Telford, R. J., and Ni, J.: A modern pollen–climate dataset from China and Mongolia: Assessing its potential for climate reconstruction, Rev. Palaeobot. Palynol., 211, 87–96, https://doi.org/10.1016/j.revpalbo.2014.08.007, 2014.
Cao, X., Tian, F., Li, K., Ni, J., Yu, X., Liu, L., and Wang, N.: Lake surface sediment pollen dataset for the alpine meadow vegetation type from the eastern Tibetan Plateau and its potential in past climate reconstructions, Earth Syst. Sci. Data, 13, 3525–3537, https://doi.org/10.5194/essd-13-3525-2021, 2021.
Carvalho, F., Brown, K. A., Waller, M. P., Bunting, M. J., Boom, A., and Leng, M. J.: A method for reconstructing temporal changes in vegetation functional trait composition using Holocene pollen assemblages, PLoS One, 14, e0216698, https://doi.org/10.1371/journal.pone.0216698, 2019.
Chen, D. L., Xu, B. Q., Yao, T. D., Guo, Z. T., Peng, C., Chen, F. H., Zhang, R. H., Zhang, X. Z., Zhang, Y. L., and Jie, F.: Assessment of past, present and future environmental changes on the Tibetan Plateau, Chin. Sci. Bull., 60, 3025–3035, https://doi.org/10.1360/N972014-01370, 2015 (in Chinese).
Chen, H.-Y., Xu, D.-Y., Liao, M.-N., Li, K., Ni, J., Cao, X.-Y., Cheng, B., Hao, X.-D., Kong, Z.-C., and Li, S.-F.: A modern pollen dataset of China, Chin. J. Plant Ecol., 45, 799–808, https://doi.org/10.17521/cjpe.2021.0024, 2021 (in Chinese).
Connor, S. E., van Leeuwen, J. F., van der Knaap, W., Akindola, R. B., Adeleye, M. A., and Mariani, M.: Pollen and plant diversity relationships in a Mediterranean montane area, Veg. Hist. Archaeobot., 30, 583–594, https://doi.org/10.1007/s00334-020-00811-0, 2021.
Cui, A., Fan, B., Xu, D., Zheng, Z., Xu, Q., Luo, Y., Huang, K., Li, Y., Shen, C., and Cao, X.: The quality assessment, integration and application of Chinese modern pollen datasets, Quat. Sci., 44, 605–622, https://doi.org/10.11928/j.issn.1001-7410.2024.03.01, 2024 (in Chinese).
Cui, Y., Qin, F., Zhao, Y., Cui, Q., Geng, R., and Li, Q.: Does palynological diversity reflect floristic diversity? A case study from Northeast China, Sci. China Earth Sci., 66, 2097–2108, https://doi.org/10.1007/s11430-022-1131-y, 2023.
Davis, B. A., Zanon, M., Collins, P., Mauri, A., Bakker, J., Barboni, D., Barthelmes, A., Beaudouin, C., Bjune, A. E., and Bozilova, E.: The European modern pollen database (EMPD) project, Veg. Hist. Archaeobot., 22, 521–530, https://doi.org/10.1007/s00334-012-0388-5, 2013.
Davis, B. A. S., Chevalier, M., Sommer, P., Carter, V. A., Finsinger, W., Mauri, A., Phelps, L. N., Zanon, M., Abegglen, R., Åkesson, C. M., Alba-Sánchez, F., Anderson, R. S., Antipina, T. G., Atanassova, J. R., Beer, R., Belyanina, N. I., Blyakharchuk, T. A., Borisova, O. K., Bozilova, E., Bukreeva, G., Bunting, M. J., Clò, E., Colombaroli, D., Combourieu-Nebout, N., Desprat, S., Di Rita, F., Djamali, M., Edwards, K. J., Fall, P. L., Feurdean, A., Fletcher, W., Florenzano, A., Furlanetto, G., Gaceur, E., Galimov, A. T., Gałka, M., García-Moreiras, I., Giesecke, T., Grindean, R., Guido, M. A., Gvozdeva, I. G., Herzschuh, U., Hjelle, K. L., Ivanov, S., Jahns, S., Jankovska, V., Jiménez-Moreno, G., Karpińska-Kołaczek, M., Kitaba, I., Kołaczek, P., Lapteva, E. G., Latałowa, M., Lebreton, V., Leroy, S., Leydet, M., Lopatina, D. A., López-Sáez, J. A., Lotter, A. F., Magri, D., Marinova, E., Matthias, I., Mavridou, A., Mercuri, A. M., Mesa-Fernández, J. M., Mikishin, Y. A., Milecka, K., Montanari, C., Morales-Molino, C., Mrotzek, A., Muñoz Sobrino, C., Naidina, O. D., Nakagawa, T., Nielsen, A. B., Novenko, E. Y., Panajiotidis, S., Panova, N. K., Papadopoulou, M., Pardoe, H. S., Pędziszewska, A., Petrenko, T. I., Ramos-Román, M. J., Ravazzi, C., Rösch, M., Ryabogina, N., Sabariego Ruiz, S., Salonen, J. S., Sapelko, T. V., Schofield, J. E., Seppä, H., Shumilovskikh, L., Stivrins, N., Stojakowits, P., Svobodova Svitavska, H., Święta-Musznicka, J., Tantau, I., Tinner, W., Tobolski, K., Tonkov, S., Tsakiridou, M., Valsecchi, V., Zanina, O. G., and Zimny, M.: The Eurasian Modern Pollen Database (EMPD), version 2, Earth Syst. Sci. Data, 12, 2423–2445, https://doi.org/10.5194/essd-12-2423-2020, 2020.
Ding, W.-N., Ree, R. H., Spicer, R. A., and Xing, Y.-W.: Ancient orogenic and monsoon-driven assembly of the world's richest temperate alpine flora, Science, 369, 578–581, https://doi.org/10.1126/science.abb4484, 2020.
Ehlers, T. A., Chen, D., Appel, E., Bolch, T., Chen, F., Diekmann, B., Dippold, M. A., Giese, M., Guggenberger, G., and Lai, H.-W.: Past, present, and future geo-biosphere interactions on the Tibetan Plateau and implications for permafrost, Earth-Sci. Rev., 234, 104197, https://doi.org/10.1016/j.earscirev.2022.104197, 2022.
Felde, V. A., Peglar, S. M., Bjune, A. E., Grytnes, J.-A., and Birks, H. J. B.: Modern pollen–plant richness and diversity relationships exist along a vegetational gradient in southern Norway, Holocene, 26, 163–175, https://doi.org/10.1177/0959683615596843, 2016.
Flantua, S. G., Hooghiemstra, H., Grimm, E. C., Behling, H., Bush, M. B., González-Arango, C., Gosling, W. D., Ledru, M.-P., Lozano-García, S., and Maldonado, A.: Updated site compilation of the Latin American pollen database, Rev. Palaeobot. Palynol., 223, 104–115, https://doi.org/10.1016/j.revpalbo.2015.09.008, 2015.
Fyfe, R. M., Woodbridge, J., and Roberts, N.: From forest to farmland: pollen-inferred land cover change across Europe using the pseudobiomization approach, Glob. Change Biol., 21, 1197–1212, https://doi.org/10.1111/gcb.12776, 2015.
Gao, J., Hou, G., Xiao, Y., E, C., Wei, H., Sun, Y., Sun, M., Xue, H., Wende, Z., and Jin, S.: Vegetation history and survival patterns of the earliest village on the Qinghai–Tibetan Plateau, Front. Plant Sci., 13, 903192, https://doi.org/10.3389/fpls.2022.903192, 2022.
Goring, S., Lacourse, T., Pellatt, M. G., and Mathewes, R. W.: Pollen assemblage richness does not reflect regional plant species richness: a cautionary tale, J. Ecol., 101, 1137–1145, https://doi.org/10.1111/1365-2745.12135, 2013.
Hastie, T. and Tibshirani, R.: Generalized additive models: some applications, J. Am. Stat. Assoc. 82, 371–386, https://doi.org/10.1080/01621459.1987.10478440, 1987.
Herzschuh, U., Kramer, A., Mischke, S., and Zhang, C.: Quantitative climate and vegetation trends since the late glacial on the northeastern Tibetan Plateau deduced from Koucha Lake pollen spectra, Quat. Res., 71, 162–171, https://doi.org/10.1016/j.yqres.2008.09.003, 2009.
Herzschuh, U., Birks, H., Mischke, S., Zhang, C., and Böhner, J.: A modern pollen–climate calibration set based on lake sediments from the Tibetan Plateau and its application to a Late Quaternary pollen record from the Qilian Mountains, J. Biogeogr., 37, 752–766, https://doi.org/10.1111/j.1365-2699.2009.02245.x, 2010.
Hu, X., Shi, S., Zhou, B., and Ni, J.: A 1 km monthly dataset of historical and future climate changes over China, Science Data Bank [data set], https://cstr.cn/31253.11.sciencedb.13546, 2024.
Jin, Y.-L., Wang, H.-Y., Wei, L.-F., Hou, Y., Hu, J., Wu, K., Xia, H.-J., Xia, J., Zhou, B.-R., Li, K., and Ni, J.: A plot-based dataset of plant community on the Qingzang Plateau, Chin. J. Plant Ecol., 46, 846–854, https://doi.org/10.17521/cjpe.2022.0174, 2022 (in Chinese).
Jin, Y., Wang, H., Xia, J., Ni, J., Li, K., Hou, Y., Hu, J., Wei, L., Wu, K., Xia, H., and Zhou, B.: TiP-Leaf: a dataset of leaf traits across vegetation types on the Tibetan Plateau, Earth Syst. Sci. Data, 15, 25–39, https://doi.org/10.5194/essd-15-25-2023, 2023.
Kaufman, D. S. and Broadman, E.: Revisiting the Holocene global temperature conundrum, Nature, 614, 425–435, https://doi.org/10.1038/s41586-022-05536-w, 2023.
Li, Z., Wang, Y., Herzschuh, U., Cao, X., Ni, J., and Zhao, Y.: Pollen-based biome reconstruction on the Qinghai-Tibetan Plateau during the past 15,000 years, Palaeogeogr. Palaeoclimatol. Palaeoecol., 604, 111190, https://doi.org/10.1016/j.palaeo.2022.111190, 2022.
Liao, M. and Ni, J.: A dataset of modern pollen on the Tibetan Plateau (2018–2021), National Tibetan Plateau/Third Pole Environment Data Center [data set], https://doi.org/10.11888/Paleoenv.tpdc.302015, 2025.
Liao, M., Jin, Y., Li, K., Liu, L., Wang, N., Ni, J., and Cao, X.: Modern pollen-plant diversity relationship in open landscapes of Tibetan Plateau, Palaeogeogr. Palaeoclimatol. Palaeoecol., 641, 112131, https://doi.org/10.1016/j.palaeo.2024.112131, 2024.
Liu, L., Wang, N., Zhang, Y., Yu, X., and Cao, X.: Performance of vegetation cover reconstructions using lake and soil pollen samples from the Tibetan Plateau, Veg. Hist. Archaeobot., 32, 157–169, https://doi.org/10.1007/s00334-022-00891-0, 2023.
Liu, L., Wang, N., Zhang, Y., Liang, J., Ni, J., and Cao, X.: Spatial and temporal variations of vegetation cover on the central and eastern Tibetan Plateau since the Last glacial period, Glob. Planet. Change, 240, 104536, https://doi.org/10.1016/j.gloplacha.2024.104536, 2024.
Lu, H., Wu, N., Liu, K.-b., Zhu, L., Yang, X., Yao, T., Wang, L., Li, Q., Liu, X., and Shen, C.: Modern pollen distributions in Qinghai-Tibetan Plateau and the development of transfer functions for reconstructing Holocene environmental changes, Quat. Sci. Rev., 30, 947–966, https://doi.org/10.1016/j.quascirev.2011.01.008, 2011.
Ma, L., Li, Z., Xu, Q., Li, H., Zhang, K., Li, Y., Zhang, R., Cao, X., and Zhang, S.: Modern pollen assemblages from the hinterland of the Tibetan Plateau and their significance for reconstructions of past vegetation, Boreas, 53, 42–55, https://doi.org/10.1111/bor.12641, 2024a.
Ma, Q., Zhu, L., Ju, J., Wang, J., Wang, Y., Huang, L., and Haberzettl, T.: A modern pollen dataset from lake surface sediments on the central and western Tibetan Plateau, Earth Syst. Sci. Data, 16, 311–320, https://doi.org/10.5194/essd-16-311-2024, 2024b.
Meltsov, V., Poska, A., Odgaard, B. V., Sammul, M., and Kull, T.: Palynological richness and pollen sample evenness in relation to local floristic diversity in southern Estonia, Rev. Palaeobot. Palynol., 166, 344–351, https://doi.org/10.1016/j.revpalbo.2011.06.008, 2011.
Moore, P. D., Webb, J. A., and Collison, M. E. (Eds.): Pollen Analysis, 2nd Edn., Blackwell Scientific Publications, Oxford, UK, 216 pp., ISBN 0632021764, 1991.
Nakagawa, T., Brugiapaglia, E., Digerfeldt, G., Reille, M., Beaulieu, J. L. D., and Yasuda, Y.: Dense-media separation as a more efficient pollen extraction method for use with organic sediment/deposit samples: comparison with the conventional method, Boreas, 27, 15–24, https://doi.org/10.1111/j.1502-3885.1998.tb00864.x, 1998.
Odgaard, B. V.: Fossil pollen as a record of past biodiversity, J. Biogeogr., 26, 7–17, https://doi.org/10.1046/j.1365-2699.1999.00280.x, 1999.
Oksanen, J., Simpson, G., Blanchet, F., Kindt, R., Legendre, P., Minchin, P., O'Hara, R., Solymos, P., Stevens, M., Szoecs, E., Wagner, H., Barbour, M., Bedward, M., Bolker, B., Borcard, D., Carvalho, G., Chirico, M., De Caceres, M., Durand, S., Evangelista, H., FitzJohn, R., Friendly, M., Furneaux, B., Hannigan, G., Hill, M., Lahti, L., McGlinn, D., Ouellette, M., Ribeiro Cunha, E., Smith, T., Stier, A., Ter Braak, C., and Weedon, J.: vegan: Community Ecology Package, R package version 2.6-2 [code], https://CRAN.R-project.org/package=vegan, 2022.
Prentice, C., Guiot, J., Huntley, B., Jolly, D., and Cheddadi, R.: Reconstructing biomes from palaeoecological data: a general method and its application to European pollen data at 0 and 6 ka, Clim. Dyn., 12, 185–194, https://doi.org/10.1007/BF00211617, 1996.
Reitalu, T., Bjune, A. E., Blaus, A., Giesecke, T., Helm, A., Matthias, I., Peglar, S. M., Salonen, J. S., Seppä, H., and Väli, V.: Patterns of modern pollen and plant richness across northern Europe, J. Ecol., 107, 1662–1677, https://doi.org/10.1111/1365-2745.13134, 2019.
Smith, S. A. and Brown, J. W.: Constructing a broadly inclusive seed plant phylogeny, Am. J. Bot., 105, 302–314, https://doi.org/10.1002/ajb2.1019, 2018.
Sugita, S.: Theory of quantitative reconstruction of vegetation I: pollen from large sites REVEALS regional vegetation composition, Holocene, 17, 229–241, https://doi.org/10.1177/0959683607075837, 2007a.
Sugita, S.: Theory of quantitative reconstruction of vegetation II: all you need is LOVE, Holocene, 17, 243–257, https://doi.org/10.1177/0959683607075838, 2007b.
Tang, L., Mao, L., Shu, J., Li, C., Shen, C., and Zhou, Z. (Eds.): An Illustrated Handbook of Quaternary Pollen and Spores in China, Science Press, Beijing, 620 pp., ISBN 9787030505682, 2016.
Wang, F., Qian, N., Zhang, Y., and Yang, H. (Eds.): Pollen Flora of China, 2nd Edn., Science Press, Beijing, 461 pp., ISBN 7030036352, 1995.
Wang, H., Jin, Y., Li, K., Liao, M., Liu, Y., Ma, C., Ye, W., Zhang, Y., Luo, Y., and Ni, J.: Holocene Neolithic human activity shaped ecosystem functions through the altering of vegetation traits in Zhejiang, eastern China, Quat. Sci. Rev., 335, 108762, https://doi.org/10.1016/j.quascirev.2024.108762, 2024.
Wang, N., Liu, L., Zhang, Y., and Cao, X.: A modern pollen data set for the forest–meadow–steppe ecotone from the Tibetan Plateau and its potential use in past vegetation reconstruction, Boreas, 51, 847–858, https://doi.org/10.1111/bor.12589, 2022.
Wang, T., Huang, X., Zhang, J., Luo, D., Zheng, M., Xiang, L., Sun, M., Ren, X., Sun, Y., and Zhang, S.: Vegetation cover dynamics on the northeastern Qinghai-Tibet Plateau since late Marine Isotope Stage 3, Quat. Sci. Rev., 318, 108292, https://doi.org/10.1016/j.quascirev.2023.108292, 2023.
Weng, C., Hooghiemstra, H., and Duivenvoorden, J. F.: Challenges in estimating past plant diversity from fossil pollen data: statistical assessment, problems, and possible solutions, Divers. Distrib., 12, 310–318, https://doi.org/10.1111/j.1366-9516.2006.00230.x, 2006.
Whitmore, J., Gajewski, K., Sawada, M., Williams, J., Shuman, B., Bartlein, P., Minckley, T., Viau, A., Webb Iii, T., and Shafer, S.: Modern pollen data from North America and Greenland for multi-scale paleoenvironmental applications, Quat. Sci. Rev., 24, 1828–1848, https://doi.org/10.1016/j.quascirev.2005.03.005, 2005.
Wood, S. N.: Fast stable restricted maximum likelihood and marginal likelihood estimation of semiparametric generalized linear models, J. R. Stat. Soc., B: Stat. Methodol., 73, 3–36, https://doi.org/10.1111/j.1467-9868.2010.00749.x, 2011.
Xu, Q., Zhang, S., Gaillard, M.-J., Li, M., Cao, X., Tian, F., and Li, F.: Studies of modern pollen assemblages for pollen dispersal-deposition-preservation process understanding and for pollen-based reconstructions of past vegetation, climate, and human impact: A review based on case studies in China, Quat. Sci. Rev., 149, 151–166, https://doi.org/10.1016/j.quascirev.2016.07.017, 2016.
Yao, T., Thompson, L. G., Mosbrugger, V., Zhang, F., Ma, Y., Luo, T., Xu, B., Yang, X., Joswiak, D. R., and Wang, W.: Third pole environment (TPE), Environ. Dev., 3, 52–64, https://doi.org/10.1016/j.envdev.2012.04.002, 2012.
Yu, G., Tang, L., Yang, X., Ke, X., and Harrison, S. P.: Modern pollen samples from alpine vegetation on the Tibetan Plateau, Glob. Ecol. Biogeogr., 10, 503–519, https://doi.org/10.1046/j.1466-822X.2001.00258.x, 2001.
Zanne, A. E., Tank, D. C., Cornwell, W. K., Eastman, J. M., Smith, S. A., FitzJohn, R. G., McGlinn, D. J., O'Meara, B. C., Moles, A. T., and Reich, P. B.: Three keys to the radiation of angiosperms into freezing environments, Nature, 506, 89–92, https://doi.org/10.1038/nature12872, 2014.
Zhang, N., Cao, X., Xu, Q., Huang, X., Herzschuh, U., Shen, Z., Peng, W., Liu, S., Wu, D., and Wang, J.: Vegetation change and human-environment interactions in the Qinghai Lake Basin, northeastern Tibetan Plateau, since the last deglaciation, Catena, 210, 105892, https://doi.org/10.1016/j.catena.2021.105892, 2022.
Zhang, X. (Ed.): Vegetation Map of the People's Republic of China (1:1 000 000), Geology Press, Beijing, 274 pp., ISBN 9787116045132, 2007.
Zhang, Y., Li, B., Liu, L., and Zheng, D.: Redetermine the region and boundaries of Tibetan Plateau, Geogr. Res., 40, 1543–1553, https://doi.org/10.11821/dlyj020210138, 2021 (in Chinese).
Zheng, Z., Wei, J., Huang, K., Xu, Q., Lu, H., Tarasov, P., Luo, C., Beaudouin, C., Deng, Y., and Pan, A.: East Asian pollen database: modern pollen distribution and its quantitative relationship with vegetation and climate, J. Biogeogr., 41, 1819–1832, https://doi.org/10.1111/jbi.12361, 2014.
Zhou, S., Zhang, J., Cheng, B., Zhu, H., and Lin, J.: Holocene pollen record from Lake Gahai, NE Tibetan Plateau and its implications for quantitative reconstruction of regional precipitation, Quat. Sci. Rev., 326, 108504, https://doi.org/10.1016/j.quascirev.2024.108504, 2024.
Zhu, C., Ma, C., YU, S. Y., Tang, L., Zhang, W., and Lu, X.: A detailed pollen record of vegetation and climate changes in Central China during the past 16 000 years, Boreas, 39, 69–76, https://doi.org/10.1111/j.1502-3885.2009.00098.x, 2010.