the Creative Commons Attribution 4.0 License.
the Creative Commons Attribution 4.0 License.
 | 10 Oct 2025
ReefTEMPS: the Pacific Islands coastal temperature network
Romain Le Gendre
David Varillon
Sylvie Fiat
Régis Hocdé
Antoine de Ramon N'Yeurt
Serge Andréfouët
Jérôme Aucan
Sophie Cravatte
Maxime Duphil
Alexandre Ganachaud
Baptiste Gaudron
Elodie Kestenare
Vetea Liao
Bernard Pelletier
Alexandre Peltier
Anne-Lou Schaefer
Thomas Trophime
Simon Van Wynsberge
Yves Dandonneau
Michel Allenbach
Christophe Menkes
While the rise in global ocean temperature continues its course, reaching 1.45±0.12 °C above pre-industrial level according to the World Meteorological Organization in 2023, marine heatwave frequencies and intensities increase. Consequently, coral reef ecosystems, which are among the most vulnerable environments, are strongly impacted by dystrophic events and corals experiencing increasing frequencies of bleaching events. That has devastating consequences for the Pacific Island countries and territories (PICTs) that strongly rely on these ecosystems. In situ observation remains the best alternative for providing accurate characterization of long-term trends and extremes in these shallow environments. This paper presents the coastal temperature dataset of the ReefTEMPS monitoring network (Varillon et al., 2025, https://doi.org/10.17882/55128; Liao et al., 2025, https://doi.org/10.17882/82291) in which moored stations are implemented over a number of PICTs over a wide region in the western and central South Pacific from New Caledonia to French Polynesia. These in situ temperature time series are unique in several ways: in the length of some historical stations dating back to 1958 for the oldest, thus providing more than 65 years of daily data; in the number of countries sampled (16 PICTs); and in the variety of coral ecosystems monitored (from atolls to high islands and from barrier reefs' external slopes to shallow and narrow lagoons). Measurement devices have evolved over the years to provide increasingly precise and frequent observations, so the ReefTEMPS network was endorsed as a French National Observation Service in 2020, a label ensuring quality-controlled and open-access data of long-term observations. All stations are publicly available in ASCII or formatted NetCDF files either in the ReefTEMPS dedicated information system, which also allows for a quick visualization of time series, or on the SEANOE marine data platform. All links and accesses to these temperature time series are provided herein. The longevity of these temperature time series allows for diagnosing long-term trends, highlighting the influence of multiple processes on temperature dynamics (e.g. internal waves, cyclones, seasonal, and climate modes) and documenting the time evolution of extreme events. All files are made publicly available on dedicated SEANOE repositories.
- Article
(6418 KB) - Full-text XML
- BibTeX
- EndNote


Sea temperature is a key variable in oceanic, atmospheric, and coupled ocean–atmosphere studies. It is an essential variable to be considered when characterizing climate variability and climate change. In addition, it is also key for understanding marine ecosystem responses to thermal variability because of its wide influence on marine biogeochemistry and diversity (Kurylyk and Smith, 2023). It more particularly influences marine species spatial and temporal distributions (Pinsky et al., 2020; Righetti et al., 2019) and their life cycles (Dahlke et al., 2020). Understanding the evolution of oceanic temperatures is crucial to infer how global marine biodiversity and biomass will evolve as climate change is producing extremes that may not have been experienced by marine life before (Smale et al., 2019).
Since the 1980s, the advent of satellites has provided better knowledge on how surface oceanic temperatures evolve at scales of ∼25 km (Minnett et al., 2019). Products such as OISST offer a retrospective view back to 1982 at 0.25° resolution (Reynolds et al., 2007). Lately, this synoptic capacity to observe surface temperature has strongly progressed into much higher spatial resolution, with international efforts producing blended daily products of up to ∼1 km resolution on a global scale (e.g. MUR SST, Chin et al., 2017). These new higher-resolution surface products have been complemented, since 1999, by in situ observations of the water column temperature, with the launch of the global array of autonomous free-drifting profiling floats mainly in the open ocean (ARGO, Wong et al., 2020).
Yet, coastal and shallow water areas remain largely undersampled. First, Argo floats cannot drift in shallow waters, and at the coastal scale, even the highest-resolution global satellite products are plagued by many sources of artefacts that cause remotely borne temperature observations to strongly diverge from observed in situ estimates (Goebeler et al., 2022; Smit et al., 2013). Coastal areas often display high complexity and variability in terms of bathymetry, coastlines, or freshwater inputs which create thermal micro-habitats that satellite data do not resolve properly. Resolution offered by satellites can also lead to a misrepresentation of true thermal extremes experienced at the coastal zone (Schlegel et al., 2017; Van Wynsberge et al., 2017). In addition, processes affecting infra-daily sea surface temperature variability (e.g. diurnal heating signal, tidal signal, or internal waves; Colin and Johnston, 2020) are invisible to most remotely sensed techniques that only provide daily estimation of surface temperature. Some satellite measurements may provide these temporal scales (e.g. Himawari; Kurihara et al., 2016) but over short time periods. Satellite products generally provide estimates of the upper 10 m temperature based on their radiometer measurements of the skin temperature and other parameters with inherent limitations to describe the water column or benthic thermal variability experienced by sessile organisms (Minnett et al., 2019).
At present, the only way to obtain true continuous temperature measurements in shallow water environments comes from moored observations. While those cannot assess the spatial scales that satellites cover, they provide ground truth temperature measurements of the water column at very high frequency and over long time periods if moored observing systems are implemented in a perennial manner. It is thus of crucial importance to maintain and enhance these arrays, especially in small islands surrounded by coral reef environments, where ecosystem goods and services are fundamental for people's well-being (Santavy et al., 2021).
Coastal observations are hence essential prerequisites to manage and mitigate risks generate prediction of coastal hydrodynamics, including temperature dynamics, and create a continuous observing network from terrestrial to oceanic ecosystems (Malone et al., 2014). Knowledge about coastal seawater temperature variability is critical as it is part of the backbone of core biogeochemical and physical observations needed to inform management bodies and scientists on coastal events and processes (Bailey et al., 2019). In a warming world that exacerbates the occurrence of extreme events such as marine heatwaves (IPCC, 2023), long-term coastal monitoring of high-temporal-resolution temperature is of crucial importance for making reliable assessment of these changes at all scales, from sub-diurnal to multidecadal (Goebeler et al., 2022; Salat et al., 2019). Shorter-term observations of temperature are also proving to be crucial for understanding mechanisms driving short-term temperature dynamics and for validating and setting up statistical or numerical modelling tools able to simulate thermal short-term variability (McCabe et al., 2010; Van Wynsberge et al., 2017). Misrepresentation of such short-term coastal processes may hamper our ability to perform long-term future projection for coastal ecosystems (Siedlecki et al., 2021).
Those general considerations of the need for in situ monitoring of temperature in coastal environments are particularly true for coral ecosystems. In these ecosystems, concerns about temperature effects have arisen since the 1998 global bleaching event. Although “localized” bleaching and dystrophic events have been reported since 1982 in the Pacific and Indian oceans as well as in the Caribbean Sea (Goreau et al., 2000), the intensity and spatial extent of the 1998 event led to the awareness that global coral ecosystems may be durably endangered by climate variability (Hughes et al., 2017). This also stressed the necessity to better understand the complex relationships between coral bleaching and extreme ocean temperatures. In the tropical Pacific, the health of coral reef ecosystems is a fundamental issue as it has a major impact on food security as well as sources of income for Pacific islanders (Bell et al., 2017). As ocean warming and heatwaves are actually recognized as the most significant and growing threats to coral reefs (IPCC, 2023), in situ temperature monitoring appears of fundamental importance to better assess their fate in the future by being able to document lethal thresholds from in situ data and/or possibly find more heat-tolerant coral reef populations (DeCarlo et al., 2019; Rivera et al., 2022), for example.
Temperature variability within coral reef ecosystems (such as lagoons, outer reef slopes, and reef flats or terraces) can be controlled by a variety of physical drivers of both oceanic and atmospheric origin (Herdman et al., 2015; Grimaldi et al., 2023). Moreover, interactions of physical processes (tides, wind, and waves down to turbulence within coral canopy) with complex bathymetry induced by coral reefs geomorphology can lead to thermal microclimates (Reid et al., 2020). The resulting local thermal signatures can thus be observed only by means of in situ monitoring and strongly support field observations for understanding coral bleaching (Safaie et al., 2018; Green et al., 2019) or coral cover spatial heterogeneity (Rogers et al., 2016). Toward that end, several in situ coastal water temperature monitoring strategies have been launched since the early 2000s in the tropical Pacific, on either a regional scale (e.g. Potemra et al., 2017, for the Pacific Island Ocean Observing System: PacIOOS) or a country scale (e.g. Palau – Coral Reef Research Foundation and Colin, 2018; Australia – Lynch et al., 2014; Federated States of Micronesia, Pohnpei – Rowley et al., 2019; French Polynesia, Morea LTER Network – Leichter et al., 2013).
Along these lines, the ReefTEMPS initiative has been federating past and ongoing coastal-scale projects or temperature datasets in the south-central and south-west Pacific islands. One of the strengths of this network is it maintains long-time observational efforts for quality measurements, so it has gathered a large amount of in situ coastal temperature data dating back from 1958. The ReefTEMPS monitoring initiative is thus dedicated to documenting a range of temporal scales from long-term trends of coastal ocean temperature associated with climate change and their impacts on coral reef systems to shorter timescale processes shaping coastal thermal regimes within these ecosystems. In addition to honouring the observational effort and the origins and scientific values of the past gathered datasets from different institutions, this paper aims to present the philosophy and quality of this coastal reef monitoring current network and its future directions in order to ensure the continuity of such crucial observations. This paper is also a means by which to advocate future and more global collaborations on these observations that will ensure the sustainability of the network regardless of the turmoils linked to funding uncertainties.
The paper is organized as follows. After a description of the history and current status of ReefTEMPS in Sect. 2, Sect. 3 provides details on sampling devices used since the beginning of observations. Section 4 sets out the overall strategy and methods that ensure data quality, while Sect. 5 presents the philosophy of data management and dissemination. Finally, after a brief presentation of some key applications of such temperature data in Sect. 6, Sect. 7 is dedicated to the perspectives and future evolutions of ReefTEMPS.
2.1 History
The ReefTEMPS (Pacific Islands Coastal Temperature Network) initiative was officially launched in 2010 by the GOPS (Grand Observatoire de l'environnement et de la biodiversité terrestre et marine du Pacifique Sud) by federating existing coastal monitoring strategies and datasets and adding numerous sites of measurements in the South Pacific. In practice, the adventure actually began much earlier. As early as 1958, in Nouméa (New Caledonia, NC), ORSTOM's (Office de la Recherche Scientifique et Technique Outre Mer, now IRD, Institute of Research for Sustainable Development) oceanographers were convinced of the crucial value of repeated and prolonged measurements of sea parameters (temperature and salinity). Using the material resources available at that time (oceanographic bucket), they worked hard to maintain daily observations of temperature and salinity at the first long-term lagoon monitoring station of Anse Vata – Nouméa (Dandonneau, 1986, Fig. 1 – Appendix B1). 10 years later, in 1967, a second historical station was set up, closer to the open ocean, on the islet of the Amédée lighthouse (Fig. 1 – Appendix B1). The foundation of the ReefTEMPS network was born.
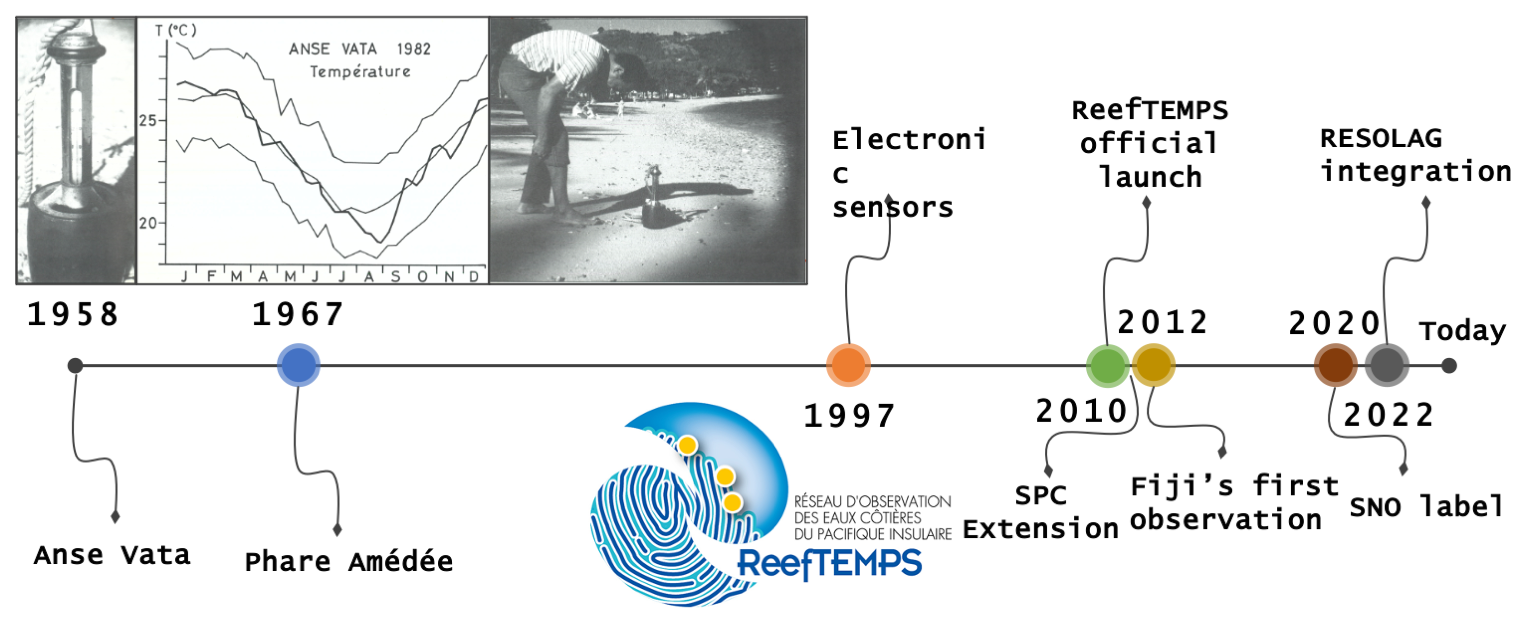
Figure 1Timeline of the main events of the ReefTEMPS network. During the first period until 1997, bucket measurements were done as depicted in the inserted photos from Dandonneau (1986). Left panel of the insert: zoom-in on an oceanographic bucket. Centre: seawater temperature at the Anse Vata station using a bucket (bold line: 1982 time series; light lines represent the average, minimum, and maximum throughout the years from 1958 to 1982 observations). Right: scientist reading temperature value on an oceanographic bucket.
From 1992 to 2009, management and continuity of the existing monitoring network in New Caledonia lagoons has been steered by IRD with the support of the Zoneco programme (https://www.zoneco.nc/, last access: 16 August 2025) with the start of new observation stations around the mainland of NC on both the west and east coasts and both northern and southern lagoons. This geographical extension began mainly in 1997 when electronic sensors replaced manual sampling. 2010 was the official birth year of the ReefTEMPS framework driven by the GOPS. In addition to major improvements on data archiving and dissemination infrastructures (Hocdé and Fiat, 2013), ReefTEMPS expanded to other PICTs during 2011–2015. In 2011, with financial support from the Australian Agency for International Development (AusAID), the Pacific Community (SPC) launched a project to help Pacific Island countries in setting up pilot projects to monitor coastal fisheries and associated habitats. In this context, a dozen sensors were deployed in Marshall Islands, Cook Islands, Papua New Guinea, Micronesia, Tuvalu, and Kiribati and were integrated in ReefTEMPS. In 2012, through a collaborative initiative, management of the historic stations on Wallis and Futuna was entrusted to the University of New Caledonia. The same year, the Pacific Centre for Environment and Sustainable Development (PaCE-SD) at the University of South Pacific in Fiji joined the ReefTEMPS initiative and began observations in Fijian coastal waters, thus developing a long-lasting collaboration with ReefTEMPS which endures to this day. Finally, in 2021, the Direction des Ressources Marines de Polynésie Française (DRM) also integrated ReefTEMPS by including their historical data from the French Polynesian lagoon network RESOLAG (Liao et al., 2025) to the ReefTEMPS dataset and has since become another major partner of the network.
As an international observation network based in both the French Pacific territories and the Pacific Island states (Hocdé et al., 2021), ReefTEMPS has been a key asset in the creation and design of France's multi-agency Research Infrastructure for coastal ocean observation, ILICO (Cocquempot et al., 2019). Since 2019, ReefTEMPS has been one of the nine National Observation Services (SNOs) integrated in ILICO. These networks are accredited through a peer-reviewed evaluation process overseen by French national research agencies every 5 years. ReefTEMPS was labelled as an SNO by the French governmental “ocean–atmosphere” commission for the 2020–2024 period and for three parameters: temperature, conductivity, and pressure. As a labelled network, ReefTEMPS is required to acquire and openly disseminate data of international quality standards.
2.2 The current ReefTEMPS network
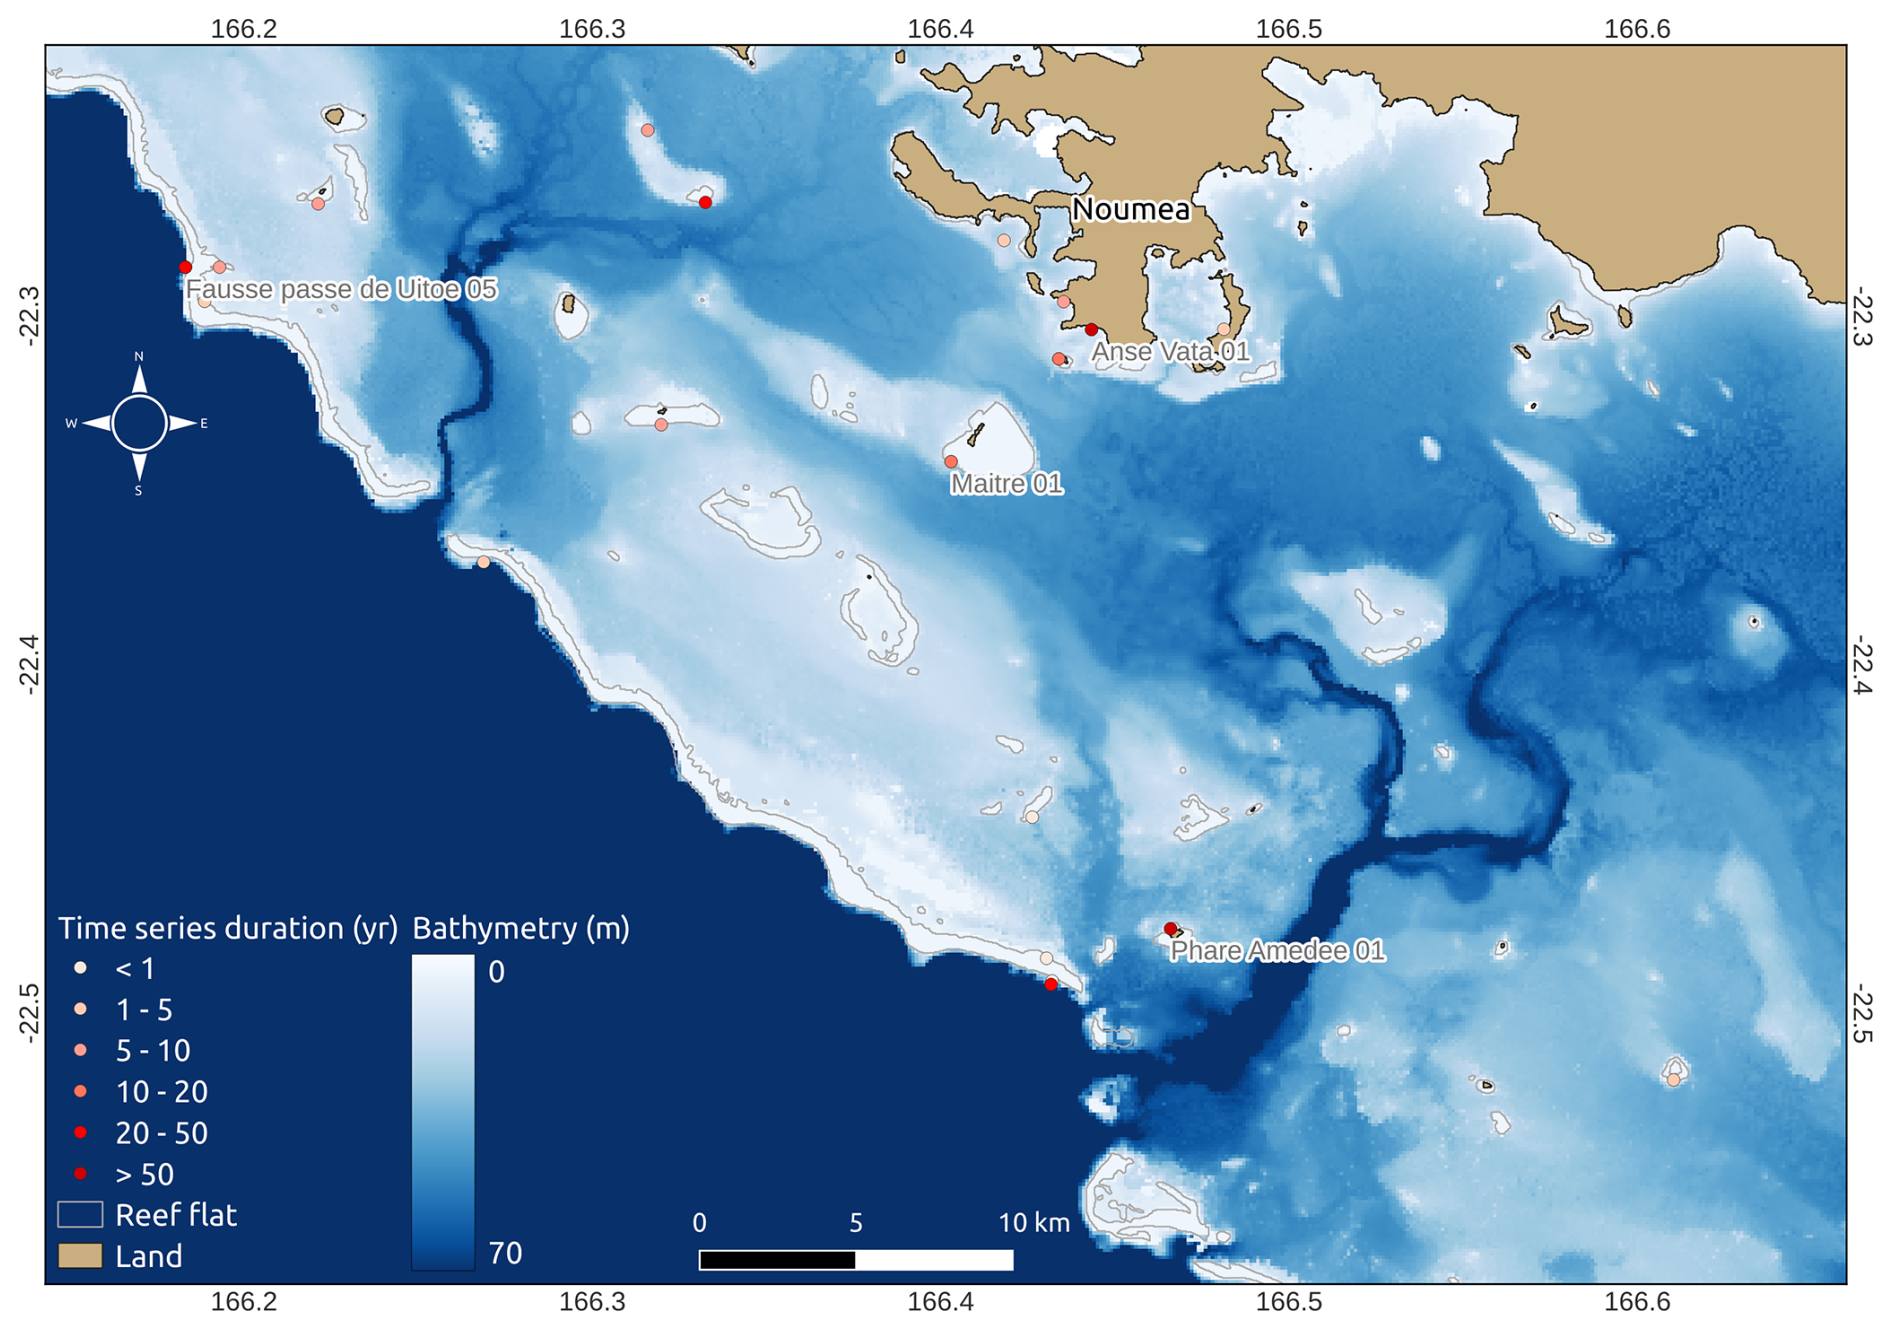
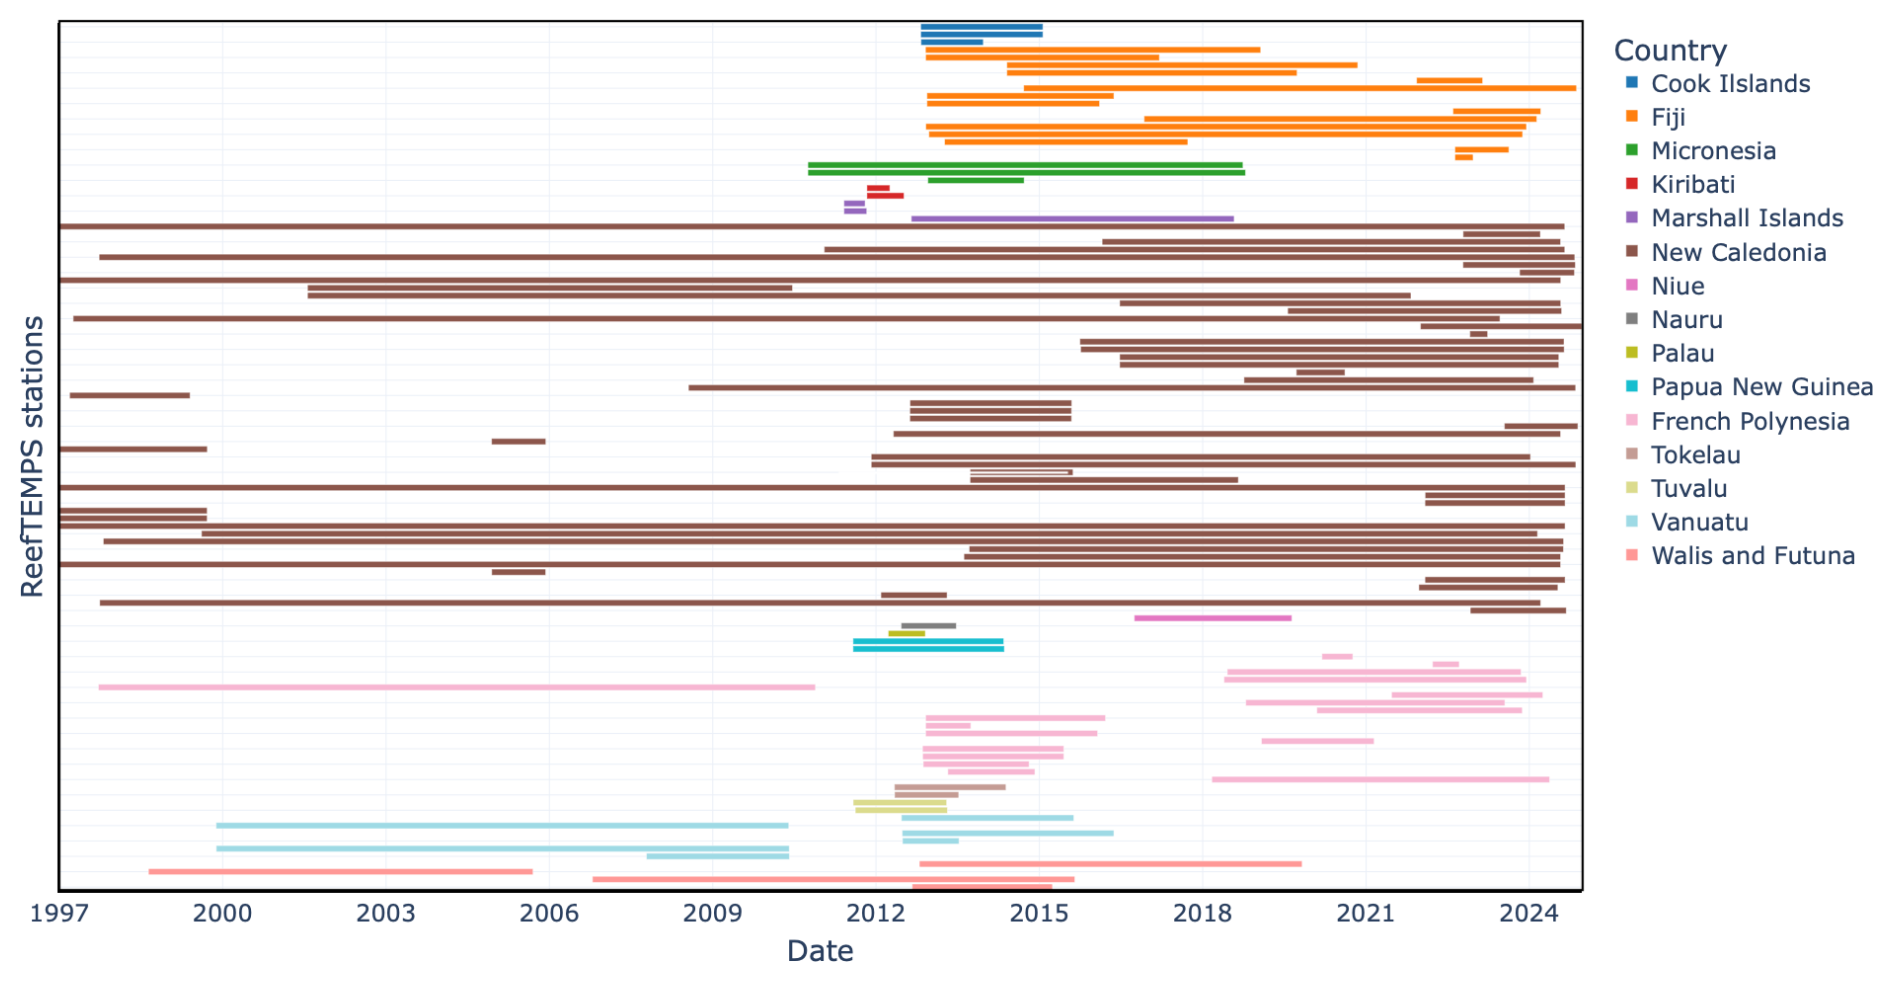
The tropical and subtropical Pacific are the areas of the world oceans that support the largest habitat for coral reefs and are home to the greatest coral species richness (Maragos and Williams, 2011; Fig. 2, upper-right panel). The ReefTEMPS temperature monitoring network encompasses the three regions of Oceania (Micronesia, Melanesia, and Polynesia), covering 16 PICTs (see Fig. 2, Tables A1 and A4, and Fig. B2) and extending roughly from 10 to 30° S and from 134° E (Palau) to 134° W (Gambier Islands). Such huge spatial coverage is a challenge to maintain over time, and some stations have been discontinued due to fluctuating collaborations and funding (57 stations interrupted). The duration of time series ranges from 6–8 months for the shortest series to more than 65 years for the longest (Anse Vata station, New Caledonia). 26 stations have more than 10 years of observations (approx. 20 % of the monitored sites). The total observation time, covering periods between the start and end dates of all stations sums actually to 320 744 d, equivalent to approximately 878 years of data. The study sites that have the higher numbers of monitoring stations and currently contribute the most to the observations of coastal temperature are New Caledonia, Fiji, and French Polynesia, which constitute the secure and core observations of ReefTEMPS. New Caledonia (Fig. 2, bottom-left panel) due to its history of coastal observations, represents the “backbone” of this network with both the largest number of monitored sites (53) and the longest time series. Most stations are located in its southwest lagoon, but some long-term sites are also spread out further north and on the east coast of the mainland (“Grande Terre”), as well as on remote reefs (e.g. Entrecasteaux reefs, Chesterfield Islands). Fiji currently has 15 monitoring sites around Viti Levu Island, Beqa Island, the Vatu-i-Ra Passage, the Lau Group, and the northernmost island of Rotuma. In French Polynesia, ReefTEMPS covers the 5 main archipelagos, sampling both atolls and high island lagoons with a total of 20 stations.
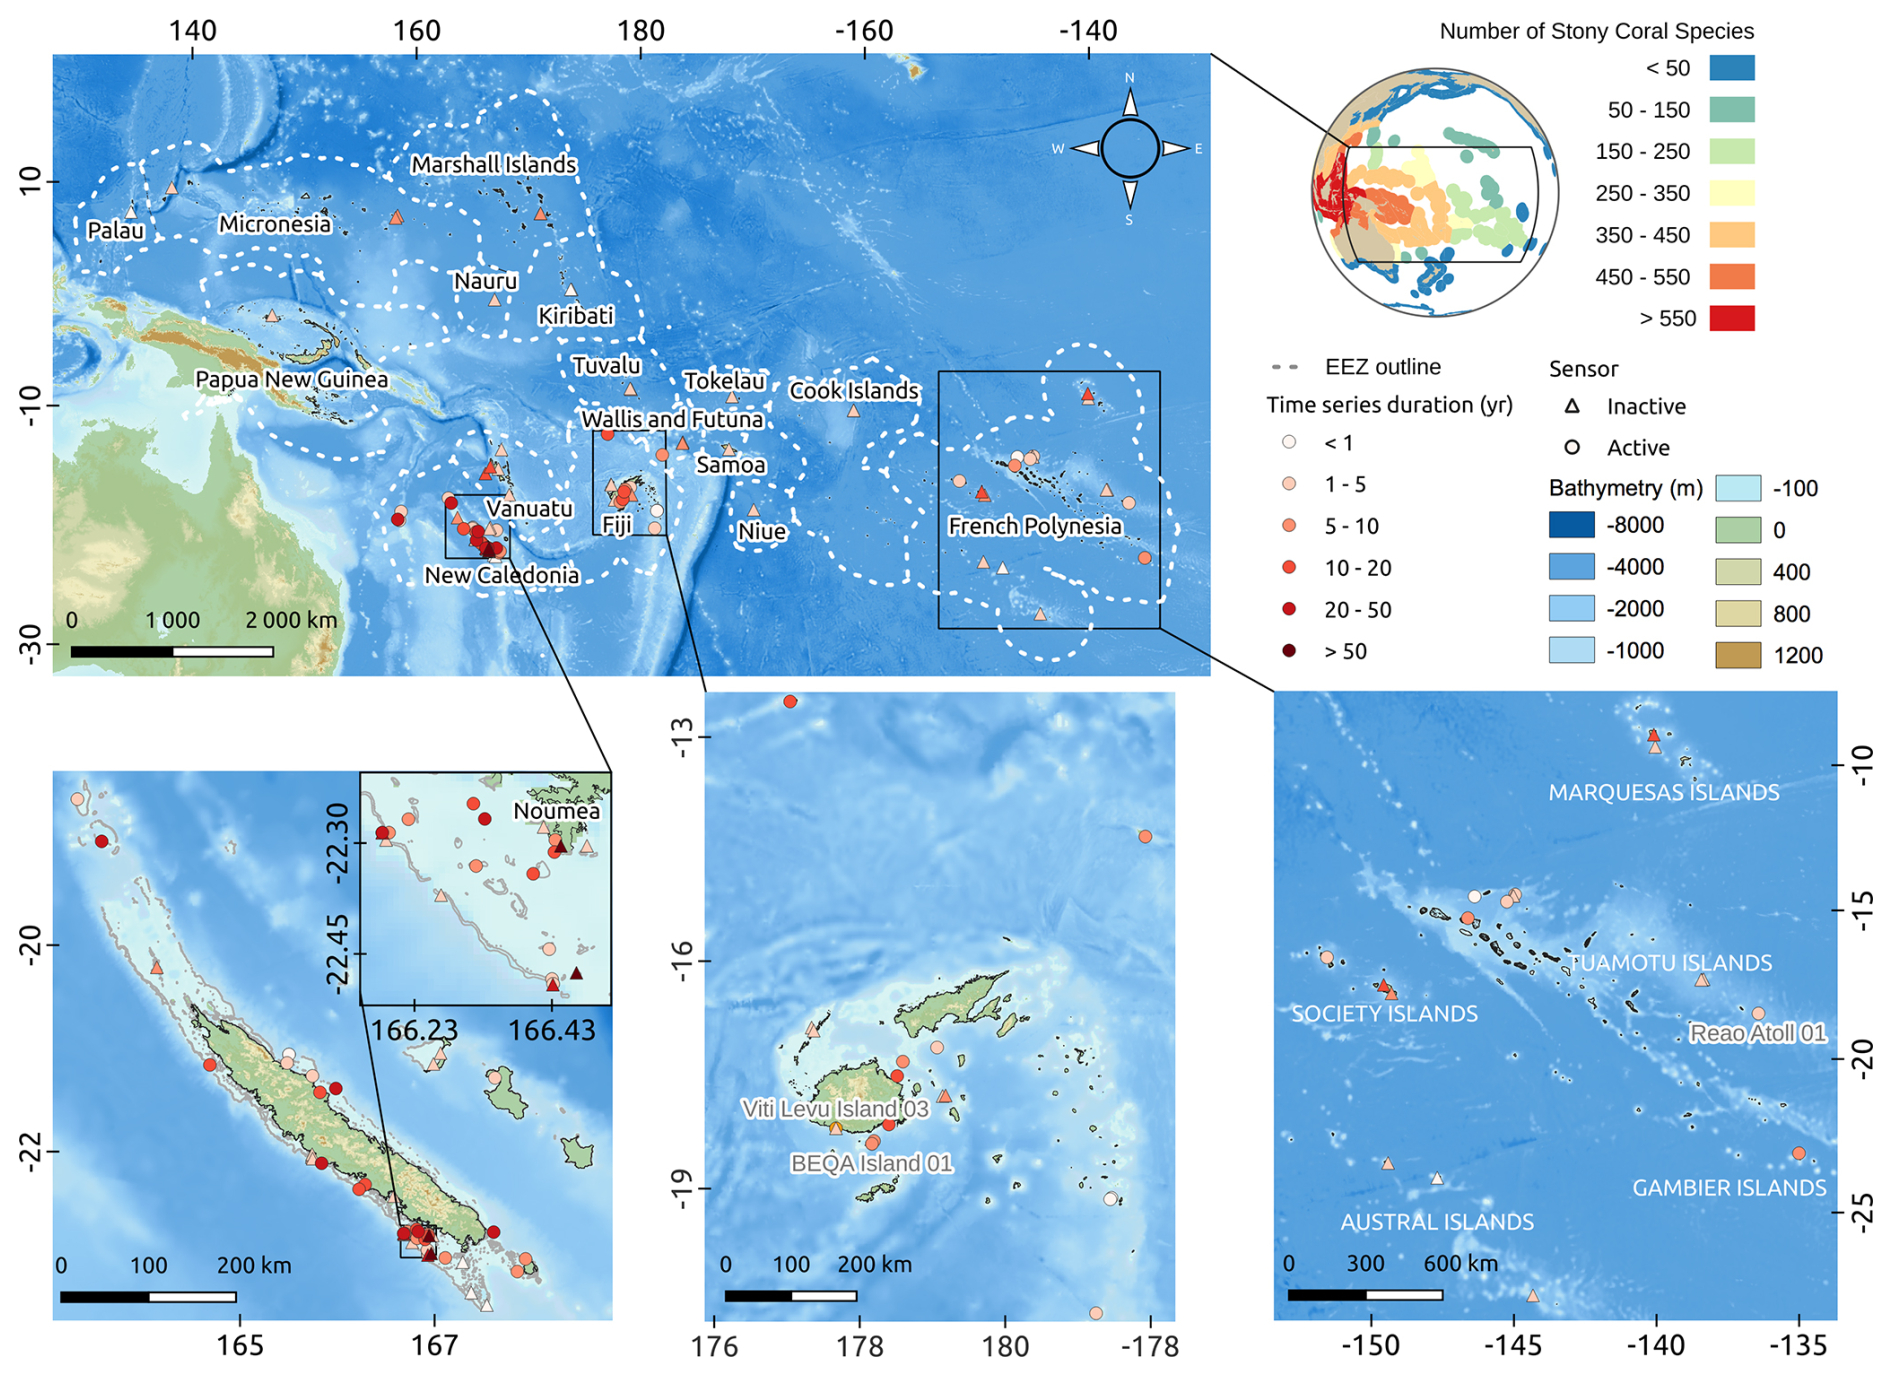
Figure 2Overview of geographical distribution and length of time series (in years) of ReefTEMPS monitoring stations. Detailed zooms are provided for New Caledonia, Fiji, and French Polynesia. Circles/triangles indicate respectively active/inactive stations. The upper-right panels depict the number of stony coral species across the world (from The Atlas of Global Conservation, Hoekstra et al., 2010) illustrating the coral reef context in which ReefTEMPS is set. Bathymetric data used come from GEBCO grid (GEBCO Compilation Group, 2022).
Overall, to date, the ReefTEMPS network has comprised 118 monitoring temperature stations (61 currently active) with a mean duration of observations above 2430 d. Since time series are generated by instrument type, this corresponds to a total of 132 files. In terms of depth, sensors are distributed between 0.5 and 60 m (61 % in the 0–10 m zone, 33 % in the 10–20 m zone, and 6 % >20 m) (see Table A4). The vast majority of observation stations consist of measurements at a single depth, while two stations in New Caledonia (Uitoe and Hienghène) are equipped with multiple vertical levels of instrumentation.
Due to the wide temporal range of the ReefTEMPS dataset, measurement methods have evolved over the years in line with technological advances. Starting from simple observations with an oceanographic bucket deployed from the shore by a human operator (see Fig. 1), the network has grown to include a variety of automatic sensors with increasing accuracy, frequency of acquisition, and capacity of storage. Most of the instruments used now are autonomous compact loggers containing internal batteries and memories deployed by scuba diving and fixed on the seabed (see Fig. 3). Moorings have been designed to be adapted to the habitats and to withstand heavy agitation, such as the ones induced by cyclones or storms. To prevent sensors from biofouling, mechanical damage or wildlife, they are all deployed inside plastic cylinders with holes that allow for water circulation. A few sites (especially in French Polynesia; see Sect. 3.3 on buoys) were also initially instrumented using buoys, but this sampling strategy is now replaced by moored sensors to be congruent with the whole network.
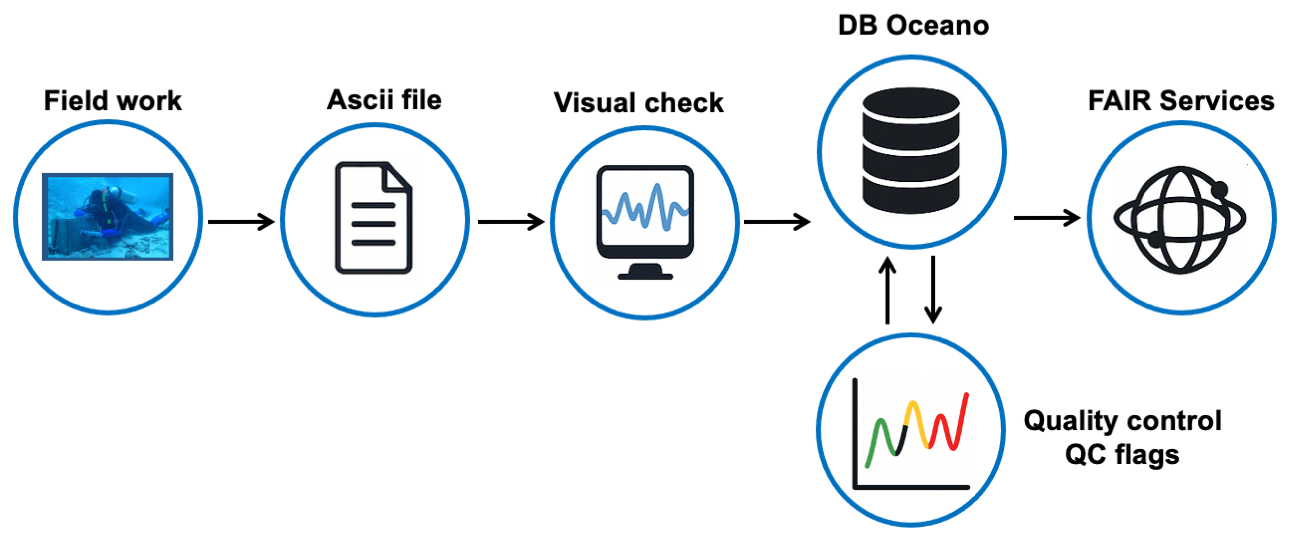
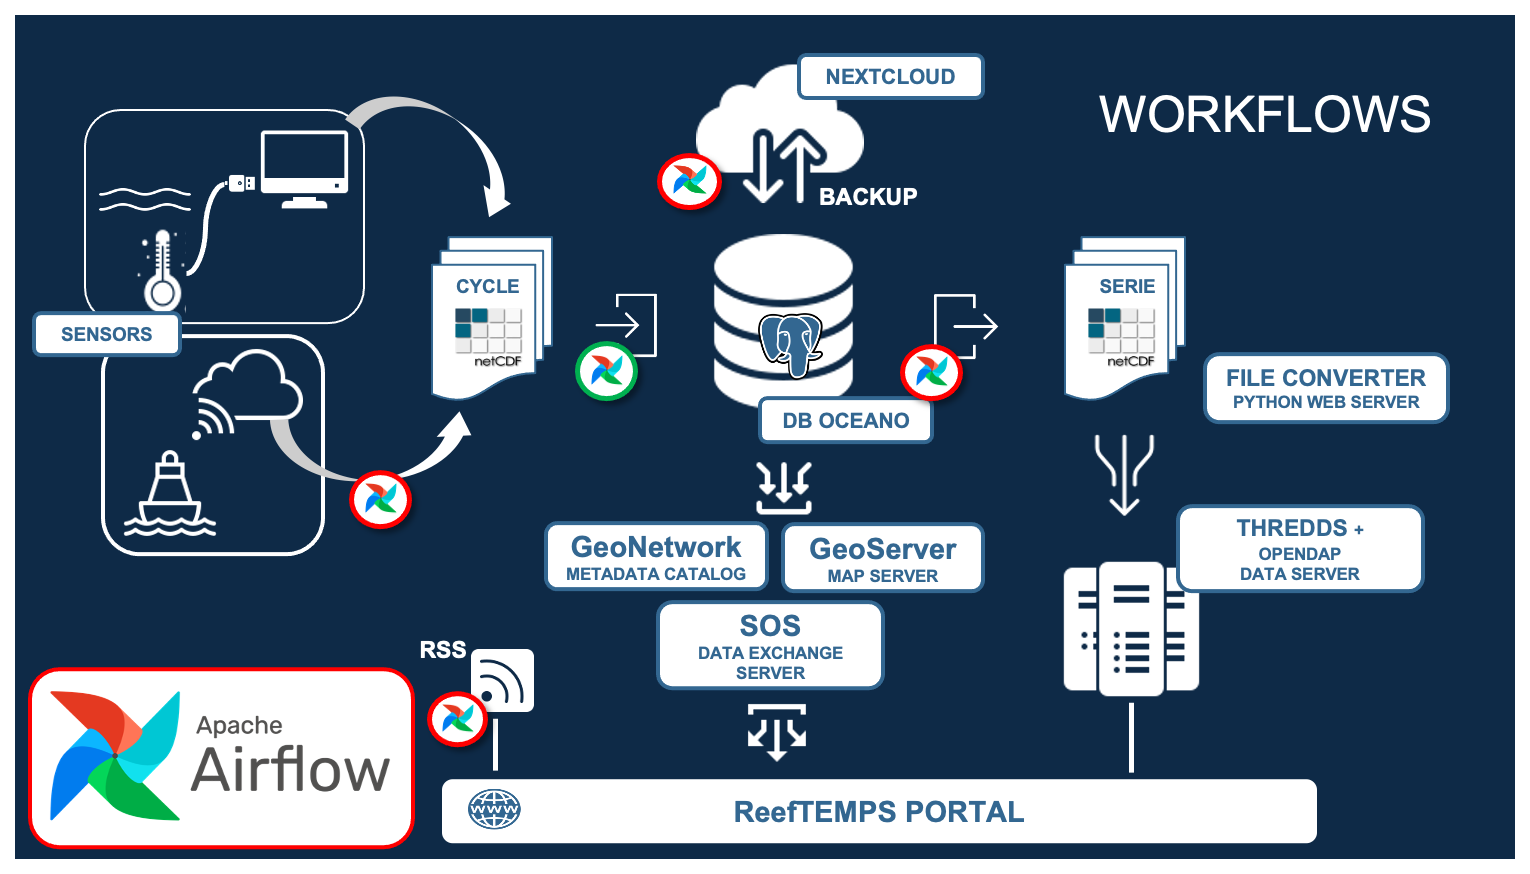
Figure 3Data life cycle of ReefTEMPS temperature time series. Photo: Batiki island sensor installation (credit: Partners in Community Development, Fiji).
3.1 Oceanographic bucket
For the two long-term sites of New Caledonia, Anse Vata, and Amédée Islet, data were first collected using the oceanographic bucket (see Fig. 1). This device was as simple and robust as a water-taking bucket equipped with a thermometer and deployed using a rope to collect water. It allowed temperature measurements to be taken with an accuracy of close to 0.1 °C and had been used daily for nearly 47 years. The nominal acquisition time for both stations was 07:00 LT (local time), and the targeted depth using the bucket was ∼0.5 m. That method was abandoned in 2005 to move to more automatic measurements. At the Amédée station, the construction in 1977 and extension in 1993 of a pontoon slightly shifted the sampling point from the initial position from the beach, moving it away from the shoreline by 44 m and then 64 m. That changed to 4.5 m with the arrival of autonomous electronic loggers. In French Polynesia, two stations were also sampled daily using buckets in Tahiti (Society Islands, from 1979 to 1989) and in Ua Pou (Marquesas Islands, from 1986 to 1989).
3.2 Compact autonomous loggers
From 1997 to 2009, a few main initial sensor brands were used for monitoring coastal temperatures in New Caledonia, French Polynesia, and Wallis Island. The first set of electronic and autonomous sensors deployed were HOBO®, for which various models were successively used: Stowaway (https://www.onsetcomp.com/resources/documentation/1513-stowaway-xti, last access: 16 August 2025), Optic Stowaway (https://www.onsetcomp.com/resources/documentation/1086-k-man-optt, last access: 16 August 2025), and UTBI-001 TidBit (https://www.onsetcomp.com/products/data-loggers/utbi-001; last access: 5 September 2024). Depending on the brand, the accuracy ranged from 0.2 to 0.4 °C, but these sensors provided a higher temporal resolution compared to the punctual observation using a bucket. They provided infra-daily resolution, acquiring data continuously at frequencies between 10 and 30 min. Autonomous loggers from RBR Ltd, RBR TD1060, were also initially deployed in New Caledonia. In addition to temperature (accuracy 0.002 °C, drift ∼0.002 °C yr−1; manufacturer's manual), they provided observations of pressure. Due to several logger failures or drifts, these RBR sensors were gradually abandoned. At last, the Uitoe station (external slope of the barrier reef, west of New Caledonia) was equipped since 1992 with a Seacat SBE16 from SEA-BIRD Electronics Inc., which samples not only temperature (accuracy of 0.01 °C, resolution 0.001 °C) but also conductivity.
With the birth of ReefTEMPS in 2010 and its associated requirements, as well as the technological developments that occurred in oceanographic instrumentation, the compact logger fleet has evolved toward models with longer autonomy and greater accuracy while measuring additional parameters. The GOPS has led a major effort to rejuvenate and homogenize the instrumental fleet. Depending on monitoring sites and scientific objectives (e.g. additional observations of level and salinity), the choice fell on a new generation of robust devices that allows for long-term deployments (from 6 month up to 2 years) with minimum battery costs while being strongly reliable. Since 2010, SBE56 temperature sensors were moored (SEA-BIRD Electronics Inc.; https://www.seabird.com/sbe-56-temperature-sensor/product?id=54627897760, last access: 5 September 2024). These SBE56 loggers allow for fast recording (1 min sampling rate) and highly accurate temperature measurements (accuracy of 0.002 °C, ±0.002 °C drift yr−1) and provide enough battery and storage autonomy to remain deployed underwater for up to 2 years. For monitoring stations where water level dynamics is of interest, the sensors used in ReefTEMPS are now two models from RBR Ltd. namely, RBRduo T.D and RBRduet T.D (https://rbr-global.com/, last access: 5 September 2024). These RBR loggers are used to record not only temperature (initial accuracy of 0.002 °C, ±0.002 °C drift/year) but also pressure that provides information about sea-level dynamics. Finally, at stations impacted by massive freshwater inflows, temperature is monitored using the Infinity-ACTW loggers from JFE Advantech Co., Ltd. (https://www.jfe-advantech.co.jp/eng/assets/img/products/ocean-infinity/INFINITY-CTW(E)_201704.pdf, last access: 5 September 2024), which reliably samples temperature (accuracy of ±0.01 °C, resolution of 0.001 °C) and conductivity (salinity).
3.3 Multiparameter buoys
In French Polynesia, RESOLAG, a program dedicated to the long-term monitoring of pearl farming atolls started in 2018 (Liao et al., 2025). The aims of the deployed sampling strategy were initially double: first, to acquire multiple parameters (temperature, salinity, fluorescence, turbidity, and dissolved oxygen) to understand the link between environment variability and the performance of pearl farming activities (e.g. spat collecting and pearl quality). The second objective was to provide pearl farmers and stakeholders with a real-time view of the lagoon's state, particularly temperature data, to make their spat collection seasons more efficient by improving their understanding of precise interseasonal periods. For this purpose, two kinds of real-time multiparameter buoys by NKE (Smatch and Sambat models; https://nke-instrumentation.com/; last access: 16 May 2024) were deployed in seven different lagoons, sampling parameters at around 3 m at 1 h frequency. Concerning the thermistors, the manufacturer's manual for the thermistors indicates for both buoys have an accuracy of 0.05 °C and a maximal resolution of 0.003 °C. In 2023, due to some problems with live transmission and sensor maintenance, the RESOLAG strategy shifted to the use of moored loggers and, to be consistent with the ReefTEMPS logger strategy, the choice fell on the SBE56 and RBR Duet instruments (see Sect. 3.2 above).
4.1 Overall strategy
Figure 3 presents the global data life cycle of the ReefTEMPS temperature time series. Data processing and quality control have been conducted in a standardized manner since 2010 to ensure both consistency of observed time series and diffusion using international oceanic data standards. Since 2010, maintenance and recalibration of instruments have been conducted at recommended intervals by or in accordance with the manufacturers (every 5 years for SEA-BIRD loggers every 2–3 years for JFE Advantech and RBR loggers) to ensure reliability and quality of values observed. Recently, an intercomparison procedure for sensors compared with a reference SBE56 sensor was implemented to ensure that the sensors do not differ by more than 0.005 °C from the reference sensor. Prior to 2010, the reliability and accuracy of the devices used were lower (see Sect. 3), and maintenance frequency was not really fixed and fluctuated according to available funds.
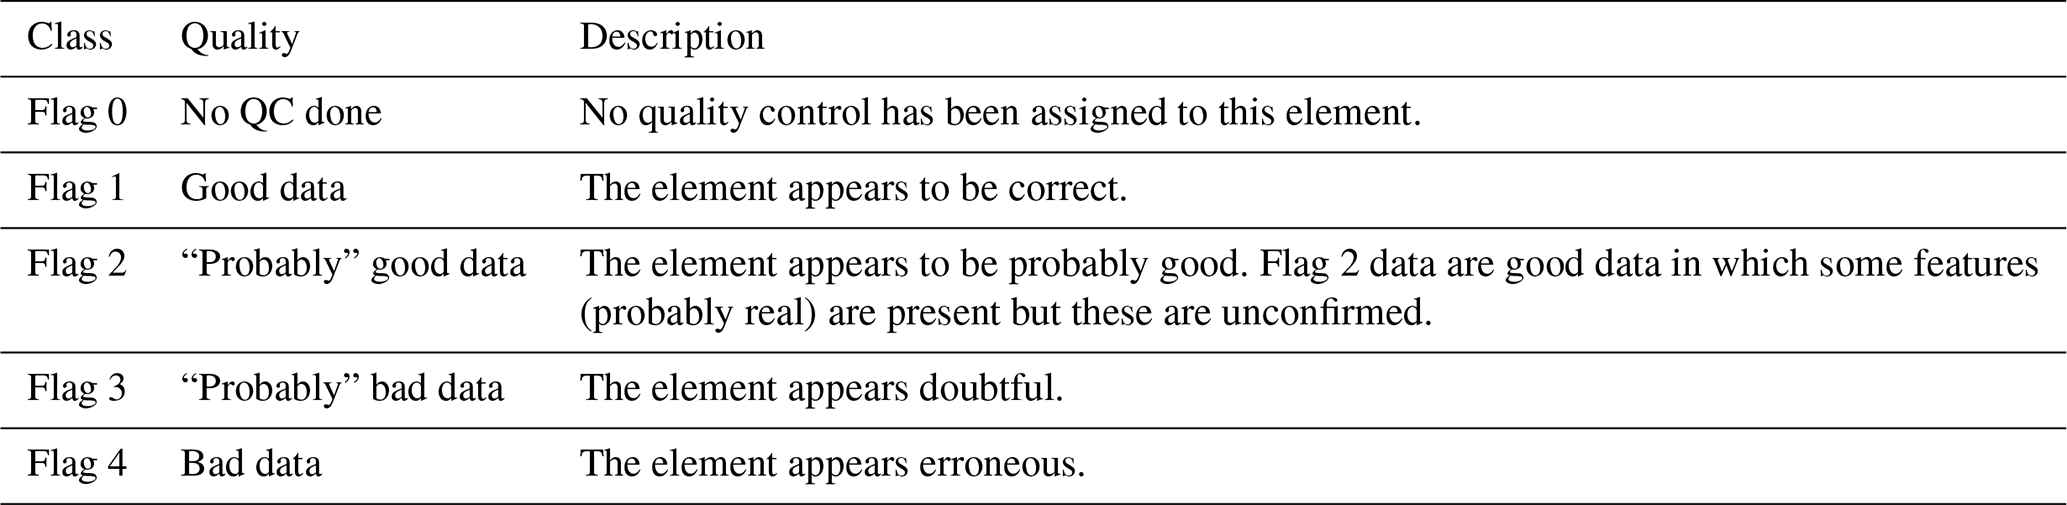
In early 2025, a major overhaul of the entire database, quality flags, and processing states was carried out. Each temperature measurement of each time series now has an associated quality code (QC; see Table A5). Based on the knowledge on sensors and sampling device accuracy, quality flags have been attributed to each measurement according to instrument type and family. Globally, buckets, onset, and NKE sensors have been flagged as “probably” good data (this mainly concerns data prior to 2010). RBR and SEA-BIRD sensors have been flagged as good data since, in our opinion and according to our expertise, they provide more reliable temperature data. A Python graphical tool was used for inspecting all temperature time series and modifying quality flags. This tool lets you zoom in to perform a visual check of all time steps, display satellite temperatures (e.g. OISST, OSTIA), perform basic statistical tasks (e.g. remove eventual duplicate data and tests values over/below threshold), and finally assign a different quality code to desired measurement. This qualification stage will now be fully integrated in the data life cycle (see Fig. 3) for future data integration in the temperature database.
Finally, a dedicated nomenclature for files based on international standards (either raw or processed) was also implemented (see Tables A2–A4 for information on stations, instrument types, and processing states and Fiat et al., 2024). Dataset file names read as follows: ConventionFormat_CodeSite_Startime_ParameterType_ProcessingState _InstrumentType_Depth. For example, file name “OS_POINDI01_199710_TEMP_2B_TR_125.nc” indicates that this time series is formatted following OceanSITES (OS; https://repository.oceanbestpractices.org/handle/11329/874.2, last access: 5 September 2024) conventions taken at the POINDI01 monitoring station (Poindimié station on NC east coast) beginning in October 1997 and processed up to the “quality-controlled data” (2B) processing state (see Table A3), with instruments belonging to the Thermistor class (see Table A2) moored at a 12.5 m depth and provided in NetCDF (.nc). To avoid decimal numbers in the file names, we have chosen to indicate depths in decimetres. The global data life cycle (including processing and quality steps) is described hereafter and depicted in the diagram in Fig. 3. The files generated at each stage are stored on secure drives.
-
Instruments are replaced (or moored if this is a first deployment for a new station) by scuba diving at frequencies that depend on their characteristics (from 3 months up to 2 years in water). Each replacement is referred to in the database as a “measurement cycle”.
-
Upon replacement, raw files are retrieved using dedicated manufacturer's software and first converted to ASCII format and named following nomenclature rules.
-
Time series from each measurement cycle are then carefully visually inspected using specific software (ferret or MATLAB routines) to ensure the removal of obviously “bad data” (e.g. out of water observations), converted into NetCDF cycles, and checked to ensure measurement cycles are properly connected. At this stage, the corresponding processing state of the time series remains at level 1A (see Table A3).
-
Measurement cycles are then imported into the DB Oceano database (PostgreSQL).
-
Datasets from each retrieval are then exported into the NetCDF OceanSITES format (https://repository.oceanbestpractices.org/handle/11329/874.2, last access: 5 September 2024), with metadata following the Climate and Forecast metadata conventions (CF: https://cfconventions.org/, last access: 5 September 2024).
-
Using a Python graphical tool, a qualification check (see above) is performed on the new cycle of observations, and if necessary, modifications are performed on the corresponding QC in the database. This qualification check, performed by a scientific expert in tropical coastal temperature dynamics, enables re-updating database and Table A3).
-
Fully processed NetCDF files are then exported into the ReefTEMPS information system (IS), which allows for delivering datasets in different formats and/or using different web services based on specific and standardized protocols (see Sect. 5.1).
As of 15 April 2025, the global archive of temperature time series contains 132 quality-controlled temperature files: 125 files are at processing states level 2B and 7 files at 3B. The seven 3B files come from temperature/pressure sensors deployed at very high frequency (1 or 2 Hz) to compute wave parameters. The temperature for these stations is therefore resampled to 30 min.
4.2 Long-term monthly homogenized files
The instrument precision and targets of ReefTEMPS have evolved over time, starting with studies of daily to seasonal variability and then moving to longer-term variability. Observations acquired before 2010 using oceanographic bucket or HOBO sensors suffered from a lack of precision or potential drifts. However, studies of the effects of climate change on coastal temperature require access to long homogeneous time series with sufficient precision as temperature trends detected since 1950 globally do not exceed a few tenths of degrees per decade (Cavarero et al., 2012; IPCC, 2023). Hence, to avoid misinterpretation in long-term trends due to sensor turnover, displacement, or change in the sensor environment, a homogenization procedure was applied to the two historical time series at Anse Vata and Phare Amédée stations in New Caledonia. That allowed for the provision of daily homogenized time series for the longest records with which to look at climate trends.
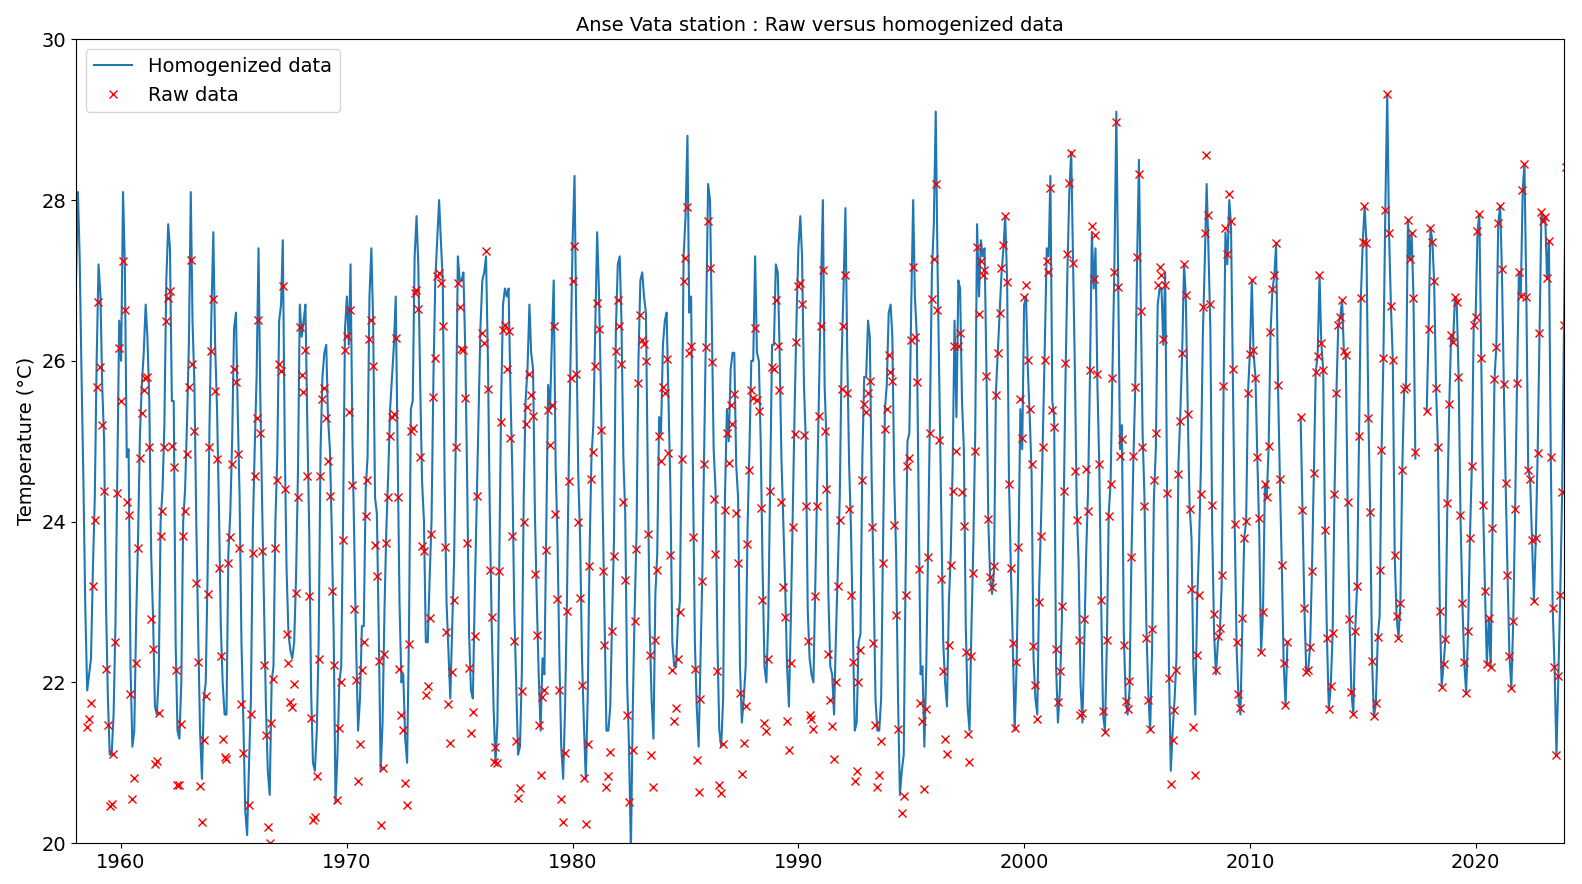
The procedure applied for building homogenized monthly long-term time series is described in depth in Guyennon (2010). During the first decades of observations (1958–1997), measurements using buckets targeted a sampling at 07:00 LT every day although some measurements were taken between 05:00 and 10:00 LT. Depending on the month of the year, this sampling time difference can lead to temperature differences of up to 0.4 °C. Thus, the first part of the procedure was devoted to readjusting these data so they are consistent. For that purpose, the HOBO sensor period (1998–2010) was used for each station to compute average daily temperature variations for each month and then perform adjustment of bucket data to represent only the 07:00 LT temperature regardless of sampling time. The second step of the homogenization procedure aimed to correct bucket data so they are representative of the daily mean for each day. Common measurement periods between sensors and buckets (80 months for Anse Vata and approx. 30 months for Phare Amédée) were used to quantify, for each month, the differences between bucket values and daily sensor averages. These differences were then applied to the bucket period to provide data series representative of the daily mean temperatures. Monthly mean temperature time series were computed for each station. Finally, detection and correction of artificial shifts were performed using the PRODIGE software from Météo-France (theoretical basis presented in Caussinus and Mestre, 2004) for the 1958–2010 period. After 2010, SBE56 sensor data (deemed much more accurate) were averaged monthly and concatenated to finally obtain two monthly long-term series for Anse Vata (1958–2023) and Phare Amédée (1967–2023). Homogeneity assessment tests were carried out using RHTest V4 (Wang et al., 2010) and revealed no significant breakpoints. Figure B4 displays the monthly homogenized data versus raw ones.
Prior to ReefTEMPS, the data were centralized on a database referred to as “DB-Oceano” (PostgresSQL database management system), which was developed by IRD in the early 2000s for managing data from marine sensors. The database framework was inspired by the one initially built by the multi-partner Coriolis Project (https://www.coriolis.eu.org/, last access: 16 August 2025). The first version of the ReefTEMPS information system (IS) was then put into production in 2011–2012 (Hocdé and Fiat, 2013). Then, several updates of the information system took into account technological changes and offered new functionalities to both data managers and users (Brissebrat et al., 2017). Now the ReefTEMPS IS uses DB-Oceano with a workflow manager (Apache Airflow, implemented in 2023) around which web servers are deployed to distribute/share data. The infrastructure is designed around the concept of micro-services and is fully containerized using docker technology, ensuring good system portability and the possibility of upgrading to distributed servers for better load balancing. The workflow manager automates the integration of new data by establishing a set of management rules according to the results of previous tasks (Fig. B3).
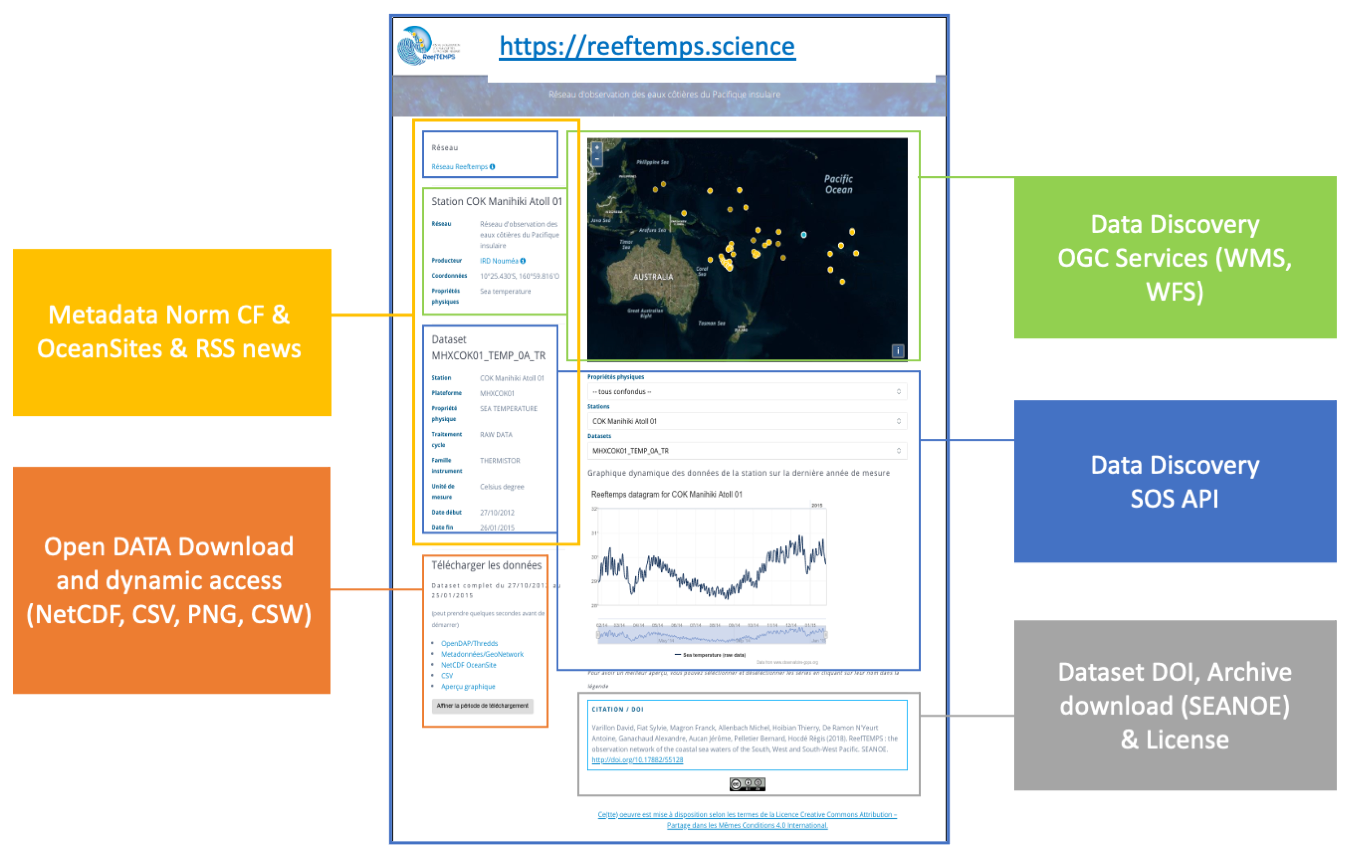
Figure 4Data access portal page and associated services.
Overall, the architecture of the ReefTEMPS IS is designed to ensure data longevity, optimize accessibility, enable widespread dissemination, and ensure interoperability with other systems (Fiat et al., 2021). These concepts are in line with the FAIR principles: findable, accessible, interoperable, and reusable (Wilkinson et al., 2016). The ReefTEMPS database is provided as an open resource under a Creative Commons Attribution-ShareAlike 4.0 International license (CC BY-SA). The core of the dataset diffusion engine used on the website (https://www.reeftemps.science/, last access: 16 August 2025) consists of an interactive map showing the location of monitoring stations via Web Map Service (WMS-OGC) and Web Feature Service (WFS-OGC) geographic services. Once a station has been selected by the user, datasets can be downloaded in multiple formats (NetCDF using OceanSITES format, ASCII file, or comma-separated value files) via different sharing protocols/servers (Thredds server and OpenDAP protocol or Sensor Observation Service, SOS-OGC). A dedicated visualization service is also available to explore time series on the website using ad hoc Python web routines. Finally, the whole ReefTEMPS data archive is also accessible through digital object identifiers (DOIs; Varillon et al., 2025, https://doi.org/10.17882/55128, and Liao et al., 2025, https://doi.org/10.17882/82291) and is updated every 6 months on the SEANOE data repository. Each release of the semestrial whole dataset is identified by a specific and additional key (i.e. https://doi.org/10.17882/55128#107183 for the January 2024 release, https://doi.org/10.17882/55128#103428 for the July 2023 release, etc.). Nevertheless, the ReefTEMPS archive DOI is unique and common to all archive releases, which allows it to better track data usage statistics. The ReefTEMPS Data Management Plan describes the life cycle of ReefTEMPS data from their acquisition to their dissemination, including the steps of processing and archiving (IR ILICO, 2023). Figure 4 presents an overview of the data portal page and the associated services.
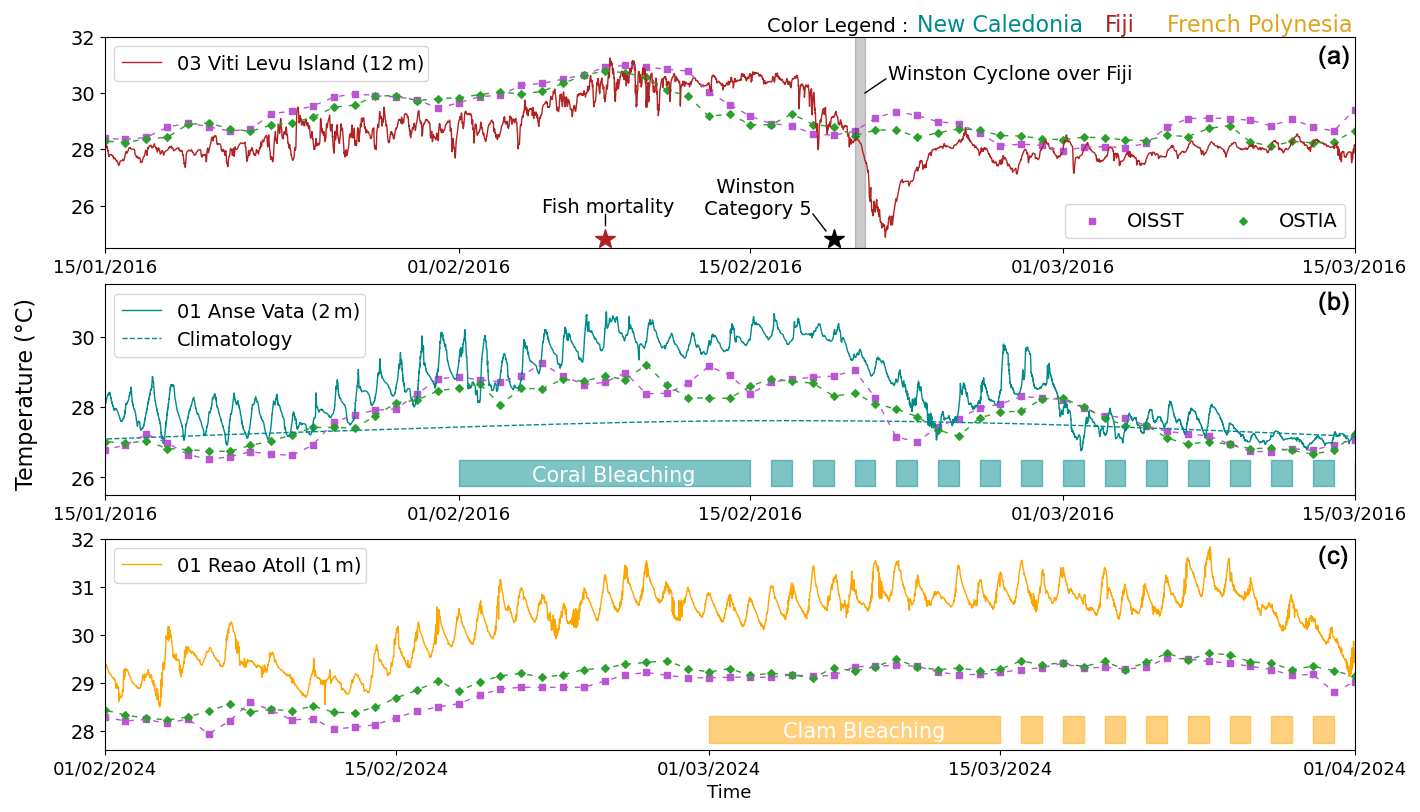
Figure 5(a) Temperature time series during austral summer 2016 at the Viti Levu Island 03 station (Fiji, depth of 12 m, red line). (b) Temperature time series during austral summer 2016 at the Anse Vata station (New Caledonia, depth of 2 m, dark cyan line). (c) Temperature time series at Reao 01 station (Reao Atoll lagoon, French Polynesia, depth of 1 m, orange line). Daily sea surface temperature from Satellite products are plotted in purple for OISST V2 and green for OSTIA. Dates of the triggered ecosystem impacts are displayed on each subplot (red star for fish mortality in Fiji, dark-cyan bar for coral bleaching in New Caledonia, and orange bar for clam bleaching in French Polynesia). Dotted lines indicate that impacts on coral and clams have continued over time (with no precise end date to give).
6.1 Capturing and documenting extreme events
With the increasing frequency, intensity, and duration of marine heatwaves (Oliver et al., 2018), in situ temperature observations are crucial for understanding the impact of true thermal variability on coral ecosystems. Figure 5 shows extracts from three chosen time series during austral summers of 2016 (for Fiji and New Caledonia) and 2024 (for French Polynesia), where elevated temperature negatively impacted the health of ecosystems and wildlife (Holbrook et al., 2022; Dutheil et al., 2024). For the sake of illustrating the benefits of in situ observations, widely used daily L4 SST products are also displayed in each subplot for the nearest points to the ReefTEMPS stations. The two selected products are respectively OISST V2 (https://psl.noaa.gov/data/gridded/data.noaa.oisst.v2.highres.html, last access: 5 September 2024) depicting SST at ° resolution and OSTIA SST (https://data.marine.copernicus.eu/product/SST_GLO_SST_L4_REP_OBSERVATIONS_010_011/description, last access: 5 September 2024) at 0.05° resolution. First, the Viti Levu 03 station in Fiji, moored at 12 m depth on the oceanic side of the Votua Lagoon, showed a sharp increase in temperature from 15 January, peaking at nearly 31.25 °C on Monday, 8 February 2016. On the same day, thousands of dead fish and invertebrates were found on the beaches near the village of Votua (Holbrook et al., 2022). Then, category 5 tropical cyclone Winston re-entering the area on 20 February induced a strong cooling by more than 5 °C, participating in the demise of that massive marine heatwave (Dutheil et al., 2024). At the same time, the Anse Vata station in New Caledonia, located more than 1250 km from Viti Levu and moored inside the south-west lagoon at 2 m depth, showed the same tendencies of rising temperature prior to March 2016. There, temperatures began to rise rapidly from mid-January onwards and also peaked at 30.7 °C on Monday, 8 February 2016. Daily maximum temperatures exceeded 30 °C for about 20 d, which is between 2.5 and 3 °C above the climatology computed for the 1997–2023 using Hobday et al. (2016) (see Fig. 5b). It had strong consequences on corals: the first documented massive coral bleaching event in New Caledonia's lagoons occurred during February 2016, while that lagoon had been relatively unscathed until then (Payri et al., 2018). The third major event illustrated here occurred in 2024 in the Reao Atoll lagoon (orange line) in French Polynesia, where the important population of giant clams (Tridacna maxima) provides significant income and food to inhabitants through fishing and aquaculture practices (Andréfouët et al., 2021). In 2024, daily maximum temperatures frequently reached or exceeded 31.5 °C for about a month from the end of February onwards (even reaching maximum values of 31.8 °C at the end of March) and always remained above 29.9 °C during 40 consecutive days. The consequences of these prolonged high temperatures highly affected giant clams, with 57 % of exploitable giant clams totally bleached and 43 % partially bleached, as estimated on 1 April 2024 in the area around the location of this thermistor.
These three iconic examples associated with heatwaves demonstrate the crucial importance of such in situ observations for a better understanding of thermal tolerance, physiological damages, and resilience of tropical marine organisms toward heat stress. Indeed, while satellites tend to capture roughly the same low-frequency temperature dynamics, large biases (more than 2 °C) are present and may prevent the study of ecosystem vulnerability. Moreover, these time series (Fiji versus New Caledonia) also illustrate the potential of such a geographically extensive network for studying spatial variability of coastal temperatures across regions, which can be very useful to study the regional heterogeneity of coastal thermal responses to climatic modes such as ENSO. Finally, at local scales, a high density of sensors inside the same lagoon, for example, can also provide valuable information for understanding smaller-scale spatial variability, which is not captured by state-of-art current satellite measurements such as MUR (Van Wynsberge et al., 2020).
6.2 Characterizing physical processes at various timescales
The temperature records from the ReefTEMPS network demonstrate the importance of capturing physical processes operating across multiple temporal scales. These measurements enable the differentiation of high-frequency variability, such as tidal or diurnal fluctuations, from lower-frequency signals associated with seasonal or interannual dynamics, thereby providing a comprehensive understanding of coastal oceanographic processes. Figure 6 shows examples of physical processes affecting temperature at different timescales as captured by the ReefTEMPS network. Here again, to highlight the crucial importance of in situ observation for temperature dynamics understanding, SST from OISST V2 and OSTIA satellites products is plotted for each time series. Figure 6a shows a 5 d temperature subset at the Uitoe 05 station (green curve), moored at 50 m depth on the external slope of the south-west lagoon barrier reef in New Caledonia, and the tidal elevation on the same period recomposed from the FES2012 global tide solution (black curve). Temperature drops (by sometimes more than 2 °C) are regularly observed at the M2 tidal wave frequency, which suggests an influence of internal tides of high amplitude around New Caledonia (Bendinger et al., 2023). As expected, the in situ data show that the satellite data at low and high resolutions are able to capture neither the amplitude observed nor the timescale linked to internal waves illustrating the strong asset of the in situ observations. At a similar frequency, the ReefTEMPS time series can also be used to characterize the diurnal temperature cycle, as depicted in Fig. 6b, which displays a 2-week temperature series using data from a sensor moored in the Reao Atoll lagoon in 2022. With an offset of more than 1.5 °C, the satellite data are not able to capture the level observed in the in situ signal. In addition to their primary interest in understanding the physical processes controlling daily and infra-daily temperature variability, documenting this range of variations may prove useful for benthic species, such as coral reefs, which can benefit from some relief during stressful thermal conditions (Wyatt et al., 2020; Oliver and Palumbi, 2011). Naturally, daily satellite products are not able to inform us about infra-daily variability, but Fig. 6a and b also illustrate mean biases introduced when using such SST products at the coastal scale in coral reef lagoons, especially when calculating coral vulnerability indices, such as bleaching indices (Van Wynsberge et al., 2017).
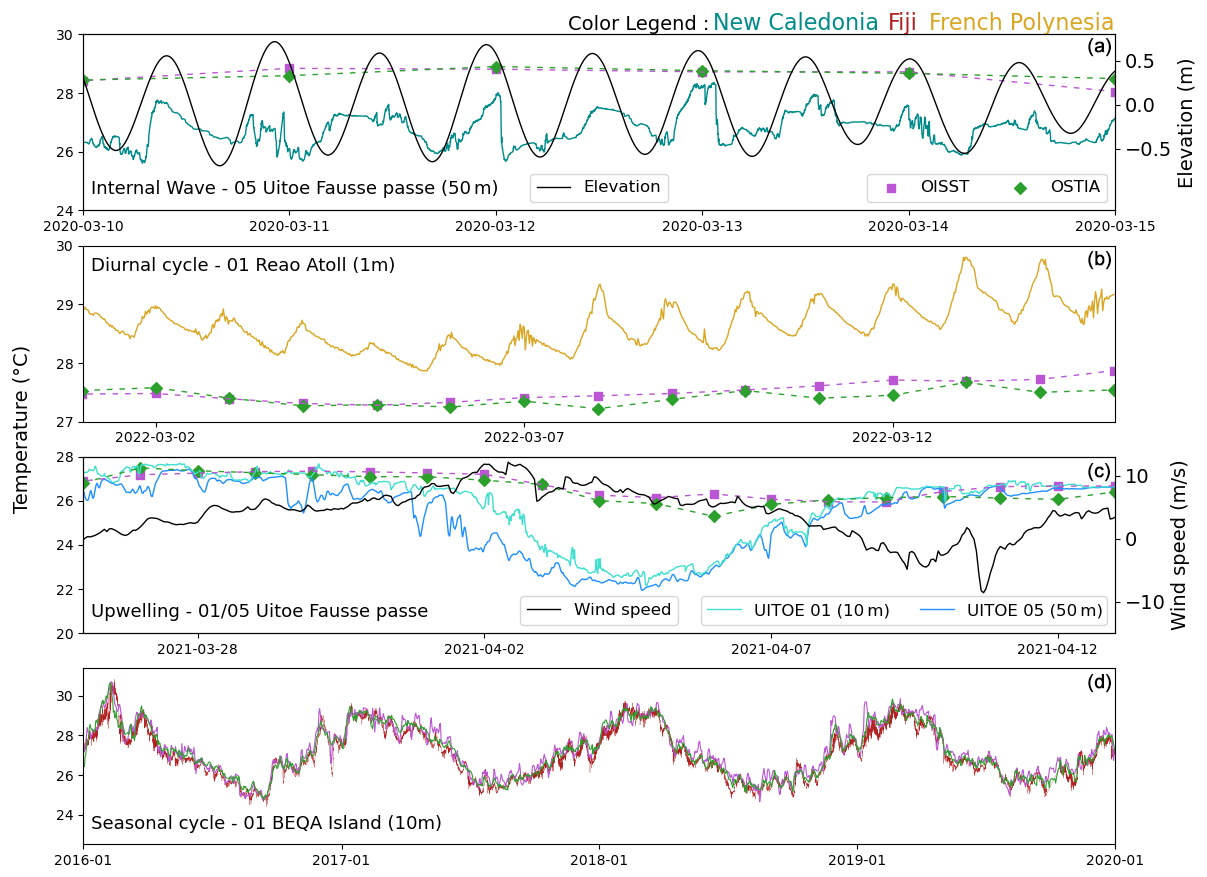
Figure 6Illustrations of several typical thermal signatures characterized in situ and using L4 daily satellite products (OISST V2 and OSTIA presented by respectively purple and green points). (a) Temperature drops due to internal tides at the false passage of Uitoe 05 in New Caledonia (dark cyan curve) and tidal elevation (black curve) recomposed from FES2012 tidal solution at the same station. (b) Diurnal cycle at Reao Atoll 01 (yellow curve) in French Polynesia. (c) Upwelling episode at the Fausse Passe de Uitoe 01 and Uitoe 05 stations (respectively 10 and 50 m depth). ERA5 wind speed projected along the northeast–southwest main axis of New Caledonia (Fig. 2) is plotted in a plain curve to illustrate the upwelling event as the wind accelerates on 2 April 2021. (d) Seasonal and interannual variability of temperature at Beqa Island 01 station in Fiji.
Another key process that can induce significant cooling on the outer slopes of barrier reefs is upwelling. One example is provided in Fig. 6d, where prolonged strong southeasterly trade winds flowing parallel to the coast triggered a wind-driven coastal upwelling episode in 2021 at station Fausse Passe de Uitoe 05 in New Caledonia, leading to an approx. 4 °C decrease in a few days. This important upwelling feature off the south-west lagoon of New Caledonia can strongly shape biogeochemical properties of the ocean in the direct vicinity of the lagoon (Alory et al., 2006; Ganachaud et al., 2010). Here again, in situ observation proves to be essential as satellite SST products fail to reflect the drops in temperature. Finally, Fig. 6d, which represents a 5-year subset of the temperature time series observed in Fiji (Beqa Island 01 station), highlights the usefulness of long-term data for understanding seasonal to interannual variability.
6.3 Long-term trends
Some of the historical stations from the ReefTEMPS network date back several decades. These are invaluable observations to assess the warming trends. Two of these long-term monthly homogenized time series (see Sect. 4.2) and associated trends are presented in Fig. 7a and b respectively. Both stations, at Anse Vata and Phare Amédée, are located inside the New Caledonia south-west lagoon, but the Anse Vata station is very close to the shore, whereas Phare Amédée is next to the ocean (see Sect. 2.1). Decadal trend computations were performed using Mann–Kendall tests combined with a Theil–Sen estimate of the linear trend with the pyMannKendall Python package (Hussain and Mahmud, 2019). The original Mann–Kendall test was used to compute trends on coldest months and warmer months, and the seasonal Mann–Kendall test was used on the monthly time series. Considering the entire observation periods, both stations exhibit increasing trends of 0.125 °C per decade and 0.127 °C per decade for Anse Vata and Phare Amédée respectively ( for both tests). Calculations using the warmest month of each year do not show any significant trend for any of the two stations. Conversely, trends on coldest months highlight a significant warming over the periods, with a warming slightly higher next to the ocean (Phare Amédée: 0.185 °C per decade) than close to the coast (Anse Vata: 0.159 °C per decade). Finally, it is important to point out that Seager et al. (2022) found, over five datasets of global open-ocean SSTs analysed over 1958–2018, a mean SST trend of ∼0.1 °C per decade around New Caledonia (see their Fig. 2), which is weaker than our in situ trends at Anse Vata and Phare Amédée.
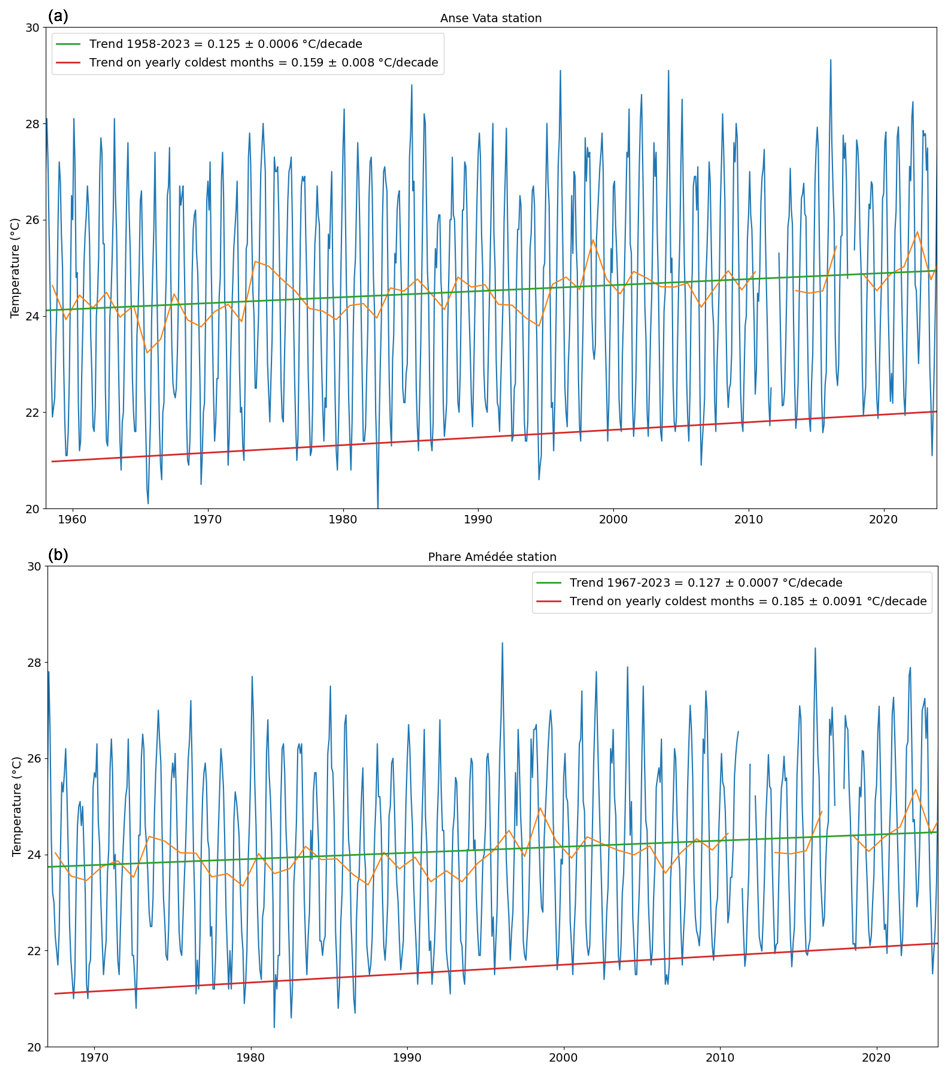
Figure 7Monthly temperature time series and trends at (a) Anse Vata station (1958–2023) and (b) Phare Amédée station (1967–2023). Orange lines are the annual mean time series, green lines trends computed over the whole period, red lines the trend computed on the yearly coldest months over the whole period.
Technical developments. As technologies and scientific needs are constantly evolving, the ReefTEMPS consortium develops new functionalities and methods to ensure data robustness, longevity of historical monitoring stations, improvement in the way of disseminating information, and establishment of new stations.
Concerning the IS and web portal, major evolutions have been underway since 2023 (see Sect. 5), but new developments are still in progress. The next one will concern the data exchange process for which the deployment of OGC SensorThings API will replace the Sensor Observation Service former protocol (see Appendix B). Concerning the workflow manager, decisions have been made to shift to a workflow manager based on the Apache Airflow open-source solution. Using a flow manager has the advantage of being able to adapt easily to the integration of new types of data such as real-time data.
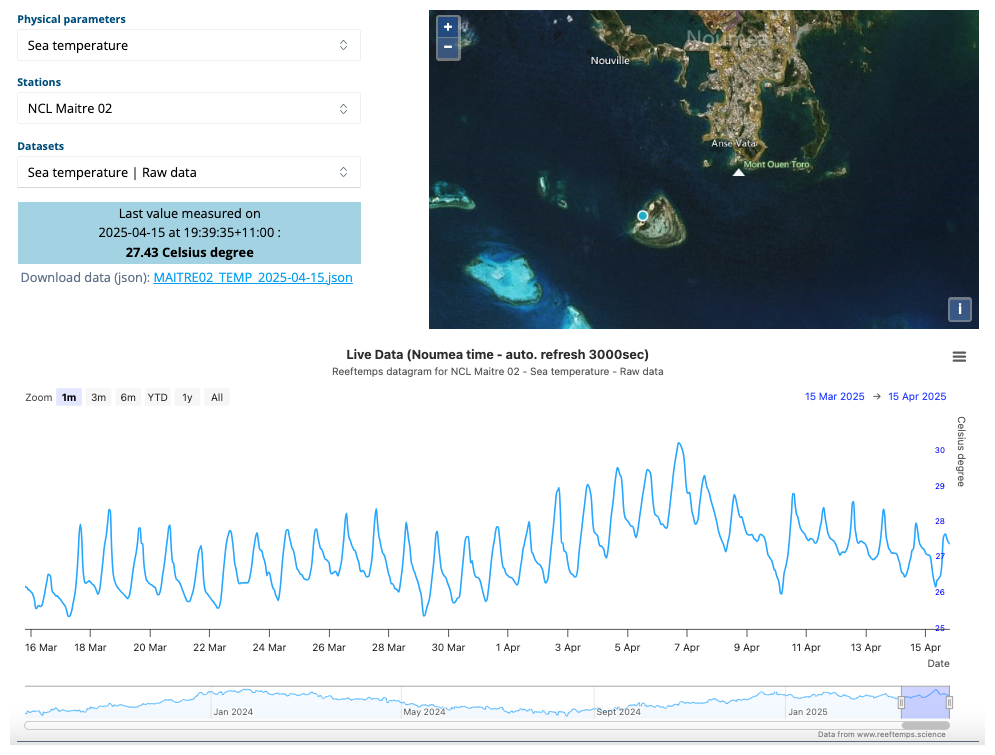
Figure 8Beta version of the live data web page available on the ReefTEMPS. The temperature time series is plotted at the blue point (Îlot Maître live station) on the map (https://www.reeftemps.science/en/live/, last access: 16 August 2025).
With the increasing threats posed by marine heatwaves on coral reefs, efforts are being put into implementing access to real-time SST observation, which allows for informing decision-makers on the risks of incoming marine heatwaves. Such systems have already been implemented at the Îlot Maître station (see Fig. 8). For the first station deployed in New Caledonia at Maître Island, it consists of an RBR Duet fixed underwater to a pile of one of the bungalows of the Hilton hotel and connected by an electronic cable to a Raspberry-type nanocomputer equipped with a LoRa transmission antenna. The measurements are recorded on a memory card on the Raspberry and sent in packets every 15 min by LoRaWan transmission. A LoRa receiver within radio range of the station recovers the data and transmits them over the internet. It is then recovered by the ReefTEMPS information system and processed into the database. Two strategies are envisioned for the future deployment of such real-time array:
-
A low-cost strategy whenever possible using Internet of Things (IoT) communication technology (Mattern and Floerkemeier, 2010), where a new station with such technology will be implemented at Phare Amédée during 2024.
-
A regular strategy with 4G or iridium transmission for stations where IoT cannot be implemented.
Figure 8 presents the beta version of live data at Îlot Maître available on the ReefTEMPS data portal web page. New developments are underway to display visualization of real-time indicators such as the degree heating week index (DHW) used in many instances to indicate a risk for coral bleaching (ref) or marine heatwave real-time information. These potential applications of real-time SST data can be crucial for public bodies and researchers to access information crucial for lagoon ecosystem vulnerability in terms of preparedness and management.
Quality perspectives. To ensure more rapid and robust controls of accuracy of observations given the remote locations of the Pacific countries to the instrument manufacturers, two new strategies have been introduced. First, a local SBE56 intercomparison protocol has been developed recently (Detandt and Varillon, 2024). The principle is that all SBE56 sensors are intercompared in a temperature-controlled tank (from 20 to 32 °C) with a reference sensor that has recently returned from calibration at the manufacturer (SEA-BIRD). The measured differences to the reference sensor must not exceed ±0.005 °C from the calibrated sensor, or that sensor is sent to the manufacturer for calibration. For stations in front of Nouméa, a second strategy that will enable robust data quality control as well as a characterization of the water column is a monthly visit of several stations to perform profiles over the water column with a calibrated SBE19PlusV2 CTD (conductivity–temperature–depth). Concerning long-term time series, a project has recently begun to convert raw data into daily (so far monthly) homogenized data to ensure a perfect reliability for computing trends and climate-induced warming. Finally, the Python tool developed for the qualification will need to be continued to provide a fully integrated tool that works directly on the DB-Oceano database and provides more statistical functionalities.
7.1 Future strategies for site selection
In all monitored PICTs, future strategy will first focus on maintaining historical long-term stations to provide a spatial view of the warming trends. In New Caledonia, the choice of new station locations will be guided to deeper investigate the signal deformation between open-ocean temperature and lagoon temperature. In Fiji, efforts will be made to maintain unbroken time series for the longest-established sites, such as Suva Reef and Rotuma, while expanding to new sites in the Lau Group and Vanua Levu. A major challenge has been the closing of some sites such as Batiki, Coral Coast, and Yasawa due to the loss of local partners. Another issue is the damage or loss of monitoring platforms (Beqa, Batiki) due to seasonal tropical cyclones. Furthermore, the ReefTEMPS working group also plans to deploy more vertical arrays on the external barrier reef slopes for a more thorough understanding of the processes leading to cooling (e.g. internal waves, upwelling). Future observation sites in French Polynesia will mainly be dedicated to important pearl farming atolls. In Fiji, such a pilot vertical array to 200 m depth had already been deployed on a mooring off the Coral Coast of Viti Levu Island as part of the VERTEMP project under the IRD JEAI COPRA between May and November 2018 and January 2019 and January 2020, sampling at 30 s intervals with an array of 10 SBE56 sensors. Finally, the coastal monitoring sites on Wallis and Futuna will also be re-instrumented in the near future.
7.2 Diversifying observations and ocean in ReefTEMPS
At present, ReefTEMPS is mostly based on an array of temperature sensors, but the increasing challenge of long-term coastal observations is to couple these measurements with other key measurements such as salinity, pressure sensors for coastal vulnerability issues, and biogeochemistry (e.g. pH, fluorescence, turbidity, and nutrient phytoplankton pigments) to monitor water quality and ecosystems. In our studies of the coral reef environment and bleaching surveillance, we perform regular in situ campaigns crossing ReefTEMPS stations with suites of physical and biological punctual measurements. The long-term plan for our coastal observing system is to systematically add to the automated temperature array other automated sensors to provide a more complete monitoring of the environment facing climate change. Along these lines, a long-term, reliable funding system has to be secured, which is a key challenge that will require strong involvement of the government agencies for which these measurements are performed and that are lacking at present. Nevertheless, even if this paper targeted temperature observations, ReefTEMPS is also labelled as SNOs (see Sect. 2.1) for other observables such as conductivity and pressure. Therefore, in addition to temperature, conductivity and pressure time series are also available at many stations through the ReefTEMPS open database. Some other key in situ time series have also been started in New Caledonia: pH continuous observations using in situ sensors, for example, at Fausse Passe de Uitoe or waves using spotter buoys. In Fiji, an experimental autonomous spectrophotometry-based pH sensor was deployed on several occasions at the VELEVU02 site near Suva in collaboration with the National Oceanography Centre (NOC) of the United Kingdom, and preliminary datasets were uploaded to the IOC-UNESCO SDG 14.3.1 data portal (https://oa.iode.org/, last access: 5 September 2024). We hope that such observations of in situ pH at this and other ReefTEMPS sites in Fiji are continued. Finally, the ReefTEMPS environment, quality observation, and practices are now extended to the Indian Ocean in La Réunion Island as a first step with the will to continue that collaborative effort with other Indian Ocean countries.
All station time series are available individually, in either ASCII or NetCDF formats, on the ReefTEMPS web portal: https://www.reeftemps.science/ (last access: 16 August 2025). The whole ReefTEMPS dataset is freely available in NetCDF format on the dedicated SEANOE repositories (Varillon et al., 2025: https://doi.org/10.17882/55128; Liao et al., 2025: https://doi.org/10.17882/82291) and updated every semester. File names, variable names, dimensions, and attributes, as well as quality flagging, follow international standards, in particular the OceanSITES and NERC Vocabulary Server conventions (see Sect. 5 and Appendix A).
The ReefTEMPS network presented in this paper represents a unique source of knowledge for understanding coastal temperature, salinity, and pressure dynamics in the South Pacific Ocean and for monitoring coral reef ecosystem thermal variability. The most striking feature that makes this network unique and extremely valuable is undoubtedly its geographical coverage (16 PICTs covered, 115 stations monitored) of temperature sensors and the duration of observations for some of its oldest monitoring stations (since 1958 for Anse Vata in New Caledonia). The network ensures open-access and quality-controlled in situ data that can be visualized and downloaded through the internet in ASCII and NetCDF formats according to the FAIR principles. The usefulness of these data is considerable as they can be used to investigate coastal and lagoon processes on different timescales, such as waves dynamics, upwelling, extreme marine heatwave events, tropical cyclone impacts, long-term interannual to decadal variabilities, and climate warming trends. The basin-scale distribution of the ReefTEMPS network is also crucial for accurately capturing the spatially heterogeneous impacts of large-scale climate phenomena, such as the El Niño–Southern Oscillation or the Pacific Decadal Oscillation. Finally, this in situ network is a key asset for validating the development of remotely sensed observations, which, at present, cannot represent the fine scale and high temporal resolution depicted by the ReefTEMPS network, and these data can be used for ocean model tuning and evaluations. In addition to highlighting the scientific value of the ReefTEMPS dataset, this paper aimed at bringing the ReefTEMPS network to the attention of as many researchers as possible and inviting interested partners from the Pacific Island countries and territories to join the initiative.
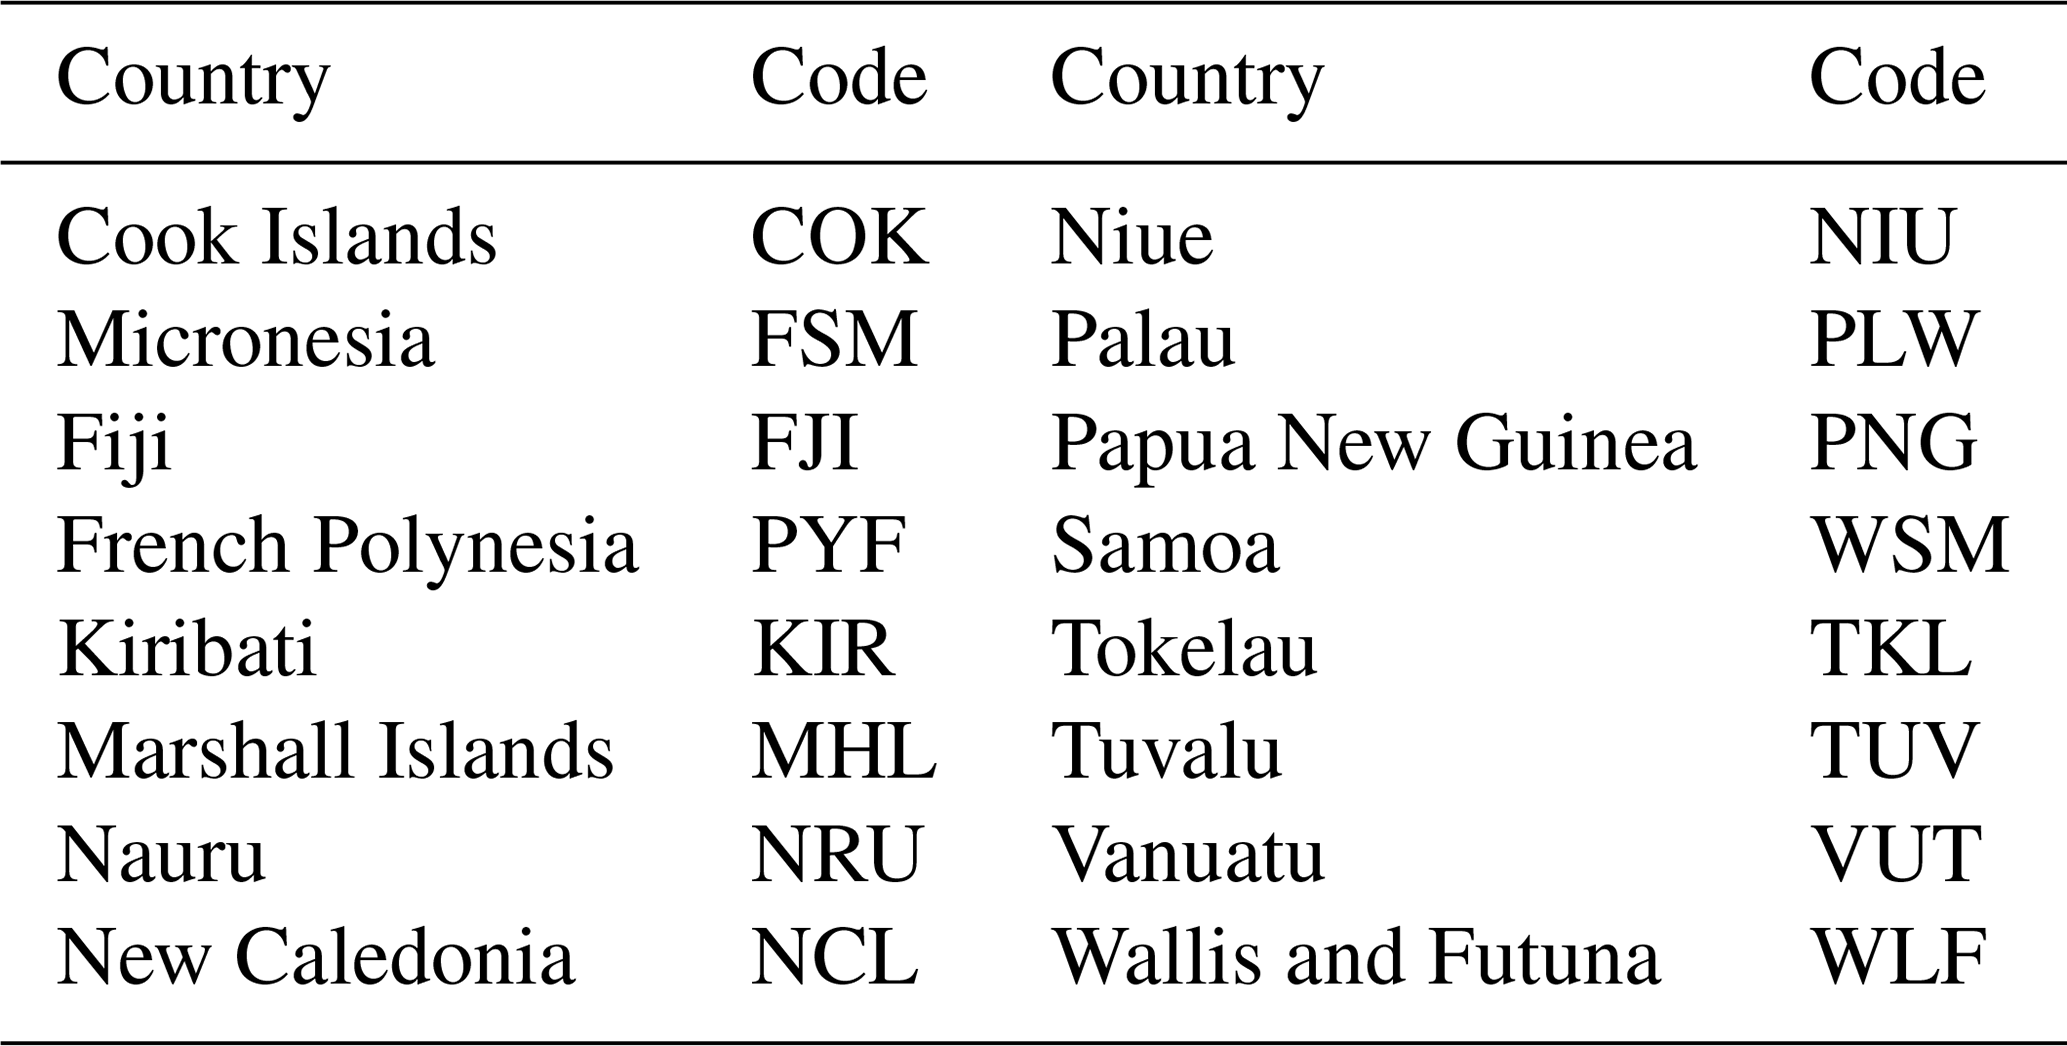
Table A2Instrument types (Fiat et al., 2024) derived from NERC L05 (https://vocab.nerc.ac.uk/collection/L05/current/, last access: 16 August 2025).
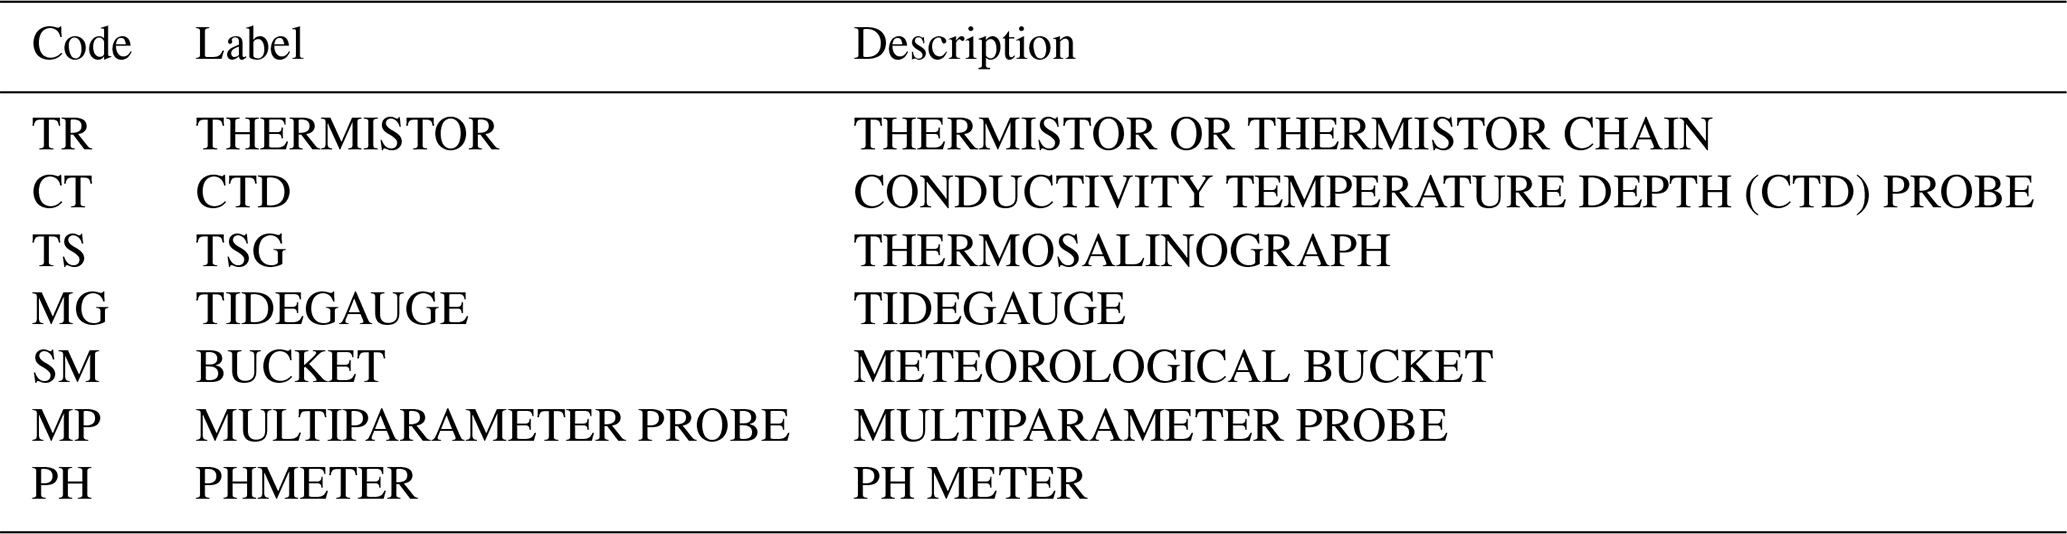
Table A3Processing states (Fiat et al., 2024) derived from NERC Vocabulary Server (NVS) R06 (https://vocab.nerc.ac.uk/collection/R06/current/, last access: 16 August 2025).
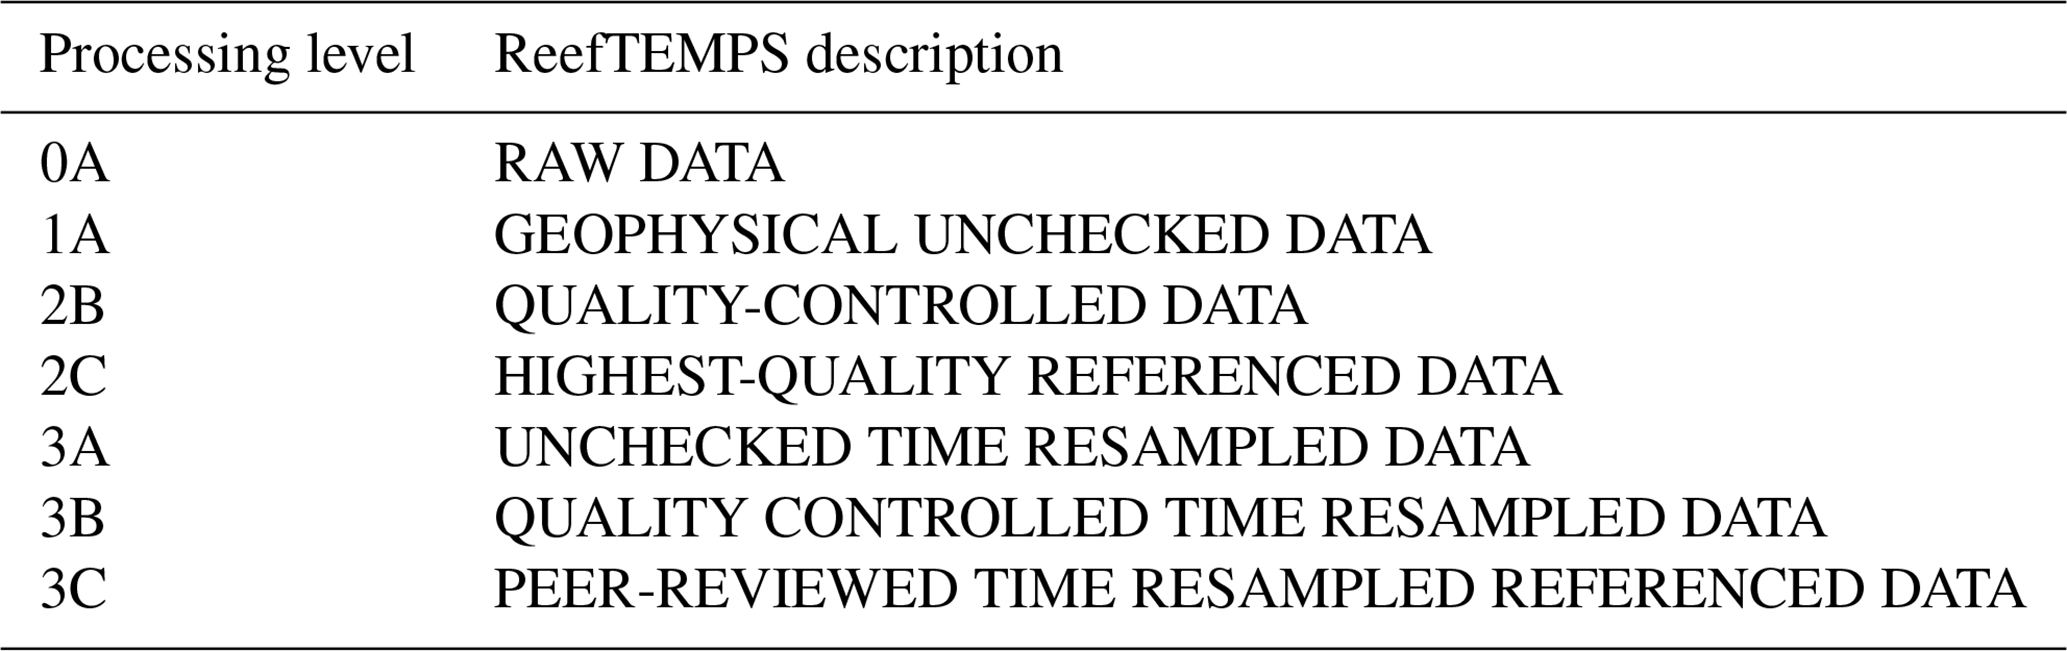
Table A4ReefTEMPS station information: names, positions, sensor type, depths, start and end dates, and total duration (days).
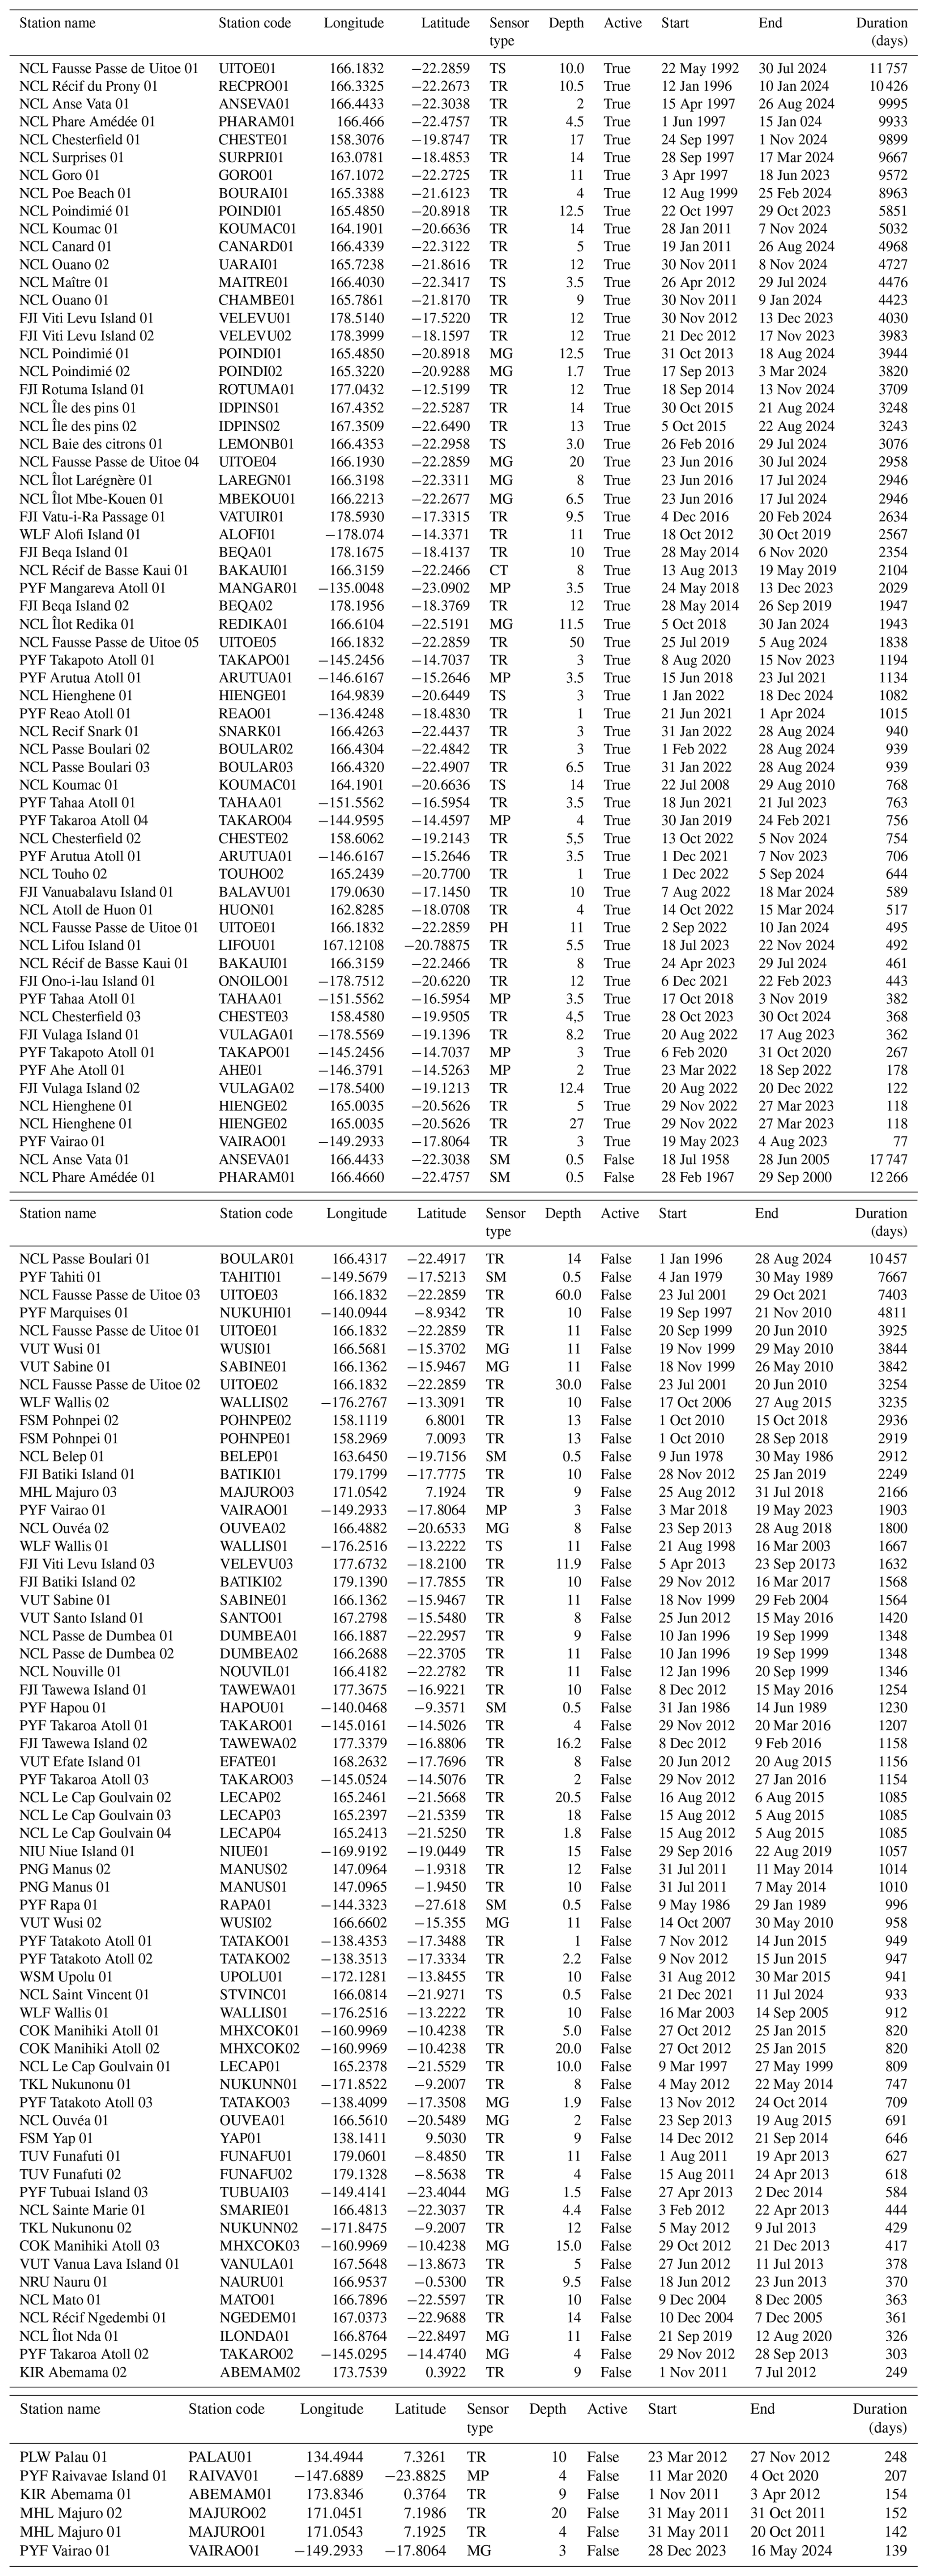
Table A5ReefTEMPS quality flags, derived from NERC Vocabulary Server (NVS) RD2 (https://vocab.nerc.ac.uk/collection/RD2/current, last access: 16 August 2025).
RLG, ALS, CM, SC, SF, and RH prepared the paper and designed the figures with contributions from all co-authors. All co-authors have been strongly involved in the ReefTEMPS network at some points in its life (in situ operations, web portal, organization, and processing and checking of data) or helped to raise funds to support it.
The contact author has declared that none of the authors has any competing interests.
Publisher's note: Copernicus Publications remains neutral with regard to jurisdictional claims made in the text, published maps, institutional affiliations, or any other geographical representation in this paper. While Copernicus Publications makes every effort to include appropriate place names, the final responsibility lies with the authors.
We would like to offer our warmest thanks here to all the researchers and technical staff (operators, scuba divers, boat drivers) who have contributed to the success of this network through the years, with special attention to the historical IRD team in IRD Nouméa and special thanks to Pierre Waigna and Christian Hénin, who greatly contributed to the development of the initial network. Our sincere thanks also go to the entire UAR IMAGO team over the years and especially Céline Bachelier, Damien Vignon, and Guillaume Detandt, who have contributed so much to the continuity of this network. We are also grateful to the Ministry of Marine Resources of Cook Islands for their support during field operations in Manihiki. Discussions with Gilles Reverdin on bucket sampling are also acknowledged.
Financial support has evolved over 6 decades but came mainly from the institutes themselves (ORSTOM, the French National Research Institute for Sustainable Development (IRD), The University of South Pacific (USP), The Pacific Community (SPC), the Marine Resources Department of the French Polynesia (DRM)), with the support of external resources (the ZONECO project of the New Caledonian Government, Ministère de l'Outre-Mer Français, GOPS (Grand Observatoire du Pacifique Sud)), and finally a long lasting and national support by the French Infrastructure for Coastal Oceans and Seashores (ILICO) with the French Ministry of Higher Education and Research (MESR) and the CNRS-INSU.
This paper was edited by Simona Simoncelli and reviewed by Vanessa Cardin and Nathaniel Bensoussan.
Alory, G., Vega, A., Ganachaud, A., and Despinoy, M.: Influence of upwelling, subsurface stratification, and heat fluxes on coastal sea surface temperature off southwestern New Caledonia, J. Geophys. Res., 111, C07023, https://doi.org/10.1029/2005JC003401, 2006.
Andréfouët, S., Van Wynsberge, S., Kabbadj, L., Wabnitz, C. C. C., Menkes, C., Tamata, T., Pahuatini, M., Tetairekie, I., Teaka, I., Scha, T. A., Teaka, T., and Remoissenet, G.: Adaptive management for the sustainable exploitation of lagoon resources in remote islands: lessons from a massive El Niño-induced giant clam bleaching event in the Tuamotu atolls (French Polynesia), Environ. Conserv., 45, 30–40, https://doi.org/10.1017/S0376892917000212, 2018.
Bailey, K., Steinberg, C., Davies, C., Galibert, G., Hidas, M., McManus, M. A., Murphy, T., Newton, J., Roughan, M., and Schaeffer, A.: Coastal Mooring Observing Networks and Their Data Products: Recommendations for the Next Decade, Front. Mar. Sci., 6, 180, https://doi.org/10.3389/fmars.2019.00180, 2019.
Bell, J. D., Cisneros-Montemayor, A., Hanich, Q., Johnson, J. E., Lehodey, P., Moore, B. R., Pratchett, M. S., Reygondeau, G., Senina, I., Virdin, J., and Wabnitz, C. C. C.: Adaptations to maintain the contributions of small-scale fisheries to food security in the Pacific Islands, Mar. Policy, 88, 303–314, https://doi.org/10.1016/j.marpol.2017.05.019, 2017.
Bendinger, A., Cravatte, S., Gourdeau, L., Brodeau, L., Albert, A., Tchilibou, M., Lyard, F. and Vic, C. Regional modeling of internal-tide dynamics around New Caledonia – Part 1: Coherent internal-tide characteristics and sea surface height signature, Ocean Sci., 19, 1315–1338, https://doi.org/10.5194/os-19-1315-2023, 2023.
Brissebrat, G., Fiat, S., Andriatiana, A., Grelet, J., Pelletier, B., and Hocdé, R.: Sensor Observation System : optimization of a sensors-oriented environmental information system – example of the SI of the ReefTEMPS observation network [Poster], in: 12th edition of JRES “Journey to the center of the virtual”, 14–17 November 2017, Nantes, http://www.documentation.ird.fr/hor/fdi:010071792 (last access: 16 August 2025), 2017.
Caussinus, H. and Mestre, O.: Detection and Correction of Artificial Shifts in Climate Series, J. Roy. Stat. Soc. Ser. C, 53, 405–425, https://doi.org/10.1111/j.1467-9876.2004.05155.x, 2004.
Cavarero, V., Peltier, A., Aubail, X., Leroy, A., Dubuisson, B., Jourdain, S., and Ganachaud, A.: Les Évolutions Passées Et Futures Du Climat De La Nouvelle-Calédonie, La Météorologie, 8, 13, https://doi.org/10.4267/2042/47371, 2012.
Chin, T. M., Vazquez-Cuervo, J., and Armstrong, E. M.: A multi-scale high-resolution analysis of global sea surface temperature, Remote Sens. Environ., 200, 154–169, https://doi.org/10.1016/j.rse.2017.07.029, 2017.
Cocquempot, L., Delacourt, C., Paillet, J., Riou, P., Aucan, J., Castelle, B., Charria, G., Claudet, J., Conan, P., Coppola, L., Hocdé, R., Planes, S., Raimbault, P., Savoye, N., Testut, L., and Vuillemin, R.: Coastal Ocean and Nearshore Observation: A French Case Study, Front. Mar. Sci., 6, 324, https://doi.org/10.3389/fmars.2019.00324, 2019.
Colin, P. L. and Johnston, T. M. S.: Measuring Temperature in Coral Reef Environments: Experience, Lessons, and Results from Palau, J. Mar. Sci. Eng., 8, 680, https://doi.org/10.3390/jmse8090680, 2020.
Coral Reef Research Foundation and Colin, P.: Ocean Warming and the Reefs of Palau, Oceanography, 31, 126–135, https://doi.org/10.5670/oceanog.2018.214, 2018.
Dahlke, F. T., Wohlrab, S., Butzin, M., and Pörtner, H.-O.: Thermal bottlenecks in the life cycle define climate vulnerability of fish, Science, 369, 65–70, https://doi.org/10.1126/science.aaz3658, 2020.
Dandonneau, Y.: Prendre sa température à la mer, ORSTOM Actualités, 2–4, https://www.documentation.ird.fr/hor/fdi:010026422 (last access: 16 August 2025), 1986.
DeCarlo, T. M., Harrison, H. B., Gajdzik, L., Alaguarda, D., Rodolfo-Metalpa, R., D'Olivo, J., Liu, G., Patalwala, D., and McCulloch, M. T.: Aclimatization of massive reef-building corals to consecutive heatwaves, P. Roy. Soc. B, 286, 20190235, https://doi.org/10.1098/rspb.2019.0235, 2019.
Detandt, G. and Varillon, D.: [UAR191] Protocole d'inter comparaison de capteurs de température, de type SBE56, en cuve, Version 1.0, Zenodo [data set], https://doi.org/10.5281/zenodo.11115833, 2024.
Dutheil, C., Lal, S., Lengaigne, M., Cravatte, S., Menkes, C., Receveur, A., Börgel, F., Gröger, M., Houlbreque, F., Le Gendre, R., Mangolte, I., Peltier, A., and Markus-Meir, H. E.: The massive 2016 marine heatwave in the Southwest Pacific: an “El Niño–Madden-Julian Oscillation” compound event, Sci. Adv., 10, eadp2948, https://doi.org/10.1126/sciadv.adp2948, 2024.
Fiat, S., Aucan, J., Varillon, D., and Hocdé, R.: ReefTEMPS, FAIRs access to Reef ecosystem environmental measurements [poster], in: International Conference on Marine Data and Information Systems, IMDIS 2021, 14 April 2021, Amsterdam, the Netherlands, https://www.documentation.ird.fr/hor/fdi:010083020 (last access: 16 August 2025), 2021.
Fiat, S., Varillon, D., Cordier, E., and Grelet, J.: Vocabulaires des métadonnées utilisées par le SNO ReefTEMPS et leurs correspondances avec les vocabulaires nationaux et internationaux, Version 1.0, Zenodo [data set], https://doi.org/10.5281/zenodo.11350556, 2024.
Ganachaud, A., Vega, A., Rodier, M., Dupouy, C., Maes, C., Marchesiello, P., Eldin, G., Ridgway, K., and Le Borgne, R.: Observed impact of upwelling events on water properties and biological activity off the southwest coast of New Caledonia, Marine Pollut. Bull., 61, 449–464, https://doi.org/10.1016/j.marpolbul.2010.06.042, 2010.
GEBCO Compilation Group: GEBCO_2022 Grid, https://doi.org/10.5285/e0f0bb80-ab44-2739-e053-6c86abc0289c, 2022.
Goebeler, N., Norkko, A., and Norkko, J.: Ninety years of coastal monitoring reveals baseline and extreme ocean temperatures are increasing off the Finnish coast, Commun. Earth Environ., 3, 215, https://doi.org/10.1038/s43247-022-00545-z, 2022.
Goreau, T., McClanahan, T., Hayes, R., and Strong, A.: Conservation of Coral Reefs after the 1998 Global Bleaching Event, Conserv. Biol., 14, 5–15, https://doi.org/10.1046/j.1523-1739.2000.00011.x, 2000.
Green, R. H., Lowe, R. J., Buckley, M. L., Foster, T., and Gilmour, J. P.: Physical mechanisms influencing localized patterns of temperature variability and coral bleaching within a system of reef atolls, Coral Reefs, 38, 759–771, https://doi.org/10.1007/s00338-019-01771-2, 2019.
Grimaldi, C. M., Lowe, R. J., Benthuysen, J. A., Cuttler, M. V. W., Green, R. H., and Gilmour, J. P.: Hydrodynamic and atmospheric drivers create distinct thermal environments within a coral reef atoll, Coral Reefs, 42, 693–706, https://doi.org/10.1007/s00338-023-02371-x, 2023.
Guyennon, A.: Homogénéisation des données de température de stations océaniques côtières autour de la Nouvelle-Calédonie: évolution et projection climatique, Sciences de la Mer, Océanographie Physique, Rapport de stage M2, Institut de Recherche pour le Développement, Nouméa, 2010.
Herdman, L. M. M., Hench, J. L., and Monismith, S. G.: Heat balances and thermally driven lagoon-ocean exchanges on a tropical coral reef system (Moorea, French Polynesia), J. Geophys. Res.-Oceans, 120, 1233–1252, https://doi.org/10.1002/2014JC010145, 2015.
Hobday, A. J., Alexander, L. V., Perkins, S. E., Smale, D. A., Straub, S. C., Oliver, E. C., Benthuysen, J. A., Burrows, M. T., Donat, M. G., Feng, M., Holbrook, N. J., Moore, P. J., Scannell, H. A., Sen Gupta, A., and Wernberg, T.: A hierarchical approach to defining marine heatwaves, Prog. Oceanogr., 141, 227–238, https://doi.org/10.1016/j.pocean.2015.12.014, 2016.
Hocdé, R. and Fiat, S.: Le système d'information du “réseau de capteurs de température des eaux côtières dans la région du Pacifique Sud et Sud-Ouest”, in: Netcom, Special issue “Les données environnementales en libre accès: politiques, expériences, usages”, Netcom, 27 170–173, https://doi.org/10.4000/netcom.1294, 2013.
Hocdé, R., Fiat, S., Varillon, D., Magron, F., Allenbach, M., Hoibian, T., N'Yeurt, A. D. R., Le Gendre, R., Ganachaud, A., Menkes, C., Pelletier, B., and Aucan, J.: ReefTEMPS documente l'impact local du changement climatique et les paramètres qui influent sur la résilience des écosystèmes récifaux. EvolEco 2021 Long Term Evolution of Coastal Ecosystems, 2–5 November 2021, La Rochelle, France, https://ird.hal.science/ird-03774373 (last access: 16 August 2025), 2021.
Hoekstra, J. M., Molnar, J. L., Jennings, M., Revenga, C., Spalding, M. D., Boucher, T. M., Robertson, J. C., Heibel, T. J, and Ellison, K.: The atlas of global conservation: changes, challenges, and opportunities to make a difference, University of California Press, 2010.
Holbrook, N. J., Hernaman, V., Koshiba, S., Lako, J., Kajtar, J. B., Amosa, P., and Singh, A.: Impacts of marine heatwaves on tropical western and central Pacific Island nations and their communities, Global Planet. Change, 208, 103680, https://doi.org/10.1016/j.gloplacha.2021.103680, 2022.
Hughes, T. P., Kerry, J. T., Álvarez-Noriega, M., Álvarez-Romero, J. G., Anderson, K. D., Baird, A. H.,. Babcock, R. C., Beger, M., Bellwood, D. R., Berkelmans, R., Bridge, T. C., Butler, I. R., Byrne, M., Cantin, N. E., Comeau, S., Connolly, S. R., Cumming, G. S., Dalton, S. J., Diaz-Pulido, G., Eakin, C. M., Figueira, W. F., Gilmour, J. P., Harrison, H. B., Heron, S. F., Hoey, A. S., Hobbs, J.-P. A., Hoogenboom, M. O., Kennedy, E. V., Kuo, C., Lough, J. M., Lowe, R. J., Liu, G., McCulloch, M. T., Malcolm, H. A., McWilliam, M. J., Pandolfi, J. M., Pears, R. J., Pratchett, M. S., Schoepf, V., Simpson, T., Skirving, W. J., Sommer, B., Torda, G., Wachenfeld, D. R., Willis, B. L., and Wilson, S. K.: Global warming and recurrent mass bleaching of corals, Nature, 543, 373–377, https://doi.org/10.1038/nature21707, 2017.
Hussain, M. and Mahmud, I.: pyMannKendall: a python package for non parametric Mann Kendall family of trend tests, J. Open Sour. Softw., 4, 1556, https://doi.org/10.21105/joss.01556, 2019.
IPCC – Intergovernmental Panel On Climate Change: Climate Change 2021 – The Physical Science Basis: Working Group I Contribution to the Sixth Assessment Report of the Intergovernmental Panel on Climate Change, in: 1st Edn., Cambridge University Press, https://doi.org/10.1017/9781009157896, 2023.
IR ILICO: SNO ReefTEMPS, Plan de gestion des données du SNO ReefTEMPS – Réseau d'observation des eaux côtières dans la région du Pacifique sud, ouest et sud-ouest, Ifremer, https://doi.org/10.13155/94550, 2023.
Kurihara, Y., Murakami, H., and Kachi, M.: Sea surface temperature from the new Japanese geostationary meteorological Himawari-8 satellite, Geophys. Res. Lett., 43, 1234–1240, https://doi.org/10.1002/2015GL067159, 2016.
Kurylyk, B. L. and Smith, K. A.: Stuck in the middle: thermal regimes of coastal lagoons and estuaries in a warming world, Environ. Res. Lett., 18, 061003, https://doi.org/10.1088/1748-9326/acd5e5, 2023.
Leichter, J., Alldredge, A., Bernardi, G., Brooks, A., Carlson, C., Carpenter, R., Edmunds, P., Fewings, M., Hanson, K., Hench, J., Holbrook, S., Nelson, C., Schmitt, R., Toonen, R., Washburn, L., and Wyatt, A.: Biological and Physical Interactions on a Tropical Island Coral Reef: Transport and Retention Processes on Moorea, French Polynesia, Oceanography, 26, 52–63, https://doi.org/10.5670/oceanog.2013.45, 2013.
Liao, V., Follin, Y., Costes, L., Germain, C., and Trophime, T.: RESOLAG: The French Polynesian lagoon monitoring network, SEANOE [data set], https://doi.org/10.17882/82291, 2025.
Lynch, T. P., Morello, E. B., Evans, K., Richardson, A. J., Rochester, W., Steinberg, C. R., Roughan, M., Thompson, P., Middleton, J. F., Feng, M., Sherrington, R., Brando, V., Tilbrook, B., Ridgway, K., Allen, S., Doherty, P., Hill, K., and Moltmann, T. C.: IMOS National Reference Stations: A Continental-Wide Physical, Chemical and Biological Coastal Observing System, PLoS ONE, 9, e113652, https://doi.org/10.1371/journal.pone.0113652, 2014.
Malone, T. C., DiGiacomo, P. M., Gonçalves, E., Knap, A. H., Talaue-McManus, L., and de Mora, S.: A global ocean observing system framework for sustainable development, Mar. Policy, 43, 262–272, https://doi.org/10.1016/j.marpol.2013.06.008,2014.
Maragos, J. E. and Williams, G. J.: Pacific Coral Reefs: An Introduction, in: Encyclopedia of Modern Coral Reefs, edited by: Hopley, D., Springer Netherlands, Dordrecht, 753–776, https://doi.org/10.1007/978-90-481-2639-2_122, 2011.
Mattern, F. and Floerkemeier, C.: From the Internet of Computers to the Internet of Things, in: From Active Data Management to Event-Based Systems and More, vol. 6462, edited by: Sachs, K., Petrov, I., and Guerrero, P., Springer, Berlin, Heidelberg, 242–259, https://doi.org/10.1007/978-3-642-17226-7_15, 2010.
McCabe, R. M., Estrade, P., Middleton, J. H., Melville, W. K., Roughan, M., and Lenain, L.: Temperature variability in a shallow, tidally isolated coral reef lagoon, J. Geophys. Res., 115, 2009JC006023, https://doi.org/10.1029/2009JC006023, 2010.
Minnett, P. J., Alvera-Azcárate, A., Chin, T. M., Corlett, G. K., Gentemann, C. L., Karagali, I., Li, X., Marsouin, A., Marullo, S., Maturi, E., Santoleri, R., Saux Picart, S., Steele, M., and Vazquez-Cuervo, J.: Half a century of satellite remote sensing of sea-surface temperature, Remote Sens. Environ., 233, 111366, https://doi.org/10.1016/j.rse.2019.111366, 2019.
Oliver, E. C. J., Donat, M. G., Burrows, M. T., Moore, P. J., Smale, D. A., Alexander, L. V., Benthuysen, J. A., Feng, M., Sen Gupta, A., Hobday, A. J., Holbrook, N. J., Perkins-Kirkpatrick, S. E., Scannell, H. A., Straub, S. C., and Wernberg, T.: Longer and more frequent marine heatwaves over the past century, Nat. Commun., 9, 1324, https://doi.org/10.1038/s41467-018-03732-9, 2018.
Oliver, T. A. and Palumbi, S. R.: Do fluctuating temperature environments elevate coral thermal tolerance?, Coral Reefs, 30, 429–440, https://doi.org/10.1007/s00338-011-0721-y, 2011.
Payri, C. E., Benzoni, F., André, Laure. V., and Houlbrèque, F.: Chapitre 25. Le blanchissement corallien de 2016, in: Nouvelle-Calédonie, edited by: Payri, C. E., IRD Éditions, 161–166, https://doi.org/10.4000/books.irdeditions.28127, 2018.
Pinsky, M. L., Selden, R. L., and Kitchel, Z. J.: Climate-Driven Shifts in Marine Species Ranges: Scaling from Organisms to Communities, Annu. Rev. Mar. Sci., 12, 153–179, https://doi.org/10.1146/annurev-marine-010419-010916, 2020.
Potemra, J., Maurer, J., and Burns, E. S.: Providing Oceanographic Data and Information to Pacific Island Communities, in: Oceanographic and Marine Cross-Domain Data Management for Sustainable Development, 253–281, https://doi.org/10.4018/978-1-5225-0700-0.ch011, 2017.
Reid, E. C., Lentz, S. J., DeCarlo, T. M., Cohen, A. L., and Davis, K. A.: Physical Processes Determine Spatial Structure in Water Temperature and Residence Time on a Wide Reef Flat, J. Geophys. Res.-Oceans, 125, e2020JC016543, https://doi.org/10.1029/2020JC016543, 2020.
Reynolds, R. W., Smith, T. M., Liu, C., Chelton, D. B., Casey, K. S., and Schlax, M. G.: Daily High-Resolution-Blended Analyses for Sea Surface Temperature, J. Climate, 20, 5473–5496, https://doi.org/10.1175/2007JCLI1824.1, 2007.
Righetti, D., Vogt, M., Gruber, N., Psomas, A., and Zimmermann, N. E.: Global pattern of phytoplankton diversity driven by temperature and environmental variability, Sci. Adv., 5, eaau6253, https://doi.org/10.1126/sciadv.aau6253, 2019.
Rivera, H. E., Cohen, A. L., Thompson, J. R., Baums, I. B., Fox, M. D., and Meyer-Kaiser, K. S.: Palau's warmest reefs harbor thermally tolerant corals that thrive across different habitats, Commun. Biol., 5, 1394, https://doi.org/10.1038/s42003-022-04315-7, 2022.
Rogers, J. S., Monismith, S. G., Koweek, D. A., Torres, W. I., and Dunbar, R. B.: Thermodynamics and hydrodynamics in an atoll reef system and their influence on coral cover: Atoll Thermal & Hydro-Dynamics & Coral Effects, Limnol. Oceanogr., 61, 2191–2206, https://doi.org/10.1002/lno.10365, 2016.
Rowley, S. J., Roberts, T. E., Coleman, R. R., Spalding, H. L., Joseph, E., and Dorricott, M. K. L.: Pohnpei, Federated States of Micronesia, in: Mesophotic Coral Ecosystems, vol. 12, edited by: Loya, Y., Puglise, K. A., and Bridge, T. C. L., Springer International Publishing, Cham, 301–320, https://doi.org/10.1007/978-3-319-92735-0_17, 2019.
Safaie, A., Silbiger, N. J., McClanahan, T. R., Pawlak, G., Barshis, D. J., Hench, J. L., Rogers, J. S., Williams, G. J., and Davis, K. A.: High frequency temperature variability reduces the risk of coral bleaching, Nat. Commun., 9, 1671, https://doi.org/10.1038/s41467-018-04074-2, 2018.
Salat, J., Pascual, J., Flexas, M., Chin, T. M., and Vazquez-Cuervo, J.: Forty-five years of oceanographic and meteorological observations at a coastal station in the NW Mediterranean: a ground truth for satellite observations, Ocean Dynam., 69, 1067–1084, https://doi.org/10.1007/s10236-019-01285-z, 2019.
Santavy, D. L., Horstmann, C. L., Sharpe, L. M., Yee, S. H., and Ringold, P.: What is it about coral reefs? Translation of ecosystem goods and services relevant to people and their well-being, Ecosphere, 12, e03639, https://doi.org/10.1002/ecs2.3639, 2021.
Seager, R., Henderson, N., and Cane, M.: Persistent Discrepancies between Observed and Modeled Trends in the Tropical Pacific Ocean, J. Climate, 35, 4571–4584, https://doi.org/10.1175/JCLI-D-21-0648.1, 2022.
Smale, D. A., Wernberg, T., Oliver, E. C. J., Thomsen, M., Harvey, B. P., Straub, S. C., Burrows, M. T., Alexander, L. V., Benthuysen, J. A., Donat, M. G., Feng, M., Hobday, A. J., Holbrook, N. J., Perkins-Kirkpatrick, S. E., Scannell, H. A., Sen Gupta, A., Payne, B. L., and Moore, P. J.: Marine heatwaves threaten global biodiversity and the provision of ecosystem services, Nat. Clim. Change, 9, 306–312, https://doi.org/10.1038/s41558-019-0412-1, 2019.
Schlegel, R. W., Oliver, E. C. J., Wernberg, T., and Smit, A. J.: Nearshore and offshore co-occurrence of marine heatwaves and cold-spells, Prog. Oceanogr., 151, 189–205, https://doi.org/10.1016/j.pocean.2017.01.004, 2017.
Siedlecki, S. A., Pilcher, D., Howard, E. M., Deutsch, C., MacCready, P., Norton, E. L., Frenzel, H., Newton, J., Feely, R. A., Alin, S. R., and Klinger, T.: Coastal processes modify projections of some climate-driven stressors in the California Current System, Biogeosciences, 18, 2871–2890, https://doi.org/10.5194/bg-18-2871-2021, 2021.
Smit, A. J., Roberts, M., Anderson, R. J., Dufois, F., Dudley, S. F. J., Bornman, T. G., Olbers, J., and Bolton, J. J.: A Coastal Seawater Temperature Dataset for Biogeographical Studies: Large Biases between In Situ and Remotely-Sensed Data Sets around the Coast of South Africa, PLoS ONE, 8, e81944, https://doi.org/10.1371/journal.pone.0081944, 2013.
Van Wynsberge, S., Menkes, C., Le Gendre, R., Passfield, T., and Andréfouët, S.: Are Sea Surface Temperature satellite measurements reliable proxies of lagoon temperature in the South Pacific?, Estuar. Coast. Shelf Sci., 199, 117–124, https://doi.org/10.1016/j.ecss.2017.09.033, 2017.
Van Wynsberge, S., Le Gendre, R., Sangare, N., Aucan, J., Menkes, C., Liao, V., and Andréfouët, S.: Monitoring pearl farming lagoon temperature with global high resolution satellite-derived products: An evaluation using Raroia Atoll, French Polynesia, Mar. Pollut. Bull., 160, 111576, https://doi.org/10.1016/j.marpolbul.2020.111576, 2020.
Varillon, D., Fiat, S., De Ramon N'Yeurt, A., Le Gendre R., Ganachaud, A., Aucan, J., Hocdé, R., and Menkes, C.: ReefTEMPS: The Pacific Island coastal ocean observation network, Seanoe [data set], https://doi.org/10.17882/55128, 2025.
Wang, X. L., Chen, H., Wu, Y., Feng, Y., and Pu, Q.: New Techniques for the Detection and Adjustment of Shifts in Daily Precipitation Data Series, J. Appl. Meteorol. Clim., 49, 2416–2436, https://doi.org/10.1175/2010JAMC2376.1, 2010.
Wong, A. P. S., Wijffels, S. E., Riser, S. C., Pouliquen, S., Hosoda, S., Roemmich, D., Gilson, J., Johnson, G. C., Martini, K., Murphy, D. J., Scanderbeg, M., Bhaskar, T. V. S. U., Buck, J. J. H., Merceur, F., Carval, T., Maze, G., Cabanes, C., André, X., Poffa, N., Yashayaev, I., Barker, P. M., Guinehut, S., Belbéoch, M., Ignaszewski, M., Baringer, M. O., Schmid, C., Lyman, J. M., McTaggart, K. E., Purkey, S. G., Zilberman, N., Alkire, M. B., Swift, D., Owens, W. B., Jayne, S. R., Hersh, C., Robbins, P., West-Mack, D., Bahr, F., Yoshida, S., Sutton, P. J. H., Cancouët, R., Coatanoan, C., Dobbler, D., Juan, A. G., Gourrion, J., Kolodziejczyk, N., Bernard, V., Bourlès, B., Claustre, H., D'Ortenzio, F., Le Reste, S., Le Traon, P.-Y., Rannou, J.-P., Saout-Grit, C., Speich, S., Thierry, V., Verbrugge, N., Angel-Benavides, I. M., Klein, B., Notarstefano, G., Poulain, P.-M., Vélez-Belchí, P., Suga, T., Ando, K., Iwasaska, N., Kobayashi, T., Masuda, S., Oka, E., Sato, K., Nakamura, T., Sato, K., Takatsuki, Y., Yoshida, T., Cowley, R., Lovell, J. L., Oke, P. R., Van Wijk, E. M., Carse, F., Donnelly, M., Gould, W. J., Gowers, K., King, B. A., Loch, S. G., Mowat, M., Turton, J., Rama Rao, E. P., Ravichandran, M., Freeland, H. J., Gaboury, I., Gilbert, D., Greenan, B. J. W., Ouellet, M., Ross, T., Tran, A., Dong, M., Liu, Z., Xu, J., Kang, K., Jo, H., Kim, S. D., and Park, H. M.: Argo Data 1999–2019: Two Million Temperature-Salinity Profiles and Subsurface Velocity Observations From a Global Array of Profiling Floats, Front. Mar. Sci., 7, 700, https://doi.org/10.3389/fmars.2020.00700, 2020.
Wilkinson, M. D., Dumontier, M., Aalbersberg, Ij. J., Appleton, G., Axton, M., Baak, A., Blomberg, N., Boiten, J.-W., Da Silva Santos, L. B., Bourne, P. E., Bouwman, J., Brookes, A. J., Clark, T., Crosas, M., Dillo, I., Dumon, O., Edmunds, S., Evelo, C. T., Finkers, R., Gonzalez-Beltran, A., Gray, A. J. G., Groth, P., Goble, C., Grethe, J. S., Heringa, J., ’T Hoen, P. A. C., Hooft, R., Kuhn, T., Kok, R., Kok, J., Lusher, S. J., Martone, M. E., Mons, A., Packer, A. L., Persson, B., Rocca-Serra, P., Roos, M., Van Schaik, R., Sansone, S.-A., Schultes, E., Sengstag, T., Slater, T., Strawn, G., Swertz, M. A., Thompson, M., Van Der Lei, J., Van Mulligen, E., Velterop, J., Waagmeester, A., Wittenburg, P., Wolstencroft, K., Zhao, J., and Mons, B.: The FAIR Guiding Principles for scientific data management and stewardship, Sci. Data, 3, 160018, https://doi.org/10.1038/sdata.2016.18, 2016.
Wyatt, A. S. J., Leichter, J. J., Toth, L. T., Miyajima, T., Aronson, R. B., and Nagata, T.: Heat accumulation on coral reefs mitigated by internal waves, Nat. Geosci., 13, 28–34, https://doi.org/10.1038/s41561-019-0486-4, 2020.
- Abstract
- Introduction
- ReefTEMPS: coastal temperature monitoring in the Pacific Islands
- Sampling devices
- Processing and quality control
- Data management and dissemination – open access
- Some examples of key applications
- Ongoing developments and perspectives
- Data availability
- Conclusion
- Appendix A
- Appendix B
- Author contributions
- Competing interests
- Disclaimer
- Acknowledgements
- Financial support
- Review statement
- References