the Creative Commons Attribution 4.0 License.
the Creative Commons Attribution 4.0 License.
 | 10 Oct 2025
The 2024 Noto Peninsula earthquake building damage dataset: multi-source visual assessment
Ruben Vescovo
Bruno Adriano
Sesa Wiguna
Chia Yee Ho
Jorge Morales
Xuanyan Dong
Shin Ishii
Kazuki Wako
Yudai Ezaki
Ayumu Mizutani
Erick Mas
Satoshi Tanaka
Shunichi Koshimura
We present a building damage dataset following the 2024 Noto Peninsula earthquake. The database was compiled from freely available, multi-source, remote sensing data, verified through opt-in crowd-sourced information. The dataset consists of georeferenced polygons representing the pre-event building footprints of 140 208 structures. Each building was classified through visual inspection using pre-disaster and post-disaster vertical, oblique, survey, and verifiable news reporting imagery. Entries were validated using voluntary submission data sourced through a web API hosting a live version of the database. We calculate classification metrics for a subset of the database where ground survey photographs were provided by independent surveyors. An average F1 score of 0.94 suggests that the proposed assessment is consistent and high-quality. We aim to inform future research such as disaster-specific physical dynamics models, statistical and machine learning damage models, and logistics and evacuation studies. The present work describes the data collection process, damage assessment methodology, and rationale, including limitations encountered, the crowd-sourcing validation process, and the dataset structure (https://doi.org/10.5281/zenodo.11055711, Vescovo et al., 2025).
- Article
(16101 KB) - Full-text XML
- BibTeX
- EndNote


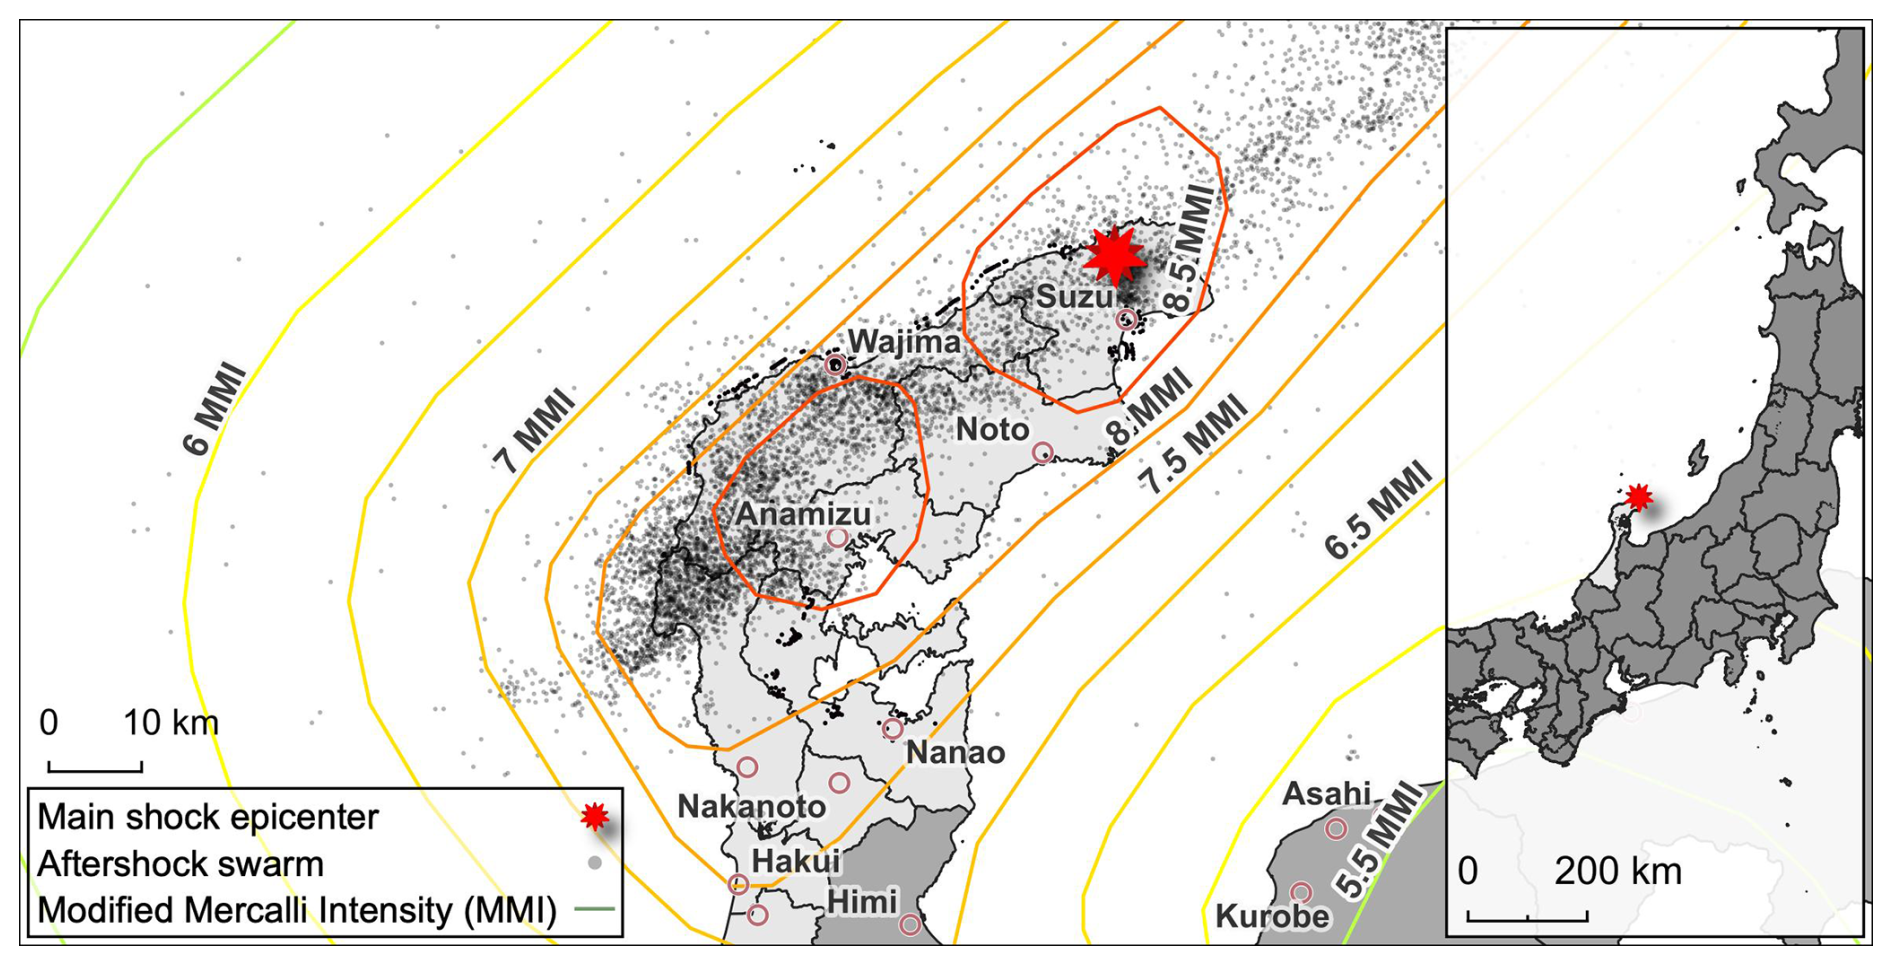
At 16:10 (JST) on 1 January 2024, shallow reverse faulting produced an Mw 7.5 earthquake (USGS, 2024) that propagated from the northernmost point of Suzu, Ishikawa Prefecture (Fig. 1). The disaster poses unique challenges for the disaster geophysics community due to its context and outfall. The intraplate faulting occurred on the relatively inert western coast of Honshu Island, Japan, following a 3-year-long earthquake swarm (Ishikawa and Bai, 2024). Affected areas were the Suzu, Noto, Wajima, Nanao, Shika, and Anamizu municipalities (NASA, 2024; Japan Meteorological Agency, 2024a; Japanese Red Cross Society, 2024). The Prime Minister's Office of Japan has provided transcripts for several press conferences and emergency meetings reporting actions taken to address monitoring and relief operations. Initial reporting provided information on near-instant tsunami impacts around the main shock's epicenter (north Suzu), quickly followed by a comprehensive tsunami warning along the entire peninsula's coast. Subsequent statements confirmed the presence of catastrophic damage affecting infrastructure throughout the peninsula including ground shaking, land deformation, liquefaction, and landslides, causing varied damage to buildings, interrupting roads, and starting a fire. Later press releases, medical reports, and news outlets confirmed impacts to critical services, such as water supply, sewage system, power outages, and telecommunication service disruptions (Egawa et al., 2024; Prime Minister's Office of Japan, 2024d, a, b, c; British Broadcasting Corporation, 2024). The disaster and following outfall ultimately resulted in injuries and human casualties, the prevention of which represents an overarching focus of disaster research (preventable disaster deaths) (Egawa et al., 2024).
The spatial distribution of infrastructure impacts is of particular importance to disaster research. Such data can inform emergency response studies (physical dynamics simulation, damage detection, damage estimation, evacuation simulation, etc.), long-term recovery studies (socioeconomic studies, disaster epidemiology, disaster prevention, probabilistic hazard, etc.), and ultimately the development of more informed codes and regulation. Disaster damage visual assessments are critical to develop a comprehensive corpus of disaster impacts to infrastructure and to inform studies such as the aforementioned.
These visual assessments can be carried out by an on-the-ground survey team, ensuring the highest degree of fidelity and granularity. However, such an investigation is often resource-intensive, carries inherent risk of harm, and may be highly invasive. Alternative methods generally employ remote sensing data and have historically been carried out by experts (Gokon and Koshimura, 2012) and institutions (CEMS, 2025).
Human visual assessments have informed several studies that have contributed to a deeper understanding of seismic and tsunami building damage. Chua et al. (2021), for example, conducted a limited-scope visual assessment of the 2011 Great East Earthquake and Tsunami using multi-source multi-modal imagery (modality refers to the viewing angle, including aerial or satellite orthophoto, standard aerial photography, ground level photo, or aerial oblique photos, among others; source refers to the type and capabilities of the sensor used to capture the imagery) to generate fragility curves of port structures in Ishinomaki.
More recently automated methods employing pre-trained machine learning models have been explored (Deng and Wang, 2022; Miura et al., 2020; Wiguna et al., 2024a). Such methods generally leverage vertical imagery as input to a machine learning model to perform automatic classification of building damage. These automated image-based assessments carry inherent limitations beyond human interpretation, such as the capability to generalize between domains and hazard-induced damage (e.g., damage types to buildings from tsunami, earthquake, and fire all look different).
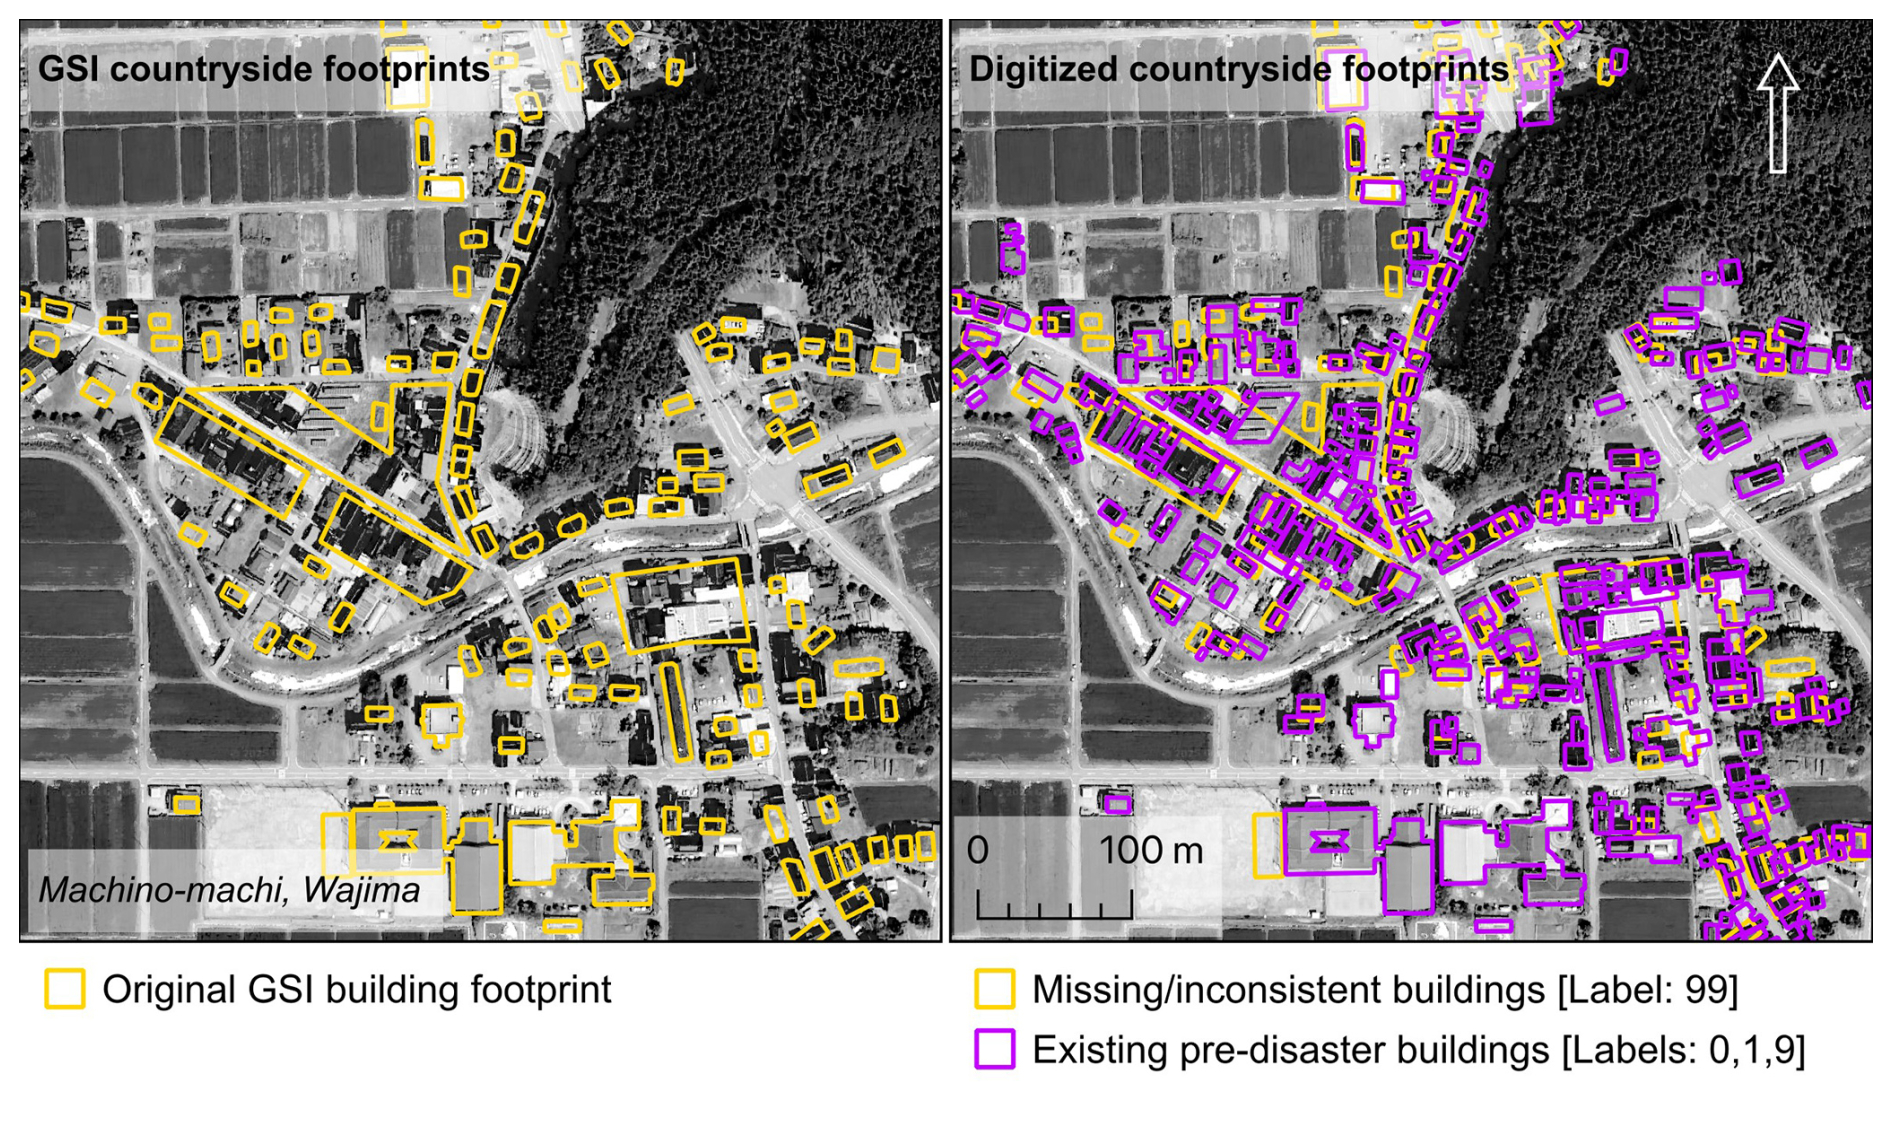
Figure 2Mismatch between original building polygons provided by the Geospatial Information Authority of Japan (GSI) and orthophoto imagery. Inconsistencies appear more prevalent in rural areas, where the building inventory is often inconsistent with or not representative of vertical imagery. As part of the classification process, newly identified buildings were added to the database, while existing building footprints were adjusted to match the orthophoto imagery. In cases of ambiguity, the original ambiguous building polygon is marked as 99 (missing or inconsistent). One or more new building polygons are drawn over the ambiguous polygon based on the most recent pre-event vertical imagery to more faithfully represent the pre-disaster condition; the new polygons are then classified as described in Sect. 2 (basemap attribution: ©: Google Earth, 2024 Airbus, CNES/Airbus, Japan Hydrographic Association, Landsat/Copernicus, Maxar Technologies 2024).
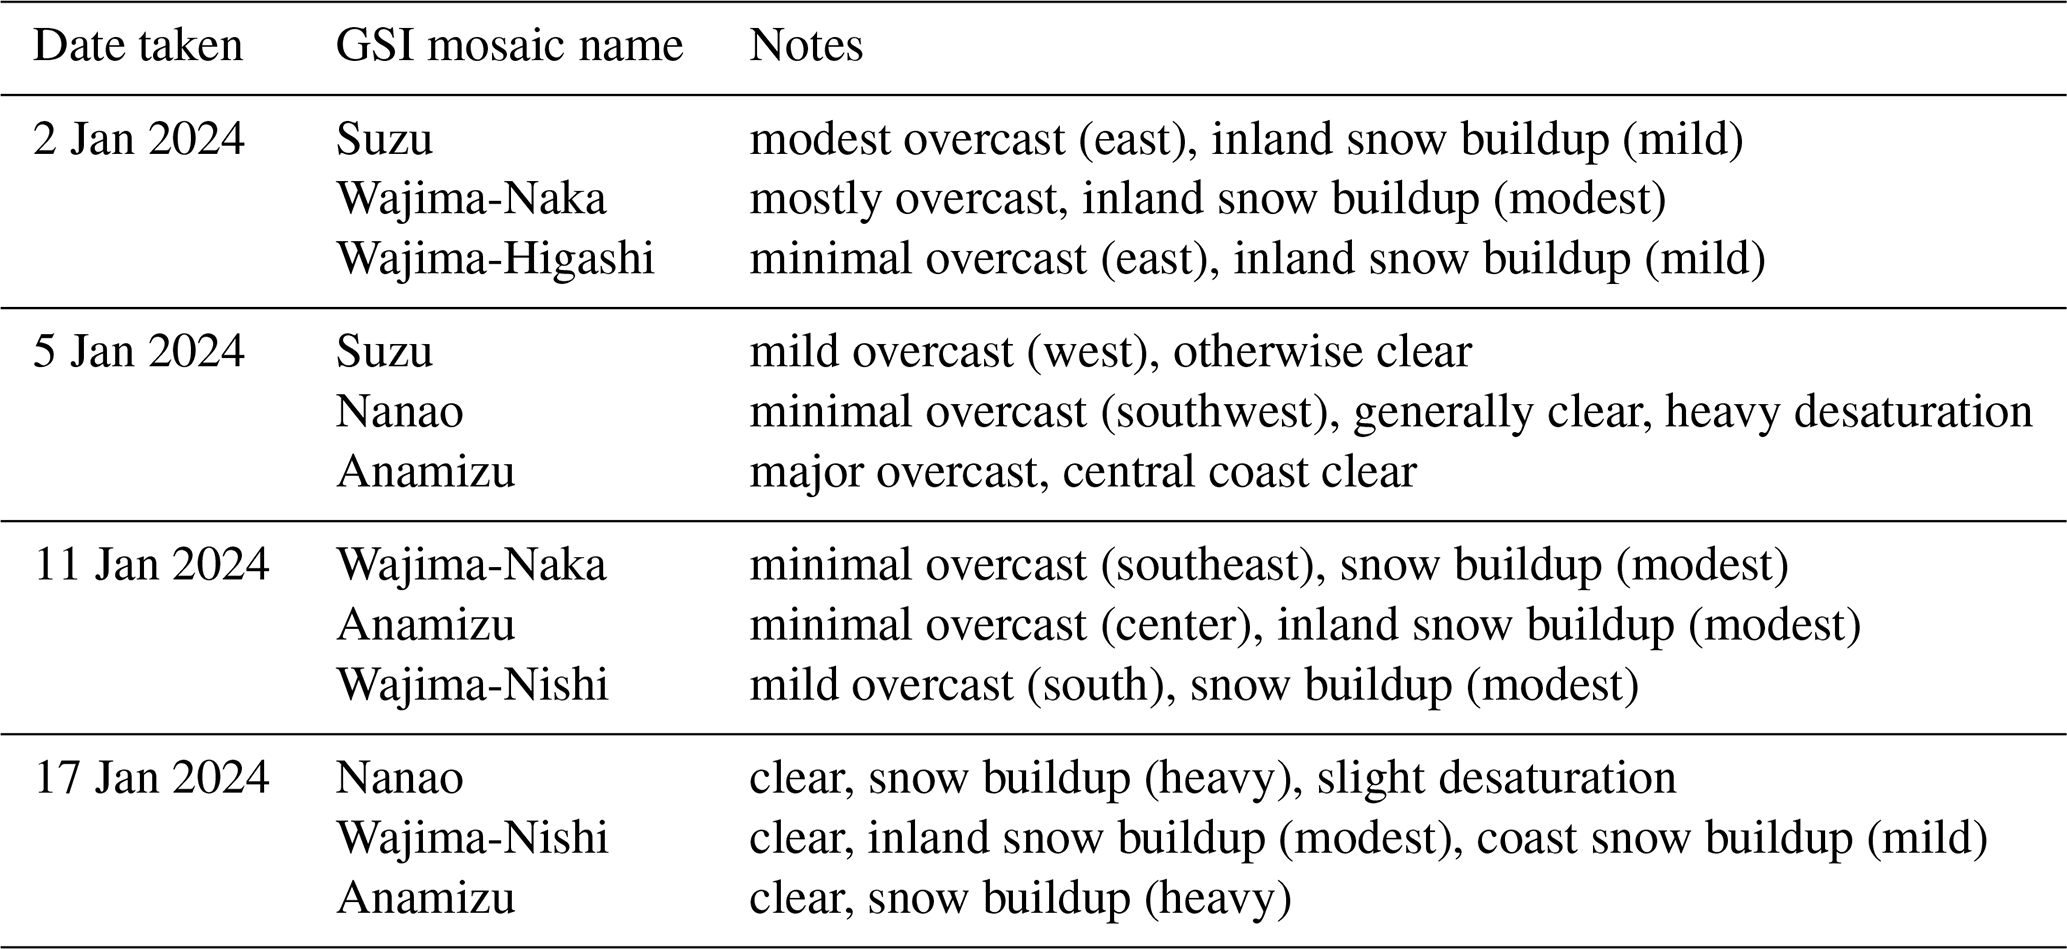
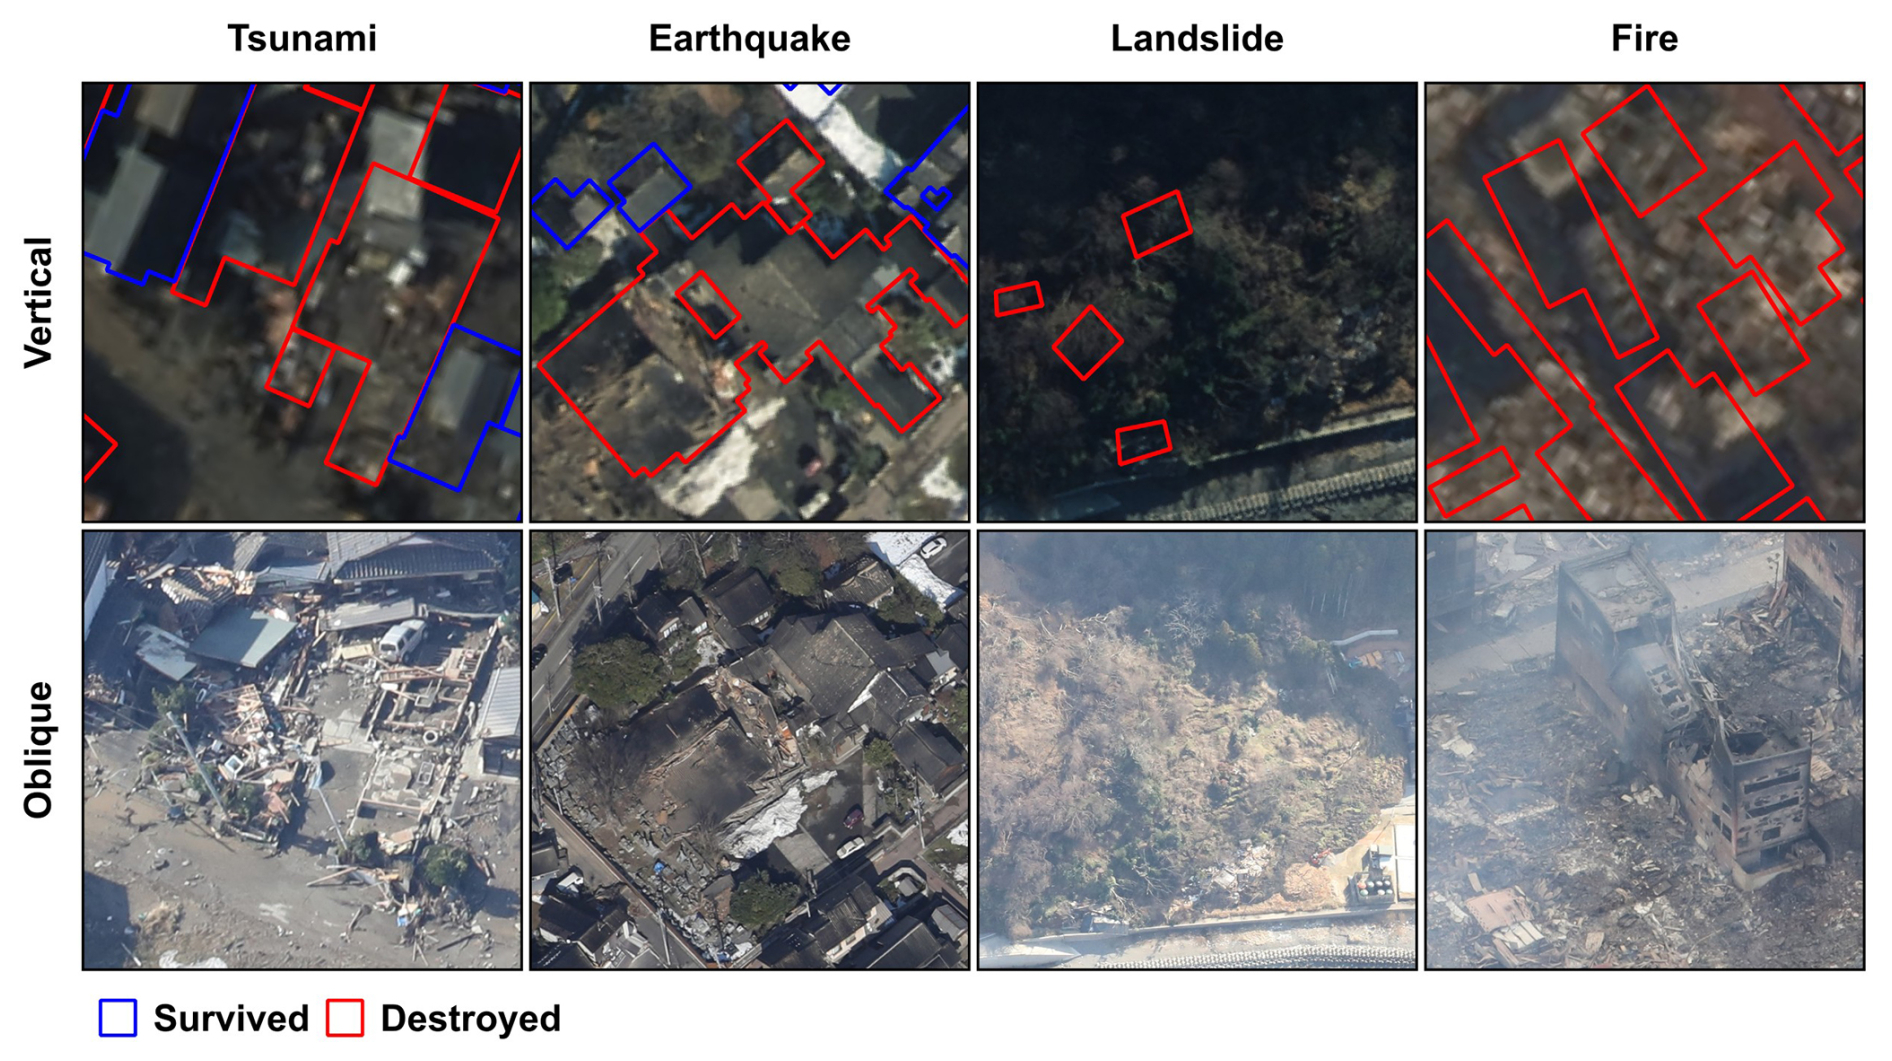
A preliminary investigation of the official building footprint inventory, provided by the Geospatial Information Authority of Japan (GSI), revealed large discrepancies with pre-event imagery (Fig. 2). Moreover, the variable aerial survey periods, image capture quality, meteorological conditions (Table 1), and different mechanisms driving building failure (such as fire, tsunami, earthquake; Fig. 3) contributed to a visually fragmented and inconsistent domain.
Despite these challenges, the unprecedented availability of open-source and multi-source data provided us with a unique opportunity for a rapid visual damage assessment. With the above considerations in mind, we opted for a manual approach to curate this dataset. We hope that this dataset will serve as a reference for future studies and as a benchmark for automated methods. The primary sources for the investigation were post-disaster vertical imagery captured by GSI and made available online. In addition, oblique imagery of select portions of Noto Peninsula was made available by Kokusai Kogyo (KKC) through the free version of their proprietary aerial survey database (for details regarding licensing, usage, and distribution, see Sect. 6). The post-disaster imagery data informed the classification of the public GSI building footprint inventory vector data. Our criteria were developed iteratively in response to limitations presented by the data. Following an initially limited-scope investigation, the assessment was made available to the public for a progressive appraisal at the online portal: https://experience.arcgis.com/experience/70aae9964dc54e4190b6b360dcbb3759/ (25 April 2024). End users may request corrections regarding potential misclassifications. Requests must include proof to substantiate the amendment, usually in the form of a photo of the target building. Finally, two limited-scope on-site surveys by independent research teams informed a secondary round of corrections. We hope to contribute to the growing corpus of natural-hazard-driven building damage datasets in the manner of the 2009 L'Aquila Earthquake Dataset (Tertulliani et al., 2012) and the 2011 Great East Japan Earthquake Dataset (Sekimoto et al., 2013), which have been widely studied and applied downstream to advance the field of disaster research (Anniballe et al., 2018; Suppasri et al., 2014; Charvet et al., 2014). The initiative takes inspiration from previous efforts to democratize this process such as Tomnod (DigitalGlobe and formerly GEO-CAN) for cases like Haiti (Zhai et al., 2012), Christchurch / Ōtautahi (Barrington et al., 2012; Ghosh et al., 2011), and Nepal (Poiani et al., 2016), which in different ways employed crowd source techniques to supplement the damage assessment process. Beyond just contributing more data, we hope to inform future research in three fundamental ways:
-
Prove the feasibility of multi-modal, multi-source visual assessment methodologies,
-
Provide a measure of expected accuracy when employing such methods, and
-
Contribute a damage dataset of a profoundly complex disaster, with significant multi-hazard interactions and impacts.
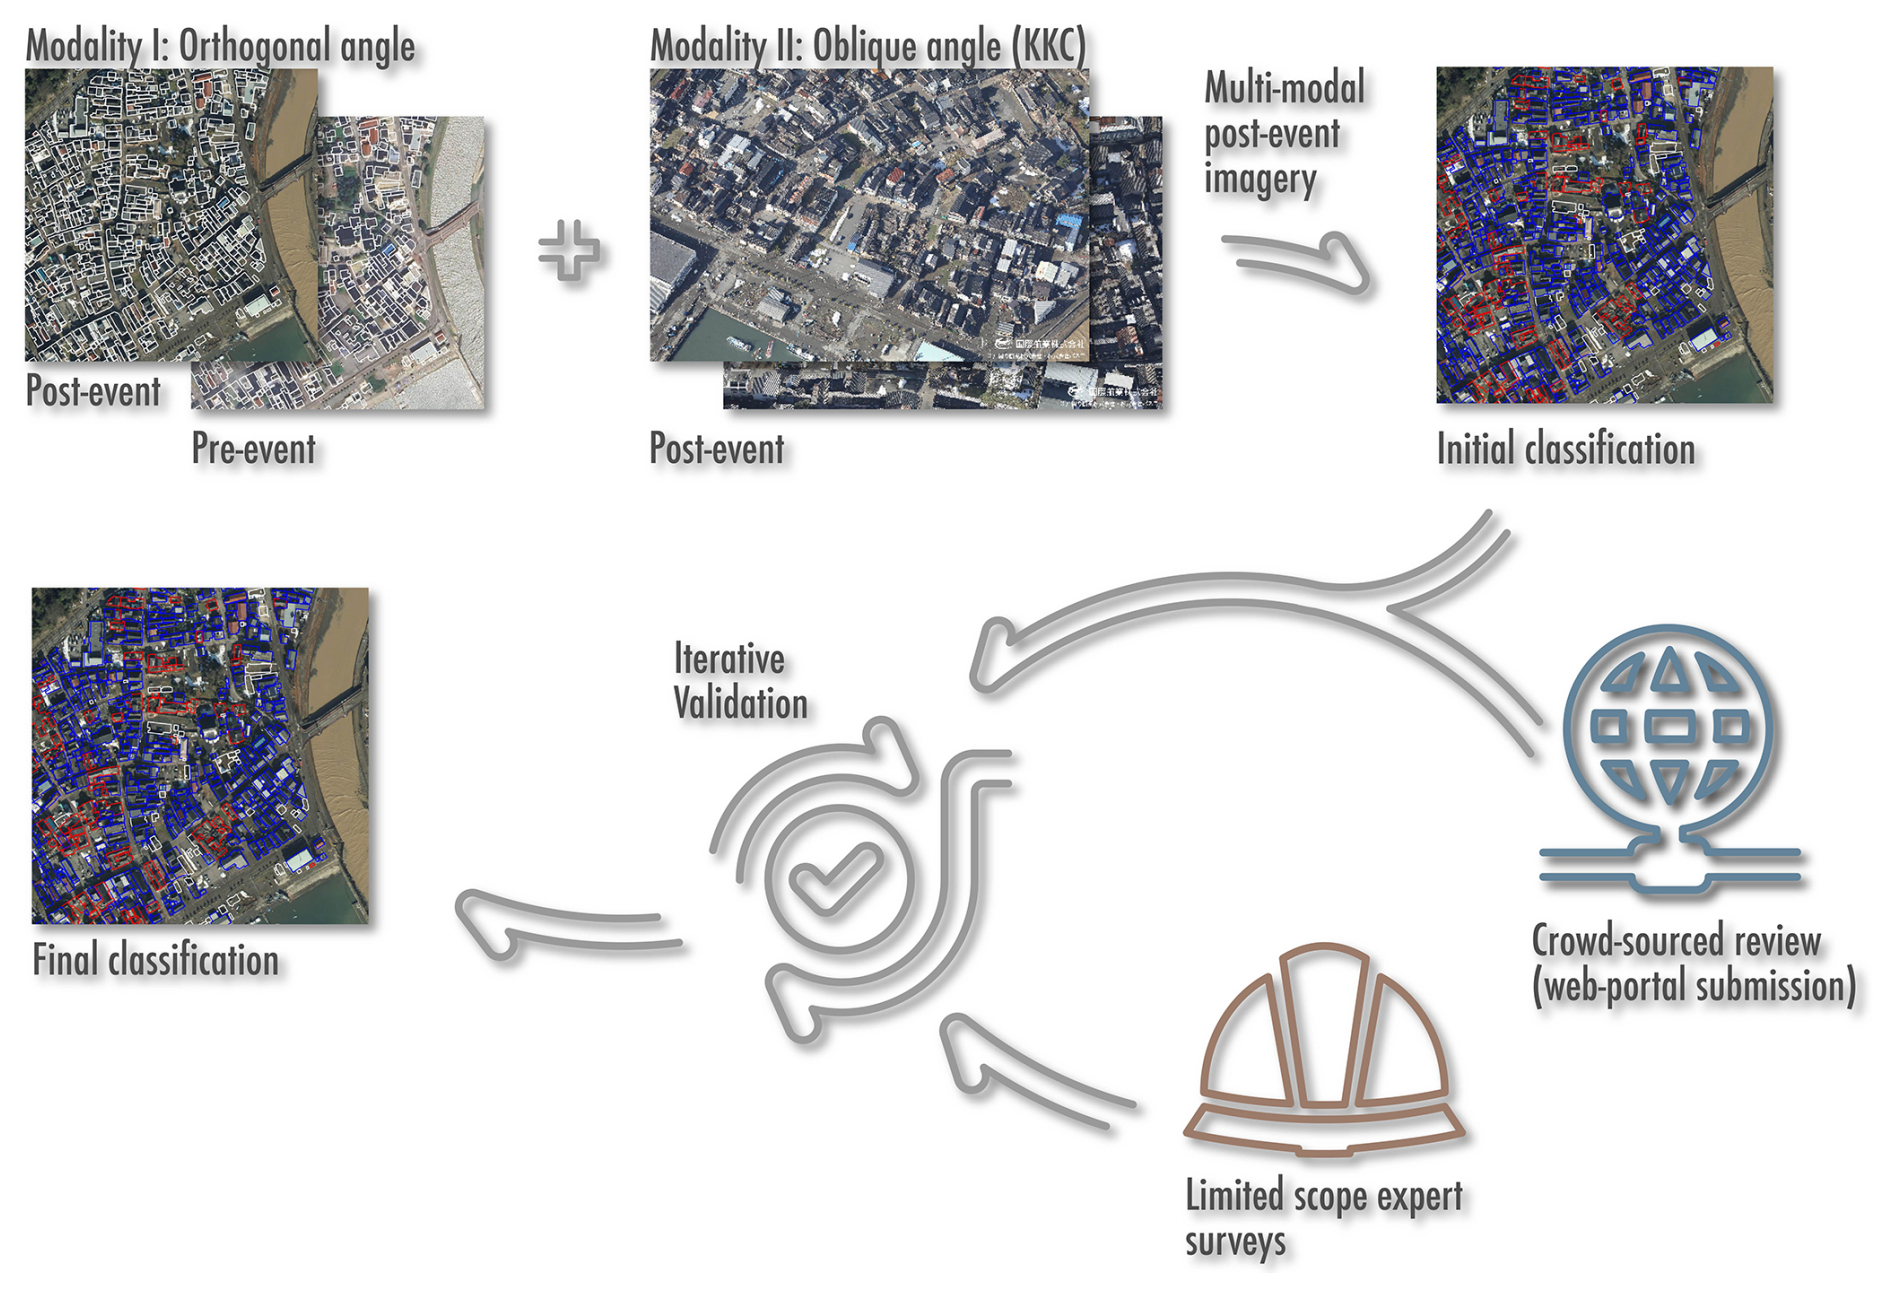
Figure 4Building damage visual assessment workflow illustrating the working group's approach to multi-source and multi-modal data, each stage of inclusion, and the expert-feedback-driven iterative validation process. Pre-event orthophoto by © Google Earth 2024, post-event aerial by GSI (2024), all oblique imagery courtesy of © KKC (2024).
Herein, we relate the methodology used to generate the dataset, including considerations, challenges, and limitations encountered during the creation of the dataset (Fig. 4). The working group was formed in response to the disaster and included members from Tohoku University, the International Research Institute of Disaster Science (IRIDeS), and the Faculty of Social and Environmental Studies at Tokoha University, who provided a secondary survey sample to conduct the technical validation. The assessment was conducted by our internal working group, which included a mix of civil engineers, geophysicists, and disaster researchers. We conducted the assessment in a collaborative manner, with each member of the working group contributing to the assessment of different areas of the peninsula, followed by a quality control round to ensure consistency. The assessment progress was publicly documented through a web portal, which allowed for real-time feedback from the public and other researchers, as more parts of the peninsula were documented and served online. After the initial assessment, we conducted a secondary round of validation using limited-scope surveys by independent research teams and crowd-sourced feedback from the public.
2.1 Data sourcing
The initial review consisted of a general overview of available data from official sources. The Government of Japan provides basic geographic information through the GSI (https://fgd.gsi.go.jp/download/menu.php (last access: 25 April 2024), Japanese). An inventory of building footprints, pre-event aerial imagery, and digital elevation data provided a general level of clarity for the feasibility of a visual assessment. Moreover, GSI hosts an index of information pertinent to the Noto Peninsula earthquake on a dedicated page (GSI, 2024) (https://www.gsi.go.jp/BOUSAI/20240101_noto_earthquake.html, last access: 25 April 2024, Japanese) at the time of writing. Available data include ground subsidence and slope failure extents, post-event aerial vertical imagery, tsunami inundation extent estimates, and crustal deformation estimates. From this portal we obtained post-processed vertical imagery xyz tiles for the post-disaster period: GSI conducted photographic missions on 2, 5, 11, and 17 January, covering the whole Noto Peninsula with a significant degree of redundancy to minimize visual obstruction due to atmospheric and environmental effects such a cloud coverage, smoke, sunshade, and snow. Similarly, Kokusai Kogyo (KKC), a for-profit consulting agency specializing in geospatial technology, has been issuing special investigative products free of charge through a Noto Peninsula earthquake information page (KKC, 2024). Available data include geotagged high-resolution oblique imagery of specific high-profile areas that were affected catastrophically by the disaster (KKC, 2024). Oblique imagery missions were conducted on 2 January, and oblique images are available through Kokusaki Kogyo's proprietary BOIS portal https://bois-free.bousai.genavis.jp/diarsweb (last access: 25 April 2024) (Japanese). The assessment was supplemented by news sources (Minami, 2024; xTECH, 2024) for select areas of Nanao due to visibility issues with the vertical and oblique images.
Table 2Criteria used for binary classification of the entire Noto Peninsula building damage visual assessment.
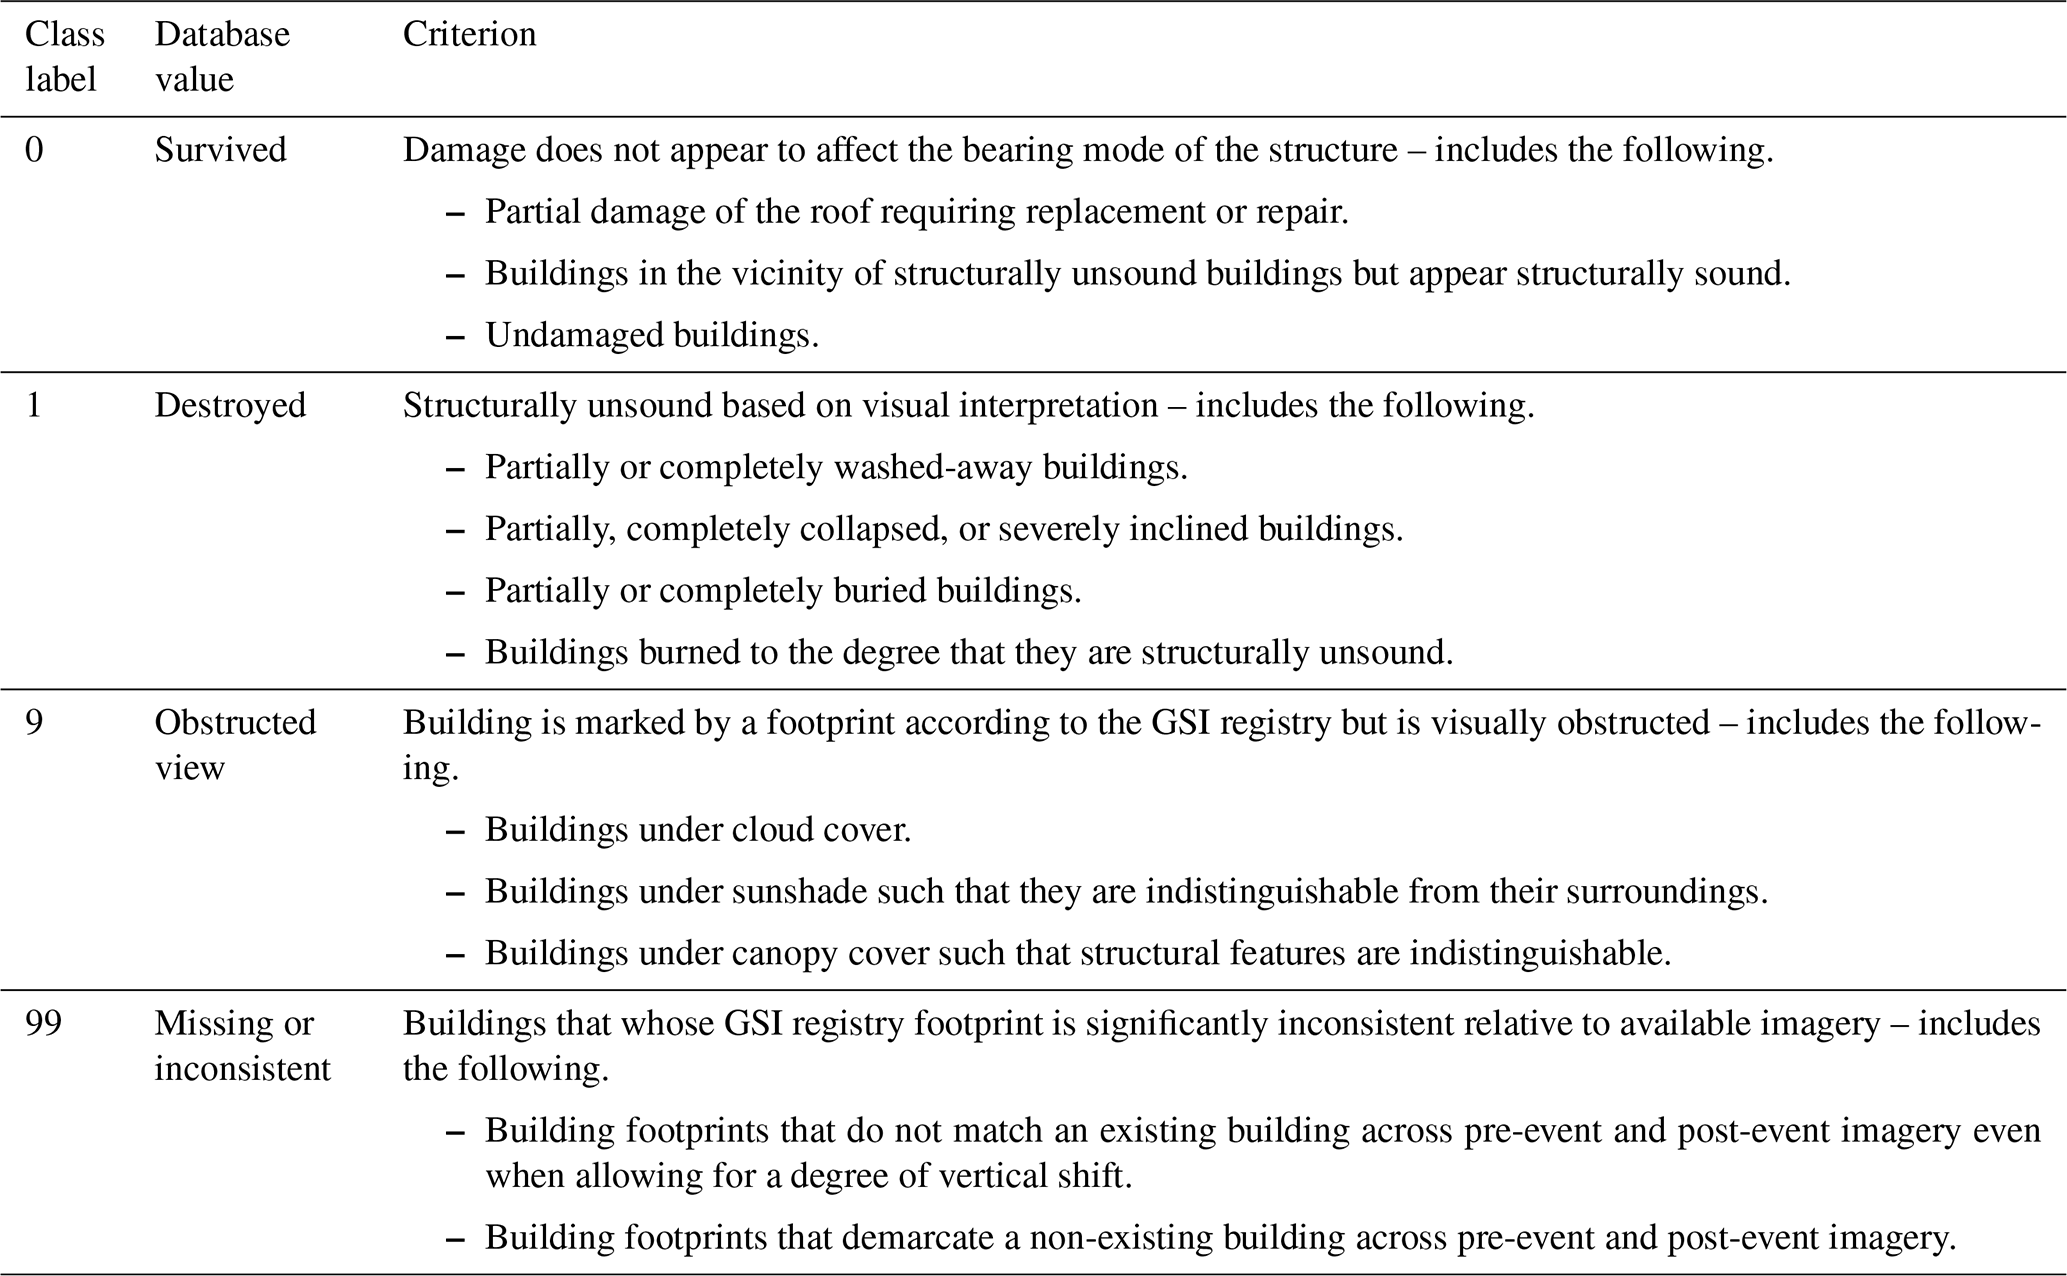
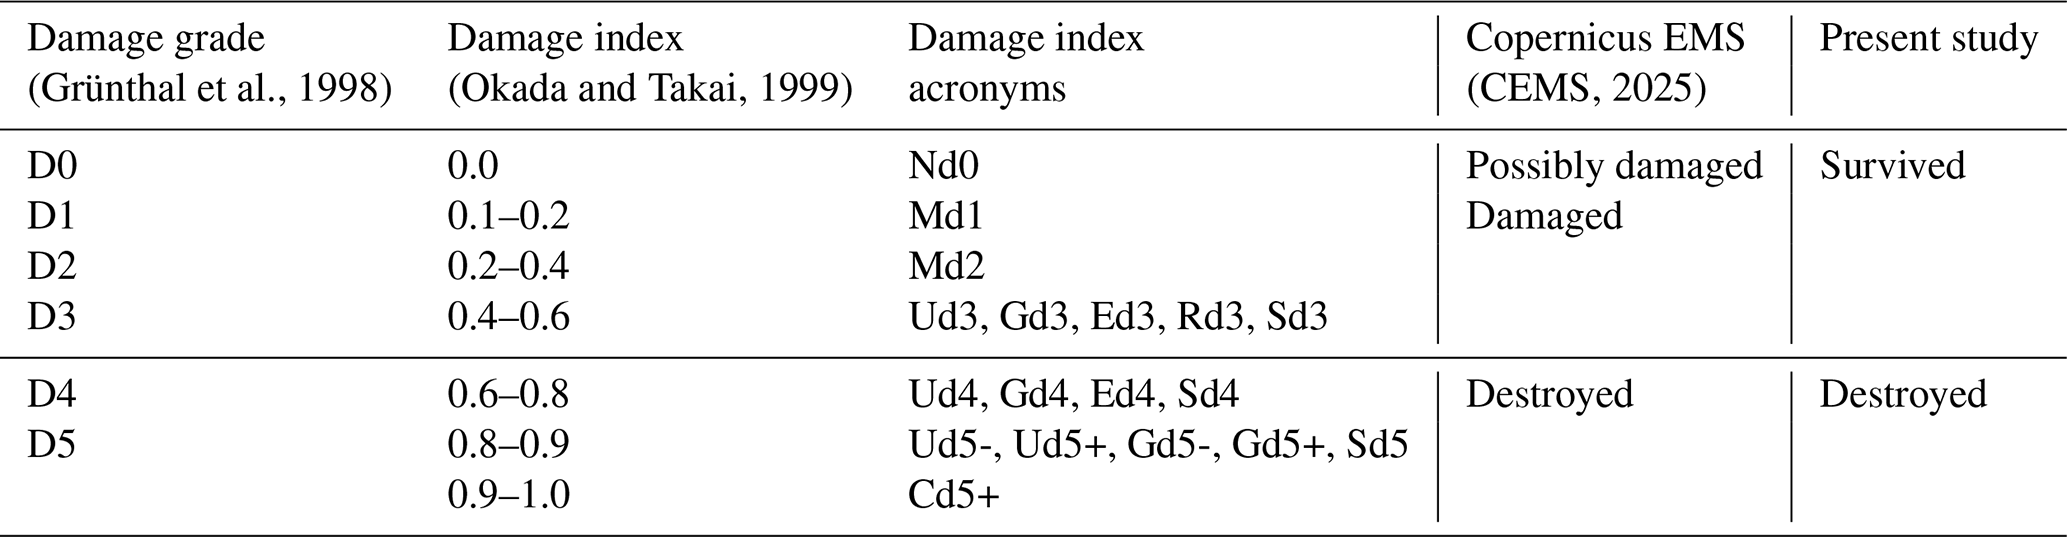
Table 3Comparison of popular reference damage scales for building damage visual assessment with approximate relative equivalences.
2.2 General methods
We provide a short summary of the general methodology used to conduct the visual assessment (refer to Table 2 for precise criteria).
-
Areas with oblique images were treated first.
-
Each aerial was screened for cloud cover and potentially obstructed buildings were marked as 9 unless the oblique imagery provided a clear view of the building, in which case the oblique was used to classify the building.
-
For each building we checked first against the pre-disaster aerial for footprint geometry consistency; in cases of mismatch or ambiguity we classified the existing polygon as 99 and added a new polygon (based on the pre-disaster aerial) to the database.
-
In the case of coherence between the footprint polygon and the pre-disaster aerial, we classified the building as 0 or 1 (survived/destroyed) using the post-disaster vertical imagery and corroborated against the oblique image if available and clear.
-
After each section was completed, we conducted a quality control round to ensure consistency across the assessment.
-
After the initial assessment, we conducted a secondary round of validation using limited-scope surveys by independent research teams and crowd-sourced feedback from the public.
The assessment began as a limited-scope pilot investigation for the tsunami-affected area but expanded to include the entire peninsula. Based on the pilot investigation, we conceived an initial “binary+” classification schema that was eventually formalized into the final classification system with minimal adjustment – these classes are defined as reported in Table 2.
We provide an approximate equivalence table between classification methods in Table 3.
This decision is in part supported by previous findings by Huynh et al. (2014), who mention that crowd sourcing yields bias towards edge classes (“no damage” and “destroyed”) in spite of middle classes (damage and/or possibly damaged). Where possible, the visual assessment is supported by oblique imagery, which proved invaluable in many instances. This was especially true for edge cases such as areas with poor visibility, densely packed areas wherein buildings collapsed vertically (“pancake” collapse), or overcast areas. Initially we considered a multi-class damage assessment to fully leverage the oblique imagery. However, a combination of cloud obfuscation in the vertical imagery and limited coverage of the oblique conditions did not allow a comprehensive assessment (Fig. 5).
As mentioned in Sect. 1, significant discrepancies exist between the GSI building inventory and the pre-event orthophotos. These discrepancies are particularly pronounced in rural areas where the GSI building inventory is often missing or inconsistent with the orthophoto baseline. These mismatches range from minor misalignments to geometry changes (in the case of additions, refurbishing, or knock-down rebuild) and significant changes in the building footprint that are unattributable even when cross-checking the historical imagery. When reasonable, we attempted to adjust the GSI building footprints to match the orthophoto baseline; this is done in order to preserve the original GSI building metadata (see Sect. 3). However, in most cases the ambiguity is significant enough that the building is marked as 99 (missing or inconsistent; Table 2) and new buildings are drawn in its place.
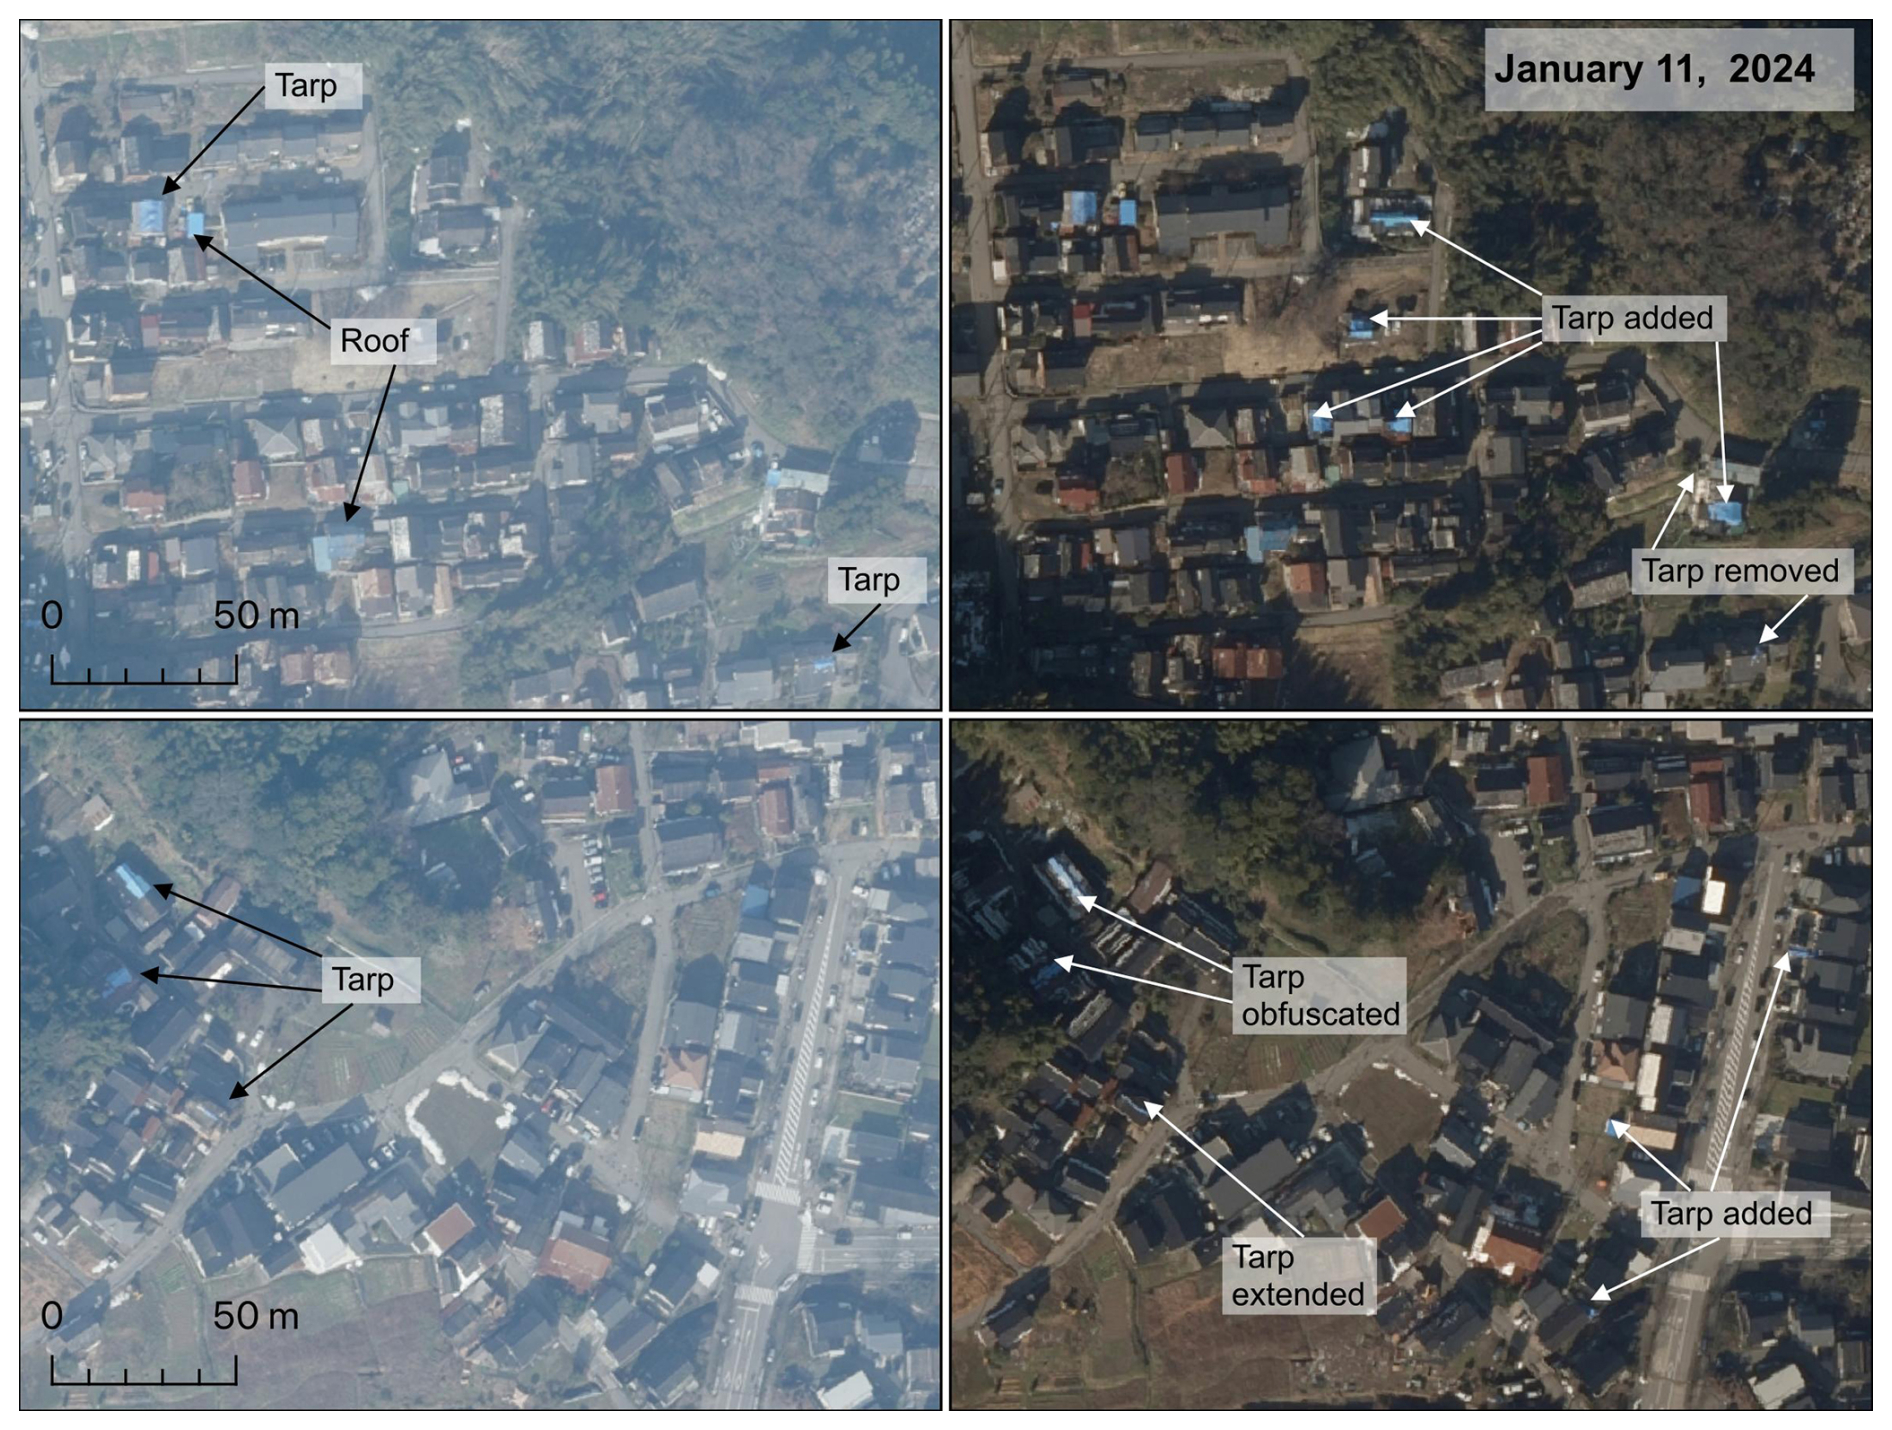
Since only ∼ 16 % of buildings lie within the viewing angle of oblique imagery a multi-class assessment was deemed less viable. Miura et al. (2020) make a case for the inclusion of blue-tarp-covered buildings as a separate class in their deep learning classification framework: they note that the presence of blue-tarp-covered structures correlated with moderate–heavy building damage classes. Although we initially considered including tarp-covered buildings as a distinct class, there are mismatches between the GSI-provided vertical images: this is observable for segments where overlapping orthophotos are available, such as Wajima. Figure 6 provides an example of the mismatch in tarp presence between mission dates. In other instances, such as Anamizu-machi, spotty cloud cover makes the identification of tarp-covered buildings particularly challenging. Ultimately, a conservative approach was deemed preferable.
2.3 Tsunami damage assessment
The tsunami that impacted the eastern coast of the Noto Peninsula was purportedly generated in part by the rupturing of several offshore active faults. In addition, seismic activity may have aggravated submarine landslides in southern Toyama Bay, leading to subsequent tsunami amplification that was ultimately responsible for much of the damage experienced along the eastern coast of the Noto Peninsula (Masuda et al., 2024).
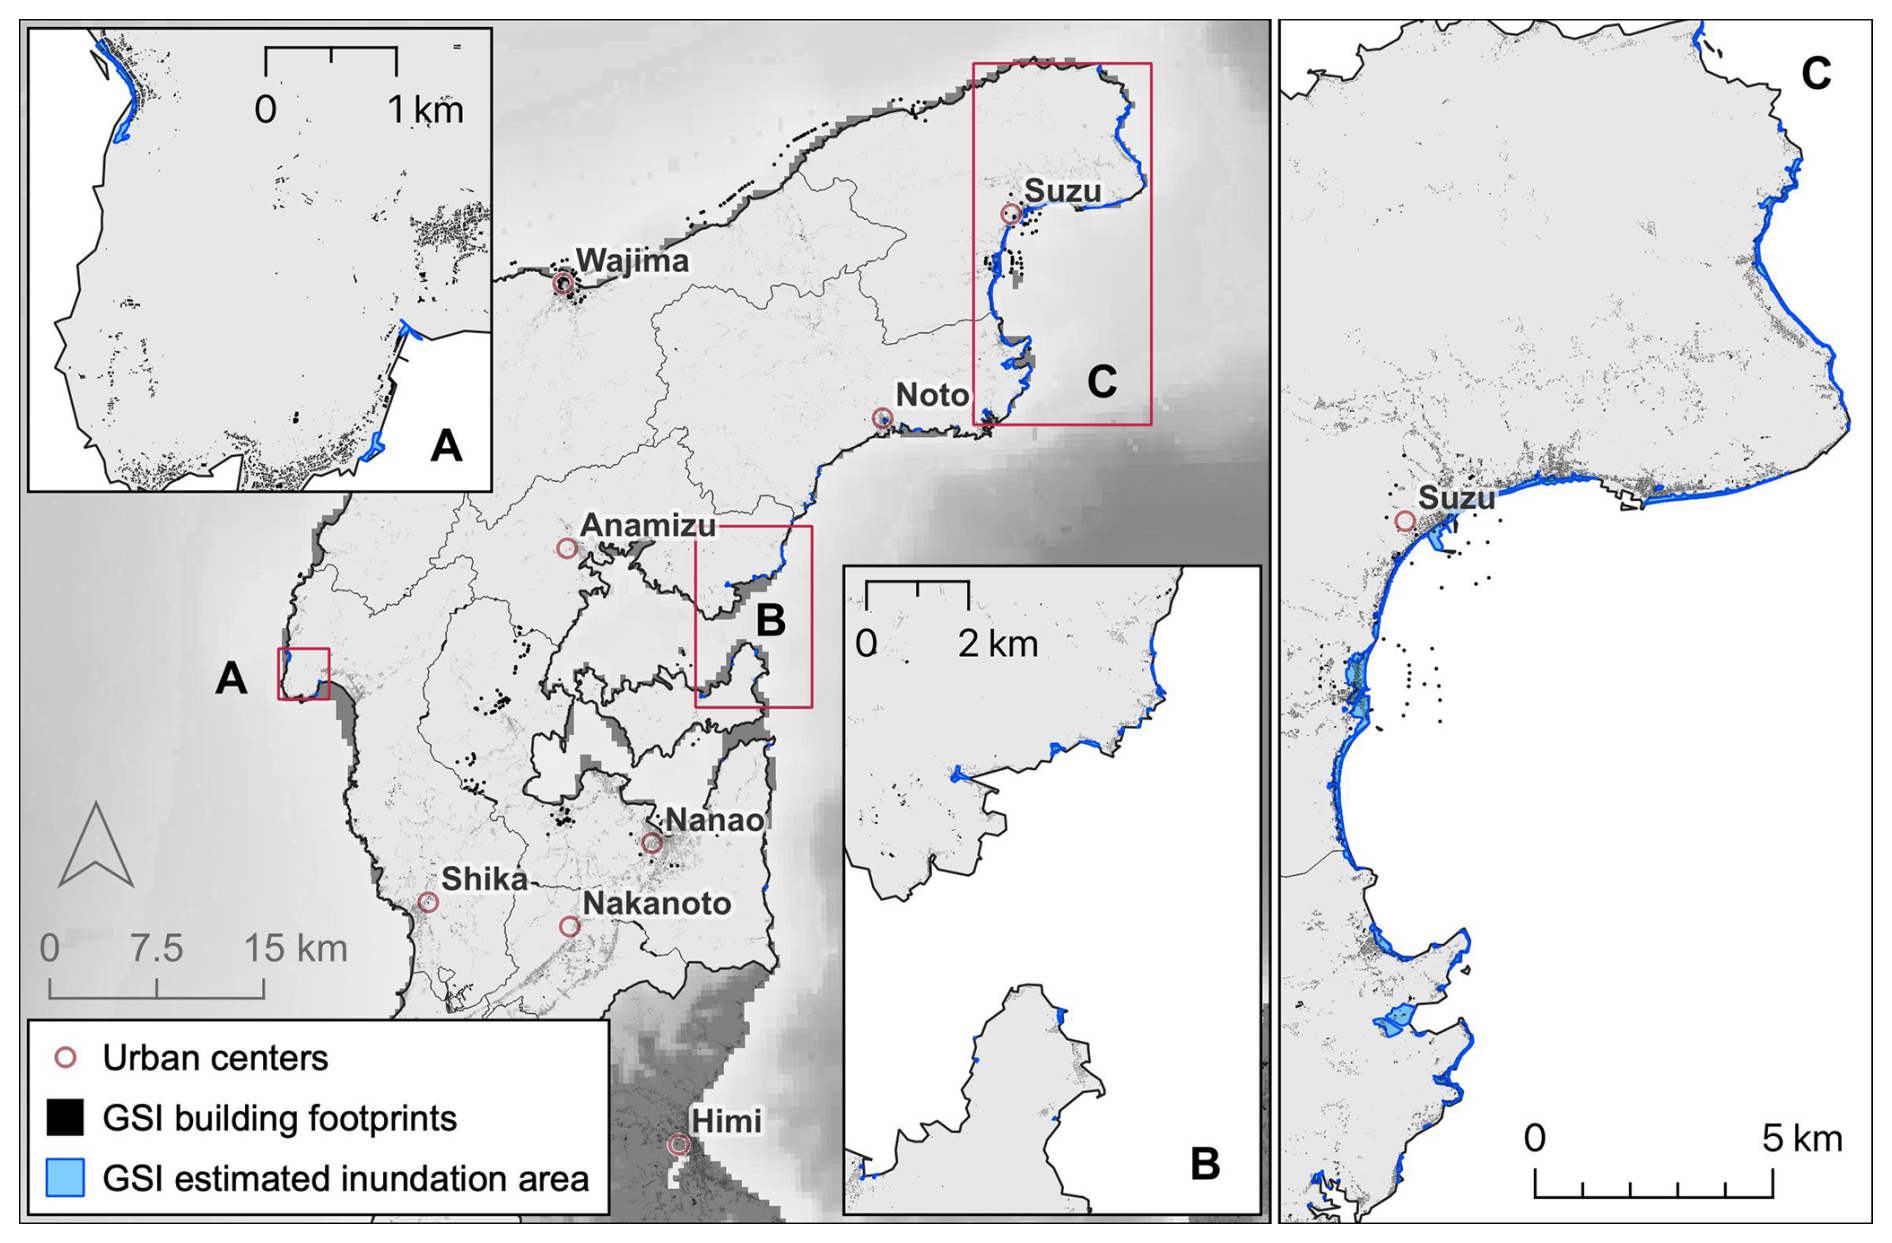
Figure 7Estimated inundation area provided by GSI; backdrop: GEBCO Bathymetric Compilation Group 2023 (2023).
The estimated tsunami inundation extent lies almost entirely along the northeastern coast of the Noto Peninsula area and stretches from the northernmost point of the Suzu municipality to the Nanao municipality in the south. Yuhi et al. (2024a, b) conducted several surveys of the tsunami inundation area and provided comprehensive information on the inundation and run-up heights of the tsunami. On the western coast, only a small extent on the northern portion of the Shika municipality was indicated as inundated (Fig. 7).
Table 4Approach to mismatches between footprint polygons and the orthophoto baseline.
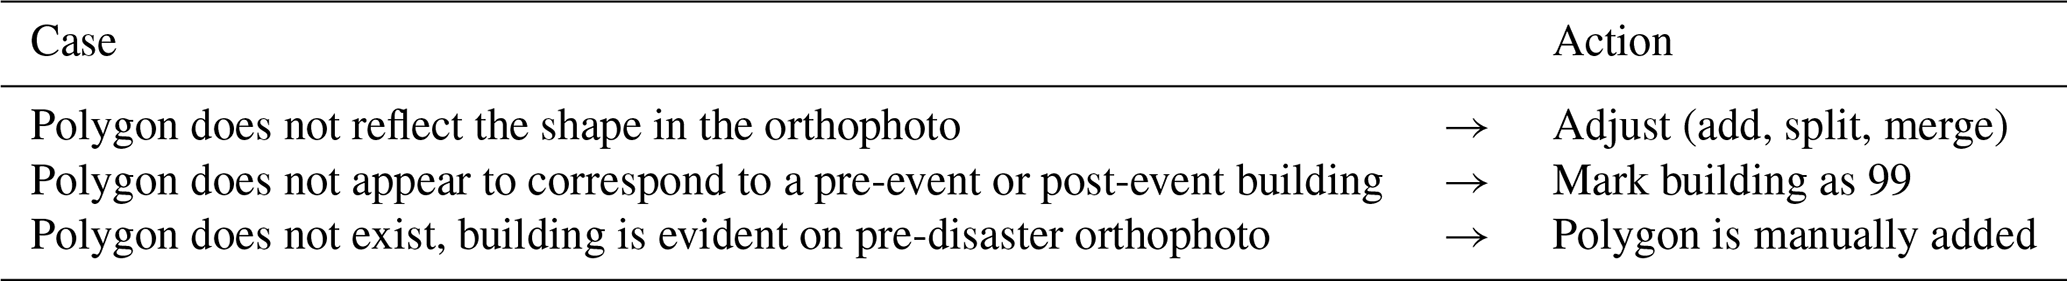
The intersection between the estimated tsunami inundation and the GSI building inventory was the first portion of the damage assessment to be carried out as a preliminary measure. A total of 3261 building polygons were originally included. This pilot investigation served as the basis for the initial criteria, which was then expanded to include the entire peninsula. Notably, this is where it was originally noted that the GSI building inventory was often inconsistent with the pre-event orthophoto baseline. In these cases we handled mismatches with the heuristic noted in Table 4; this was later folded into the final classification system and process heuristic explained at the top of this section.
2.4 Earthquake damage assessment
The scope of the visual assessment was expanded upon completion of the tsunami assessment. The criteria were adjusted to include modes of damage exogenous to tsunami-induced failure: including considerations for landslide displacement and burial, as well as fire damage. Moreover, concessions were made for sunshade and buildings under canopy, conditions that seldom affect urbanized coastal settlements where tree cover is diminished. The final damage inventory for the whole domain resolves to 140 208 buildings, 25 685 of which were digitized manually. The large proportional disparity in digitized buildings between the tsunami-affected areas (4.1 %) and the entire domain (18.3 %) is largely due to vast portions of building footprints in the countryside being mismatched.
2.5 Crowd-sourced feedback
An initial version of the database was made public for viewing on 11 February 2024 https://experience.arcgis.com/experience/70aae9964dc54e4190b6b360dcbb3759/ (last access: 25 April 2024). The working group encouraged specialist opinions to validate potential errors in the data. Corrections are submitted directly through the website and must include photos for the review process to be formalized. Building damage in Nanao was particularly challenging due to a combination of poor exposure, vertical image desaturation, and densely packed houses. In this case we relied on news public reporting (xTECH, 2024; Minami, 2024) that included images and location descriptions to identify damaged buildings.
A second set of review information was made available by limited-scope surveys (conducted by research teams) that provided photo evidence to assist the technical validation process. This data informed a quantitative statistical analysis of error margins for the assessment.
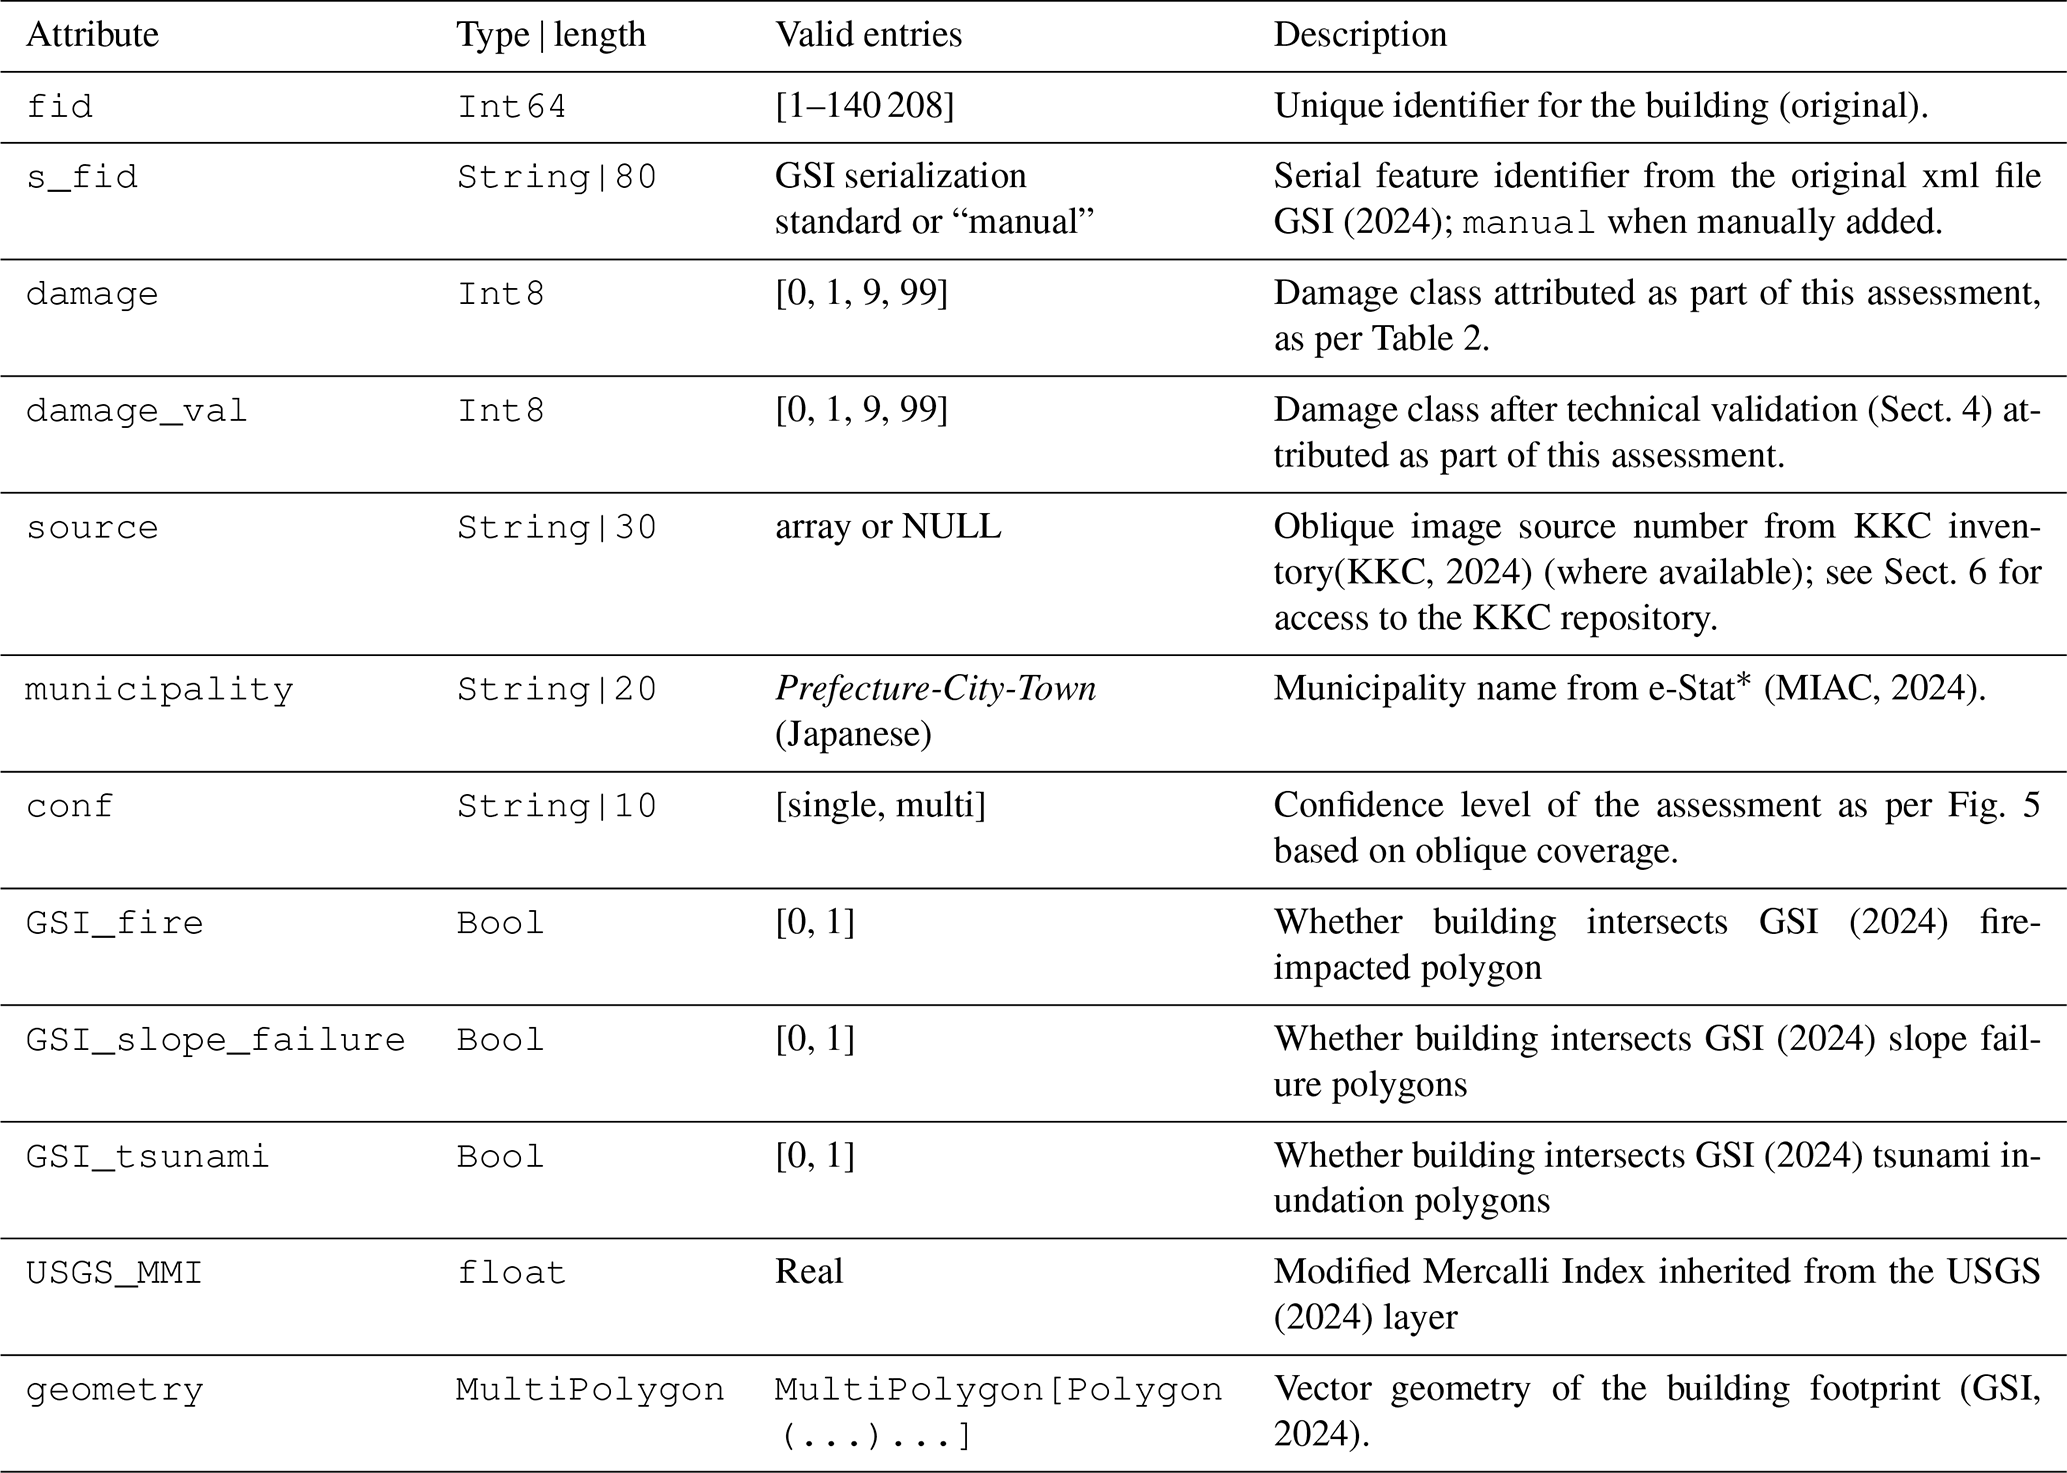
GSI (2024)(KKC, 2024)(MIAC, 2024)GSI (2024)GSI (2024)GSI (2024)USGS (2024)(GSI, 2024)Table 5Details regarding table attributes contained in the GeoPackage dataset.
* Available at the following. https://www.e-stat.go.jp/gis (last access: 2 April 2025). Sitemap (JP): ![]() /
/ ![]() /
/ ![]() . Query tags (JP):
. Query tags (JP): ![]() ,
, ![]() , 2020
, 2020![]() ,
, ![]() (
(![]() ) (JGD2011),
) (JGD2011), ![]() ⋅ Shapefile,
⋅ Shapefile,![]()
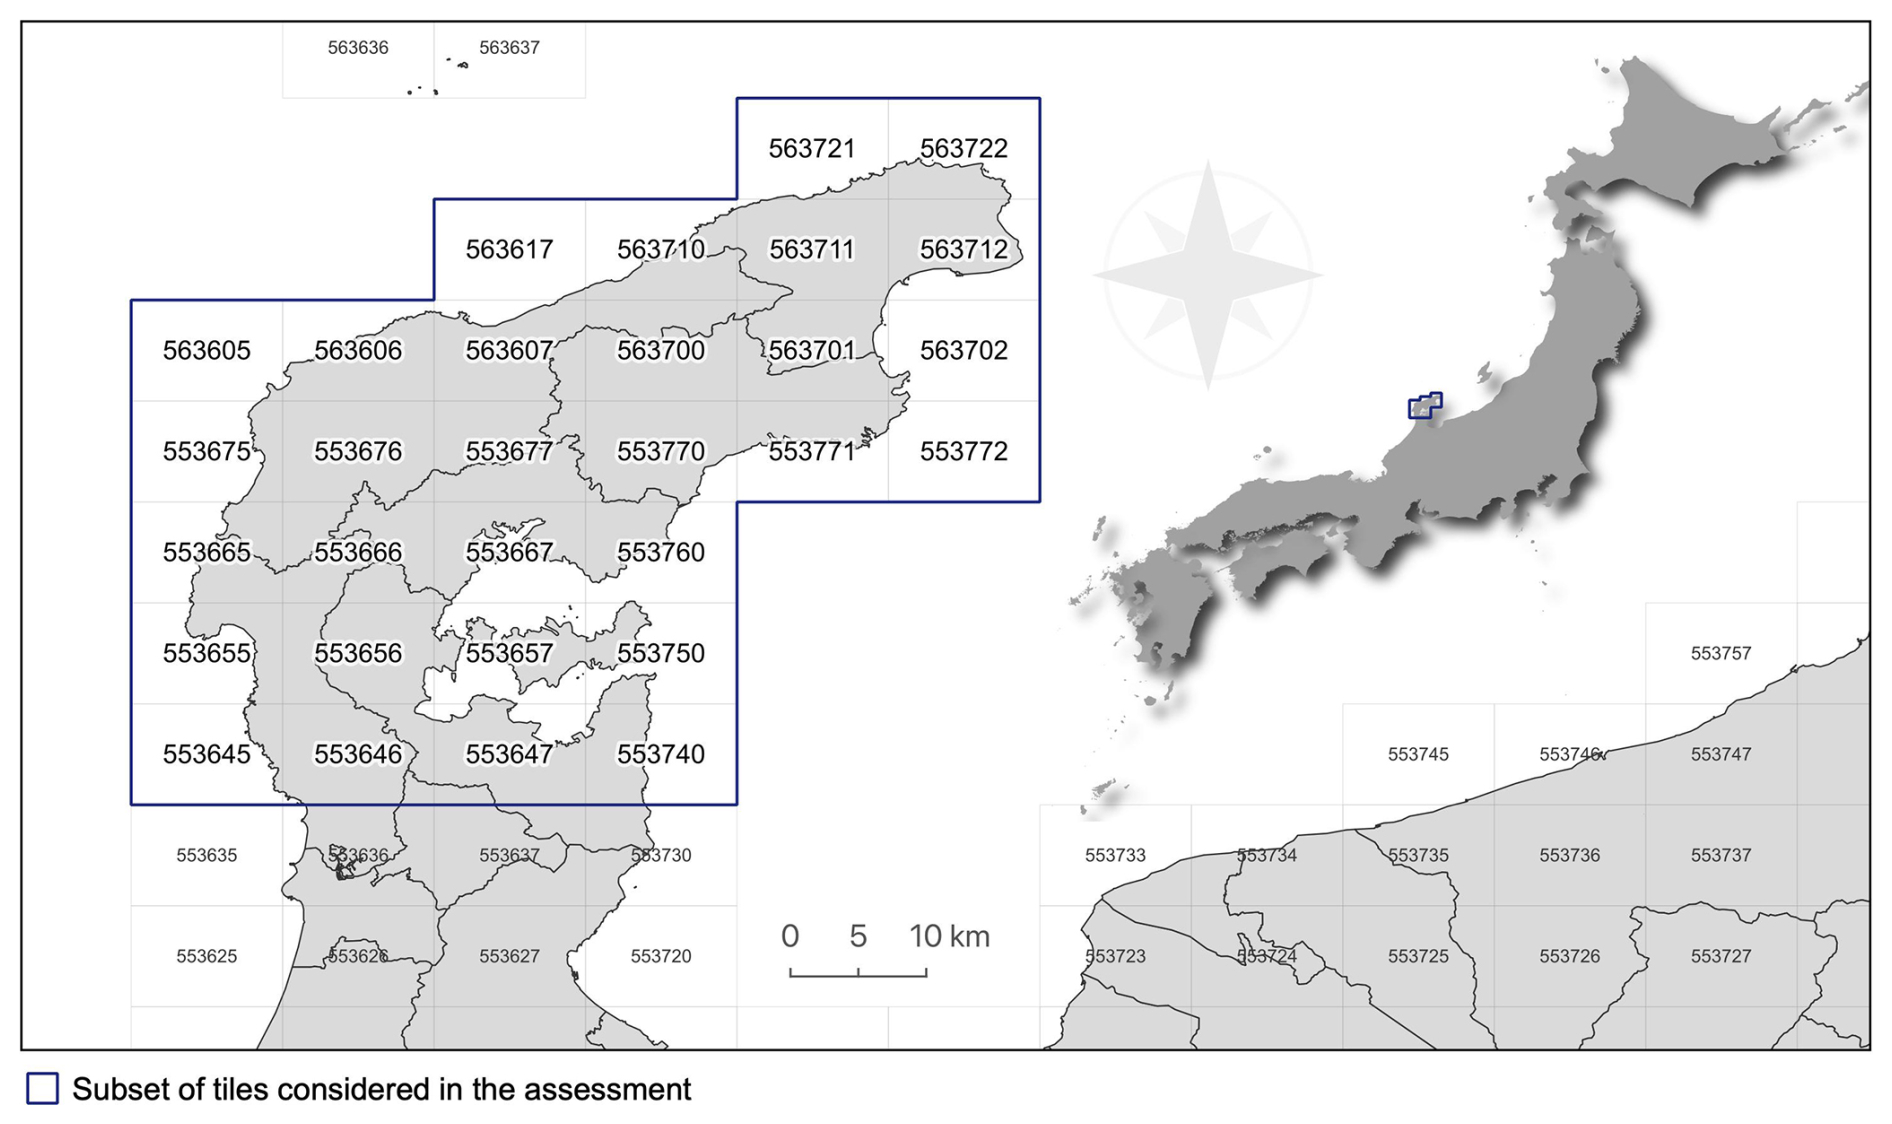
Figure 8GSI mesh tiles considered for the assessment (GSI, 2024), available at: https://fgd.gsi.go.jp/download/ (last access: 2 April 2025).
In this section we describe the structure of the dataset, technical notes, attributes, and secondary sources. The database is stored as the GeoPackage (Yutzler, 2024) Noto_Peninsula_Damage_X_Y.gpkg (where X and Y are version values). A single layer (vX.Y) with table entries for contents (features) and geometries (MultiPolygon) is used to store the building footprints. Details regarding each feature are given in Table 5. A total of 140 208 entries (features + geometries) are included in the dataset. The basis of the analysis was conducted on top of GSI (2024)'s “basic map information” publicly available at https://fgd.gsi.go.jp/download/ (last access: 4 January 2024). The raw data are organized in tiles comprising the standard national mesh defined in JIS X 0410:2002 (Japanese Industrial Standard Committee, 2021). Each tile is archived (provided as FG-GML-nnnnnn-ALL-YYYYMMDD.zip, where nnnnnn is the mesh tile number and YYYYMMDD is the date of the last update). In our assessment we only consider the FG-GML-nnnnnn-BldA-YYYYMMDD-0001.xml files which contain the building polygons. We retain only the geometry and the s_fid attribute from the original dataset. Tiles relevant to the present assessment are given in Fig. 8; however, we aggregate them into a single table in preprocessing.
The dataset uses coordinate reference system (CRS) EPSG:4326 (WGS 84).
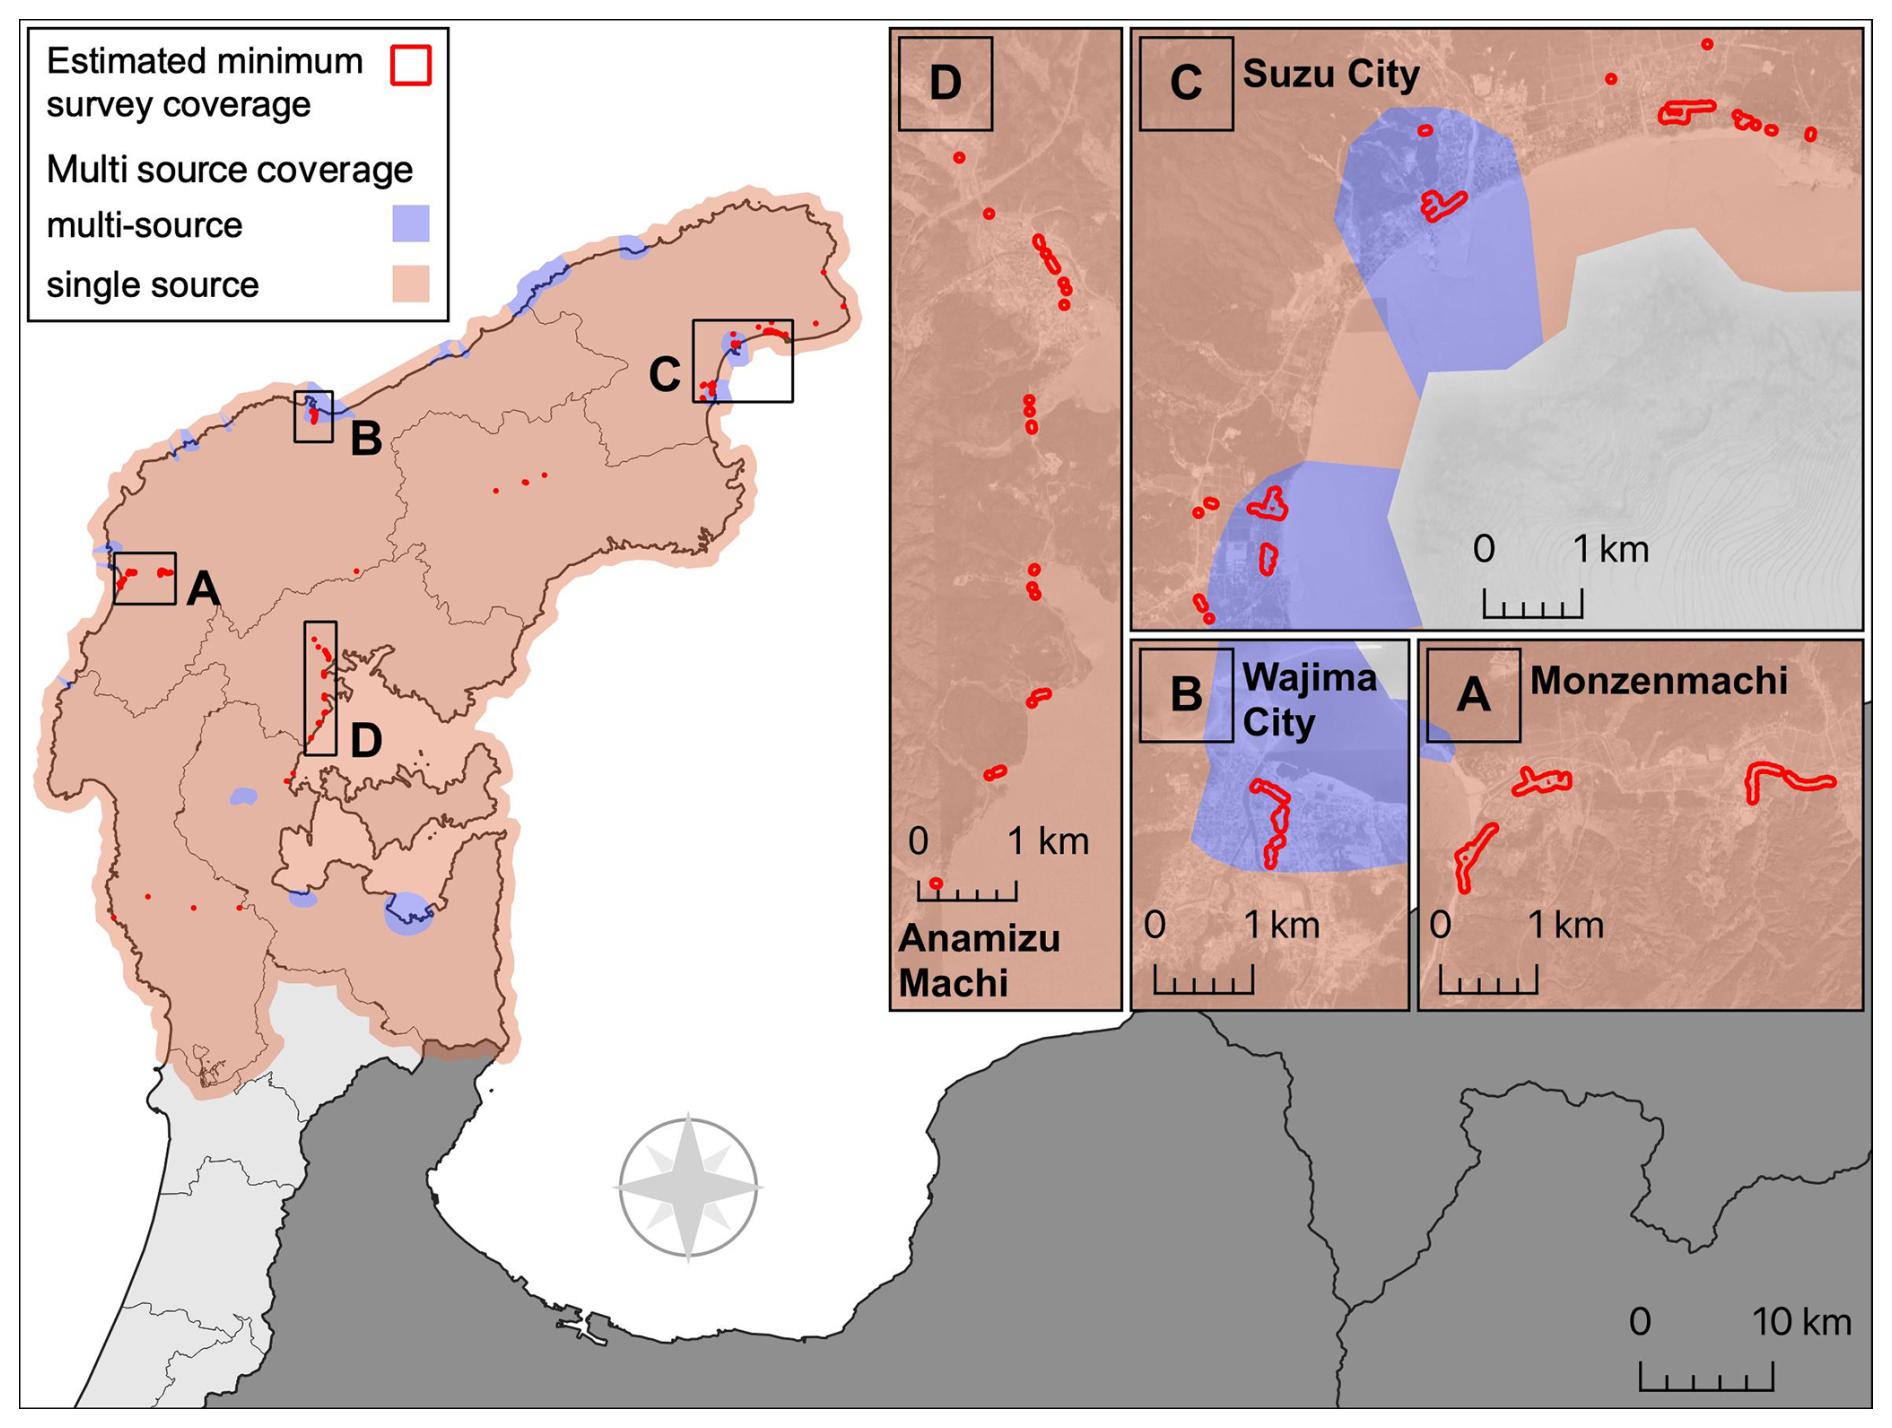
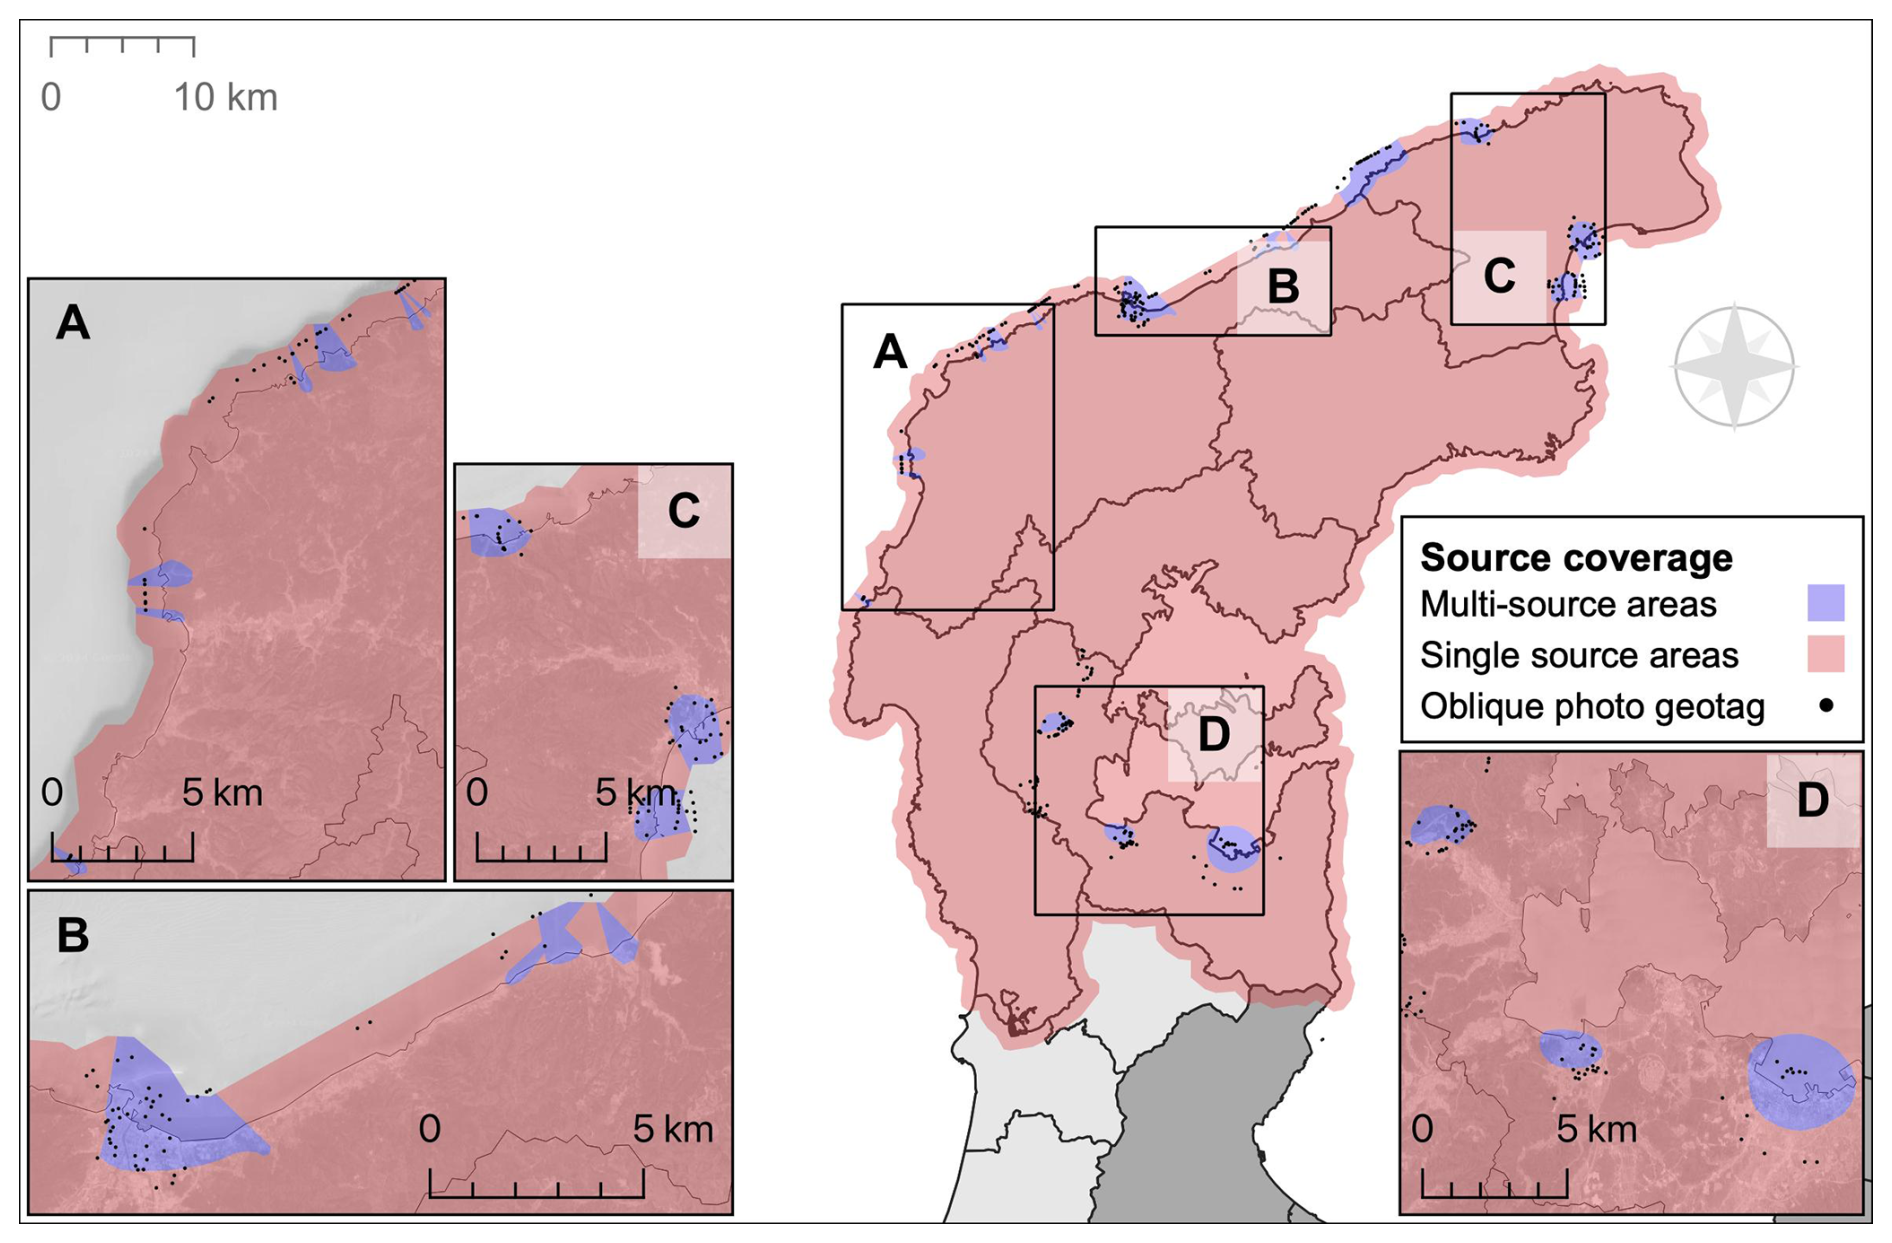
Figure 9Dataset validation areas are estimated from imagery provided by an independent survey team. A path was fit through the location metadata of each photo. We assume a 40 m range buffer around the path to be a reasonable visible area for the survey team, judging by the photographic evidence provided. Inset basemap courtesy of © Google Earth 2024.
The database was split into working subsections to annotate using single-source or multi-source remote sensing imagery – we refer to this process as human annotation (Xia et al., 2023). Once completely classified, each subsection was reviewed by a different team member and integrated into the live database. Our iterative validation was twofold: through our open web API, we collected voluntary requests for correction, each submission requiring photographic evidence. Each building for which a correction was submitted was given a new validated damage class (Table 5) with the new classification provided that the submitted evidence conformed to our binary damage classification (Table 2).
Data provided by two independent on-site photographic surveys, by Tokoha University and Tohoku University, were used to validate portions of the database similar to how crowd-sourced data were handled. The surveys provide coherent coverage of four major settlements: Wajima, Suzu, Anamizu, and Monzenmachi (Wajima), as well as scattered inland rural settlements (Fig. 9).
Since the data are unbiased with respect to the database (i.e., all damaged buildings were documented along the survey path irrespective of the damage assessment class), the coverage was used to statistically impute the accuracy of human annotation: each photo was taken from ground level and geotagged, forming a dense set of nodes. An approximate path was generated using a range-limited nearest-neighbor algorithm. Finally, the intersection between the building database and a 40 m buffer (reasonable field of view, assumed from photo inspection) around the paths was taken as the surveyed extent. Our initial labels (human annotation) are taken as the estimates and measured against the surveyed (corrected) ground truth yGT, and we report standard classification metrics in Table 6.
Table 6Classification statistics for independently surveyed areas, showing the approximate accuracy of the visual assessment against comprehensive ground documentation.
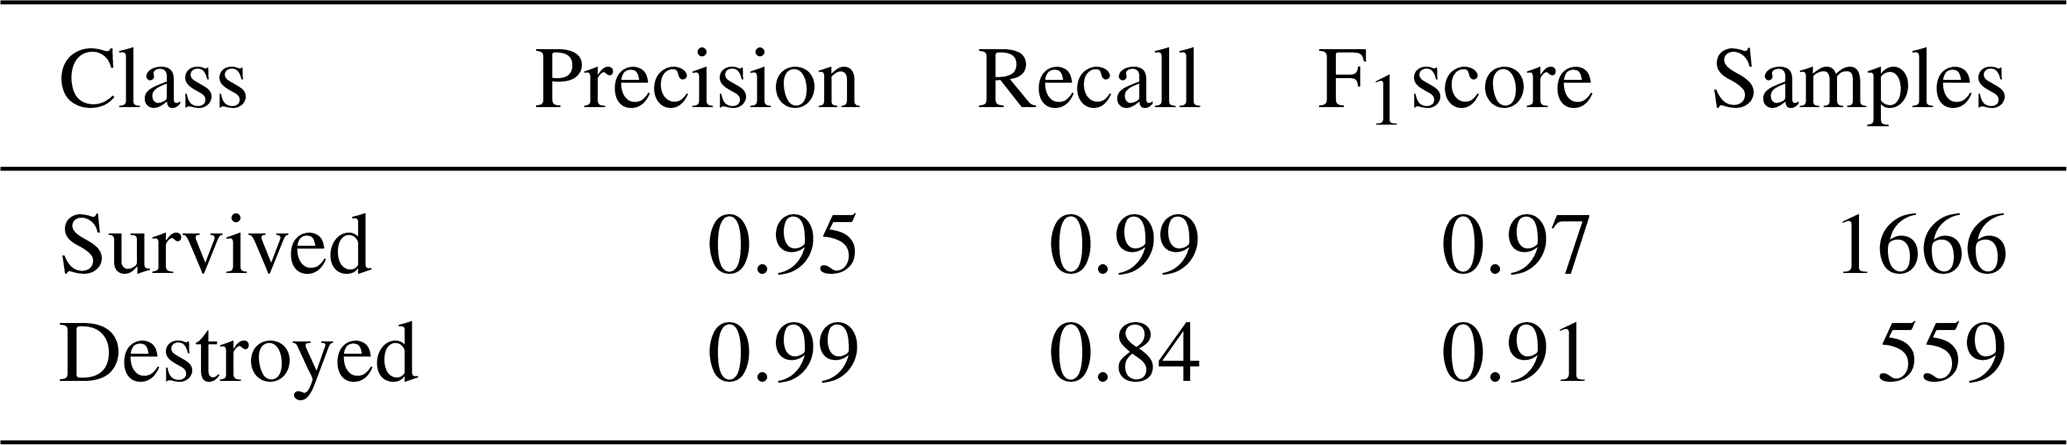
The harmonic F1 score between survived and destroyed classes is 0.939, suggesting high confidence in the assessment. A spatial representation of the survey coverage is given in Fig. 9; notably, a large portion of the surveyed areas is outside of multi-source coverage, suggesting that despite the limitations described above, the proposed visual assessment framework is robust. We hope that this exercise in crowd-sourced and survey validation will permit further statistical investigations into the features and limitations of manual image-based rapid building damage visual assessments.
The unique nature of the disaster is reflected in its varied impacts on buildings, such as ground shaking, subsidence, uplifting, tsunami surge, soil liquefaction, landslide, and fire, among others (Fig. 3). The dataset provides a comprehensive visual assessment of building damage across the Noto Peninsula, including all the aforementioned impacts. With this contribution, we aim to provide a reference for future studies and a benchmark for automated methods.
To guarantee a high degree of consistency across all working members, our classes needed to be as clear-cut as they were manageable. A potentially useful third class would necessarily split the “survived” class, analogous to the scale provided by Copernicus Emergency Management Service (CEMS) (CEMS, 2025). Roof damage and horizontally displaced rubble are generally the only visible signs of a damage spectrum between ideal “no-damage” and “destroyed” classes. Any potential third class would be predicated on the presence of these defining characteristics.
Regrettably, timing and weather conditions severely limited the return period of sufficiently clear or redundant vertical imagery (Table 1). Major seasonal pressure systems accompanied modest seasonal snowfall across the peninsula over the first 3 weeks of the year. The cloud cover and snow buildup effectively impeded the classification of 9456 buildings (criteria details are given in Table 2). Notable among the mosaics described in Table 1 is the Nanao_2024-01-05 mosaic, which is particularly faded and unsaturated.
The winter season poses particular challenges for image classification – much of the natural environment tends towards darker, less saturated colors due to a combination of factors: houses in the Noto Peninsula generally feature traditional black roof tiles. Overcast weather can decrease color saturation by reducing available light (hence reflection). Relative darkening can reduce the contrast between dark roofs and the background environment in both cities (concrete and asphalt colors) and the countryside (deciduous vegetation tends towards browns and greys). Many of these challenges can hamper the visibility of roof cracks, missing tiles, exposed roof beams, and scattered rubble that may be used to distinguish between classification grades.
The Copernicus guidelines for CEMS make a case to diverge from EMS-98 (Grünthal et al., 1998), citing that “such methodologies are fundamentally designed for ground-based field assessments, and thus are not intentionally tailored to be used with remotely sensed images”. Moreover, EMS-98 only considers masonry and reinforced concrete buildings, which are inappropriate for a context such as Japan where wooden buildings are overwhelmingly prevalent. Okada et al. (Okada and Takai, 1999) provide a damage index (and equivalent grades) better suited to the context of the Noto Peninsula; however, this index is also conceived for ground-based assessments and relies on accurately assessing the condition of load-bearing walls and pillars. In principle, the CEMS index provides the most appropriate framework for our use case; however, CEMS is not designed with a consideration for multi-source, multi-modal data. Obliques can allow for vastly more granular classification contingent on the viewing angle and distance from the target building. The following items contributed to our final decision to use a binary classification.
-
Only ∼ 16 % of buildings lie within the viewing angle of oblique imagery.
-
While oblique imagery provides significant redundancy, not all buildings visible in the frame are clear; draw distance and image resolution are significantly more variable than in vertical imagery where the distance to the target is more consistent.
-
The failure modes vary depending on the hazard (e.g., tsunami, landslide, fire; Fig. 3), and hence some sort of equivalence is needed to compare the different failure modes relative to the same scale.
-
Oblique cover is split between failure modes: for example, in Suzu, earthquake and tsunami damage is present, while in Wajima, earthquake and fire damage is present. Finally, along the north coast between Wajima and Suzu, the majority of the damage is caused by landslides and slope failure.
Ultimately, we valued consistency and comparability over the potential for a conditional, more granular classification. For the purposes of this project a binary classification was deemed preferable – a breakdown of how our assessment relates to popular reference scales is given in Table 3. We fully endorse and encourage the use of this dataset by the research community and beyond as the starting point for more granular and detailed assessments of the damage now that significantly more information is available.
5.1 On multi-hazard failure modes
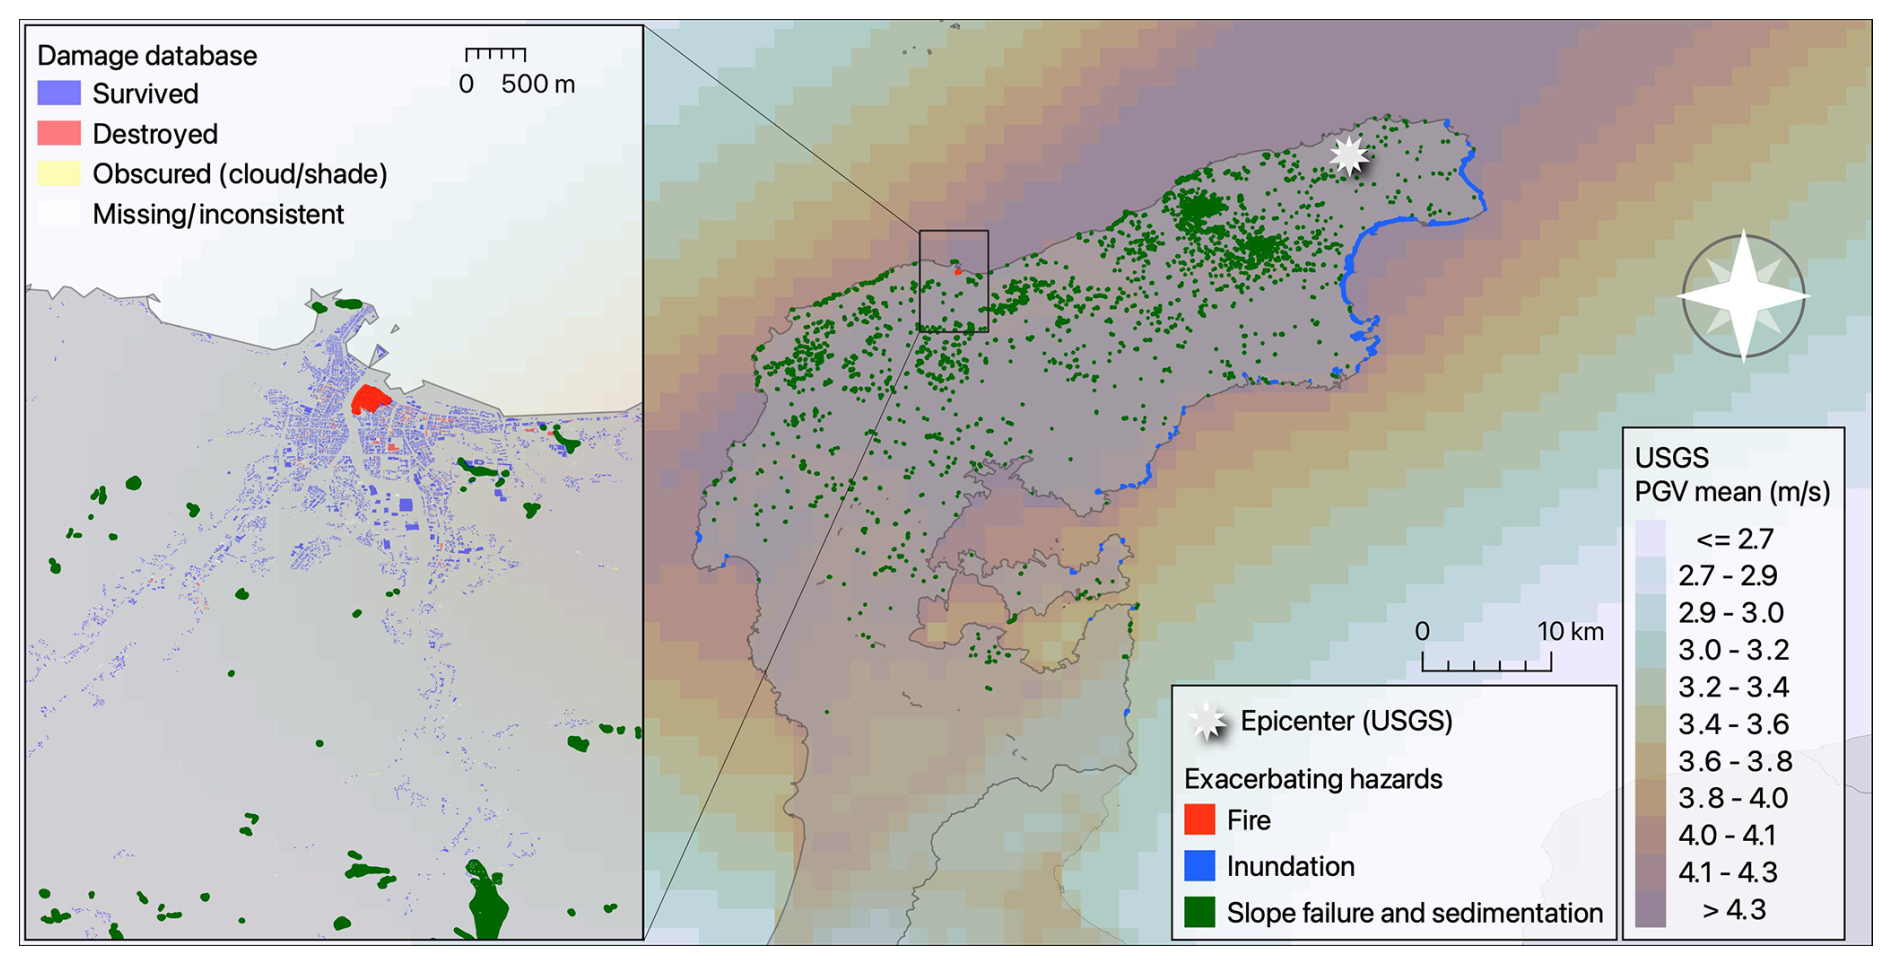
The dataset can inform studies that aim to understand the different multi-hazard failure modes given the different impacts listed above – Valentijn et al. (2020) explore multi-hazard damage detection models but focus on aggregating each hazard discretely by type.
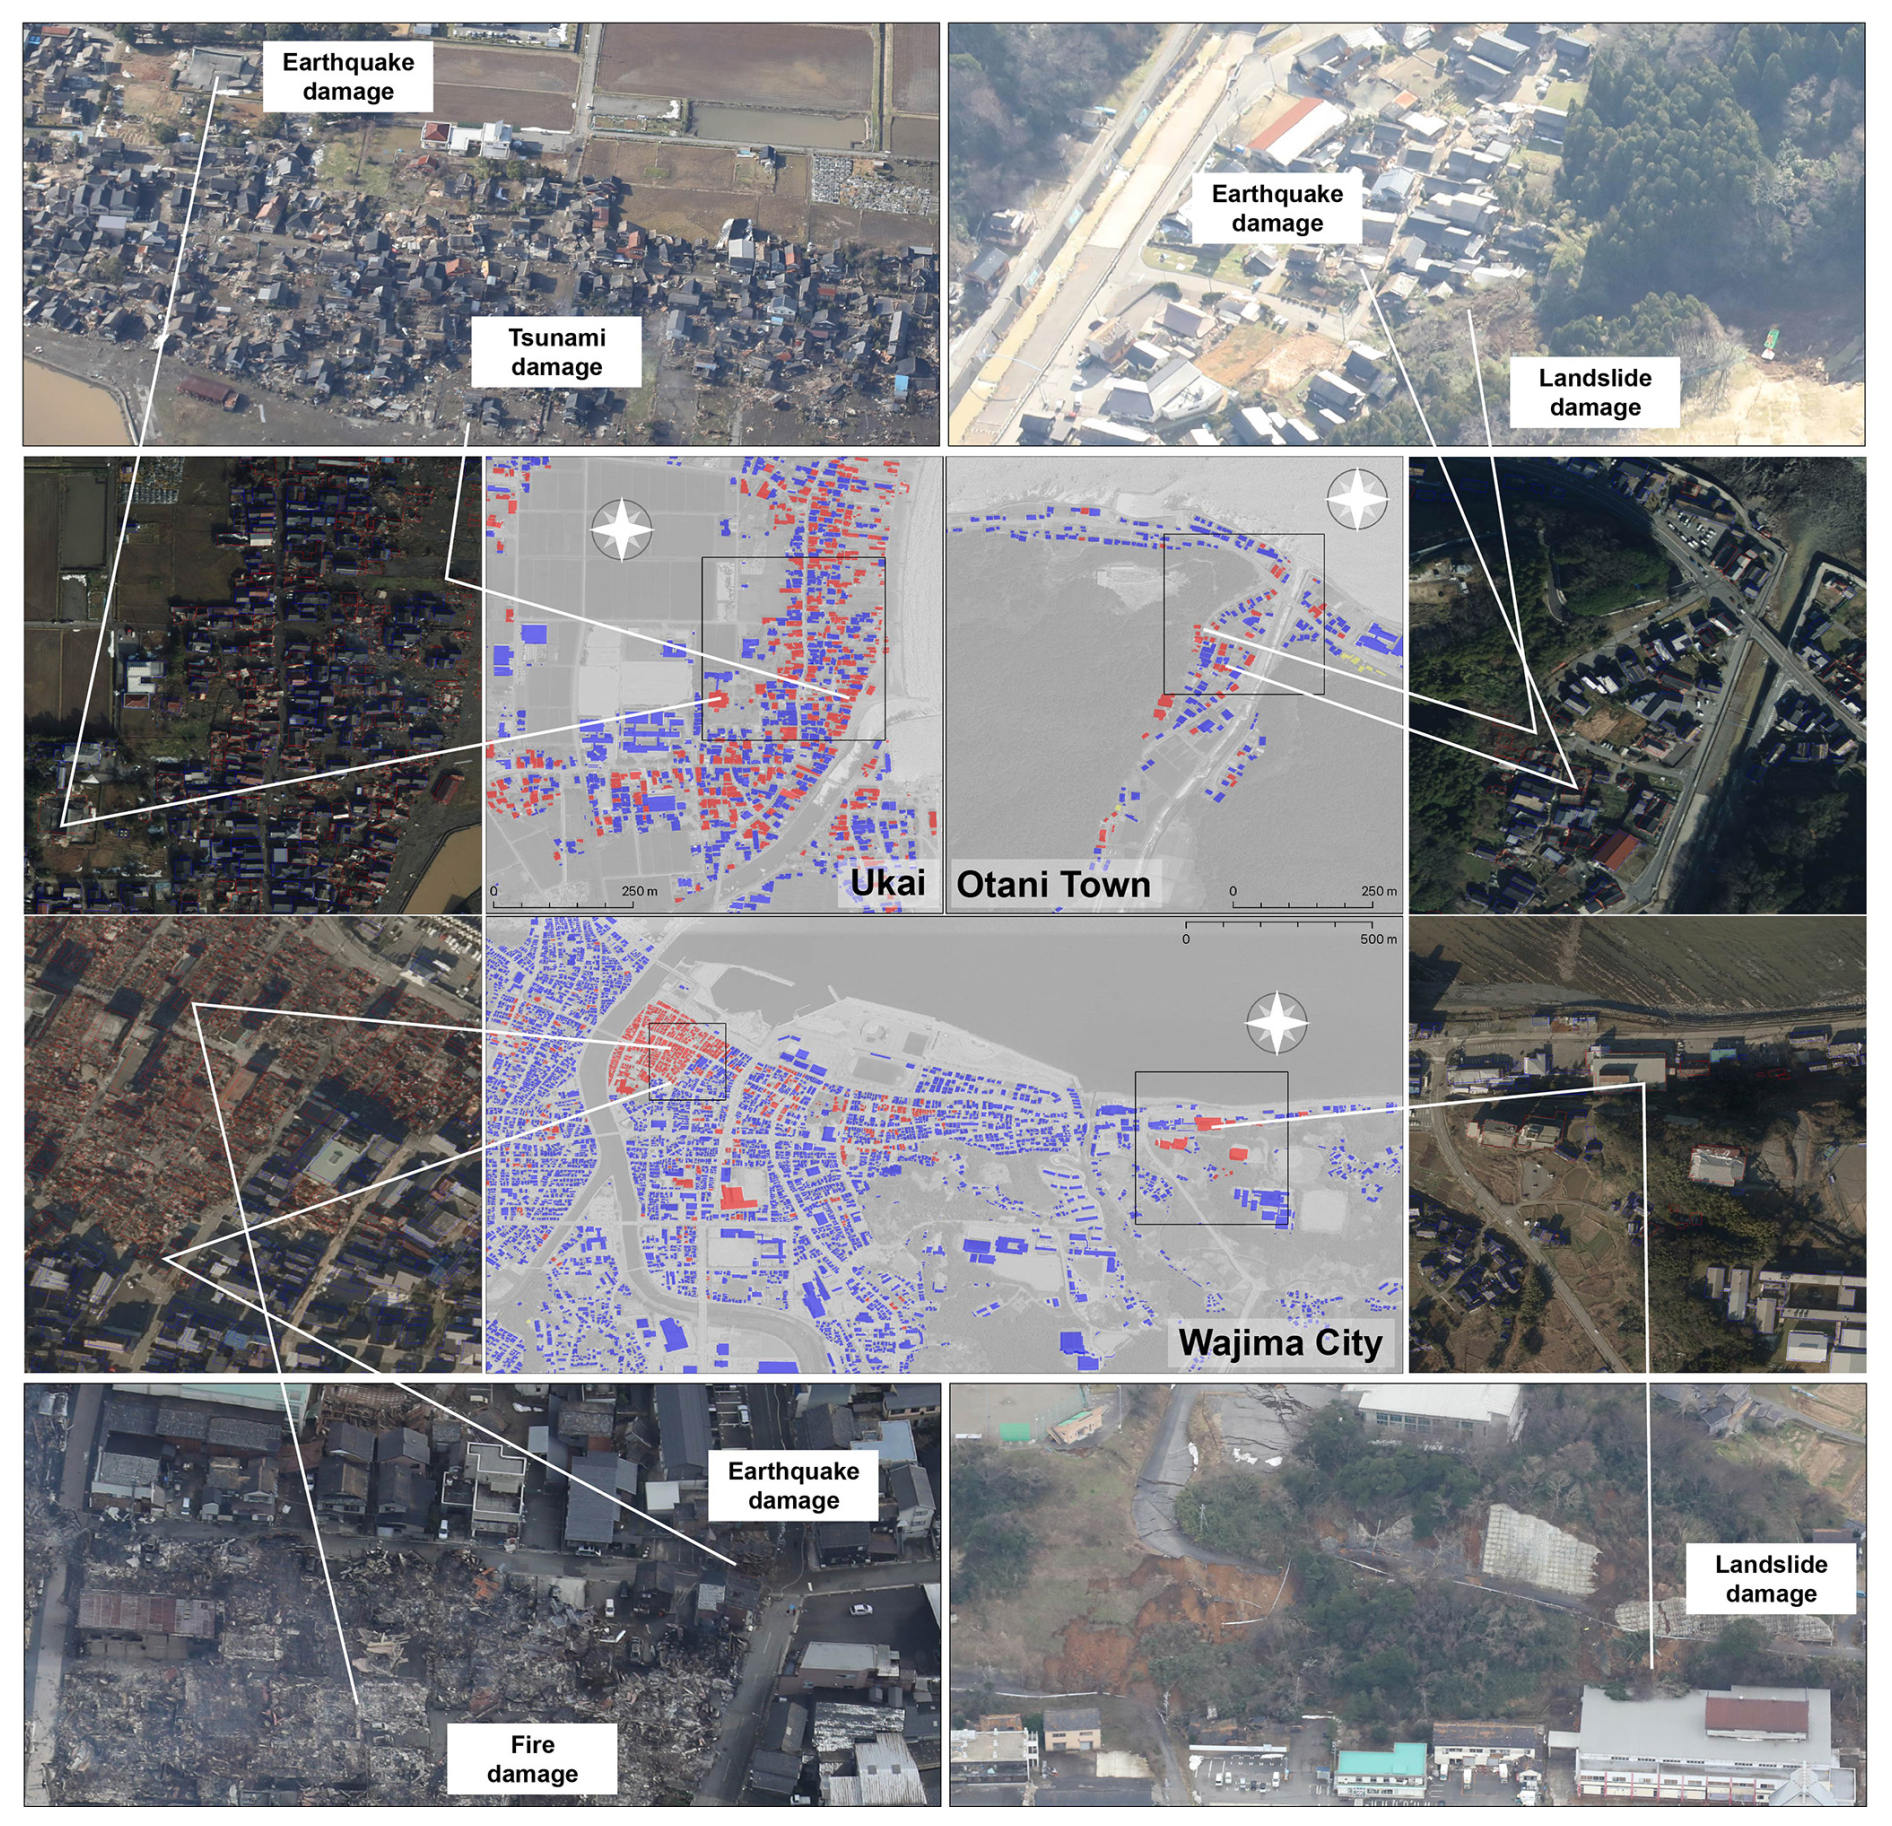
However, as Fig. 10 illustrates, multi-hazard failures not only occur within the same domain, but can also be present in contiguous sections of the same town. In the figure, we show how earthquake damage is often compounded by fire, landslide, or tsunami damage; in cases of more populated areas, multiple hazards are present at once, as can be seen in Wajima where fire damage, landslide damage, and earthquake damage are all present.
5.2 Machine learning applications
In the field of disaster geo-informatics, our dataset can serve as training data for machine learning tasks. In its current form, the dataset can be used to test pre-trained models such as those proposed by Miura et al. (2020), Deng and Wang (2022), and Wiguna et al. (2024a). In this context our dataset offers a new, valuable, out-of-domain test set (Wiguna et al., 2024a). A speculative framework, specifically focused on the multi-hazard nature of the Noto earthquake disaster discussed above, is illustrated in Fig. 11.
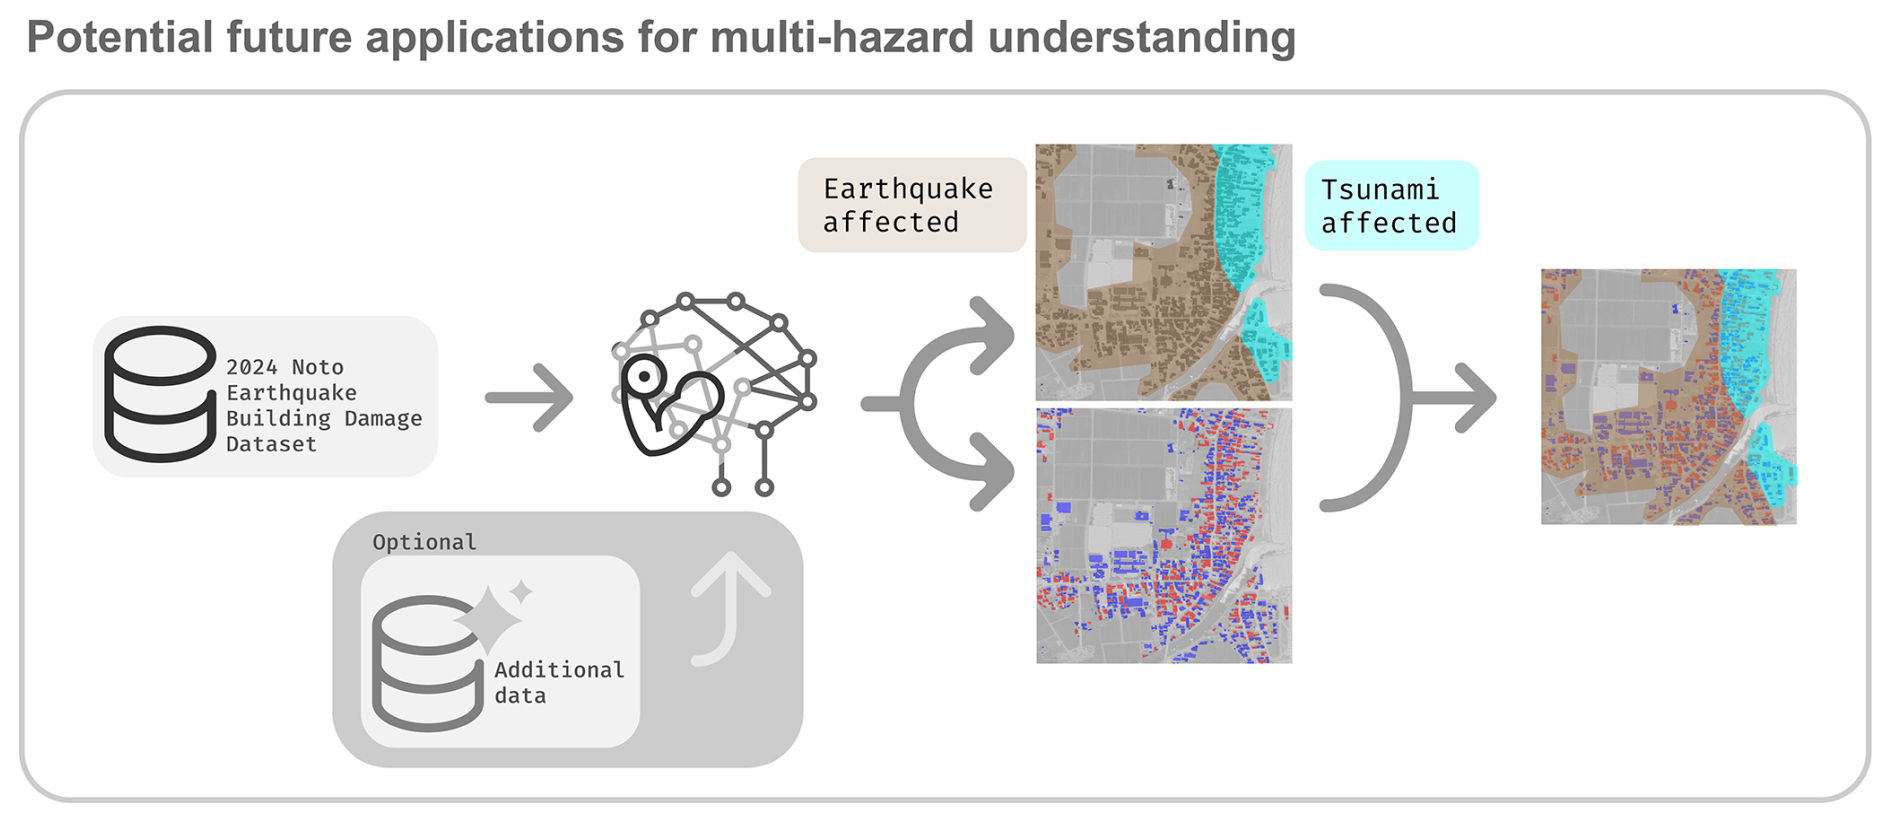
Figure 11A speculative framework that might be used to investigate multi-hazard failure modes (for illustrative purposes). Basemaps courtesy of © Google Earth 2024.
Combined with population data, our database can enable more granular quantitative research into injury and mortality.
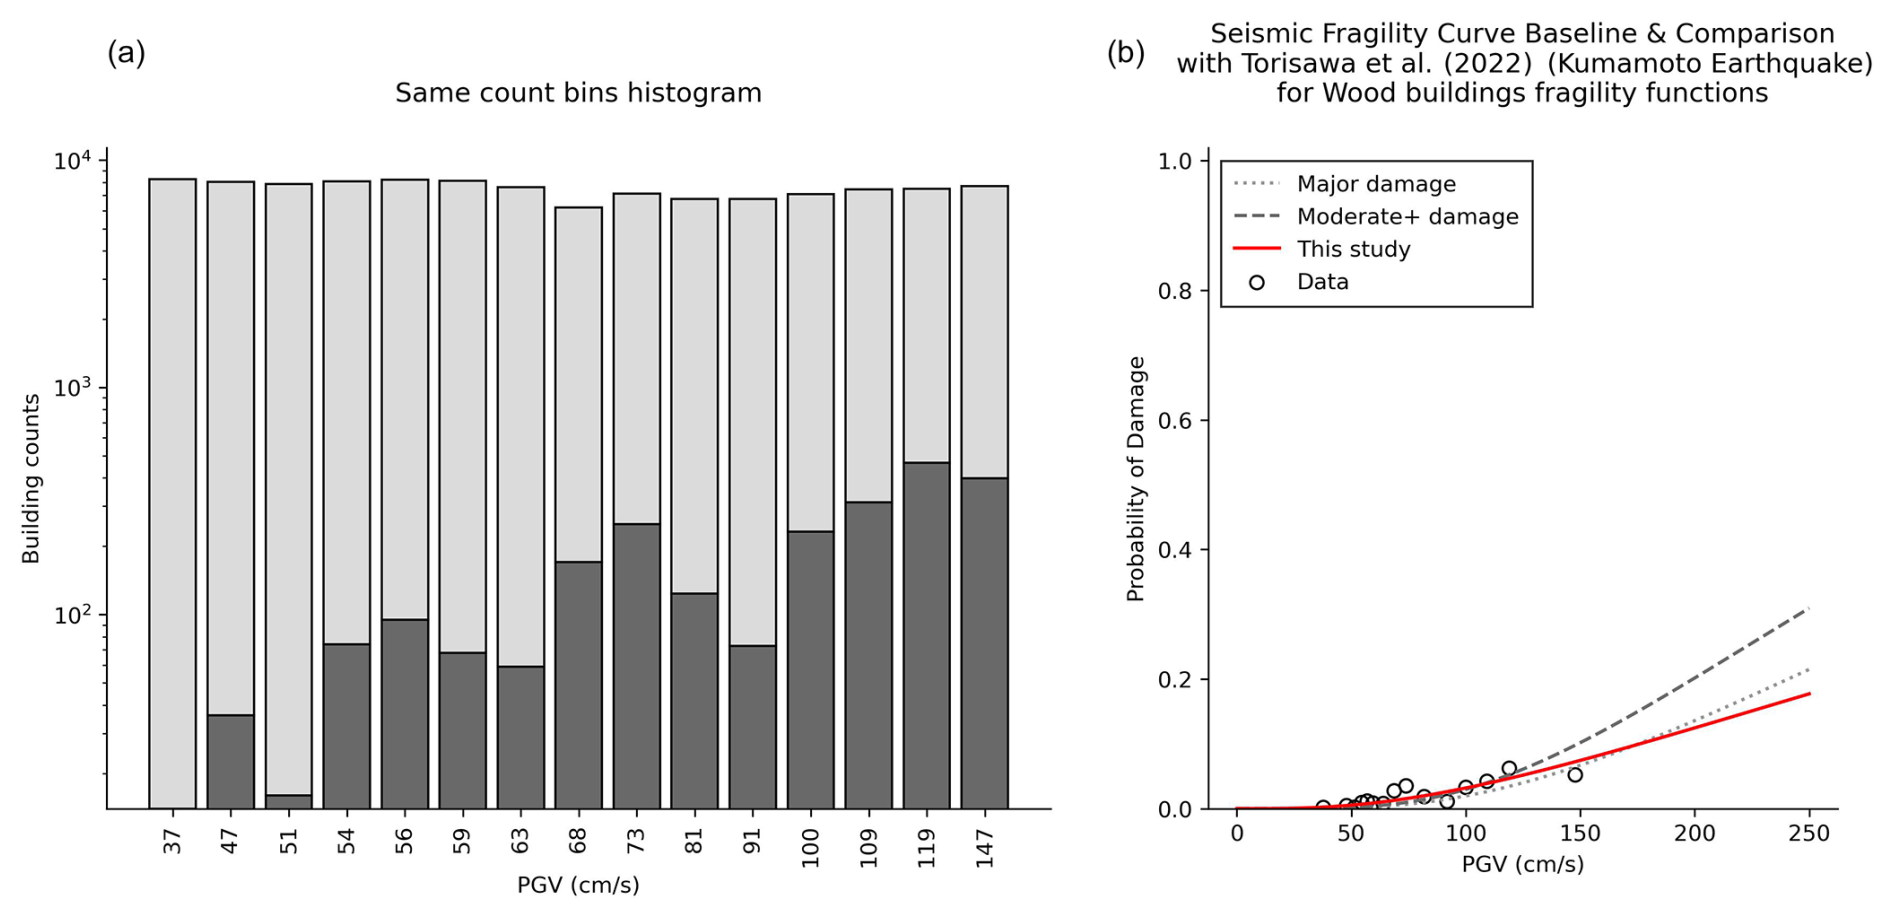
Figure 12(a) Histogram of aggregated building damage. (b) Empirical fragility function (red solid line) for earthquake-affected buildings relative to PGV. We provide two wood building fragility functions for “major” and “moderate+” damage classes (dotted line and dashed line, respectively) proposed by Torisawa et al. (2022) for buildings built between 2001 and 2016 and affected by the 2016 Kumamoto earthquake.
5.3 Statistical approaches and baseline model
To encourage the research community's engagement, we provide a statistical baseline of the damage across the non-inundated portion of the Noto Peninsula dataset (Fig. 12).
We propose an aggregated seismic empirical fragility function relative to the peak ground velocity (PGV) registered during the event. Importantly, this fragility function is built on the subset of data not affected by aggravating hazards (inundation, fire, or landslide) illustrated in Fig. 13.
Hence we assume that the damage is solely due to seismic shaking. We fit the aggregated data using a lognormal distribution (Eq. 1) and estimate the parameters using ordinary least squares (μ=6.436, σ=0.9869).
As a frame of reference, we report two fragility functions proposed by Torisawa et al. (2022) for new wooden buildings affected by the Kumamoto earthquake in 2016. Our baseline fragility function suggests that buildings in the Noto Peninsula were similarly vulnerable as wood buildings built between 2001 and 2016 and destroyed in the Kumamoto earthquake.
The database is provided as a standard GeoPackage (Yutzler, 2024) containing a single vector layer accessible through any software implementing the Geospatial Data Abstraction Library (GDAL/OGR) such as QGIS or ArcGIS. Each entry is represented by a building footprint with seven attributes summarized in Table 5.
-
The database is available in its most updated version from our public repository at https://doi.org/10.5281/zenodo.11055711 (Vescovo et al., 2025).
-
Epicenter and intensity contours are available at the USGS event page (https://earthquake.usgs.gov/earthquakes/eventpage/us6000m0xl/shakemap/intensity, USGS, 2024).
-
Earthquake swarm data are available through the Japan meteorological Agency (JMA)'s website (https://www.data.jma.go.jp/eqdb/data/shindo/, Japan Meteorological Agency, 2024b, Japanese).
-
Post-event raster orthophotography, inundation, fire, and slope failure vector extents are available through the GSI's dedicated Noto Peninsula earthquake page (GSI, 2024) (https://www.gsi.go.jp/BOUSAI/20240101, last access: 25 April 2024, Japanese).
-
Oblique imagery is provided by KKC (KKC, 2024). For disaster events, KKC may make their products available for free through the BOIS portal (https://bois-free.bousai.genavis.jp/diarsweb, Japanese, KKC, 2024), subject to terms and conditions (https://www.kkc.co.jp/contact/image/, last access: 25 April 2024, Japanese). With permission from KKC, only oblique images freely available through BOIS were employed in the present study.
We present a comprehensive building damage database for the Noto Peninsula earthquake of 2024, developed through a multi-source, multi-modal visual assessment of building damage.
The particular circumstances of this event, timeliness of data availability, degree of coverage, and access to in situ survey information presented a singular opportunity to develop and validate this new dataset through a unique framework.
Providing this dataset offers the opportunity to study impacts of multi-hazard disasters on building damage. Figure 10 illustrates how different hazards manifested across contiguous areas of the Noto Peninsula. Understanding the different impacts may provide valuable insights for disaster response and recovery planning. Future studies may leverage our dataset to develop novel multi-hazard models that can predict building damage across different impacts (a speculative framework is shown in Fig. 11). With this contribution we hope to enrich the global corpus of disaster building damage datasets.
We provide the hand-curated building inventory as a GeoPackage through the public repository at https://doi.org/10.5281/zenodo.11055711 (Vescovo et al., 2025). Each building was classified into four classes: survived, destroyed, obstructed view through human inspection, and missing or inconsistent. Limited-scope validation was conducted through crowd-sourced community feedback through our online portal and independent survey data collected by experts in the field. In its immediate form, the dataset may be used to do the following:
-
Train site-specific statistical and machine learning models for building damage assessment.
-
Test domain adaptation frameworks for building damage assessment by testing pre-trained models on our new out-of-domain dataset as illustrated by Wiguna et al. (2024a).
-
Fine-tune pre-trained models on our dataset to improve performance across datasets as shown in Wiguna et al. (2024b).
-
Develop novel multi-hazard models that can predict building damage across different impacts.
In combination with additional data sources, such as population data and post-disaster information, our dataset can inform further investigation into disaster logistics, evacuation, injury, and mortality. We hope that this dataset will serve as a reference for future studies on building damage assessment, disaster response, and recovery planning.
RV: writing (original draft preparation), validation, visualization. RV and SW: methodology, software, formal analysis, data curation, investigation. CYH, JM, XD, SI, KW, and YE: data curation. BA, EM, and AM: conceptualization, investigation, supervision, field survey, writing (review and editing). SK: conceptualization, supervision, field survey, writing (review and editing), funding acquisition.
The contact author has declared that none of the authors has any competing interests.
Publisher's note: Copernicus Publications remains neutral with regard to jurisdictional claims made in the text, published maps, institutional affiliations, or any other geographical representation in this paper. While Copernicus Publications makes every effort to include appropriate place names, the final responsibility lies with the authors.
This article is part of the special issue “Methodological innovations for the analysis and management of compound risk and multi-risk, including climate-related and geophysical hazards (NHESS/ESD/ESSD/GC/HESS inter-journal SI)”. It is not associated with a conference.
This study was supported by JSPS KAKENHI (Grants-in-Aid for Scientific Research; 21H05001, 22K21372, and 22H01741), JST SICORP (JPMJSC2311), and the SIP of CSTI (JPJ012289).
This study was supported by JSPS KAKENHI (Grants-in-Aid for Scientific Research; 21H05001, 22K21372, and 22H01741), JST SICORP (JPMJSC2311), and the SIP of CSTI (JPJ012289).
This paper was edited by Kirsten Elger and reviewed by two anonymous referees.
Anniballe, R., Noto, F., Scalia, T., Bignami, C., Stramondo, S., Chini, M., and Pierdicca, N.: Earthquake damage mapping: An overall assessment of ground surveys and VHR image change detection after L'Aquila 2009 earthquake, Remote Sens. Environ., 210, 166–178, https://doi.org/10.1016/j.rse.2018.03.004, 2018. a
Barrington, L., Ghosh, S., Greene, M., Har-Noy, S., Berger, J., Gill, S., Yu-Min, A., and Huyck, C.: Crowdsourcing earthquake damage assessment using remote sensing imagery, Ann. Geophys., 54, https://doi.org/10.4401/ag-5324, 2012. a
British Broadcasting Corporation: Japan earthquake: Fires hit quake zone as rescuers race to reach survivors, BBC News, https://www.bbc.com/news/world-asia-67865502, last access: 25 April 2024. a
CEMS: Detection methods and Damage Assessment, Online, CEMS, https://mapping.emergency.copernicus.eu/about/rapid-mapping-manual/detection-methods-damage-assessment/, last access: 10 June 2025. a, b, c
Charvet, I., Suppasri, A., and Imamura, F.: Empirical fragility analysis of building damage caused by the 2011 Great East Japan tsunami in Ishinomaki city using ordinal regression, and influence of key geographical features, Stochastic Environmental Research and Risk Assessment, https://doi.org/10.1007/s00477-014-0850-2, 2014. a
Chua, C. T., Switzer, A. D., Suppasri, A., Li, L., Pakoksung, K., Lallemant, D., Jenkins, S. F., Charvet, I., Chua, T., Cheong, A., and Winspear, N.: Tsunami damage to ports: cataloguing damage to create fragility functions from the 2011 Tohoku event, Nat. Hazards Earth Syst. Sci., 21, 1887–1908, https://doi.org/10.5194/nhess-21-1887-2021, 2021. a
Deng, L. and Wang, Y.: Post-disaster building damage assessment based on improved U-Net, Sci. Rep.-UK, 12, 15862, https://doi.org/10.1038/s41598-022-20114-w, 2022. a, b
Egawa, S., Ishii, T., Furukawa, H., Fujita, M., Abe, Y., Sakamoto, A., Inaba, Y., Ono, K., Harigae, H., Tsuboi, M., Kuriyama, S., and Sasaki, H.: The 2024 Noto Peninsula Earthquake and the Strategy of Medical Assistance from the Tohoku University Hospital, Tohoku J. Exp. Med., 262, 45–49, https://doi.org/10.1620/tjem.2024.J010, 2024. a, b
GEBCO Bathymetric Compilation Group 2023: The GEBCO 2023 Grid – a continuous terrain model of the global ocean and land, https://doi.org/10.5285/f98b053b-0cbc-6c23-e053-6c86abc0af7b, 2023. a
Ghosh, S., Huyck, C. K., Greene, M., Gill, S. P., Bevington, J., Svekla, W., DesRoches, R., and Eguchi, R. T.: Crowdsourcing for Rapid Damage Assessment: The Global Earth Observation Catastrophe Assessment Network (GEO-CAN), Earthq. Spectra, 27, 179–198, https://doi.org/10.1193/1.3636416, 2011. a
Gokon, H. and Koshimura, S.: Mapping of Building Damage of the 2011 Tohoku Earthquake Tsunami in Miyagi Prefecture, Coast. Eng. J., 54, 1250006–1–1250006-12, https://doi.org/10.1142/S0578563412500064, 2012. a
Grünthal, G., Musson, R. M. W., Schwarz, J., and Stucchi, M.: European Microseismic Scale 1998, EMS-98, Cahiers du Centre Européen de Géodynamique et de Séismologie, 15, https://doi.org/10.2312/EMS-98.full.en, 1998. a, b
GSI: Information on the Noto Peninsula Eartquake, Webpage, Geospatial Information Authority of Japan [data set], https://www.gsi.go.jp/BOUSAI/20240101_noto_earthquake.html, last access: 25 April 2024. a, b, c, d, e, f, g, h, i, j, k, l, m, n
Huynh, A., Eguchi, M., Lin, A. Y.-M., and Eguchi, R.: Limitations of crowdsourcing using the EMS-98 scale in remote disaster sensing, in: 2014 IEEE Aerospace Conference, https://doi.org/10.1109/AERO.2014.6836457, pp. 1–7, ISSN 1095-323X, 2014. a
Ishikawa, Y. and Bai, L.: The 2024 Mj7.6 Noto Peninsula, Japan earthquake caused by the fluid flow in the crust, Earthquake Research Advances, 100292, https://doi.org/10.1016/j.eqrea.2024.100292, 2024. a
Japan Meteorological Agency: Reiwa 6 Noto Peninsula Earthquake Assessment (January 2nd), Tech. rep., Japan Meteorological Agency, https://www.static.jishin.go.jp/resource/monthly/2024/20240101_noto_1.pdf, last access: 25 April 2024a. a
Japan Meteorological Agency: Seismic Intensity Database (January 2nd), Tech. Rep., Japan Meteorological Agency, https://www.data.jma.go.jp/eqdb/data/shindo, last access: 25 April 2024b (in Japanese). a
Japanese Industrial Standard Committee: JIS X0410:2002 Regional mesh code, Japanese Standards Associations (JSA), https://www.jisc.go.jp/app/jis/general/GnrJISNumberNameSearchList?toGnrJISStandardDetailList (last access: 25 April 2024), 2021. a
Japanese Red Cross Society: Operation Update No.30: 2024 Noto Peninsula Earthquake: The Japanese Red Cross Society's Response – Emergency Relief, Japanese Red Cross Society, https://www.jrc.or.jp/english/relief/2024NotoPeninsulaEarthquake.html, last access: 25 April 2024. a
KKC: Reiwa 6 Noto Peninsula Earthquake, Kokusai Kougyou [data set], https://bois-free.bousai.genavis.jp/diarsweb, last access: 25 April 2024. a, b, c, d, e, f, g, h, i
KKE: QUIET+, Tech. rep., Kōzō Keikaku Engineering Inc., https://site.quietplus.kke.co.jp/home/, last access: 25 April 2024. a
Masuda, H., Sugawara, D., Cheng, A.-C., Suppasri, A., Shigihara, Y., Kure, S., and Imamura, F.: Modeling the 2024 Noto Peninsula earthquake tsunami: implications for tsunami sources in the eastern margin of the Japan Sea, Geoscience Letters, 11, 29, https://doi.org/10.1186/s40562-024-00344-8, 2024. a
MIAC: E-Stat: Portal Site of Official Statistics of Japan, Online, Ministry of Internal Affairs and Communications, https://www.e-stat.go.jp/, last access: 25 April 2024. a
Minami, F.: (Expert Opinion) Noto Peninsula earthquake hits family home in Nanao, Ishikawa Prefecture, Japan Shelters were set up by the residents themselves, Yahoo! Japan News, https://news.yahoo.co.jp/expert/articles/8ab093df29bbadd1bf5c18e9d64fc581e677904d, last access: 25 April 2024. a, b
Miura, H., Aridome, T., and Matsuoka, M.: Deep Learning-Based Identification of Collapsed, Non-Collapsed and Blue Tarp-Covered Buildings from Post-Disaster Aerial Images, Remote Sens.-Basel, 12, 1924, https://doi.org/10.3390/rs12121924, 2020. a, b, c
NASA: Earthquake Lifts the Noto Peninsula, NASA, https://earthobservatory.nasa.gov/images/152350/earthquake-lifts-the-noto-peninsula, last access: 25 April 2024. a
NIED: Nied K-Net, Kik-Net, Tech. rep., National Research Institute for Earth Science and Disaster Resilience, https://doi.org/10.17598/NIED.0004, 2019. a
Okada, S. and Takai, N.: Classifications of Structural Types and Damage Patterns of Buildings for Earthquake Field Investigation, Journal of Structural and Construction Engineering (Transactions of AIJ), 64, 65–72, https://doi.org/10.3130/aijs.64.65_5, 1999. a, b
Poiani, T. H., Dos Santos Rocha, R., Degrossi, L. C., and Porto De Albuquerque, J.: Potential of Collaborative Mapping for Disaster Relief: A Case Study of OpenStreetMap in the Nepal Earthquake 2015, in: 2016 49th Hawaii International Conference on System Sciences (HICSS), IEEE, https://doi.org/10.1109/hicss.2016.31, pp. 188–197, 2016. a
Prime Minister's Office of Japan: Press Conference by the Prime Minister on the 2024 Noto Peninsula Earthquake, January 1, 2024, Cabinet Public Affairs Office, Cabinet Secretariat, https://japan.kantei.go.jp/101_kishida/statement/202401/01kaiken.html, last access: 25 April 2024a. a
Prime Minister's Office of Japan: Press Conference by the Prime Minister on the 2024 Noto Peninsula Earthquake, January 2, 2024, Cabinet Public Affairs Office, Cabinet Secretariat, https://japan.kantei.go.jp/101_kishida/statement/202401/01kaiken.html, last access: 25 April 2024b. a
Prime Minister's Office of Japan: Press Conference by the Prime Minister on the 2024 Noto Peninsula Earthquake, January 3, 2024, Cabinet Public Affairs Office, Cabinet Secretariat, https://japan.kantei.go.jp/101_kishida/statement/202401/01kaiken.html, last access: 25 April 2024c. a
Prime Minister's Office of Japan: To those affected by the 2024 Noto Peninsula Earthquake – Information to assist disaster victims, Cabinet Public Affairs Office, Cabinet Secretariat, https://japan.kantei.go.jp/ongoingtopics/notoearthquake20240101.html, last access: 25 April 2024d. a
Sekimoto, Y., Nishizawa, A., Yamada, H., Shibasaki, R., Kumagai, J., Kashiyama, T., Sagara, T., Kayama, Y., and Ootomo, S.: Data Mobilization by Digital Archiving of the Great East Japan Earthquake Survey, Theory and Applications of GIS, 21, 87–95, https://doi.org/10.5638/thagis.21.87, 2013. a
Suppasri, A., Muhari, A., Futami, T., Imamura, F., and Shuto, N.: Loss Functions for Small Marine Vessels Based on Survey Data and Numerical Simulation of the 2011 Great East Japan Tsunami, J. Waterway Port C., 140, 04014018, https://doi.org/10.1061/(asce)ww.1943-5460.0000244, 2014. a
Tertulliani, A., Leschiutta, I., Bordoni, P., and Milana, G.: Damage Distribution in L'Aquila City (Central Italy) during the 6 April 2009 Earthquake, B. Seismol. Soc. Am., 102, 1543–1553, https://doi.org/10.1785/0120110205, 2012. a
Torisawa, K., Matsuoka, M., Horie, K., Inoguchi, M., and Yamazaki, F.: Development of Fragility Curves for Japanese Buildings Based on Integrated Damage Data from the 2016 Kumamoto Earthquake, Journal of Disaster Research, 17, 464–474, https://doi.org/10.20965/jdr.2022.p0464, 2022. a, b
USGS: M 7.5 – 2024 Noto Peninsula, Japan Earthquake, USGS [data set], https://earthquake.usgs.gov/earthquakes/eventpage/us6000m0xl/shakemap/intensity, last access: 25 April 2024. a, b, c, d
Valentijn, T., Margutti, J., van den Homberg, M., and Laaksonen, J.: Multi-hazard and spatial transferability of a cnn for automated building damage assessment, Remote Sens.-Basel, 12, 2839, https://doi.org/10.3390/rs12172839, 2020. a
Vescovo, R., Adriano, B., Mas, E., Wiguna, S., Mizutani, A., Ho, C. Y., Morales, J., Dong, X., Ishii, S., Ezaki, Y., Wako, K., Tanaka, S., and Koshimura, S.: 2024 Noto Peninsula Earthquake Building Damage Visual Assesment (2.4), Zenodo [data set], https://doi.org/10.5281/zenodo.11055711, 2025. a, b, c
Wiguna, S., Adriano, B., Mas, E., and Koshimura, S.: Evaluation of Deep Learning Models for Building Damage Mapping in Emergency Response Settings, IEEE J. Sel. Top. Appl., 1–17, https://doi.org/10.1109/JSTARS.2024.3367853, 2024a. a, b, c, d
Wiguna, S., Adriano, B., Vescovo, R., Mas, E., Mizutani, A., and Koshimura, S.: Building Damage Mapping of the 2024 Noto Peninsula Earthquake, Japan, Using Semi-Supervised Learning and VHR Optical Imagery, IEEE Geosci. Remote S., 21, 1–5, https://doi.org/10.1109/LGRS.2024.3407725, 2024b. a
Xia, J., Yokoya, N., Adriano, B., and Broni-Bediako, C.: OpenEarthMap: A Benchmark Dataset for Global High-Resolution Land Cover Mapping, IEEE Computer Society, ISBN 9781665493468, https://doi.org/10.1109/WACV56688.2023.00619, pp. 6243–6253, 2023. a
xTECH, NIKKEI: Wooden houses collapse in rapid succession amid frequent liquefaction, Nanao City, Nikkei Crosstech, https://xtech.nikkei.com/atcl/nxt/column/18/02706/011100038/, last access: 25 April 2024. a, b
Yuhi, M., Umeda, S., Arita, M., Ninomiya, J., Gokon, H., Arikawa, T., Baba, T., Imamura, F., Kawai, A., Kumagai, K., Kure, S., Miyashita, T., Suppasri, A., Nobuoka, H., Shibayama, T., Koshimura, S., and Mori, N.: Post-event survey of the 2024 Noto Peninsula earthquake tsunami in Japan, Coast. Eng. J., 1–14, https://doi.org/10.1080/21664250.2024.2368955, 2024a. a
Yuhi, M., Umeda, S., Arita, M., Ninomiya, J., Gokon, H., Arikawa, T., Baba, T., Imamura, F., Kumagai, K., Kure, S., Miyashita, T., Suppasri, A., Kawai, A., Nobuoka, H., Shibayama, T., Koshimura, S., and Mori, N.: Dataset of Post-Event Survey of the 2024 Noto Peninsula Earthquake Tsunami in Japan, Scientific Data, 11, https://doi.org/10.1038/s41597-024-03619-z, 2024b. a
Yutzler, J.: OGC® GeoPackage Encoding Standard, https://www.geopackage.org/spec140/index.html, last access: 25 April 2024. a, b
Zhai, Z., Kijewski-Correa, T., Hachen, D., and Madey, G.: Haiti earthquake photo tagging: Lessons on crowdsourcing in-depth image classifications, in: Seventh International Conference on Digital Information Management (ICDIM 2012), IEEE, https://doi.org/10.1109/ICDIM.2012.6360130, 2012. a