the Creative Commons Attribution 4.0 License.
the Creative Commons Attribution 4.0 License.
 | 29 Sep 2025
Updates to C-LSAT 2.1 and the development of high-resolution land surface air temperature and diurnal temperature range datasets
Sihao Wei
Qiya Xu
Zichen Li
Hanyu Zhang
Jiaxue Lin
High-resolution climate datasets are of critical importance for the comprehension of spatial and temporal variations in climate and hydrology. However, their development is significantly influenced by the availability, density, and quality of observational data. Building on the China global land surface air temperature 2.0 (C-LSAT 2.0) station data, we collected and integrated nearly 3000 additional station observations and conducted quality control and homogenization processing to complete the updates to the C-LSAT 2.1 dataset. The coverage of the C-LSAT 2.1 dataset has been significantly enhanced, further improving the representativeness of global land diurnal temperature range (DTR) data with greater spatial heterogeneity. Compared to C-LSAT 2.0, C-LSAT 2.1 shows consistent overall trends, except for a slight post-2010 increase for the Southern Hemisphere LSAT anomaly. Furthermore, we employed a “thin-plate spline (climatology) and adjusted inverse distance weighted (anomaly fields)” technical framework to develop a high-resolution (0.5°×0.5°) LSAT (C-LSAT HRv1) and DTR (C-LDTR HRv1) dataset covering January 1901–December 2023. Apart from discrepancies in 1901–1950 due to the limited number of observational stations, the C-LSAT HRv1 and C-LDTR HRv1 datasets effectively capture global and regional variation patterns for subsequent periods. The C-LSAT 2.1 dataset can be downloaded from https://doi.org/10.6084/m9.figshare.28255394.v1 (Wei et al., 2025a), while the C-LSAT HRv1 and C-LDTR HRv1 datasets are available at https://doi.org/10.6084/m9.figshare.28255505.v2 (Wei et al., 2025c) and https://doi.org/10.6084/m9.figshare.28255568.v2 (Wei et al., 2025b), respectively. They are also accessible via http://www.gwpu.net (last access: 11 July 2025).
- Article
(11660 KB) - Full-text XML
-
Supplement
(625 KB) - BibTeX
- EndNote


Global surface temperature (GST) is one of the most important indicators in the Earth's climate system, serving as a key metric for monitoring and understanding climate change and directly reflecting global warming (IPCC, 2007, 2013, 2021). Likewise, land surface air temperature (LSAT), which is closely related to GST, is also of critical importance. Since the onset of global industrialization, the rising emissions of greenhouse gases, such as carbon dioxide, have driven rapid increases in LSAT, causing profound consequences for ecosystem stability, human health, and economic production (Jones et al., 2023; Loucks, 2021). The Intergovernmental Panel on Climate Change (IPCC) has systematically summarized and assessed climate change research through its assessment reports. These documents reveal the current state, future change, impacts, and adaptation measures of climate change, providing the scientific basis for policy decisions worldwide. According to IPCC AR6 (2021), global land temperature during 2011–2020 increased by 1.59 °C (1.34–1.83 °C) relative to pre-industrial levels.
The diurnal temperature range (DTR) indicates the difference between daytime and nighttime temperatures; it is influenced by factors such as greenhouse gases, aerosols, and land use changes (Kalnay and Cai, 2003; Stjern et al., 2020). DTR exhibits significant spatial heterogeneity and seasonal variations. In the latter half of the 20th century, observed nighttime warming on land exceeded daytime warming. This trend led to the narrowing of the global DTR (Zhong et al., 2023). Furthermore, DTR changes are strongly correlated with the probability of extreme high- and low-temperature events. Since 1950, the global DTR has been decreasing, with most of the reduction occurring between 1960 and 1980 (IPCC, 2021).
Meteorological observation stations vary significantly in terms of spatial distribution, especially in high-altitude or otherwise complex terrain. Moreover, disparities in temporal coverage and incomplete homogenization affect the accuracy of climate change analysis (Kumar et al., 2022; Sokol et al., 2021; Viviroli et al., 2011; Zhao et al., 2020). The major representative LSAT benchmark observational datasets worldwide used in IPCC AR6 include CRUTEM (Osborn et al., 2021), GHCN (Menne et al., 2018), GISTEMP (Lenssen et al., 2024), Berkeley Earth (Rohde and Hausfather, 2020), and C-LSAT (Li et al., 2021; Sun et al., 2021). Global land DTR datasets include CRU TS (Harris et al., 2020), GHCNDEX (Menne et al., 2018), and the recently released C-LDTR (Xu et al., 2025). Some datasets provide Tmax and Tmin, enabling the calculation of DTR, such as Berkeley Earth (Rohde and Hausfather, 2020), HadEX3 (Dunn et al., 2024), and HadGHCND (Caesar et al., 2006).
Improving spatial resolution is essential for investigating regional climate change, especially in quantifying the effects of topography and in supporting climate research at medium and small scales, which can provide more accurate support for climate prediction, regional model refinement, and climate risk evaluation (Beck et al., 2018; Harris et al., 2014, 2020; Kotlarski et al., 2014; Sun et al., 2018). Global high-resolution LSAT datasets have been continuously developed in recent years. However, they remain constrained in capturing climate change in some regions (Karger et al., 2017; Li et al., 2021, 2024a; Wang et al., 2024). Accordingly, systematically integrating additional observational networks is crucial to improve dataset accuracy and better resolve regional climate change (Haylock et al., 2008; Li et al., 2017, 2020; Menne et al., 2012; Wu and Gao, 2013; Xu et al., 2013). Long-term series datasets are conventionally generated by separately interpolating climatology and anomaly fields and then combining them into a complete dataset (Cheng et al., 2020; Harris et al., 2020; New et al., 1999, 2000; Schamm et al., 2014). For climatology field interpolation, common methods include thin-plate spline (TPS) (Wahba, 1990), the Precipitation-elevation Regressions on Independent Slopes Model (PRISM) (Daly et al., 1994), and Kriging (Cressie, 1990). When interpolating the anomaly field, the inverse distance weighted (IDW), multiple regression, and bilinear interpolations are frequently employed. Among the above-mentioned datasets, the Climatic Research Unit (CRU) developed a 0.5°×0.5° high-resolution global LSAT dataset by applying TPS for the climatology field and angular distance weighting (ADW) (New et al., 1999, 2000) for the anomaly field. The Berkeley Earth team employed Kriging and IDW to construct a high-resolution global LSAT dataset with a 1°×1° resolution (Rohde et al., 2013). Fick and Hijmans (2017) developed a global 1 km LSAT dataset using TPS.
The C-LSAT dataset integrates observational datasets from over 10 global, regional, and national sources, continuously improving data completeness and accuracy (Li, 2019; Li et al., 2021, 2023, 2024b; Sun et al., 2021c, 2022; Sun and Li, 2021a, b; Xu et al., 2018, 2024, 2025; Yun et al., 2019). To date, the C-LSAT team provides only 5°×5° gridded products (C-LSAT 2.0, including monthly mean temperature (Tavg), monthly mean maximum temperature (Tmax), and monthly mean minimum temperature (Tmin)) (http://www.gwpu.net, last access: 5 February 2025) and recently released C-LDTR (Xu et al., 2025). This study aims to utilize the recently updated C-LSAT 2.1 station data to update the C-LSAT 2.1 (5°×5°) gridded data (Wei et al., 2025a) and to develop corresponding global high-resolution LSAT (C-LSAT HRv1) and DTR (C-LDTR HRv1) datasets at a 0.5°×0.5° resolution (Wei et al., 2025b, c). Consequently, this study is organized into seven main sections. Section 2 details the updates and pre-processing of the C-LSAT 2.1 station data. Section 3 presents the updated 5°×5° C-LSAT 2.1 gridded product. The development and validation of the C-LSAT HRv1 and C-LDTR HRv1 datasets are presented in Sect. 4. Section 5 analyses the spatiotemporal patterns of global and regional LSAT and DTR using high-resolution datasets (0.5°×0.5°). Section 6 discusses the availability of these datasets. Section 7 concludes with the key findings of this study.
2.1 Data sources and updates
2.1.1 Data integration
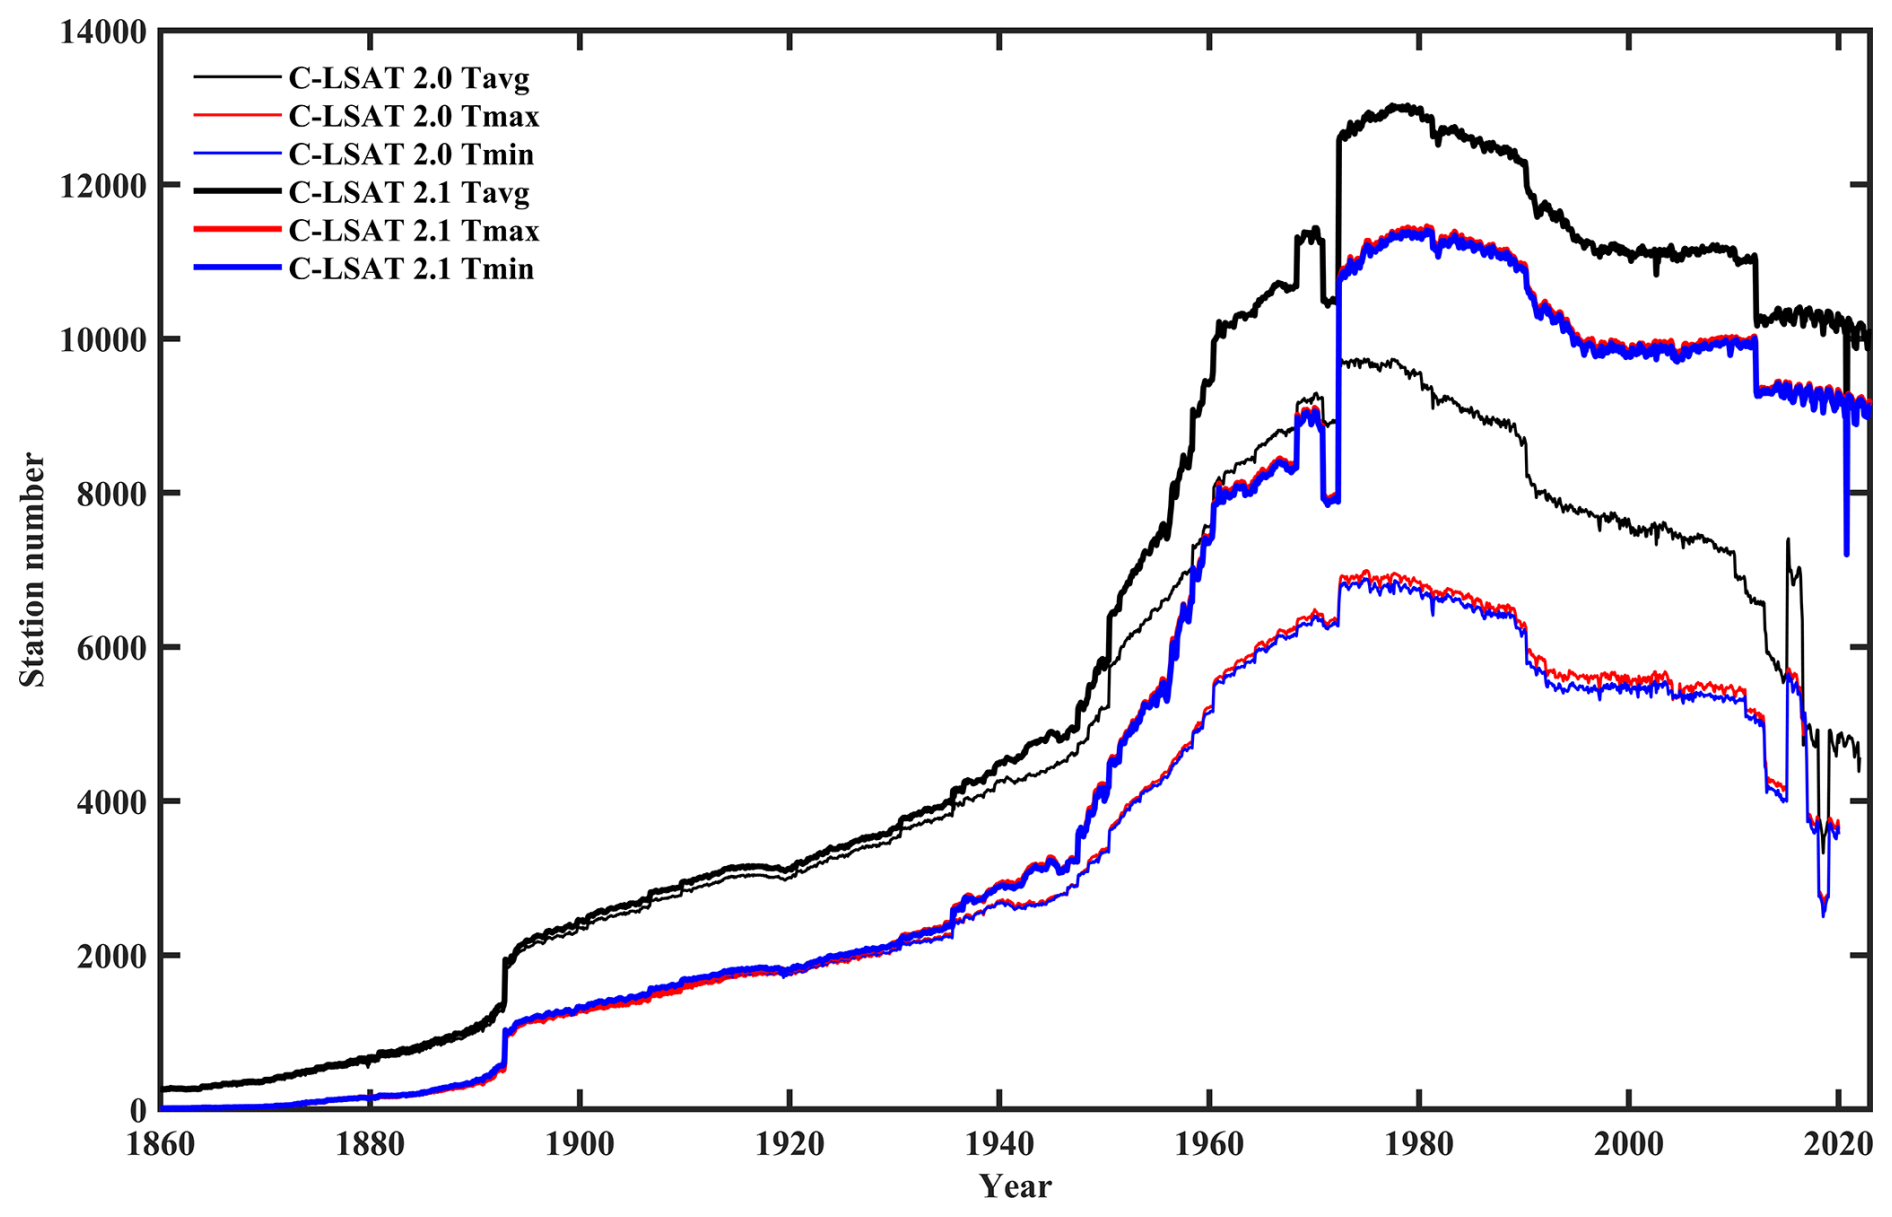
This study builds on C-LSAT 2.0 station data (Xu et al., 2018; Yun et al., 2019), combined with additional observations integrated from various countries, regions, and global sources, covering the period from 2013 to 2023. Compared to version 2.0, the C-LSAT 2.1 station data significantly increased the number of observation stations (Tavg increased from 15 936 to 25 085 stations, Tmax increased from 13 648 to 25 086 stations, and Tmin increased from 13 629 to 25 083 stations, as shown in Fig. 1 of Xu et al., 2025).
Various data sources commonly assign different station IDs to the same station. Therefore, matching the data from various sources with the corresponding stations in the C-LSAT station data is a problem that requires urgent resolution. Most stations have a core five-digit ID. For example, the core ID for the “JAN MAYEN” station is “01001”. In GSOD, this appears as “01001099999”; in the CLIMATE Report, this appears as “01001”; and in C-LSAT station data, this appears as “601001001000”. For stations lacking a consistent core ID, we employ the station name or identify nearby stations to locate the corresponding stations and complete the updates. Notably, when the sequence of a station is derived from multiple data sources, there may be homogenization discrepancies. In such cases, the application of calibration procedures for the specific station is necessary.
2.1.2 Eliminating duplicate stations
When updating data from multiple sources, duplicate stations are inevitable. They arise either because different data sources assign distinct IDs to the same station or because iterative updates generate new duplicates. Duplicate stations can affect the interpolation of both the climatology and anomaly fields, causing deviations in the interpolation results. To address this issue, it is essential to eliminate duplicate stations. Based on the same core IDs and similar station names, the C-LSAT 2.1 station data are filtered to identify and select duplicate stations. Subsequently, time series from each duplicate and its corresponding update sources or nearby stations are plotted for comparison. A reference station with the longest and most consistent record is then chosen. The data from the duplicate stations are selectively merged with the reference station or retained unmodified, ensuring the retention of a single representative station for each group of duplicates (Rennie et al., 2014; Xu et al., 2018).
Table 1Quality control results for C-LSAT 2.1 station data (unit: station month).
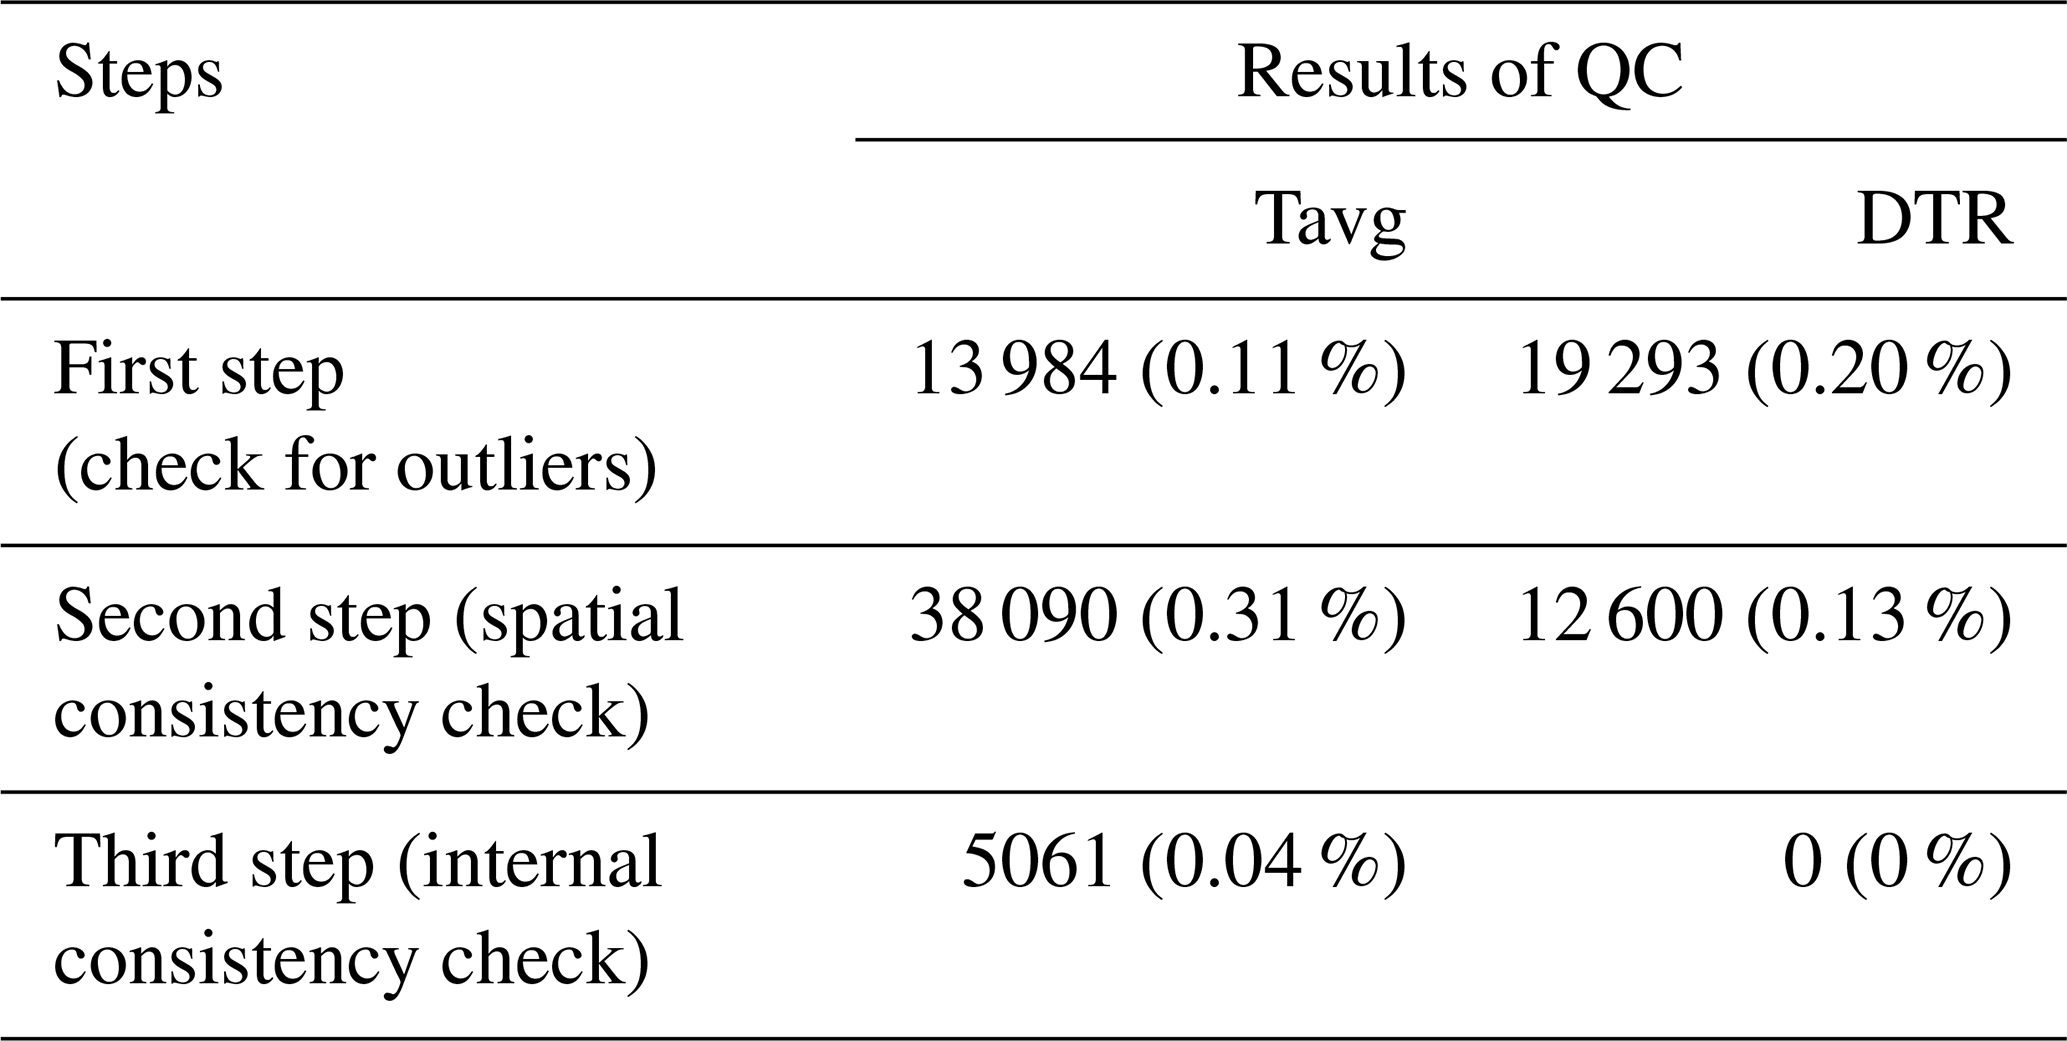
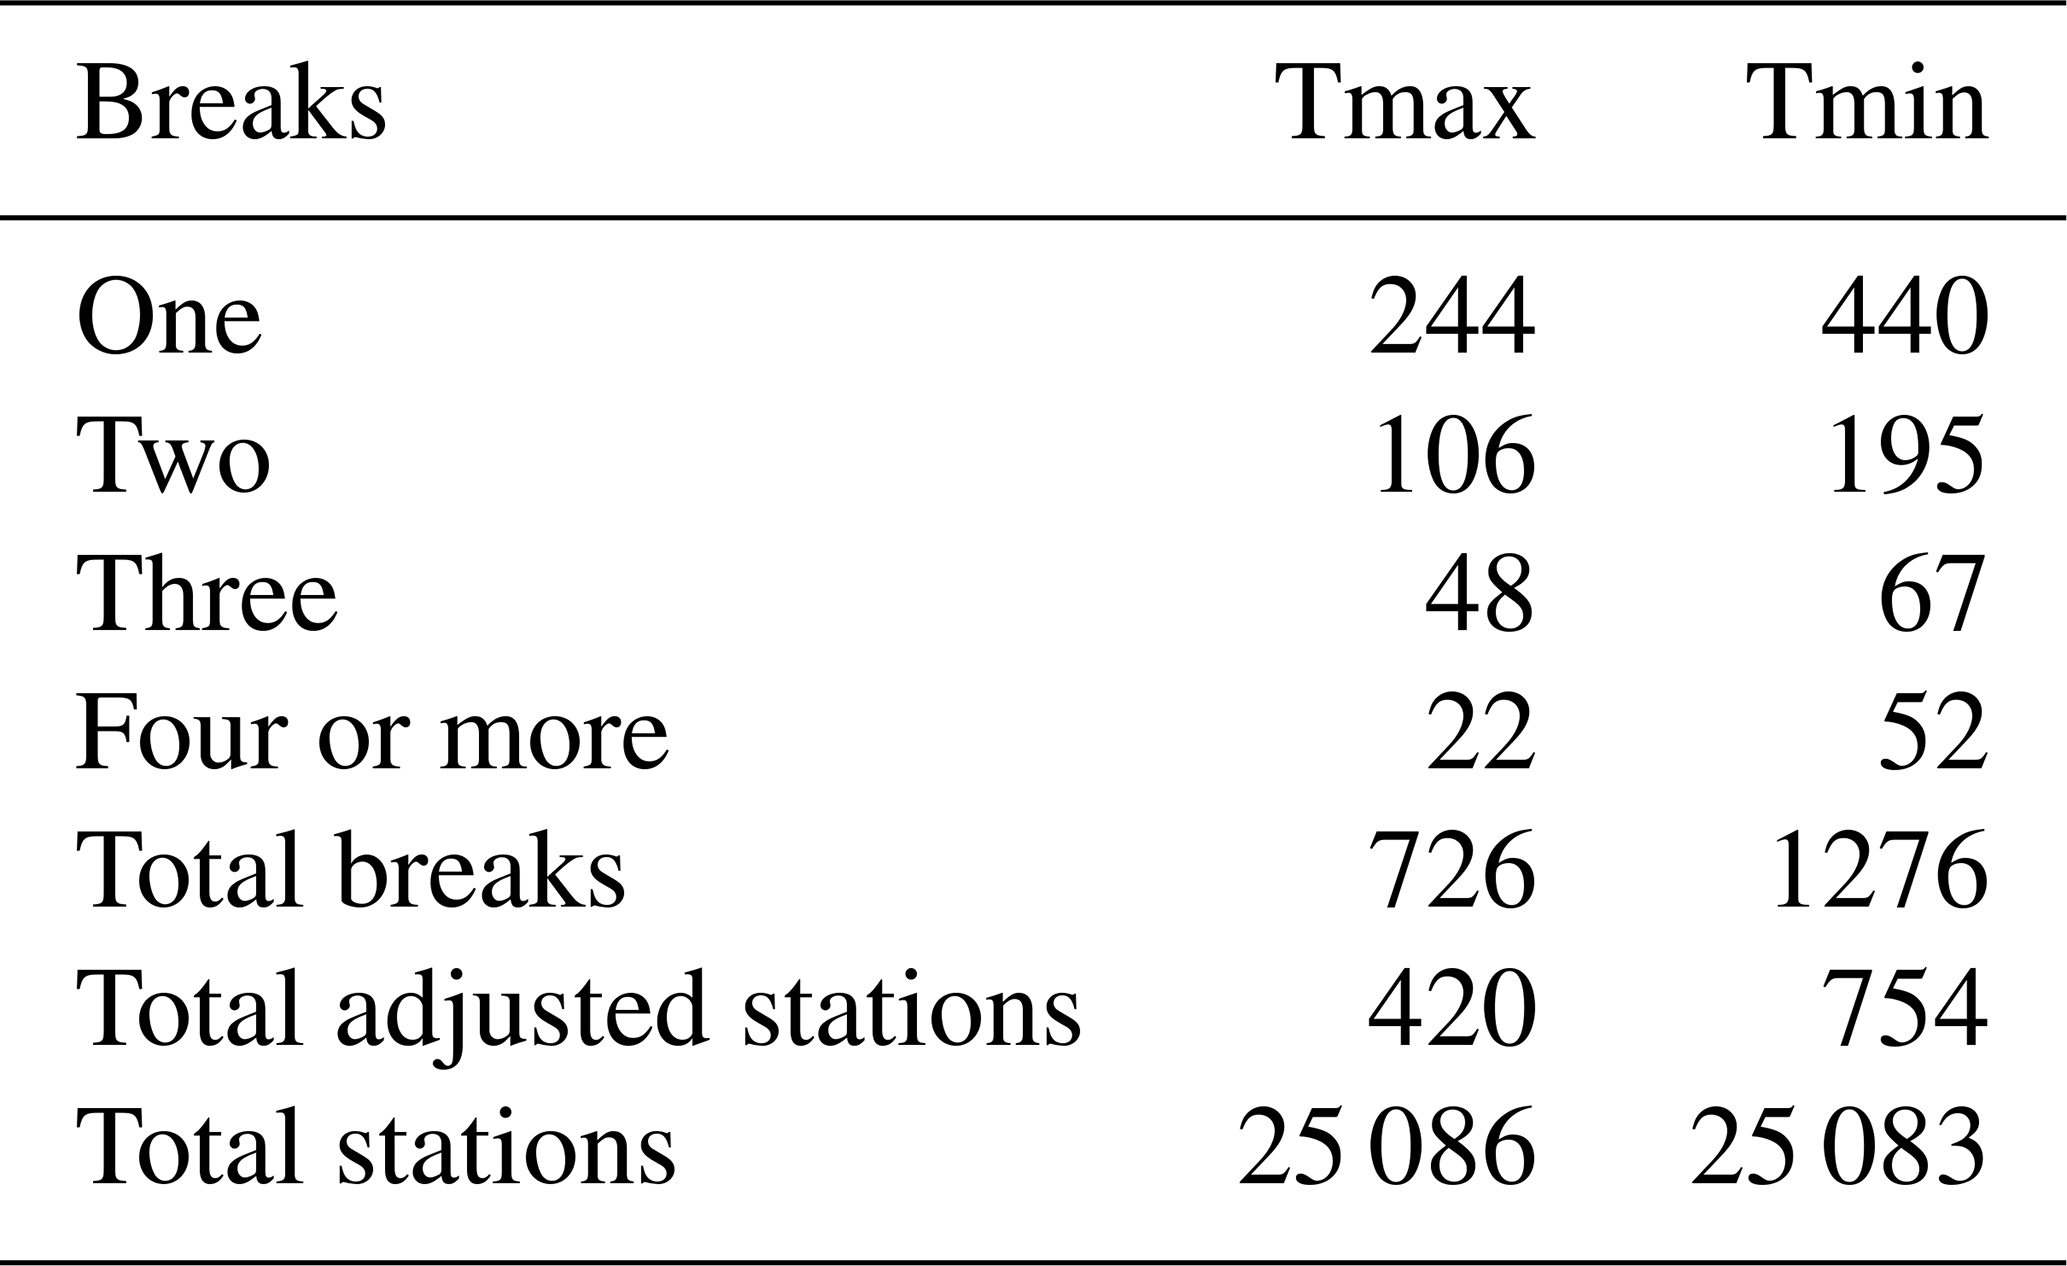
Table 2The number of breakpoints adjusted at each step of homogenization.
2.1.3 Updates to climatology
The Tavg variable contains climatology (1961–1990) in the C-LSAT 2.1 station data including 13 746 stations (Fig. 1). Among these, 11 975 stations calculate Tavg using the average of Tmax and Tmin. The remaining 1771 stations, which lack either Tmax or Tmin, are primarily derived from datasets such as CRUTEM4, HISTALP, and SCAR. Compared to other datasets, the C-LSAT 2.1 station data demonstrate substantial improvements in station coverage in multiple regions, especially in East Asia. Figure 1 illustrates the C-LSAT 2.1 station data updates; compared to version 2.0, the number of stations increased significantly for Tmax, Tmin, and Tavg, particularly after the 1970s. These additional stations substantially expand spatial coverage, thereby enhancing the accuracy of data and reducing uncertainty after gridding. For temporal coverage, the majority of stations provide data for 50–80 years, with a few covering 80–100 years (Table S1 in the Supplement).
2.2 Data pre-processing
2.2.1 Quality control
Data quality control is a crucial step to ensure the accuracy and reliability of datasets. By identifying and eliminating outliers, invalid data, and measurement errors, this process reduces the influence of observational biases, ensuring the consistency and integrity of the data.
First, when updating station data, if a station has a data record exceeding 15 years, its new observations are subjected to quality control. Any anomaly – defined as the difference between the updated data and the prior monthly mean – that exceeds 5 times the standard deviation is classified as an outlier and set to missing.
Table 3Interpolation schemes for climatology field (lat: latitude; long: longitude; ele: elevation).
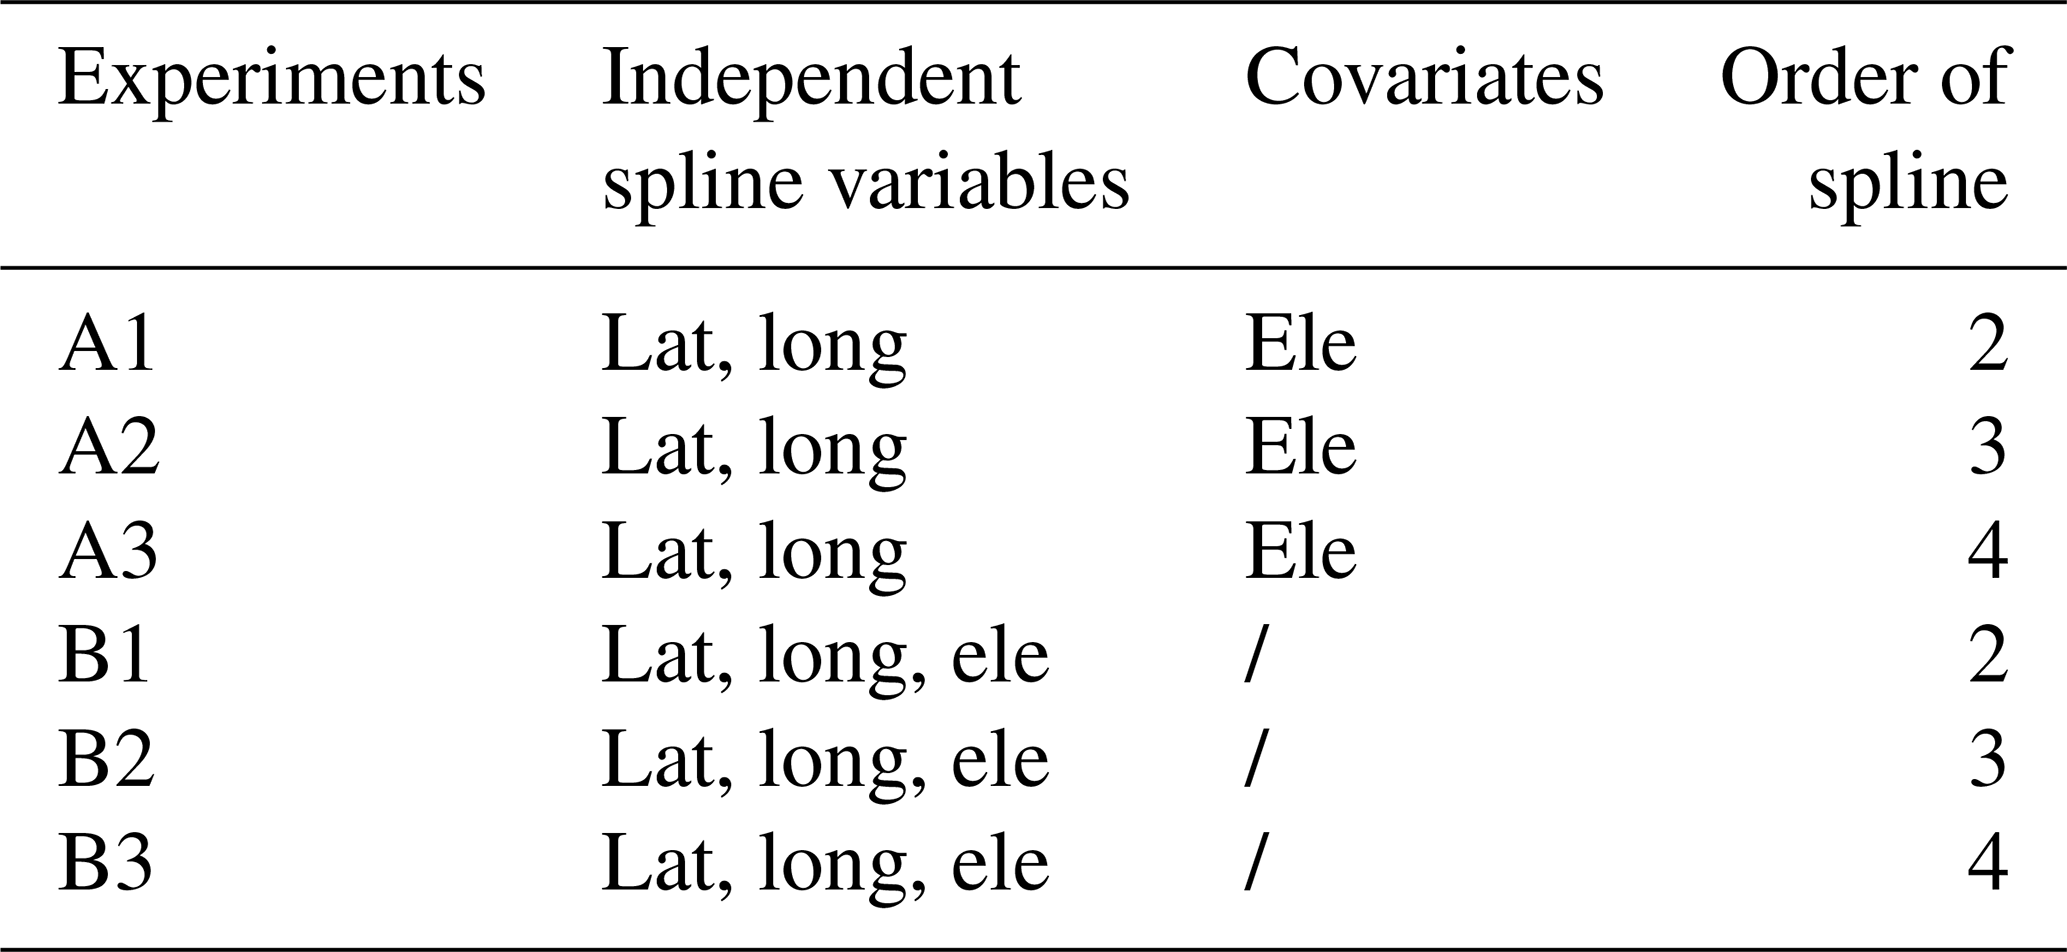
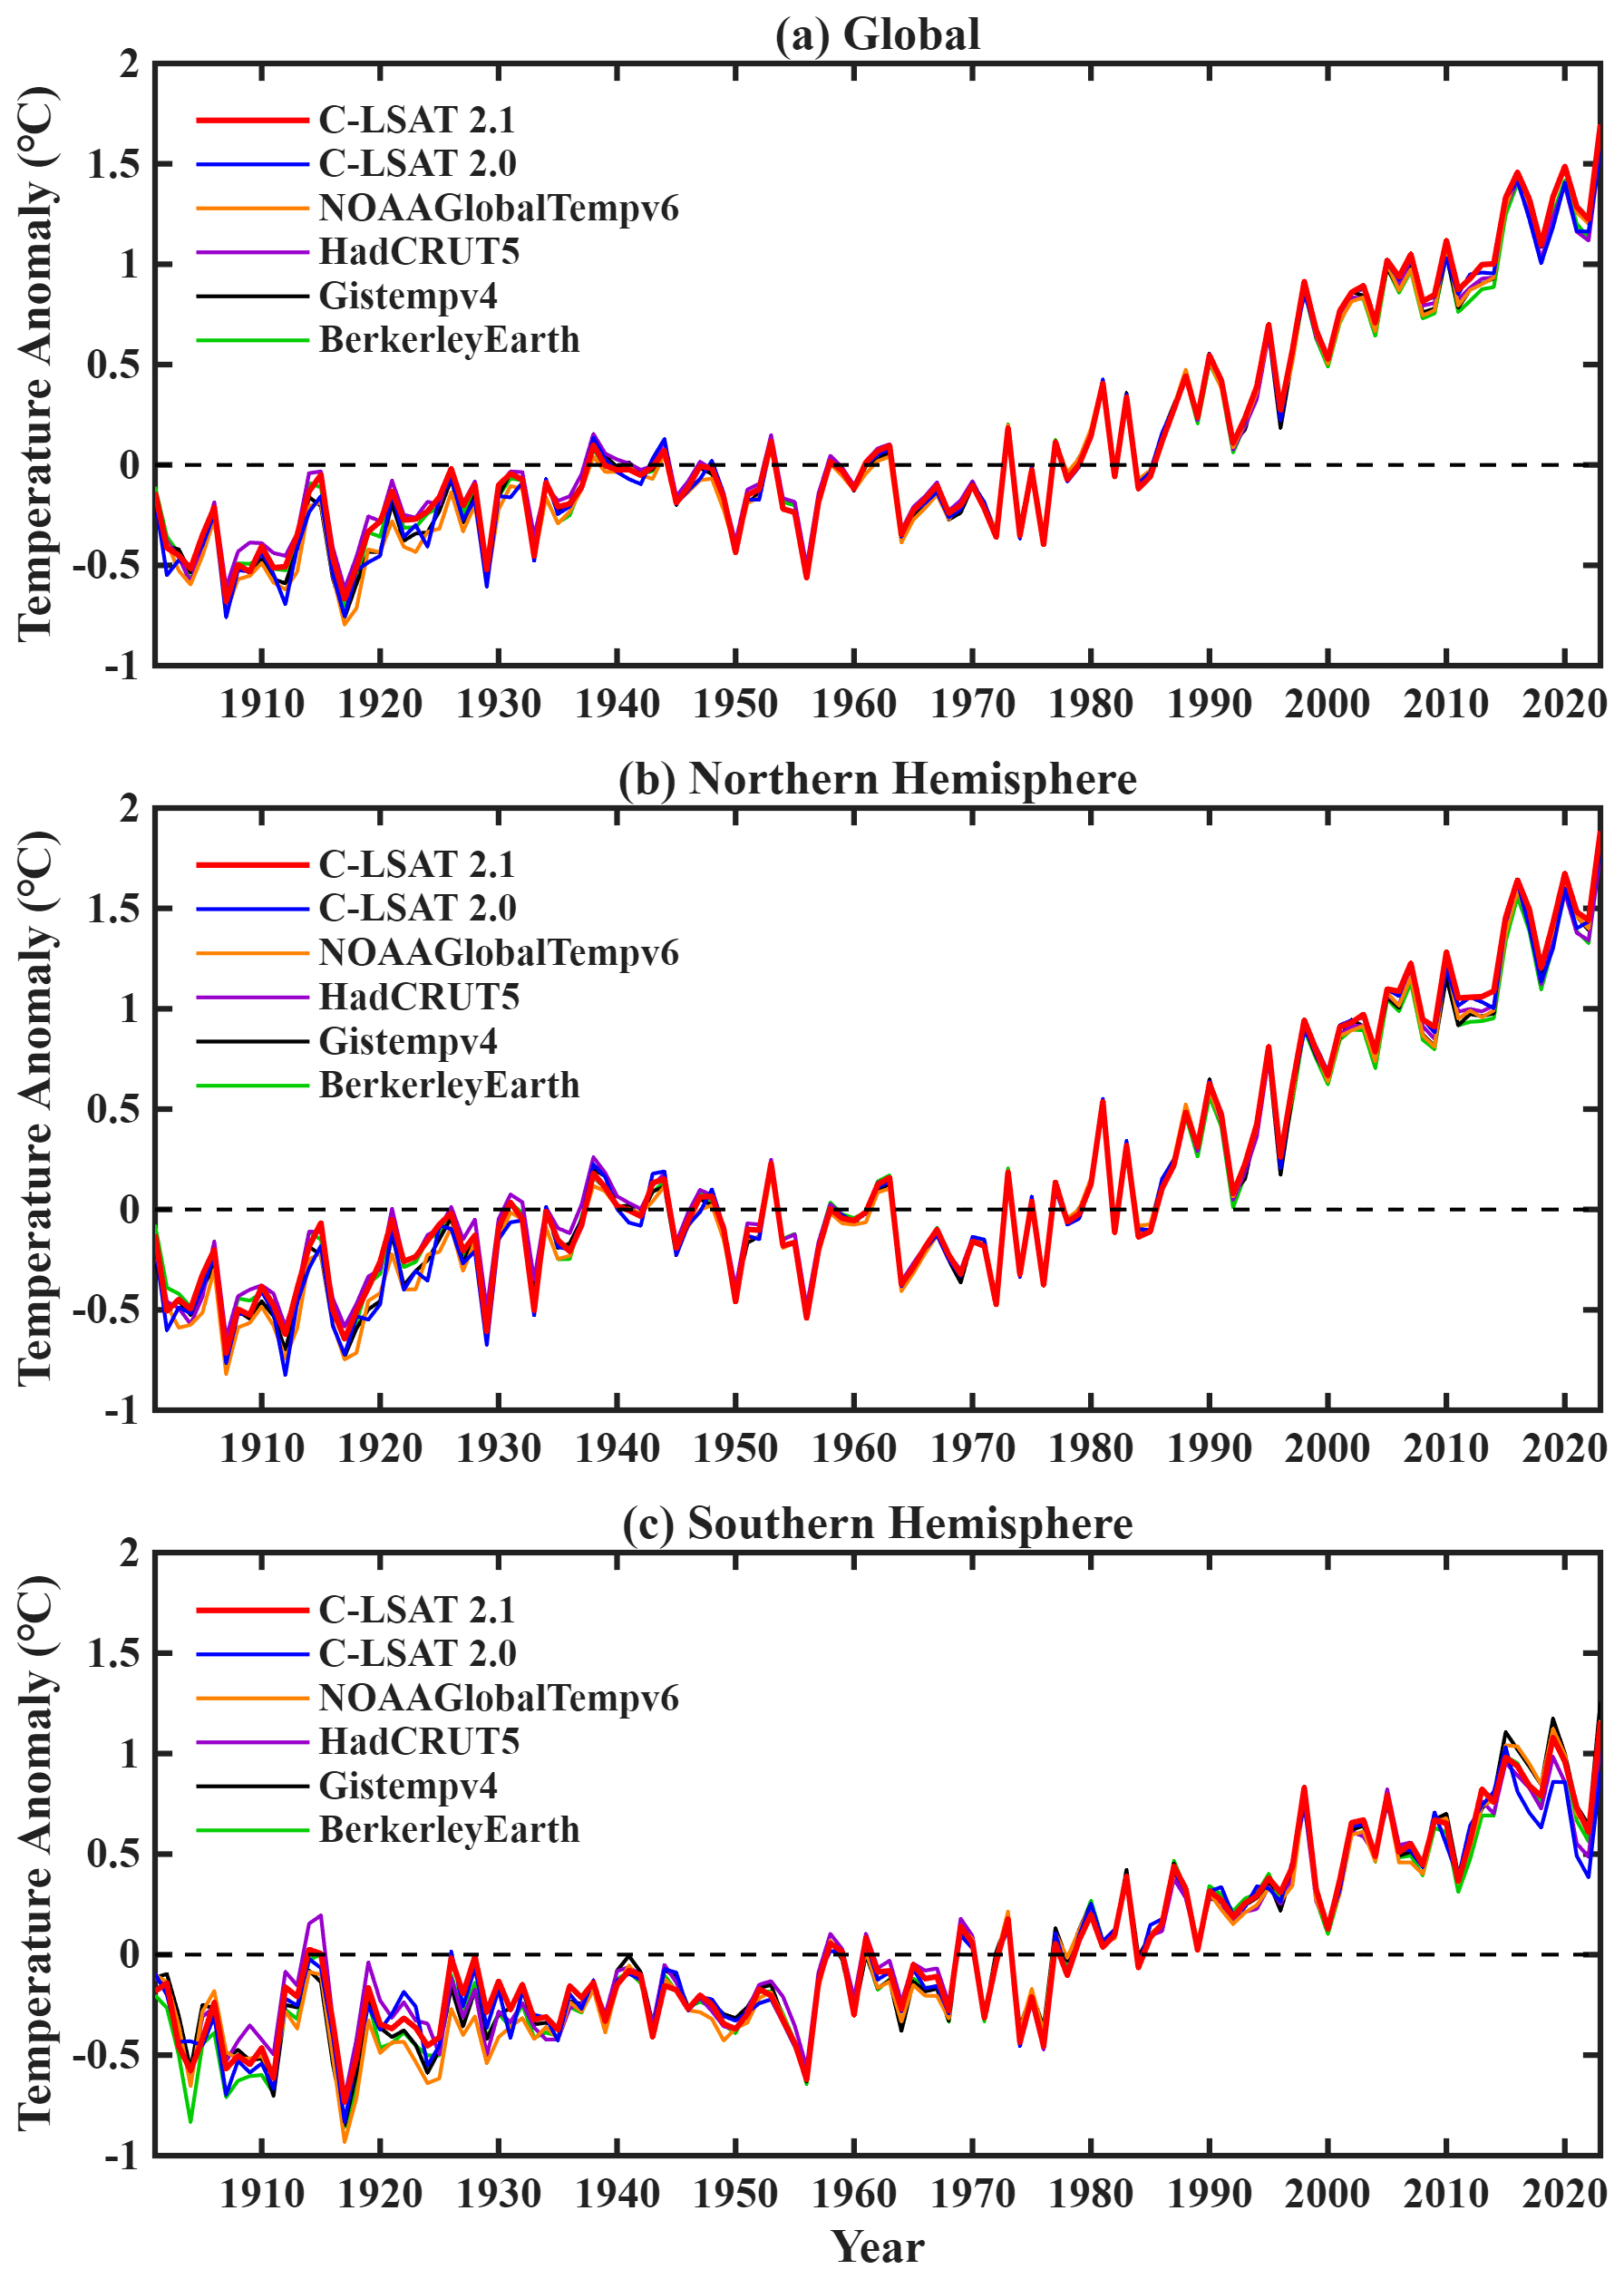
Figure 2The LSAT anomalies for the globe (a), Northern Hemisphere (b), and Southern Hemisphere (c) from 1901 to 2023 for C-LSAT 2.1 and other datasets.
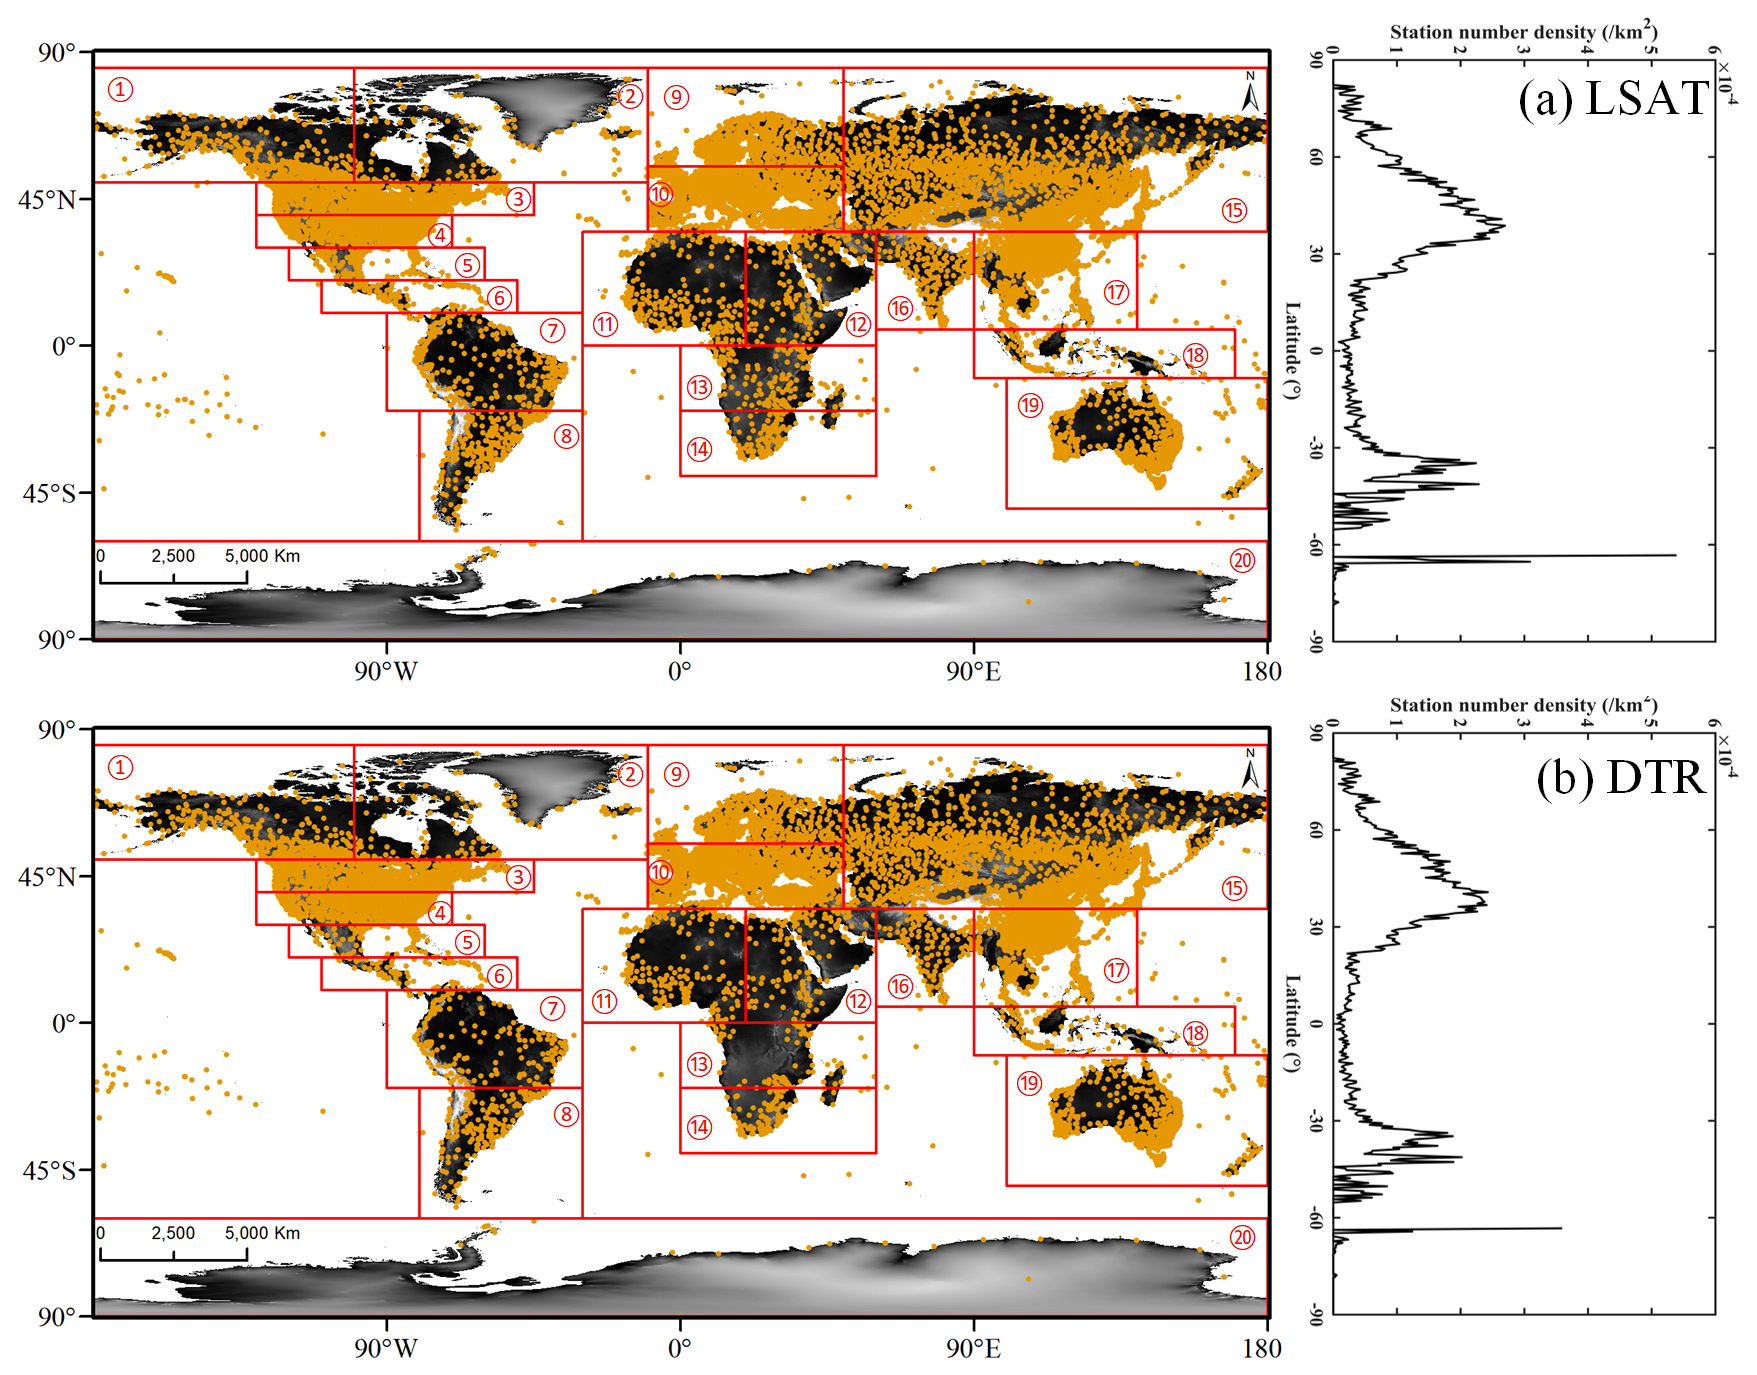
Figure 3Spatial distribution of meteorological observational stations for LSAT (a) and DTR (b), along with the division of the 20 global interpolation regions.
Table 4Performance metrics for climatology interpolation schemes.
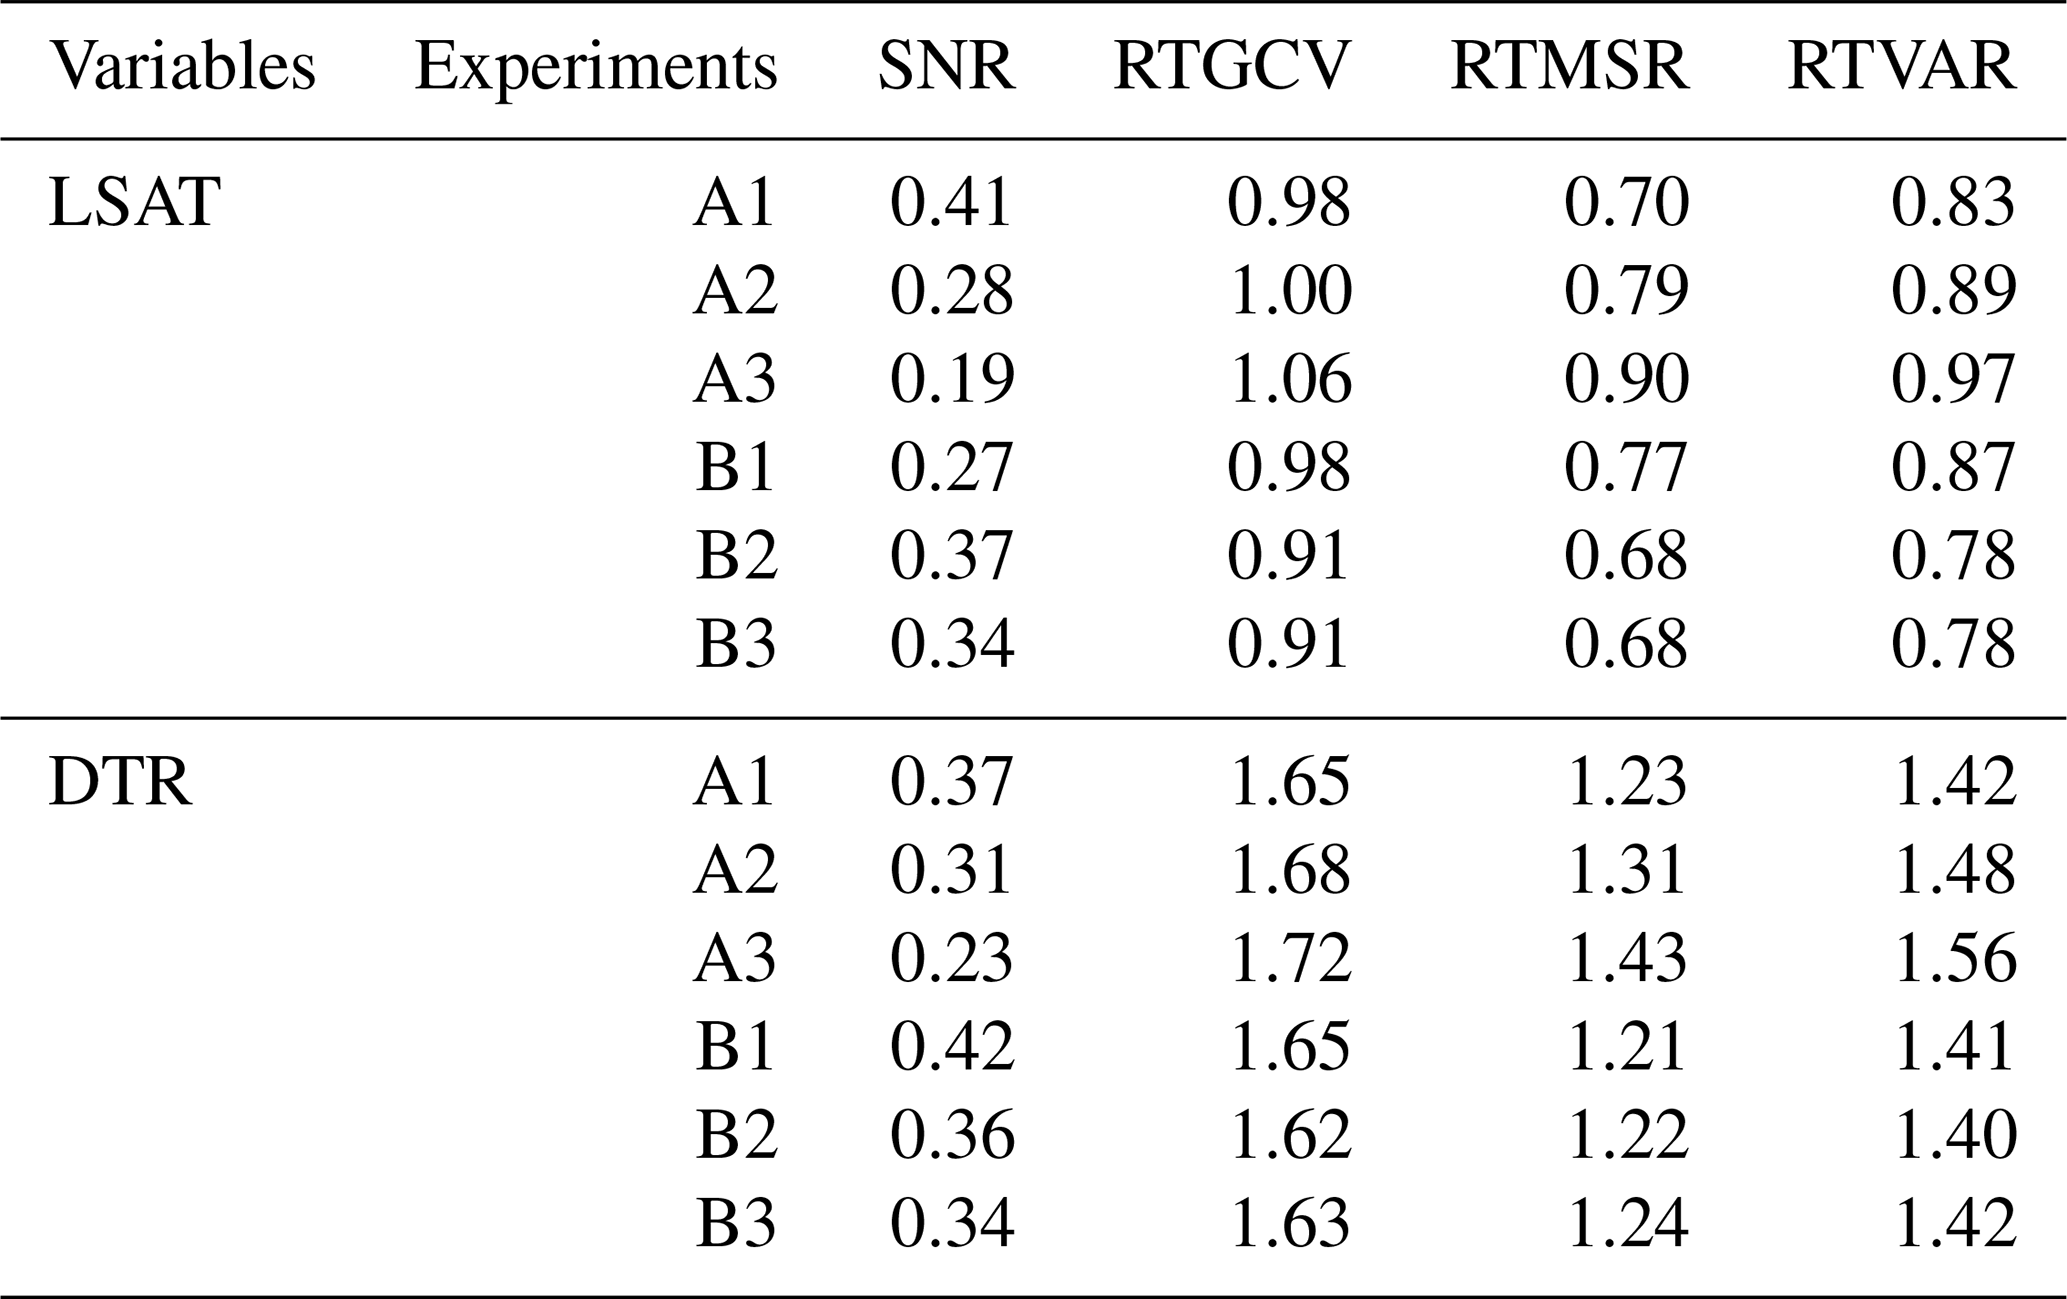
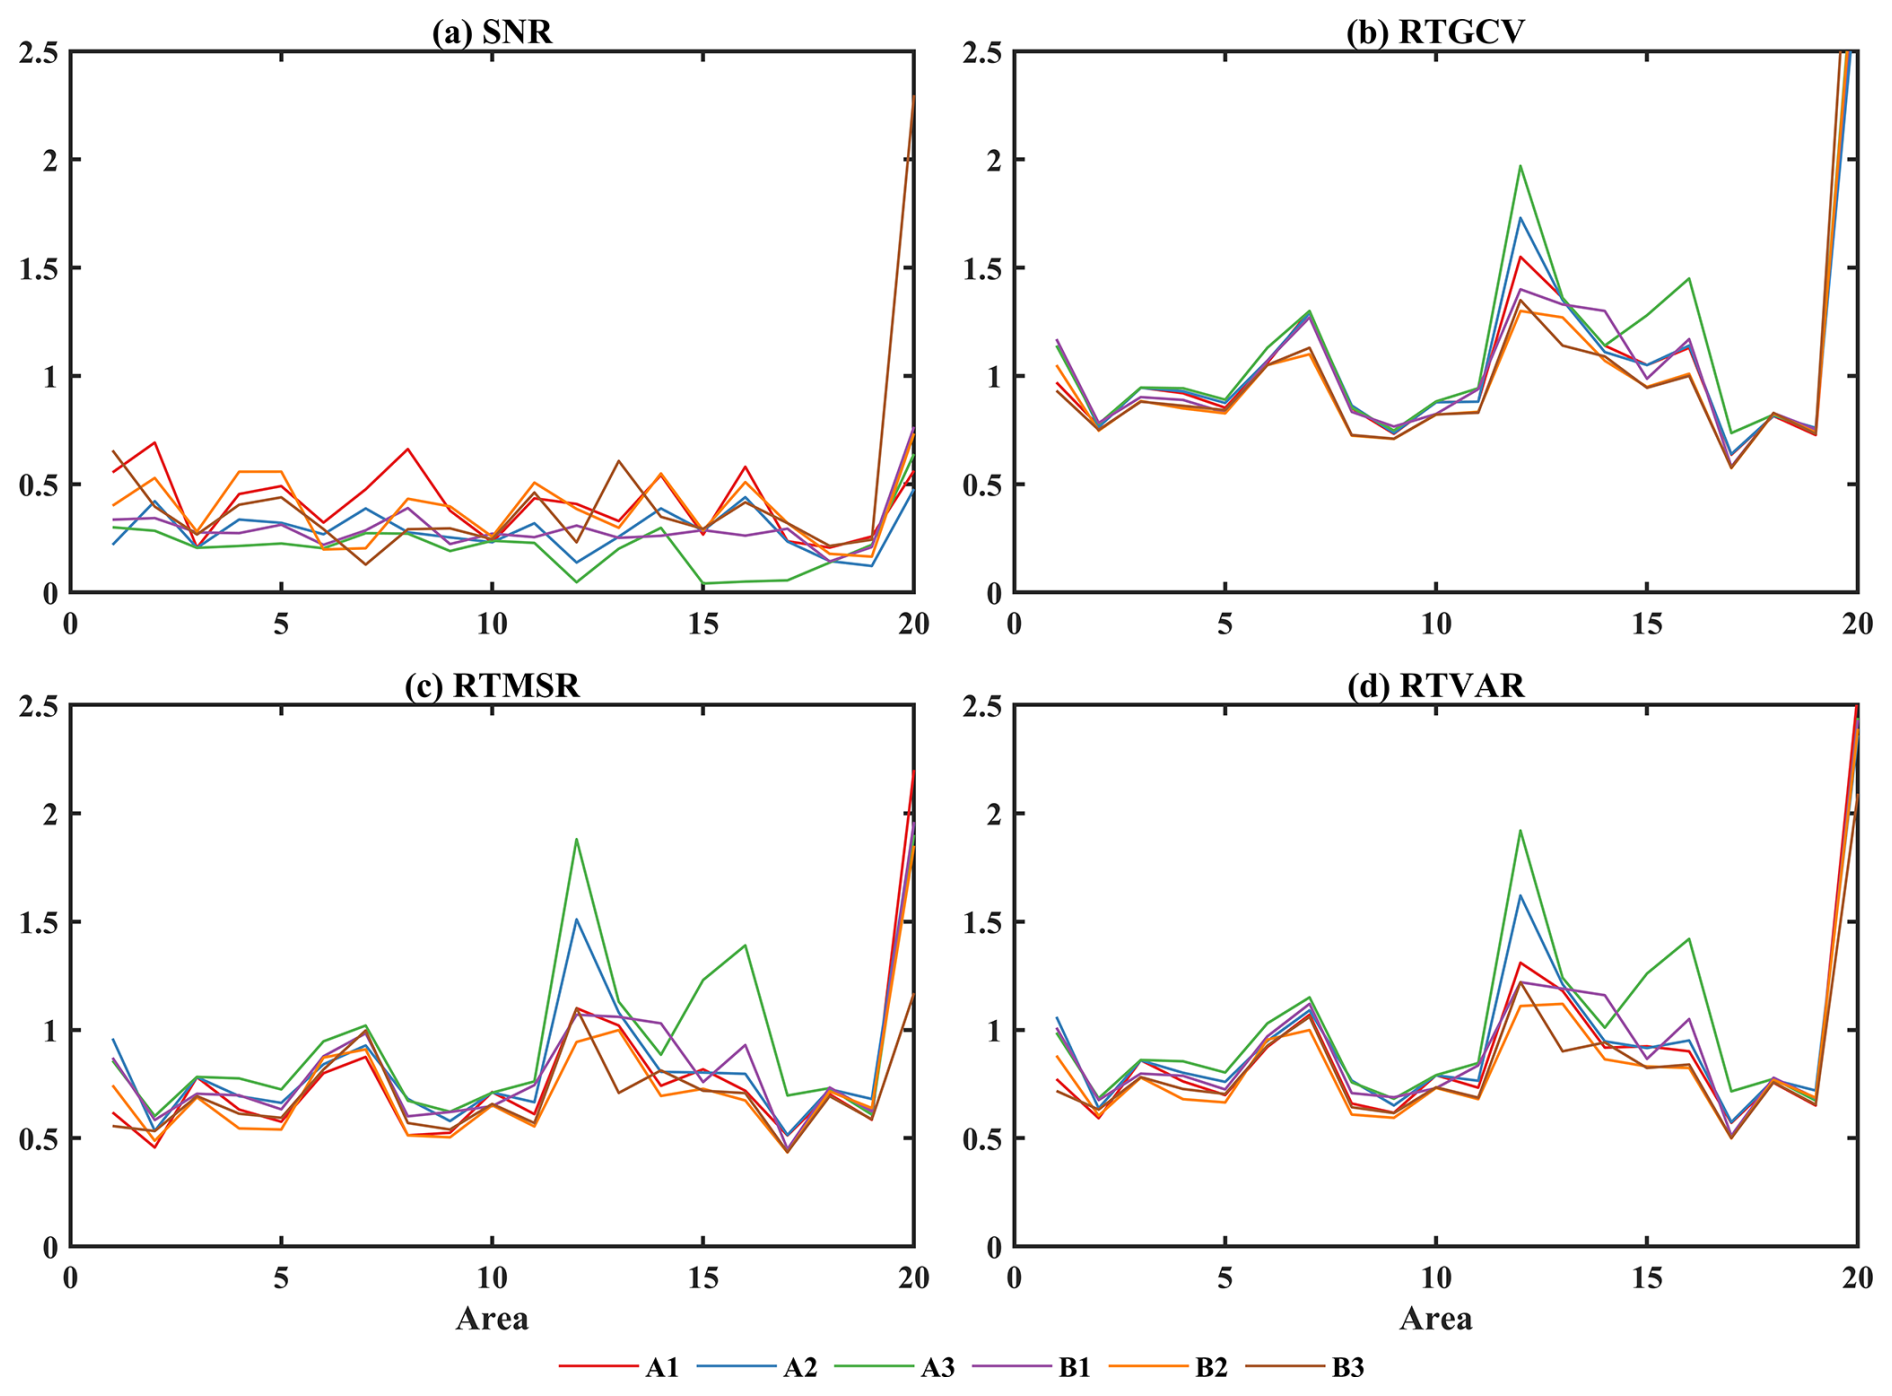
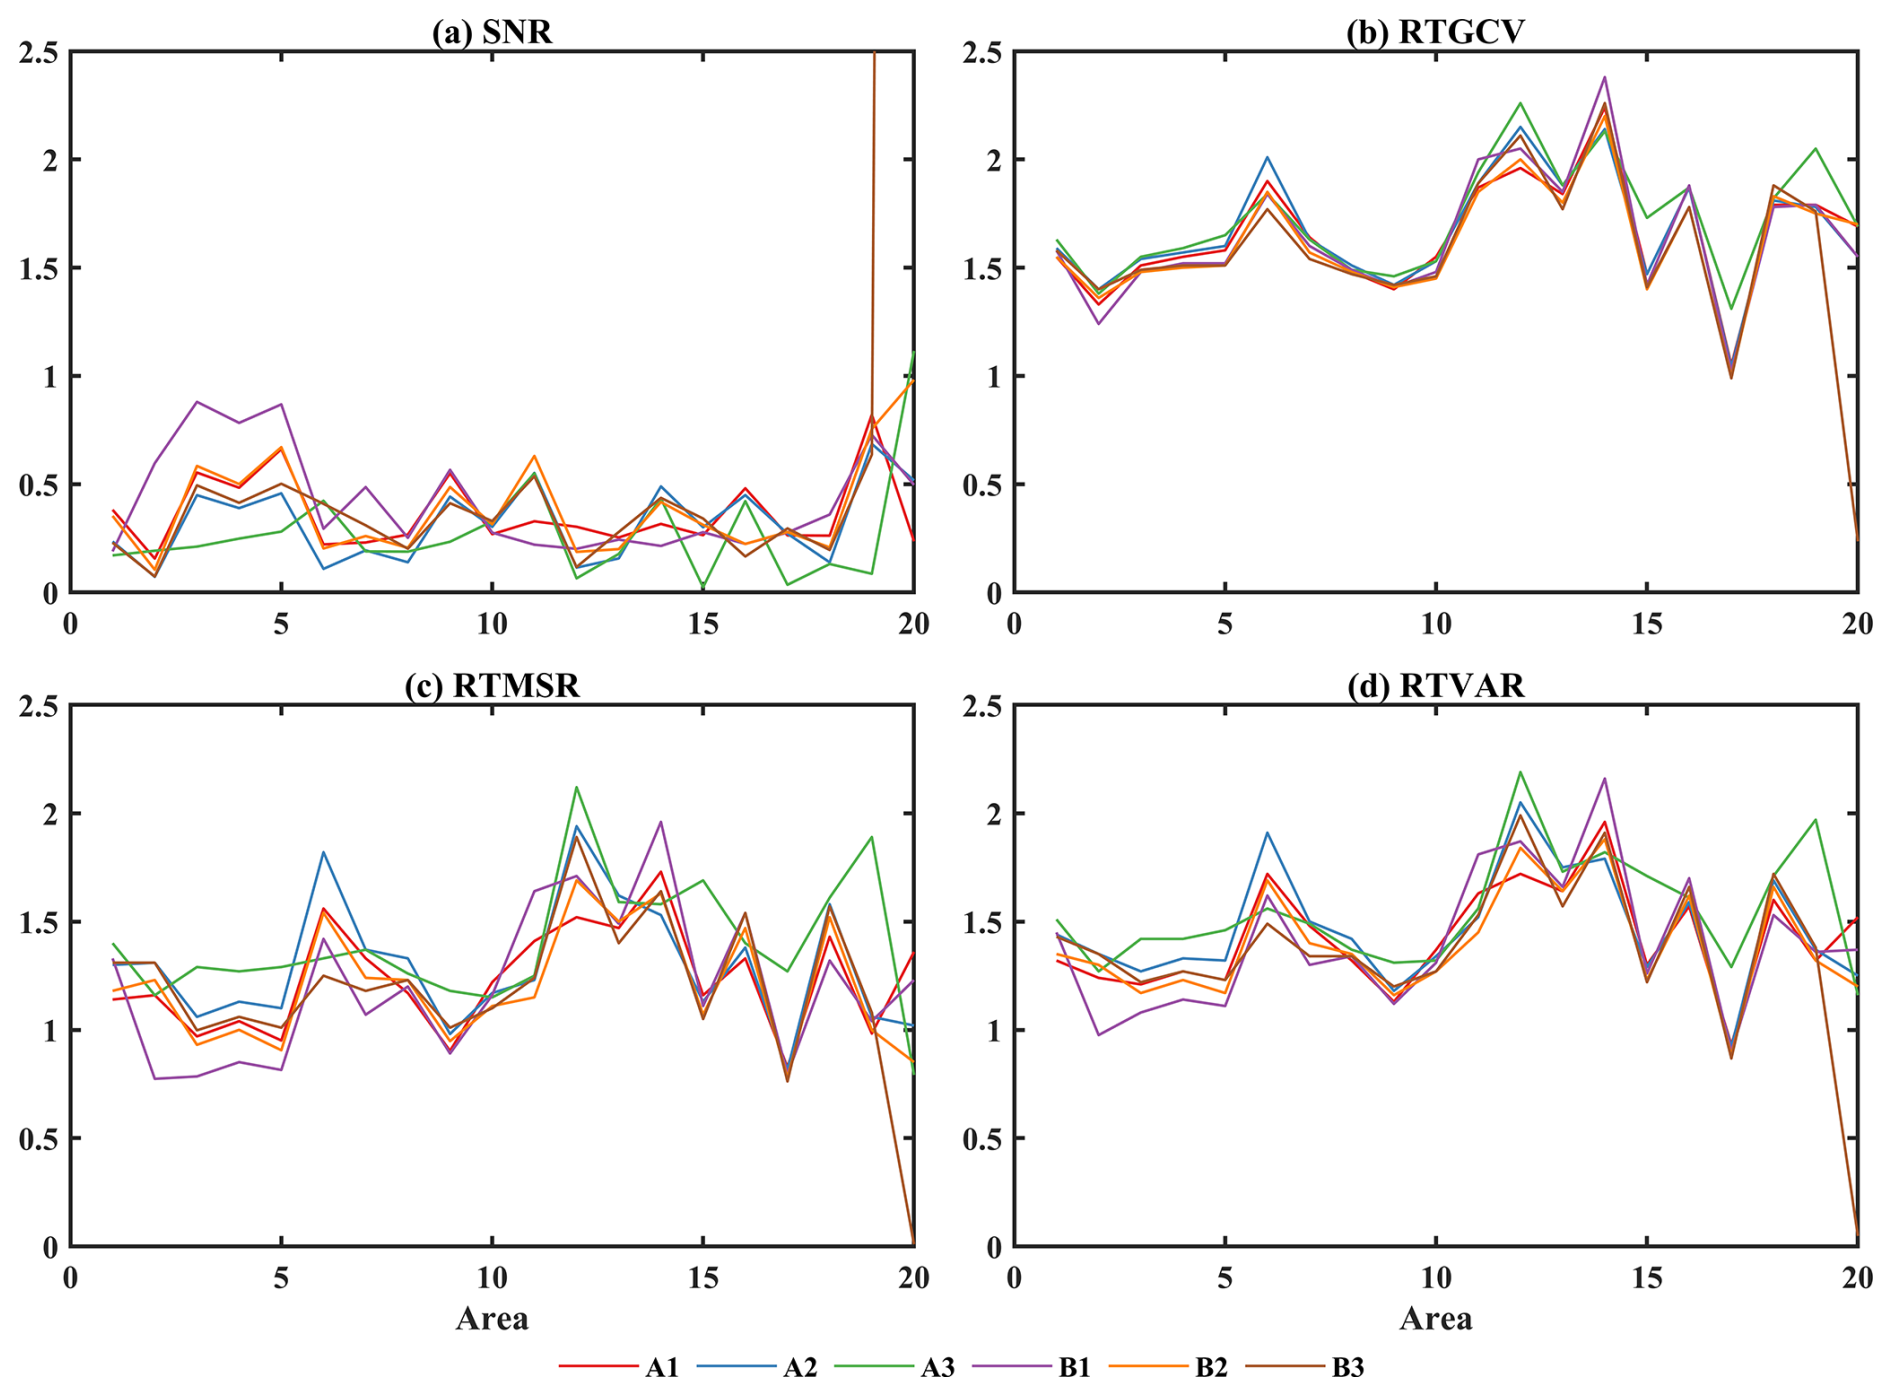
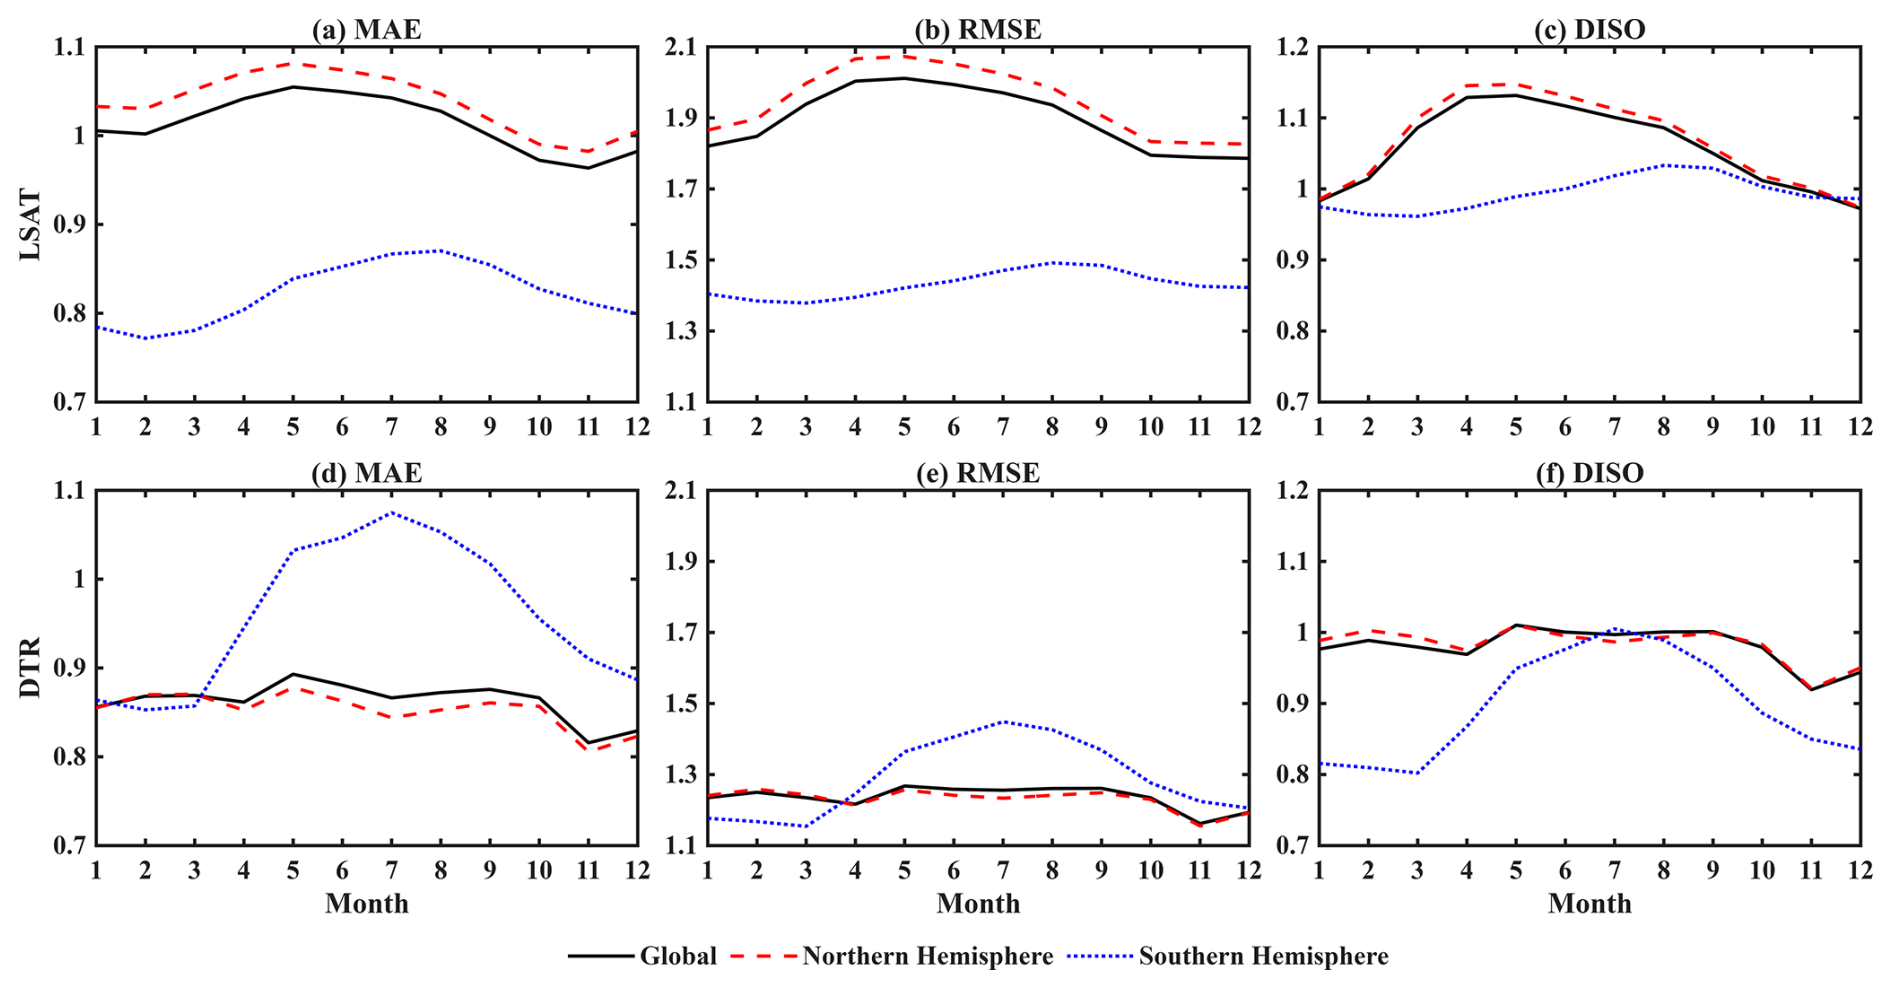
Figure 6MAE, RMSE, and DISO validation results of the climatology fields for C-LSAT HRv1 (a–c) and C-LDTR HRv1 (d–f).
Subsequently, quality control is performed on all station data during gridded-data generation. This study follows the methods proposed by Lawrimore et al. (2011) and Menne et al. (2009) to implement the necessary quality control steps for C-LSAT 2.1 station data. The number of data values excluded during the quality control procedure is shown in Table 1.
-
Climatic outlier check. Stations with monthly records exceeding 10 years were selected, with the period from 1961 to 1990 as the climatology. The monthly climatological mean value was subtracted from the selected stations to calculate anomalies for each station. The standard deviation (SD) for each month during the climatology period was subsequently calculated. Any anomaly exceeding 5 times the SD for the corresponding month was flagged as an outlier and excluded.
-
Spatial consistency check. Based on Eq. (1), the anomaly data were evaluated by examining all stations. For each station i, all stations located within a 500 km radius were identified, up to a maximum of 20 neighbouring stations (n≤20). The mean () and SD of the anomalies for these n+1 stations were calculated. If the absolute value of the difference between the value at station i and exceeded 3 times the SD, this value was classified as an outlier and removed.
-
Internal consistency check. The Tmax, Tmin, and Tavg of station data were assessed. If Tavg was larger than Tmax or if Tavg was smaller than Tmin then these values were identified as outliers and removed.
2.2.2 Homogenization
Data homogenization is crucial for understanding climate change. Although its influence on a global or large scale may be limited, its impacts on local regions are often substantial (Peterson et al., 1998; Ribeiro et al., 2016). Homogenization removes data discontinuities caused by non-climatic factors such as station relocations, instrument changes, and environmental transformations (e.g. urbanization), ensuring that the data accurately reflect signals of climate change (Eccel et al., 2012; Jiao et al., 2023). Homogenized data enhance reliability and reduce error propagation.
The homogenization process of C-LSAT station data follows the work of Xu et al. (2025). Using the method proposed by Peterson and Easterling (1994), a reference series was constructed by selecting three to five neighbouring stations with correlation coefficients greater than 0.8 relative to the target station. Based on the spatial distances of these stations, a reference LSAT series was generated through a weighted average of first-order differences. Subsequently, the RHTest V4 software was used to detect and correct discontinuities in the target series (Wang and Feng 2013). The PMTred algorithm (derived from the penalized maximal t test, PMT) in RHTest V4 served as the primary algorithm to detect discontinuities in the target station's monthly average Tmax and Tmin series at a significance level of 5 %. For any confirmed breakpoints, the differences between the target series and the reference series were uniformly allocated using the mean adjustment (Wang et al., 2008a, b). According to this procedure, 726 breakpoints (in 420 stations) for the 25 086 Tmax stations and 1276 breakpoints (in 754 stations) for the 25 083 Tmin stations of the C-LSAT station data were adjusted. The homogenized Tmax and Tmin data were then combined into the LSAT and DTR datasets (Table 2).
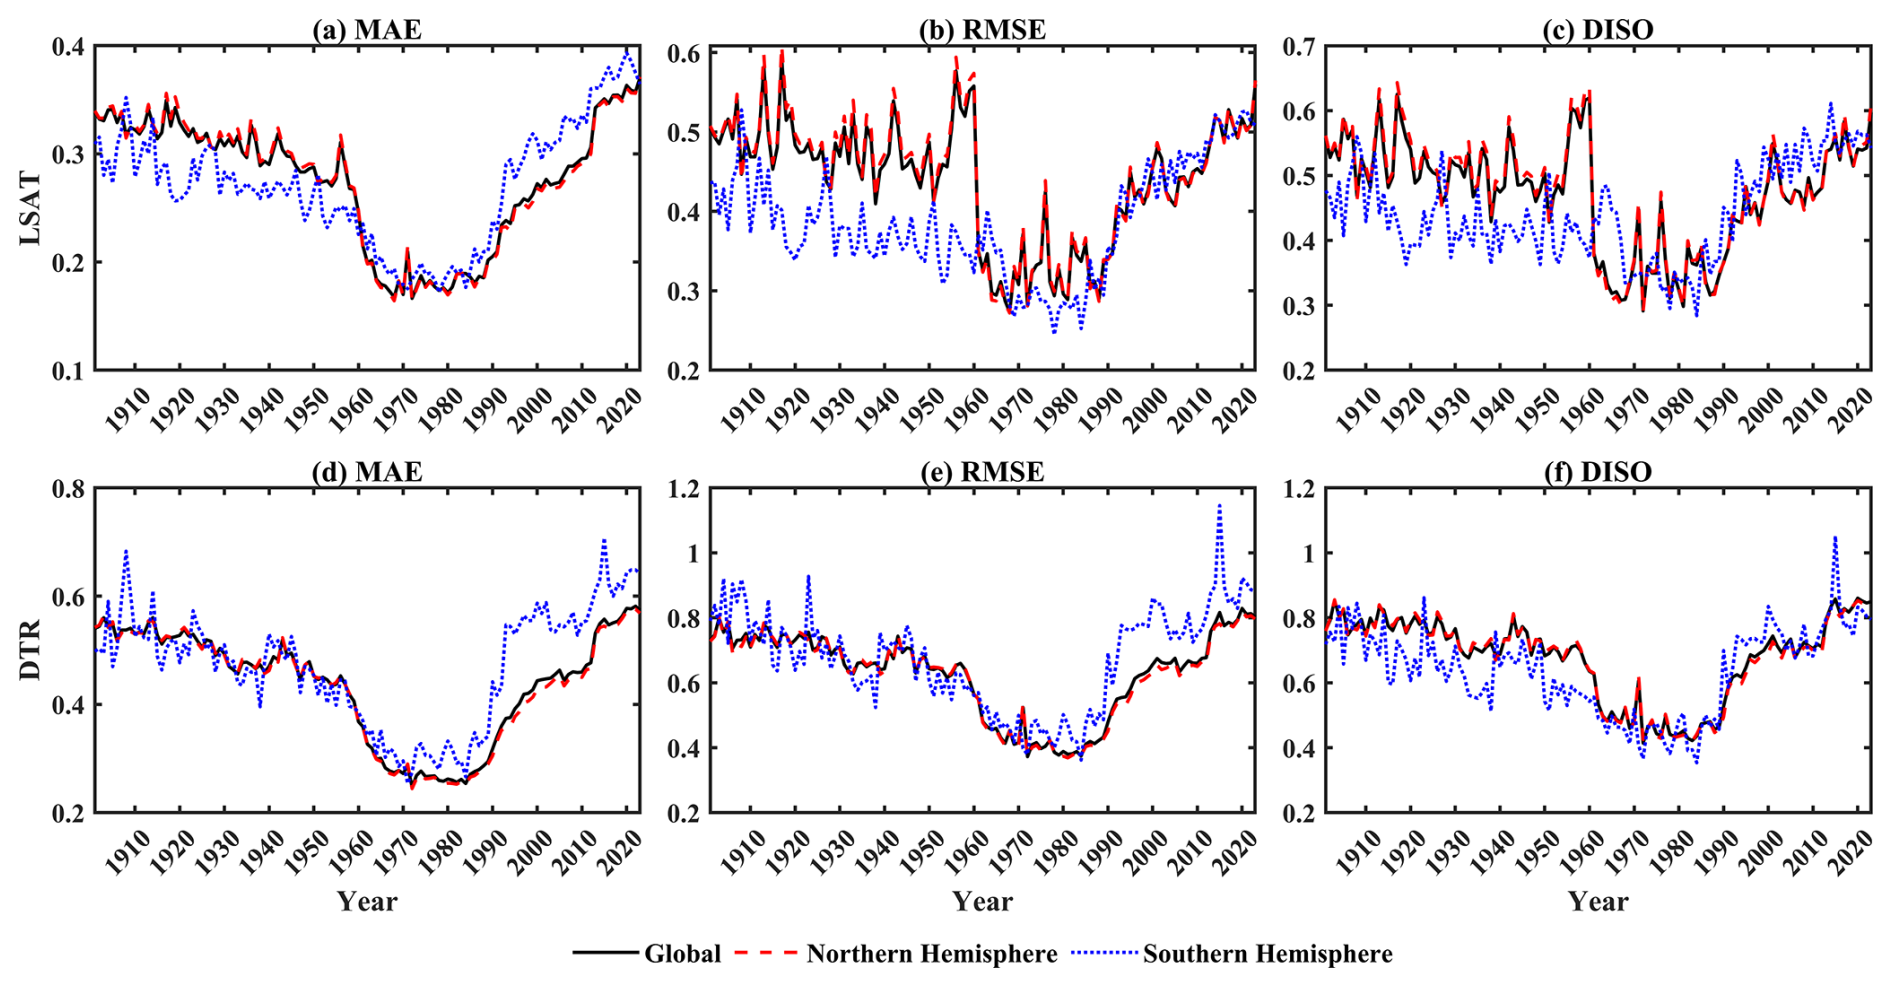
Figure 7MAE, RMSE, and DISO validation results of the anomaly fields for C-LSAT HRv1 (a–c) and C-LDTR HRv1 (d–f).
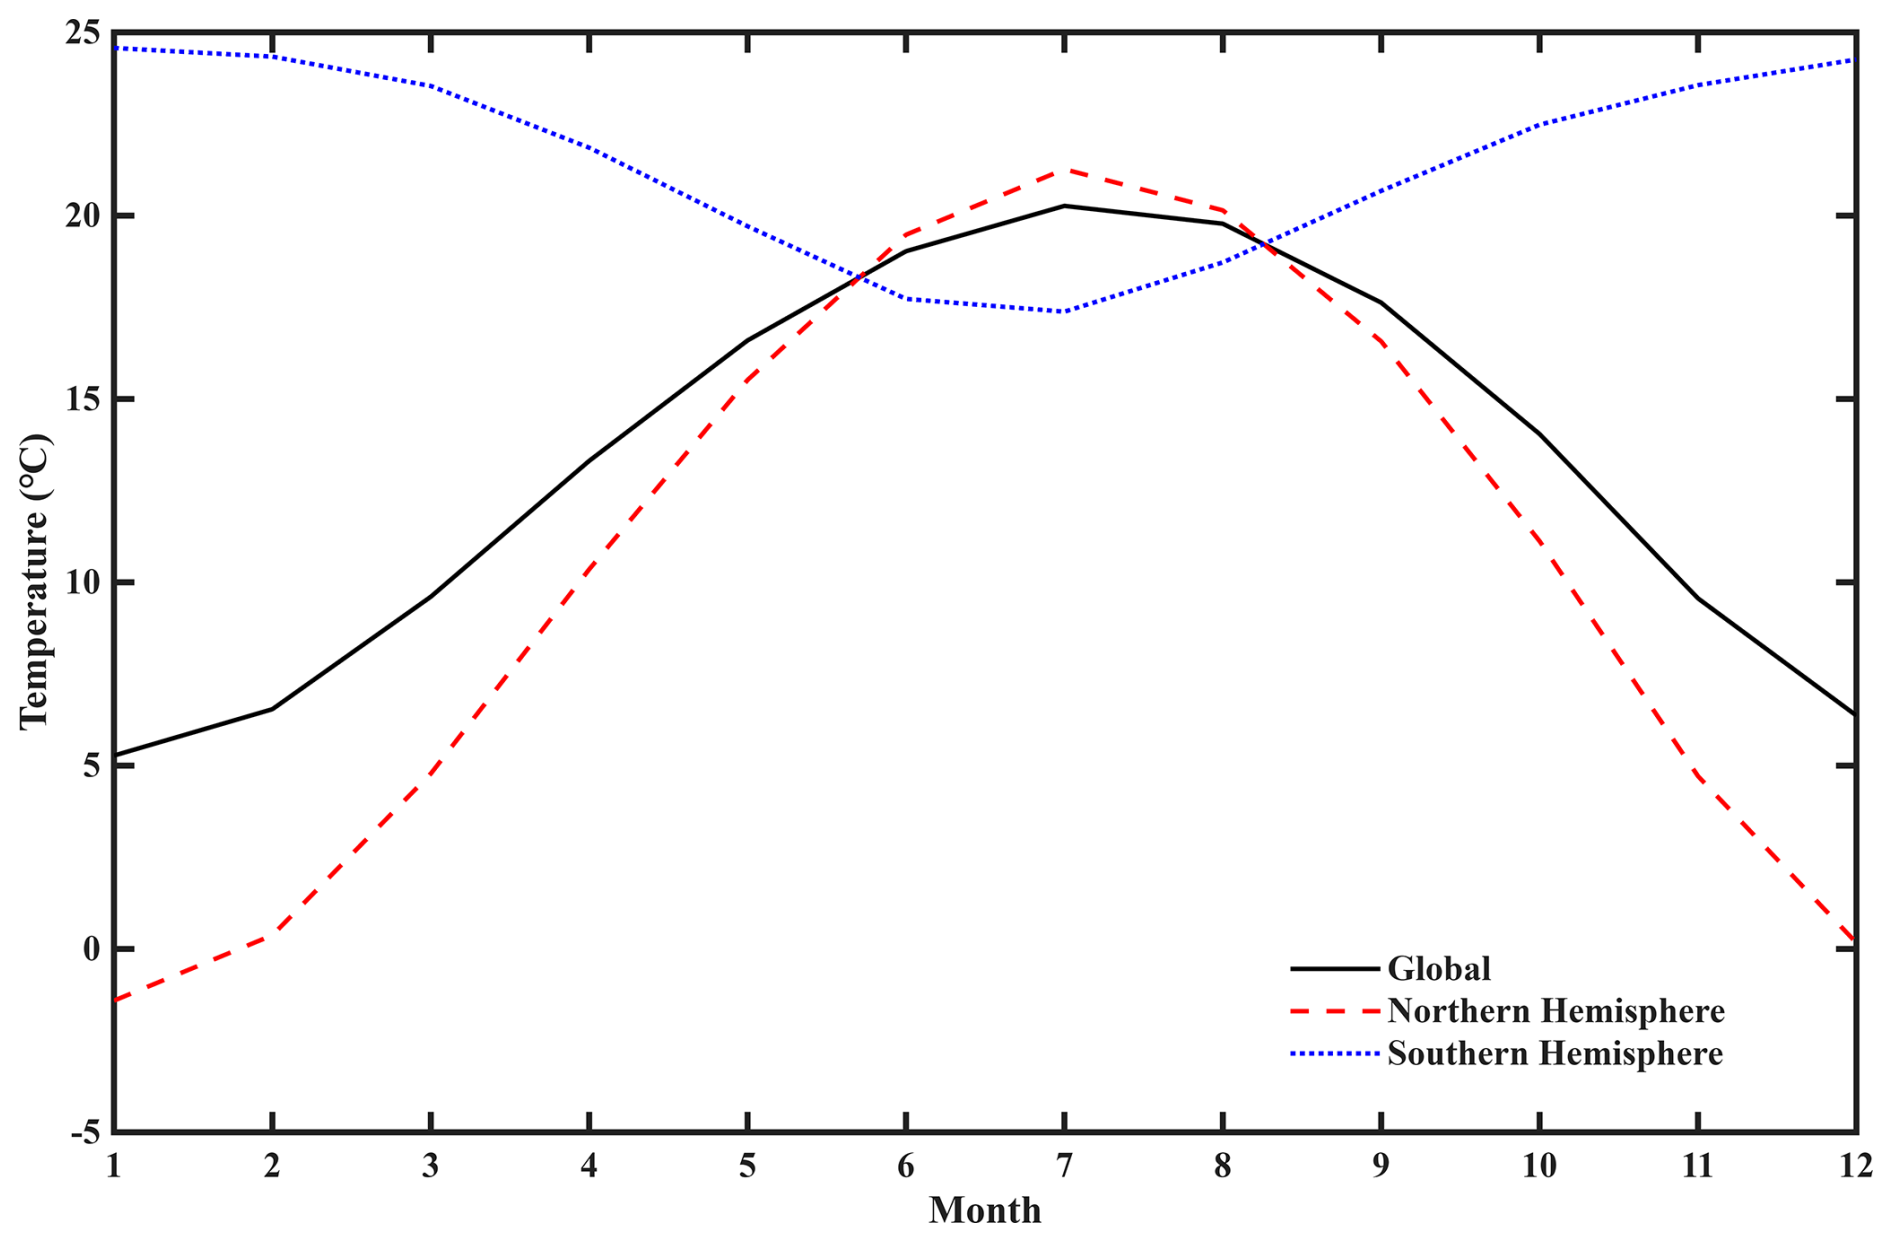
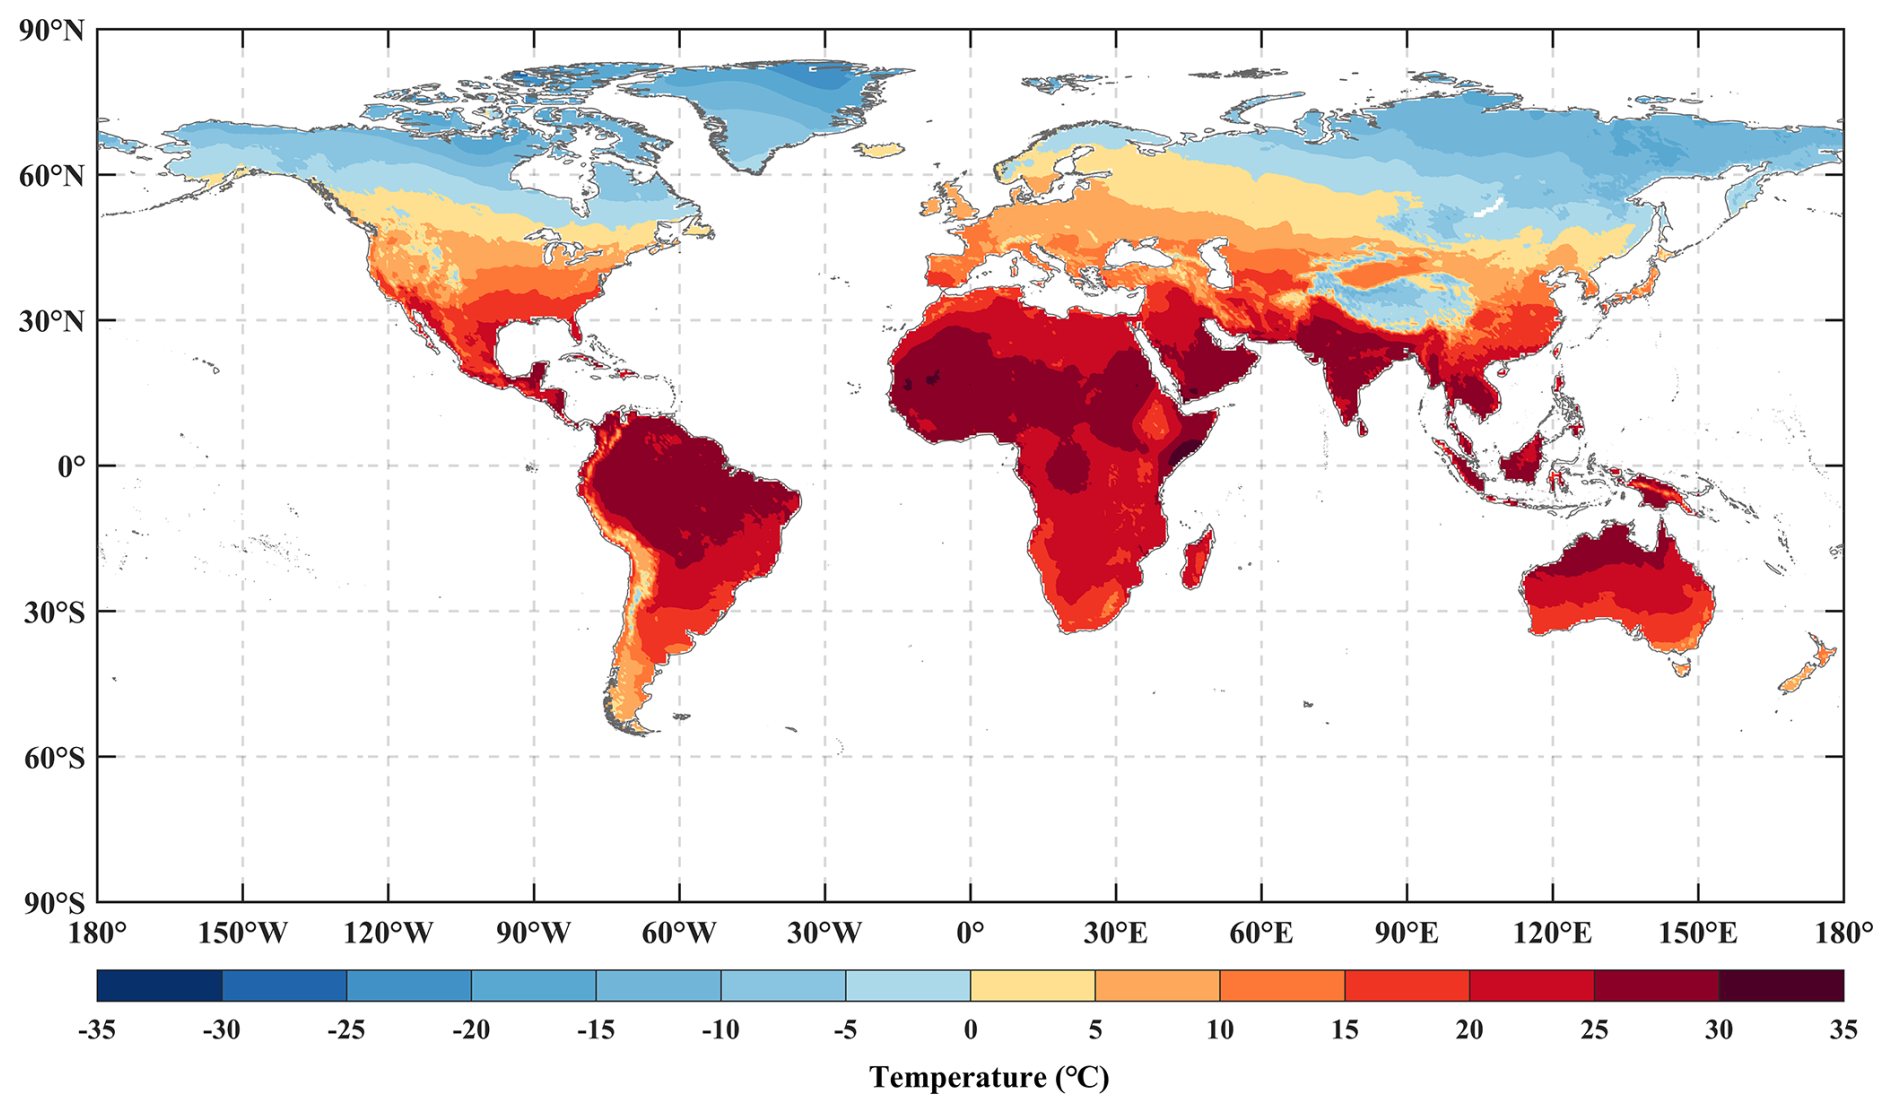
Figure 9Spatial distribution of the LSAT for the C-LSAT HRv1 climatology field.
Based on the C-LSAT 2.1 station data, this study applied the climate anomaly method (CAM) for gridding and reconstructed the gridded data with high- and low-frequency component decomposition and empirical orthogonal telecorrelation (EOT) reconstruction methods (Sun et al., 2021c), enhancing the coverage of early-period grid data. Subsequently, observational constraints were applied to increase the reliability of the data, ultimately resulting in a high-coverage, high-accuracy C-LSAT 2.1 dataset (5°×5°).
Figure 2 shows a comparison of the LSAT anomaly time series among the updated C-LSAT 2.1, C-LSAT 2.0, and other LSAT datasets across global, Northern Hemisphere, and Southern Hemisphere regions. C-LSAT 2.1 shows strong agreement with other LSAT datasets in capturing long-term warming trends, particularly the accelerated warming since the 1970s. The warming rates for C-LSAT 2.0 are 0.133±0.014, 0.145±0.016, and for the globe, Northern Hemisphere, and Southern Hemisphere, respectively, while those for C-LSAT 2.1 are 0.131±0.015, 0.141±0.017, and . The serial correlation of the time series has been taken into account in the calculation of trend uncertainties (Li et al., 2021). In C-LSAT 2.1, the warming rates for the global, Northern Hemisphere, and Southern Hemisphere regions present slight changes in comparison to version 2.0. For the global, Northern Hemisphere, and Southern Hemisphere regions, C-LSAT 2.1 is higher than C-LSAT 2.0 both before 1950 and after 2000 (this is particularly pronounced for the Southern Hemisphere). The increase before 1950 is primarily driven by improved data coverage, while changes in other periods may stem from the eliminating duplication process and updates to new data sources. These results suggest that C-LSAT 2.1 provides a more accurate representation of LSAT trends.
Building upon Cheng et al. (2020), this study also uses the TPS and adjusted inverse distance weighted (AIDW) methods to interpolate the climatology and anomaly fields of the C-LSAT 2.1 station data, ultimately generating the C-LSAT HRv1 and C-LDTR HRv1 datasets with a resolution of 0.5°×0.5°.
4.1 Interpolation and validation of the climatology field
4.1.1 Interpolation and region division
TPS interpolation was used to generate the climatology fields (1961–1990) of LSAT and DTR in this study. This was originally proposed by Wahba (1990) and later optimized and improved by Hutchinson et al. (Hutchinson, 1991, 1995, 1998a, b; Hutchinson and Gessler, 1994), evolving into the partial TPS, which integrates covariate-dependent interpolation, extending the previous method that was limited to calculations based on independent variables. Based on the TPS, Hutchinson (1991) designed and developed the software ANUSPLIN, which enables multivariable data interpolation. This software has been widely adopted for meteorological data interpolation. This study employed ANUSPLIN for climatology field interpolation.
Due to the strong correlation between temperature and elevation, longitude, latitude, and elevation were selected as variables for interpolating LSAT and DTR climatology field. The elevation data used in this study were obtained from the ETOPO2022 published by NOAA (National Oceanic and Atmospheric Administration) (available at https://www.ncei.noaa.gov/products/etopo-global-relief-model, last access: 3 January 2024). This dataset integrates topography, bathymetry, and coastline data from regional and global datasets, providing a comprehensive and high-resolution representation of the Earth's geophysical features (MacFerrin et al., 2025).
Because of the Earth's spherical shape, the TPS cannot provide a globally consistent surface interpolation. Thus, the globe was divided into regions for separate interpolation. This study refers to the global partitioning scheme from the CRU (New et al., 1999) and WorldClim2 (Fick and Hijmans, 2017) datasets, dividing the globe into 20 regions for interpolation. The spatial distribution is shown in Fig. 3. In terms of station density, the highest density is observed around 40° N and 40° S, while the lowest density occurs at the poles and the Equator. After interpolating the data for each region, the data from the 20 regions are merged into the global dataset. A known limitation of ANUSPLIN interpolation is the occurrence of larger errors near regional boundaries. To address this, when interpolating the 20 regions, the boundaries of each region are extended (by 5° latitudinally and 10° longitudinally). After interpolation, the extended areas are clipped, and then merged into the global dataset. This approach helps minimize boundary-related errors of the dataset.
4.1.2 Validation of the climatology field
Longitude and latitude are typically used as independent variables for meteorological interpolation. However, whether elevation should be treated as an independent variable or a covariate demands careful evaluation. There are three main indicators for evaluating the interpolation accuracy of the climatology field: the square root of generalized cross-validation (RTGCV), the mean square residual (RTMSR), and the data error variance estimate (RTVAR). The RTGCV quantifies the overall error of data fitting during the cross-validation process, measuring the model's generalization capability. The RTMSR reflects how well the model fits the input data, and the RTVAR evaluates the uncertainty in the data. Another indicator, the signal-to-noise ratio (SNR), is typically used to indicate the complexity of the fitted surface. It represents the ratio between the signal and the error value in the ANUSPLIN software output file. This value generally needs to be less than 1 to indicate that the chosen interpolation experiment is feasible.
Parameter schemes (Table 3) and their corresponding results (Table 4, Figs. 4 and 5) are presented below. Overall, DTR interpolation errors exceed those for LSAT, and interpolation errors (not included in Table 4) increase markedly at spline order 4 compared to orders 2 and 3. As a result, all order-4 experiments (A3 and B3) are excluded. For the Antarctic (region 20), the four error metrics of LSAT demonstrated substantial increases, indicating high uncertainty in this area. This is attributed to the notably low and uneven station distributed for the Antarctic. Considering the increased error mentioned before, both LSAT and DTR for the Antarctic are excluded from this study. Thus, the subsequent contents of this study exclude the Antarctic (region 20). After excluding region 20, the SNR, RTGCV, RTMSR, and RTVAR are compared across the remaining 19 regions. For LSAT, experiment B2 demonstrates optimal performance; however, with respect to the DTR, although experiment B2 achieves the highest overall effectiveness, it produces negative values in some regions and is therefore excluded, leading to the adoption of experiment B1 (Table 4).
Based on the cross-validation results, the mean absolute error (MAE), the root mean squared error (RMSE), and the distance between indices of simulation and observation (DISO) are computed for C-LSAT HRv1 and C-LDTR HRv1 climatology field evaluation (Fig. 6). DISO is a comprehensive performance evaluation index that combines the correlation coefficient (r), absolute error (AE), and RMSE, and the closer its value is to 0, the better the agreement between the simulation and observation (Hu et al., 2019, 2022; Zhou et al., 2021). For C-LSAT HRv1, the MAE, RMSE, and DISO for the Southern Hemisphere fall below the global means, whereas Northern Hemisphere values exceed the global means. In contrast, the C-LDTR HRv1 MAE and RMSE are higher for the Southern Hemisphere than globally. However, the comprehensive index DISO confirms that the Southern Hemisphere's overall performance still surpasses that of both the Northern Hemisphere and the global average. For high-altitude and complex terrain regions, the Tibetan Plateau is selected for validation. The results indicate that all LSAT indices in this region surpass their global and hemispheric levels, whereas DTR performance remains consistent (Fig. S1 in the Supplement). This discrepancy can be attributed to a combination of factors, including a limited observational network, significant topographic variations, land use, and so on. To improve data reliability, future work should refine spatial resolution and optimize variable selection.
4.2 Interpolation and validation of the anomaly field
In this study, AIDW (Cheng et al., 2020) was employed for spatial interpolation of the monthly anomalies from 1901 to 2023.
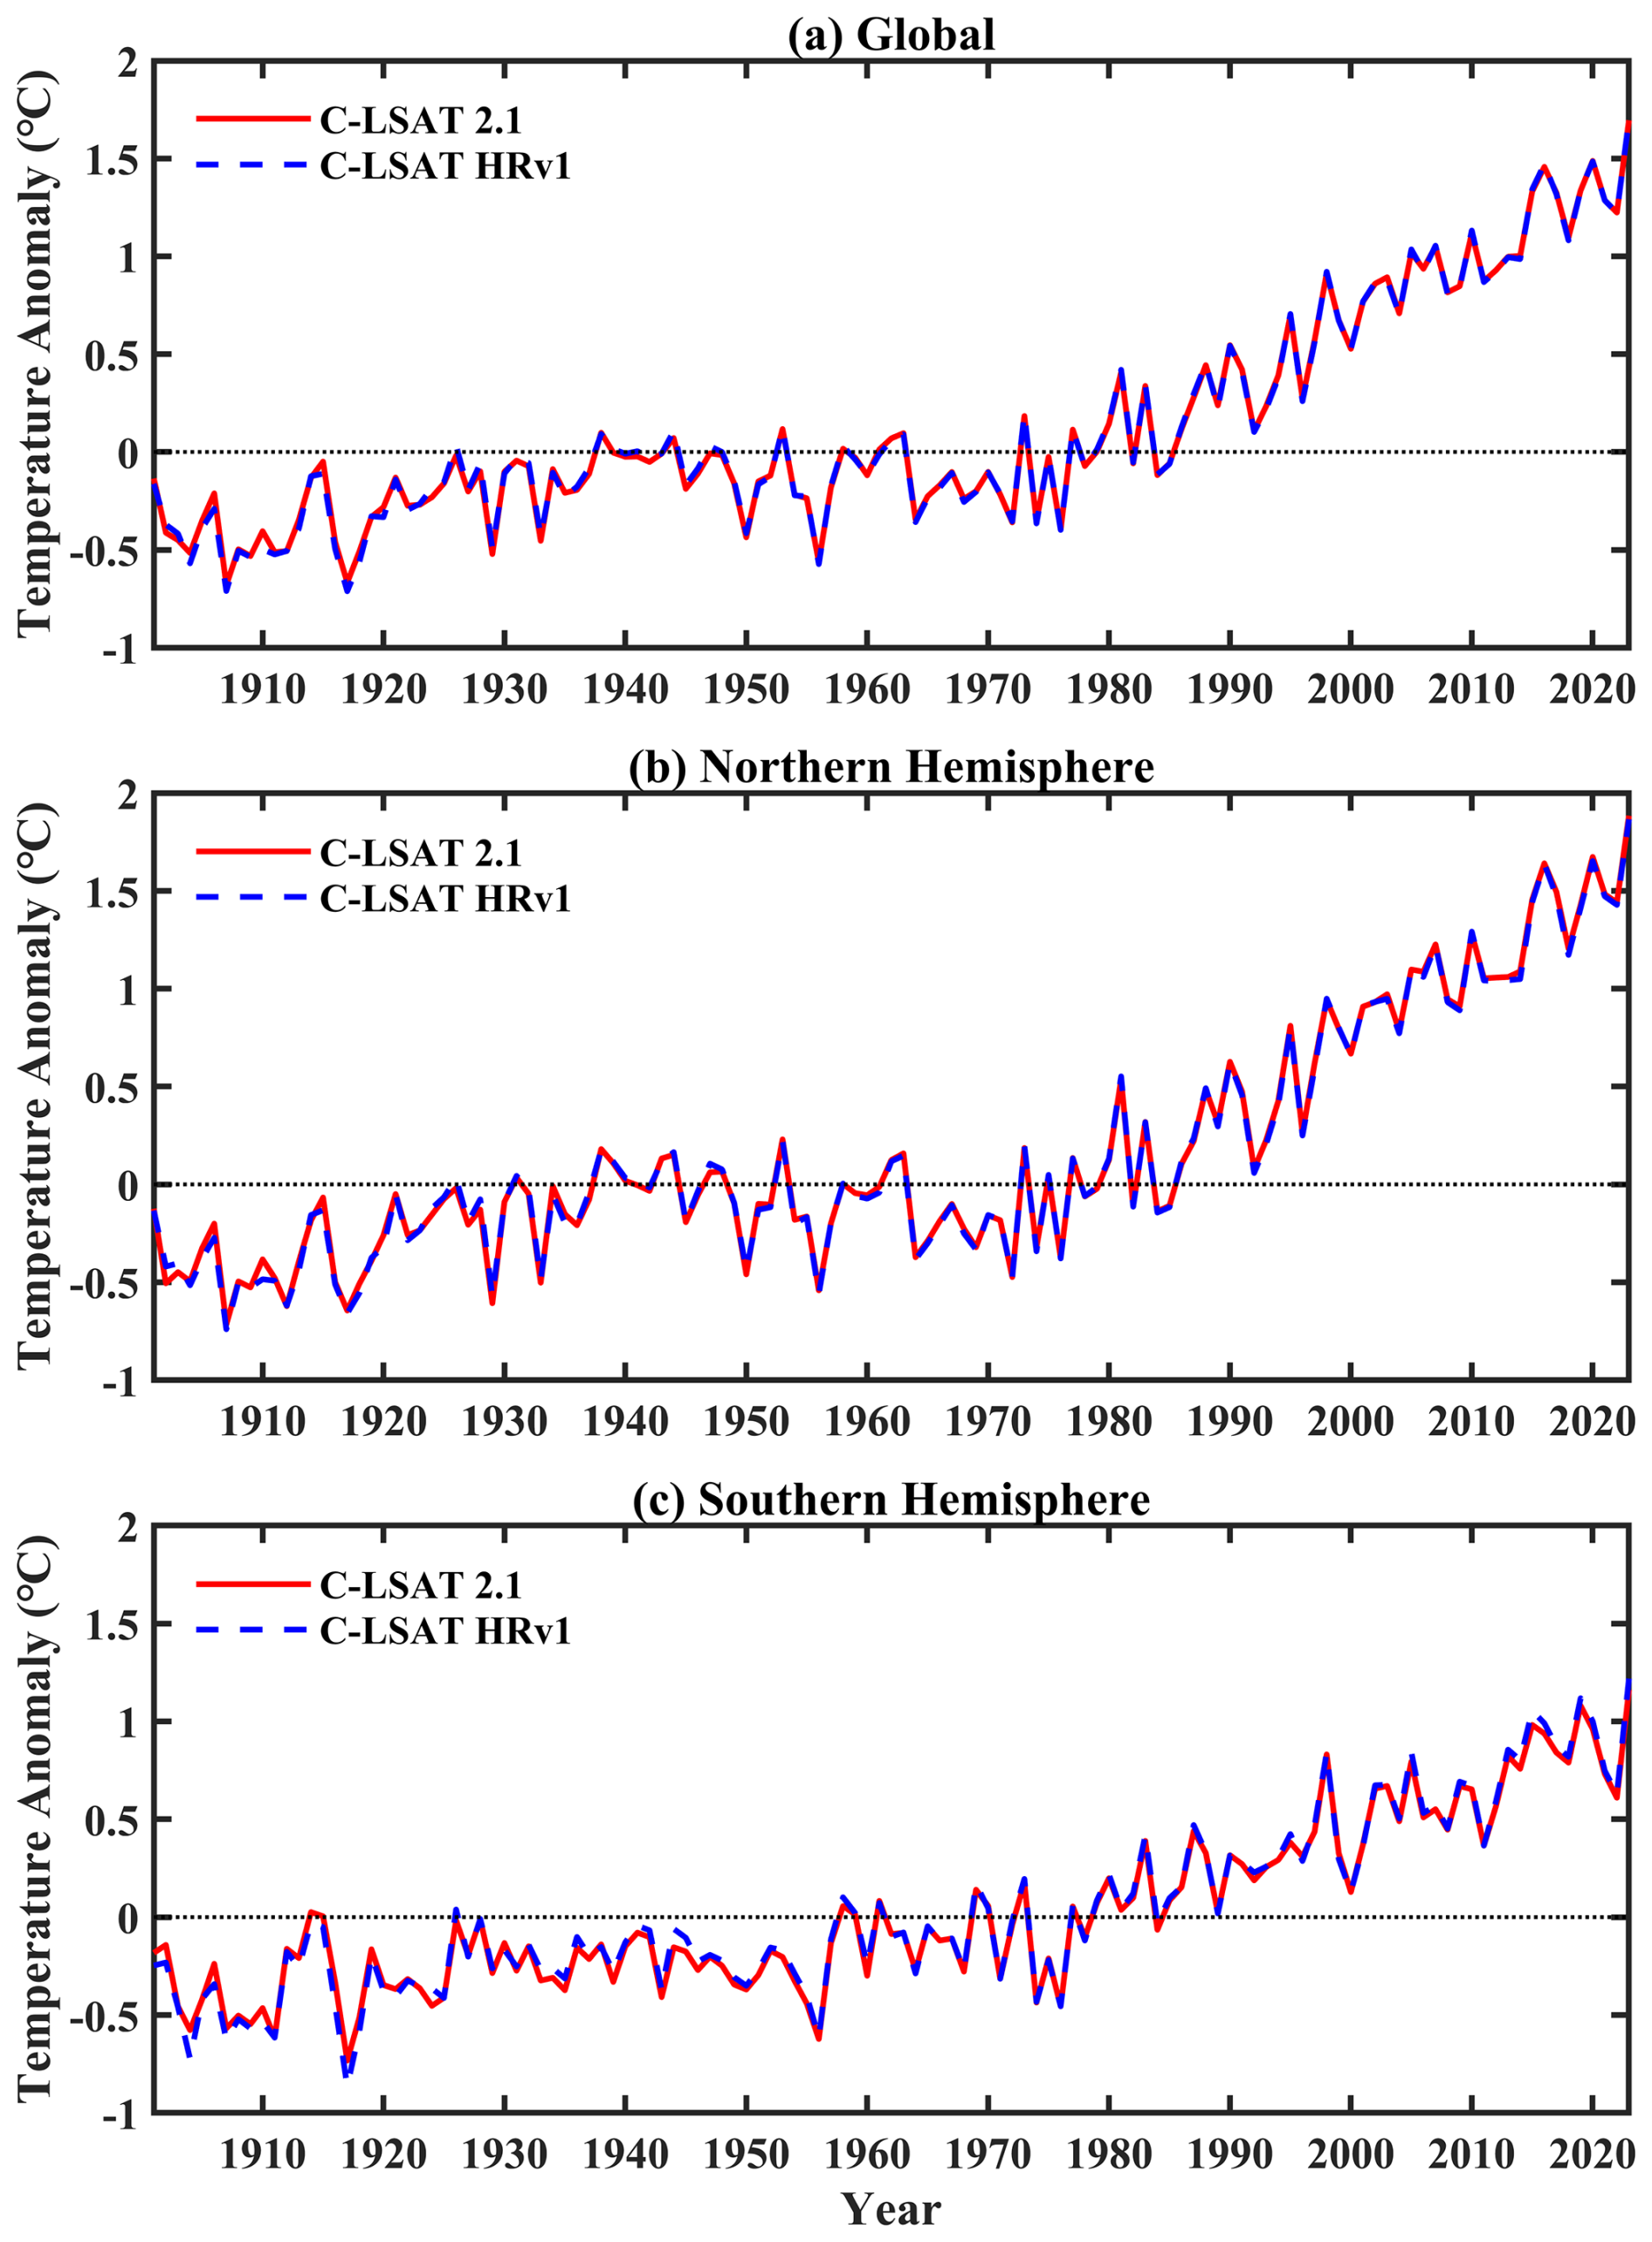
Figure 10The LSAT anomalies for the globe (a), Northern Hemisphere (b), and Southern Hemisphere (c) from 1901 to 2023 for C-LSAT HRv1 and C-LSAT 2.1.
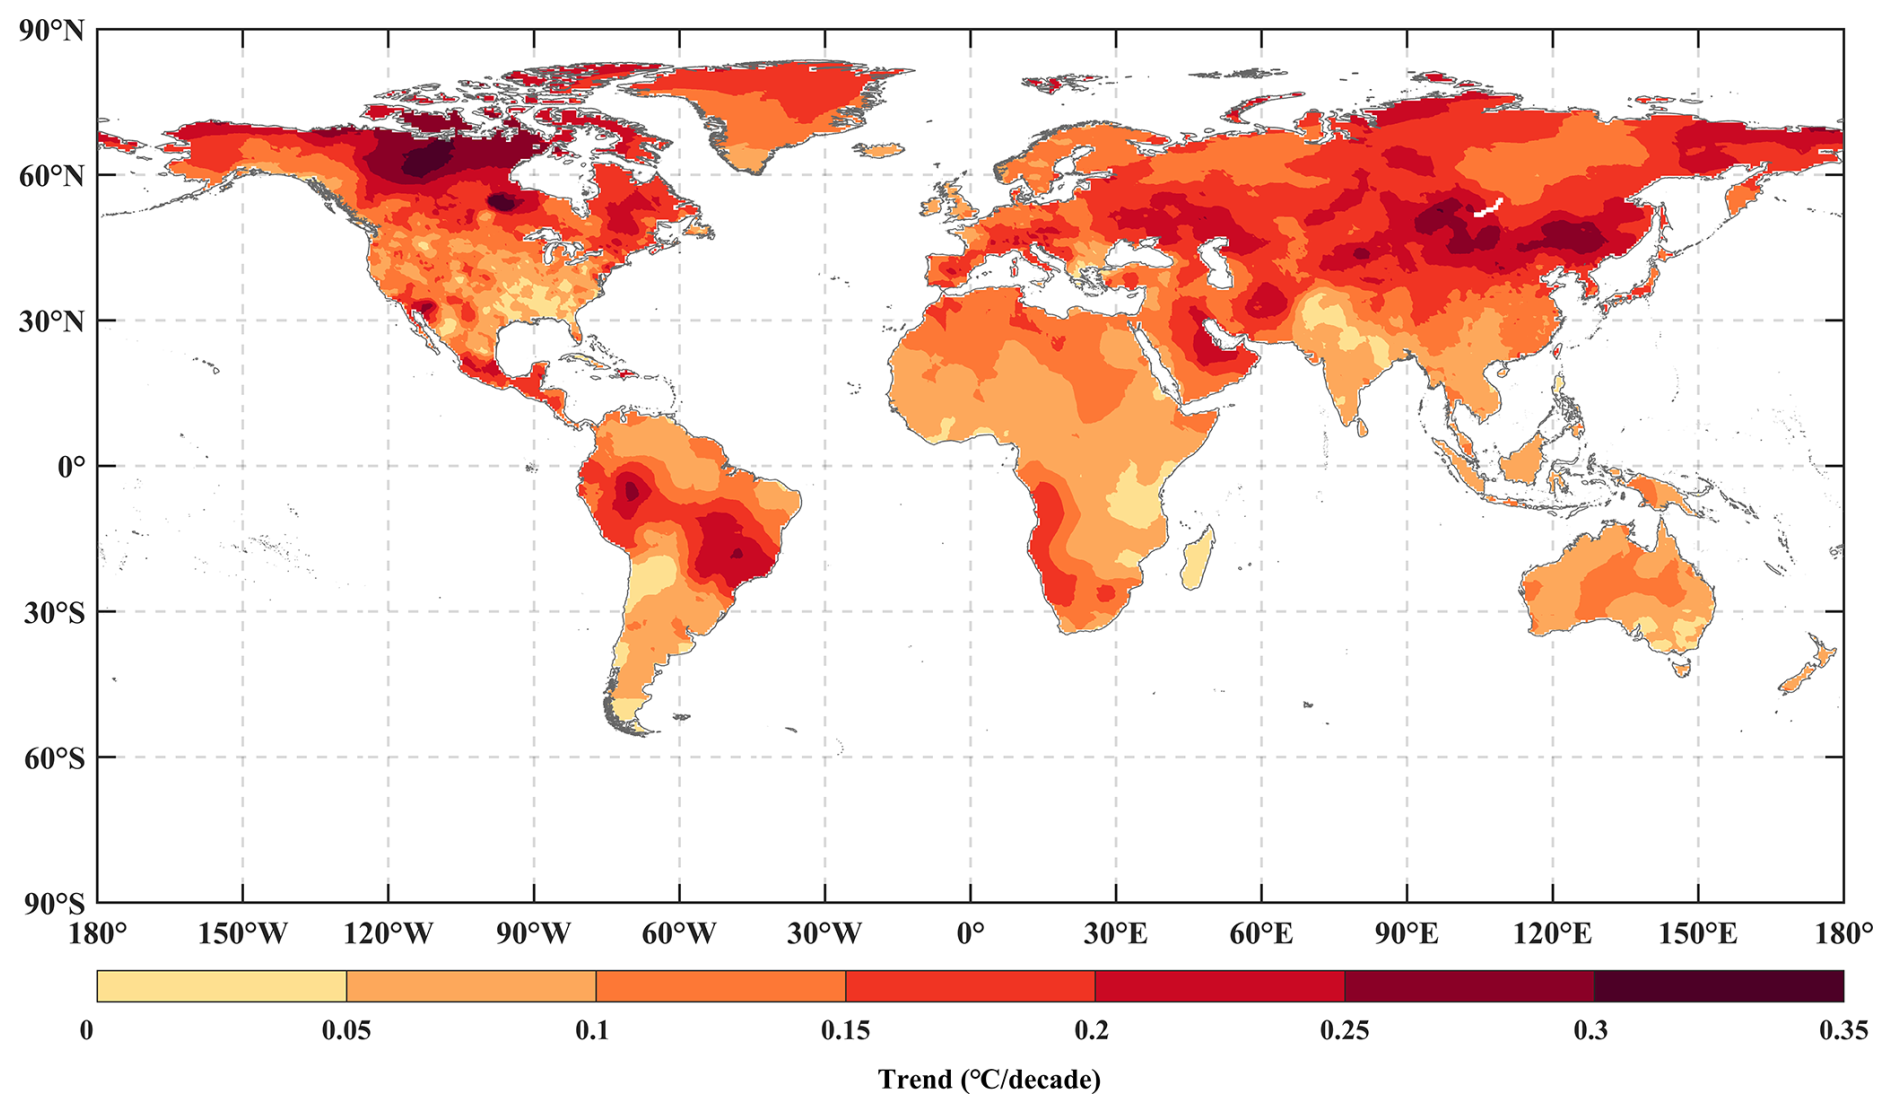
Figure 11Spatial distribution of the LSAT change rate for C-LSAT HRv1 anomaly field from 1901 to 2023.
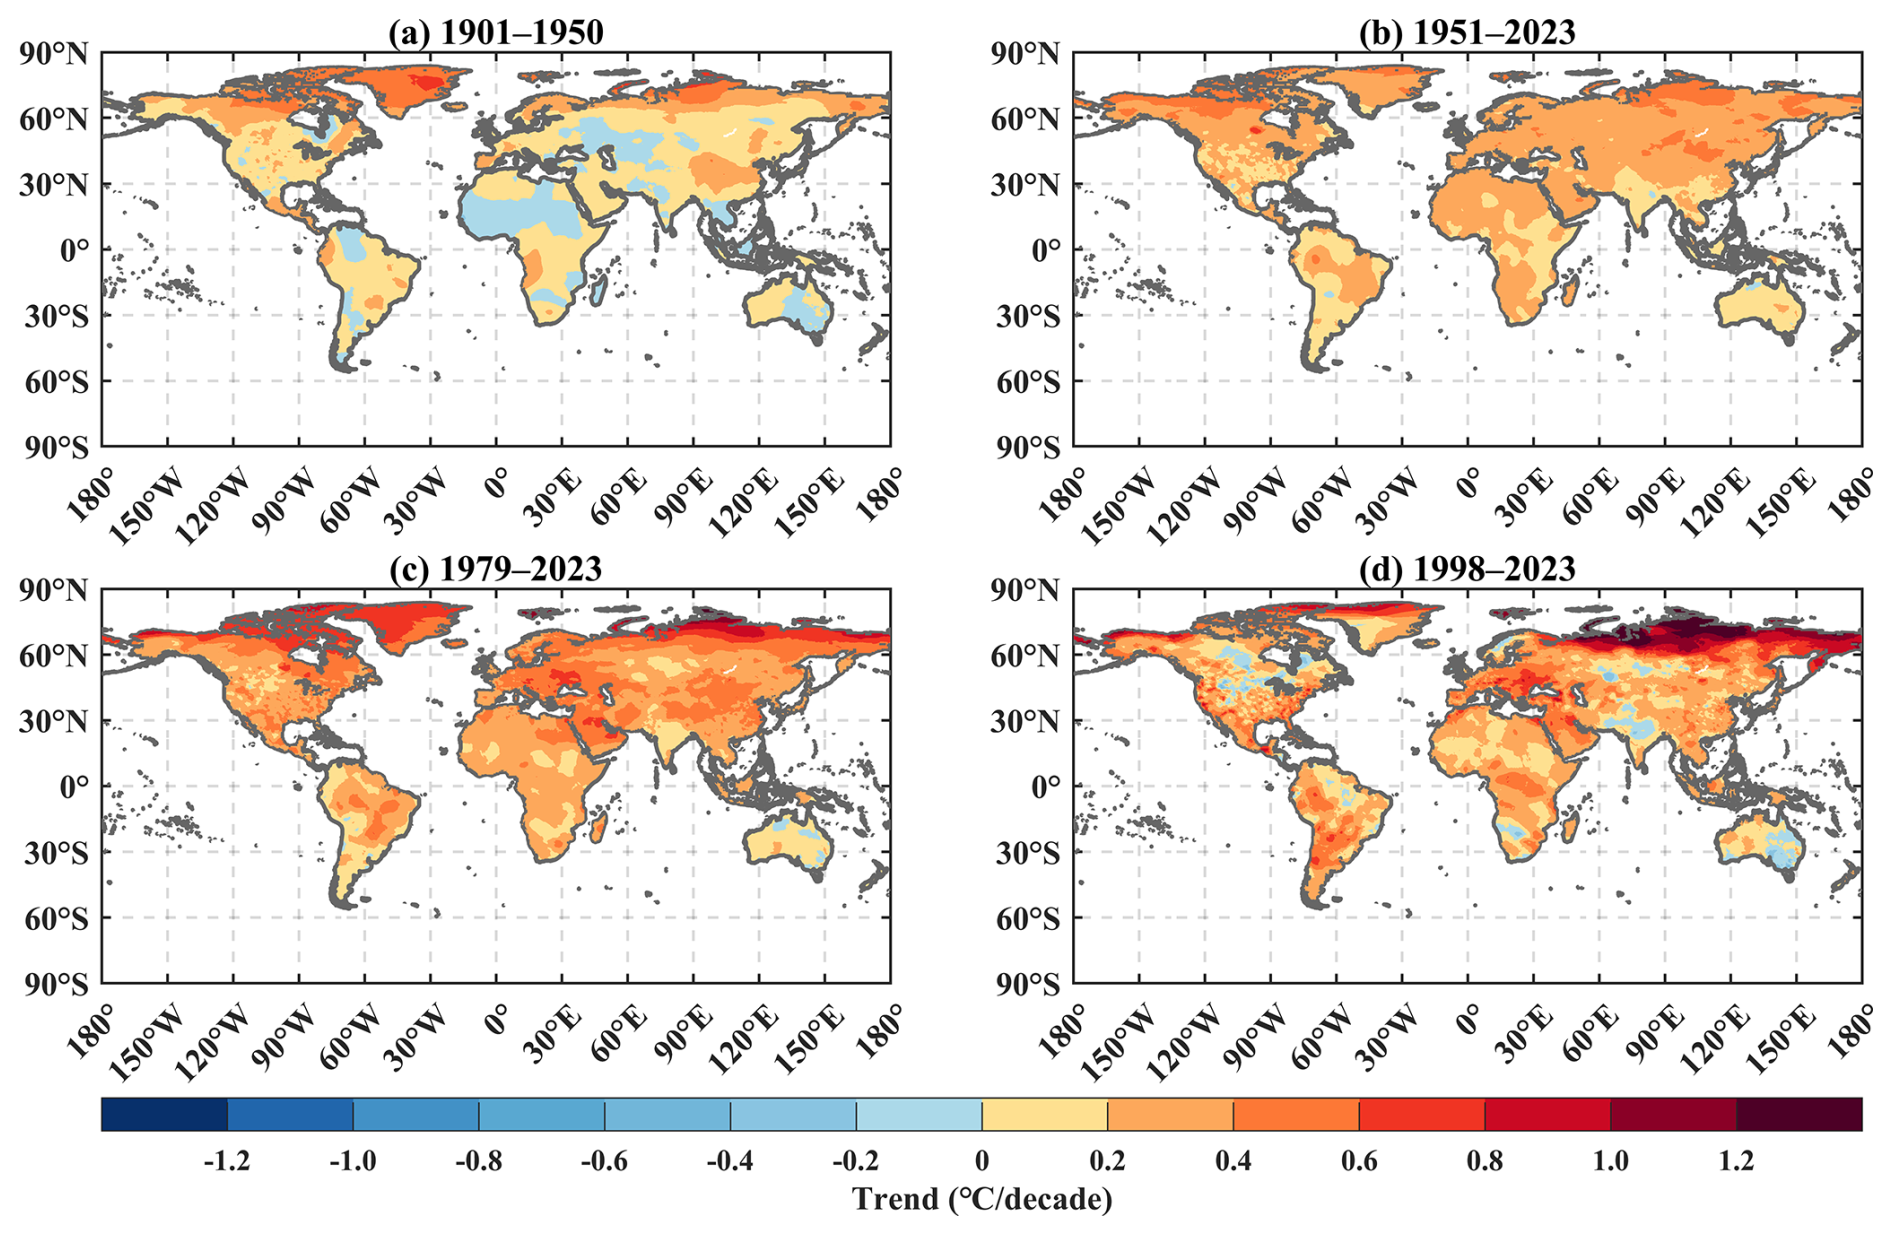
Figure 12Spatial distribution of the LSAT change rates for C-LSAT HRv1 anomaly field during 1901–1950 (a), 1951–2023 (b), 1979–2023 (c), and 1998–2023 (d).
Table 5The LSAT change rates and their 95 % confidence intervals (“*”) for C-LSAT HRv1 over five periods for the globe, Northern Hemisphere, and Southern Hemisphere (°C decade−1).
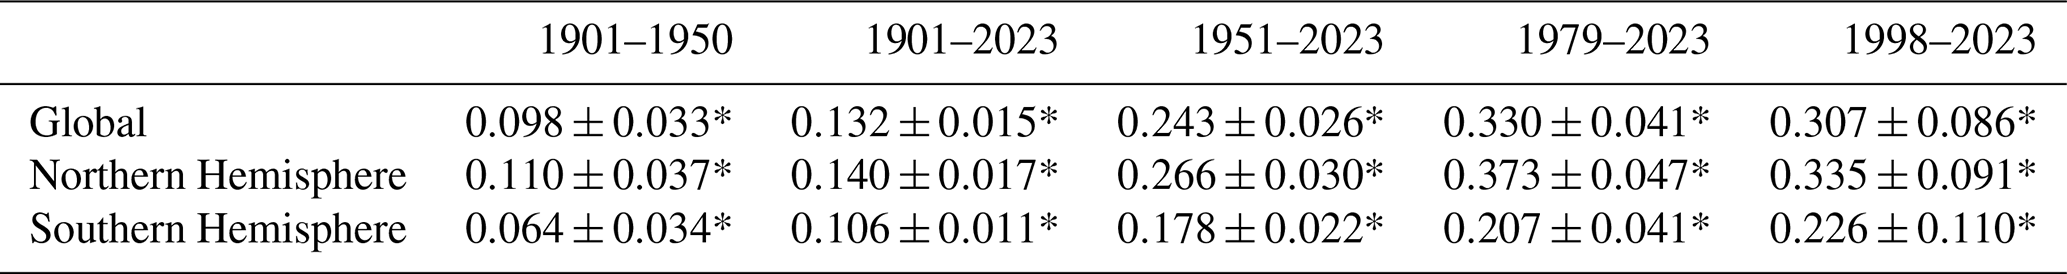
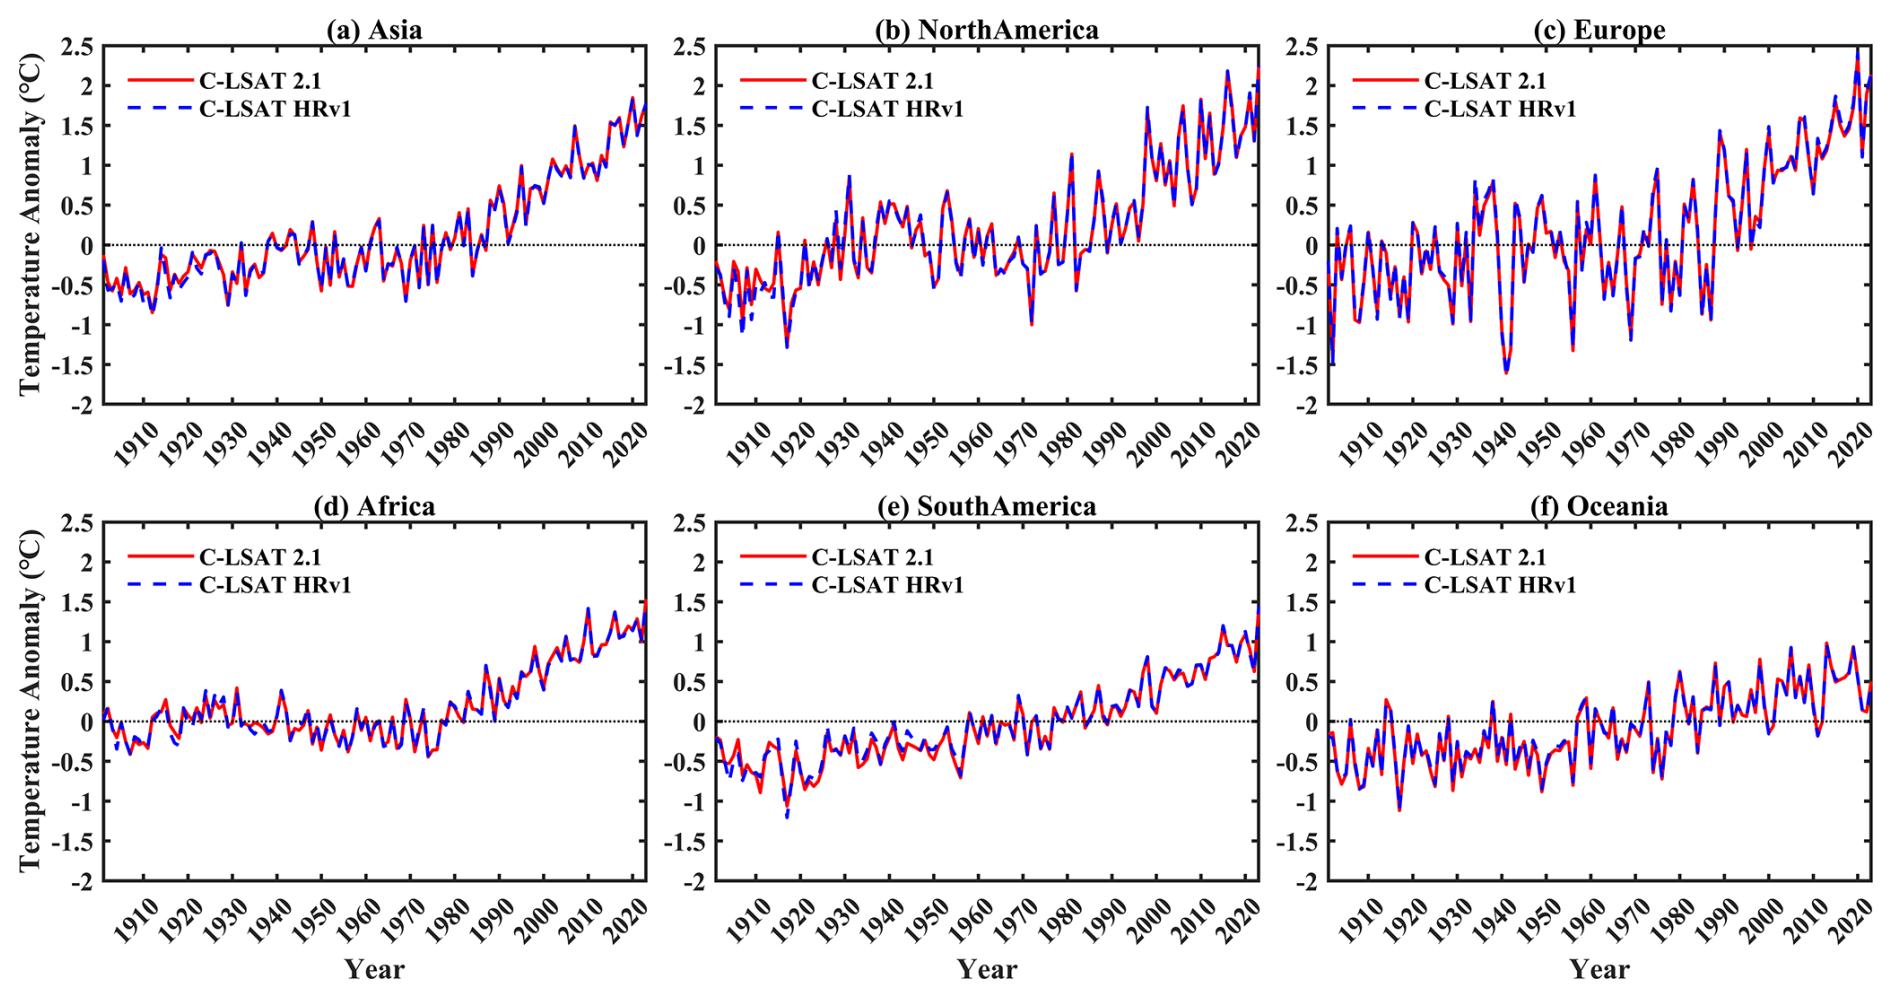
Figure 13The LSAT anomalies for C-LSAT HRv1 and C-LSAT 2.1 on different continents from 1901 to 2023.
IDW assumes that spatially neighbouring data points exhibit higher spatial autocorrelation, and the closer a sample point is to the prediction point, the greater its influence on the predicted value. It assigns weights to sample points based on the inverse of the distance and then calculates the weighted average of the values from each sample point. The equation is as follows:
T represents the value at the prediction point, Ti is the value at a given sample point, Wi is the weight of the sample point, n is the number of selected sample points, di is the distance from the sample point to the prediction point, and α is the parameter that controls how the weight decays with distance. When using traditional IDW interpolation, the weight exhibits a rapid increase, even reaching infinity, as the distance between two points approaches zero. This leads to the sample point having an excessively high weight, which distorts the final estimated value. Building upon the ADW method (New et al., 2000), this study modifies the weight calculation method of the original IDW. The equation is as follows:
d0 is the decay distance. Following the CRU05 (New et al., 2000), we adopted values of 1200 km for LSAT interpolation and 750 km for DTR interpolation. Empirical testing revealed that the optimal results were achieved when n=6 and α=4 (Cheng et al., 2020). The AIDW method introduces an exponential decay relationship between distance and weight, ensuring that the maximum weight does not exceed 1. The decay curve is moderated, leading to a more reasonable distribution of weights.
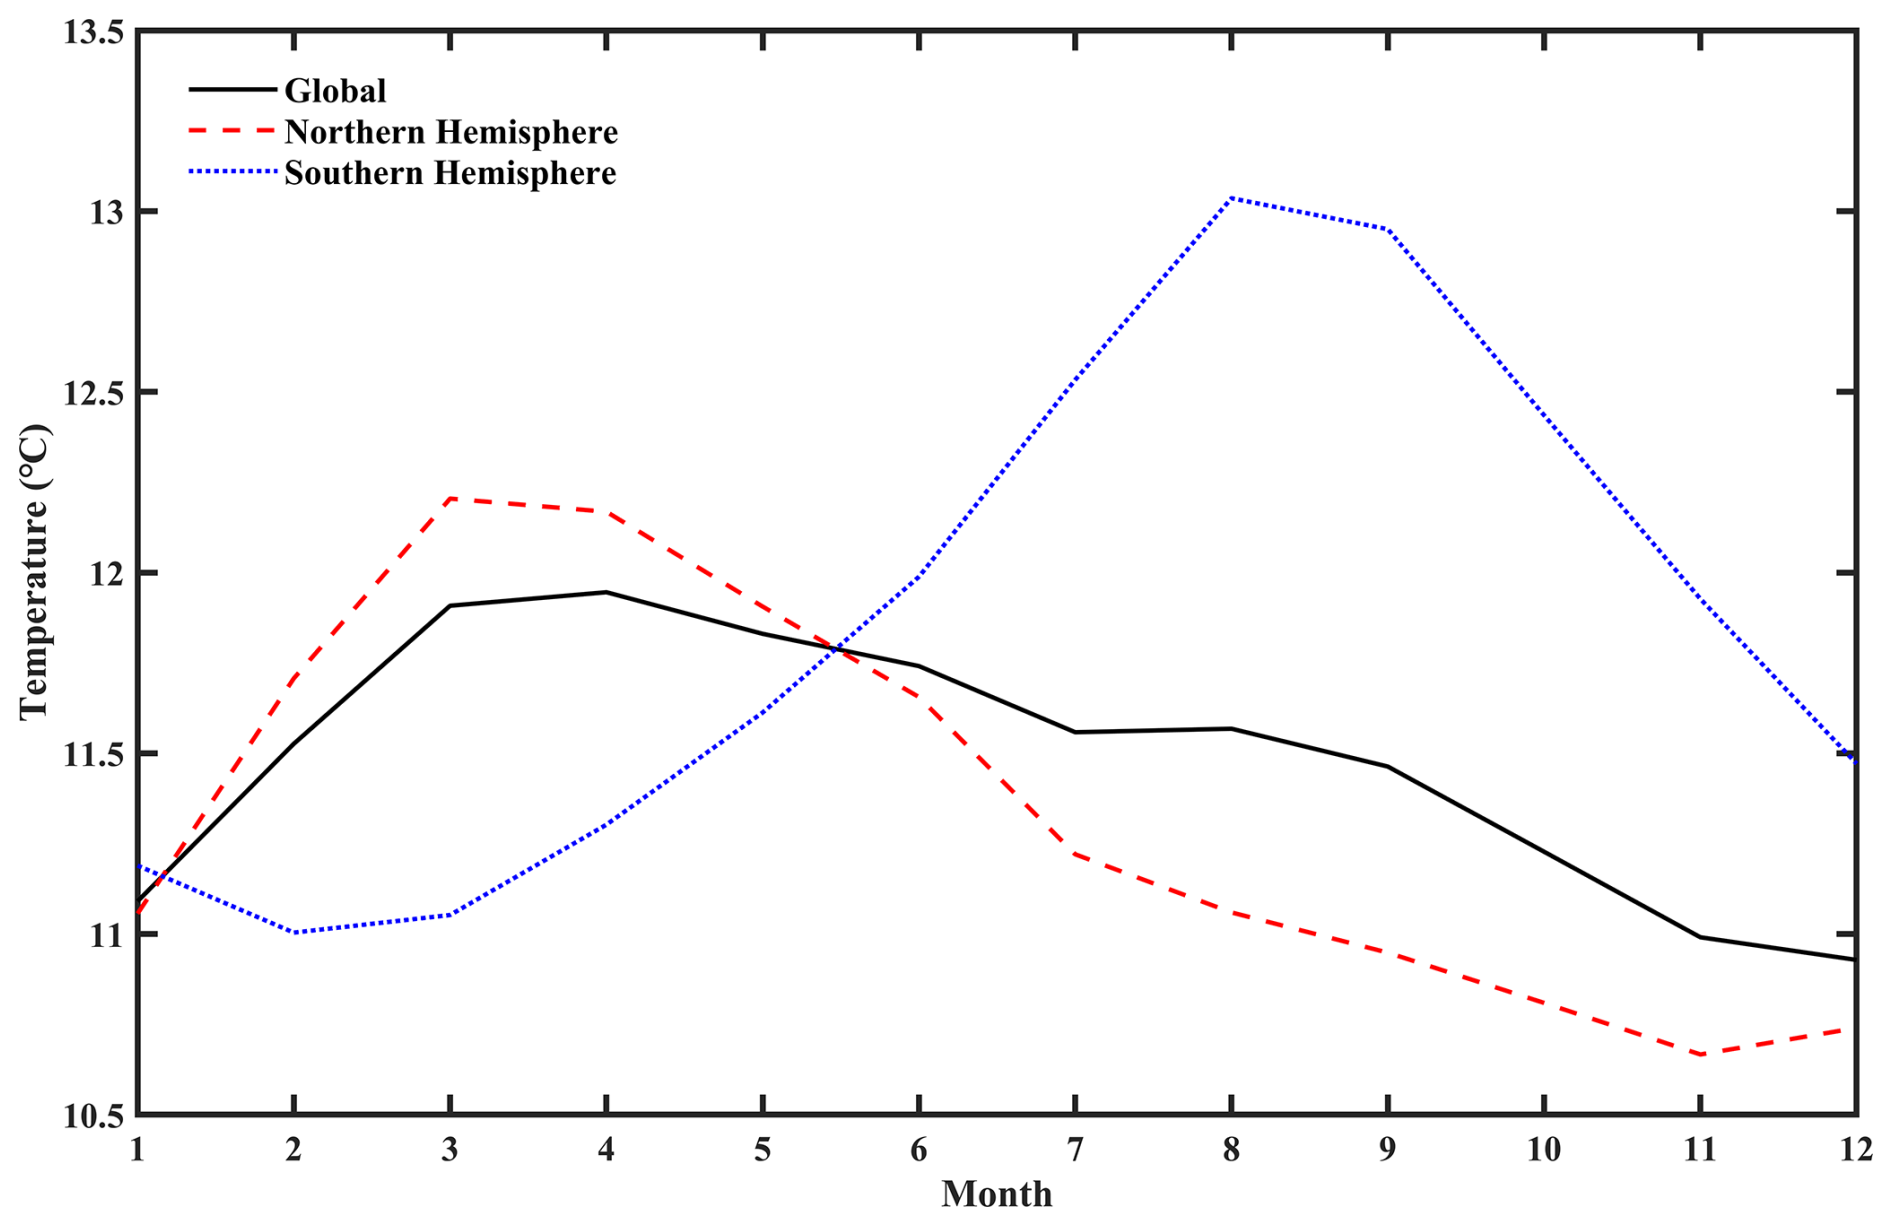
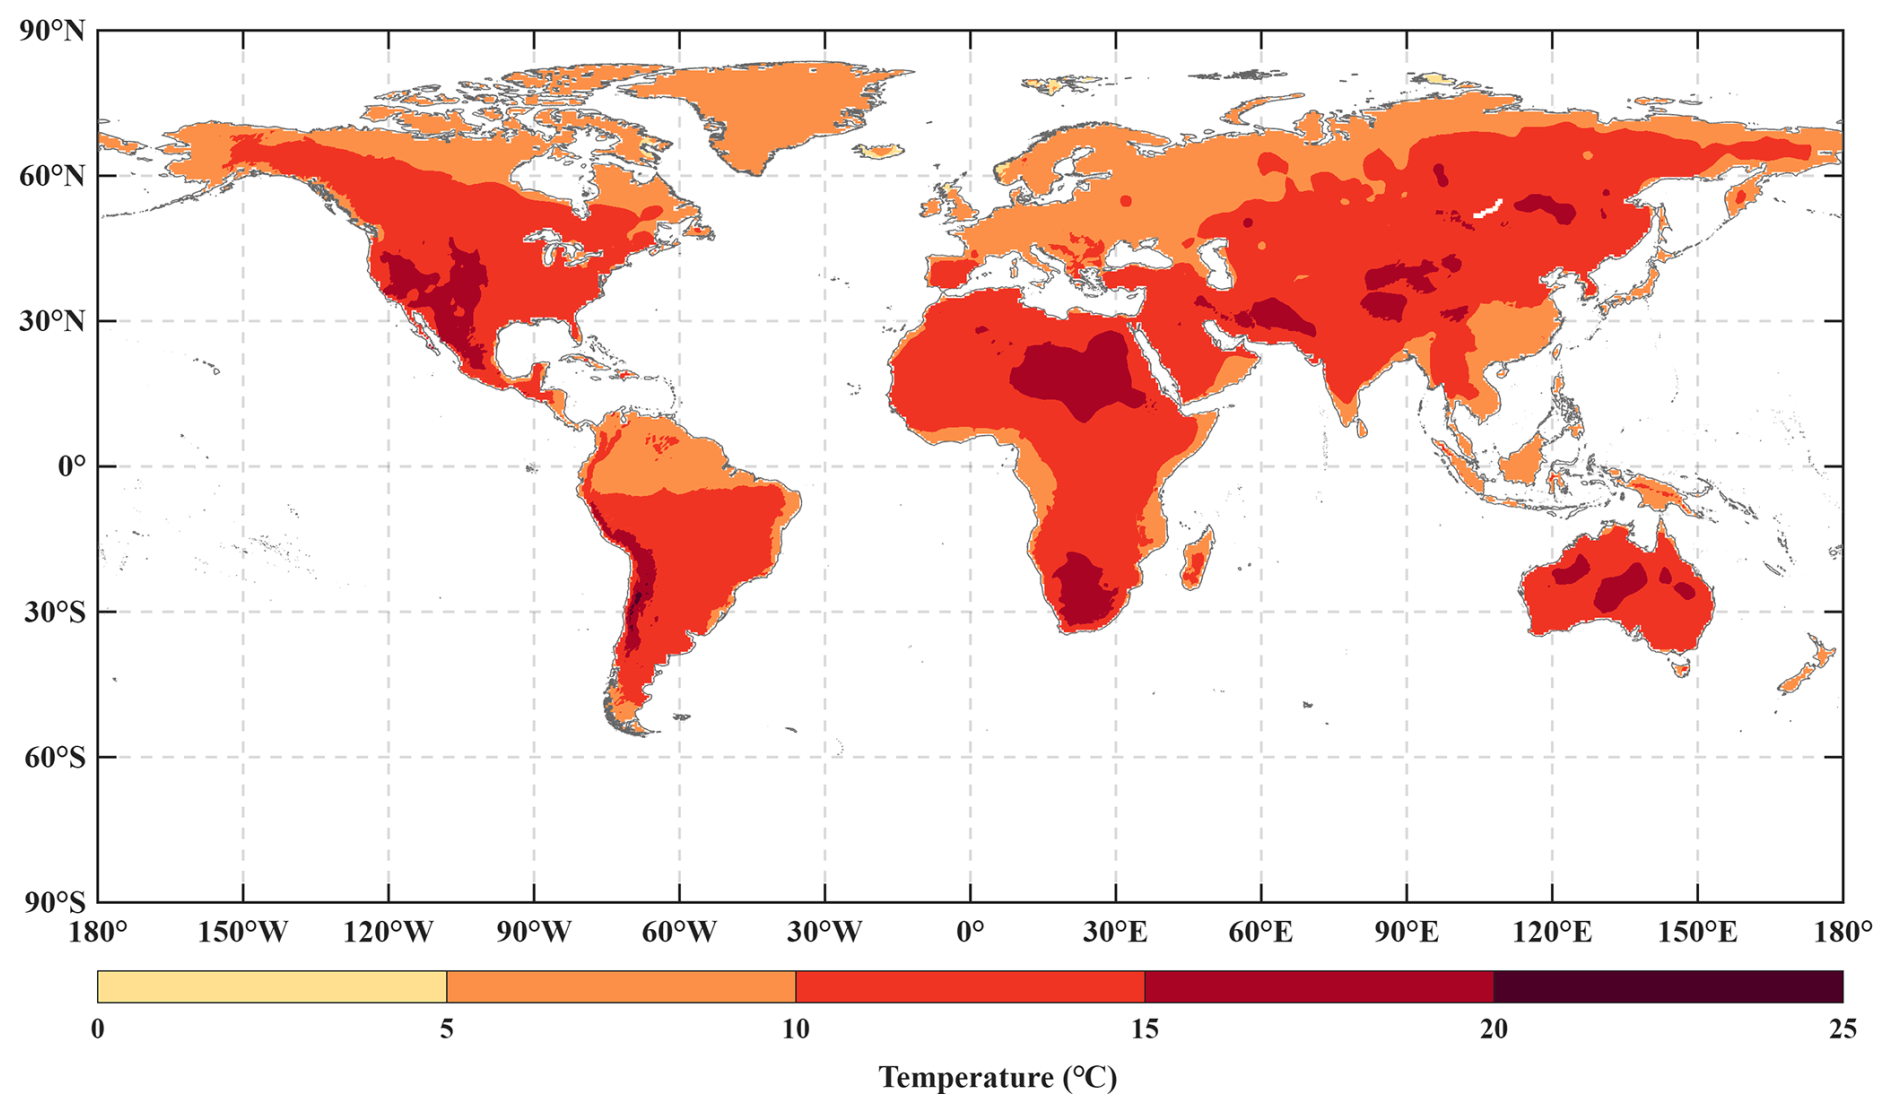
Figure 15Spatial distribution of the DTR for the C-LDTR HRv1 climatology field.
Figure 7 demonstrates that the trends in LSAT and DTR exhibit strong coherence, both showing initial declines, reaching a minimum during the 1960–1990 period, and rebounding thereafter. This is correlated with the number of stations, and their trends are essentially opposite. The trend for the Northern Hemisphere is largely consistent with the global trend. For LSAT, the indices in the Southern Hemisphere are lower than those in the Northern Hemisphere and global values from 1901 to 1960 but become slightly higher after 1960. Regarding DTR, the variabilities in MAE and RMSE for the Southern Hemisphere are significantly higher than those for the Northern Hemisphere and globe. During the 1901–1960 period, the global and hemispheric levels are almost identical, but after 1960, the MAE and RMSE for the Southern Hemisphere remain consistently higher than those for the Northern Hemisphere and globe. Furthermore, with regard to DISO, the Southern Hemisphere outperforms both the global and Northern Hemispheric averages. Over the Tibetan Plateau, the LSAT and DTR validation results are essentially comparable to global and hemispheric values (Fig. S2 in the Supplement).
5.1 C-LSAT HRv1 climatology field
The performance of the C-LSAT HRv1 climatology field is evaluated for the global, Northern Hemisphere, and Southern Hemisphere areas. The highest LSAT values for the global and Northern Hemisphere means are observed in July, reaching 20.3 and 21.3 °C, respectively, while the lowest are recorded in January at 5.3 and −1.4 °C. For the Southern Hemisphere, LSAT peaks in January (24.6 °C) and reaches a minimum in July (17.4 °C) (Fig. 8). Excluding Antarctic data reduces Southern Hemisphere land area, thereby reducing its contribution to the global LSAT average. Spatially, LSAT shows a dependency on both latitude and elevation, with this being significantly lower in high-latitude regions (such as northern North America and northern Asia) and high-elevation areas (e.g. the Tibetan Plateau and the Andes) compared to other regions (Fig. 9).
5.2 C-LSAT HRv1 anomaly field
5.2.1 Global and hemispheric scales
The LSAT anomaly variations of C-LSAT HRv1 and C-LSAT 2.1 from 1901 to 2023 for the globe, Northern Hemisphere, and Southern Hemisphere are presented in Fig. 10. The anomaly trends obtained in C-LSAT HRv1 are largely consistent with those of C-LSAT 2.1, with warming rates of 0.132±0.015, 0.140±0.017, and for the globe, Northern Hemisphere, and Southern Hemisphere, respectively. The LSAT change trends for the globe and Northern Hemisphere demonstrate comparable patterns, with warming being predominantly concentrated in two periods: the 1900–1930s and the 1970–2020s, with accelerated warming in the latter period. A slight cooling trend occurs in the middle period, from the 1940s to the 1960s. The warming for the Southern Hemisphere is relatively slower and continues throughout the entire 1901–2023 period without experiencing the cooling trend observed for the global and Northern Hemisphere during the 1940–1960s. Its warming rate also undergoes a pronounced acceleration after the 1970s.
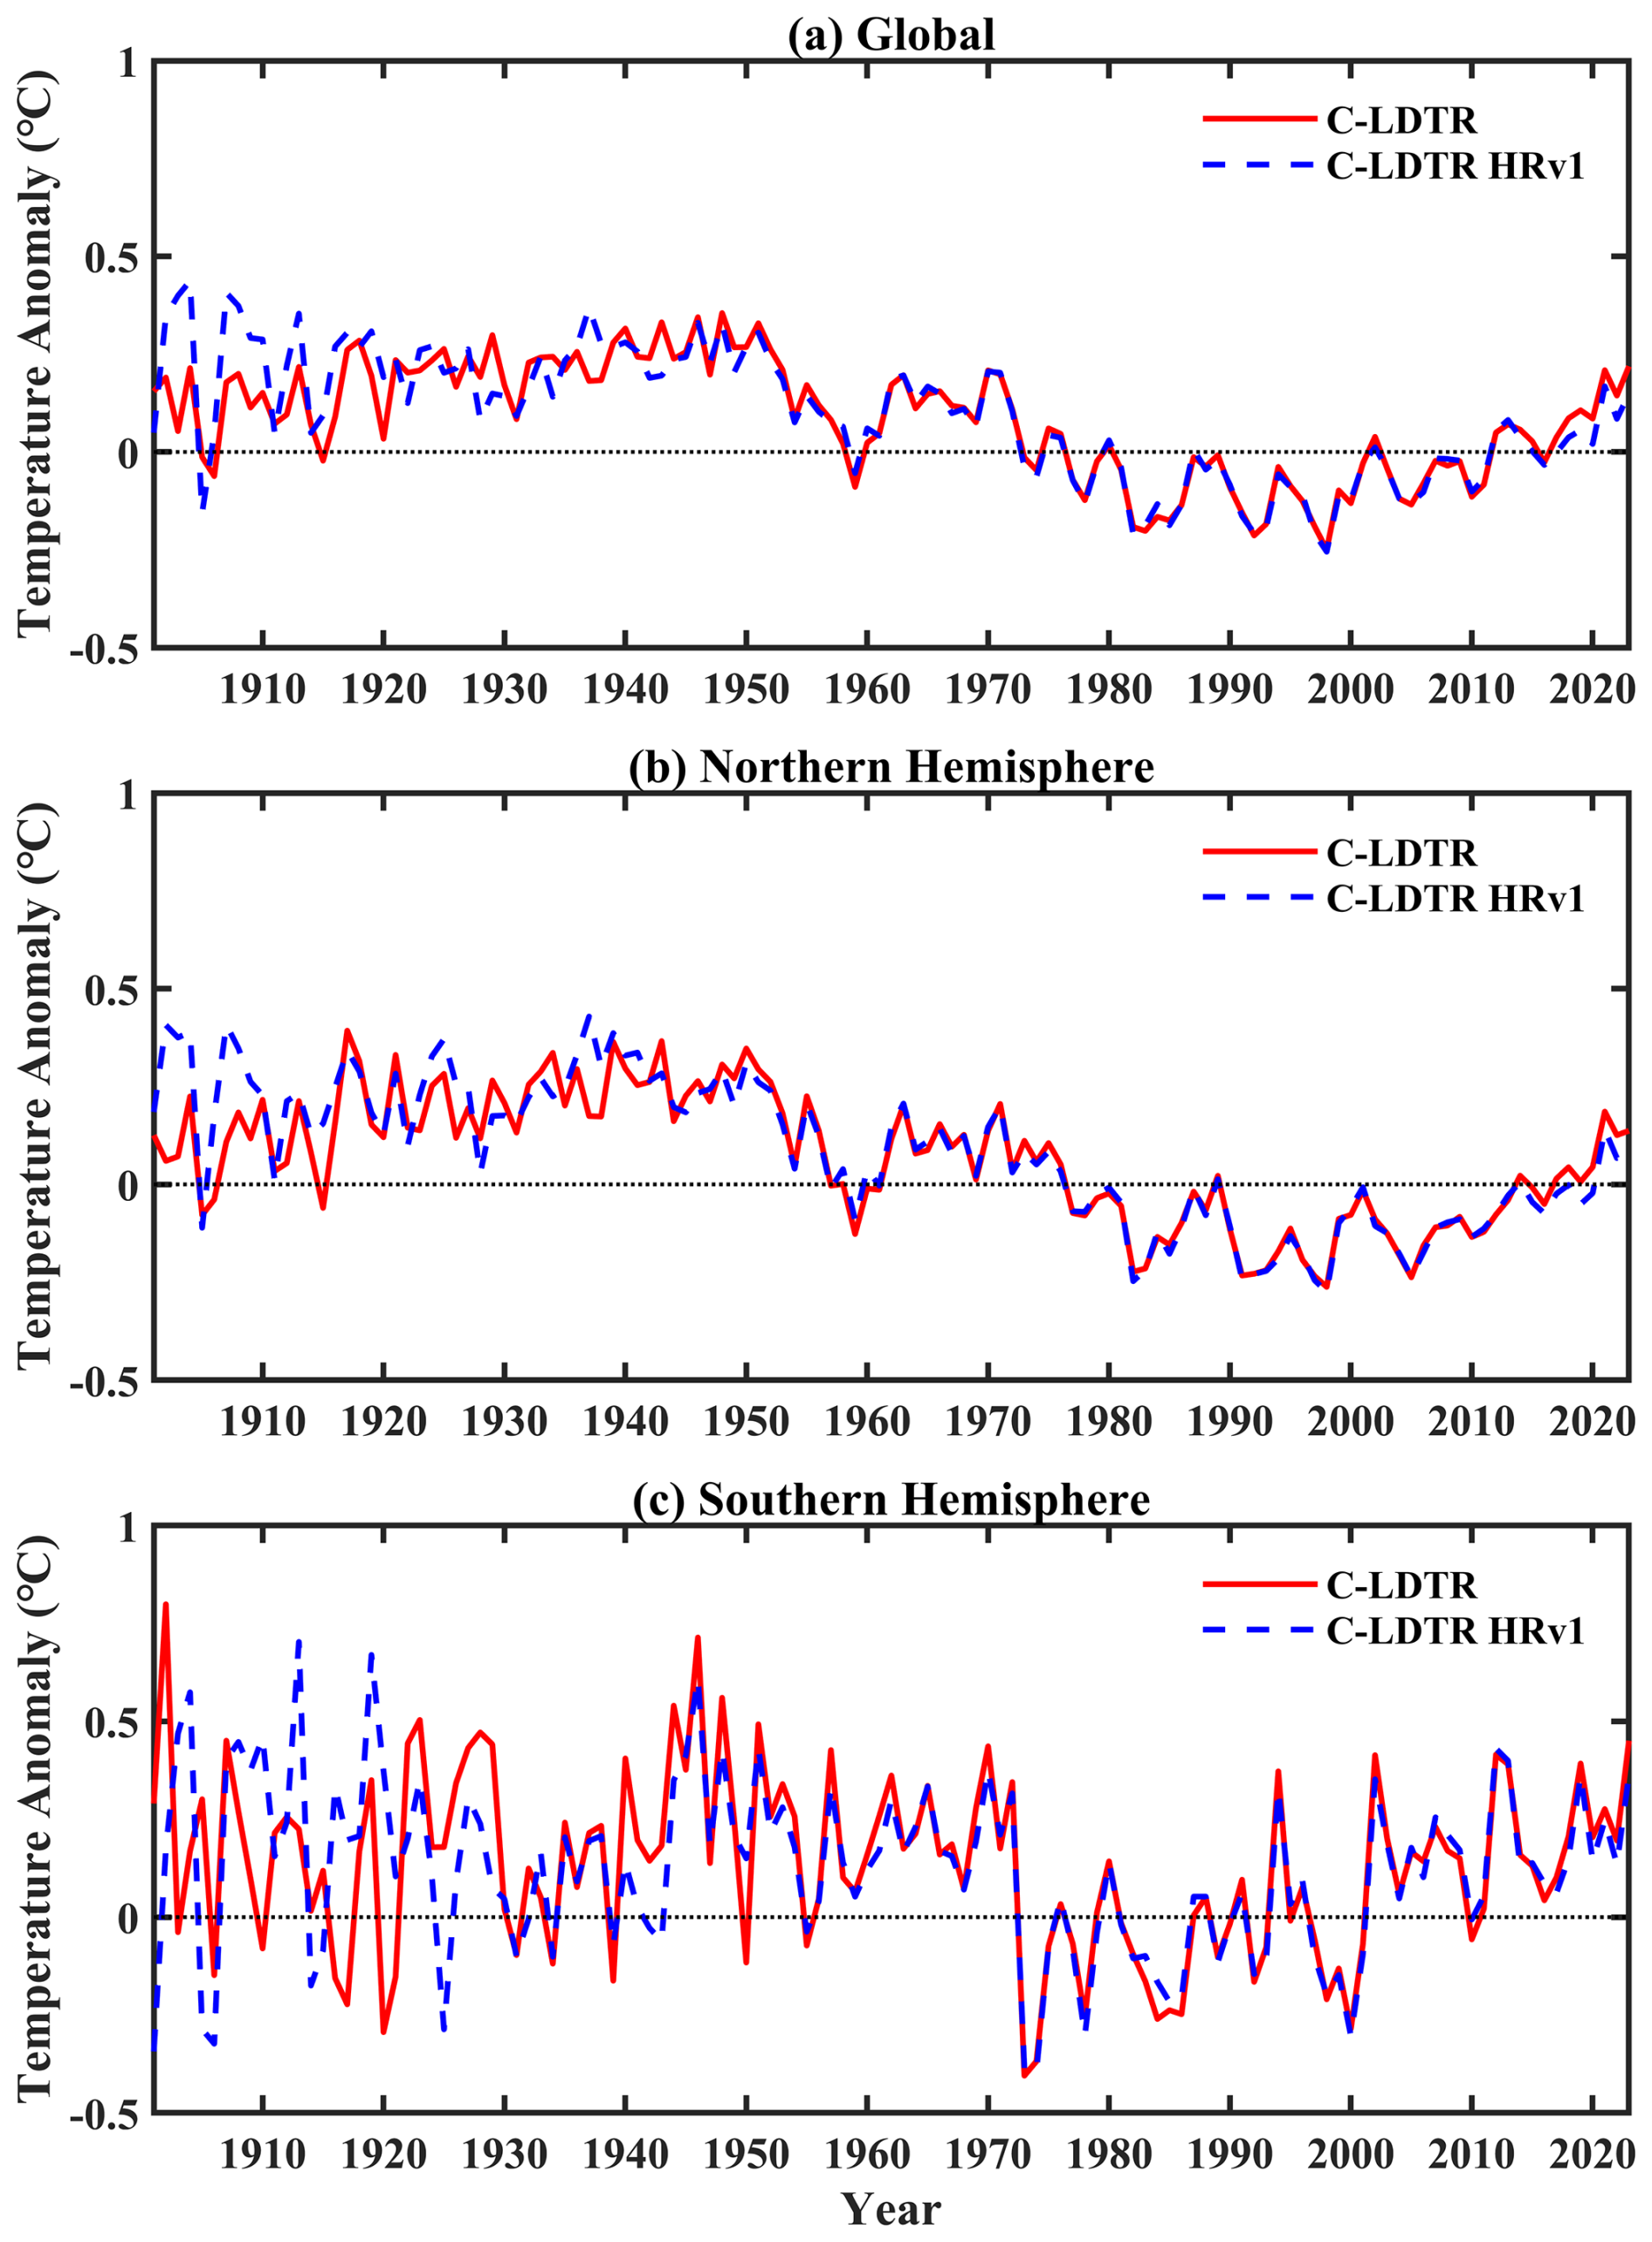
Figure 16The DTR anomalies for the globe (a), Northern Hemisphere (b), and Southern Hemisphere (c) from 1901 to 2023 for C-LDTR HRv1 and C-LDTR.
Annual warming rates for C-LSAT HRv1 (Table 5) are lowest for 1901–1950, rise sharply after 1951 to peak in 1979, and then decline moderately by 1998. This slowdown corresponds to the 1998–2014 warming hiatus; although no cooling is detected, the warming rate is reduced.
Spatially, the LSAT change trend indicates continuous warming globally from 1901 to 2023, with the fastest warming occurring in regions such as northern North America, eastern South America, eastern Europe, and eastern Asia (Fig. 11). Regarding different periods, the fastest warming was observed between 1998–2023 (particularly in areas north of 60° N), while the slowest warming occurred during 1901–1950 (Fig. 12).
Table 6The DTR change rates and their 95 % confidence intervals (“*”) for C-LDTR HRv1 over five periods for the globe, Northern Hemisphere, and Southern Hemisphere (°C decade−1).
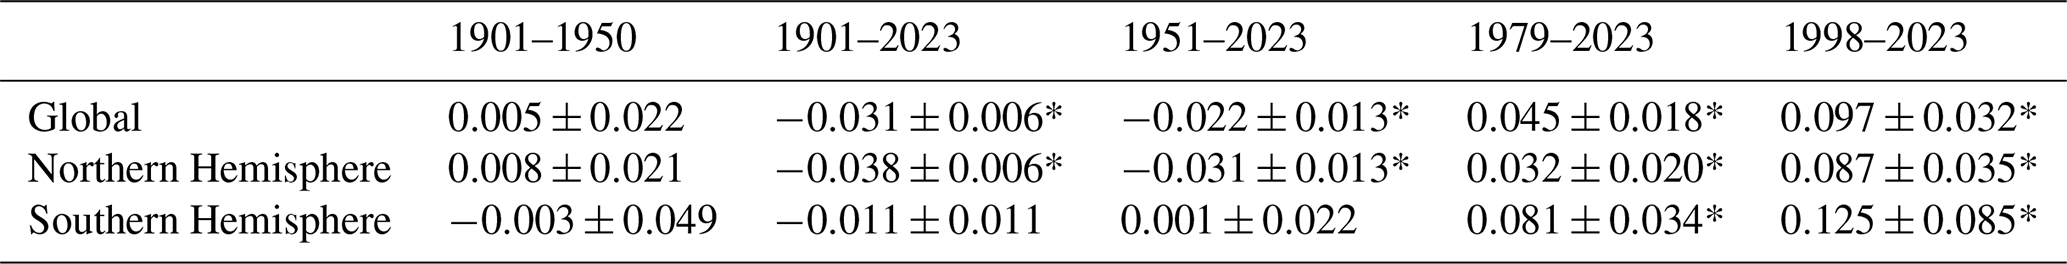
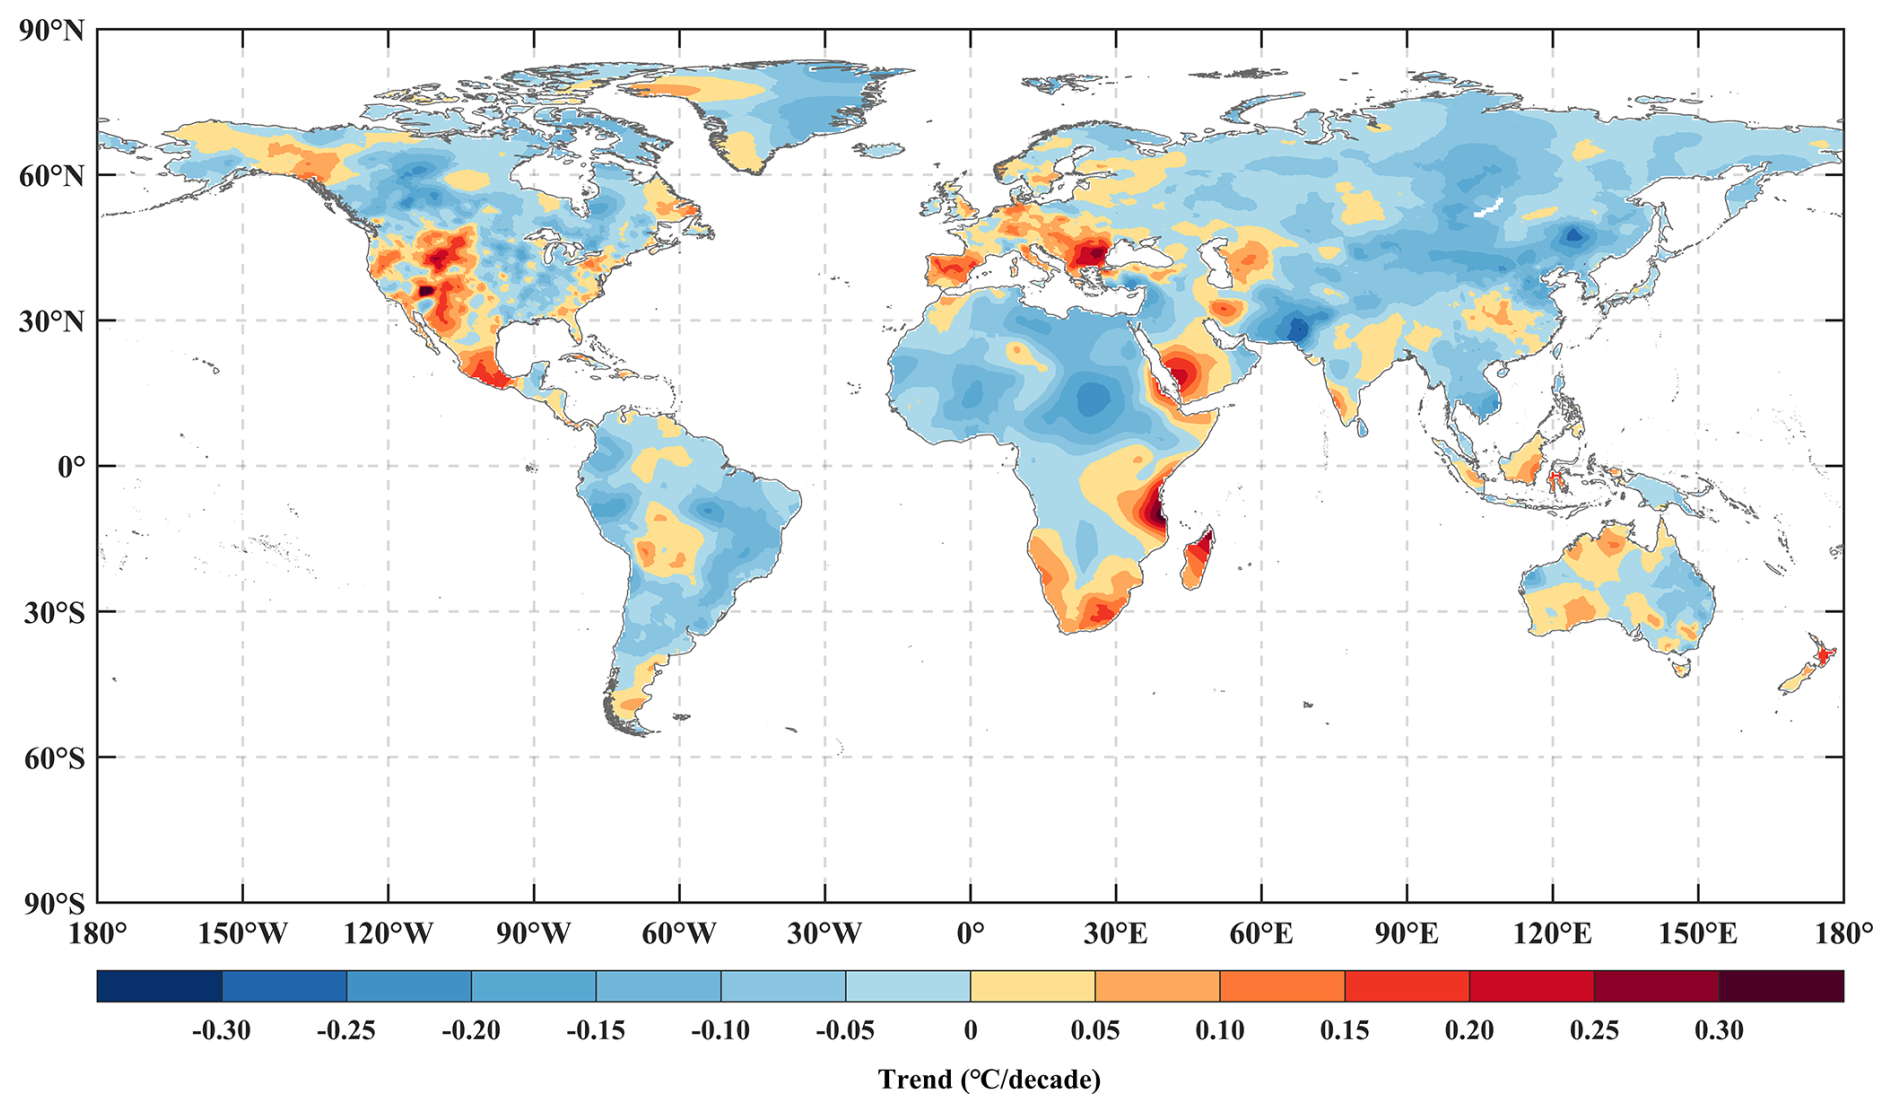
Figure 17Spatial distribution of the DTR change rate for the C-LDTR HRv1 anomaly field from 1901 to 2023.
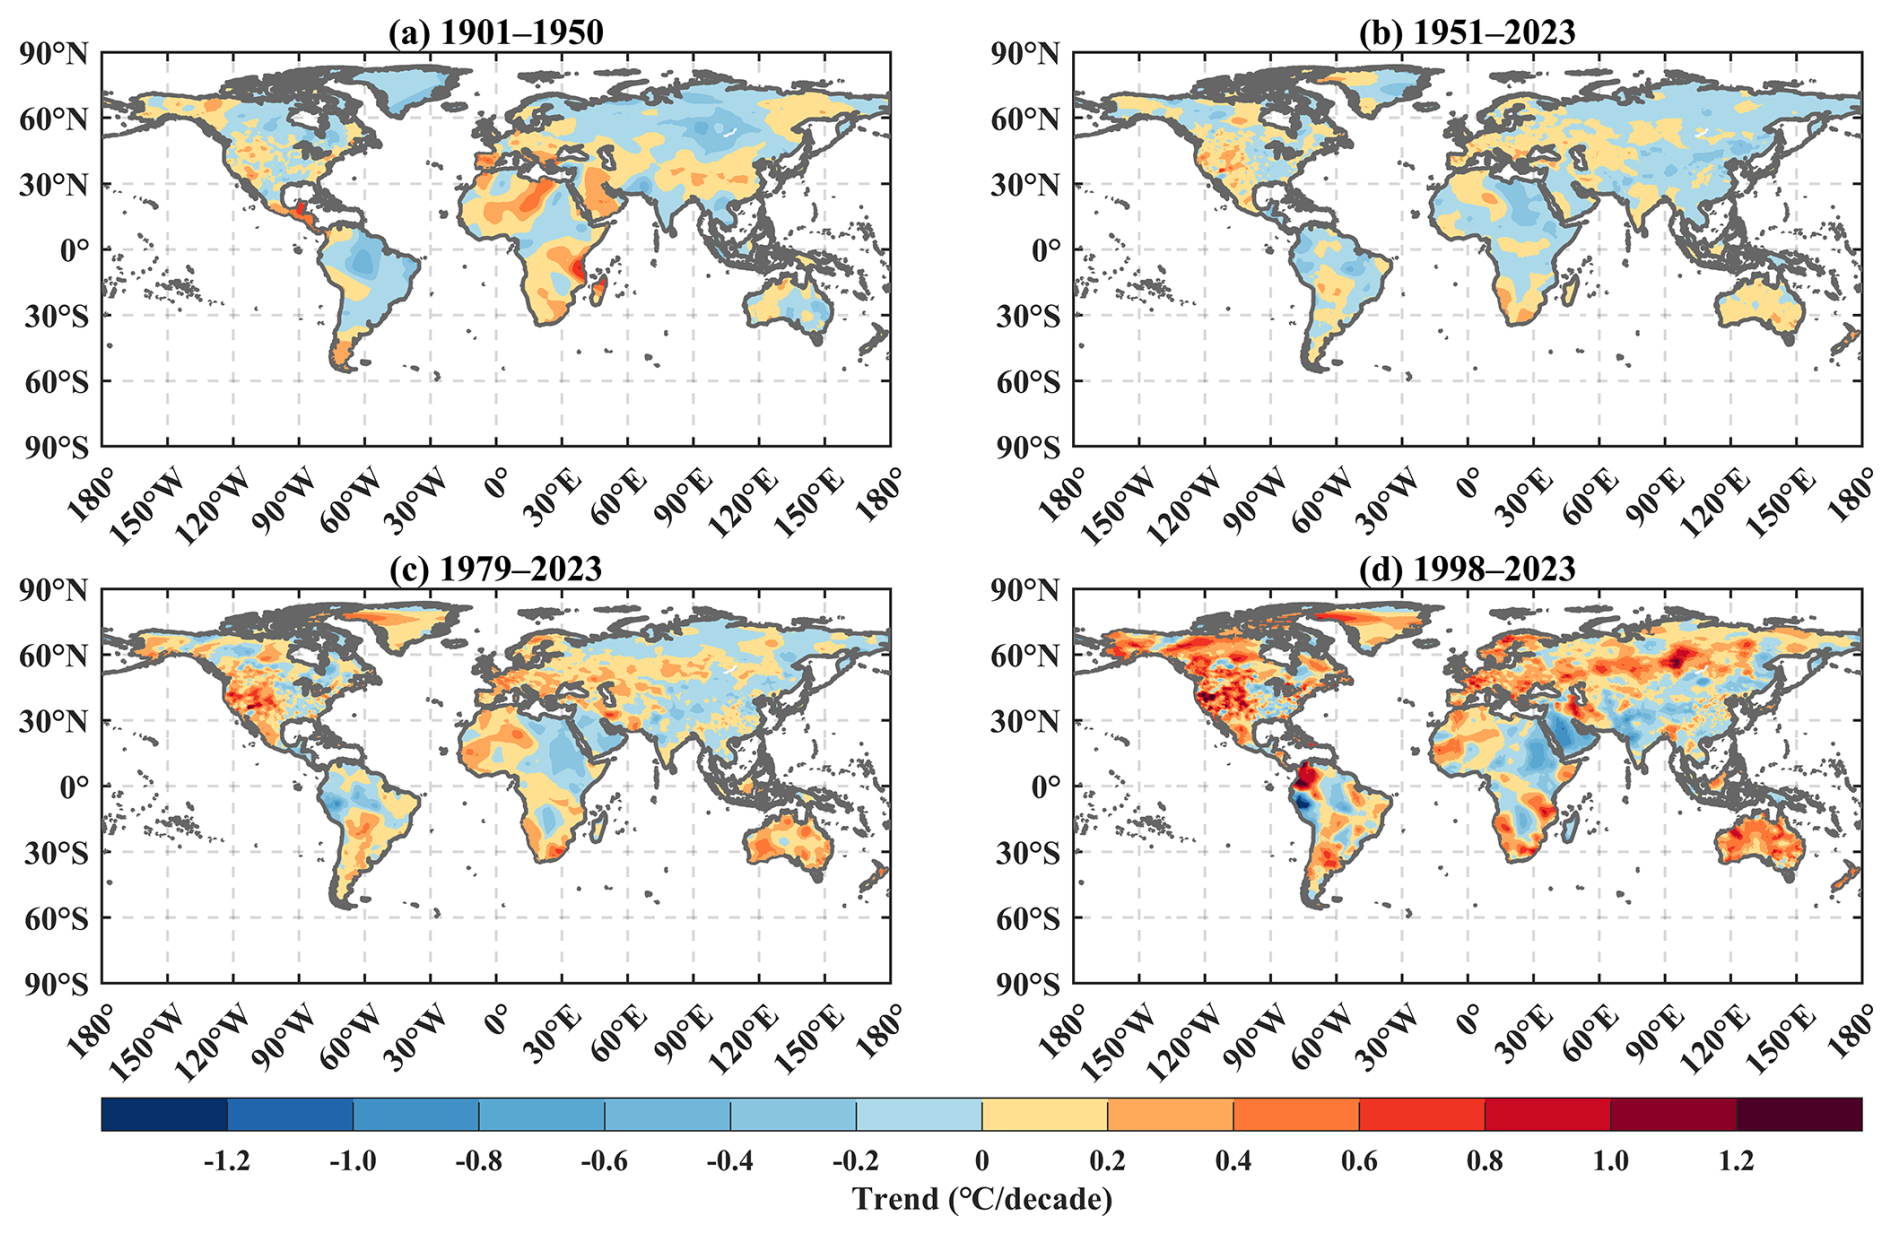
Figure 18Spatial distribution of the DTR change rates for the C-LDTR HRv1 anomaly field during 1901–1950 (a), 1951–2023 (b), 1979–2023 (c), and 1998–2023 (d).
5.2.2 Continental scale
At the continental scale, both C-LSAT HRv1 and C-LSAT 2.1 show a warming trend across all six continental domains since the early 20th century, with this trend intensifying after the 1970s and manifesting regional differences (Fig. 13). The warming is pronounced in Asia, Europe, and North America, whereas it remains comparatively moderated in South America, Africa, and Oceania, reflecting the different responses of the climate system to global warming. Both datasets are consistent in terms of their long-term trends; however, differences in short-term fluctuations may stem from variations in spatial resolution and processing methods.
5.3 C-LDTR HRv1 climatology field
Figure 14 shows that the monthly average DTR of the C-LDTR HRv1 climatology field undergoes a seasonal inflection in May for the global mean, Northern Hemisphere, and Southern Hemisphere. The global DTR reaches a maximum in April (11.9 °C) and a minimum in December (10.9 °C). For the Northern Hemisphere, the DTR peaks in March (12.2 °C) and reaches its minimum in November (10.7 °C), while, for the Southern Hemisphere, the peak occurs in August (13.0 °C), and the minimum occurs in February (11.0 °C). The Southern Hemisphere shows the largest DTR variation, significantly larger than that of the global mean and Northern Hemispheres, primarily attributed to its smaller land area, resulting in higher sensitivity. This difference reflects the combined impact of solar radiation, surface characteristics, and seasonal changes on the climate system. Spatially, DTR is influenced by elevation, land use, and land cover. DTR is elevated over high-elevation regions (mountains and plateaus) and in arid areas such as deserts (Fig. 15).
5.4 C-LDTR HRv1 anomaly field
5.4.1 Global and hemispheric scales
The DTR anomaly changes of C-LDTR HRv1 for the global mean, Northern Hemisphere, and Southern Hemisphere from 1901 to 2023 are presented in Fig. 16. During 1950–2010, C-LDTR HRv1 remains highly consistent with C-LDTR, with change rates of , , and for the globe, Northern Hemisphere, and Southern Hemisphere, respectively. However, there are notable discrepancies before 1950 and after 2010. From 1901 to 1950, the station number is limited, which resulted in greater uncertainty. Consequently, the differences between the two datasets are more pronounced. This is particularly apparent for the Southern Hemisphere, where the DTR fluctuations and the differences between the two datasets are significantly larger than those for the globe and Northern Hemisphere. After 2010, the reduction in DTR (or Tmax and Tmin) station data leads to the differences between C-LDTR HRv1 and C-LDTR, which is further reflected in other DTR datasets (Xu et al., 2025). The DTR is stable during the 1900s–1940s and 1980s–1990s, declines during the 1950s–1970s, and shows a slight increase after the 2000s.
Table 6 shows the DTR change rates of C-LDTR HRv1 for different periods. The change rate is stable from 1901 to 1950, then initiates a decline in 1951, stabilizes again in 1979, and peaks at 1998. The DTR change rates for the Southern Hemisphere are more pronounced than those for the globe and Northern Hemisphere after 1979.
It is noteworthy that there is no obvious spatial pattern in the changes in DTR. During the period of most significant change, 1998–2023, the regions with the most rapid DTR increases are North America, Europe, and Oceania, whereas other regions, including Northeast Africa, South Asia, and the Middle East, demonstrate a pronounced downward trend (Figs. 17 and 18).
5.4.2 Continental scale
Based on the C-LDTR HRv1 and C-LDTR datasets, Fig. 19 illustrates the complex variation characteristics and significant regional differences of DTR across six continents between 1901 and 2023. DTR anomalies in Asia, Africa, and South America show the downward trend, whereas the changes in Europe, North America, and Oceania remain relatively stable. Europe demonstrates a general upward trend throughout the entire 1901–2023 period, while DTR for the remaining five continents declines before the 1970s but rebounds after 2010.
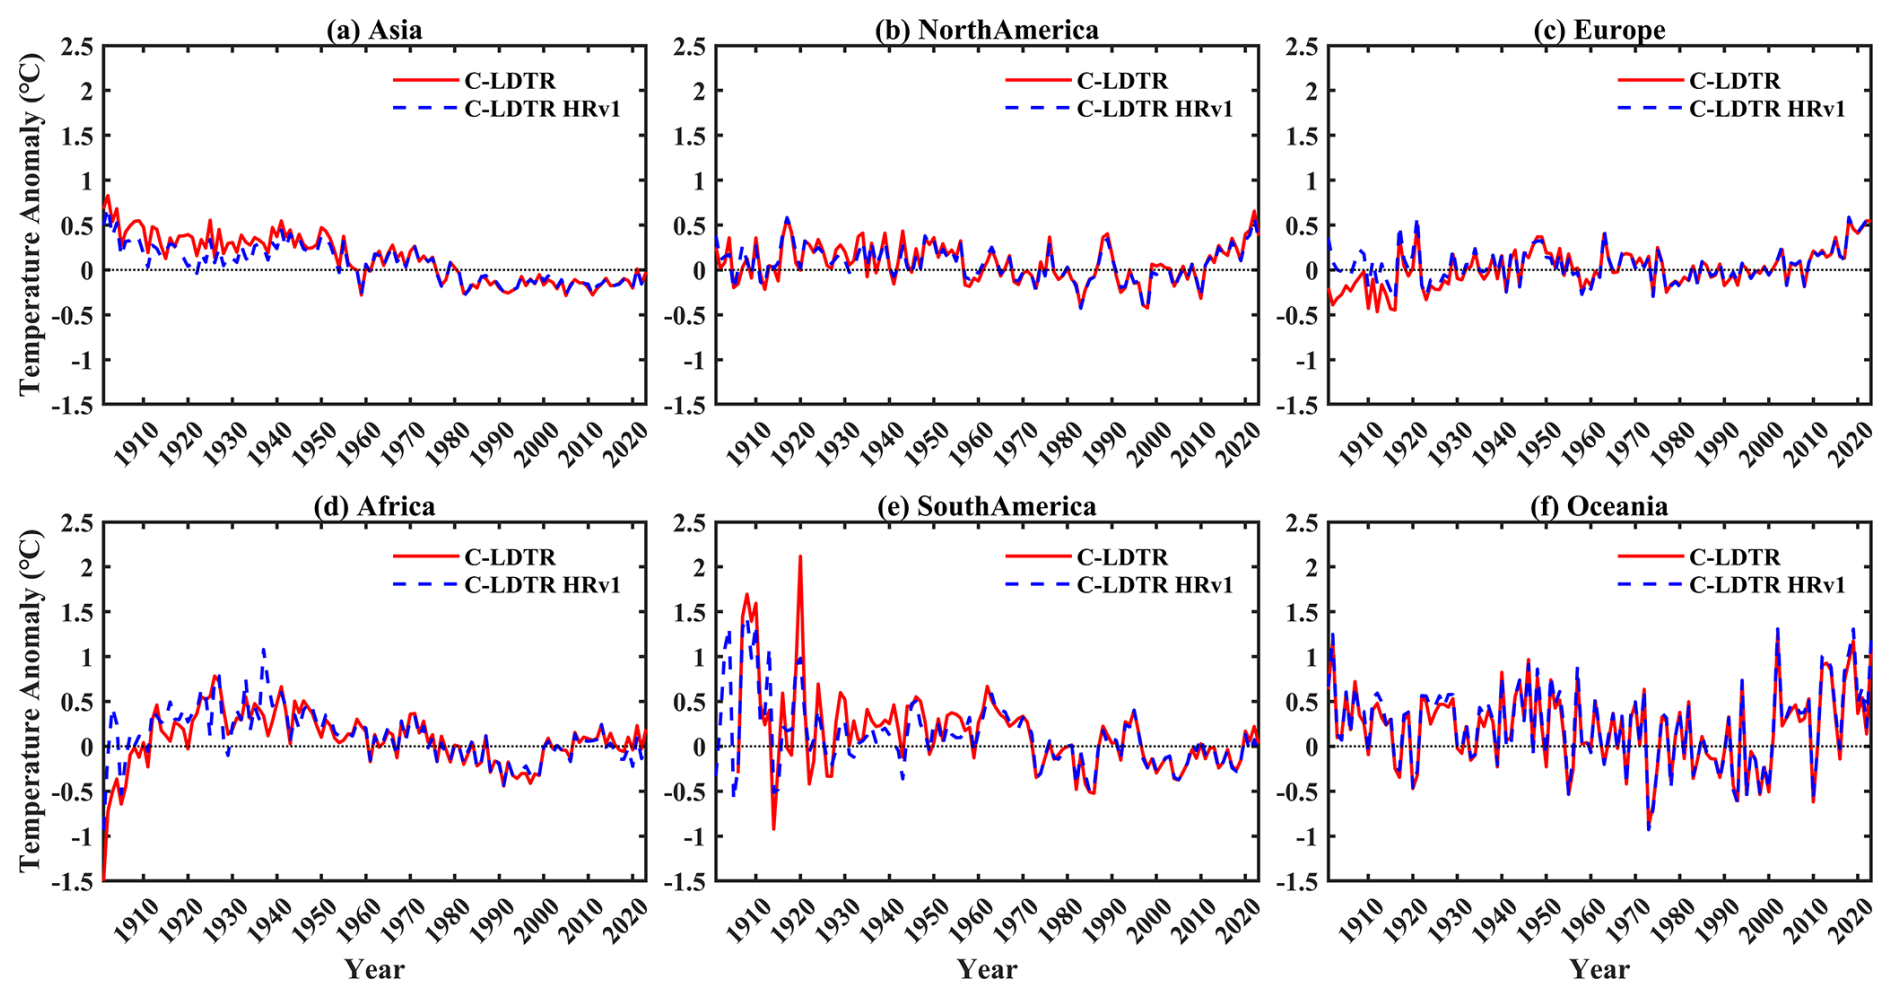
Figure 19The DTR anomalies for C-LDTR HRv1 and C-LDTR on different continents from 1901 to 2023.
The C-LSAT 2.1 dataset is publicly available on the website at https://doi.org/10.6084/m9.figshare.28255394.v1 (Wei et al., 2025a). C-LSAT HRv1 can be downloaded at https://doi.org/10.6084/m9.figshare.28255505.v2 (Wei et al., 2025c). C-LDTR HRv1 can be downloaded at https://doi.org/10.6084/m9.figshare.28255568.v2 (Wei et al., 2025b). They can also be accessed at http://www.gwpu.net (last access: 11 July 2025) for free.
This study provides a comprehensive overview of the updates made to the C-LSAT 2.1 station data and grid data (5°×5°). On this basis, the high-resolution (0.5°×0.5°) LSAT (C-LSAT HRv1) and DTR (C-LDTR HRv1) datasets are developed. The key characteristics of the C-LSAT 2.1 station data and the C-LSAT 2.1, C-LSAT HRv1, and C-LDTR HRv1 datasets are summarized below:
-
C-LSAT 2.1 station data supplemented and integrated meteorological observational data from various sources, resulting in a substantial enhancement in global station coverage. After filtering based on the reference period (1961–1990), the number of stations for LSAT and DTR is 13 746 and 11 900, respectively. The number of stations peaks in the 1970–1980s, followed by a slight decline.
-
The updated station data were utilized for gridded interpolation and EOT reconstruction (C-LSAT 2.1). Compared to the 2.0 version, the LSAT change trends at global and hemispheric scales exhibit no significant change in C-LSAT 2.1.
-
The results of comparative analysis of C-LSAT HRv1 with other LSAT datasets show minor discrepancies in the period from 1901 to 1950, but the trends thereafter demonstrate strong coherence. During the climatology period (1961–1990), the highest LSAT values in C-LSAT HRv1 are 20.3 °C (July) for the globe, 21.3 °C (July) for the Northern Hemisphere, and 24.6 °C (January) for the Southern Hemisphere. The lowest LSAT values are 5.3 °C (January), −1.4 °C (January), and 17.4 °C (July) for the globe, Northern Hemisphere, and Southern Hemisphere. The 1901–2023 warming rates for C-LSAT HRv1 are globally, for the Northern Hemisphere, and for the Southern Hemisphere.
-
The C-LDTR HRv1 dataset differs from other DTR datasets before 1950 and after 2010, especially for the Southern Hemisphere. The monthly variation in the DTR during the climatology period differs significantly from that of LSAT, with the highest DTR reaching 11.9 °C (April) globally, 12.2 °C (March) for the Northern Hemisphere, and 13.0 °C (August) for the Southern Hemisphere, whereas the lowest values are 10.9 °C (December) globally, 10.7 °C (November) for the Northern Hemisphere, and 11.0 °C (February) for the Southern Hemisphere. Over 1901–2023, the C-LDTR HRv1 shows change rates of globally, for the Northern Hemisphere, and for the Southern Hemisphere.
Overall, C-LSAT HRv1 exhibits high consistency with established LSAT datasets. In contrast, the differences observed in C-LDTR HRv1 are primarily due to limited station availability in the early period and a reduction in Tmax and/or Tmin data in recent years.
The supplement related to this article is available online at https://doi.org/10.5194/essd-17-4985-2025-supplement.
SW: conceptualization, data curation, formal analysis, investigation, methodology, resources, software, validation, visualization, writing (original draft preparation; review and editing). QL: conceptualization, funding acquisition, investigation, methodology, project administration, resources, software, supervision, writing (review and editing). QX: data curation, formal analysis, resources, visualization. ZL: data curation, formal analysis, resources. HZ: resources, validation. JL: resources, validation.
At least one of the (co-)authors is a member of the editorial board of Earth System Science Data. The peer-review process was guided by an independent editor, and the authors also have no other competing interests to declare.
Publisher's note: Copernicus Publications remains neutral with regard to jurisdictional claims made in the text, published maps, institutional affiliations, or any other geographical representation in this paper. While Copernicus Publications makes every effort to include appropriate place names, the final responsibility lies with the authors.
We thank the two reviewers for their constructive comments and detailed suggestions, which have substantially improved the clarity and quality of this paper.
This research has been supported by the National Natural Science Foundation of China (grant no. 42375022) and the National Key Research and Development Program of China (grant no. 2023YFC3008002).
This paper was edited by Chunlüe Zhou and reviewed by Zengyun Hu and one anonymous referee.
Beck, H. E., Zimmermann, N. E., McVicar, T. R., Vergopolan, N., Berg, A., and Wood, E. F.: Present and future Köppen-Geiger climate classification maps at 1 km resolution, Sci. Data, 5, 180214, https://doi.org/10.1038/sdata.2018.214, 2018.
Caesar, J., Alexander, L., and Vose, R.: Large-scale changes in observed daily maximum and minimum temperatures: Creation and analysis of a new gridded data set, J. Geophys. Res.-Atmos., 111, https://doi.org/10.1029/2005JD006280, 2006.
Cheng, J., Li, Q., Chao, L., Maity, S., Huang, B., and Jones, P.: Development of High Resolution and Homogenized Gridded Land Surface Air Temperature Data: A Case Study Over Pan-East Asia, Front. Environ. Sci., 8, https://doi.org/10.3389/fenvs.2020.588570, 2020.
Cressie, N.: The origins of kriging, Math. Geol., 22, 239–252, https://doi.org/10.1007/BF00889887, 1990.
Daly, C., Neilson, R. P., and Phillips, D. L.: A Statistical-Topographic Model for Mapping Climatological Precipitation over Mountainous Terrain, J. Appl. Meteorol. Clim., 33, 140–158, https://doi.org/10.1175/1520-0450(1994)033<0140:ASTMFM>2.0.CO;2, 1994.
Dunn, R. J. H., Herold, N., Alexander, L. V., Donat, M. G., Allan, R., Bador, M., Brunet, M., Cheng, V., Ibadullah, W. M. W., Ibrahim, M. K. I. B., Kruger, A., Kubota, H., Lippmann, T. J. R., Marengo, J., Mbatha, S., McGree, S., Ngwenya, S., Pabon Caicedo, J. D., Ramos, A., Salinger, J., van der Schrier, G., Srivastava, A., Trewin, B., Yáñez, R. V., Vazquez-Aguirre, J., Jiménez, C. V., Vose, R., Yussof, M. N. B. H., and Zhang, X.: Observed Global Changes in Sector-Relevant Climate Extremes Indices – An Extension to HadEX3, Earth Space Sci., 11, e2023EA003279, https://doi.org/10.1029/2023EA003279, 2024.
Eccel, E., Cau, P., and Ranzi, R.: Data reconstruction and homogenization for reducing uncertainties in high-resolution climate analysis in Alpine regions, Theor. Appl. Climatol., 110, 345–358, https://doi.org/10.1007/s00704-012-0624-z, 2012.
Fick, S. and Hijmans, R.: WorldClim 2: New 1 km spatial resolution climate surfaces for global land areas, Int. J. Climatol., 37, https://doi.org/10.1002/joc.5086, 2017.
Harris, I., Jones, P. D., Osborn, T. J., and Lister, D. H.: Updated high-resolution grids of monthly climatic observations – the CRU TS3.10 Dataset, Int. J. Climatol., 34, 623–642, https://doi.org/10.1002/joc.3711, 2014.
Harris, I., Osborn, T. J., Jones, P., and Lister, D.: Version 4 of the CRU TS monthly high-resolution gridded multivariate climate dataset, Sci. Data, 7, 109, https://doi.org/10.1038/s41597-020-0453-3, 2020.
Haylock, M. R., Hofstra, N., Tank, A. M. G. K., Klok, E. J., Jones, P. D., and New, M.: A European daily high-resolution gridded data set of surface temperature and precipitation for 1950–2006, J. Geophys. Res.-Atmos., 113, https://doi.org/10.1029/2008JD010201, 2008.
Hu, Z., Chen, X., Zhou, Q., Chen, D., and Li, J.: DISO: A rethink of Taylor diagram, Int. J. Climatol., 39, 2825–2832, https://doi.org/10.1002/joc.5972, 2019.
Hu, Z., Chen, D., Chen, X., Zhou, Q., Peng, Y., Li, J., and Sang, Y.: CCHZ-DISO: A Timely New Assessment System for Data Quality or Model Performance From Da Dao Zhi Jian, Geophys. Res. Lett., 49, e2022GL100681, https://doi.org/10.1029/2022GL100681, 2022.
Hutchinson, M. F.: The Application of Thin Plate Smoothing Splines to Continent-Wide Data Assimilation, Bur. Meteorol. Res. Rep., 27, 104–113, 1991.
Hutchinson, M. F.: Interpolating mean rainfall using thin plate smoothing splines, Int. J. Geogr. Inf. Syst., 9, 385–403, https://doi.org/10.1080/02693799508902045, 1995.
Hutchinson, M. F.: Interpolation of Rainfall Data with Thin Plate Smoothing Splines - Part I: Two Dimensional Smoothing of Data with Short Range Correlation, J. Geogr. Inf. Decis. Anal., 2, 153–167, 1998a.
Hutchinson, M. F.: Interpolation of rainfall data with thin plate smoothing splines: II. Analysis of topographic dependence, J. Geogr. Inf. Decis. Anal., 2, 168–185, 1998b.
Hutchinson, M. F. and Gessler, P. E.: Splines – more than just a smooth interpolator, Geoderma, 62, 45–67, https://doi.org/10.1016/0016-7061(94)90027-2, 1994.
IPCC: Climate Change 2007: The Physical Science Basis. Contribution of Working Group I to the Fourth Assessment Report of the Intergovernmental Panel on Climate Change, Cambridge University Press, Cambridge, United Kingdom and New York, NY, USA, 1007 pp., ISBN 9780521705967, 2007.
IPCC: Climate Change 2013: The Physical Science Basis. Contribution of Working Group I to the Fifth Assessment Report of the Intergovernmental Panel on Climate Change, Cambridge University Press, Cambridge, United Kingdom and New York, NY, USA, 1535 pp., https://doi.org/10.1017/CBO9781107415324, 2013.
IPCC: Climate Change 2021: The Physical Science Basis. Contribution of Working Group I to the Sixth Assessment Report of the Intergovernmental Panel on Climate Change, Cambridge University Press, Cambridge, United Kingdom and New York, NY, USA, 2391 pp., https://doi.org/10.1017/9781009157896, 2021.
Jiao, B., Su, Y., Li, Q., Manara, V., and Wild, M.: An integrated and homogenized global surface solar radiation dataset and its reconstruction based on a convolutional neural network approach, Earth Syst. Sci. Data, 15, 4519–4535, https://doi.org/10.5194/essd-15-4519-2023, 2023.
Jones, M. W., Peters, G. P., Gasser, T., Andrew, R. M., Schwingshackl, C., Gütschow, J., Houghton, R. A., Friedlingstein, P., Pongratz, J., and Le Quéré, C.: National contributions to climate change due to historical emissions of carbon dioxide, methane, and nitrous oxide since 1850, Sci. Data, 10, 155, https://doi.org/10.1038/s41597-023-02041-1, 2023.
Kalnay, E. and Cai, M.: Impact of urbanization and land-use change on climate, Nature, 423, 528–531, https://doi.org/10.1038/nature01675, 2003.
Karger, D. N., Conrad, O., Böhner, J., Kawohl, T., Kreft, H., Soria-Auza, R. W., Zimmermann, N. E., Linder, H. P., and Kessler, M.: Climatologies at high resolution for the earth's land surface areas, Sci. Data, 4, 170122, https://doi.org/10.1038/sdata.2017.122, 2017.
Kotlarski, S., Keuler, K., Christensen, O. B., Colette, A., Déqué, M., Gobiet, A., Goergen, K., Jacob, D., Lüthi, D., van Meijgaard, E., Nikulin, G., Schär, C., Teichmann, C., Vautard, R., Warrach-Sagi, K., and Wulfmeyer, V.: Regional climate modeling on European scales: a joint standard evaluation of the EURO-CORDEX RCM ensemble, Geosci. Model Dev., 7, 1297–1333, https://doi.org/10.5194/gmd-7-1297-2014, 2014.
Kumar, S., Amarnath, G., Ghosh, S., Park, E., Baghel, T., Wang, J., Pramanik, M., and Belbase, D.: Assessing the Performance of the Satellite-Based Precipitation Products (SPP) in the Data-Sparse Himalayan Terrain, Remote Sens., 14, 4810, https://doi.org/10.3390/rs14194810, 2022.
Lawrimore, J. H., Menne, M. J., Gleason, B. E., Williams, C. N., Wuertz, D. B., Vose, R. S., and Rennie, J.: An overview of the Global Historical Climatology Network monthly mean temperature data set, version 3, J. Geophys. Res.-Atmos., 116, https://doi.org/10.1029/2011JD016187, 2011.
Lenssen, N., Schmidt, G. A., Hendrickson, M., Jacobs, P., Menne, M., and Ruedy, R.: A GISTEMPv4 observational uncertainty ensemble, J. Geophys. Res.-Atmos., 129, e2023JD040179, https://doi.org/10.1029/2023JD040179, 2024.
Li, B., Liang, S., Ma, H., Dong, G., Liu, X., He, T., and Zhang, Y.: Generation of global 1 km all-weather instantaneous and daily mean land surface temperatures from MODIS data, Earth Syst. Sci. Data, 16, 3795–3819, https://doi.org/10.5194/essd-16-3795-2024, 2024a.
Li, Q.: China Merged Surface Temperature, PANGAEA [data set], https://doi.org/10.1594/PANGAEA.901295, 2019.
Li, Q., Zhang, L., Xu, W., Zhou, T., Wang, J., Zhai, P., and Jones, P.: Comparisons of Time Series of Annual Mean Surface Air Temperature for China since the 1900s: Observations, Model Simulations, and Extended Reanalysis, B. Am. Meteorol. Soc., 98, 699–711, https://doi.org/10.1175/BAMS-D-16-0092.1, 2017.
Li, Q., Dong, W., and Jones, P.: Continental scale surface air temperature variations: Experience derived from the Chinese region, Earth-Sci. Rev., 200, 102998, https://doi.org/10.1016/j.earscirev.2019.102998, 2020.
Li, Q., Sun, W., Yun, X., Huang, B., Dong, W., Wang, X. L., Zhai, P., and Jones, P.: An updated evaluation of the global mean land surface air temperature and surface temperature trends based on CLSAT and CMST, Clim. Dynam., 56, 635–650, https://doi.org/10.1007/s00382-020-05502-0, 2021.
Li, Z., Sun, W., Liang, C., Xing, X., and Li, Q.: Arctic warming trends and their uncertainties based on surface temperature reconstruction under different sea ice extent scenarios, Adv. Clim. Change Res., 14, 335–346, https://doi.org/10.1016/j.accre.2023.06.003, 2023.
Li, Z., Li, Q., and Chen, T.: Record-breaking High-temperature Outlook for 2023: An Assessment Based on the China Global Merged Temperature (CMST) Dataset, Adv. Atmos. Sci., 41, 369–376, https://doi.org/10.1007/s00376-023-3200-9, 2024b.
Loucks, D. P.: Chapter 2 - Impacts of climate change on economies, ecosystems, energy, environments, and human equity: A systems perspective, in: The Impacts of Climate Change, edited by: Letcher, T. M., Elsevier, 19–50, https://doi.org/10.1016/B978-0-12-822373-4.00016-1, 2021.
MacFerrin, M., Amante, C., Carignan, K., Love, M., and Lim, E.: The Earth Topography 2022 (ETOPO 2022) global DEM dataset, Earth Syst. Sci. Data, 17, 1835–1849, https://doi.org/10.5194/essd-17-1835-2025, 2025.
Menne, M. J., Williams, C. N., and Vose, R. S.: The U. S. Historical Climatology Network Monthly Temperature Data, Version 2, B. Am. Meteorol. Soc., 90, 993–1008, https://doi.org/10.1175/2008BAMS2613.1, 2009.
Menne, M. J., Durre, I., Vose, R. S., Gleason, B. E., and Houston, T. G.: An Overview of the Global Historical Climatology Network-Daily Database, J. Atmos. Ocean. Tech., 29, 897–910, https://doi.org/10.1175/JTECH-D-11-00103.1, 2012.
Menne, M. J., Williams, C. N., Gleason, B. E., Rennie, J. J., and Lawrimore, J. H.: The Global Historical Climatology Network Monthly Temperature Dataset, Version 4, J. Climate, 31, 9835–9854, https://doi.org/10.1175/JCLI-D-18-0094.1, 2018.
New, M., Hulme, M., and Jones, P.: Representing Twentieth-Century Space–Time Climate Variability. Part I: Development of a 1961–90 Mean Monthly Terrestrial Climatology, J. Climate, 12, 829–856, https://doi.org/10.1175/1520-0442(1999)012<0829:RTCSTC>2.0.CO;2, 1999.
New, M., Hulme, M., and Jones, P.: Representing Twentieth-Century Space–Time Climate Variability. Part II: Development of 1901–96 Monthly Grids of Terrestrial Surface Climate, J. Climate, 13, 2217–2238, https://doi.org/10.1175/1520-0442(2000)013<2217:RTCSTC>2.0.CO;2, 2000.
Osborn, T. J., Jones, P. D., Lister, D. H., Morice, C. P., Simpson, I. R., Winn, J. P., Hogan, E., and Harris, I. C.: Land Surface Air Temperature Variations Across the Globe Updated to 2019: The CRUTEM5 Data Set, J. Geophys. Res.-Atmos., 126, e2019JD032352, https://doi.org/10.1029/2019JD032352, 2021.
Peterson, T. C. and Easterling, D. R.: Creation of homogeneous composite climatological reference series, Int. J. Climatol., 14, 671–679, https://doi.org/10.1002/joc.3370140606, 1994.
Peterson, T. C., Easterling, D. R., Karl, T. R., Groisman, P., Nicholls, N., Plummer, N., Torok, S., Auer, I., Boehm, R., Gullett, D., Vincent, L., Heino, R., Tuomenvirta, H., Mestre, O., Szentimrey, T., Salinger, J., Førland, E. J., Hanssen-Bauer, I., Alexandersson, H., Jones, P., and Parker, D.: Homogeneity adjustments of in situ atmospheric climate data: a review, Int. J. Climatol., 18, 1493–1517, https://doi.org/10.1002/(SICI)1097-0088(19981115)18:13<1493::AID-JOC329>3.0.CO;2-T, 1998.
Rennie, J. J., Lawrimore, J. H., Gleason, B. E., Thorne, P. W., Morice, C. P., Menne, M. J., Williams, C. N., de Almeida, W. G., Christy, J. r., Flannery, M., Ishihara, M., Kamiguchi, K., Klein-Tank, A. M. G., Mhanda, A., Lister, D. H., Razuvaev, V., Renom, M., Rusticucci, M., Tandy, J., Worley, S. J., Venema, V., Angel, W., Brunet, M., Dattore, B., Diamond, H., Lazzara, M. A., Le Blancq, F., Luterbacher, J., Mächel, H., Revadekar, J., Vose, R. S., and Yin, X.: The international surface temperature initiative global land surface databank: monthly temperature data release description and methods, Geosci. Data J., 1, 75–102, https://doi.org/10.1002/gdj3.8, 2014.
Ribeiro, S., Caineta, J., and Costa, A. C.: Review and discussion of homogenisation methods for climate data, Phys. Chem. Earth Pt. A–C, 94, 167–179, https://doi.org/10.1016/j.pce.2015.08.007, 2016.
Rohde, R., Muller, R., Jacobsen, R., Perlmutter, S., and Mosher, S.: Berkeley Earth Temperature Averaging Process, Geoinformatics Geostat. Overv., 01, https://doi.org/10.4172/2327-4581.1000103, 2013.
Rohde, R. A. and Hausfather, Z.: The Berkeley Earth Land/Ocean Temperature Record, Earth Syst. Sci. Data, 12, 3469–3479, https://doi.org/10.5194/essd-12-3469-2020, 2020.
Schamm, K., Ziese, M., Becker, A., Finger, P., Meyer-Christoffer, A., Schneider, U., Schröder, M., and Stender, P.: Global gridded precipitation over land: a description of the new GPCC First Guess Daily product, Earth Syst. Sci. Data, 6, 49–60, https://doi.org/10.5194/essd-6-49-2014, 2014.
Sokol, Z., Szturc, J., Orellana-Alvear, J., Popová, J., Jurczyk, A., and Célleri, R.: The Role of Weather Radar in Rainfall Estimation and Its Application in Meteorological and Hydrological Modelling – A Review, Remote Sens., 13, 351, https://doi.org/10.3390/rs13030351, 2021.
Stjern, C. W., Samset, B. H., Boucher, O., Iversen, T., Lamarque, J.-F., Myhre, G., Shindell, D., and Takemura, T.: How aerosols and greenhouse gases influence the diurnal temperature range, Atmos. Chem. Phys., 20, 13467–13480, https://doi.org/10.5194/acp-20-13467-2020, 2020.
Sun, Q., Miao, C., Duan, Q., Ashouri, H., Sorooshian, S., and Hsu, K.-L.: A Review of Global Precipitation Data Sets: Data Sources, Estimation, and Intercomparisons, Rev. Geophys., 56, 79–107, https://doi.org/10.1002/2017RG000574, 2018.
Sun, W. and Li, Q.: China global Land Surface Air Temperature 2.0 during 1850–2020, figshare [data set], https://doi.org/10.6084/m9.figshare.16968334.v4, 2021a.
Sun, W. and Li, Q.: China global Merged surface temperature 2.0 during 1850–2020, figshare [data set], https://doi.org/10.6084/m9.figshare.16929427.v4, 2021b.
Sun, W., Li, Q., Huang, B., Cheng, J., Song, Z., Li, H., Dong, W., Zhai, P., and Jones, P.: The Assessment of Global Surface Temperature Change from 1850s: The C-LSAT2.0 Ensemble and the CMST-Interim Datasets, Adv. Atmos. Sci., 38, 875–888, https://doi.org/10.1007/s00376-021-1012-3, 2021c.
Sun, W., Yang, Y., Chao, L., Dong, W., Huang, B., Jones, P., and Li, Q.: Description of the China global Merged Surface Temperature version 2.0, Earth Syst. Sci. Data, 14, 1677–1693, https://doi.org/10.5194/essd-14-1677-2022, 2022.
Viviroli, D., Archer, D. R., Buytaert, W., Fowler, H. J., Greenwood, G. B., Hamlet, A. F., Huang, Y., Koboltschnig, G., Litaor, M. I., López-Moreno, J. I., Lorentz, S., Schädler, B., Schreier, H., Schwaiger, K., Vuille, M., and Woods, R.: Climate change and mountain water resources: overview and recommendations for research, management and policy, Hydrol. Earth Syst. Sci., 15, 471–504, https://doi.org/10.5194/hess-15-471-2011, 2011.
Wahba, G.: Spline Models for Observational Data, Society for Industrial and Applied Mathematics, https://doi.org/10.1137/1.9781611970128, 1990.
Wang, M., Wei, J., Wang, X., Luan, Q., and Xu, X.: Reconstruction of all-sky daily air temperature datasets with high accuracy in China from 2003 to 2022, Sci. Data, 11, 1133, https://doi.org/10.1038/s41597-024-03980-z, 2024.
Wang, X. L.: Accounting for Autocorrelation in Detecting Mean Shifts in Climate Data Series Using the Penalized Maximal t or F Test, J. Appl. Meteorol. Clim., 47, 2423–2444, https://doi.org/10.1175/2008JAMC1741.1, 2008a.
Wang, X. L.: Penalized Maximal F Test for Detecting Undocumented Mean Shift without Trend Change, J. Atmos. Ocean. Tech., 25, 368–384, https://doi.org/10.1175/2007JTECHA982.1, 2008b.
Wang, X. L. and Feng, Y.: RHtestsV4 user manual, Clim. Res. Div. Atmospheric Sci. Technol. Dir. Sci. Technol. Branch Environ. Can., 28, 780, 2013.
Wei, S., Li, Q., Xu, Q., Li, Z., Zhang, H., and Lin, J.: China global Land Surface Air Temperature 2.1 (C-LSAT 2.1), figshare [data set], https://doi.org/10.6084/m9.figshare.28255394.v1, 2025a.
Wei, S., Li, Q., Xu, Q., Li, Z., Zhang, H., and Lin, J.: High-Resolution China global Land Diurnal Temperature Range version 1 (C-LDTR HRv1), figshare [data set], https://doi.org/10.6084/m9.figshare.28255568.v2, 2025b.
Wei, S., Li, Q., Xu, Q., Li, Z., Zhang, H., and Lin, J.: High-Resolution China global Land Surface Air Temperature version 1 (C-LSAT HRv1), figshare [data set], https://doi.org/10.6084/m9.figshare.28255505.v2, 2025c.
Wu, J. and Gao, X.: A gridded daily observation dataset over China region and comparison with the other datasets, Chin. J. Geophys., 56, 1102–1111, https://doi.org/10.6038/cjg20130406, 2013.
Xu, Q., Wei, S., Li, Z., and Li, Q.: Data from the C-LSAT2.1 Dataset for the Paper: “A New Evaluation of Observed Changes in Diurnal Temperature Range,” figshare [data set], https://doi.org/10.6084/m9.figshare.28030196.v2, 2024.
Xu, Q., Wei, S., Li, Z., and Li, Q.: A New Evaluation of Observed Changes in Diurnal Temperature Range, Geophys. Res. Lett., 52, e2024GL113406, https://doi.org/10.1029/2024GL113406, 2025.
Xu, W., Li, Q., Wang, X. L., Yang, S., Cao, L., and Feng, Y.: Homogenization of Chinese daily surface air temperatures and analysis of trends in the extreme temperature indices, J. Geophys. Res.-Atmos., 118, 9708–9720, https://doi.org/10.1002/jgrd.50791, 2013.
Xu, W., Li, Q., Jones, P., Wang, X. L., Trewin, B., Yang, S., Zhu, C., Zhai, P., Wang, J., Vincent, L., Dai, A., Gao, Y., and Ding, Y.: A new integrated and homogenized global monthly land surface air temperature dataset for the period since 1900, Clim. Dynam., 50, 2513–2536, https://doi.org/10.1007/s00382-017-3755-1, 2018.
Yun, X., Huang, B., Cheng, J., Xu, W., Qiao, S., and Li, Q.: A new merge of global surface temperature datasets since the start of the 20th century, Earth Syst. Sci. Data, 11, 1629–1643, https://doi.org/10.5194/essd-11-1629-2019, 2019.
Zhao, B., Mao, K., Cai, Y., Shi, J., Li, Z., Qin, Z., Meng, X., Shen, X., and Guo, Z.: A combined Terra and Aqua MODIS land surface temperature and meteorological station data product for China from 2003 to 2017, Earth Syst. Sci. Data, 12, 2555–2577, https://doi.org/10.5194/essd-12-2555-2020, 2020.
Zhong, Z., He, B., Chen, H. W., Chen, D., Zhou, T., Dong, W., Xiao, C., Xie, S., Song, X., Guo, L., Ding, R., Zhang, L., Huang, L., Yuan, W., Hao, X., Ji, D., and Zhao, X.: Reversed asymmetric warming of sub-diurnal temperature over land during recent decades, Nat. Commun., 14, 7189, https://doi.org/10.1038/s41467-023-43007-6, 2023.
Zhou, Q., Chen, D., Hu, Z., and Chen, X.: Decompositions of Taylor diagram and DISO performance criteria, Int. J. Climatol., 41, 5726–5732, https://doi.org/10.1002/joc.7149, 2021.
- Abstract
- Introduction
- Updates and pre-processing of C-LSAT 2.1 station data
- Updates to C-LSAT 2.1
- Development of C-LSAT HRv1 and C-LDTR HRv1
- Spatiotemporal analysis of global LSAT and DTR
- Data availability
- Conclusions
- Author contributions
- Competing interests
- Disclaimer
- Acknowledgements
- Financial support
- Review statement
- References
- Supplement