the Creative Commons Attribution 4.0 License.
the Creative Commons Attribution 4.0 License.
 | 26 Sep 2025
Hydrodynamic and atmospheric conditions in a volcanic caldera: a comprehensive dataset at Deception Island, Antarctica
Francesco Ferrari
Alejandro López-Ruiz
Andrea Lira-Loarca
Marine spatial planning and environmental management in Antarctica require reliable data to address challenges such as climate change impacts, sea level changes, and the dynamics of fragile ecosystems. Deception Island, a volcanic caldera in the South Shetland Islands, presents unique hydrodynamic conditions influenced by extreme weather, glacial melt, and its complex geomorphology. To improve understanding of these processes, we present an open-access, integrated dataset spanning 16 years, from 2005 until 2020, combining high-resolution atmospheric and hydrodynamic variables. Atmospheric modelling was done with the Weather Research and Forecasting (WRF) model leading to data in a 1 km grid and 35 vertical levels covering the island. The atmospheric dataset includes a total of 161 variables including wind fields, precipitation, and pressure among others, at hourly resolution that have been validated against data provided by an in situ weather station.
Hydrodynamical and wave propagation modelling was performed with Delft3D (2DH) on different grids with a maximum resolution of 15×25 m2 for hydrodynamic and 220×160 m2 for wave propagation results. This dataset provides high-resolution temporal and spatial data including sea surface elevation, current velocities, significant wave height, wave direction, and wind pressure, at daily intervals across the grid and hourly at five observation points. In addition to standard conditions, the dataset captures spatial, seasonal, and temporal variability as well as extreme events, providing unprecedented insight into the island's dynamics.
By incorporating long-term high-resolution atmospheric reanalysis and hydrodynamic simulations, this dataset fills critical knowledge gaps in the hydrodynamic behaviour of Deception Island and provides a valuable tool for stakeholders in research, environmental monitoring, and climate change adaptation. Applications range from analysing glacial melt contributions and nutrient transport to modelling ecosystem interactions and assessing the effects of extreme weather events. The atmospheric (https://doi.org/10.5281/zenodo.14845212, Ferrari and Lira-Loarca, 2025) and hydrodynamics and wave climate (https://doi.org/10.5281/zenodo.14870881, Zarzuelo et al., 2025) comprehensive data collections advance our understanding of Antarctic coastal systems and support broader efforts to predict and mitigate the effects of global climate change on polar environments.
- Article
(10313 KB) - Full-text XML
- BibTeX
- EndNote


Deception Island is a unique Antarctic environment characterized by complex hydrodynamics, volcanic activity, and extreme meteorological conditions. Despite its importance, detailed long-term hydrodynamic studies remain limited, particularly regarding the role of extreme events in shaping its coastal and sedimentary dynamics. This study presents a high-resolution dataset integrating atmospheric simulations using the Weather Research and Forecasting (WRF) model with hydrodynamic simulations using Delft3D (2DH). By providing long-term spatial, seasonal, and extreme event analyses, this work allows a better understanding of the island's response to ocean-atmosphere interactions.
The paucity of detailed hydrodynamic data underscores critical knowledge gaps in the understanding of Deception Island's environmental processes, particularly their interactions with atmospheric, geological, and ecological factors. The integration of the WRF atmospheric model and data, with their unprecedented temporal and spatial resolution, provides new insights into the long-term trends and extreme events that shape the hydrodynamics of this region. This work builds on and complements previous studies, such as Baldwin and Smith Jr (2003) and Flexas et al. (2017), which analysed sediment transport and coastal dynamics, and Geyer et al. (2021), which investigated the contribution of glacial melt to local hydrodynamics. In addition, Jigena et al. (2015) highlighted the role of guano-derived nutrient enrichment in Antarctic ecosystems, and Torrecillas et al. (2024) provided broader insights into polar hydrodynamics, which can now be further contextualized using the presented dataset.
The use of physically based numerical modelling, supported by wind speed and pressure fields from the WRF atmospheric model, and wave boundary conditions from the EU Copernicus Marine Service, provide a robust approach to studying the hydrodynamics of the island. The dataset allows detailed analyses of wind, wave, and atmospheric pressure variability on hydrodynamic processes and provides a basis for scenario testing under extreme events or climate-induced changes. In addition, this work facilitates interdisciplinary research by linking hydrodynamics with sediment transport, nutrient cycling, and ecosystem dynamics.
By addressing significant knowledge gaps, this dataset provides an innovative resource for advancing understanding of the hydrodynamics of Deception Island and contributes to broader studies of Antarctic coastal and marine systems. Future applications include assessing the effects of glacial melt on sediment and nutrient transport, analysing water quality dynamics, and evaluating ecosystem responses to environmental and climate change. This work demonstrates the usefulness of integrating long-term atmospheric reconstructions and high-resolution hydrodynamic modelling to improve the predictive power of models and promotes a deeper understanding of the interconnected processes that shape the Deception Island environment.
Deception Island is a volcanic caldera in the South Shetland Islands off the Antarctic Peninsula that forms one of the world's most unique natural harbours (Fig. 1). The horseshoe shaped caldera of the island, which is approximately 12 km in diameter, contains a bay known as Port Foster. This harbour, with an average depth of 100–180 m, serves as a well-protected and ice-free harbour, ideal for maritime operations in the otherwise challenging Antarctic waters (Orheim, 1982; Smellie et al., 2002). The island is characterized by a cold polar climate, with temperatures ranging from −10 to 3 °C, and a landscape dominated by volcanic ash, lava flows, and glacial remnants (Birkenmajer, 1992).
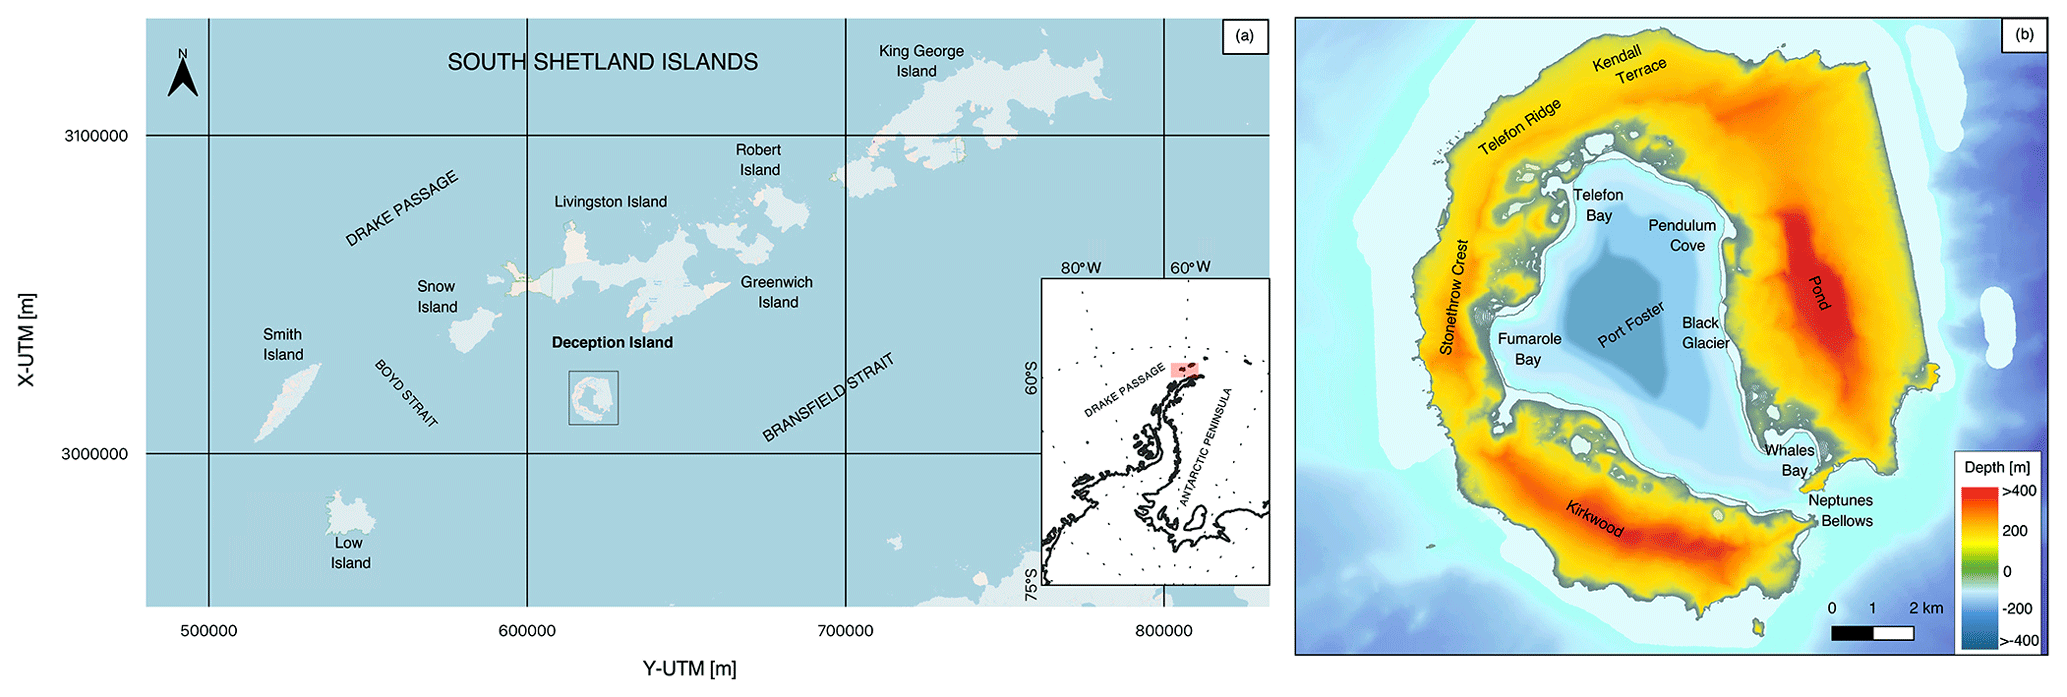
Figure 1Location and topo-bathymetry of Deception Island, Antarctica.
The volcanic history of the island has resulted in an active geothermal environment, particularly along the south-western coastline near Whalers Bay. Here the shallow waters are often warmed by volcanic heat, creating fumaroles, warm beaches, and occasionally steam rising from the shores. The caldera has erupted several times in recorded history, with notable eruptions in 1967, 1969, and 1970, which significantly altered the island's topography and affected the scientific bases stationed there (Baker et al., 1975; Smellie, 2001). As a results, Deception Island's unique geological and environmental conditions support a limited but specialized ecosystem. The coastal areas support diverse seabird colonies, including Antarctic terns, skuas, and chinstrap penguins, while the surrounding waters support seals and whales (Angulo-Preckler et al., 2021). The island's geothermal activity also supports the growth of certain thermophilic microorganisms in areas of active fumaroles (Herbold et al., 2014).
Human presence on Deception Island has largely been driven by scientific research and tourism. The island was once home to a whaling station at Whalers Bay, which has since been abandoned, but remnants of the station remain as historical artefacts. In recent decades, Deception Island has become an important site for Antarctic research, with its caldera serving as a natural laboratory for studying volcanology, oceanographic dynamics, and the effects of climate change on Antarctic ecosystems (Smellie, 2001; Convey and Peck, 2019).
Port Foster can be divided into distinct zones based on bathymetry and exposure to volcanic activity. The inner basin of Port Foster reaches depths exceeding 100 m, with some areas approaching 180 m, as also depicted in Fig. 1. This relatively deep and enclosed environment plays a key role in modulating internal circulation and wave attenuation. The outer caldera rim, with cliffs rising to 540 m, encloses the bay and protects it from the harsh winds and waves of the Southern Ocean. The inner bay, approximately 9 km in diameter, is connected to the open ocean by a narrow passage called Neptune's Bellows, which is 230 m wide and only 15 m deep (Smellie et al., 2002; Flexas et al., 2017). This narrow passage amplifies tidal currents, which can reach up to 1.54 m s−1, creating strong currents as water is exchanged between the caldera and the surrounding ocean (Flexas et al., 2017). The wind regime at Deception Island is dominated by strong westerly winds, which can exceed 20 m s−1 during storms. These winds generate waves that typically range from 1 to 2 m within Port Foster, but waves from the Southern Ocean entering through Neptune's Bellows can reach heights of 3 m (Figueiredo et al., 2018). These wave patterns, together with tidal influences, make the entrance challenging for ships, especially in rough weather conditions. Water levels in Port Foster are influenced by both tidal and atmospheric pressure changes. The tidal range is typically between 1 and 2 m, but can increase during storm surges, particularly when low pressure systems pass through the area (Flexas et al., 2017). The combination of wind-driven waves, tidal surges, and currents results in dynamic water conditions, particularly along the eastern and northern coasts of the island.
This study presents a comprehensive data of atmospheric and hydrodynamic conditions produced using the WRF model and Delft3D, respectively (Ferrari and Lira-Loarca, 2025; Zarzuelo et al., 2025). The WRF atmospheric model was forced using ERA-5 reanalysis whereas Delft3D was forced using the wind and pressure fields from WRF dynamical downscaling and wave data from the Copernicus Marine Service. This section presents the details on the forcing data used throughout the modelling chain and the description, set-up, calibration, and validation of the atmospheric and hydrodynamics simulations.
3.1 Forcing data
3.1.1 ERA5
Initial and boundary conditions needed to create the atmospheric high-resolution hindcast dataset were taken from the European Centre for Medium-Range Weather Forecasts (ECMWF) Reanalysis, version 5 (ERA5). ERA5 is the fifth-generation, state-of-the-art, atmospheric reanalysis of the global climate, covering the period from January 1950 to the present. It is produced by the Copernicus Climate Change Service (C3S) at the ECMWF. ERA5 provides hourly estimates for a wide range of atmospheric, land, and oceanic climate variables. The dataset covers the entire Earth on a 30 km resolution grid and models the atmosphere with 137 vertical levels, extending from the surface up to a height of 80 km (Hersbach et al., 2020). The ERA5 new reanalysis replaces the ERA-Interim reanalysis, which spanned from 1979 onwards and began in 2006. ERA5 is based on the Integrated Forecasting System (IFS) Cy41r2, that has been operational since 2016, resulting in a decade of advancements in model physics, core dynamics, and data assimilation. Furthermore, ERA5 spatial resolution has been significantly improved with respect to 80 km horizontal resolution of the ERA-Interim products (Hersbach et al., 2020).
3.1.2 Global ocean waves reanalysis
The wave forcing for the hydrodynamic model was obtained from the Global Ocean Waves Reanalysis provided by the EU CMEMS (2024) – Product ID: GLOBAL_REANALYSIS_WAV_001_032. This dataset offers a high-resolution reanalysis of global ocean wave conditions since 1980, assimilating altimeter wave observations into the wave model from 2017 onwards. The dataset also provides wave parameters such as significant wave height, mean and peak wave period, and mean wave direction with 0.2° spatial resolution and 3 h temporal resolution. The dataset ensures consistency with historical observations and is widely used for ocean modelling applications, coastal engineering studies, and climate variability assessments.
3.2 Atmospheric modelling
3.2.1 Model description and set-up
To accurately describe the weather evolution on Deception Island, and specifically to precisely depict the wind and pressure fields within the island bay, which are necessary to initialize the hydrodynamic models used in this study, the ERA5 data are not optimal. The island, in fact, has an extension of approximately 10 km both in the north–south and east-west directions, which is too small for its interaction with the atmosphere to be accurately represented in the ERA5 reanalysis, as this has a resolution of approximately 30 km. A dynamic downscaling of the ERA5 reanalysis was therefore performed to produce a high-resolution hindcast of the area under study, accounting for small-scale atmospheric interactions both with Deception Island and the surrounding lands. To dynamically downscale ERA5 reanalysis the WRF model, Version 4.3.3, was adopted. The WRF model is a fully compressible non-hydrostatic, primitive-equation model with multiple nesting capabilities. The WRF model represents the state of the art in numerical modelling of the atmosphere and a comprehensive description of the model formulation is given in Skamarock (2008).
To describe in detail the atmospheric evolution around Deception Island, two nested computational domains were defined, respectively covering the northernmost part of the Antarctic Peninsula with a horizontal resolution of 5.0 km, and the South Shetland Islands with a grid spacing of 1.0 km. Exact extension, localization, and topography of the two domains are reported in Fig. 2. The number of terrain-following vertical levels adopted was 35 for both domains, with higher resolution close to the surface. In Fig. 2, the highlighted inlet does not represent a computational domain, but the area where the results will be made publicly available.
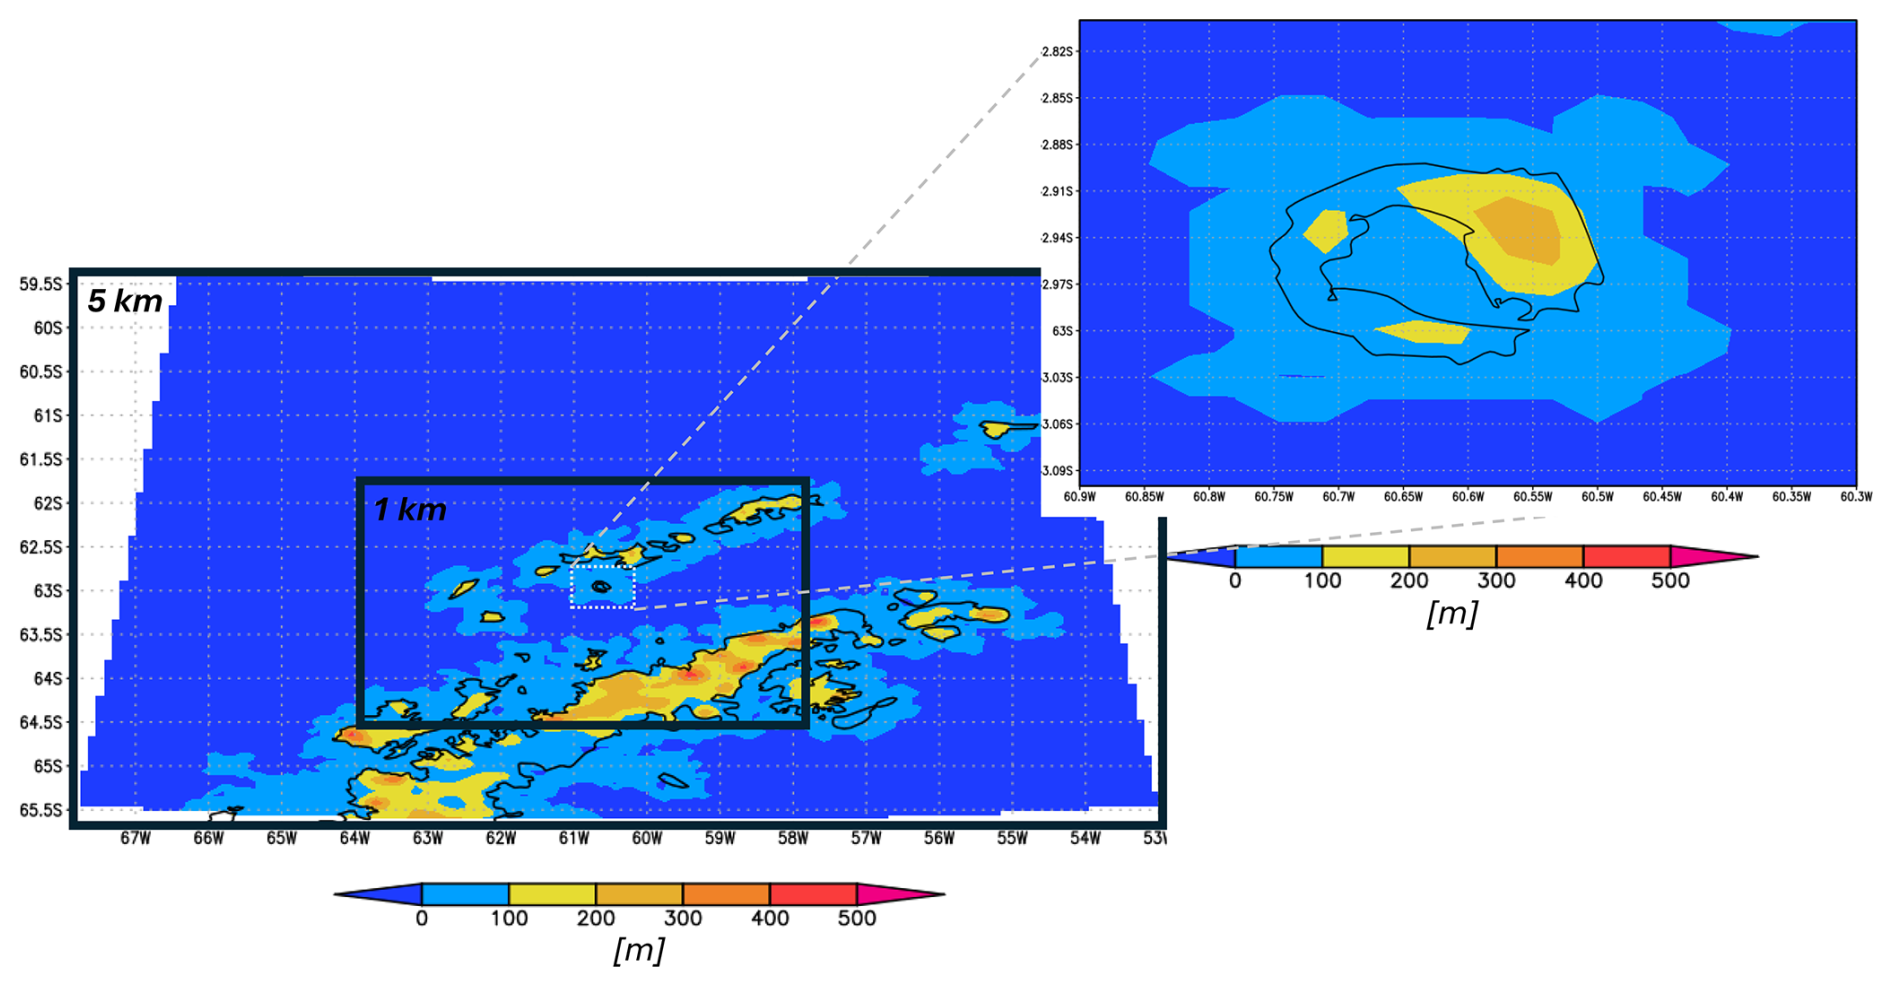
Figure 2Extension, localization and topography (shaded contours, [m]) of the two WRF nested domains. Resolution varies from 5 km for the outermost domain, to 1 km for the innermost. The highlighted-inlet (dashed white box) does not represent another computational domain, but the area where the results will be made publicly available. The white cross in the inlet represents the location of the Gabriel de Castilla (GdC) meteorological station.
To describe the effects that unresolved sub-grid phenomena have on resolved variables, several parameterizations are available in WRF. For the present work, we adopted a model configuration quite similar to that described in Xue et al. (2022), where an assessment of the WRF simulation reliability in the Antarctic region is performed. In particular, for both long- and short-wave radiation the Rapid Radiation Transfer Model (RRTM) scheme was selected (Clough et al., 2005). The Mellor–Yamada–Nakanishi–Niino (MYNN) 2.5-level scheme (Nakanishi and Niino, 2006) was selected to parametrize the planetary boundary layer (PBL) as well as the MYNN scheme for the surface layer (SL) (Olson et al., 2021). The unified Noah land surface model was adopted to describe land-surface processes. Regarding the cloud microphysics parameterization, Thompson microphysics (Thompson et al., 2004), a well-known and widely tested two-moment bulk scheme, considering all six hydrometeors, was chosen (Cassola et al., 2015). Finally, convection was explicitly resolved over the higher-resolution domains, while the Grell–Freitas cumulus parameterization scheme (Grell and Freitas, 2014) was adopted for the 5 km resolution domain.
The WRF simulations cover the period from 1 January 2005 until 31 December 2022 providing 24 h-long runs that were initialized at 00:00 UTC of each day from ERA5 data, while boundary conditions where imposed every 3 h.
3.2.2 Model validation
The validation of the atmospheric downscaling modelling was carried out by comparing its outputs with observational data from the Spanish State Meteorological Agency (AEMET) meteorological station at the Gabriel de Castilla (GdC) station located in Deception Island (60°40′31′′ W, 62°58′38′′ S, white cross in the inlet of Fig. 2) at an elevation of 13 m above sea level and active since February 2005. This location provided a reliable source of in situ measurements of weather variables, allowing for a robust evaluation of the performance of WRF data. More specifically, we compared wind speed (WRF: 10 m wind speed), wind gusts, temperature (WRF: 2 m temperature), pressure, relative humidity, and precipitation between the GdC station and the closest WRF model point at 4.5 m above MSL from 5 February 2005 until 31 December 2022. Figure 3 presents the bivariate density function as well as the correlation coefficient (R), bias, and the root-mean-square deviation for all the analysed variables. For the precipitation, the comparison was done for the data limited to temperatures over 1° and daily-accumulated precipitation over 1 mm. The comparison revealed that the WRF model captured the general trends observed in the data, with correlation coefficients ranging from R=0.43 and R=0.57 for the precipitation and relative humidity, respectively, to R=0.86 and R=0.99 for the temperature and pressure, respectively. The comparison demonstrated the accuracy of the dataset in representing real-world conditions at Deception Island. The lower correlation values for precipitation could be due inaccurate measurement of the rain gauge in case of solid precipitation, related to the mechanical characteristics of the rain gauge, and/or to the dynamic interactions between snow, winds, and gauge that lead to possible differences, in certain cases, between observations and model.
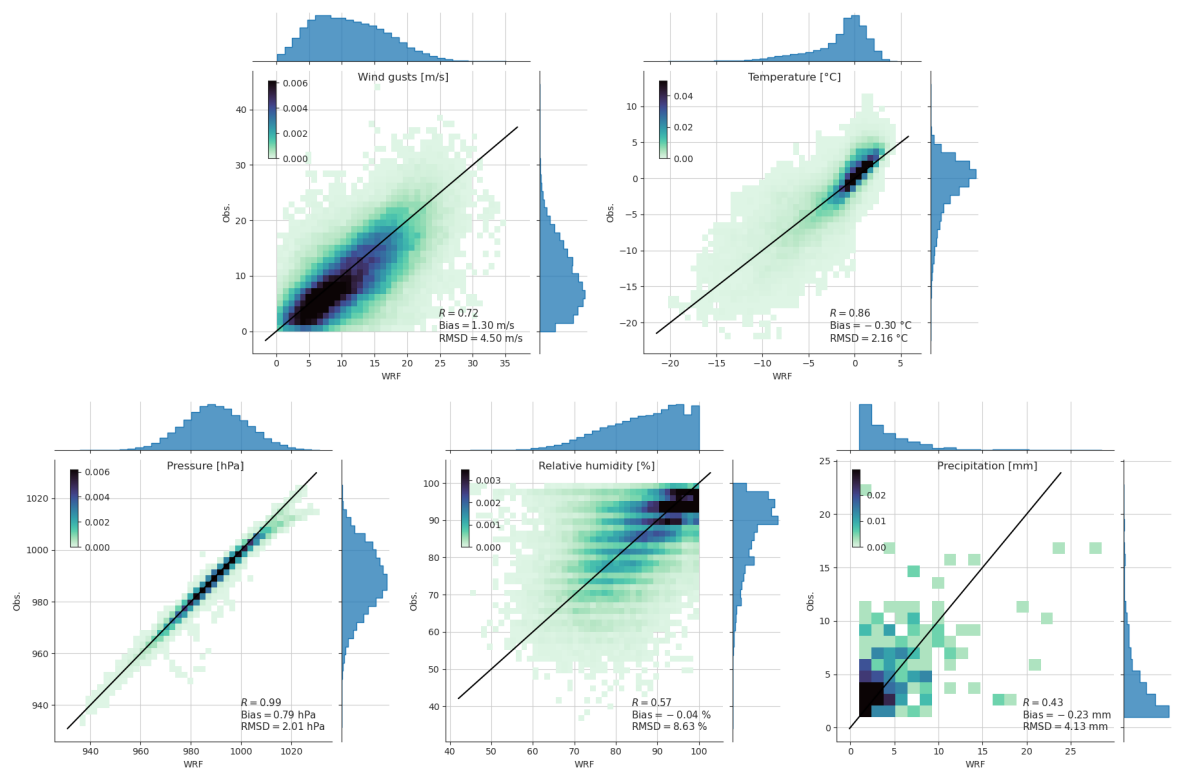
Figure 3Comparison between the WRF model outputs and the observations from the AEMET GdC meteo station for wind speed, wind gusts, temperature, pressure, relative humidity and precipitation.
3.3 Hydrodynamic modelling
3.3.1 Model description
Delft3D is a widely used numerical modelling system for simulating hydrodynamic, sediment transport, and morphodynamic processes in coastal, estuarine, and riverine environments. Developed by Deltares, the model consists of several interlinked modules, each capable of handling specific physical processes. Among them, modules Flow and Wave were used in this work to obtain wind, pressure, tidal, and wave generated hydrodynamics. In this study, the depth-averaged version of the flow was applied to simulate the hydrodynamic conditions at Deception Island.
The Delft3D-Flow module is designed to simulate hydrodynamic processes, including currents, water levels, and transport phenomena driven by tidal forces, winds, and density gradients. It solves the unsteady, depth-averaged or fully three-dimensional (3D) forms of the Navier–Stokes equations, under the shallow water assumption, for free surface flows. The governing equations can be expressed as continuity and momentum equations, shown, respectively, as follows:
where h is the water depth and u is the horizontal velocity vector (u, v);
where u and v are the depth-averaged velocity components in the x- and y-directions, respectively; p is the pressure; f is the Coriolis parameter; τx and τy are the wind stress components in the x- and y-directions, respectively; Rx and Ry are the diffusion and dispersion terms in the x- and y-directions, respectively; and Mx and My represent contributions due to external sources or sinks of momentum, such as wind action on the water surface or wave action in the water column. The model incorporates various turbulence closure schemes such as the k–ε model, which helps in capturing vertical mixing and turbulent energy dissipation (Rodi, 2017). Delft3D-Flow is commonly applied in coastal engineering studies to analyse storm surges, tidal dynamics, riverine flows, and long-term morphological evolution (Lesser et al., 2004; Zarzuelo et al., 2021).
The Delft3D-WAVE module is based on the SWAN (Simulating WAves Nearshore) model, which computes the transformation of surface waves as they travel across the coastal region. It simulates processes such as wave generation by wind, wave propagation, refraction generated by depth variations and currents, diffraction, and nonlinear wave–wave interactions. The core equation used by Delft3D-Wave is the spectral action balance equation, which is defined in terms of wave action density N(σ,θ), where σ is the relative frequency, and θ is the wave direction. The equation is
where is the wave action density (with E being the wave energy density); cg is the group velocity of the waves; and represent the rate of change in wave frequency and direction, respectively; and Sin and Sout are source and sink terms representing processes such as wind input, wave breaking, bottom friction, and whitecapping (Booij et al., 1999).
The coupling between Delft3D-Flow and Delft3D-Wave allows for two-way interaction between hydrodynamic flows and waves. The wave module provides radiation stress gradients, that are included in the momentum conservation equation (Eqs. 2 and 3) for wave-driven currents and water level variations (wave set-up), while the hydrodynamic module provides the water levels and current velocities required by the wave model to compute wave propagation and transformation. The coupled system is essential for modelling complex coastal dynamics, where wave-induced currents significantly influence sediment transport and morphological changes, particularly in shallow water environments (Lesser et al., 2004; Holthuijsen, 2010).
3.3.2 Model set-up and calibration
The flow model domain was defined as a computational curvilinear grid (blue – Fig. 4), with a total of 314×464 cells and a maximum resolution of 15×25 m2 within Deception Island. The wave model has two nested grids: a coarse resolution and a fine-resolution. The fine mesh is defined as above but with more cells, 316×488 (green – Fig. 4), and the coarse mesh has a resolution of 220×160 m2 with a total of 95×88 cells (red – Fig. 4). Both offshore and Deception Island bathymetry data were provided by the Instituto Hidrográfico de la Marina (Spanish Ministry of Defence) with a resolution of 10×10 m2. The topography was obtained from Instituto Geográfico Nacional (Spanish Ministry of Transport, Mobility and Urban Agenda) with a resolution of 5×5 m2.
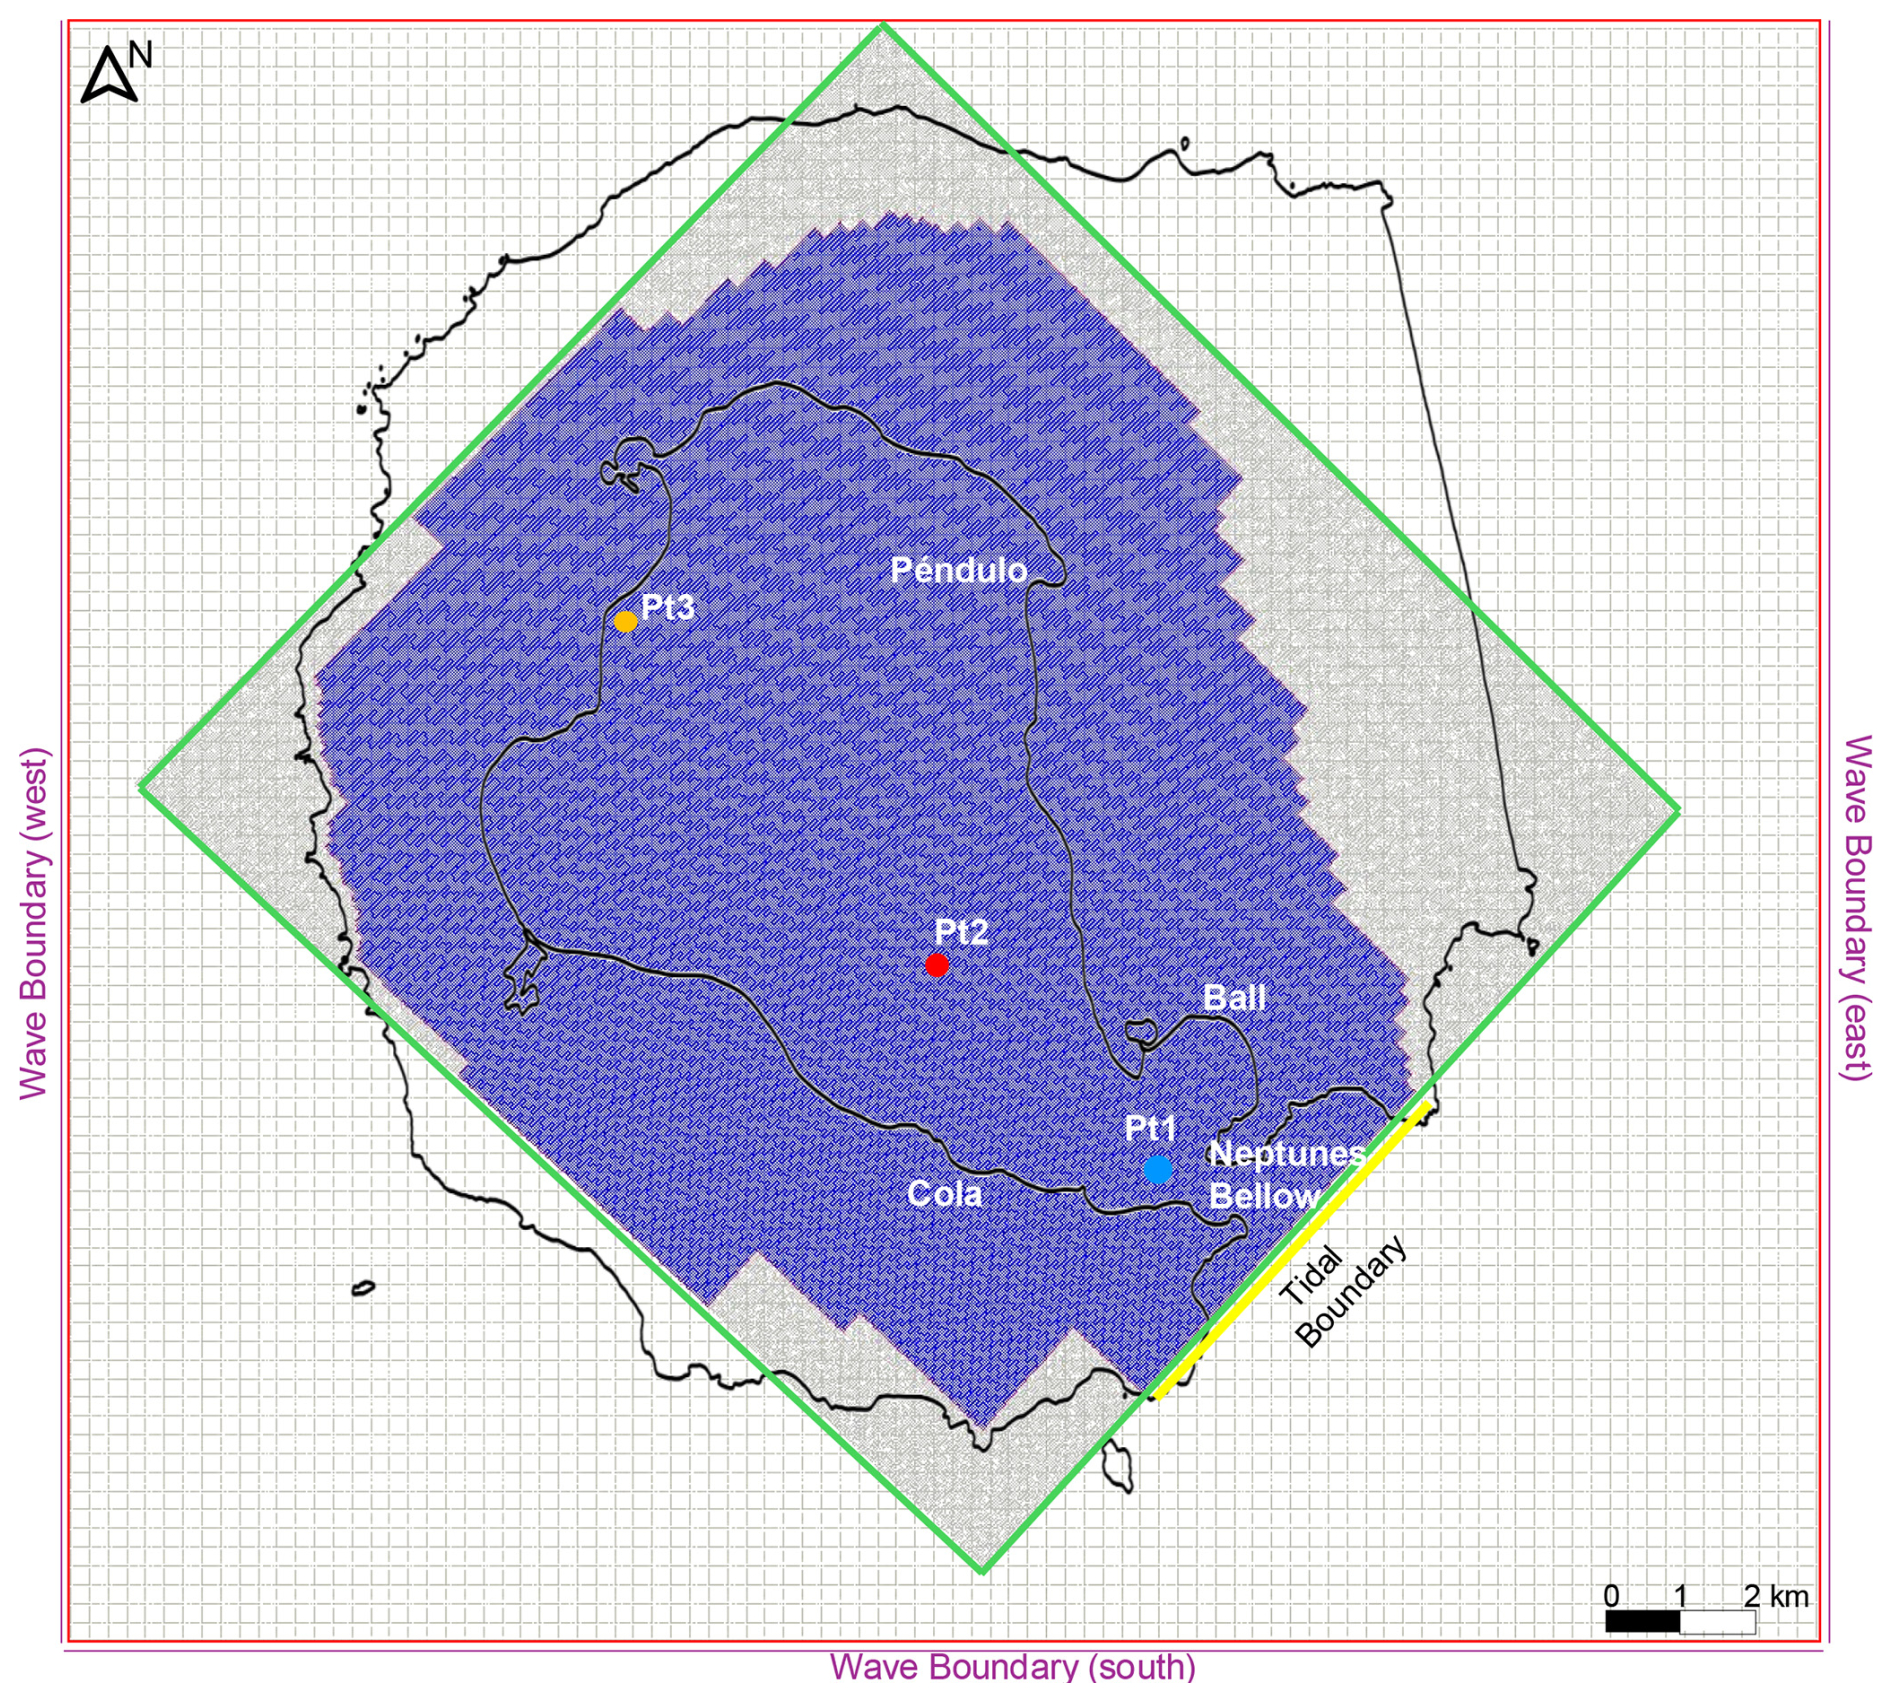
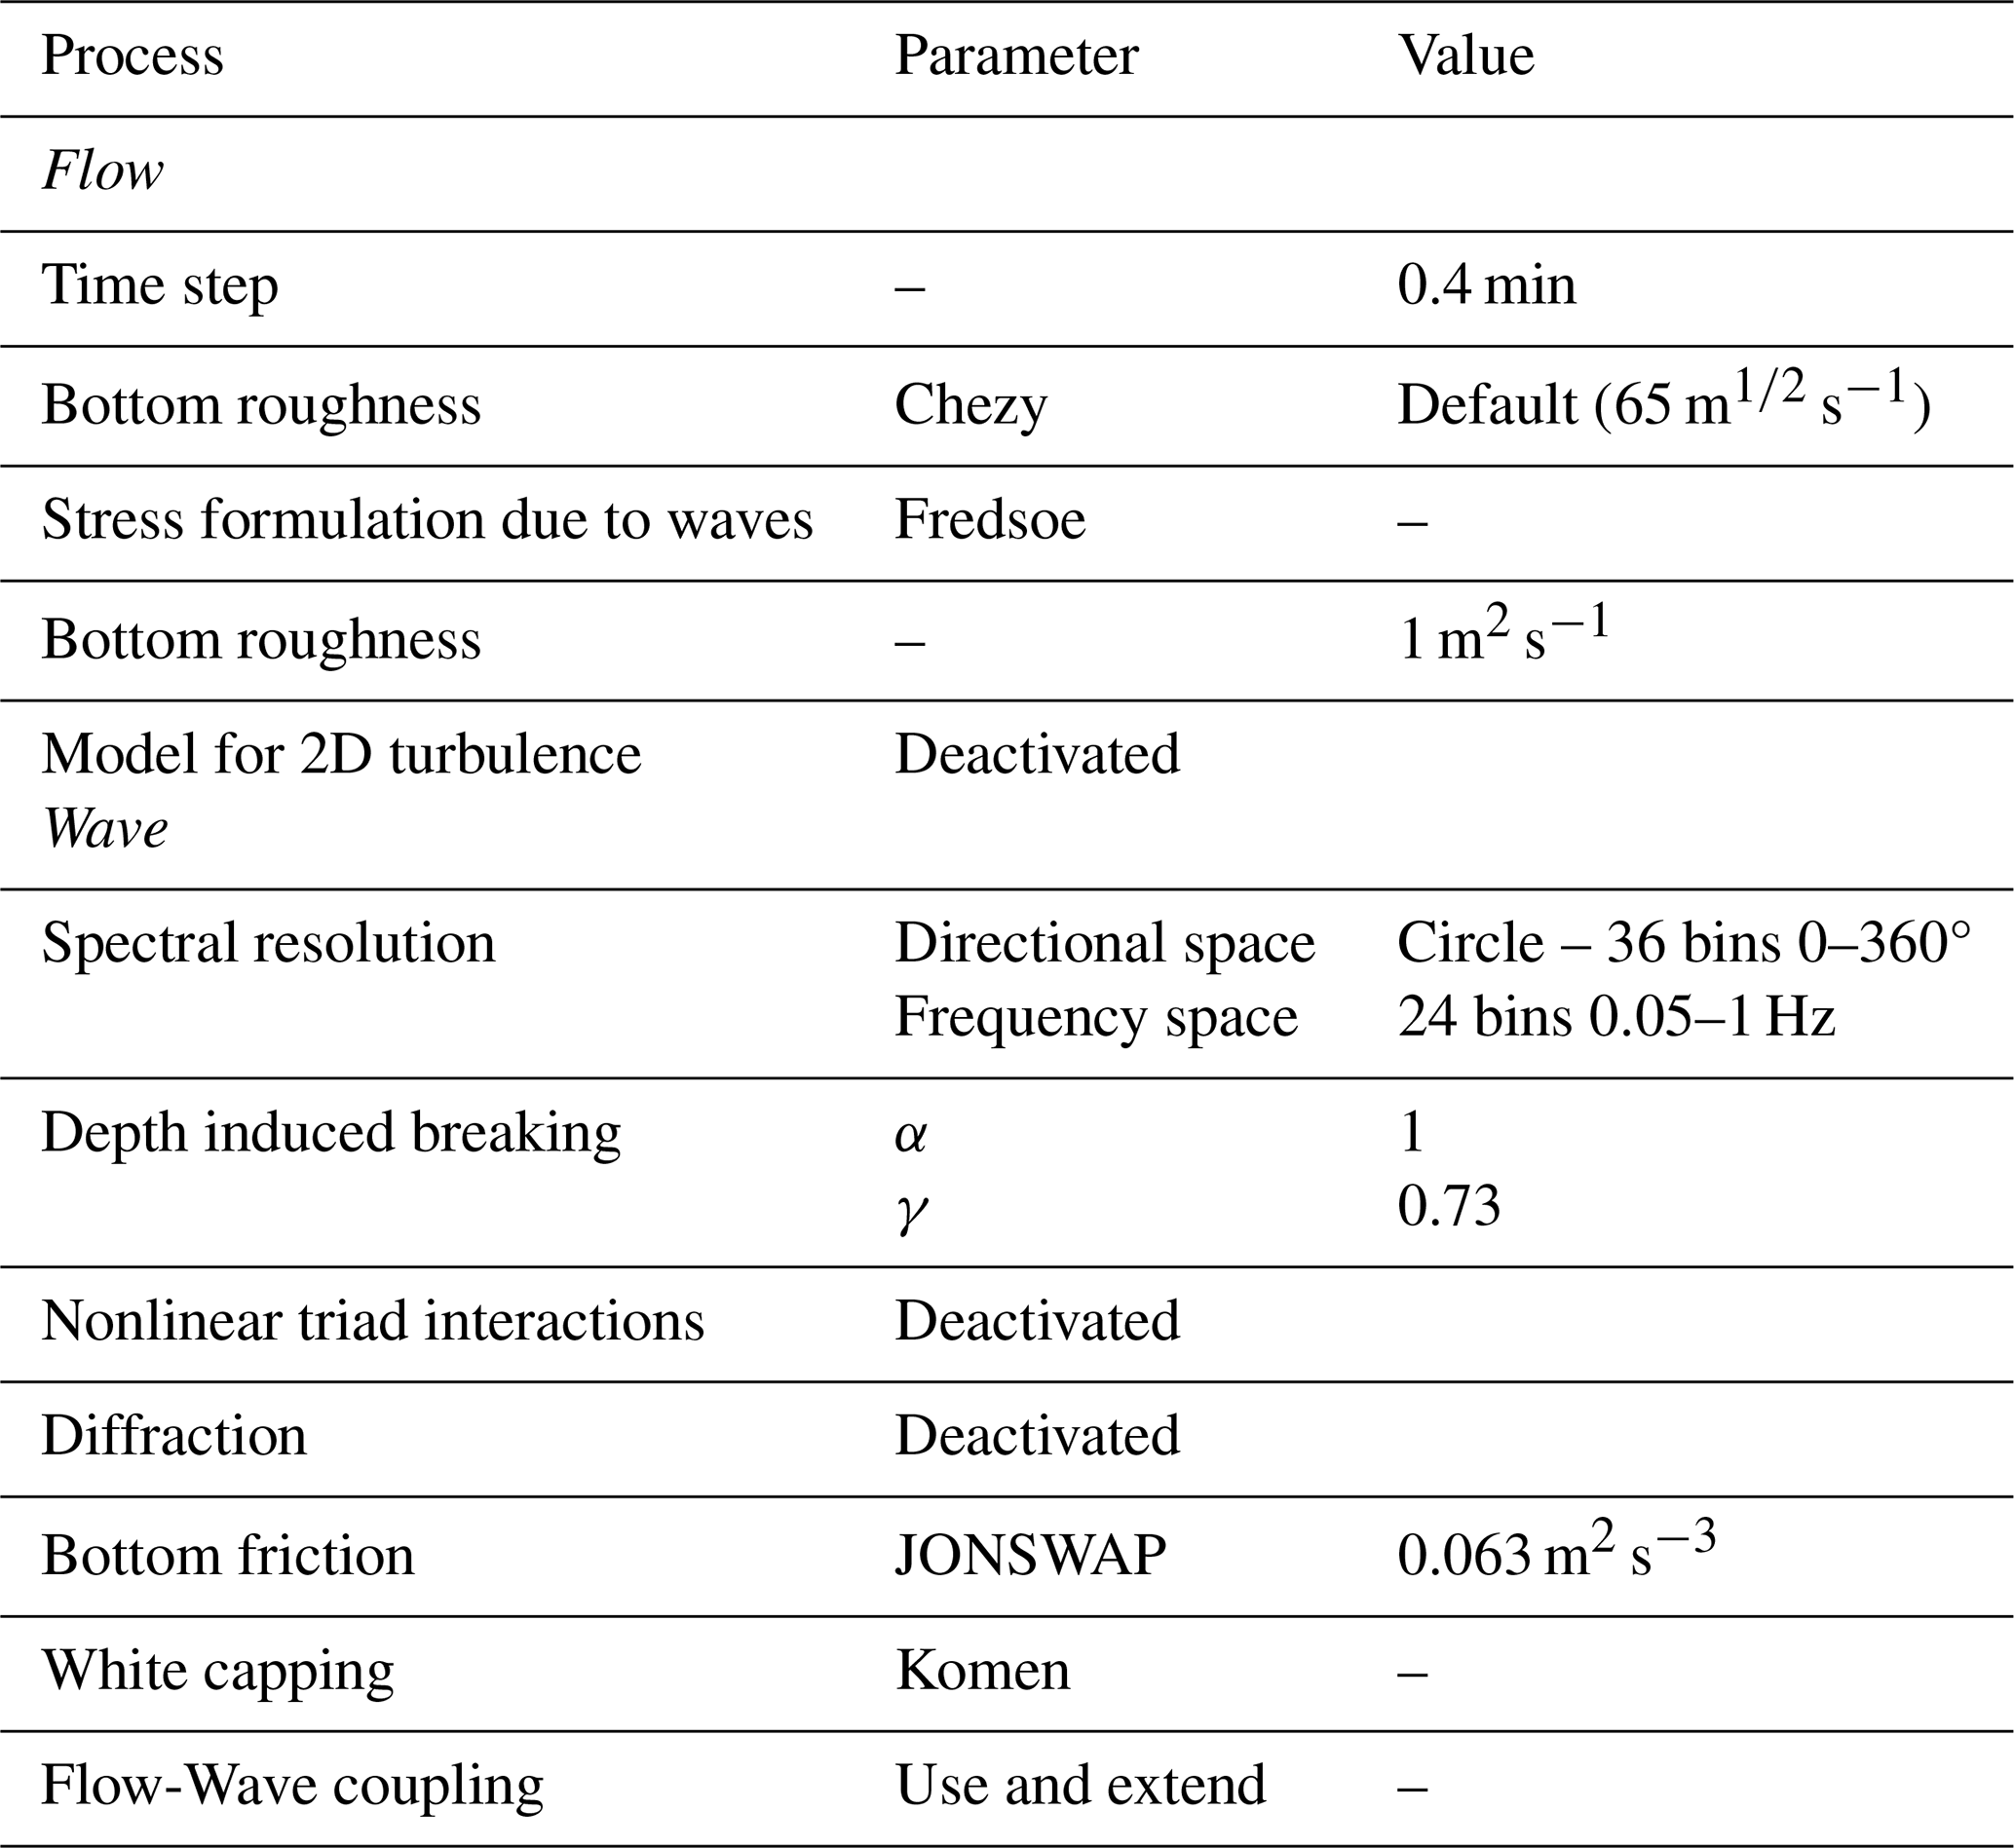
Figure 4Delft3D mesh composition. The red and green polygon correspond to the Delft3D-Wave grids. The blue polygon, covering the island, corresponds to the Delft3D-Flow grid. The yellow line defines the tidal boundary and the purple lines define the three wave boundaries. Wind and pressure fields input are given over the entire grid. The coastline is represented in black colour.
The tidal boundary conditions (yellow line – Fig. 4) are given by the nine principal astronomical components (semi-diurnal and diurnal constituents) as M2, K1, O1, S2, P1, Q1, K2, N2, and MF. The amplitude and phase of the major tidal constituents from Antarctic Tide Gauge Database (ESR, 2024) at the oceanic border have been used. The pressure and 10 m wind fields required to initialize Delft3D were provided by the WRF simulations, whose description and set-up is reported in Sect. 3.2, providing spatially variable hourly input data on a 1 km grid. Three wave boundary conditions (purple lines – Fig. 4) are defined where the three-hourly data from the EU Copernicus Marine Service reported in Sect. 3.1.2 was used as input for each one. Furthermore, specific settings used in the Delft3D models are listed in Table 1. The missing hydrodynamic data for certain periods between 2005 and 2020 are mainly due to computational instabilities or the unavailability of boundary condition data from the Copernicus Marine Service. No artificial gap-filling has been applied to maintain the physical reliability of the dataset. Although the bathymetric data used have a horizontal resolution of 10×10 m, this is considered sufficient for the study objectives, which focus on basin-scale hydrodynamic and atmospheric variability. Future studies specifically targeting detailed channel dynamics may benefit from the use of higher-resolution terrain data.
The model calibration was carried out using a manual trial-and-error approach, as is common in coastal regions where data availability is limited. The calibration period extended from December 2007 to March 2008, and relied on in situ data published in previous studies by Machado et al. (2011), Antelo et al. (2015), and Jigena et al. (2015). These datasets provide tidal harmonic components for water level and depth-averaged current harmonics. The calibration focused on the dominant semi-diurnal (M2, S2) and diurnal (K1, O1) tidal constituents, both for water level and for currents. As described in the manuscript (see Fig. 5), excellent agreement was achieved for water levels, and good agreement was obtained for currents at four monitoring sites: Cola, Péndulo, Ball, and Neptuno, which are spatially distributed across the island (see Fig. 1). The lower model performance observed at Neptuno station may reflect localized hydrodynamic effects not well resolved in the two-dimensional (2D) simulation. This includes steep bathymetric gradients, coastline irregularities, and potentially 3D circulation patterns (e.g. density-driven flows or vertical shear) that are not captured in a depth-averaged model. These limitations have been clarified to inform future users about the representativeness and appropriate use of the model results, especially in areas with complex nearshore dynamics.
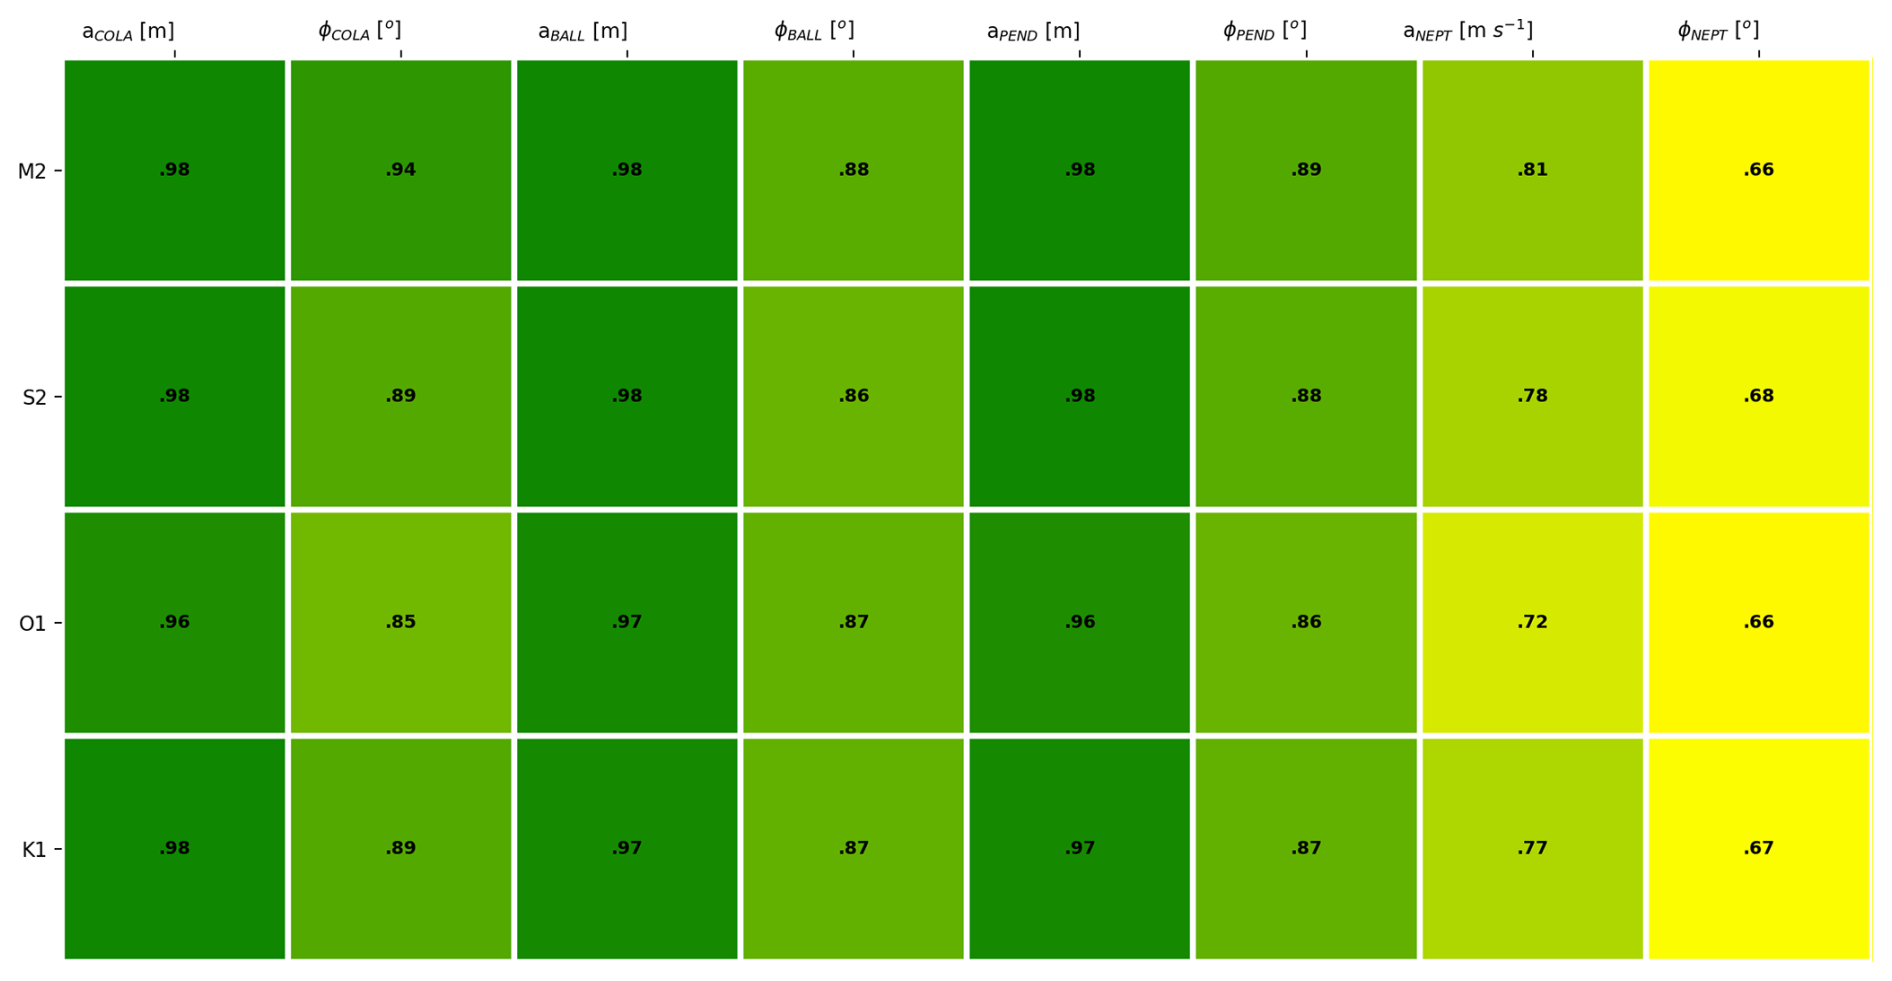
Figure 5Correlation coefficient (R2) of the M2, S2, O1 and K1 constituents of water level and currents for Cola, Pendulo and Ball stations, and Neptuno station, respectively. The colour indicates the degree of accuracy (green indicates excellent agreement, yellow-orange indicates good agreement, and red indicates poor agreement).
This dataset provides a basis for future research into the hydrodynamics of the island, enabling long-term analyses and complementing potential studies that may arise from this work. The integrated approach, involving high-resolution atmospheric downscaling and hydrodynamical modelling, provides a comprehensive view of how Deception Island responds to changing conditions and extreme events, and enhances the understanding of its unique meteo-hydrodynamic processes. The complete atmospheric dataset contains hourly information for 161 atmospheric variables (see Appendix A), including the 10 m wind field and pressure, used as input for the hydrodynamic simulations. The hydrodynamic dataset includes daily data over the whole grid as well as hourly data collected at five observation points strategically distributed over the island. This section presents an analysis of the spatial, seasonal and temporal variability of different key atmospheric and hydrodynamic variables to highlight the capabilities and potential of the combined dataset. In addition, extreme events have been selected to examine their impact on the dynamics of Deception Island.
4.1 Data record
The atmospheric dataset comprises, on a (x=19, y=20) Lambert conformal curvilinear grid, hourly information continuously from 2005 until 2022 including a large number of atmospheric variables such as wind velocity and pressure at different vertical levels, precipitation, and temperature among others. The hydrodynamic dataset covers from 2005 until 2020 although there is some missing data where atmospheric data could not be reproduced or where hydrodynamic simulation errors occurred. The variables recorded include water level, velocity components (east and north), significant wave height, peak period, and mean direction. Representative stations with numerical results at high temporal resolution (hourly and daily) were used to analyse the bay dynamics from intratidal to seasonal scales. Figure 6 shows the timeline of the hydrodynamic dataset from 2005 to 2020, highlighting the variables recorded and identifying the gaps. The gaps in the wave boundary data correspond to missing information in the Copernicus dataset; however, to ensure consistency in the dataset, the last available recorded value was kept constant during data gaps to avoid artificial variability. In contrast, the gaps in the full grid and island point data are due to computational errors during the hydrodynamic model, resulting in missing records for certain periods.
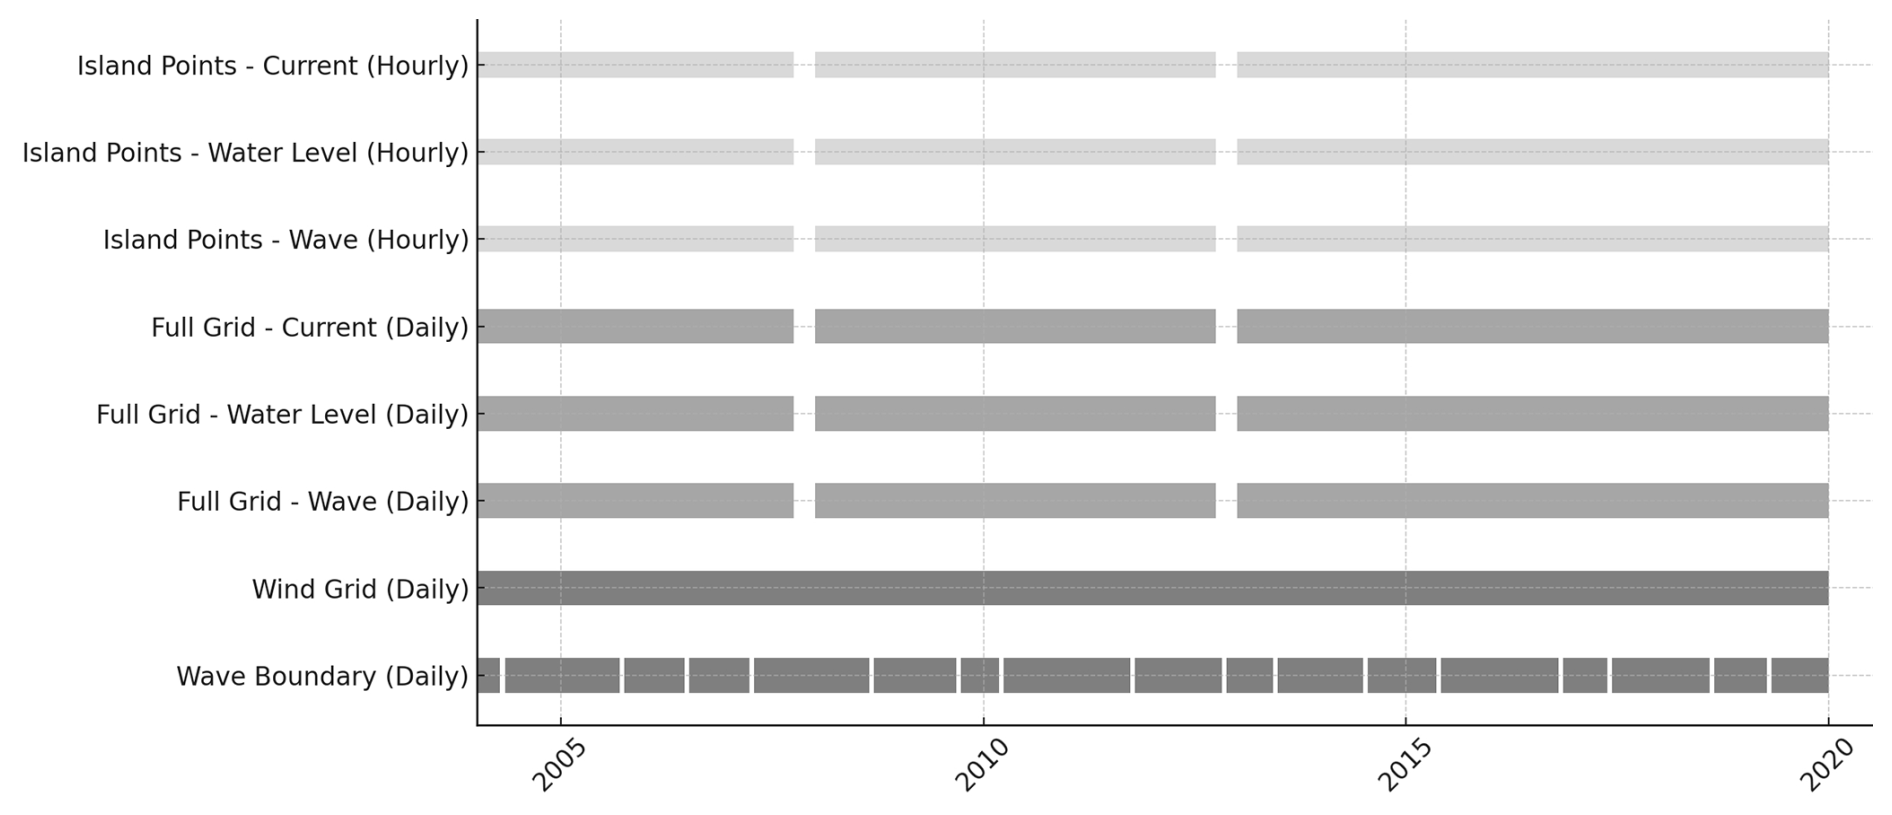
Figure 6Hydrodynamic dataset timeline (2005–2020). The figure shows the availability of different components of the dataset across time. Light grey bars represent hourly point data (wave, water level, and current), while darker grey bars indicate daily point data. The darkest bars correspond to data available over the full model grid. Colour shading indicates the temporal resolution and spatial coverage of each dataset category. Black bars represent the availability of wave boundary and wind forcing data used in the simulations.
4.2 Spatial variability
Figures 7 and 8 present the spatial distribution of the seasonal mean wind and annual mean of the monthly maxima, respectively, over the WRF 1 km domain for the period 2005 until 2022. Regarding the seasonal mean (Fig. 7), the highest wind speeds are observed, as expected, during winter (JJA) with maximum mean wind speed values of over 10 m s−1 in the Mount Pond, Whalers bay, and Mount Kirkwood regions, whereas values of approximately 9 m s−1 are generally present in Port Foster bay. Mean wind speed values of approximately 9 m s−1 are shown for spring (SON) and fall (MAM). The minimum mean speed values are depicted for summer (DJF) with values of approximate 7 m s−1 over the entire island. Regarding the spatial variability, all seasons present a similar distribution with the lowest mean wind speeds are depicted in the inner part of Port Foster and the Kendal Terrace whereas the highest mean wind speeds are observed in the mountain areas Goddard Hill, Mount Pond, and Mount Kirkwood as well as in the entrance area, Neptunes Bellows.
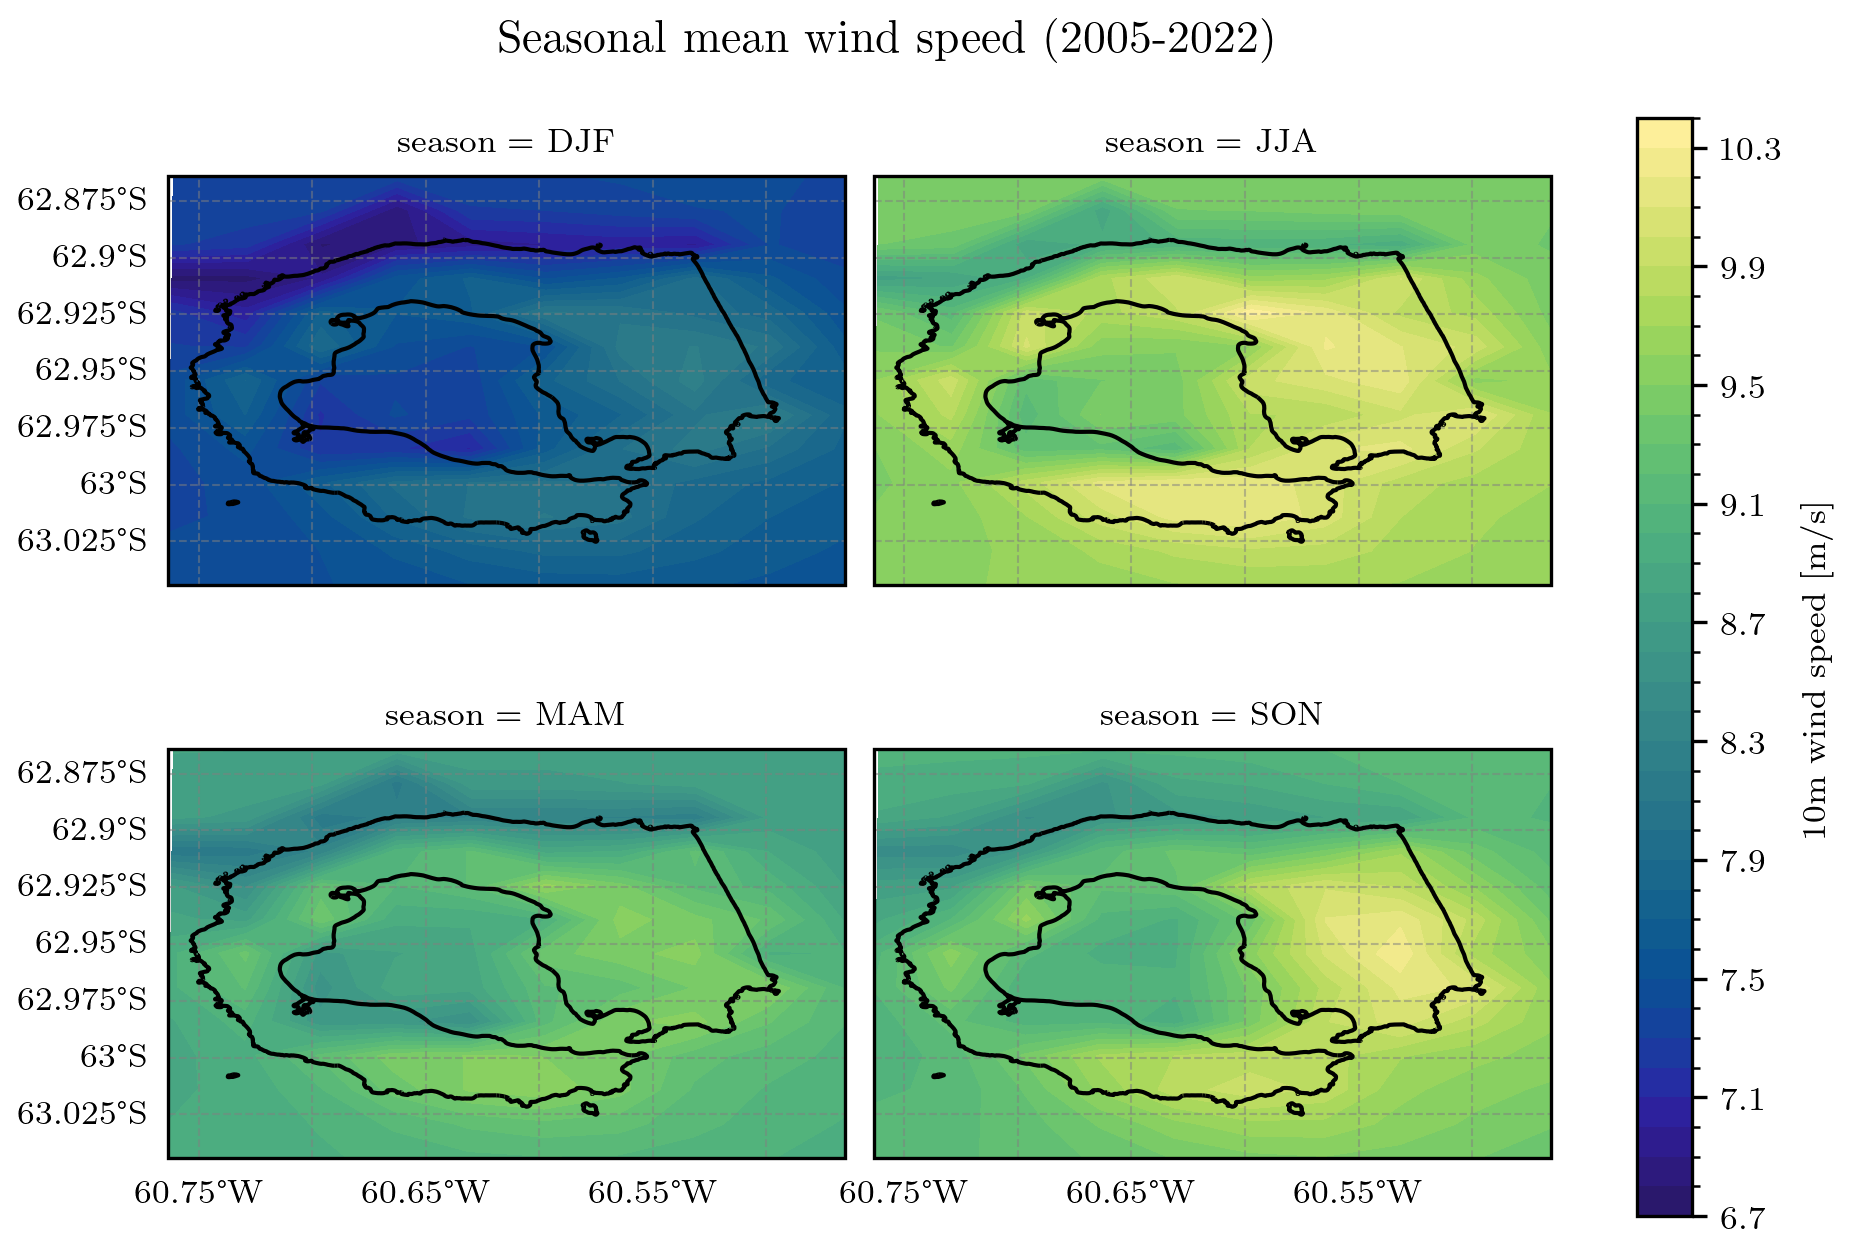
Figure 7Seasonal mean wind speed for the period 2005 until 2022. Coastline data from the SCAR Antarctic Digital Database, 2024.
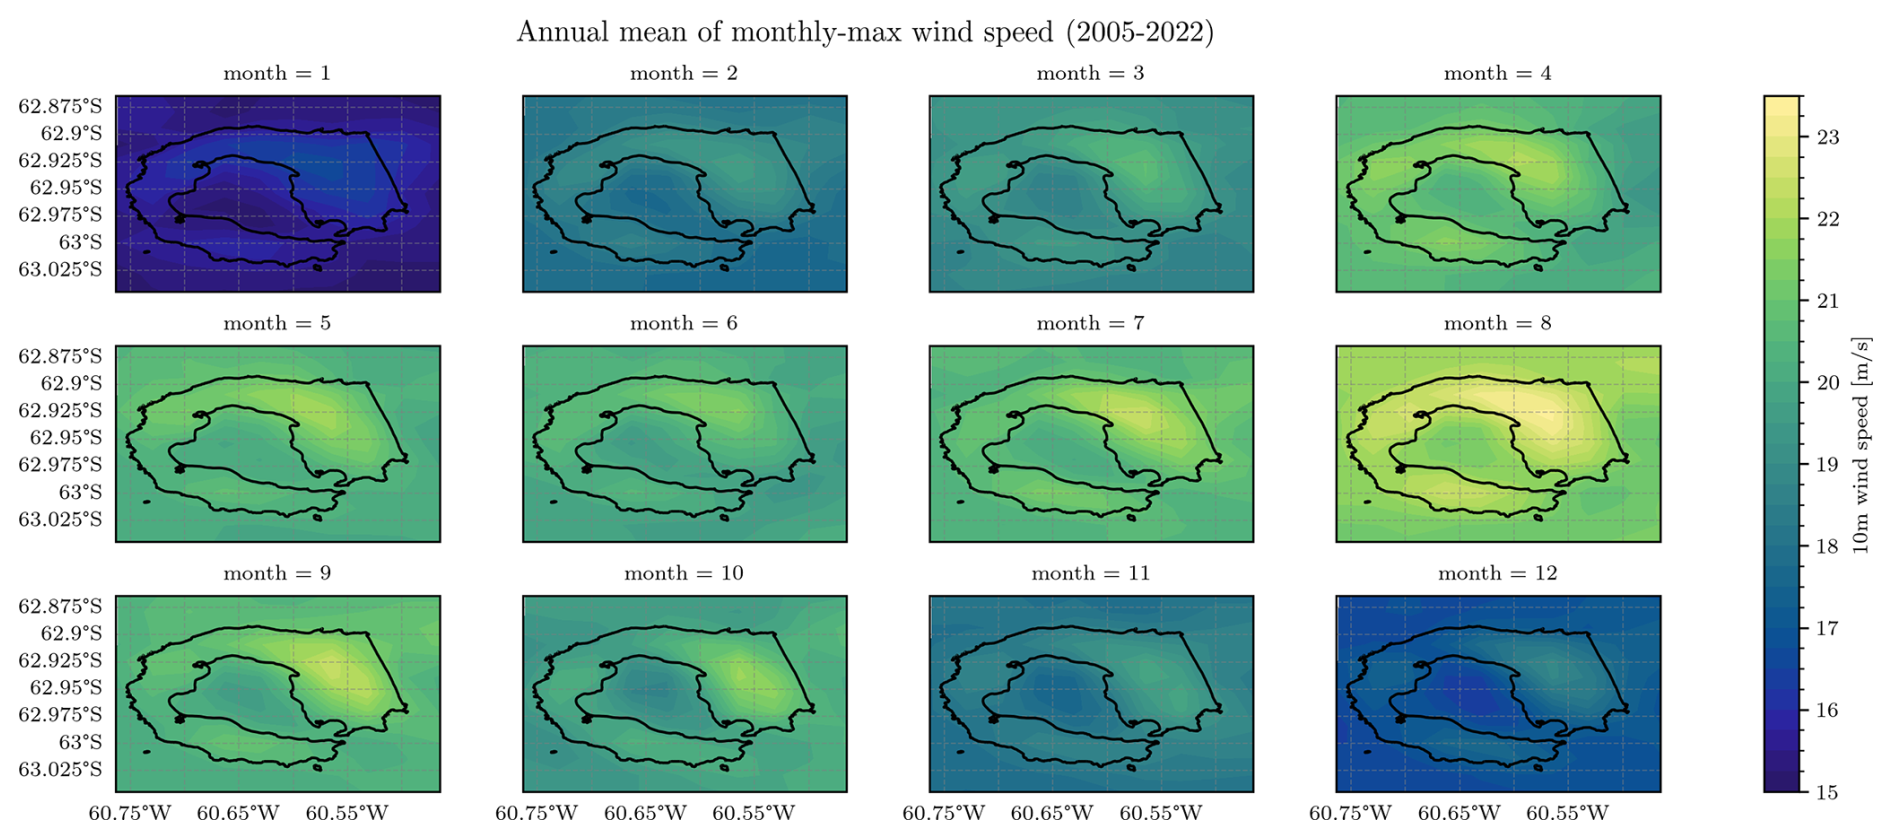
Figure 8Annual mean of monthly maxima wind speed for the period 2005 until 2022. Coastline data from the SCAR Antarctic Digital Database, 2024.
Regarding the spatial variability of the annual mean of the monthly maxima wind speed, presented in Fig. 8, a similar distribution as the seasonal mean is observed with the highest values depicted for the Mount Pond area and the lowest values observed in the inner Port Foster bay, more specifically, Fumarole Bay. The lowest monthly maxima are depicted for January with wind speed values of approximately 15 m s−1 whereas the highest values are observed for August with values over 20 m s−1.
The spatial variability of key hydrodynamic parameters is shown in Fig. 9, comparing conditions during spring and neap tides under both summer and winter scenarios. During spring tides, the highest values of free surface elevation (η) are observed near the coastal boundary, with maximum peaks of approximately 0.52 m in summer and 0.726 m in winter (Fig. 9a.1 and a.2). In contrast, during neap tides, η remains generally lower, with peaks around 0.35 m in summer and 0.3 m in winter (Fig. 9b.1 and b.2). Current velocity magnitudes follow a similar trend, with higher values during spring tides, reaching up to 0.45 m s−1 in both seasons (Fig. 9c.1 and c.2). During neap tides, velocities are significantly reduced, with maxima below 0.2 m s−1 (Fig. 9d.1 and d.2). Wave parameters (Hs and wave direction) were analysed independently of tidal variability, as wave dynamics are primarily driven by wind forcing and external swell conditions rather than the tidal cycle. The significant wave height (Hs) shows seasonal variability, with higher values recorded in winter due to increased storm activity. Maximum values reach 0.4 m in summer (Fig. 9e.1) and over 2.5 m in winter (Fig. 9e.2). The wave direction shows a spatial gradient with values ranging from −150 to 150° (Fig. 9g.1 and g.2).
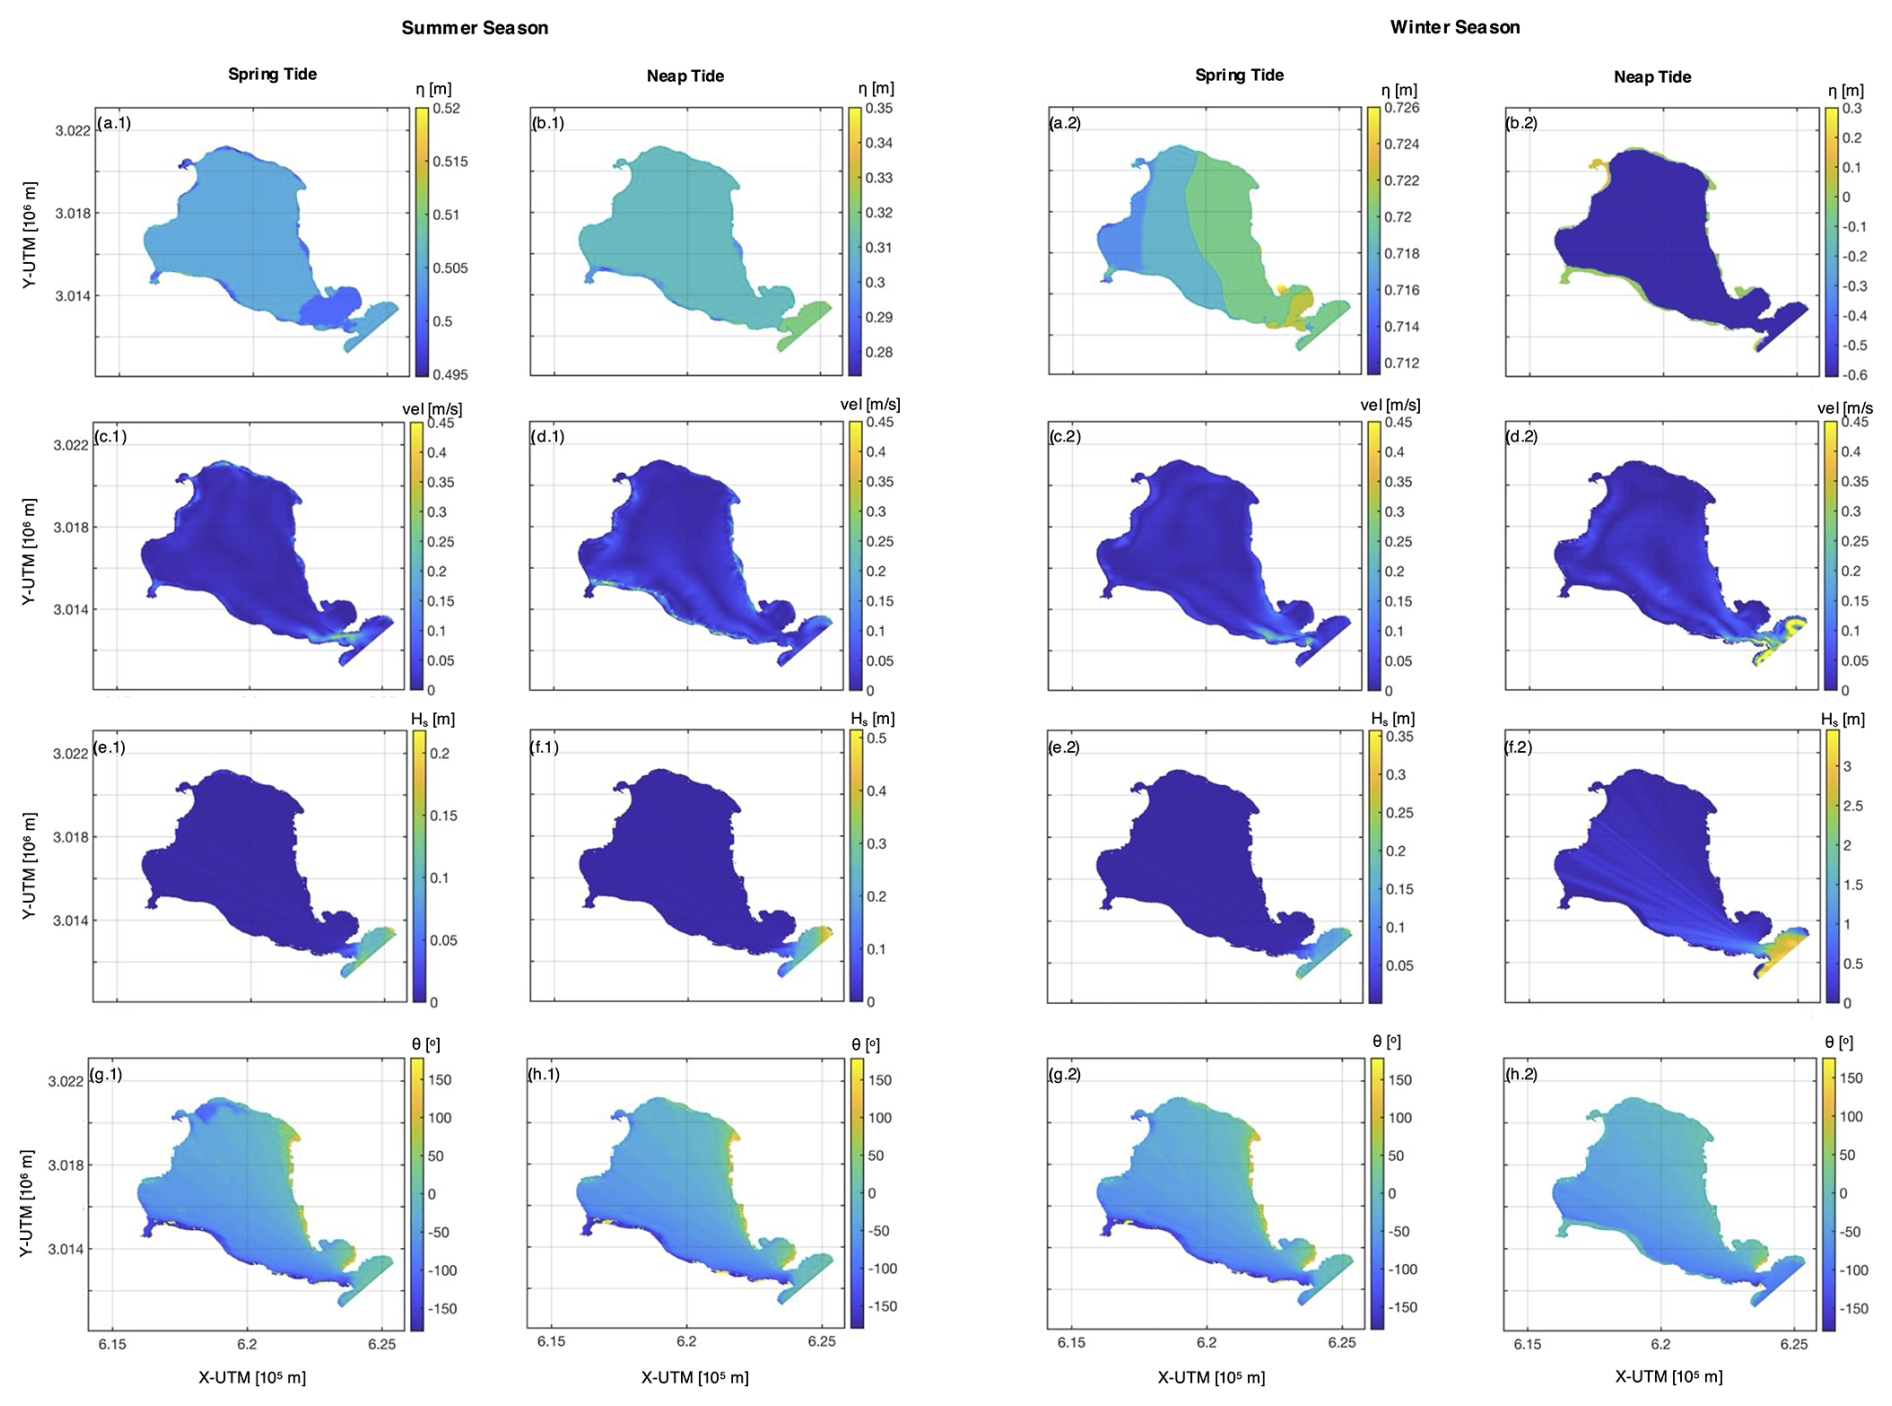
Figure 9Panels (a) and (b) display free surface elevation; panels (c) and (d) show velocity; panels (e) and (f) show the significant wave height; and panels (g) and (h) show the wave direction. The number “1” corresponds to summer conditions and “2” to winter conditions. The first and third columns represent spring tides, while the second and fourth columns represent neap tides.
Seasonal differences between summer and winter conditions (parts 1 and 2 of Fig. 9, respectively) show clear patterns for all analysed parameters. Winter conditions are characterized by significantly higher values of η, especially during spring tides (Fig. 9a.2), and increased significant wave heights, especially in offshore regions where values exceed 2.5 m during neap tides (Fig. 9f.2). Summer conditions, on the other hand, exhibit lower η and Hs, with more uniform spatial distributions across the domain (Fig. 9a.1 and e.1). The velocity magnitude shows a slight seasonal increase during the winter spring tides (Fig. 9c.2), suggesting stronger hydrodynamic forcing compared to summer (Fig. 9c.1). The wave direction also shows seasonal shifts, with a wider directional range in summer (Fig. 9g.1 and h.1) compared to the more consistent winter patterns (Fig. 9g.2 and h.2). These results highlight the importance of tidal forcing and seasonality in modulating hydrodynamic and wave dynamics in the study area.
The observed seasonal variability in wind speed and wave height at Deception Island, characterized by higher values during austral winter, is consistent with broader climate patterns affecting the Southern Ocean. In particular, phases of the Southern Annular Mode (SAM) are known to modulate the intensity and persistence of westerly winds over the South Shetland Islands region (e.g. Marshall, 2003). Figure 10 shows the comparison between the monthly mean wind speed at Deception Island and the SAM index over the period 2005–2020. The SAM index describes the difference in zonal mean sea level pressure between approximately 40 and 65° S, capturing the variability of the westerly wind belt that surrounds Antarctica. Positive SAM phases are associated with stronger and poleward shifting westerlies, while negative phases indicate weakening and equatorward shifting. The figure shows a general correspondence between periods of positive SAM and higher wind speeds at Deception Island, suggesting that local atmospheric conditions are modulated, at least in part, by broader climatic patterns. This relationship highlights the potential influence of large-scale climate variability on the hydrodynamic and atmospheric processes studied in this work.
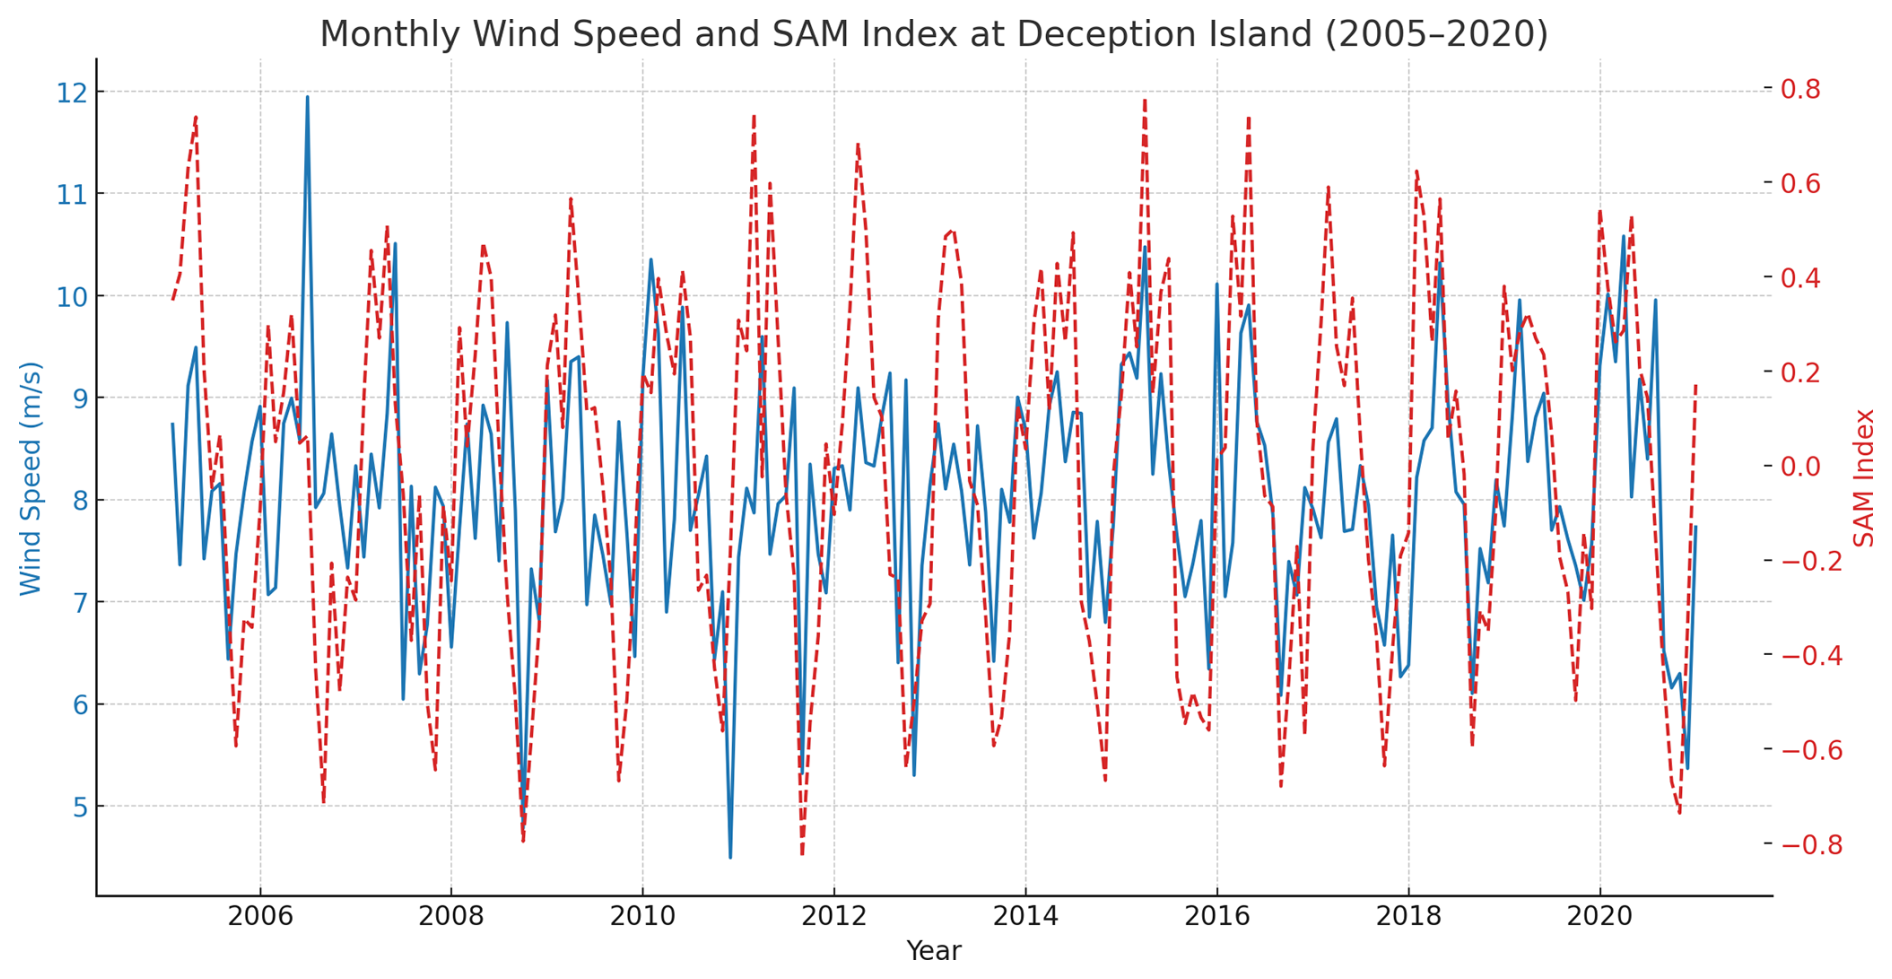
Figure 10Monthly wind speed (blue line) and Southern Annular Mode (SAM) index (red dashed line) at Deception Island from 2005 to 2020, illustrating the relationship between local wind variability and large-scale climate patterns.
In addition to the SAM, the El Niño–Southern Oscillation (ENSO) also influences atmospheric and oceanographic conditions in the Antarctic Peninsula region. El Niño events are generally associated with weaker westerly winds and reduced storm activity, while La Niña phases tend to increase wind strength and hydrodynamic forcing. Although the present analysis focuses primarily on local variability, future studies could explore the relationship between ENSO phases and the patterns observed at Deception Island.
Although the present study focuses on the barotropic (depth-averaged) hydrodynamic response of Deception Island, it is important to acknowledge the potential influence of thermal stratification on water motion, particularly during the austral summer. The caldera is subject to strong seasonal variability in both atmospheric forcing and freshwater input from glacial melt, which can enhance vertical density gradients and lead to the formation of a stratified water column. In such conditions, surface currents may be more strongly decoupled from bottom dynamics, altering the transport pathways and energy distribution within the basin. Moreover, Deception Island's steep bathymetry and semi-enclosed geometry provide favourable conditions for the generation of internal waves and baroclinic tides, which are not represented in a depth-averaged (2D) model configuration. These internal processes can contribute to vertical mixing, sediment resuspension, and nutrient transport – key factors for ecosystem dynamics in the region. While the 2D configuration used here captures the dominant horizontal circulation and is suitable for long-term, climatological-scale assessment, it may not fully represent the complexity of stratified dynamics during summer months.
4.3 Temporal variability
Figure 11 presents the temporal variability of key atmospheric variables at Neptunes Bellows (location Pt1 – Fig. 4). More specifically, it depicts the hourly time series for wind speed [m s−1], wind gusts [m s−1], pressure [Pa], temperature [K], relative humidity [%], and precipitation [mm]. Maximum wind speed and wind gusts values of over 20 and 30 m s−1 are observed with the highest wind speed obtained at the end of 2017. In the pressure panel, the red points represent the annual mean pressure, which does not show any trend over the analysed years. In the temperature panel, the red and blue dots represent the average summer and winter temperatures, respectively. In this case, an upward trend is clearly visible, particularly during the winter season. In addition, winter temperatures exhibit greater inter-annual variability compared to summer temperatures.
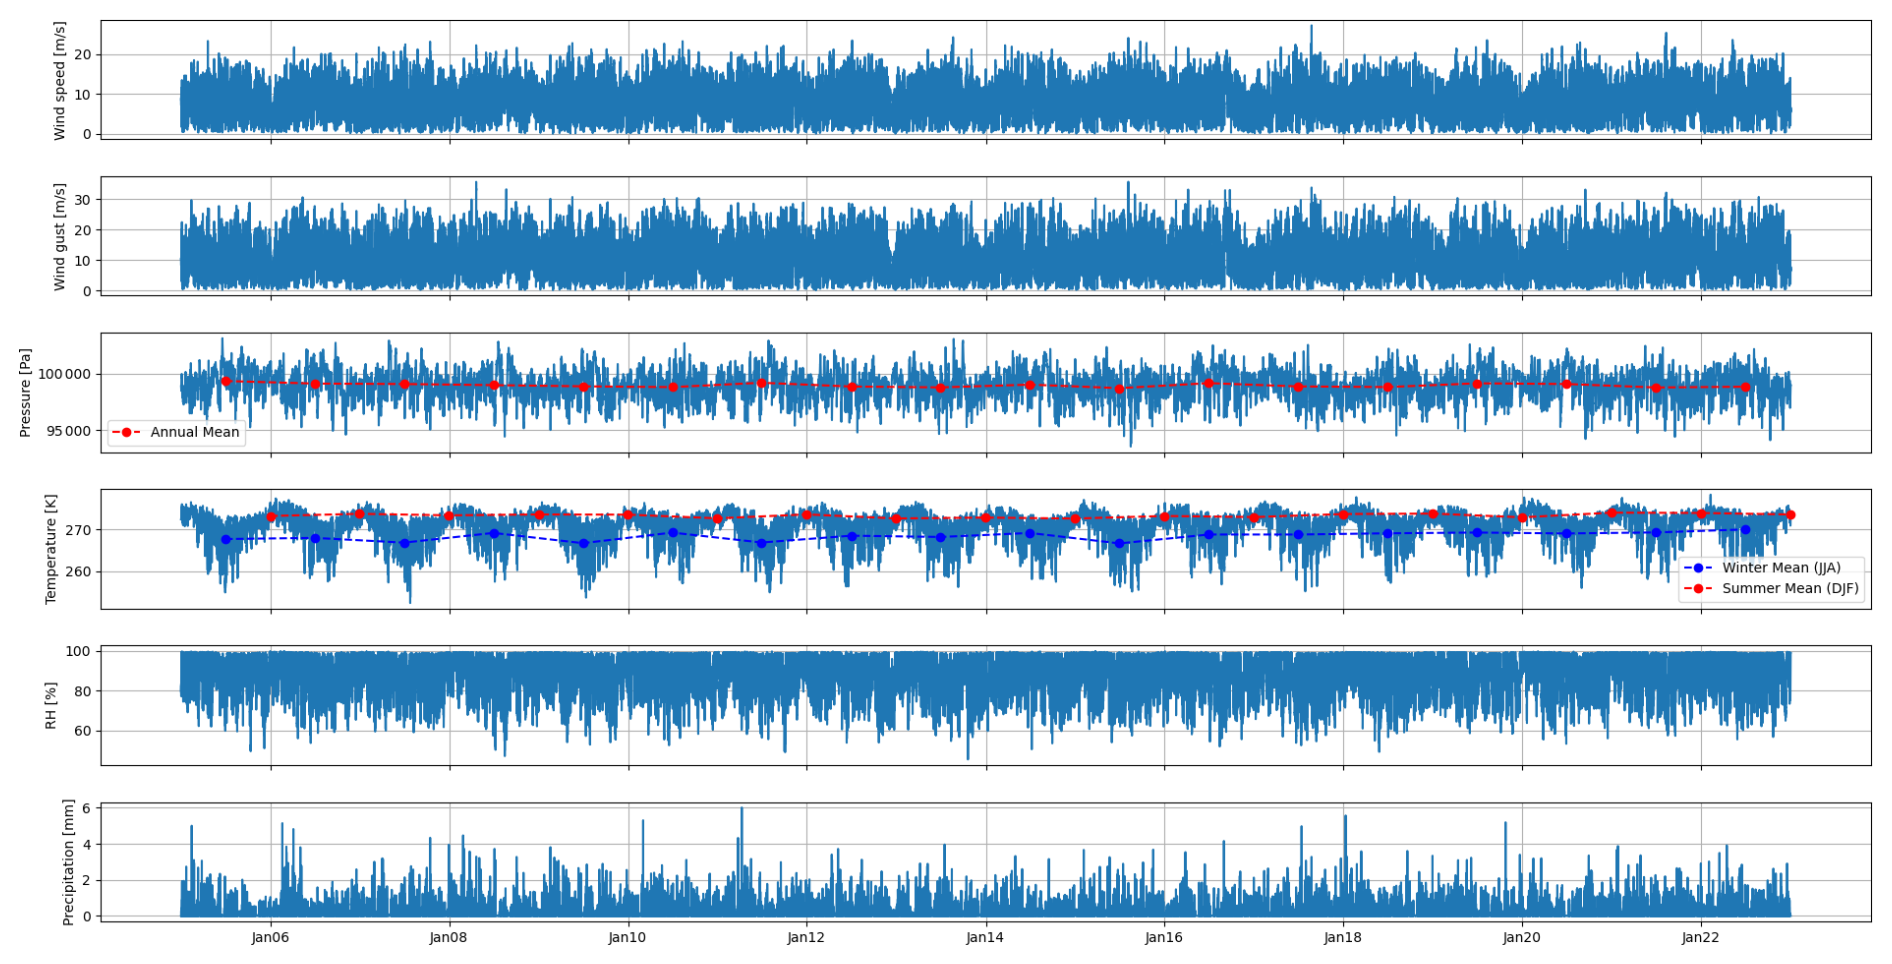
Figure 11Time series (2005–2022) of whether variable for the point Pt1. From top to bottom, variables represented are: wind speed [m s−1], wind gust [m s−1], pressure [Pa], temperature [K], relative humidity [%] and hourly precipitation [mm]. Red points in pressure panel refer to pressure annual mean, while red and blue points in temperature panels respectively refer to summer and winter mean temperature.
The time series shown in Fig. 12 illustrates the hydrodynamic variability at three observation points along a longitudinal transect in Deception Island: Neptune Bellows (Pt1, blue), the interior of the island in Port Foster (Pt2, red), and a near-shore coastal location in the inner part of the bay (Pt3, orange). The dataset includes water level, current eastward velocity, current northward velocity, significant wave height, peak period, and wave direction. The water level shows similar tidal oscillations at all three sites, with slight variations in amplitude. Pt1, being more exposed, shows slightly higher fluctuations compared to the inland and coastal locations where the geography of the island attenuates the tidal signal. The velocity components reflect the dominant tidal influence, with Pt1 showing the highest variations due to exposure to open ocean forcing, while Pt2, located within the island, shows reduced velocity magnitudes, probably due to topographic confinement. Pt3 shows intermediate behaviour, with a balance between tidal and wave driven currents. Significant wave heights follow a similar trend, with Pt1 showing the highest values, occasionally exceeding 1.5 m during storm conditions. In contrast, wave energy inside the island is significantly reduced, suggesting sheltering effects, while the nearshore point retains moderate variability, influenced by both offshore waves and local conditions. The peak period remains consistent at all locations, but is generally longer at Pt1 due to the influence of offshore swells, while Pt2 mainly reflects shorter periods from locally generated waves. Pt3 shows a mixture of both behaviours, with wave conditions influenced by its semi-exposed position. Wave direction shows greater variability at Pt1, influenced by changing wind and offshore conditions, whereas Pt2 and Pt3 show more stable directional patterns, probably governed by refraction and diffraction effects as waves propagate through the island's channels and coastal topography. Overall, the results highlight a progressive attenuation of hydrodynamic energy from the open ocean towards the sheltered interior, with the nearshore point exhibiting characteristics of both external and internal forcing, highlighting the complex interplay of tidal currents, wave processes, and local bathymetric influences in the hydrodynamic system of Deception Island. Figure 12 serves as an example of the temporal structure and variability available in the dataset; full high-resolution time series for each observation point are openly available in the Zenodo repository.
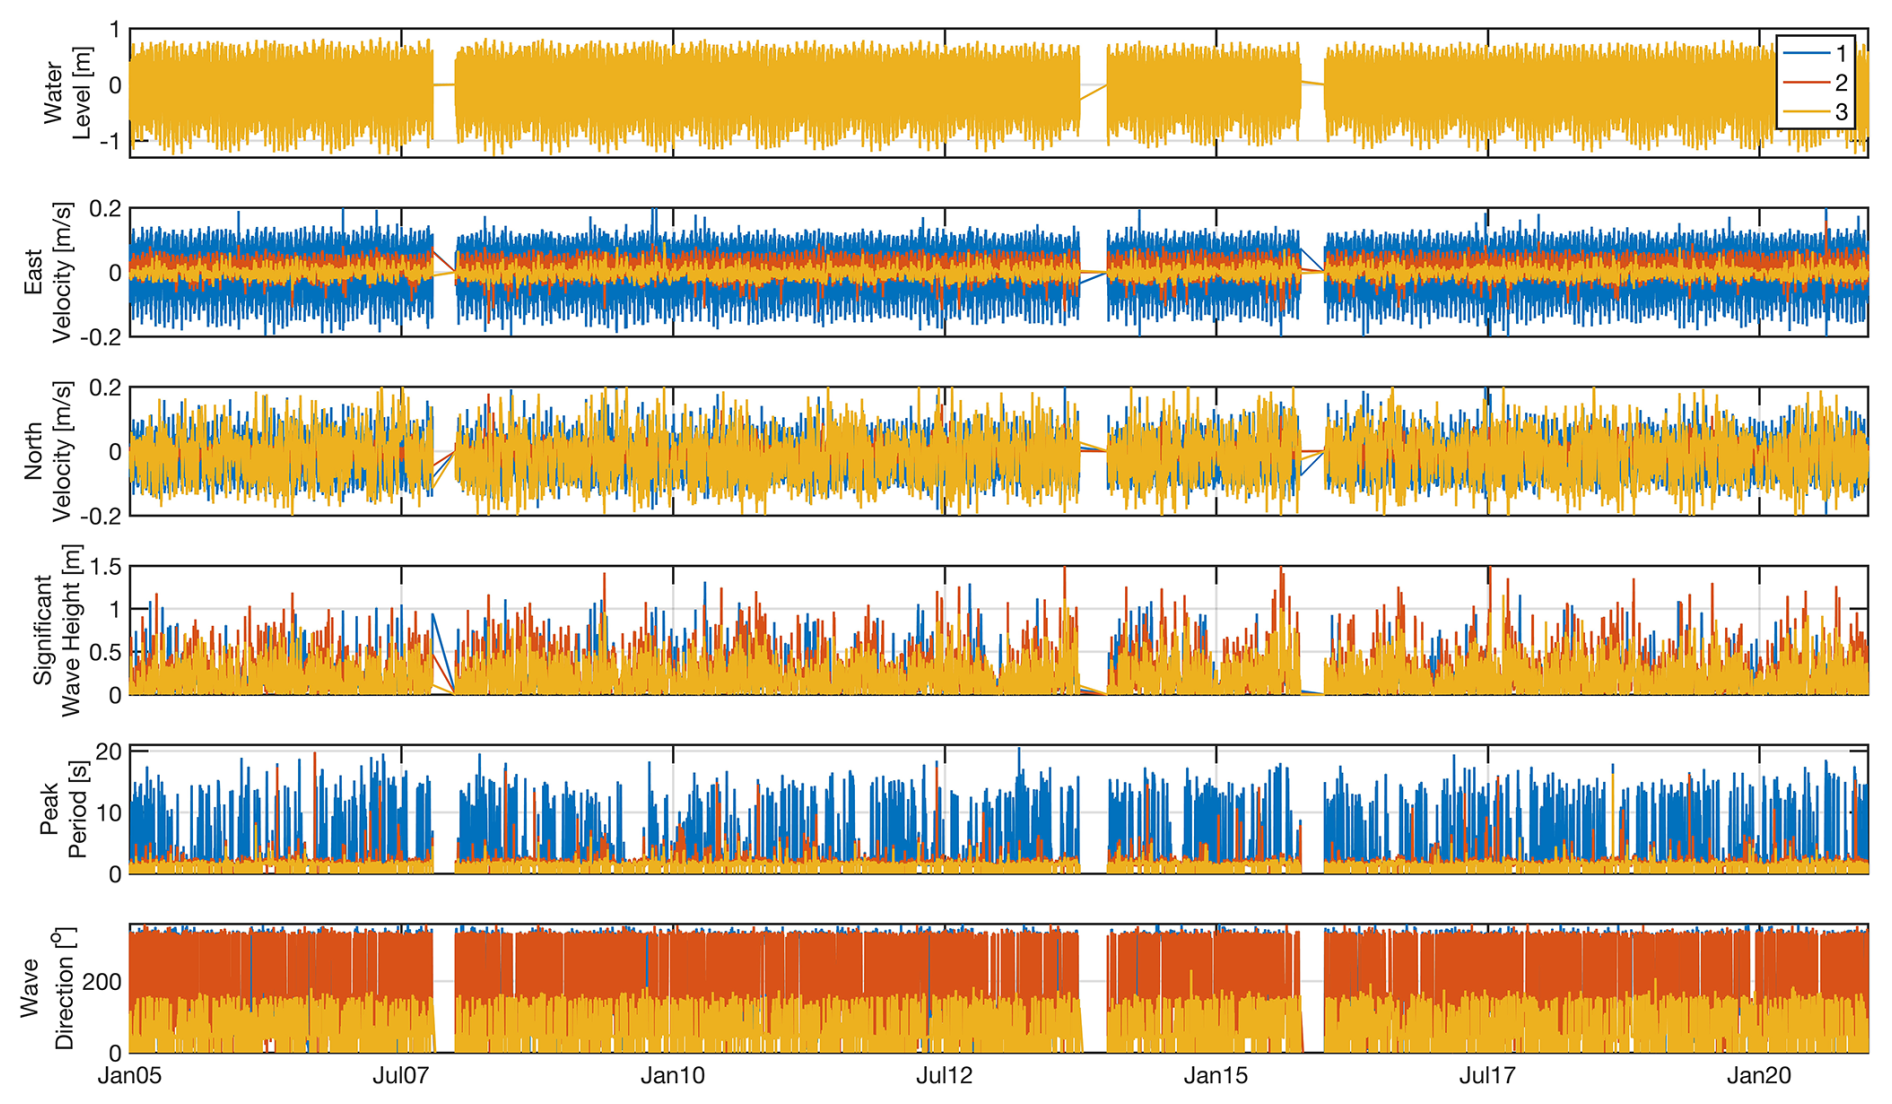
Figure 12Time series of hydrodynamic variables at three observation points aligned along a single longitudinal transect on Deception Island. The blue line corresponds to Neptuno Fuelle, the orange line is located inside the island, and the yellow line is near the coast. From top to bottom, the variables shown are: water level, eastward velocity, northward velocity, significant wave height, peak period, and wave direction.
4.4 Extreme weather events
Figure 13 shows the temporal evolution of extreme events at the location Pt1 over the analysed years for sea state (blue), temperature (red), sea level pressure (teal), and wind speed (orange). Concerning sea state (blue line), an event is classified as extreme if the water level or the significant wave height exceeds its 99th percentile for a minimum duration of 2 d. This threshold ensures that only the most energetic conditions are considered, typically associated with strong storms, high winds, or intense oceanic forcing. Regarding weather conditions, temperature and mean sea level pressure extreme events are identified when the daily maximum exceeded the 99th percentile (solid lines) and when the daily minimum was below the 1st percentile (dashed lines) at location Pt1. Regarding wind speed, a location outside the island has been selected and the number of events in which the daily maximum exceeded the 99th percentile have been identified.
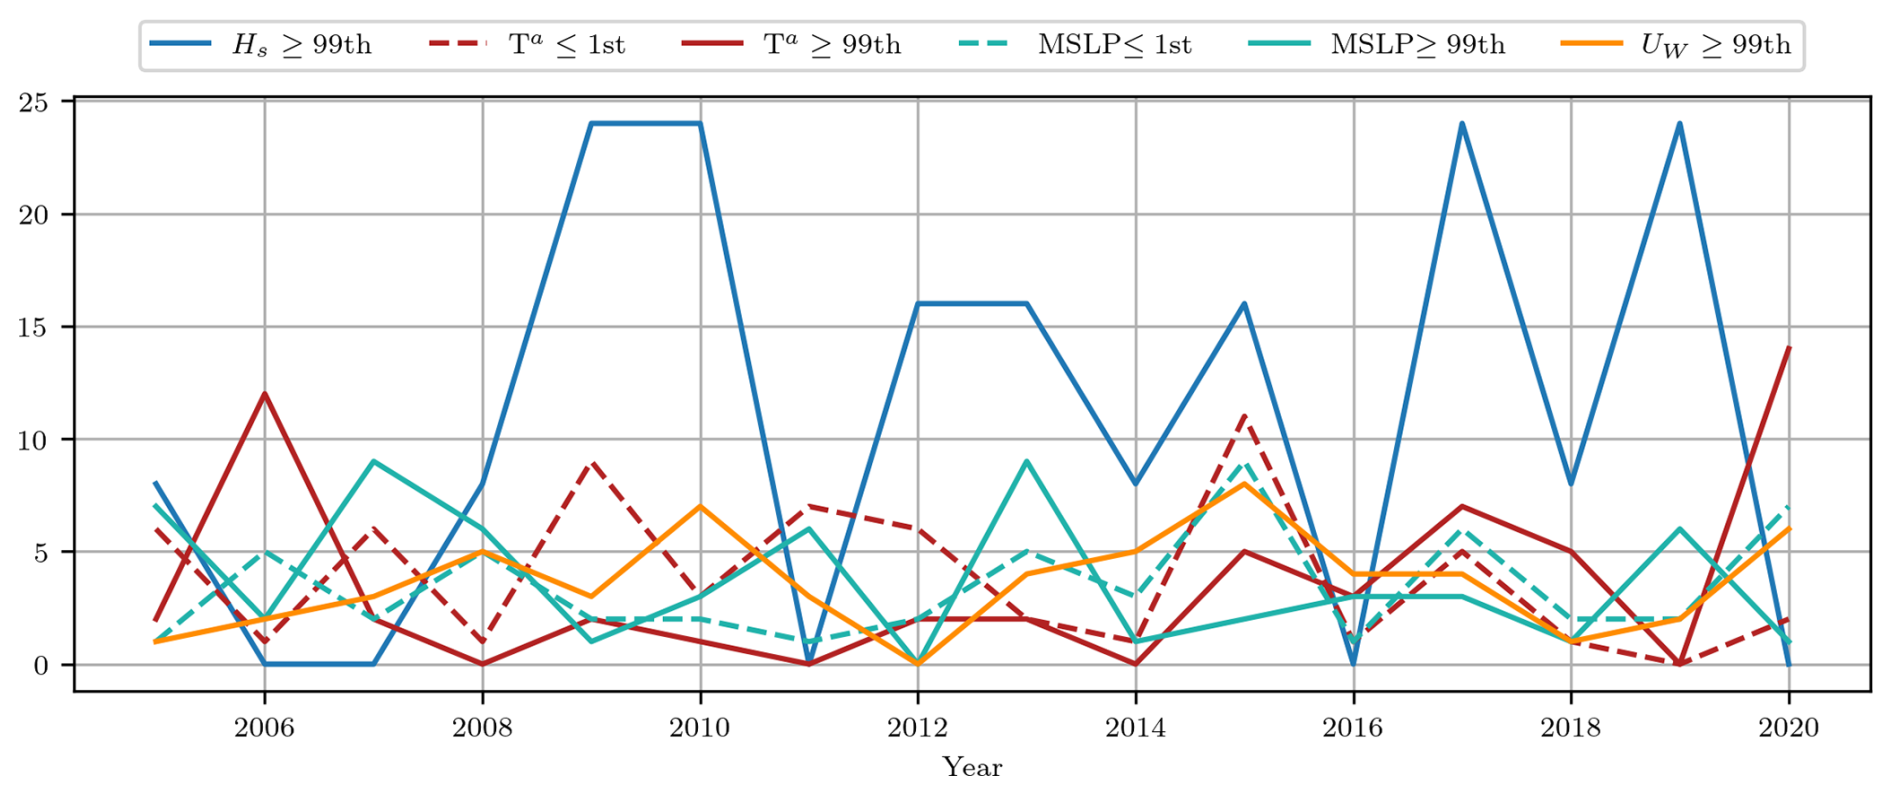
Figure 13Evolution of extreme events over time for different atmospheric and hydrodynamic variables from 2005 to 2020. The blue line represents the number of extreme events, defined as an event where the water level or significant wave height exceeds the 99th percentile. Red and teal lines correspond to the number of events where the daily maximum temperature and mean sea level pressure, respectively, are below the 1st percentile (dashed lines) and above the 99th (solid lines). Orange line corresponds to events where the wind speed exceeds the 99th percentile.
The variability in the number of extreme events per year reflects fluctuations in atmospheric and hydrodynamic conditions, with certain years experiencing a higher frequency of extreme conditions, possibly related to climatic patterns or seasonal anomalies. Identifying extreme events is crucial to understanding their impact on the hydrodynamics and environmental stability of Deception Island. These events have a significant influence on water level fluctuations, wave dynamics and current patterns, with implications for coastal erosion, sediment transport, and potential changes in marine ecosystems.
This period was selected as the most extreme recorded event in the dataset due to its exceptional duration (lasting seven consecutive days above the 99th percentile) and peak wave heights exceeding 4 m, making it the most energetic event observed during the study period. Figures 14 and 15 present the behaviour of key atmospheric and hydrodynamic variables, during this event. Regarding the atmospheric variables, Fig. 14 presents the evolution of wind speed and pressure at Pt2 during the whole event (left) and the spatial distribution (right) in correspondence of the wind peak (12 January 2012 01:00 UTC), and the minimum pressure during the passage of the storm (14 January 2012 14:00 UTC). Peak wind values of approximately 15 m s−1 were identified starting from the 11 January 2012 and lasting for one day. Afterwards a sudden decrease of up to 2.5 m s wind speed is observed due to the passage over the island of a pressure minimum associated to the storm. Regarding the spatial distribution during the wind speed maximum and pressure minimum, it can be observed that the highest values are identified for the mounts' peaks and Neptune Bellows whereas the minimum is identified inside the bay in the central part of Port Foster.
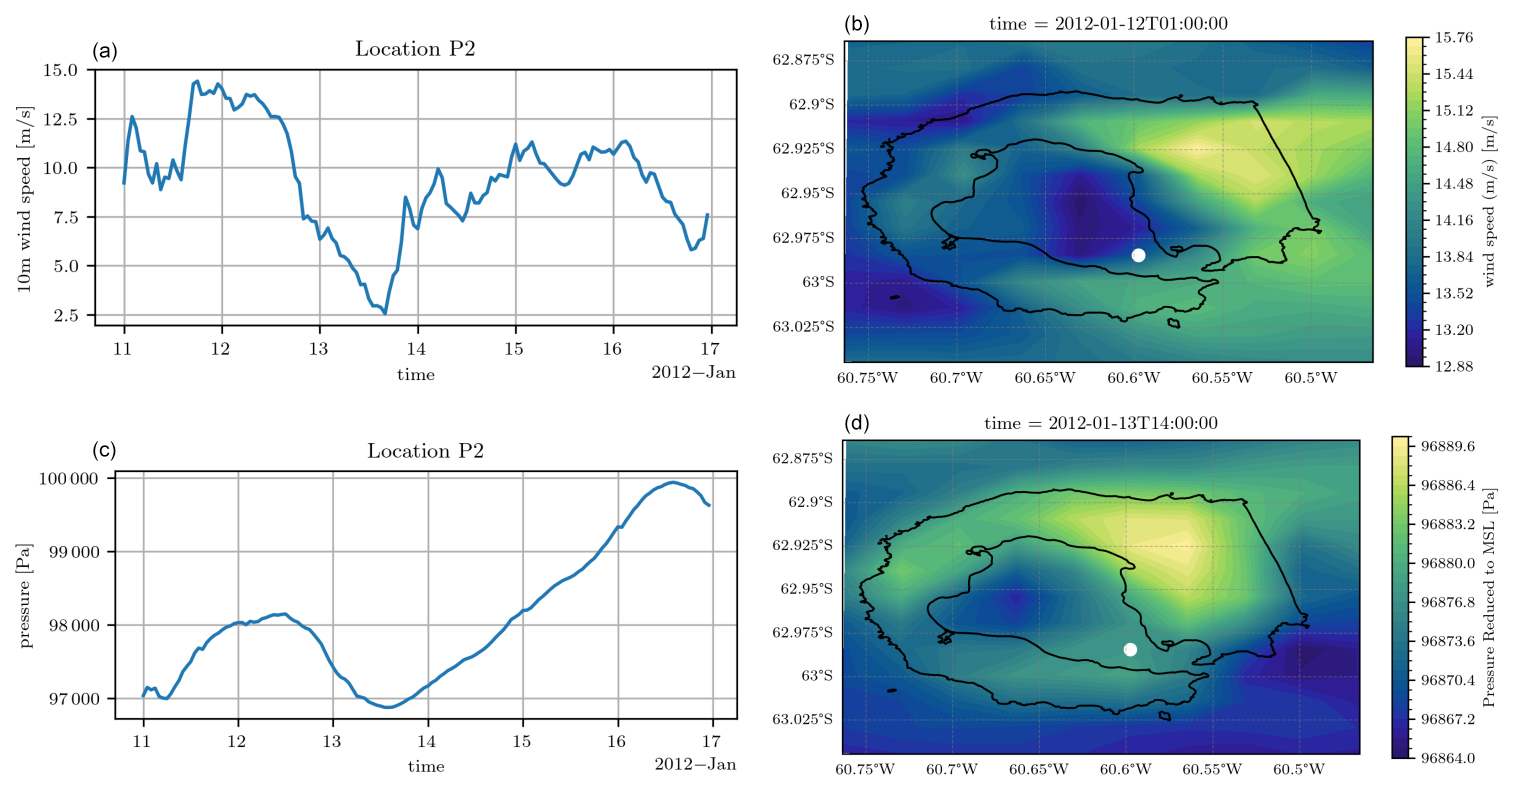
Figure 14Wind speed (a, b) and pressure (c, d) conditions during an extreme event from 11 until 17 January 2012. Panels (a) and (c) present the temporal evolution of the analysed variables for location Pt2 and panels (b) and (d) present the spatial distribution for a specific time where high wind speed values and low pressure values were identified. The white dot indicates the location of Pt2. Coastline data from the SCAR Antarctic Digital Database, 2024.
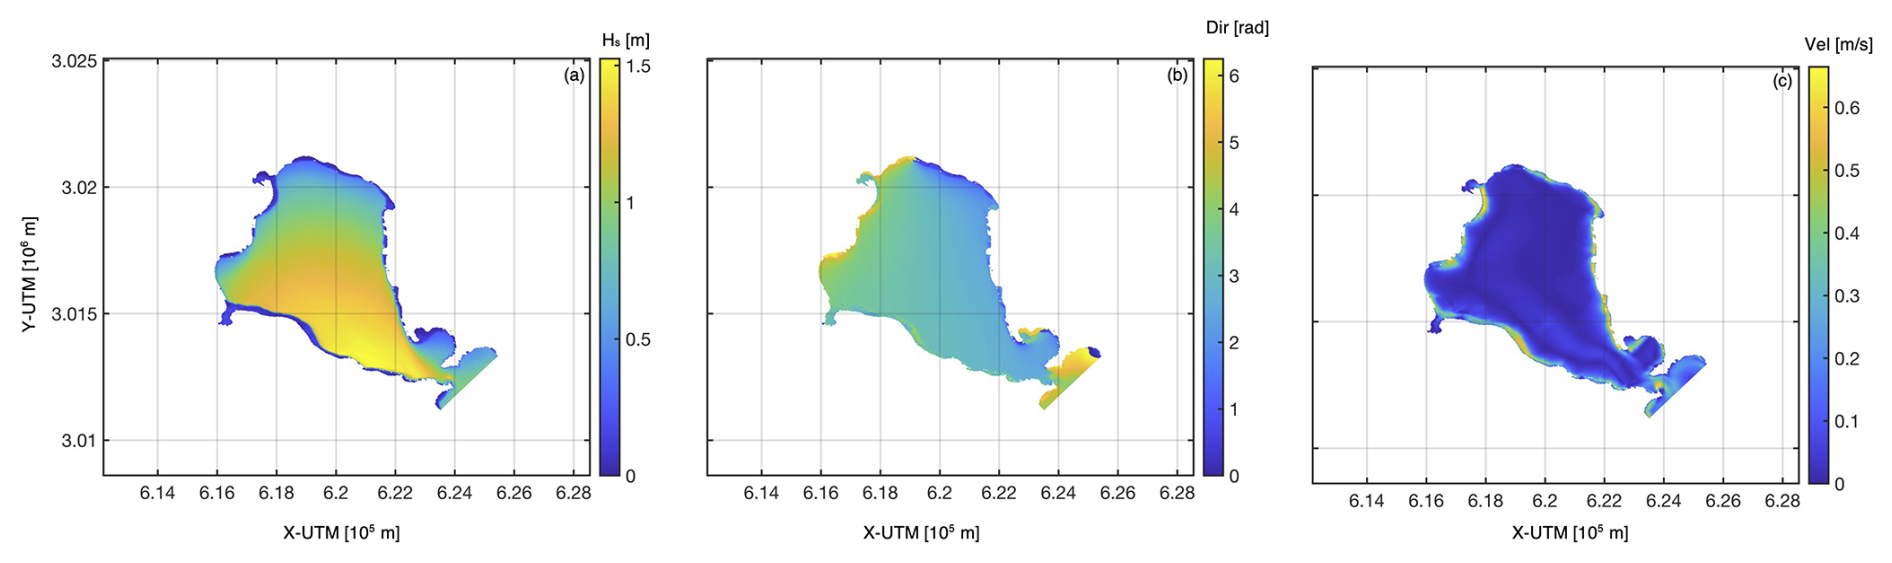
Figure 15Hydrodynamic and atmospheric conditions during an extreme event on 15 January 2012, selected as a case study where the significant wave height exceeded the 99th percentile. Panels show: (a) significant wave height (Hs) [m], (b) peak wave direction [radians], and (c) depth-averaged current velocity [m s−1] from the 2D Delft3D-FLOW simulation. This analysis provides insight into the spatial variability of wave and wind conditions during extreme events affecting Deception Island.
Figure 15 shows the spatial distribution of significant wave height (a), peak wave direction (b), and current velocity (c) on the high-resolution Delft3D-Flow grid on 15 January 2012. The distribution of the significant wave height (Hs), presents maximum values exceeding 1.5 m and predominantly affecting the northern and southeastern regions of Deception Island. This pattern suggests that wave energy is strongly modulated by the island's geomorphology and exposure to external forcing. The wave direction (Fig. 15b) indicates that the waves propagated predominantly from the northwest sector, which is consistent with the dominant regional wind patterns. However, as the dataset provides daily averages, it is important to recognize that these results represent a single snapshot of the hydrodynamic response of Deception Island during the extreme event, rather than its full temporal evolution.
Finally, Fig. 15c shows the current velocity distribution, where the highest values (above 0.6 m s−1) are observed along the coastal boundaries, especially near the eastern and northern sectors of the island. This pattern is consistent with the bathymetric constraints and tidally driven circulation patterns identified in the previous Antarctic hydrodynamic modelling efforts of Torrecillas et al. (2024). Overall, the strong coupling between wind forcing, wave dynamics, and current circulation during extreme events at Deception Island can be observed. The spatial distribution of these variables highlights the role of atmospheric forcing and island topography in shaping hydrodynamic responses, contributing to a better understanding of the dynamics of extreme events on the island and their potential implications for coastal processes and sediment transport in the region.
While this case study illustrates the dynamic response of the system to an extreme weather event, the dataset also provides an opportunity for future analyses on the frequency and intensity of such events in relation to large-scale climate variability. Investigating long-term trends and their potential links to climate change, including the role of SAM and ENSO, could offer valuable insights into the evolving risk of extreme hydrodynamic conditions in the Antarctic Peninsula region.
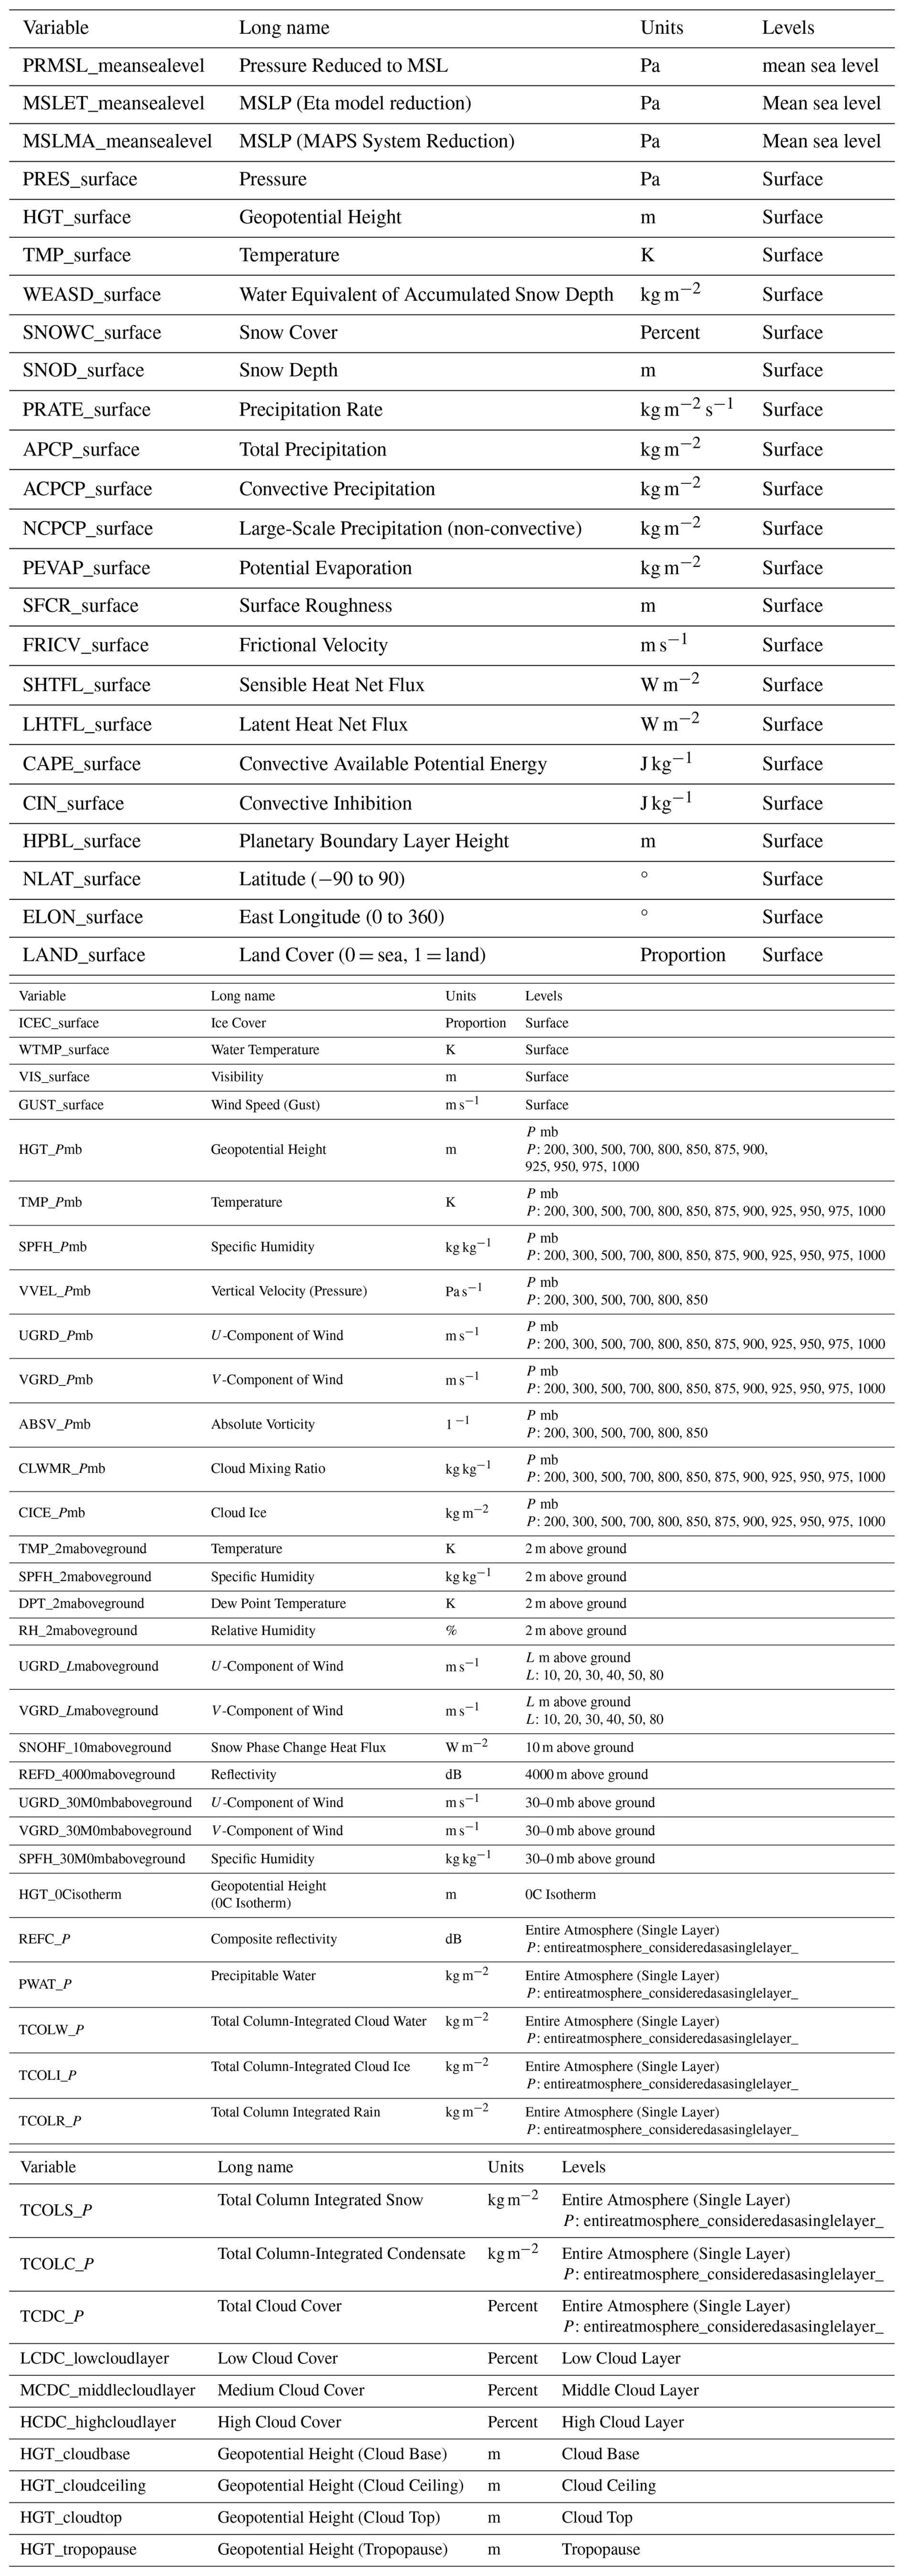
The complete atmospheric dataset is stored in yearly NetCDF files for the 1 km SMALL grid (Fig. 2). Each file contains hourly information on a (x=19, y=20) Lambert conformal curvilinear grid for 161 atmospheric variables listed in Table A1, including the 10 m wind field (UGRD_10maboveground and VGRD_10maboveground) and pressure (PRMSL_meansealevel) used as input for the hydrodynamic simulations. The full atmospheric dataset from the WRF simulations comprising all 161 variables can be accessed through the ZENODO open-access data repository, https://doi.org/10.5281/zenodo.14845212 (Ferrari and Lira-Loarca, 2025). The dataset employs a consistent file naming convention as follows: WRF_ANTARTICA_1km_〈YY〉_SMALL.nc, where 〈YY〉 represents each year of the simulation.
The hydrodynamic data presented in this article are freely available at the ZENODO repository. See https://doi.org/10.5281/zenodo.14870881 (Zarzuelo et al., 2025). The datasets are published in MATLAB format (.mat) with the hourly and daily modelled results. The data files (water level, current, and wave climate) are explicitly named and contain extensive metadata in the header, indicating whether the data correspond to specific observation points or the full model domain:
-
Point-specific hydrodynamic model data: Hydrodynamics_PtX, where X represents the station number.
-
Full hydrodynamic model domain: data20XX, where 20XX represents the simulation year.
A unique and comprehensive dataset has been developed for Deception Island, Antarctica, combining the WRF atmospheric model and a hydrodynamic model forced using the FLOW and WAVE modules. The resulting atmospheric dataset includes 161 atmospheric variables such as precipitation, temperature, pressure at mean sea level, wind velocity, and relative humidity among other. The hydrodynamic datasets includes water level, current velocity, significant wave height, mean wave period, and wave direction, providing high spatial and temporal resolution data that capture the complex dynamics of the island's environment, including extreme events.
This dataset allows detailed analysis of the spatial, seasonal, and temporal variability of the island's hydrodynamics. It also provides insights into the impact of extreme events on these dynamics. As shown in the analyses, the dataset facilitates: (1) the study of the spatial variability of key atmospheric (wind speed, pressure) and hydrodynamic (water level and velocity) variables across the island, (2) information on seasonal variability, and (3) an understanding of the influence of extreme atmospheric conditions, such as intense wind events, on hydrodynamic variables.
Furthermore, the dataset can be used for various applications, such as investigating the influence of wind and waves on hydrodynamic processes, or assessing the interactions between physical and ecological dynamics on the island. The data can also be used to support long-term environmental monitoring and model development to better understand the potential impacts of future climate change, such as sea level rise or shifts in storm patterns, on the fragile Antarctic environment.
CZ, ALR, FF, and ALL conceptualized the study and the manuscript, performed data analysis and visualization, and prepared the original draft of the manuscript as well as reviewed and edited the final manuscript. FF set up the WRF atmospheric numerical model and performed the WRF downscaling simulations, ALR and CZ set up, calibrated, and validated the DELFT3D hydrodynamics numerical model, performed the hydrodynamic simulations and prepared the hydrodynamics dataset, ALL performed the validation of the WRF model, prepared the atmospheric and wave input data, contributed to the DELFT3D model set-up, and prepared the atmospheric dataset.
The contact author has declared that none of the authors has any competing interests.
Publisher's note: Copernicus Publications remains neutral with regard to jurisdictional claims made in the text, published maps, institutional affiliations, or any other geographical representation in this paper. While Copernicus Publications makes every effort to include appropriate place names, the final responsibility lies with the authors.
This research has been supported by the Spanish Ministry of Economy and Competitiveness (grant no. PID2021125895OA-I00 – RESILIENCE) and the Department of Economy, Knowledge, Business and Universities of the Andalusian Regional Government (grant no. A-TEP-88-UGR20).
This paper was edited by Sebastiano Piccolroaz and reviewed by Marina Amadori and one anonymous referee.
Angulo-Preckler, C., Pernet, P., García-Hernández, C., Kereszturi, G., Álvarez-Valero, A. M., Hopfenblatt, J., Gómez-Ballesteros, M., Otero, X. L., Caza, J., Ruiz-Fernández, J., and Geyer, A.: Volcanism and rapid sedimentation affect the benthic communities of Deception Island, Antarctica, Cont. Shelf Res., 220, 104404, https://doi.org/10.1016/j.csr.2021.104404, 2021. a
Antelo, B. J., Vidal, J., and Berrocoso, M.: Determination of the tide constituents at Livingston and Deception Islands (South Shetland Islands, Antarctica), using annual time series, Dyna, 82, 191, 209–218, 2015.
Baker, P. E., McReath, I., Harvey, M., Roobol, M., and Davies, T.: The geology of the South Shetland Islands: BAS Scientific Report 78, 1975, https://nora.nerc.ac.uk/id/eprint/509208/1/The geology of the South Shetland Islands (last access: 25 September 2025), 1975. a
Baldwin, R. and Smith Jr, K.: Temporal dynamics of particulate matter fluxes and sediment community response in Port Foster, Deception Island, Antarctica, Deep-Sea Res. Pt. II, 50, 1707–1725, 2003. a
Birkenmajer, K.: Volcanic succession at Deception Island, West Antarctica: a revised lithostratigraphic standard, Studia Geologica Polonica, 101, 27–82, 1992. a
Booij, N., Ris, R. C., and Holthuijsen, L. H.: A third-generation wave model for coastal regions: 1. Model description and validation, J. Geophys. Res.-Oceans, 104, 7649–7666, 1999. a
Cassola, F., Ferrari, F., and Mazzino, A.: Numerical simulations of Mediterranean heavy precipitation events with the WRF model: A verification exercise using different approaches, Atmos. Res., 164–165, 3–18, 2015. a
Clough, S., Shephard, M., Mlawer, E., Delamere, J., Iacono, M., Cady-Pereira, K., Boukabara, S., and Brown, P.: Atmospheric radiative transfer modeling: a summary of the AER codes, J. Quant. Spectrosc. Ra., 91, 233–244, https://doi.org/10.1016/j.jqsrt.2004.05.058, 2005. a
Convey, P. and Peck, L. S.: Antarctic environmental change and biological responses, Sci. Adv., 5, eaaz0888, https://doi.org/10.1126/sciadv.aaz0888, 2019. a
ESR – Earth & Space Research: Earth & Space Research Website, http://www.esr.org (last access: February 2024), 2024. a
EU CMEMS – Copernicus Marine Service Information: GLOBAL_REANALYSIS_WAV_001_032, Marine Data Store (MDS), https://doi.org/10.48670/moi-00022, 2024. a
Ferrari, F. and Lira-Loarca, A.: High-resolution atmospheric dataset at Deception Island, Antarctica, Zenodo [data set], https://doi.org/10.5281/zenodo.14845212, 2025. a, b, c
Figueiredo, D., Dos Santos, A., Mateus, M., and Pinto, L.: Hydrodynamic modelling of Port Foster, Deception Island, Antarctica, Antarct. Sci., 30, 115–124, 2018. a
Flexas, M. M., Arias, M. R., and Ojeda, M. A.: Hydrography and dynamics of Port Foster, Deception Island, Antarctica, Antarct. Scie., 29, 83–93, 2017. a, b, c, d
Geyer, A., Pedrazzi, D., Almendros, J., Berrocoso, M., López-Martínez, J., Maestro, A., Carmona, E., Álvarez-Valero, A., and De Gil, A.: Deception Island, Geological Society, London, Memoirs, 55, 667–693, https://doi.org/10.1144/M55-2018-56, 2021. a
Grell, G. A. and Freitas, S. R.: A scale and aerosol aware stochastic convective parameterization for weather and air quality modeling, Atmos. Chem. Phys., 14, 5233–5250, https://doi.org/10.5194/acp-14-5233-2014, 2014. a
Herbold, C. W., Lee, C. K., McDonald, I. R., and Cary, S. C.: Evidence of global-scale aeolian dispersal and endemism in isolated geothermal microbial communities of Antarctica, Nat. Commun., 5, 3875, https://doi.org/10.1038/ncomms4875, 2014. a
Hersbach, H., Bell, B., Berrisford, P., Hirahara, S., Horányi, A., Muñoz-Sabater, J., Nicolas, J., Peubey, C., Radu, R., Schepers, D., Simmons, A., Soci, C., Abdalla, S., Abellan, X., Balsamo, G., Bechtold, P., Biavati, G., Bidlot, J., Bonavita, M., De Chiara, G., Dahlgren, P., Dee, D., Diamantakis, M., Dragani, R., Flemming, J., Forbes, R., Fuentes, M., Geer, A., Haimberger, L., Healy, S., Hogan, R. J., Hólm, E., Janisková, M., Keeley, S., Laloyaux, P., Lopez, P., Lupu, C., Radnoti, G., de Rosnay, P., Rozum, I., Vamborg, F., Villaume, S., and Thépaut, J.-N.: The ERA5 global reanalysis, Q. J. Roy. Meteorol. Soc., 146, 1999–2049, https://doi.org/10.1002/qj.3803, 2020. a, b
Holthuijsen, L. H.: Waves in oceanic and coastal waters, Cambridge University Press, ISBN 100511270216, 2010. a
Jigena, B., Vidal, J., and Berrocoso, M.: Determination of the mean sea level at Deception and Livingston islands, Antarctica, Antarct. Sci., 27, 101–102, 2015. a, b
Lesser, G. R., Roelvink, J. v., van Kester, J. T. M., and Stelling, G.: Development and validation of a three-dimensional morphological model, Coast. Eng., 51, 883–915, 2004. a, b
Machado, J. T., Baleanu, D., and Luo, A. CJ. and, Vidal, J., and Berrocoso, M., and Jigena, B.: Hydrodynamic modeling of port foster, Deception Island (Antarctica), Nonlinear and complex dynamics: applications in physical, biological, and financial systems, Springer, 193–203, 2011.
Marshall, G. J.: Trends in the Southern Annular Mode from observations and reanalyses, J. Climate, 16, 4134–4143, 2003. a
Nakanishi, M. and Niino, H.: An Improved Mellor–Yamada Level-3 Model: Its Numerical Stability and Application to a Regional Prediction of Advection Fog, Bound.-Lay. Meteorol., 150, 1003–1021, 2006. a
Olson, J. B., Smirnova, T., Kenyon, J. S., Turner, D. D., Brown, J. M., Zheng, W., , and Green, B. W.: A Description of the MYNN Surface-Layer Scheme, Tech. rep., National Oceanic and Atmospheric Administration, https://doi.org/10.25923/f6a8-bc75, 2021. a
Orheim, O.: Deception Island: A potential geothermal resource in Antarctica, Polar Rec., 21, 119–129, 1982. a
Rodi, W.: Turbulence models and their application in hydraulics, Routledge, https://doi.org/10.1201/9780203734896, 2017. a
Skamarock, W. C.: A description of the advanced research WRF version 3, Tech. Note, U.S. National Center for Atmospheric Research, https://doi.org/10.5065/D68S4MVH, 1–96, 2008. a
Smellie, J.: Lithostratigraphy and volcanic evolution of deception island, South Shetland Islands, Antarct. Sci., 13, 188–209, 2001. a, b
Smellie, J., López-Martínez, J., Headland, R., Hernández-Cifuentes, F., Maestro, A., Millar, I., Rey, J., Serrano, E., Somoza, L., and Thomson, J.: Geology and geomorphology of Deception Island, British Antarctic Survey, vol. 36, 2002, ISBN 9780856651762, https://nora.nerc.ac.uk/id/eprint/17439 (last access: 25 September 2025), 2002. a, b
Thompson, G., Rasmussen, R. M., and Manning, K.: Explicit forecasts of winter precipitation using an improved bulk microphysics scheme. Part I: Description and sensitivity analysis, Mon. Weather Rev., 132, 519–542, 2004. a
Torrecillas, C., Zarzuelo, C., de la Fuente, J., Jigena-Antelo, B., and Prates, G.: Evaluation and Modelling of the Coastal Geomorphological Changes of Deception Island since the 1970 Eruption and Its Involvement in Research Activity, Remote Sens., 16, 512, https://doi.org/10.3390/rs16030512, 2024. a, b
Xue, J., Xiao, Z., Bromwich, D. H., and Bai, L.: Polar WRF V4.1.1 simulation and evaluation for the Antarctic and Southern Ocean, Front. Earth Sci, 16, 1005–1024, https://doi.org/10.1007/s11707-022-0971-8, 2022. a
Zarzuelo, C., López-Ruiz, A., and Ortega-Sánchez, M.: The Role of Waves and Heat Exchange in the Hydrodynamics of Multi-Basin Bays: The Example of Cádiz Bay (Southern Spain), J. Geophys. Res.-Oceans, 126, e2020JC016346, https://doi.org/10.1029/2020JC016346, 2021. a
Zarzuelo, C., Lira-Loarca, A., Ferrari, F., and López-Ruiz, A.: Hydrodynamic numerical model data at Deception Island, Antartica, Zenodo [data set], https://doi.org/10.5281/zenodo.14870881, 2025. a, b, c