the Creative Commons Attribution 4.0 License.
the Creative Commons Attribution 4.0 License.
 | 11 Sep 2025
Rescue, integration, and analytical application of historical data from eight pioneering geomagnetic observatories in China
Suqin Zhang
Changhua Fu
Jianjun Wang
Chuanhua Chen
Guohao Zhu
Qian Zhao
Jun Chen
Shaopeng He
Bin Wang
Pengkun Guo
Na Deng
Jinghui Lu
Hongchi Yu
Decades to centuries of continuous geomagnetic observation data have extensive scientific research and practical application value, especially in revealing the long-term variation of the geomagnetic field, which is irreplaceable. During the International Geophysical Year (1957–1958), China established geomagnetic observatories in Beijing, Lhasa, Lanzhou, Wuhan, Guangzhou, Changchun, and Ürümqi, forming the initial structure of China's geomagnetic observation network together with the Shanghai Observatory. These observatories have continuously been in operation despite facing many challenges since their establishment, accumulating a large amount of valuable observational data, making significant contributions to the progress of geomagnetic scientific research and development. However, the scattered storage state of these historical data and the potential risk of damage pose a threat to the integrity and reliability of the data. This study conducted a rescue integration of the historical observational data from eight pioneering geomagnetic observatories in China, significantly improving data quality and facilitating long-term preservation and use of the data. This article introduces the basic conditions of eight observatories, including their locations, changes in location, observation environments, magnetic rooms, the magnetism of building materials, the layout of building facilities, measuring instruments, etc. These are the main prerequisites and foundations for ensuring the quality of observation data. Then, it introduces the integration and processing of historical data, including data collection, digitization, unification of formats, anomaly detection, and processing. Subsequently, the processed data were validated, including assessments of daily variations accuracy and long-term stability. The results show that the quality of the integrated historical data has been significantly improved. These datasets are of great value for improving historical geomagnetic field models, studying variable fields, main geomagnetic fields, and their long-term variations. Finally, we applied the data to the analysis and research of Sq and geomagnetic jerks, exploring the spatiotemporal variation characteristics of Sq and jerk in the China. Sq is mainly a daytime phenomenon, and its variation pattern in the middle- and low-latitude regions is mainly characterized by its dependence on latitude and local time. The geomagnetic jerk phenomenon exhibits significant regional differences and asynchronous occurrence times of jerks. Jerk events in 1969, 1979, 1991, 2003, and 2019 were observed at all observatories and had distinct jerk variation characteristics. Other jerks were only observed at some observatories or individual observatories. The maximum time difference for the occurrence of the same jerk event at different observatories was 2 years. This study aims to provide these precious datasets to the scientific community and the public so that these data can be integrated with data from other sources, thereby further exploring the spatiotemporal evolution and physical mechanisms of the geomagnetic field. The historical datasets of the eight geomagnetic observatories that have been integrated and quality-controlled are available at https://doi.org/10.5281/zenodo.15481895 (Zhang et al., 2025).
- Article
(6808 KB) - Full-text XML
- BibTeX
- EndNote


Geomagnetism is an observational science. Geomagnetic observation data contain rich information about the near-Earth space. By studying this information, we can not only gain a deep understanding of the physical properties and dynamics within the Earth, but also investigate the structure of the magnetosphere and ionosphere, as well as the impact of solar activity on the human living environment, which holds significant importance. The application scope of geomagnetic observation data is extensive, covering fields such as aerospace, communication, mineral resource exploration, underground pipeline networks, power systems, oil drilling, space weather forecasting, and earthquake prediction (Reay et al., 2005; Marshall et al., 2011; Bolduc et al., 2002; Boteler et al., 1998; Liu et al., 2008, 2016; Liu et al., 2009), attracting widespread attention from scientists around the world. In particular, constructing historical geomagnetic models and researching the evolution of the Earth's magnetic field and its related dynamic processes largely depend on precise measurement data of long-term changes in the geomagnetic field provided by geomagnetic observatories (Clarke et al., 2009; Soloviev et al., 2018; Gillet et al., 2013). Therefore, establishing and maintaining permanent geomagnetic observatories with a certain density and uniform distribution is crucial.
In 1834, German scientist Gauss established the world's first geomagnetic observatory to measure the three component absolute values of the geomagnetic field – the Göttingen Geomagnetic Observatory. The establishment of the Göttingen Geomagnetic Observatory marked the beginning of systematic observation and research of geomagnetic field changes. To gain a more comprehensive understanding and mastery of the change patterns of the geomagnetic field, scientists realized the necessity of establishing more observatories worldwide. Currently, over 130 geomagnetic observatories globally have joined INTERMAGNET worldwide, providing continuous, quasi-real-time online data (http://www.intermagnet.org, last access: 20 August 2025). These observatories are distributed around the world, forming a vast network for geomagnetic field observations.
In China, the first geomagnetic observatory was established in Beijing by Russian scientists in 1870 but ceased operations in 1882. In 1874, French missionaries established a geomagnetic observatory in Xujiahui, Shanghai, which was relocated to Lujiazui in 1908 and then to Sheshan in 1932, where it has continued to operate until now, becoming one of the longest-running geomagnetic observatories globally with nearly 150 years of continuous observation records. Additionally, the United Kingdom and Germany set up geomagnetic observatories in Hong Kong and Qingdao, respectively. From the 1930s to the 1940s, Chinese scholars established observatories in places such as Zijin Mountain in Nanjing, Liangfeng in Guangxi, and Beibei in Chongqing, but these observatories ceased operations before 1944.
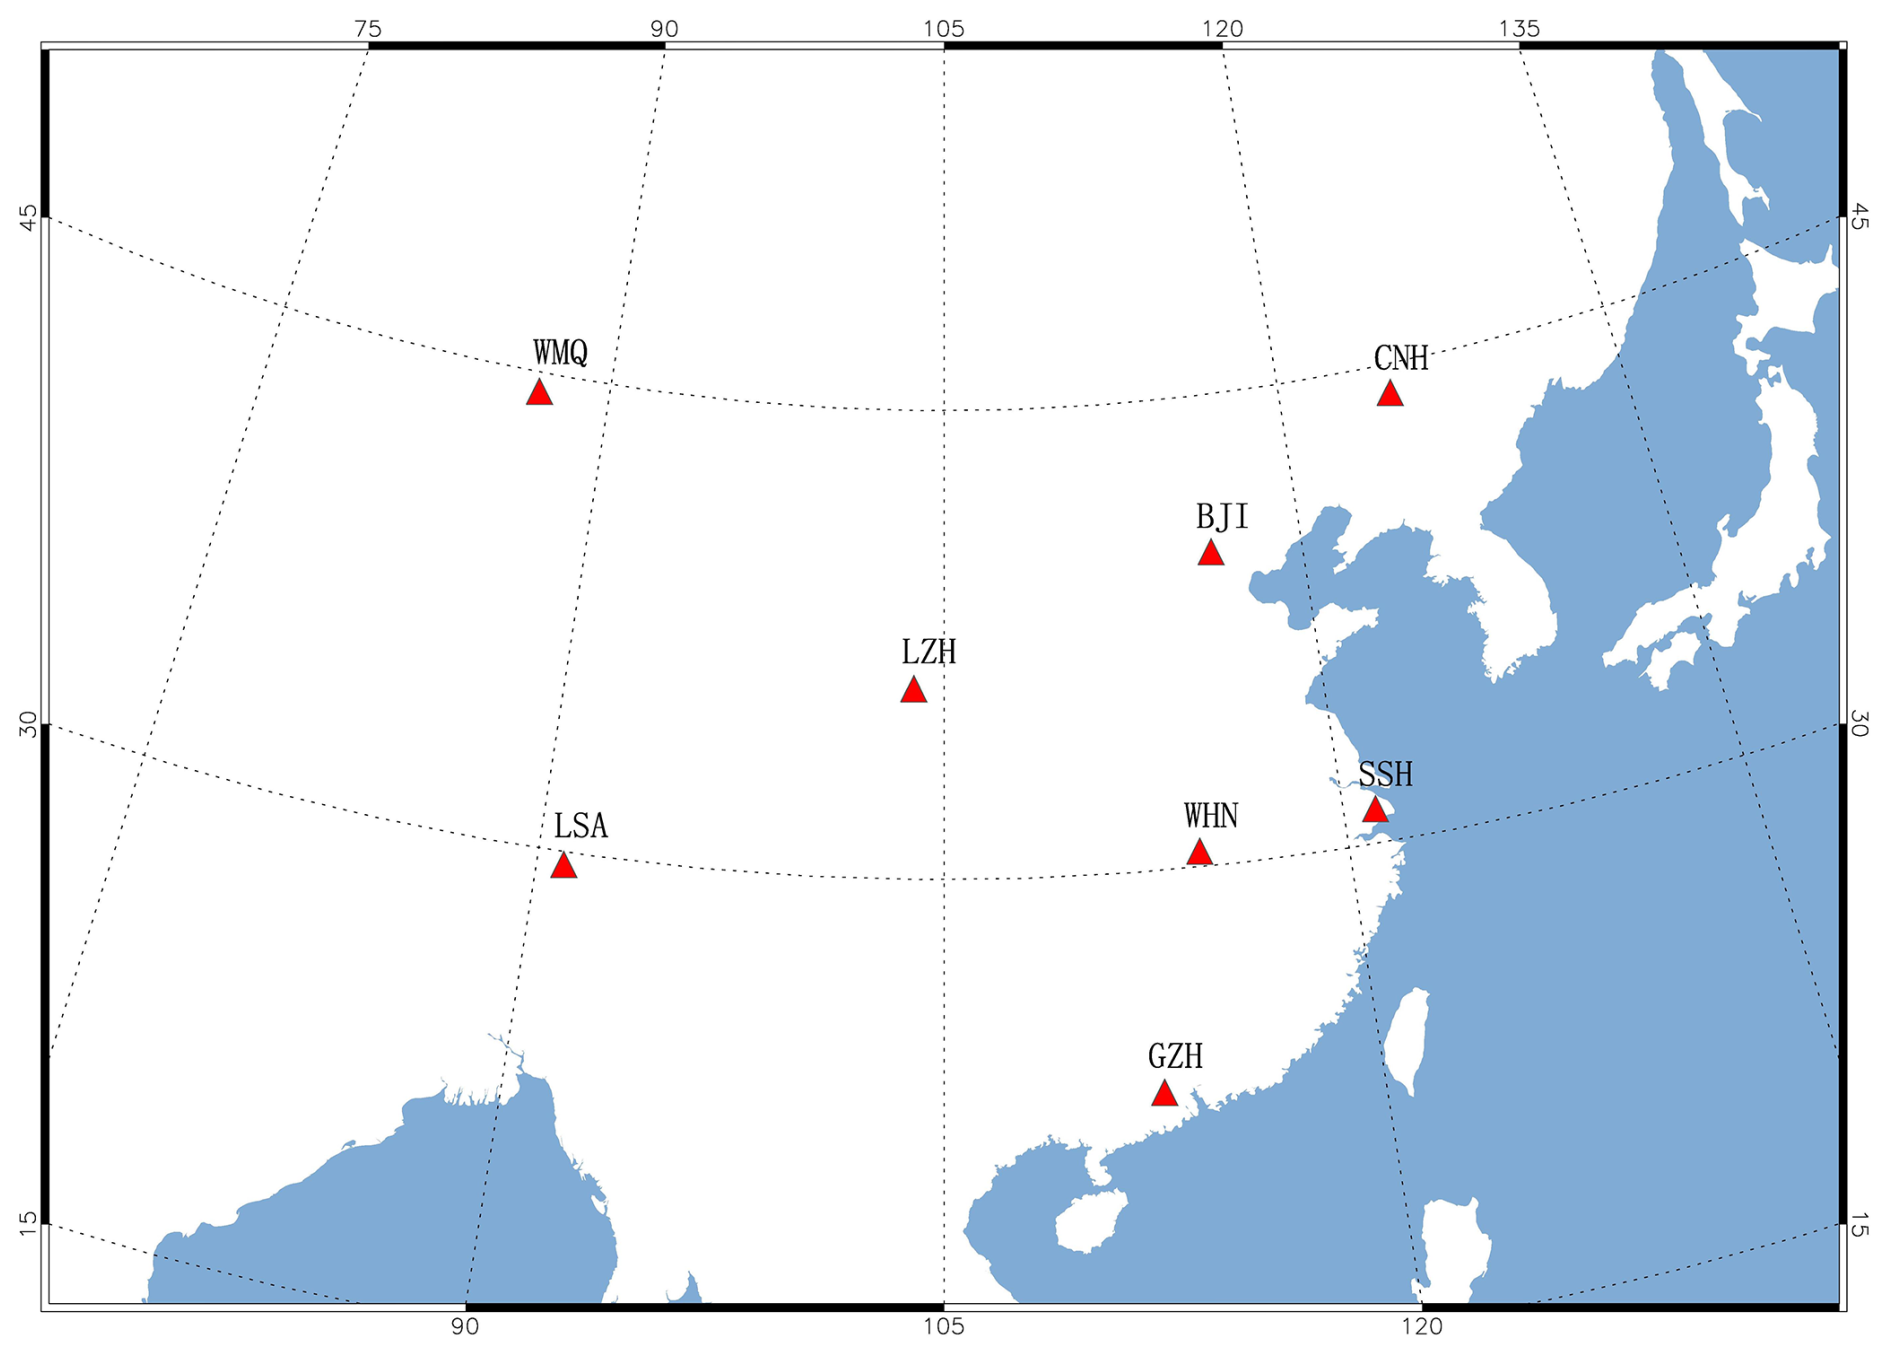
Figure 1Distribution map of the eight pioneering geomagnetic observatories in China.
During the International Geophysical Year, geomagnetic observatories were established in Beijing, Lhasa, Lanzhou, Wuhan, Guangzhou, Changchun, and Ürümqi by China, together with the Shanghai Observatory, forming the eight pioneering geomagnetic observatories in China, collectively known as the “Old Eight observatories”. The layout of these observatories is roughly cross-shaped (Fig. 1), forming the basic framework of geomagnetic observation network of China (Cheng, 1995). They undertake the critical task of monitoring the spatiotemporal changes of the geomagnetic field in China, laying the foundation for the construction and development of China's geomagnetic network and making significant contributions to the geomagnetic scientific research and development in China. In 1984, the “Old Eight observatories” were awarded the ”International Centennial Geomagnetic Observation Commemorative Medal” by the International Association of Geomagnetism and Aeronomy (IAGA) in recognition of their outstanding contributions in the global field of geophysical observation. As the “Old Eight observatories” with a long history of observations, they have accumulated a large amount of valuable data, becoming an important foundation for research in geomagnetism. However, historical materials are scattered, with a large portion existing in paper form, which is extremely inconvenient to use. Moreover, due to the long storage period, complex and harsh preservation conditions, these precious materials are facing severe risks of damage. Over time, these materials may be lost or damaged due to natural wear and tear, thus affecting their application in scientific research. Therefore, the rescue work of historical materials has always been a focus of attention in the global scientific community (Jonkers et al., 2003; Chulliat and Telali, 2007; Dawson et al., 2009; Dong et al., 2009; Korte et al., 2009; Reay et al., 2013; Morozova et al., 2014, 2021; Zhao et al., 2017; Sergeyeva et al., 2021; Zhang et al., 2022a).
Thanks to the advancement of the national special project for the rescue of historical data in the field of earthquakes by the China Earthquake Administration, we have carried out the rescue, organization, and analysis of these historical data. First, we collected observational data that were stored in various locations and in multiple media formats. Then, we digitized the paper materials using digital photography and manual entry and stored data from different periods and formats in a unified database for management. Subsequently, we conducted quality checks and processing on the data in the database and validated the processed data. Finally, we applied and analyzed these data. Systematically organizing and summarizing these data is of great significance for understanding the long-term evolution patterns of the geomagnetic field, also providing valuable data support for future related research.
Ensuring data quality is crucial for the reliability of research outcomes and the effectiveness of their application. The quality of geomagnetic data is influenced by a variety of factors, including the regional geomagnetic background conditions of the observation site (e.g., the foundation, topography), magnetic field gradient of the observation site, the magnetic properties of the building materials used, the layout of the magnetic room, the insulation of the observation room, the configuration and updating of observation instruments, measurement arrangements, and data processing, among others (Jankowski and Sucksdorff, 1996; CEA, 2004; Kudin et al., 2021; Linthe et al., 2013; Zhang et al., 2024). This section will provide a detailed introduction to the geomagnetic observation conditions at various observatories, including observatory site selection and historical changes, magnetic environment of the observatories, building materials, magnetic room layout, insulation conditions of the observation room, and the configuration of observation instruments.
2.1 Basic information on observatories
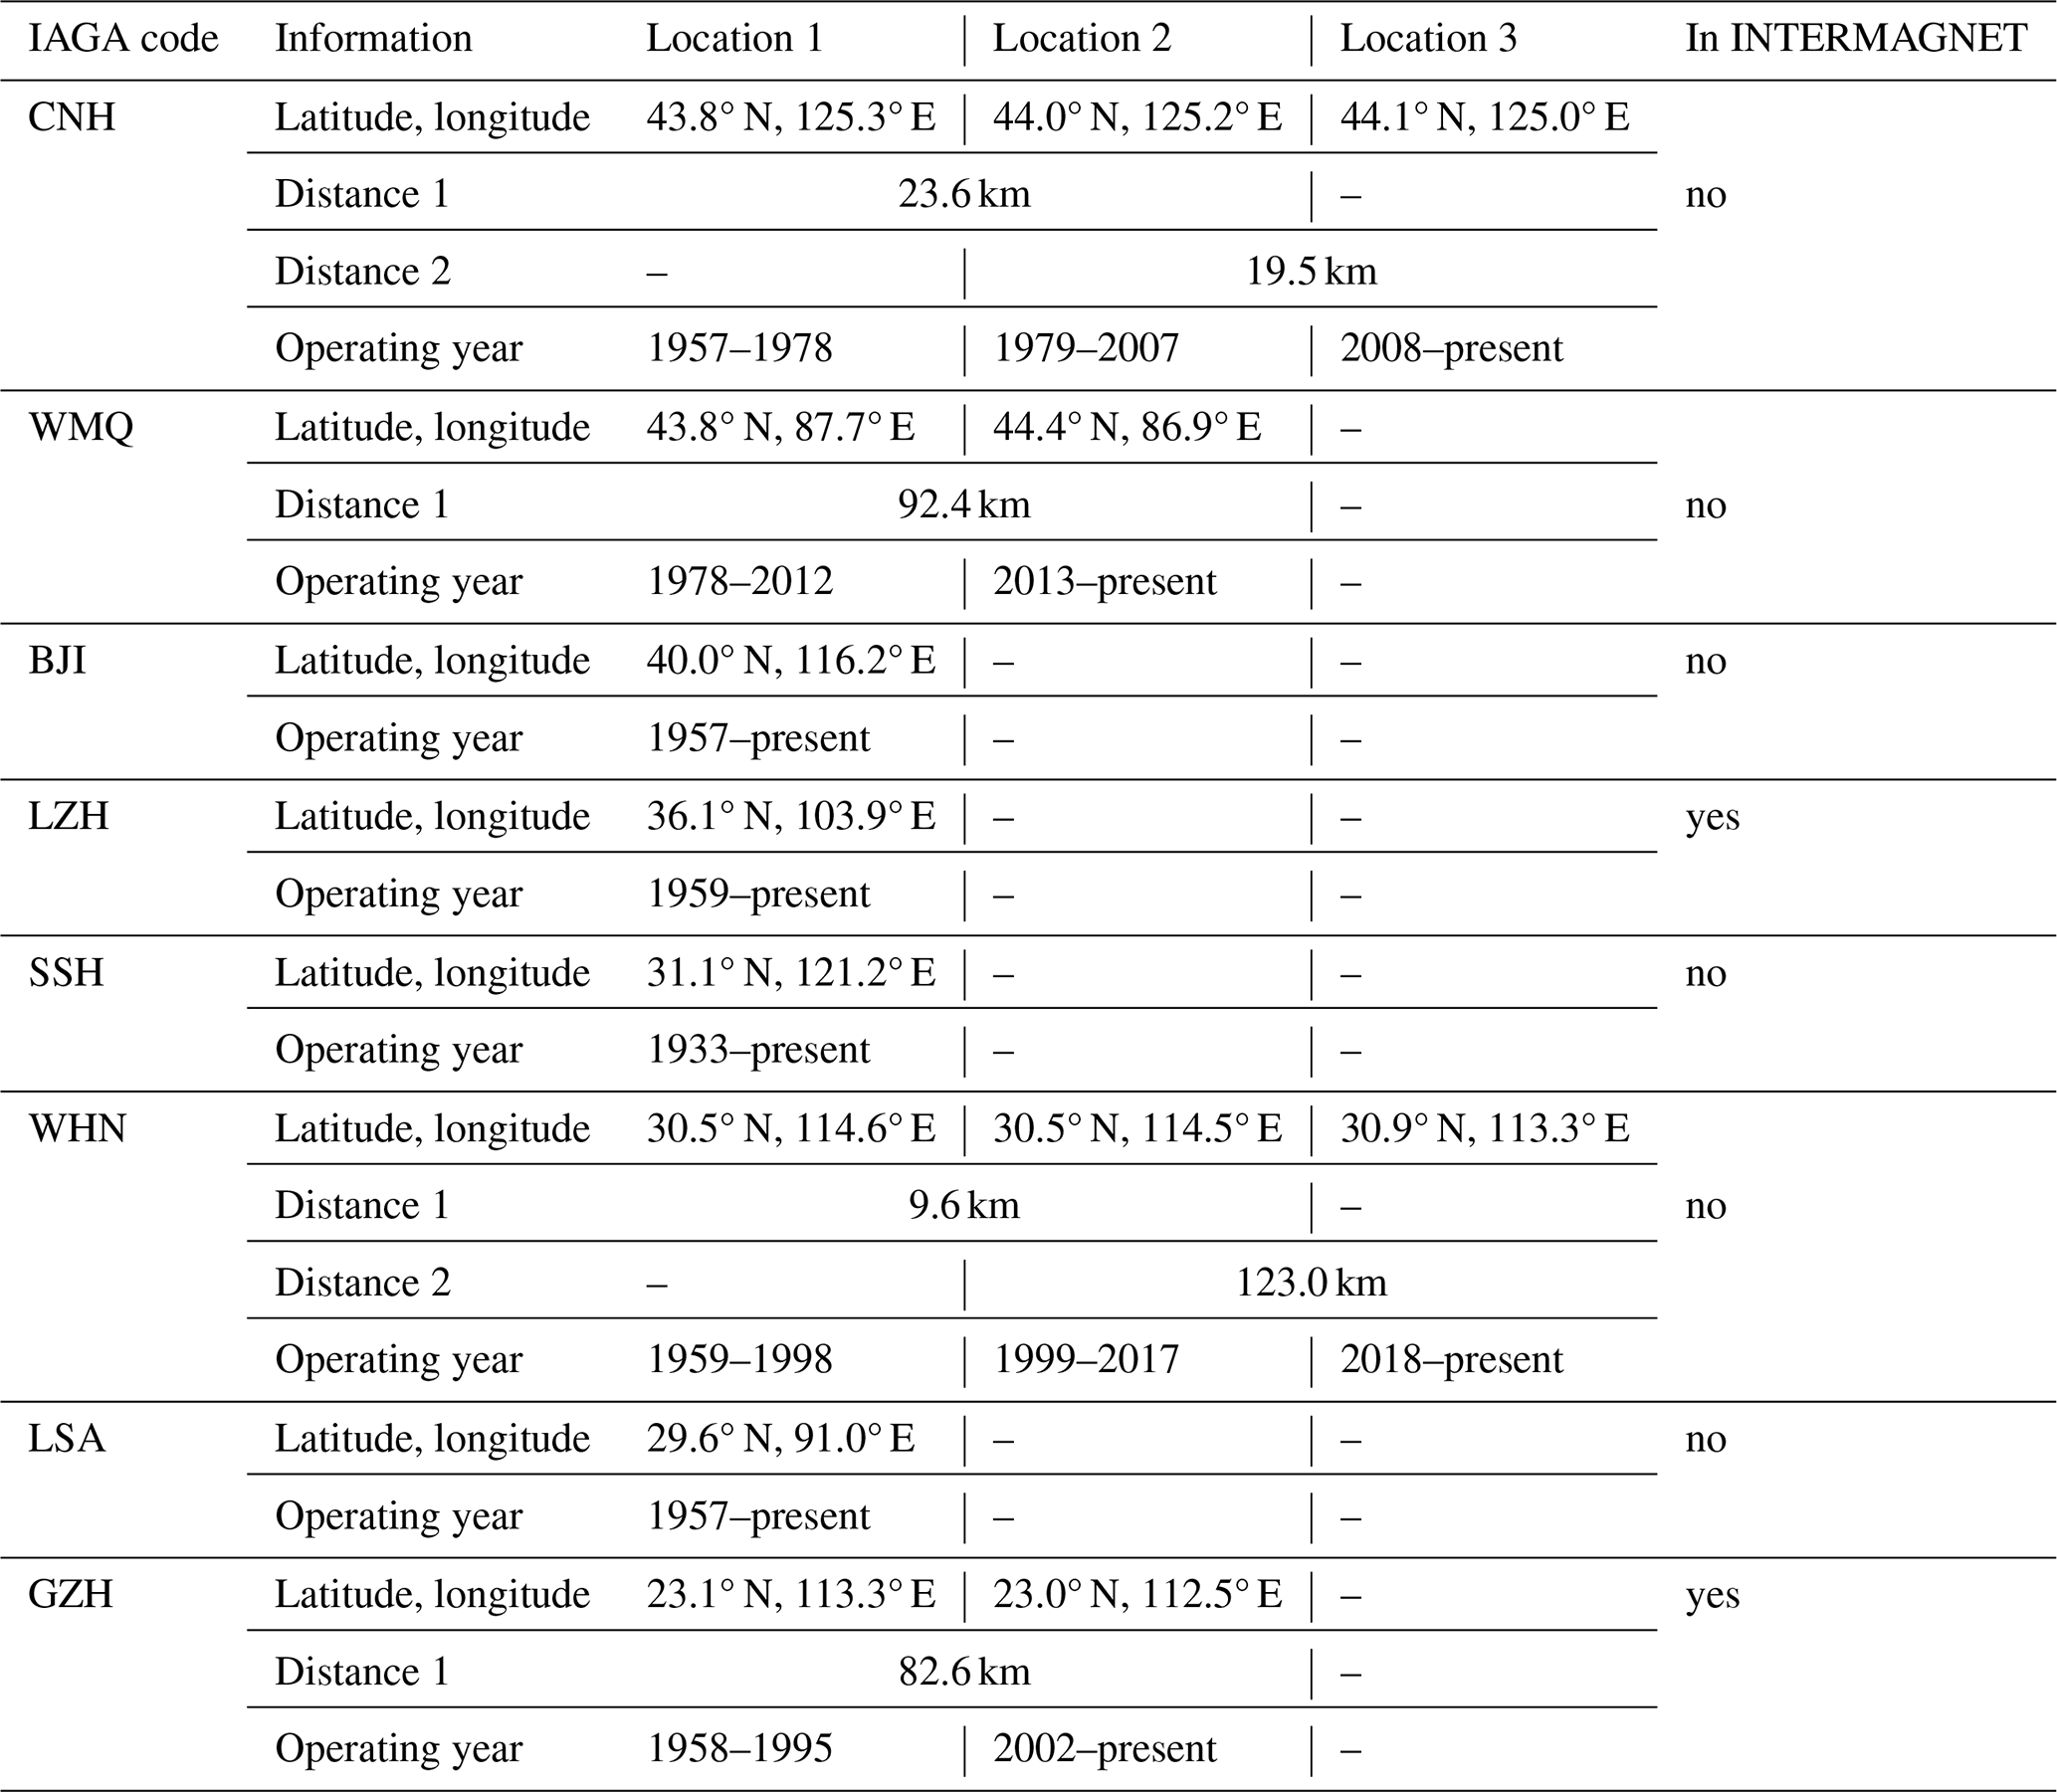
Table 1 shows the location information of the eight pioneering geomagnetic observatories and their changes. These data, covering the latitude and longitude of each site, the start and end years of the observatory's operation, the distance between old and new sites, and whether the observatories joined INTERMAGNET, are included in the yearbooks.
2.1.1 Changchun observatory (IAGA code CNH)
The Changchun observatory started construction in 1951 and is located in the Nanling area (43.8° N, 125.3° E) in the southern suburbs of Changchun City, Jilin Province. The observatory was completed in 1954 and underwent instrument installation and trial observations from 1954 to 1956. Formal observation work began in 1957. The geology foundation of the observatory and surrounding area is composed of Quaternary alluvial layers, approximately 30 m thick, consisting of loess and sub-clay.The magnetic field around the observatory is homogeneous, with a horizontal gradient less than 0.5 nT m−1. The absolute measurement house and variation recording room are integrated, with the absolute measurement house being a ground-level building and the recording room a semi-underground structure. It was built using weak magnetic materials such as limestone, wood, and copper. The annual temperature difference in the recording room is 16 °C, and the daily temperature difference is 0.5 °C.
Due to the rapid urbanization of Changchun City, the geomagnetic observations have inevitably been disturbed. Therefore, at the end of 1978, the Changchun observatory was relocated to Helong Town, Nong'an County, northwest of Changchun City (latitude 44.0° N, longitude 125.2° E). According to documented records (Sun, 2013), the site differences between the new and old observatories are a D: of −9.0′, an H of 26.6 nT, and a Z of −188.2 nT. The geology foundation of this site and surrounding area is Cretaceous strata, consisting of mudstone, shale, and fine sandstone. The magnetic field around the observatory is homogeneous, with a horizontal gradient less than 1 nT m−1. The absolute measurement house is a ground-level building, and the recording room is a semi-underground building. Both were constructed using weak-magnetic materials such as limestone, white bricks, pearl powder, copper, and wood. The annual temperature difference in the recording room is about 24 °C, and the daily temperature difference is about 0.5 °C.
Unfortunately, the construction of rail transit has once again caused interference in the geomagnetic observation. Consequently, the Changchun observatory was relocated to Sangan Township, Nong'an County (latitude 44.1° N, longitude 125.0° E), in 2007 and began normal observation on 1 June of the same year. The site differences between the new and old observatories are D: −4.56′, H: −45.6 nT, Z: −145.8 nT (Sun, 2013). The site was built on a base of Cretaceous Songhua River Group thick sedimentary strata, consisting of non-magnetic and weakly magnetic mudstones, siltstones, and sandstones, with a horizontal gradient of the ground magnetic field of less than 1 nT m−1. Both the absolute measurement house and the relative recording room were constructed with weak magnetic materials. The measurement house is a ground-level building, while the recording room is a fully underground structure, with loess covering providing natural insulation. The annual temperature difference in the recording room is about 8 °C, and the daily temperature difference is less than 0.3 °C.
2.1.2 Beijing Geomagnetic Observatory (IAGA code BJI)
The Beijing Geomagnetic Observatory started construction in 1952 and is located south of Baijiatuan Village in the western suburbs of Beijing (latitude 40.0° N, longitude 116.2° E); it was fully completed in 1954. In 1955, the observatory began to install observation instruments and started trial observation. In 1957, the Beijing Geomagnetic Observatory officially undertook the task of observation. The geology foundation of the observatory and surrounding area is composed of diluvial gravel layers, with Ordovician limestone buried more than 54 m below, and the upper part is covered with layers of sand, gravel, and pebbles. Within the observation area, the magnetic field gradient is less than 1 nT m−1. Both the absolute measurement house and the relative recording room were constructed with weak magnetic materials. The measurement house is a wooden and stone structure on the ground floor. The recording room is a semi-underground wooden and stone structure, with an annual temperature difference of 17 °C and a daily temperature difference of less than 0.3 °C. However, since 1995, with the acceleration of urbanization, the observation environment of the Beijing Geomagnetic Observatory has gradually been affected by surrounding construction projects. After 2012, with the opening of new subway lines, the interference in the observation environment has become increasingly severe.
2.1.3 Guangzhou Observatory (IAGA code GZH)
The Guangzhou Observatory (IAGA code GZH) started construction in 1954 and is located 10 km southeast of Guangzhou in Shiliugang (latitude 23.1° N, longitude 113.3° E). The observatory was completed in 1955 and was equipped with geomagnetic observation instruments the same year. In 1958, the Guangzhou Observatory officially began geomagnetic observations. The geology foundation of the observatory and surrounding area is composed of sandstone, with a homogeneous magnetic field distribution and a magnetic gradient of less than 1 nT m−1. Both the absolute measurement house and the relative recording room are ground-level buildings, constructed with weak magnetic materials such as limestone and wood. The daily temperature variation in the recording room is less than 0.2 °C, and the annual temperature variation is about 17 °C.
However, due to the construction of the Guangzhou rail transit and the South China Expressway, it was inevitable that interference would occur with geomagnetic observations. Therefore, the Guangzhou Observatory decided to relocate. The new site was chosen to be Shendang Village, Liantang Town, Gaoyao District, Zhaoqing City, approximately 120 km southwest of Guangzhou (latitude 23.0° N, longitude 112.5° E), and the site selection and positioning work were completed between 1996 and 1997. Construction of the new observatory began in November 2000 and was completed in December 2001. The old observatory ceased observations by the end of 1995. Thus, there were no observation data available from 1996 to 2001. The bedrock at the site is composed of Carboniferous limestone. The magnetic field around the observatory is homogeneous, with a magnetic field gradient of less than 1 nT m−1. Both the absolute measurement house and the relative recording room were constructed with weak magnetic reinforced concrete structures. The absolute measurement house is a ground-level building, while the recording room is a fully underground structure. The annual temperature difference in the recording room is less than 4 °C, and the daily temperature difference is less than 0.1 °C.
2.1.4 Wuhan Geomagnetic Observatory (IAGA code WHN)
The Wuhan Geomagnetic Observatory (IAGA code WHN) is located in the southeastern suburbs of Wuhan city, Hubei Province, in the town of Baozixie, Wuchang County (latitude 30.5° N, longitude 114.6° E). The construction of the observatory began in the spring of 1957 and was completed by December of the same year. In 1958, the instruments were installed and calibrated, and in 1959, the observatory officially began its observations. The observatory is built on a hill with a thick overburden, with a surface layer of yellow clay, where the distribution of the magnetic field gradient is relatively homogeneous, with a gradient of less than 1 nT m−1. Both the absolute measurement house and the recording room were constructed with weak magnetic materials as ground-level buildings. The annual temperature difference in the recording room is about 28 °C, and the daily temperature difference is generally less than 0.5 °C.
Later, affected by the rapid development of township enterprises, it was relocated in 1997 to Jiufeng Village within the territory of Baozixia Town (114.5° E, 30.5° N). In 1998, both the Jiufeng site and Baozixia site conducted 1-year geomagnetic observation work simultaneously. In 1999, the new site (Jiufeng site) officially began its observations. The site differences between the new and old observatories are a D of 0.2′, an H of −13 nT, and a Z of −55 nT (Institute of Geophysics, China Earthquake Administration, 2005). The geology foundation of Jiufeng site and surrounding area is mainly composed of Upper Triassic quartz sandstone, with thin layers of marl interbedded within. The magnetic field around the observatory is homogeneous, with a magnetic gradient less than 1 nT m−1. The absolute measurement house and recording room were both constructed with weak-magnetic materials; the measurement house is a ground structure made of wood and stone, while the recording room is a ground structure made of copper, stone, and plastic, covered with a 3 m thick soil layer. The indoor daily temperature difference is less than 0.1 °C, and the annual temperature difference is less than 9.0 °C.
Due to the influence of the subway, it was relocated to Tangchi Town, Yingcheng City, Hubei Province (30.9° N, 113.3° E) in 2017. Due to the severe impact on the observation environment at the Jiufeng site, parallel observations were not conducted at the Jiufeng site and Yingcheng site. The geology foundation of Yingcheng site and surrounding area is made of limestone with a maximum thickness of 7.4 m. The magnetic field gradient is less than 1 nT m−1. Both the absolute measurement house and the relative recording room are ground buildings made of weak-magnetic wooden and stone structures. The daily temperature difference in the recording room is about 0.1 °C, and the annual temperature difference is about 15 °C.
2.1.5 Sheshan Magnetic Observatory (IAGA code SSH)
The Sheshan Geomagnetic Observatory (IAGA code SSH) and its predecessors have the longest continuous data series. The construction that started in 1874 was in Xujiahu in Shanghai (1874–1908). Due to the construction of tram lines passing through Xujiahu in 1907, which inevitably interfered with geomagnetic recordings, the observatory was relocated to Lukjapu, Kunshan (1908–1933), in 1908. Later, because of the construction of the Beijing–Shanghai Railway, it was moved to its current location in Songjiang District, Sheshan, Shanghai (since 1932). The SSH Geomagnetic Observatory is located about 20 km southwest of Shanghai in the Xisheshan area of Songjiang District (31.1° N, 121.2° E). With nearly 150 years of history, it is one of the longest-operating geomagnetic observatories in China and the world. The geology foundation of the observatory and surrounding area is mainly composed of medium to acidic andesite from the Upper Jurassic to Lower Cretaceous periods. The magnetic field gradient is 2–3 nT m−1. Both the absolute measurement house and the relative recording room are constructed using materials with weak magnetic materials. The daily temperature difference in the recording room is less than 0.2 °C, and the annual temperature difference is about 15 °C.
2.1.6 Lhasa Observatory (IAGA code LSA)
The Lhasa Observatory (IAGA code LSA) is located on the western outskirts of Lhasa City (29.6° N, 91.0° E). Construction of the observatory began in 1956 and was completed in 1957, and it started formal observations in July of the same year (Zhou, 2013). Due to instrument failure, the observatory suspended its observation work from 1974 to 1982 and resumed in 1983. The Lhasa Observatory was the first highland geophysical observatory established in the world and was, at the time, the highest altitude geomagnetic observatory globally, with an elevation of 3655 m. It is located in the central part of the alluvial basin of the Lhasa River valley in the suburbs of the city. The magnetic field gradient at the observation site is about 1 nT m−1 and is relatively homogeneous. Both the absolute measurement house and the recording room are non-magnetic ground buildings made of limestone, earth bricks, and wood structures. The daily temperature difference inside the recording room is less than 0.2 °C, and the annual temperature difference is about 19 °C.
2.1.7 Lanzhou Observatory (IAGA code LZH)
The Lanzhou Geomagnetic Observatory (IAGA code LZH) is located at Liujiaping, north of the Yellow River in Lanzhou City (36.1° N, 103.9° E). Construction began in 1956 and was completed in 1957. Geomagnetic instruments were installed in 1958, and trial observation was started. It officially commenced observation on 1 January 1959. The observatory is situated at Liujiaping, north of the Yellow River in Lanzhou City. The geology foundation of the observatory and surrounding area is mainly Quaternary loess layers. The ground magnetic field gradient is about 1 nT m−1 and is relatively homogeneous. Both the absolute measurement house and the relative recording room use non-magnetic or weakly magnetic stones and earth bricks, as well as wooden structures for construction. The absolute measurement house is a ground-level building, while the recording room is an underground structure with a daily temperature difference of 0.3 °C and an annual temperature variation of no more than 10 °C.
2.1.8 Ürümqi Observatory (IAGA code WMQ)
The Ürümqi Observatory (IAGA code WMQ) was established in 1964 and officially began its observations in 1970. However, due to the long-term instability of the instruments, the first geomagnetic observation report was not officially published until 1978. The observatory is located in the eastern suburbs of Ürümqi, Xinjiang Uygur Autonomous Region, 10 km from the city center in Shuimogou (43.8° N, 87.7° E). The geology foundation of the observatory and surrounding area consists of Triassic sandstone and mudstone, with a Quaternary loess layer approximately 4 m thick covering it. The ground magnetic field gradient is less than 1 nT m−1. Both the absolute measurement house and the recording room are ground buildings, constructed using weak magnetic soil bricks and a wooden stone structure. The annual temperature difference in the recording room is less than 8 °C, and the daily temperature difference is less than 0.3 °C.
Later, due to urban expansion and rapid socioeconomic development, the observation was significantly affected. Therefore, in 2012, the Ürümqi Observatory was relocated to Yuanhucun Village, Hutubi County, Changji Hui Autonomous Prefecture, about 80 km northwest of Ürümqi City (44.4° N, 86.9° E). The old observatory ceased operations in December 2012, while the new observatory officially began its observation on 1 January 2013. In 2012, both the Shuimogou site and Hutubi site conducted 1-year geomagnetic observation work simultaneously. The site differences between the new and old observatories are a D of −20′, an H of 420 nT, and a Z of −413 nT (Institute of Geophysics, China Earthquake Administration, 2012). The geology foundation of the Hutubi site is covered with loess layers, and the observation field area has a homogeneous geomagnetic field with a ground magnetic gradient of less than 1 nT m−1. The absolute measurement house and the recording room are both constructed with non-magnetic reinforced concrete and stone structures, with the absolute measurement house being a ground-level building and the recording room being a fully underground structure. The annual temperature difference in the recording room is less than 6 °C, and the daily temperature difference is less than 0.1 °C.
2.2 Instrument configuration
All eight observatories involved in this study are equipped with the absolute measurement house and the relative recording rooms. The absolute observation room is a ground-level building, while the relative recording room can be either at ground level or under ground. They are constructed using weak magnetic materials, providing an ideal environment for geomagnetic observations. Inside the absolute measurement house, the absolute measurement instruments are installed; in the relative recording room, the relative recording instruments are set up. The absolute measurement instrument is capable of measuring the absolute value of the geomagnetic field with high precision, but it cannot operate continuously; the relative recording instruments, on the other hand, can continuously record the changes in the geomagnetic field over long periods, although they cannot measure the absolute value of the geomagnetic field. Therefore, a combination of absolute observations and relative recordings is necessary to obtain long-term continuous absolute values of the geomagnetic field (Jankowski and Sucksdorf, 1996; Rasson, 2007). In China, absolute measurement instruments are commonly used to determine the three independent elements of the geomagnetic field: magnetic declination (D), magnetic inclination (I), and total intensity (F). Absolute measurements are scheduled twice a week, usually on Mondays and Thursdays. The relative recording instruments are mainly used to measure the three elements of magnetic declination (D), horizontal component (H), and vertical component (Z).
Before 1975, the absolute observation instruments used at the eight observatories were produced by foreign manufacturers, including Askania, Schmidt, Smith, Cooke, Mating, and QHM, and other types of magnetometers, which were used to measure the absolute values of the D, H, and I components. Relative record relied on the Type 57 and Type 72 magnetometers developed independently in China. In 1975, China successfully developed the CJ6 geomagnetic theodolite, after which this instrument was used to absolute measurement of magnetic declination and horizontal intensity. At the same time, they used proton precession magnetometers of the CZM, DTZ, and other types to measure the F total field. Entering the 21st century, the China Earthquake Administration initiated the Seismic Precursor Station (Network) Technical Renovation project, vigorously promoting the digitization observation of geomagnetic observatories, equipping them with GM-3 digital fluxgate magnetometers to continuously record changes in the geomagnetic field in the H, Z, and D components. In addition, they were equipped with CTM-DI fluxgate theodolites, combined with G856 proton precession magnetometers, to achieve absolute measurement of D, I, and F. Since 2007, the advancement of the China Digital Seismological Observation Network project has further updated and improved the observation instruments at the observatories, using MINGEO fluxgate theodolites and GSM-19T proton precession magnetometers for absolute measurement of D, I, and F and equipped with GM4 fluxgate magnetometers for continuous relative recording of the D, H, and Z components. At the same time, the GSM-90F1 Overhauser magnetometer was introduced for continuous recording of the F total field.
Table 2Instrument data sheet of geomagnetic observatory (Department of Monitoring and Prediction, China Earthquake Administration, 2008).
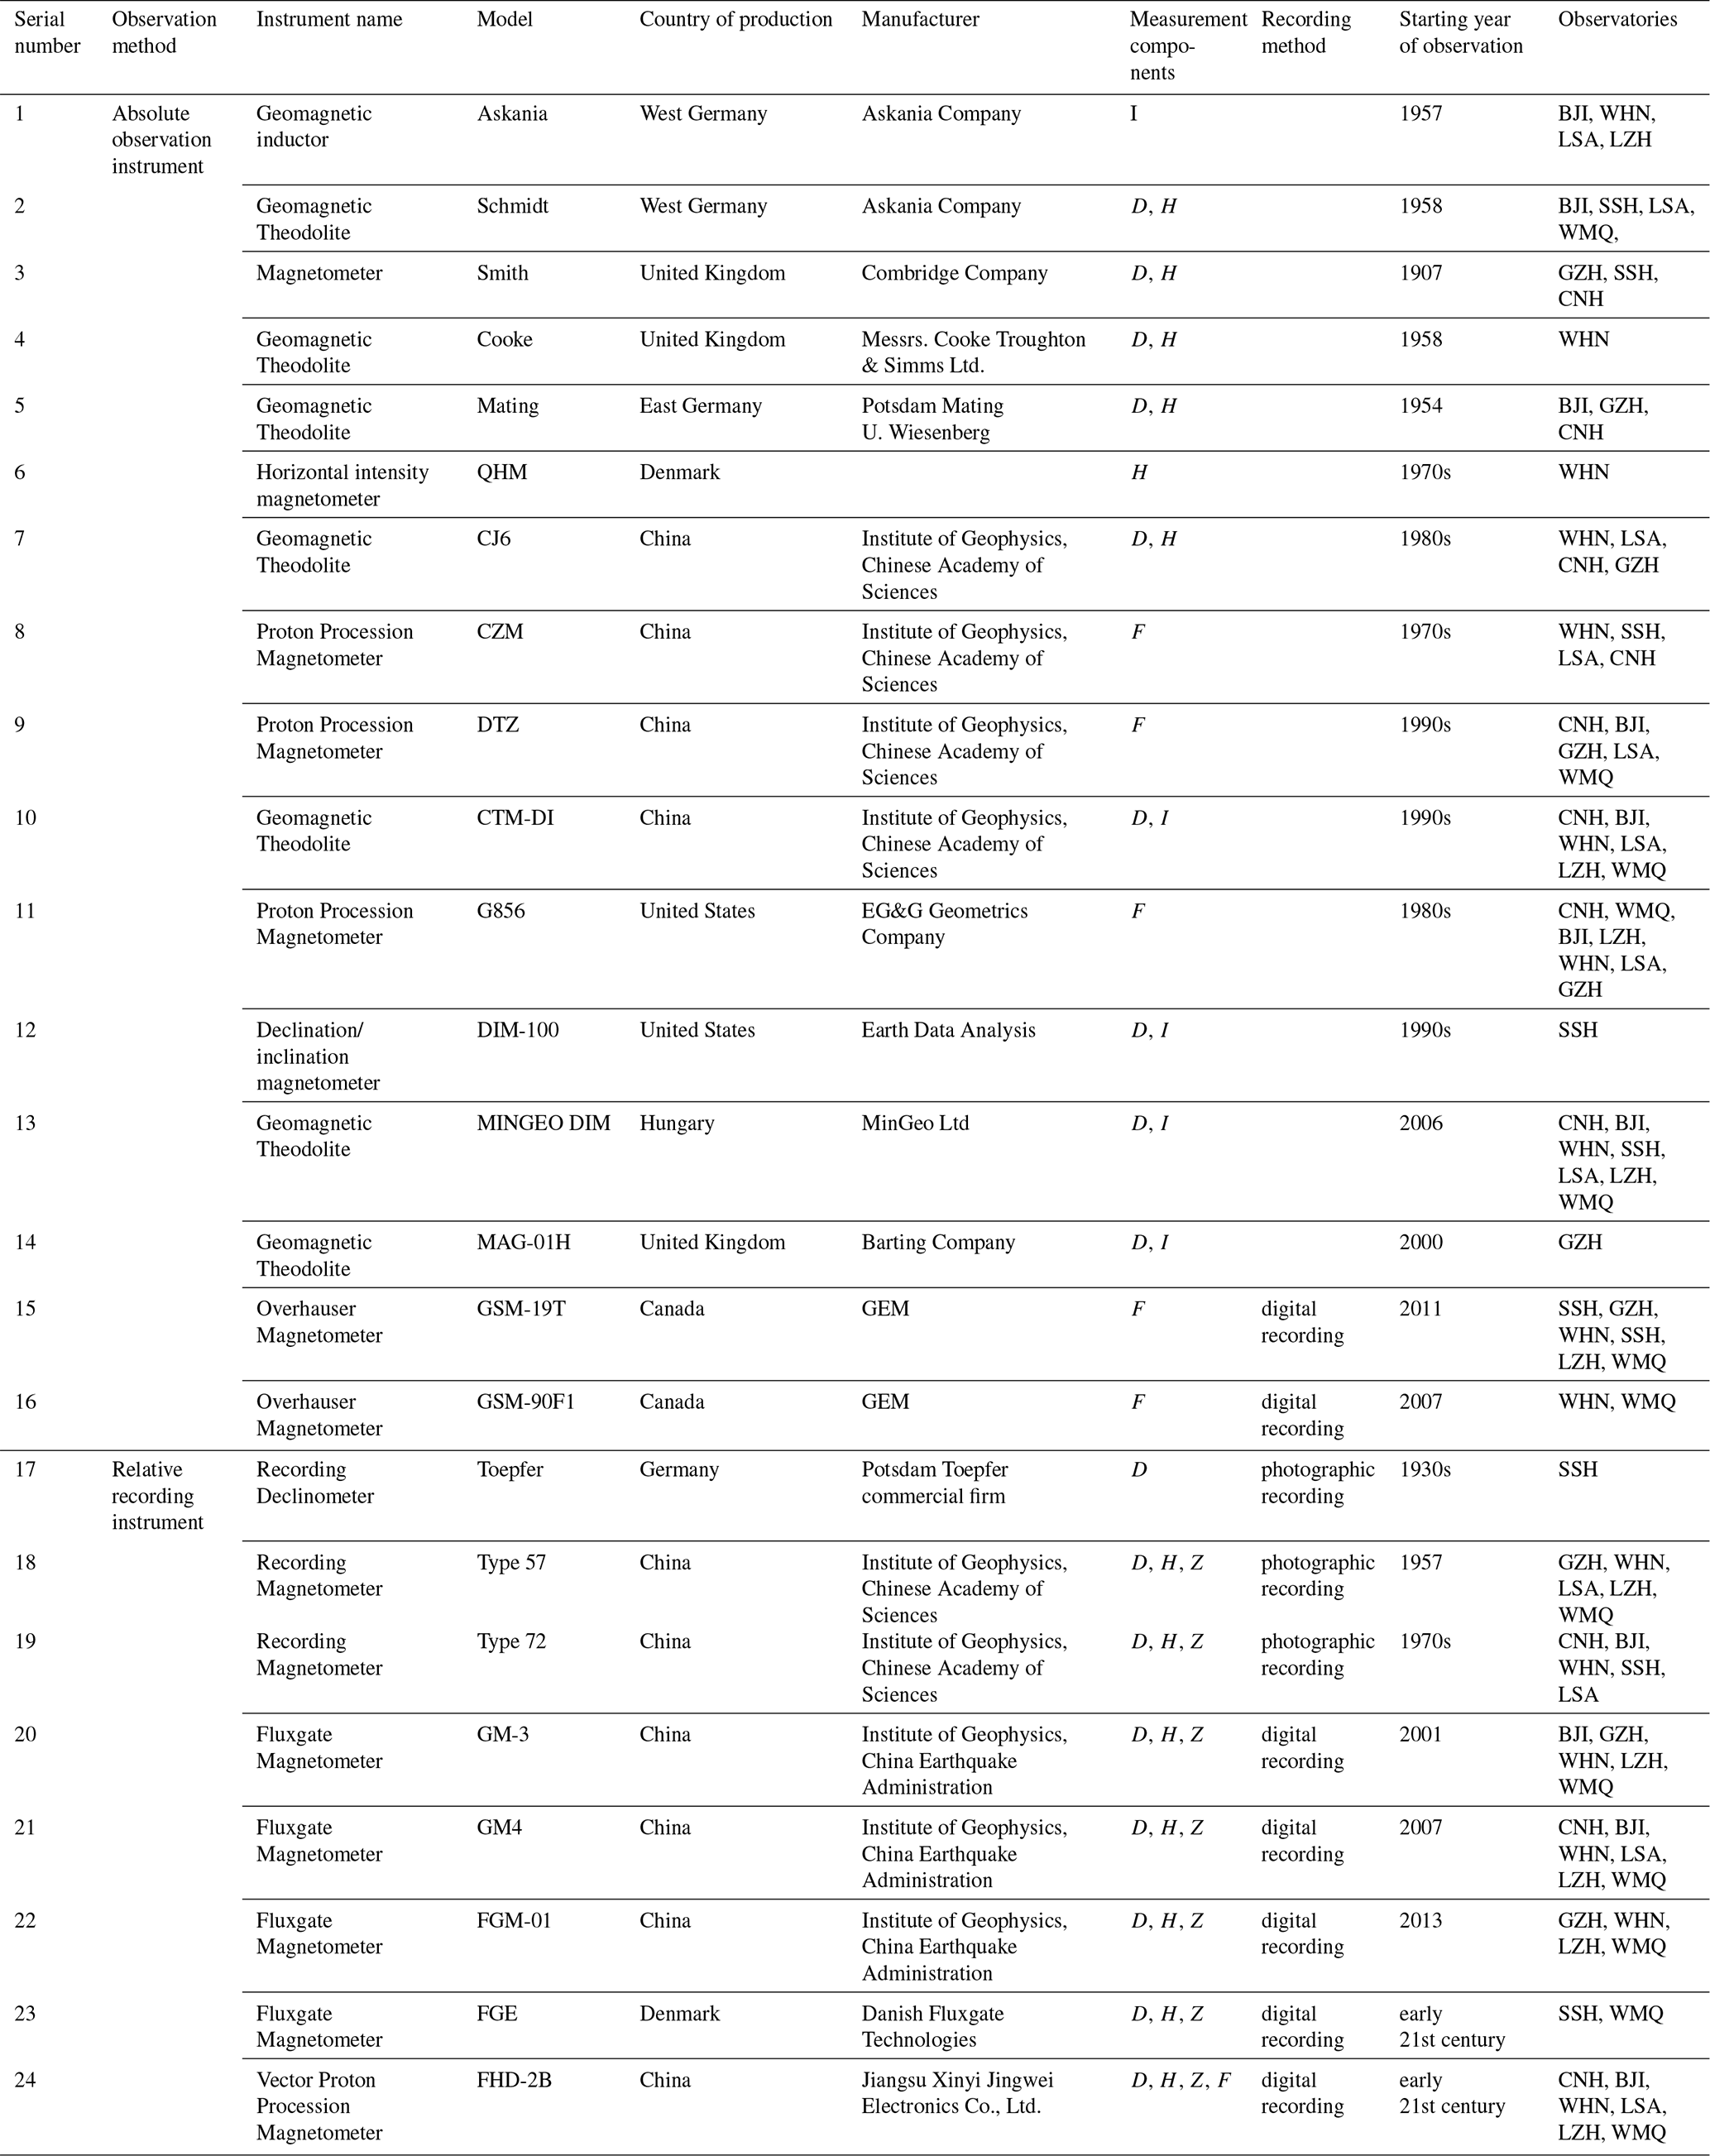
Table 2 provides a comprehensive listing of all instrument data adopted by eight geomagnetic observatories since 1933. This information includes the instrument models, types, countries and manufacturers of origin, measurement parameters, the year of first deployment at Chinese stations, and recording methods, as well as which specific stations have utilized these particular instruments.
2.3 Data collection, organization, digitization, and standardization
Given that these valuable historical materials are distributed across different observatories or administrative departments, it is difficult to query and access data resources. Limited by the historical conditions at the time, storage methods vary, with some records on paper carriers, others stored on outdated floppy disks and other storage media, and still others stored on modern hard drives. Due to the lack of unified standards and specifications, users find it difficult to obtain shared common data sources. Therefore, this study first aims to collect and organize these data from various scattered locations, including geomagnetic observatories and the archives of the Institute of Geophysics, China Earthquake Administration.
The data we collected prior to 1985 primarily originate from the observatory's paper-based annual reports. Continuous records from this period were achieved through photographic methods, and these records have already been published. However, due to the passage of time, we were unable to obtain the digital records from the time of publication. Therefore, We need to digitize the data from published numbers. For this portion of historical materials recorded on paper carriers, we have scanned and generated digital images stored on hard drives for long-term preservation. Since the paper materials have yellowed and exhibit low legibility, past experience has shown that the accuracy of digital image recognition software often falls short of manual entry (Zhang et al., 2022b). Therefore, we adopted a fully manual input approach to ensure the digitization accuracy of this portion of data.
From 1985 to 2001, data were saved on floppy disks. For data stored on floppy disks, we needed to find compatible reading devices. Since floppy disk drives are rare on modern computers, we had to search everywhere and finally found a compatible drive at a second-hand electronics market, thus achieving the migration of data from the floppy disk to the hard drive.
Data from 2002 to 2006 were stored in Access databases in MDB format, while data from 2007 onwards have been saved in Oracle databases. For data stored on modern hard drives, although technically easier to handle, we also needed to conduct a thorough inspection to ensure that the data were not damaged or lost.
We converted the above collected data into a standardized format and imported them into the database of Geomagnetic Network of China (GNC) for unified management and use. The data we integrated cover the absolute hourly mean values (AHMV) of the X (northward component), Y (eastward component), and Z components from the following observatories: CNH Observatory (1957–2022), BJI Observatory (1957–2022), LSA Observatory (1957–2022, but no observation data from 1974 to 1982 due to instrument failure), SSH Observatory (1933–2019, no observation from 2020–2022 due to renovation of the observation room), GZH Observatory (1958–2022, no observation data from 1996–2001 due to observatory relocation), WMQ Observatory (1978–2022), LZH Observatory (1959–2022), and WHN Observatory (1959–2022). The data after 2022 were not included because they were incomplete at the time of our analysis.
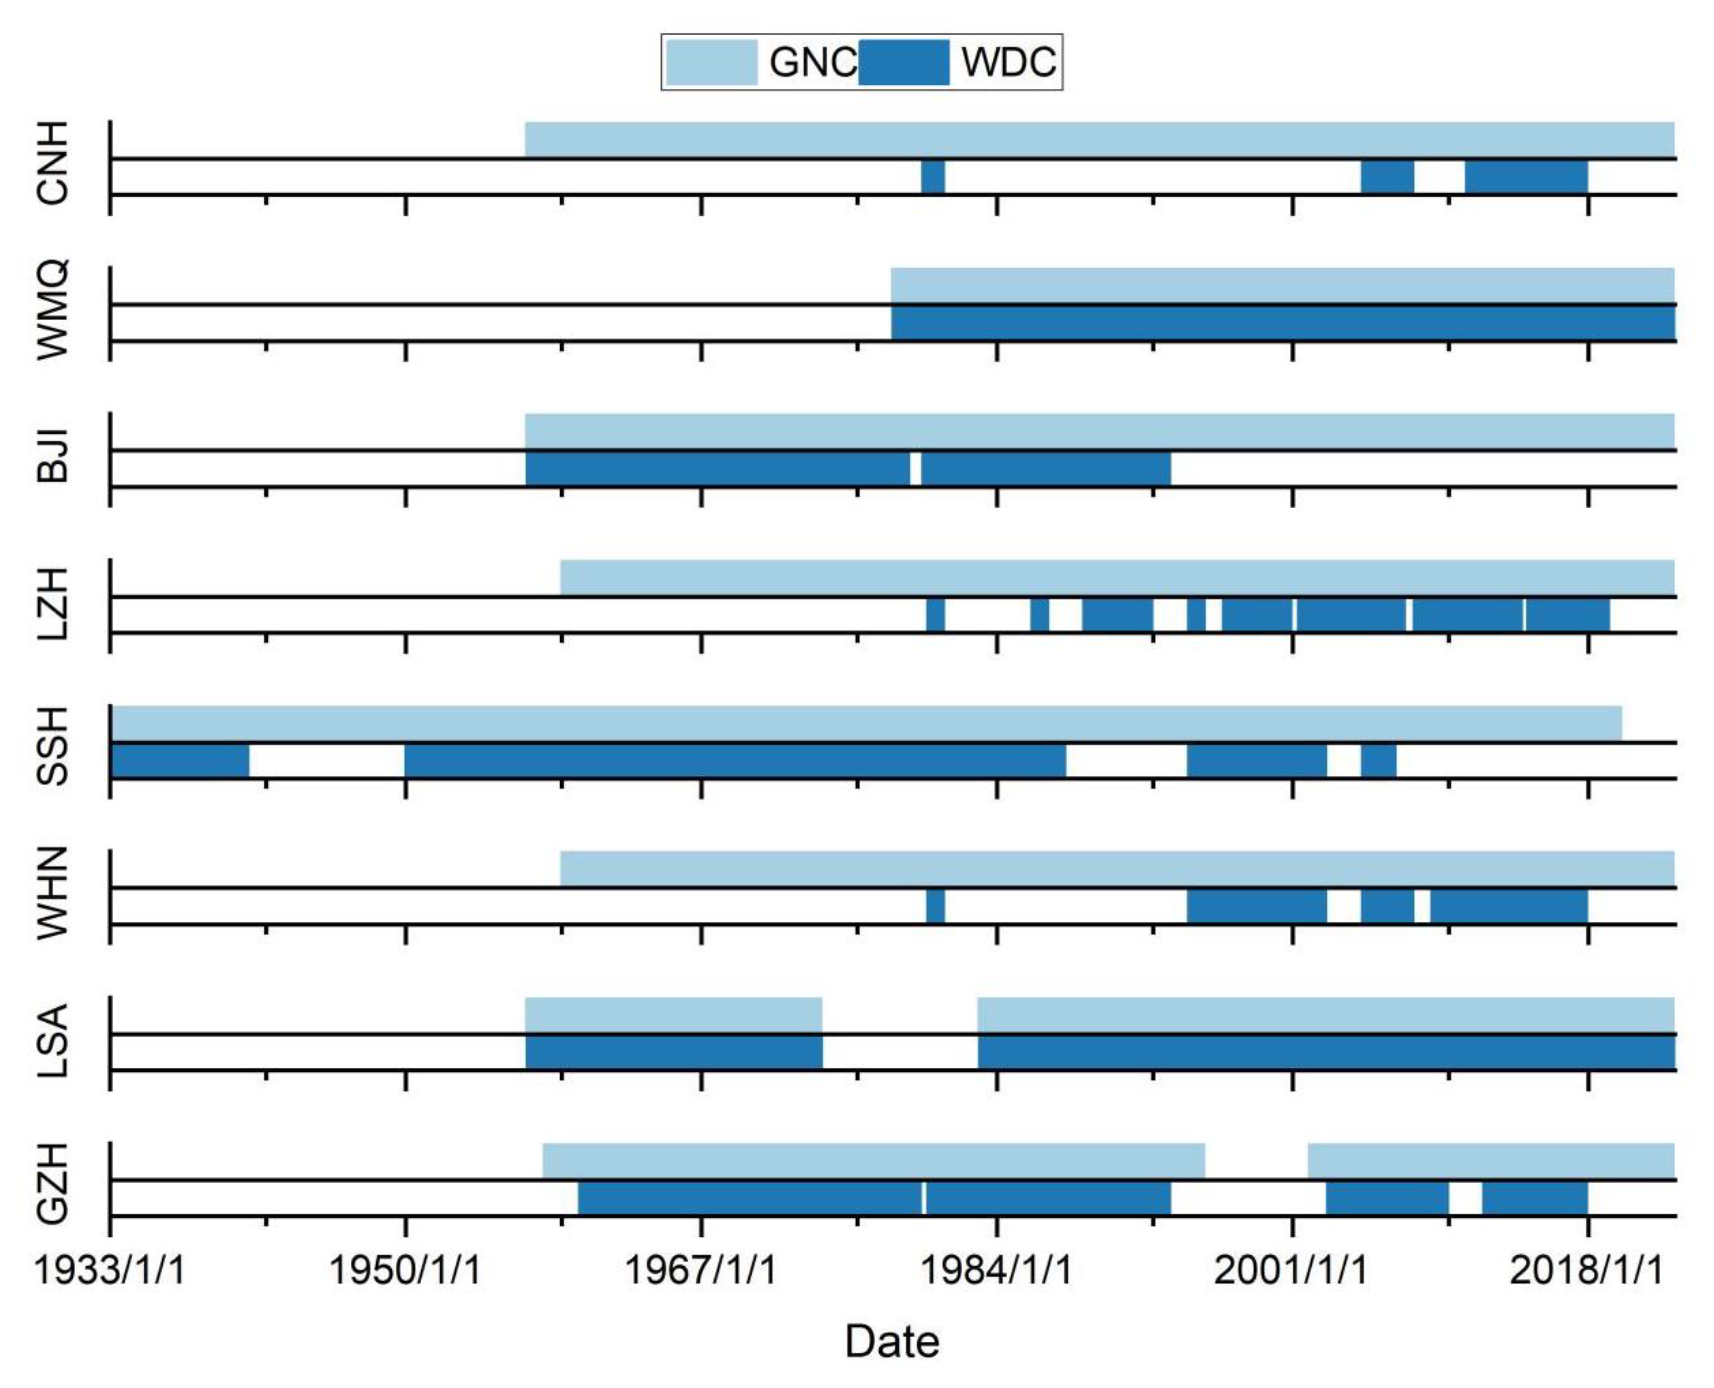
In order to verify the consistency of data from different sources, we compared the integrated data with those held at the World Data Center (WDC) for Geomagnetism in Edinburgh (https://wdc.bgs.ac.uk/data.html, last access: 20 August 2025), as shown in Fig. 2. The pale blue in the figure represents the integrated data, denoted as GNC, while the dark blue represents data from the WDC. The comparison reveals that, except for the data from the WMQ and LSA observatories, which show relatively consistent integrity, the data obtained from the WDC for the other observatories perform poorly in terms of integrity and continuity, with many discontinuous gaps.
Quality inspection and preprocessing of observational data are critical steps for conducting data analysis and applications. This study first performs a preliminary examination of the time series data through visual inspection to identify and eliminate obvious errors due to measurement mistakes, data entry omissions, or equipment failures. Subsequently, the tolerance test (Zhang et al., 2022b; Korte et al., 2009) is used to further identify and remove outliers from the data. After completing these steps, the Multi-scale Wavelet Analysis Step Detection and Signal Correction Algorithm (MWASDSC) (Zhang et al., 2023) is applied for further detection and processing of the data, primarily aimed at detecting and correcting jump phenomena (Chulliat and Telali, 2007) in the data, which are often caused by replacing absolute instruments, changing standard observation pillars, or relocating observatories. The MWASDSC is as follows:
-
Low-pass filtering. Apply low-pass filtering to the original signal to eliminate high-frequency interference and obtain a smoother low-pass filtered signal.
-
Moving average processing. Perform moving average processing on the low-pass filtered signal based on different numbers of moving average points, resulting in a series of moving average signals. These signals reflect data characteristics at different scales.
-
Constructing a dataset and wavelet transform. Based on the moving average signals obtained in (2), construct a dataset and choose the largest-scale moving average signal to build a ramp function as the wavelet function. Perform a wavelet transform on it to obtain wavelet transform coefficients. At the same time, remove the largest-scale moving average signal from the dataset.
-
Step jump point detection. Use the position of the maximum wavelet transform coefficient as the predetermined step jump point and determine the optimal step jump point position and step height through a search algorithm.
-
Enclosing the area and repeat the search. Enclose the area that spans one ramp width before and after the optimal step jump point, repeat step (4), and continue to search for the optimal step jump point position and step height from the remaining area.
-
Constructing wavelet functions at different scales. Repeat steps (3) to (5), construct wavelet functions at different scales in sequence, and use wavelet analysis to pick up step information at different scales, including step jump point positions and step heights. When repeating step (3), look for the wavelet transform coefficients of the largest-scale moving average signal in the remaining scales' moving average signals.
-
Statistics and correction. Statistically analyze all step information found by the wavelet functions at all scales. If three or more scales can identify the same step, it is preliminarily determined as a step that needs correction. Then, combine it with the Kp index to investigate. If the Kp index is less than 5, it is officially determined as a step that needs correction (Kp index greater than 5 is usually a large magnetic disturbance, which can also produce step effects). Based on the positions of the jump points and step heights of all confirmed steps, correct the original signal in turn to obtain the corrected signal.
-
Iterative processing. Take the corrected signal in (7) as the original signal for the next round of signal processing, repeat steps (1) to (7), and search for and correct the remaining steps again.
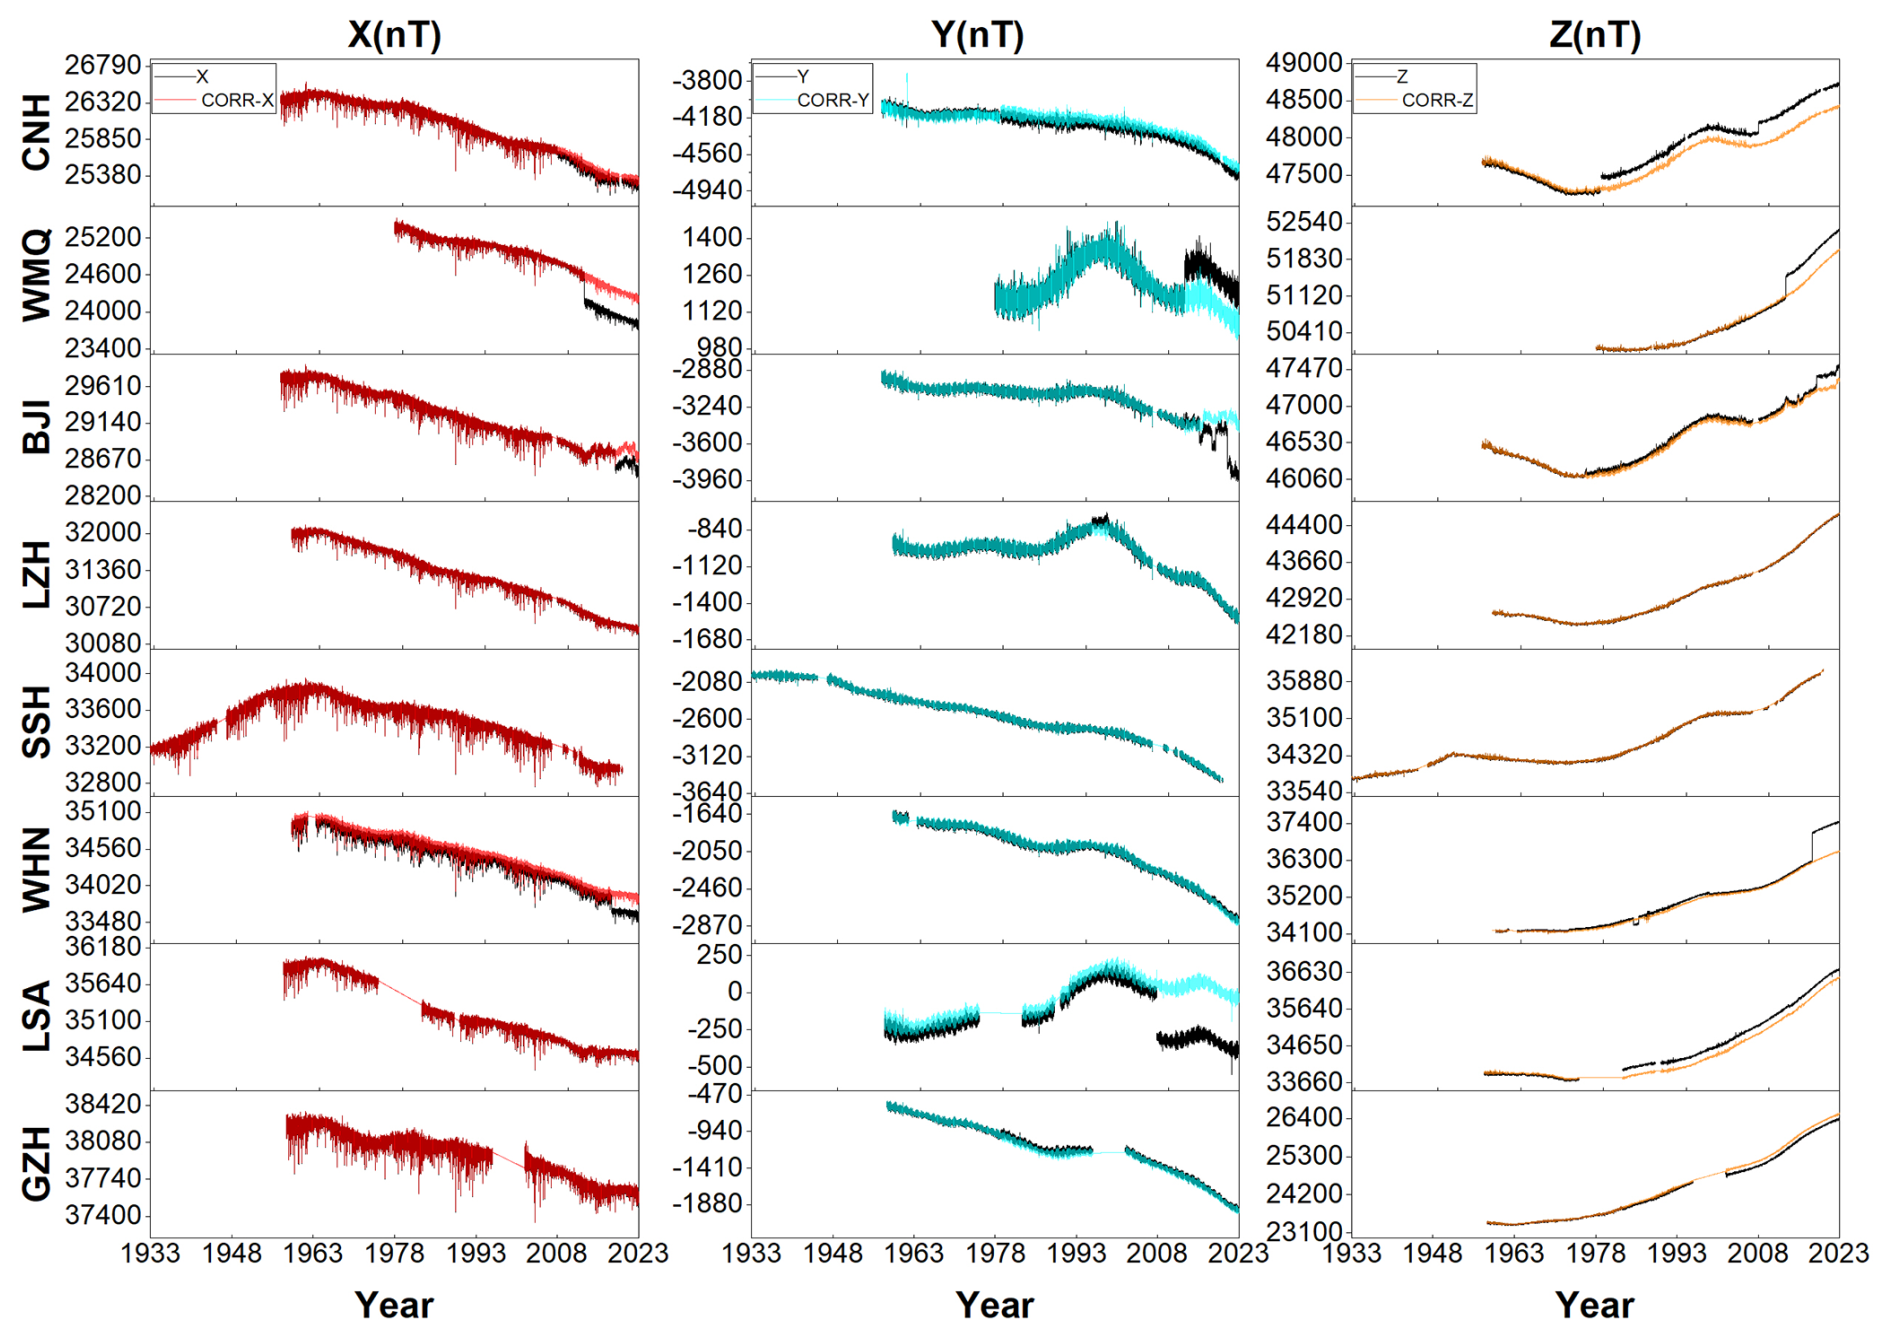
This study successfully achieved quality inspection and processing of time series data through the aforementioned steps. The preliminary review and tolerance test effectively eliminated obvious error values and spike anomalies from the data. The MWASDSC can identify and correct the jump in the data. We estimated all jumps related to the observatory's relocation in this way, which is clearly visible in Fig. 3. Figure 3 shows the comparison of the AHMV before and after correction, with the corrected data showing significant improvement in continuity and reliability.
The analysis of the corrected data shows that each component has a significant year-to-year variation, which over a considerable period of time manifests as a monotonic increase or decrease. For the X component, there was a general trend of monotonic increase before 1962 and a monotonic decrease for the subsequent 60 years. The SSH observatory, due to its longer observation, can more clearly exhibit this characteristic of change.The Y-component time series from the WMQ, LZH, and LSA observatories in the western region show a high degree of consistency in their trends. From the start of the observation, these three observatories exhibited an overall upward trend in the Y component, reaching their respective peaks in 1997, 1995, and 1999, after which they transitioned into a downward trend until the present. At the same time, the other five observatories have shown a general downward trend since the beginning of observations. Additionally, all eight observatories displayed varying degrees of upward convexity in the Y component between 1987 and 2008. As for the Z component, the CNH, BJI, LZH, and LSA observatories have shown a consistent year-on-year decline since observations began, reaching minimum values around 1973, followed by an overall upward trend. The SSH observatory showed a slow upward trend before 1955, began a slow decline afterwards, reached its lowest point in 1973, and has been on an upward trend ever since. The remaining three observatories have roughly exhibited an upward trend since observations began.
Furthermore, in the time series curve of the AHMV, it is clear that the AHMV contains a rich variety of external field variation contributions. Since the external field originates from the ionosphere and magnetosphere current systems outside the Earth, the complexity and variability of these currents result in a diverse and complexly changing magnetic field morphology. It is due to this origin that the spatial distribution of the varying magnetic field is extensive, with a global-scale and long-distance spatial correlation. This characteristic is particularly prominent in the X component. For example, during 13 to 15 March, 1989, all eight observatories recorded a significant geomagnetic storm and a noticeable decrease exhibited in the X component, with different observatories exhibiting varying magnitude of change.
Validating the corrected data is an important means to evaluate data quality. The content of validation includes the accuracy of diurnal variation records and the stability of long-term changes (Curto and Marsal, 2007).
4.1 Validation of the accuracy of diurnal variation
Typically, the accuracy of daily variations is tested by comparing the consistency of daily variation data from neighboring observatories (Reda et al., 2011; Linthe et al., 2013). Since these eight observatories were among the earliest established in China, there was a lack of data from nearby observatories for comparison in the early days. In this study, we adopted a strategy of cross-validation using data from the eight observatories (Curto and Marsal, 2007). Specifically, We used Geomagnetic Data Processing Software (Zhang et al., 2016) to conduct the consistency comparative analysis of the diurnal variation patterns of these eight observatories on daily and monthly timescales.
The comparison results show that the data from the eight observatories, after correction, exhibit a high degree of consistency in their daily variation patterns, with changes sometimes gentle and sometimes intense. Among these, one type of variation is gentle and periodic, cycling with a period of about 24 h, with the magnetic field changes during the day being significantly greater than those at night. The other type of variation occurs occasionally, is turbulent and irregular, and disappears after a period of time (Xu, 2009). This phenomenon is mainly attributed to their origins from different current systems. The gentle and periodic variations originate from relatively stable current systems in the ionosphere (Pedatella et al., 2011; Yamazaki et al., 2016), while the intense and irregular variations originate from various transient current systems formed by solar particle flows in the magnetosphere and ionosphere (Campbell, 2003). In most cases, regular magnetic field changes are superimposed with some irregular changes. Taking the records from February 1986 as an example, as can be clearly observed from Fig. 4, the daily records of each observatory include both regular periodic quiet daily variations and complex disturbed variations, especially during the magnetic storm from 7 to 9 February (as shown between the two vertical dashed lines in Fig. 3), where all observatories' three components showed a consistent intense disturbed response.
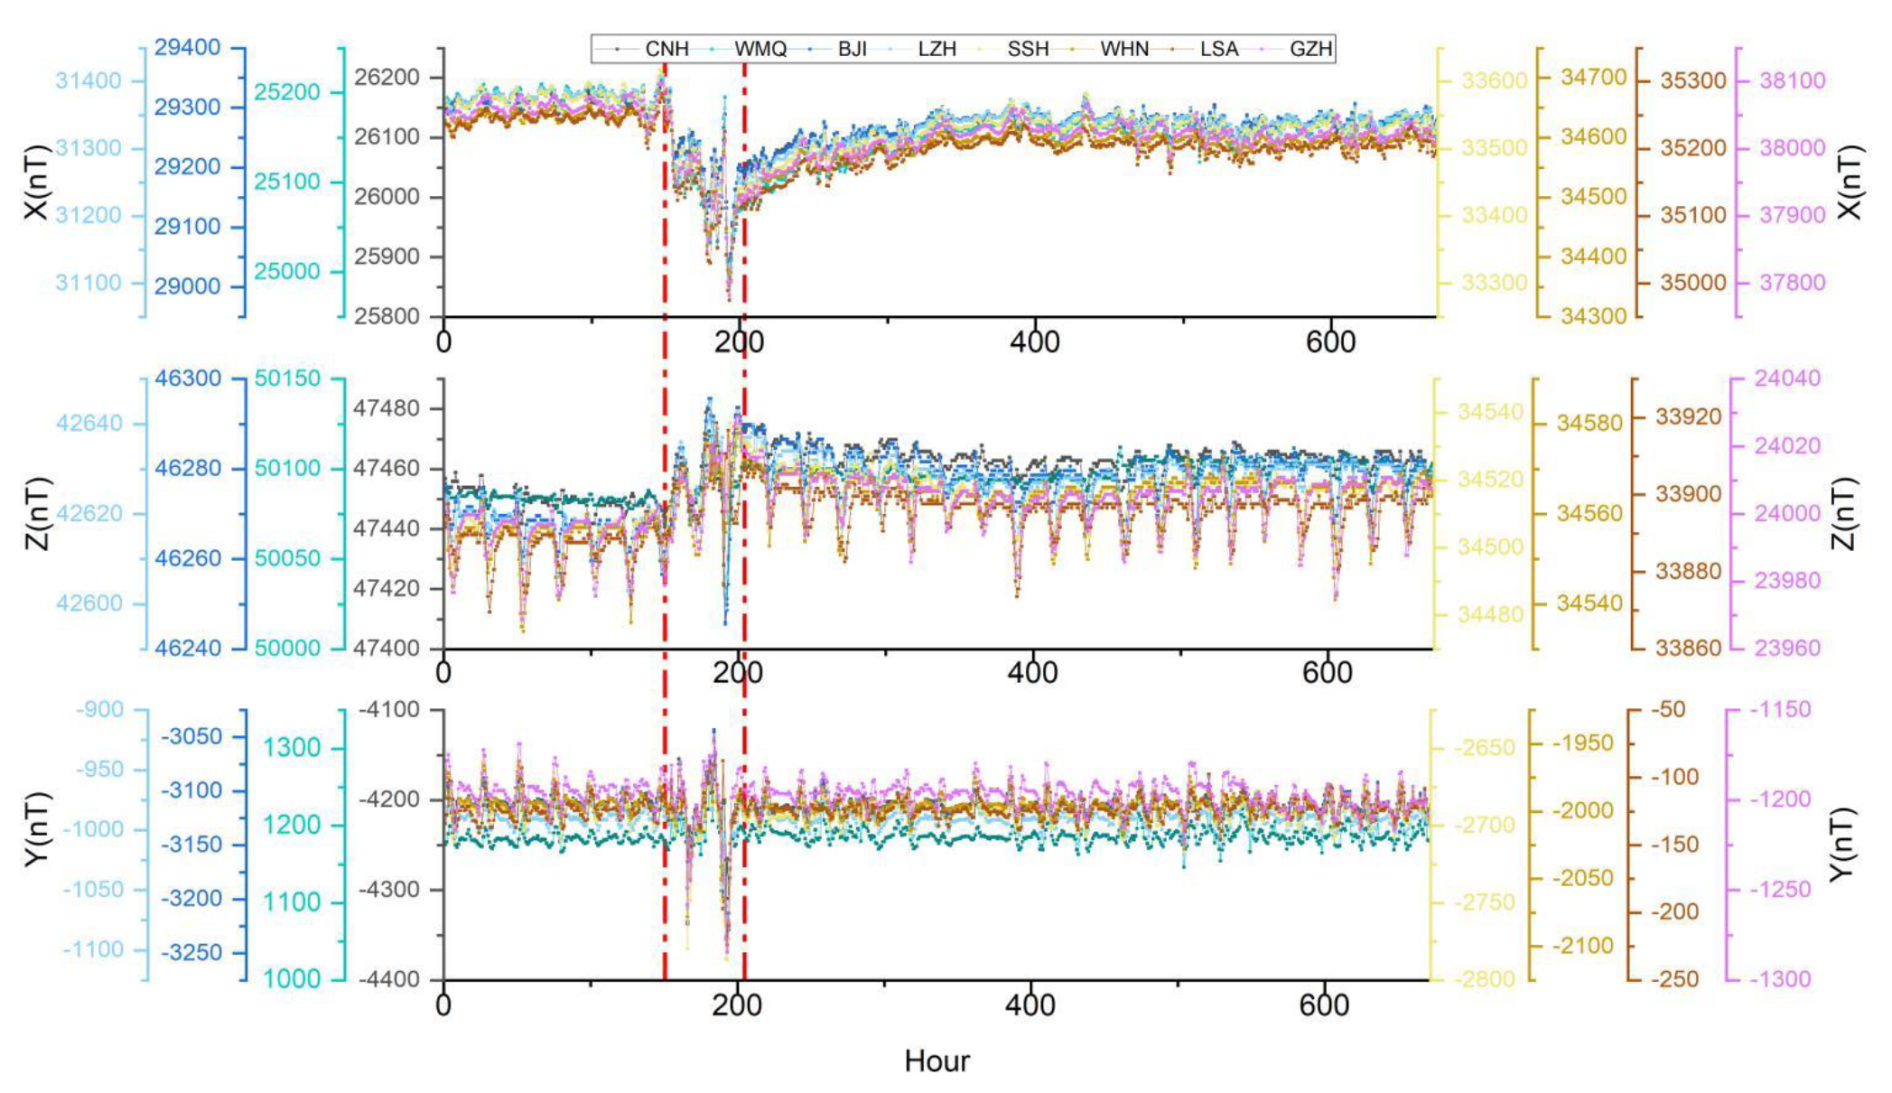
Figure 4Time series curve of AHMV of X, Y, and Z components from eight observatories in February 1986.
4.2 Validation of the stability of long-term changes
Comparing the processed data with the prediction data from mature and reliable model can serve as an important method for evaluating the long-term stability of data (Kudin et al., 2021) and can also be used to test the model's adaptability to ground observation data (Finlay et al., 2016). The comparison model selected for this study is the International Geomagnetic Reference Field (IGRF) model. The IGRF model is a mathematical model of the internal geomagnetic field widely recognized by the international academic community, constructed based on candidate models developed by multiple research teams. It mainly describes the core or main field as detectable at Earth's surface. The IGRF model has also been widely accepted and applied in practical applications. The latest version of the IGRF model is available online (http://www.ngdc.noaa.gov/IAGA/vmod/, last access: 20 May 2025, V-MOD Working Group, 2025) and supports online direct calculation of the seven elements of the geomagnetic field (X, Y, Z, F, D, I, and H) and their secular variations at specified coordinates and dates. The cycle of the IGRF model is updated every 5 years, and the coefficients of the 14th-generation IGRF model were finally determined by the IAGA working group in November 2024.
To exclude interference from external fields, this study selected mean data from the midnight period from eight observatories to calculate the annual mean (He et al., 2019). The midnight mean data were obtained by calculating the arithmetic average of the AHMV from 00:00 to 03:00 LT at each observatory. During this period, the observatories are located on the Earth's night side, where the geomagnetic field is relatively stable, effectively avoiding interference from the ionospheric current system and some of the magnetospheric current system. In addition, the midnight period also avoids interference caused by a large amount of human activity. Furthermore, to eliminate the influence of the lithospheric magnetic field, we subtracted their respective initial year's annual mean from the annual mean of each observatory and the IGRF model every year (Fig. 5).
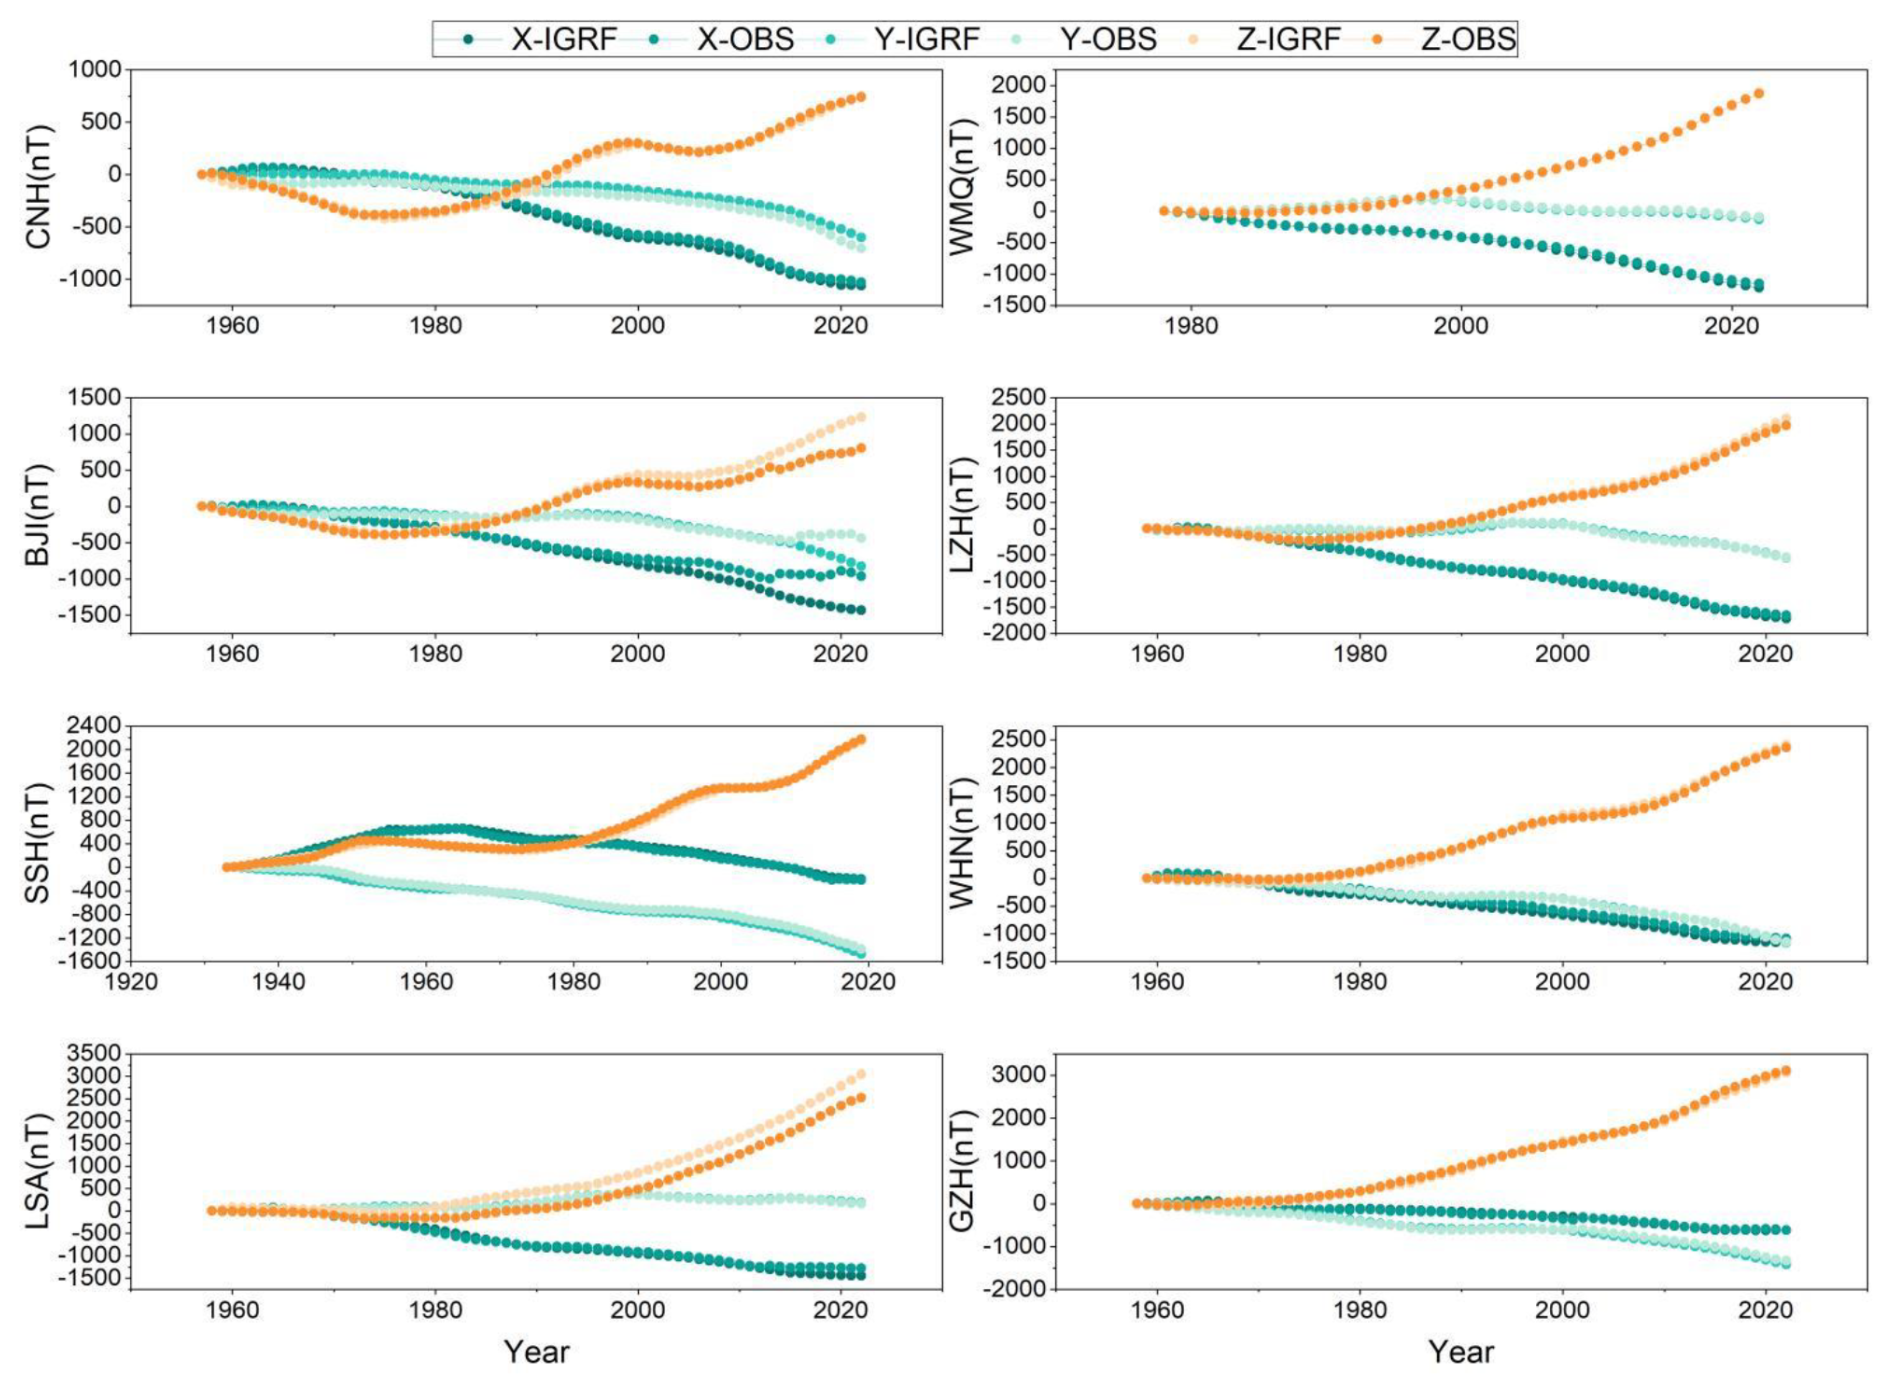
Figure 5Comparison of annual mean of the observatories with annual mean calculated by the IGRF14 model.
As observed, it is evident that the three components from observatories are highly consistent with the long-term variation trends shown by IGRF model. This indicates that the corrected data can accurately reflect the long-term characteristics of the geomagnetic field in the China. Specifically, the X component showed an upward trend before 1962, which then transitioned to a monotonic downward trend; for the Y component, the WMQ, LZH, and LSA observatories in the western region exhibited a high degree of synchronicity in their trends. Before the late 1990s, the overall trend was upward, followed by a shift to a downward trend until the present. The other five observatories generally showed a downward trend; regarding the Z component, the CNH, BJI, LZH, and LSA observatories showed a slight annual decrease before 1973, after which the overall trend became upward; the SSH observatory showed a slow increase before 1955, followed by a decrease until reaching a minimum in 1973, after which it has been on an upward trend. The other three observatories have consistently shown an upward trend. Additionally, for the BJI observatory, the deviation between the observed and modeled X and Y components after 2000, as well as the Z component after 2012, has shown an increasing trend. It is speculated that this phenomenon may be due to the increasing interference in the observation environment.
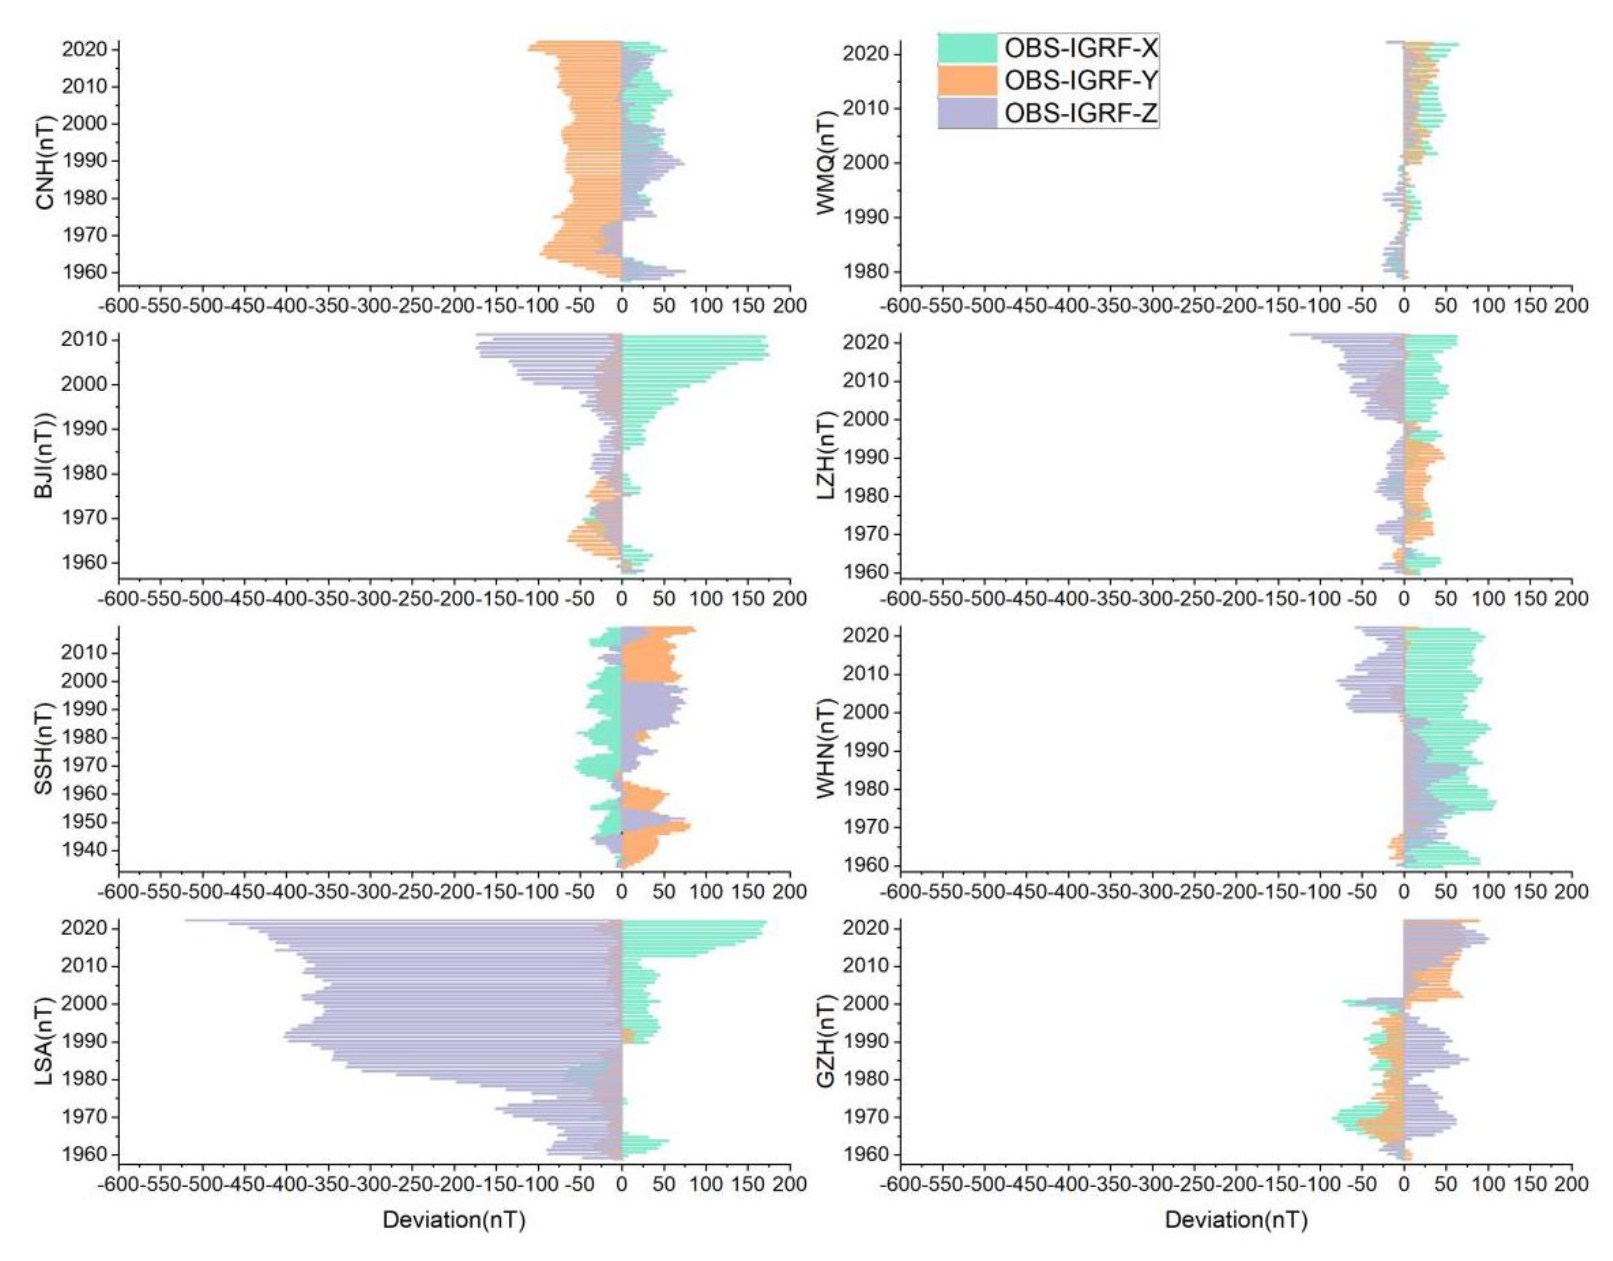
To further quantitatively analyze the differences between the observation and model, this study used Eq. (1) to calculate the differences between the observatory values and model values obtained above, as well as the standard deviation of the differences. The comparison of the differences is shown in Fig. 6, and the statistical results of the standard deviation of the differences are shown in Table 3.
In the equation, BOBS represents the annual mean of the observatory, BIGRF represents the annual mean of the IGRF model, ΔB represents the difference between the annual mean of the observatory and the value of the IGRF model, represents the mean of the differences, S represents the standard deviation of the differences, n represents the total number of years, and i represents the ith year.
Table 3Statistical results of standard deviations for the differences between observatories values and IGRF model values.
Although the long-term trends of the observatories are consistent with the IGRF model values, it can be seen from Fig. 6 that there are certain differences between them. The difference in the Z component of the LSA observatory is the largest, with the maximum difference exceeding 500 nT and the average difference being about 280 nT. Following that, the differences in the X and Z components of the BJI have significantly increased since 2000, with the maximum difference approaching 200 nT, which may be related to the gradual deterioration of the surrounding observation environment (Zhang et al., 2018). The differences at other observatories are basically all below 100 nT or even smaller. The error statistics in Table 3 also show that, apart from the slightly larger errors in the X and Z components of LSA and BJI, the root mean square errors of the X, Y, and Z components at the other observatories are all within 50 nT. The preliminary analysis reveals that the reasons for the differences are primarily concentrated in two aspects: first, the remaining contributions from external magnetic fields – although we only selected data for night times, geomagnetic field activity was not taken into account, particularly since geomagnetic storms can still be substantial. On the other hand, due to the uneven distribution of observatories, missing data from these eight observatories, and data quality issues, errors were introduced during the construction of the IGRF model. Additionally, the 5-year piecewise linear model adopted in the IGRF model is a simplification method, which has certain limitations in accurately describing continuous secular variations.
By analyzing the differences between them, the overall accuracy of the IGRF model in China can also be assessed. Although there are certain differences, considering that the global estimation accuracy range of the IGRF model is between 5 and 300 nT (Lowes, 2000; Wang, 2003; Nie et al., 2017; Lowes, 2022), the model is capable of accurately depicting the spatial distribution of the main magnetic field in China. In scientific research and practical applications of the geomagnetic field, it is crucial to know the accuracy of the model in specific areas.
The application scope of geomagnetic observation data is very extensive, as mentioned in the introduction. In this section, we will introduce its applications in the study of Sq variations and geomagnetic jerks.
5.1 Analysis of the characteristics of Sq variation in the China
In the calm variations, the solar quiet daily variation (Sq) has attracted attention due to its theoretical significance and practical value. Sq mainly originates from the ionospheric dynamo current system (Vichare et al., 2017) and is the most significant variation component in the mid-low latitude regions during the quiet period of the geomagnetic field. This section will briefly analyze the characteristics of Sq variation in China using the corrected hourly mean data.
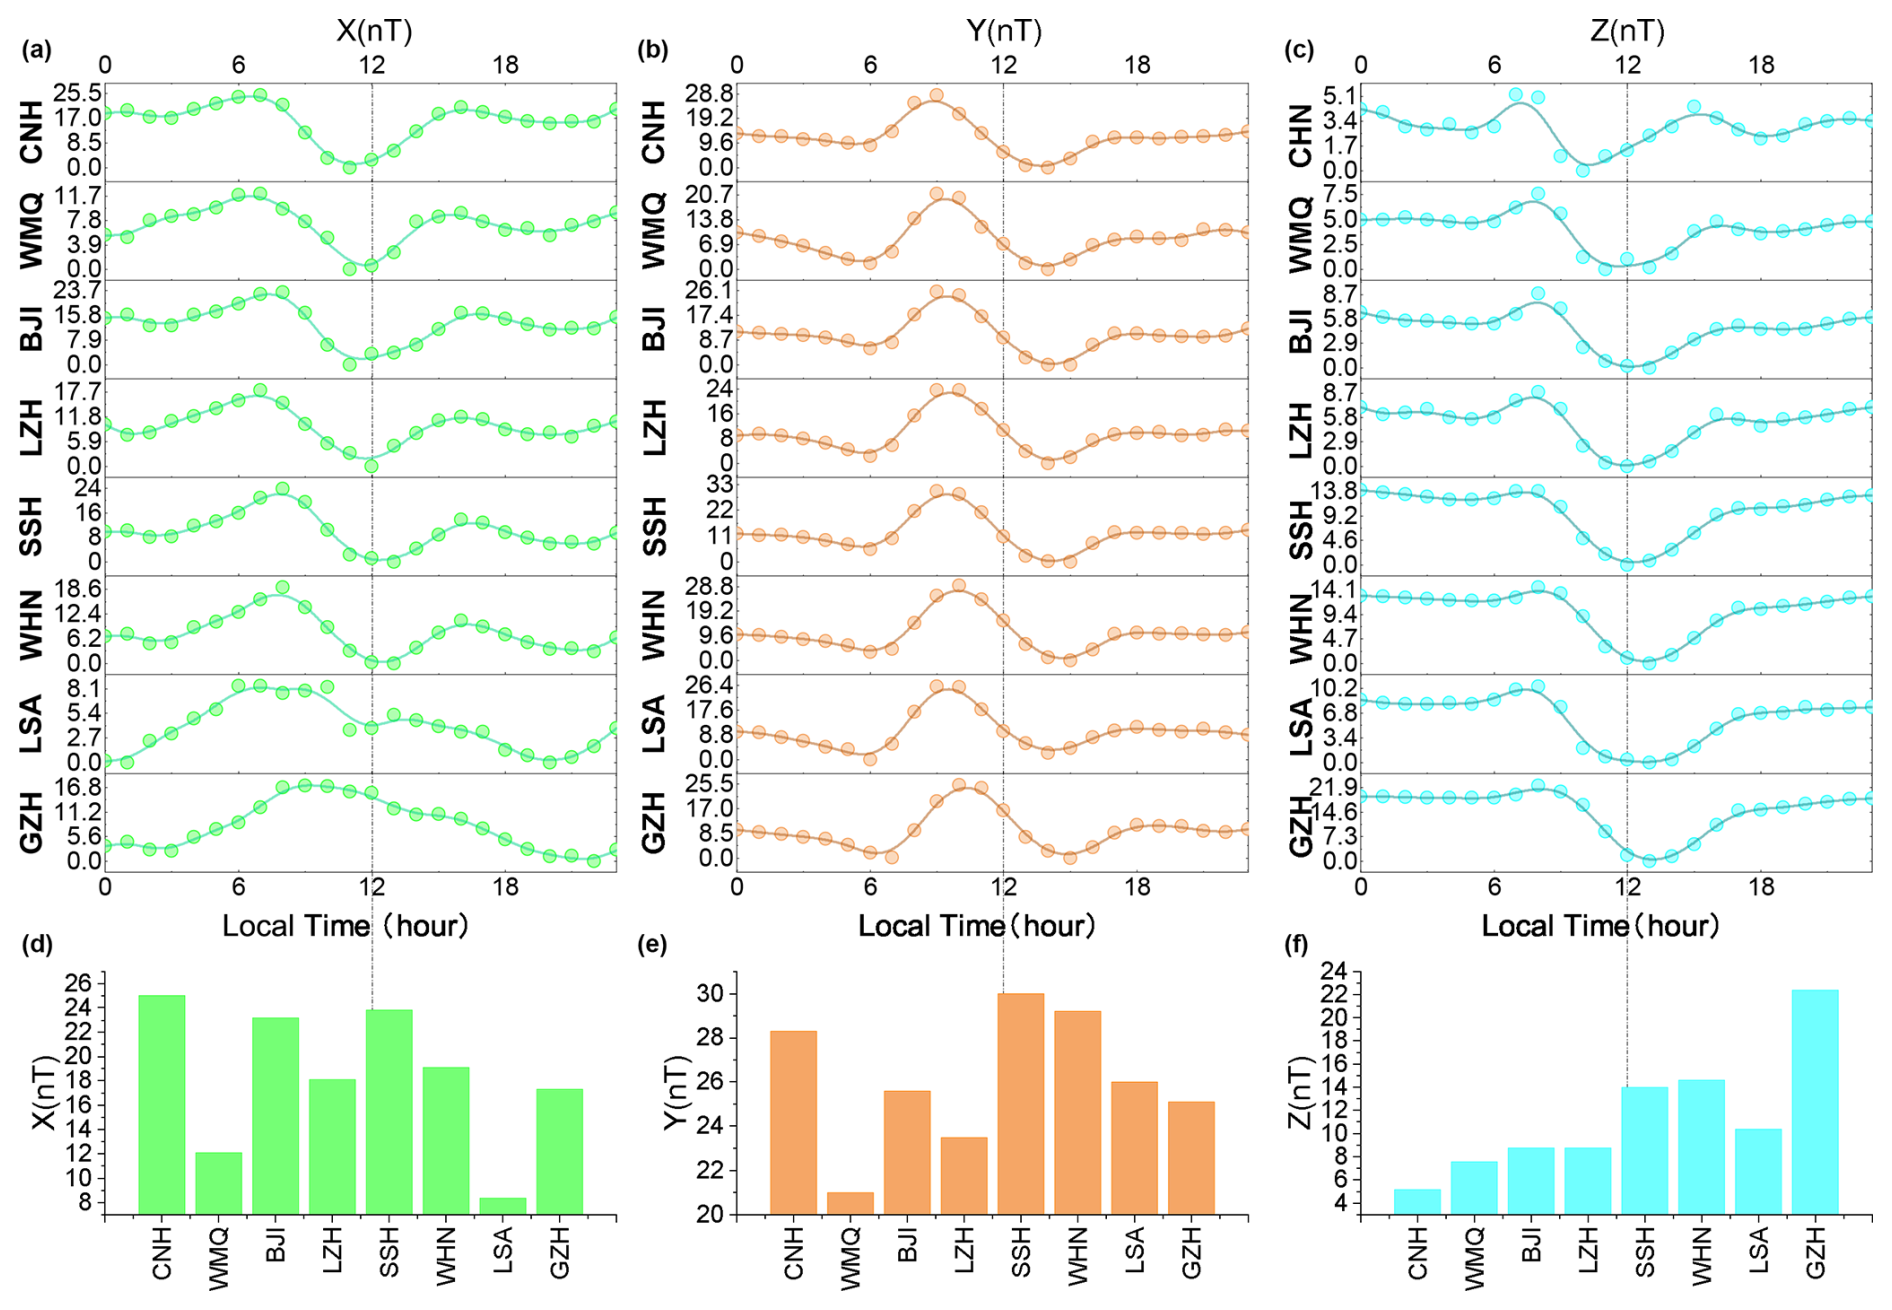
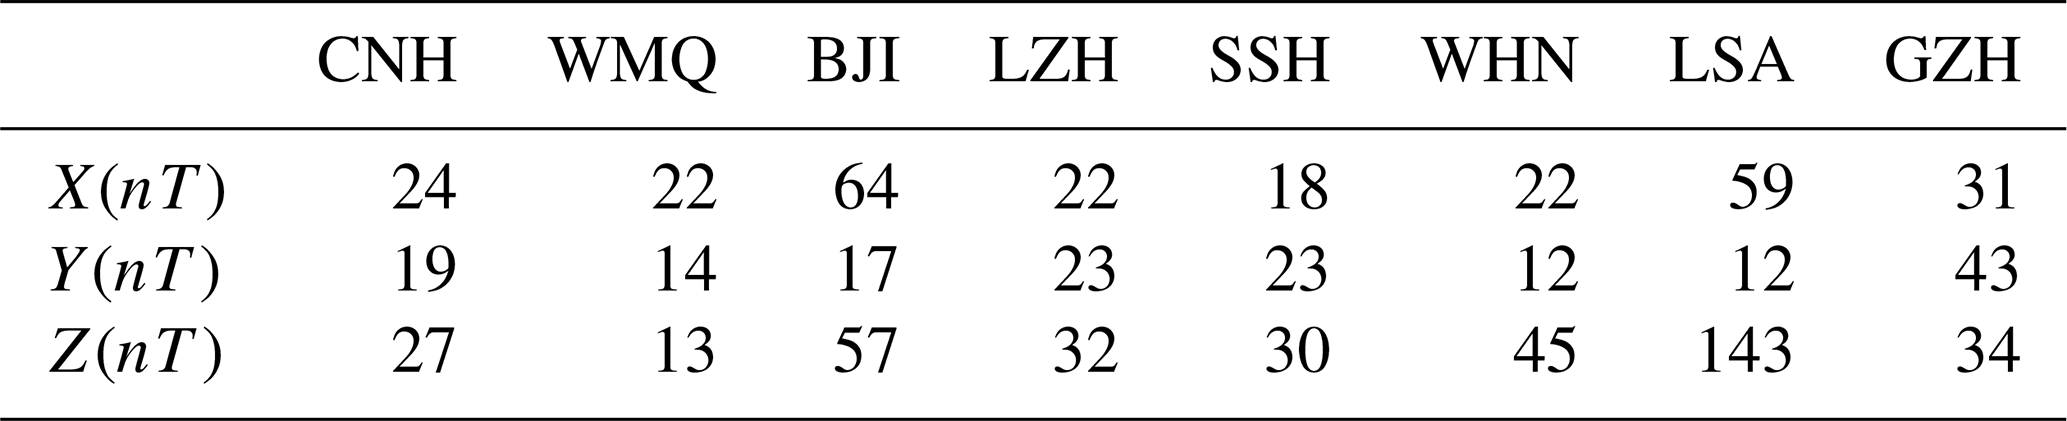
Figure 7Sq in February 1986. (a–c) The Sq variations in the X, Y, and Z components recorded at eight observatories. (d–f) The daily variation amplitudes of the X, Y, and Z components at each observatory.
The data from the five calmest days of the geomagnetic field in February 1986 were selected, and the average Sq for that month was obtained through time series superposition. The international geomagnetic quiet day data come from the World Data Center (https://wdc.kugi.kyoto-u.ac.jp/, last access: 20 August 2025). As shown in Fig. 7, the horizontal axis represents local time. From the figure, it can be seen that the variations of the three components of Sq at various geomagnetic observatories show the characteristic of large daytime variation and small nighttime variation. This is because the Sq current system has a counterclockwise daytime current vortex in the mid-low latitude part of the Northern Hemisphere (the center position of the maximum current intensity), and the center of this current vortex is located at approximately latitude 30°, while the current intensity at night is very weak (Zhao et al., 2014). It can also be seen from the figure that the X component reaches a significant extreme value before noon, the Y component shows a reverse extreme value around local noon, and the Z component has a characteristic of a minimum value appearing around noon. These characteristics are closely related to the current vortex center of the Sq current system being around 12:00 local time. In addition, the variation of Sq in the mid-low latitude regions is mainly influenced by two factors: latitude and local time (Xu, 2009; Feldstein and Zaitzev, 1968), which is also clearly reflected in Fig. 7. Sq shows a significant dependence on local time. Comparing observatories with the same latitude but different longitudes, such as CNH (43.8° N, 125.3° E) and WMQ (43.8° N, 87.7° E), it can be seen that their Sq variation patterns are very similar, almost independent of longitude, showing characteristics of smooth changes with local time. The latitude variation characteristics of Sq are mainly manifested as the phase of the X component approximately reverses at latitude 30°; the Y and Z components do not show a reversal phenomenon, because the Y and Z components usually show variations in the equatorial region (Campbell, 2003; Amory-Mazaudier, 2009; Yamazaki and Maute, 2017). In addition, the changes in the X and Z components show approximate symmetry around local noon, while the Y component shows asymmetry. These variation characteristics are consistent with the temporal and spatial variation patterns of Sq in the mid-low latitude regions during the winter solstice month of the Lloyd seasons.
We also analyzed the amplitude characteristics of Sq. The bar chart in Fig. 7 shows the daily variation amplitude of the three components at each observatory. The daily variation amplitude of the Y component is the largest at the GZH observatory with the lowest latitude. The daily variation amplitude of the Z component shows that for observatories with similar longitudes, the lower the latitude, the larger the daily variation amplitude. The variation amplitude of the X component does not show a clear regularity.
5.2 Geomagnetic jerk analysis
Geomagnetic jerks, which refer to rapid changes in the geomagnetic field occurring over short periods, are characterized by abrupt changes in the secular variations of geomagnetic field elements, showing a “⋁” or “⋀” shape. The academic community generally agrees that the origin of geomagnetic jerks can be traced back to the Earth's core, and these sudden changes are usually related to the flow changes in the Earth's core (Malin and Hodder, 1982; Alexandrescu et al., 1995; Mandea et al., 2010; Chulliat et al., 2010; Qamili et el., 2013; Ou et al., 2016). Although geomagnetic jerks have received extensive attention and research in the past 40 years (Chulliat et al., 2010; Brown et al., 2013; Feng et al., 2019; Kang et al., 2020; Bai et al., 2023), there are still many unsolved mysteries in the study of their origin mechanisms and change characteristics. The purpose of this section is to analyze and discuss the geomagnetic jerks using the acquired long-term observation data in this study.
The most direct method for detecting geomagnetic jerks is to identify ⋁-shaped or ⋀-shaped changes in the secular variation (SV) of a specific component of the geomagnetic field, after excluding the external field components (Soloviev et al., 2017). This part of the study still selects annual mean values calculated from AHMV based on the midnight period, effectively avoiding interference from external magnetic fields (variations in the ionosphere and magnetosphere) and human activities. The general view is that the X and Z components are more susceptible to the effects of external fields, while the Y component is least affected by external fields, making the jerk's manifestation most significant on the Y component (Mandea et al., 2010; Duka et al., 2012; Kang et al., 2020). Based on this, this study focuses on analyzing jerks using the Y component.
Next, we obtain SV values by calculating the first-order difference of the annual mean of Y component (Mandea et al., 2000; Nahayo et al., 2018; Kang et al., 2020). By taking the difference, we can eliminate the constant crustal magnetic field component (Bloxham and Jackson, 1992; Feng et al., 2018). The SV is calculated as
In the formula, SVY represents the SV value of the Y component, Y(year) represents the current annual mean, and Y(year−1) represents the annual mean of the previous year.
In Fig. 8, the black dots represent the SV values of the Y component at each observatory. The blank areas in the data are due to the lack of observation data during the corresponding time periods. Among them, the observation environment at the BJI observatory has been severely disturbed since 2012, so the data from 2012 and onwards were not included in the analysis. The GZH observatory was relocated and reconstructed due to environmental interference between 1996 and 2001, resulting in no observation data during that period.
To quantitatively characterize the jerk features, this study calculated the SA values before and after each jerk and the occurrence time of the jerk. The estimation of SA values is based on piecewise linear fitting of the time series, using the method proposed by Torta et al. (2015) and Kotzé (2011). The specific steps are as follows: first, to minimize variations related to the solar cycle 11, a 11-year moving average is applied to the first-order differences of the annual means (Alexandrescu et al., 1997; Korte et al., 2009). By observing the trend and turning points of the moving average curve, the starting and ending points of each time window are determined, and then piecewise linear fitting is performed. Figure 8 depicts this process well . The intersection time of two adjacent fitted linear segments in the figure represents the moment of jerk occurrence. The slope of the fitted straight line represents the SA value (Mandea et al., 2000; Pinheiro et al., 2011; Brown et al., 2013; Bai et al., 2023). The intensity of the jerk can be quantified by its amplitude, which is the difference in SA values before and after each jerk, A, with its fitting formula as
In the equation, SVY(ti) represents the SV value of Y component in ti year, a2 indicates the SA value after the jerk, and a1 is the SA value before the jerk.
As shown in Fig. 8, several jerks appeared in the SV of the Y components at every observatory. The most notable events occurred in 1969, 1979, 1991, and 2003 (Mandea and Olsen, 2007), which were clearly reflected in the SV at each observatory. The 2003 jerk occurred distinctly at all observatories, further confirming Tozzi's view that this event was also global (Tozzi et al., 2009). The jerks in 2007 (Kotzé, 2011) and 2013 (Torta et al., 2015; Chulliat et al., 2015; Finlay et al., 2016) were recorded by five observatories, with three western observatories not recording the event in 2007. The jerk event in 1999 was only recorded by two observatories (CNH and SSH), and its morphological characteristics were not very clear, which may indeed be a local jerk (Pinheiro et al., 2011). These phenomena further illustrate that some jerk events have global extension characteristics, while some jerks are local events (Chulliat et al., 2010). In 2019, a geomagnetic jerk event was recorded by several observatories. This supports Duan and Huang's (2020) prediction of a possible new geomagnetic jerk between 2020 and 2021, which was forecasted by Duan et al. based on the relationship between LOD variations and geomagnetic jerks. This phenomenon deserves further attention.
The 1949 jerk event (Alexandrescu et al., 1996) is clearly recorded in the Y component of SSH SV, with very clear characteristics of the jerk. However, since this jerk event occurred relatively early when China only had the SSH observatory, we cannot determine whether this jerk event was prevalent across the entire territory of China or was merely a unique phenomenon confined to that particular observatory. Additionally, events with similar jerk characteristics were recorded by the CNH observatory in 1996 and by the SSH observatory in 1942, 1958, and 1965. Among these, the 1942 event (Mandea et al., 2000; Duka et al., 2012) and the 1958 event were only detected in certain observatories of the world (Lutephy, 2018). These jerks may be real or could be related to the length of geomagnetic records, data quality, etc., especially for data from the early initial research, which requires more early data for confirmation.
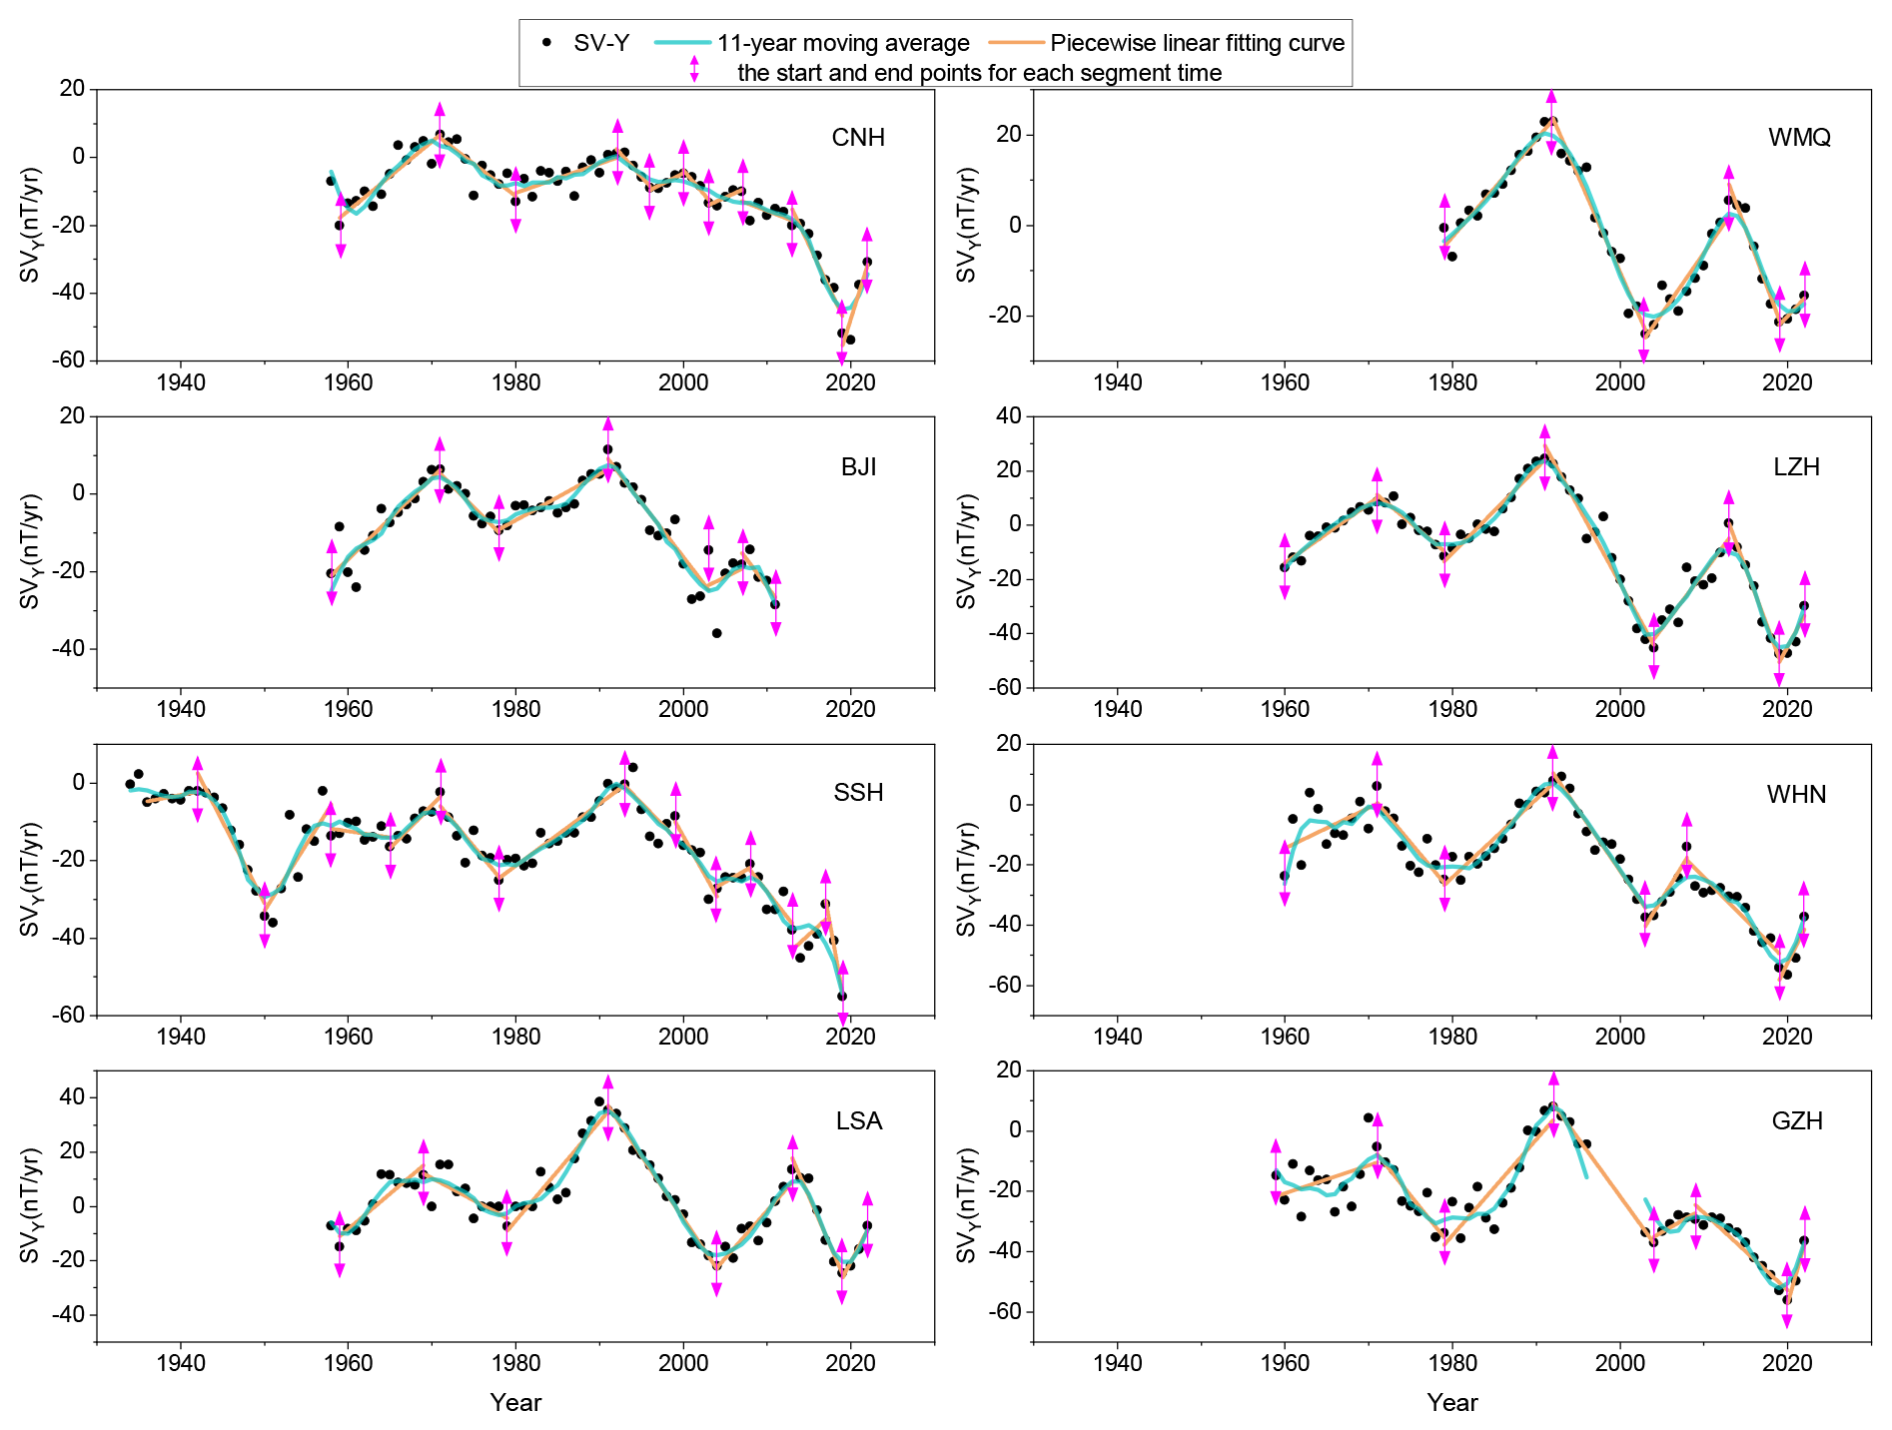
Table 4The occurrence times and amplitude of jerks. The slashes (/) denote unavailable data, and “–” is used where data existed but no jerk was detected during the corresponding time period.
Table 4 shows the occurrence times and amplitude A of each jerk event in the Y component of various geomagnetic observatories. Positive amplitude indicates that the secular variation exhibits a ⋁-shaped feature, while negative amplitude suggests that the secular variation exhibits a ⋀-shaped feature. The first column of the table lists the widely recognized occurrence times of geomagnetic jerks.
As shown in Table 4, the geomagnetic jerks exhibit significant regional differences and asynchronous occurrence times (Torta et al., 2015). For the same jerk event, there are considerable differences in the amplitude recorded by different observatories. Overall, the jerk amplitudes recorded by observatories in the central and western observatories are greater than those in the eastern observatories, except for the jerk event in 2019.
For different jerk events, the amplitude at the same observatory also varies significantly, ranging from about 2 nT yr−2 to several tens of nT yr−2. Notably, for jerks with more pronounced morphological features, the absolute value of their amplitude exceeds 4 nT yr−2 (Soloviev et al., 2017). The occurrence times of the jerks do not show any clear pattern in the eight observatories studied; the time difference for the same jerk recorded at different observatories can reach up to 2 years. This result is consistent with the conclusions of other scholars, who noted that the time discrepancy of the same event at different observatories can reach 2 to 3 years (Mandea et al., 2010; Brown et al., 2013; Morozova et al., 2014; Soloviev et al., 2017). The intervals between jerks are often 4, 6, 8, and 12 years, which seems to be correlated with the 6-year and 8.6-year oscillation periods of Earth's rotation diurnal length variations (Ma et al., 2004; Holme and De Viron, 2013; Lutephy, 2018; Duan and Huang, 2020; Gvishiani and Soloviev, 2020).
Integrated and quality-controlled historical datasets of eight pioneering geomagnetic observatories in China are available at https://doi.org/10.5281/zenodo.15481895 (Zhang et al., 2025). The data are provided in text format, including the observed AHMV files of the three components (X, Y, and Z) at the eight observatories and the metadata files about the datasets.
Geomagnetic observatories play a crucial role in monitoring the spatiotemporal variations of the geomagnetic field, and their accumulated continuous observation data are particularly important for understanding the long-term evolution patterns of the geomagnetic field. Long time-series geomagnetic observation data have wide applications and significant value for scientific research and practical use. The rescue of geomagnetic historical data is a focal point of global scientific concern. This study conducted a salvage organization of the historical observation data from eight geomagnetic observatories (CNH, WMQ, BJI, LZH, SSH, WHN, LSA, and GZH) from the official start of observations to 2022. This included the collection of disperse stored observational materials, digitization of paper materials, unified database management, anomaly detection and processing, quality assessment, and application analysis. After the salvage, the historical data are easier to preserve and use over the long term, with significantly improved data quality. These datasets are of great value for improving historical geomagnetic field models (Korte et al., 2009) and studying changing magnetic fields (e.g., diurnal variations, magnetic storm events), the main geomagnetic field, and its secular variations. However, it should be noted that after 2012, the data from the BJI observatory should be handled with caution due to severe interference in the observation.
In Sect. 5 of this study, we first applied the data to explore the changing characteristics of Sq in China. The analysis results indicate that the main features of Sq include significant changes during the day and weak changes at night, and the changing patterns also show dependence on latitude and local time. In addition, we also focus on the changing characteristics of jerks in the China. The research results revealed several landmark jerks in 1969, 1979, 1991, and 2003 that commonly appeared at eight observatories, thus verifying the global characteristics of these events. In contrast, events in 1999, 2007, and 2013 exhibited local characteristics. For events in 1942 and 1958, since they were only recorded at one observatory, more long-term sequence data are needed for in-depth analysis and confirmation. Encouragingly, the jerk in 2019 was recorded at all observatories. For those jerks with significant morphological features, their amplitude absolute values all exceeded 4 nT yr−2. These findings further confirm the regional differences in geomagnetic jerks and the asynchronicity of the occurrence times of jerks, which is of significant scientific importance for understanding changes in the geomagnetic field.
Although this study reveals the spatiotemporal characteristics of Sq and jerks in China through analysis, given that the data samples used may lack sufficient representativeness and the analytical methods may have certain limitations, these findings may not fully and accurately reflect the actual situation in China. Therefore, subsequent research will collect and integrate more high-quality data from observatories for more detailed and in-depth analysis. At the same time, we will focus on improving the accuracy of the detection algorithm and delve into the physical mechanisms of geomagnetic jerks.
This study aims to provide this valuable dataset to the scientific community and the public, so that these data can be integrated with data from other sources to further explore the spatiotemporal evolution of the geomagnetic field and its physical mechanisms. It also hopes to inspire more scientific workers to engage in the protection of historical materials, with the aim of preserving these precious resources before they are destroyed or lost, and to further realize their scientific value.
SZ conducted data integration, conducted quality inspection, and analyzed application examples. SZ prepared the manuscript. CF was responsible for identifying and correcting data anomalies, created charts, and revised the manuscript. CC, GZ, JC, QZ, BW, ND, JL, SH, PG, and HY were responsible for scanning and digitizing paper materials, as well as standardizing data in various formats. CC designed a set of Excel templates. JW developed the data quality comparison software. JW and CC established the database management system.
The contact author has declared that none of the authors has any competing interests.
Publisher's note: Copernicus Publications remains neutral with regard to jurisdictional claims made in the text, published maps, institutional affiliations, or any other geographical representation in this paper. While Copernicus Publications makes every effort to include appropriate place names, the final responsibility lies with the authors.
We thank the staff of CNH, BJI, SSH, WMQ, LZH, LSA, GZH, and WHN observatories, as well as the staff of the reference room of the Institute of Geophysics, China Earthquake Administration, for providing the valuable data resources. We sincerely thank all the technical personnel and scientists working at the geomagnetic observatories. We also thank the World Data Center for Geomagnetism, Kyoto, for providing access to the online International Geomagnetic Quiet Day. We are grateful to editors and anonymous reviewers for their helpful reviews.
This work was funded by the National Key R&D Program of China (grant no. 2023YFC3007404) and the National Natural Science of Foundation of China (grant no. 42374092).
This paper was edited by Kirsten Elger and reviewed by two anonymous referees.
Alexandrescu, M., Gibert, D., Hulot, G., Le Mouël, J.-L., and Saracco, G.: Detection of geomagnetic jerks using wavelet analysis, J. Geophys. Res., 100, 12557–12572, https://doi.org/10.1029/95JB00314, 1995.
Alexandrescu, M., Gibert, D., Hulot, G., Le Mouël, J.-L., and Saracco, G.: Worldwide wavelet analysis of geomagnetic jerks, J. Geophys. Res., 101, 21975–21994, https://doi.org/10.1029/96JB01648, 1996.
Alexandrescu, M., Courtillot, V., and Le Mouël, J.-L.: High-resolution secular variation of the geomagnetic field in western Europe over the last 4 centuries: Comparison and integration of historical data from Paris and London, J. Geophys. Res., 102, 20245–20258, https://doi.org/10.1029/97JB01423, 1997.
Amory-Mazaudier, C.: Electric current systems in the earth's environment, Niger. J. Space Res., 8, 178–255, 2009.
Bai, C. H., Kang, G. F., Gao, G. M., Wen, L. M., and Sun, Y. P.: Response of geomagnetic jerk features to the geomagnetic secular acceleration in the China region, Chinese J. Geophys.-CH, 66, 3747–3760, https://doi.org/10.6038/cjg2022Q0270, 2023.
Bloxham, J. and Jackson, A.: Time-dependent mapping of the magnetic field at the core-mantle boundary, J. Geophys. Res., 97, 19537–19563, https://doi.org/10.1029/92JB01591, 1992.
Bolduc, L., Langlois, P., Boteler, D., and Pirjola, R.: A study of geoelectromagnetic disturbances in quebec. II. Detailed analysis of a large event, IEEE T. Power Deliver., 15, 272–278, 2002.
Boteler, D. H., Pirjola, R. J., and Nevanlinna, H.: The effects of geomagnetic disturbances on electrical systems at the Earth's surface, Adv. Space Res., 22, 17–27, 1998.
Brown, W. J., Mound, J. E., and Livermore, P. W.: Jerks abound: an analysis of geomagnetic observatory data from 1957 to 2008, Phys. Earth Planet. In., 223, 62–76, https://doi.org/10.1016/j.pepi.2013.06.001, 2013.
Campbell, W. H.: Introduction to Geomagnetic Fields, Cambridge University Press, 62–102, https://doi.org/10.1017/CBO9781139165136, 2003.
CEA – China Earthquake Administration : Specification for the construction of seismic station Geomagnetic station, DB/T 9–2004, China Earthquake Publishing House, Beijing, https://www.doc88.com/p-5853043901817.html (last access: 20 August 2025), 2004.
Cheng, A. L.: Modernization technology album of geomagnetic stations and networks, Recent Developments in World Seismological, 6, 1–40, 1995.
Chulliat, A. and Telali, K.: World monthly means database project, Publications of the Institute of Geophysics, Polish Academy of Sciences, C-99, 268–274, 2007.
Chulliat, A., Thébault, E., and Hulot, G.: Core field acceleration pulse as a common cause of the 2003 and 2007 geomagnetic jerks, Geophys. Res. Lett., 37, L07301, https://doi.org/10.1029/2009GL042019, 2010.
Chulliat, A., Alken, P., and Maus, S.: Fast equatorial waves propagating at the top of the Earth's core, Geophys. Res. Lett., 42, 3321–3329, https://doi.org/10.1002/2015GL064067, 2015.
Clarke, E., Flower, S., Humphries, T., McIntosh, R., McTaggart, F., McIntyre, B., Owenson, N., Henderson, K., Mann, E., MacKenzie, K., Piper, S., Wilson, L., and Gillanders, R.: The digitization of observatory magnetograms, poster presented at: 11th IAGA Scientific Assembly, Sopron, Hungary, 23–30 August 2009, https://www.osti.gov/etdeweb/biblio/21389614 (last access: 3 January 2025), 2009.
Curto, J. J. and Marsal, S.: Quality control of Ebro magnetic observatory using momentary values, Earth Planets Space, 59, 1187–1196, 2007.
Dawson, E., Reay, S., Macmillan, S., Flower, S., and Shanahan, T.: Quality control procedures at the World Data Centre for Geomagnetism (Edinburgh), IAGA 11th Scientific Assembly, Sopron, Hungary, 23–30 August 2009, https://www.researchgate.net/publication/264590163_Quality_control_procedures_at_the_World_Data_Centre_for_Geomagnetism_Edinburgh (last access: 29 December 2024), 2009.
Dong, X. H., Li, X. J., Zhang, G. Q., Shi, J., and Liu, C.: The study of digital identification of magnetogram, Seismological and Geomagnetic Observation and Research, 30, 49–55, 2009.
Department of Monitoring and Prediction, China Earthquake Administration: Electromagnetic observation instruments, in: Comprehensive Collection of Seismic Monitoring Instruments, 191–251, 2008.
Duan, P. and Huang, C.: Intradecadal variations in length of day and their correspondence with geomagnetic jerks, Nat. Commun., 11, 2273, https://doi.org/10.1038/s41467-020-16109-8, 2020.
Duka, B., De Santis, A., Mandea, M., Isac, A., and Qamili, E.: Geomagnetic jerks characterization via spectral analysis, Solid Earth, 3, 131–148, https://doi.org/10.5194/se-3-131-2012, 2012.
Feldstein, Y. I. and Zaitzev, A. N.: Quiet and disturbed solar-daily variations of magnetic field at high latitudes during the IGY, Tellus, 20, 338–366, https://doi.org/10.3402/tellusa.v20i2.10014, 1968.
Feng, Y., Holme, R., Cox, G. A., and Jiang, Y.: The geomagnetic jerk of 2003.5-characterisation with regional observatory secular variation data, Phys. Earth Planet. In., 278, 47–58, https://doi.org/10.1016/J.PEPI.2018.03.005, 2018.
Feng, Y., Jiang, Y. S., Gu, J. L., Xu, F., Jiang, Y., and Liu S.: Geomagnetic jerk extraction based on the covariance matrix, Appl. Geophys., 16, 153–159, https://doi.org/10.1007/s11770-019-0761-6, 2019.
Finlay, C. C., Olsen, N., Kotsiaros, S., Gillet, N., and Tøffner-Clausen, L.: Recent geomagnetic secular variation from Swarm and ground observatories as estimated in the CHAOS-6 geomagnetic field model, Earth Planet Space, 68, 112, https://doi.org/10.1186/s40623-016-0486-1, 2016.
Gillet, N., Jault, D., Finlay, C. C., and Olsen, N.: Stochastic modeling of the Earth's magnetic field: Inversion for covariances over the observatory era, Geochem. Geophy. Geosy., 14, 766–786, https://doi.org/10.1002/ggge.20041, 2013.
Gvishiani, A. and Soloviev, A.: Observations, Modeling and Systems Analysis in Geomagnetic Data Interpretation, Springer Nature, ISBN 978-3-030-58969-1 (eBook), https://doi.org/10.1007/978-3-030-58969-1, 2020.
He, Y. F., Zhao, X. D., Zhang, S. Q., Yang, D. M., and Li, Q.: Geomagnetic jerks based on the midnight mean of the geomagnetic field from geomagnetic networks of China, Acta Seismologica Sinica, 41, 512–523, https://doi.org/10.11939/jass.20190009, 2019.
Holme, R. and De Viron, O.: Characterization and implications of intradecadal variations in length of day, Nature, 499, 202–204, https://doi.org/10.1038/nature12282, 2013.
Institute of Geophysics, China Earthquake Administration: Geomagnetic Observation Report of Wuhan Geomagnetic Observatory, 2005.
Institute of Geophysics, China Earthquake Administration: Geomagnetic Observation Report of Urumqi Geomagnetic Observatory, 2012.
Jankowski, J. and Sucksdorff, S.: Guide for magnetic measurements and observatory practice, The Polish National Space Research Press, Warszawa, Poland, 235 pp, ISBN: 0-9650686-2-5, 1996.
Jonkers, A. R. T., Jackson, A., and Murray, A.: Four centuries of geomagnetic data from historical records, Rev. Geophys., 41, 1006, https://doi.org/10.1029/2002RG000115, 2003.
Kang, G. F., Gao, G. M., Wen, L. M., and Bai, C. H.: The 2014 geomagnetic jerk observed by geomagnetic observatories in China, Chinese J. Geophys.-CH, 63, 4144–4153, https://doi.org/10.6038/cjg2020N0337, 2020.
Korte, M., Mandea, M., and Matzka, J.: A historical declination curve for Munich from different data sources, Phys. Earth Planet. In., 177, 161–172, https://doi.org/10.1016/j.pepi.2009.08.005, 2009.
Kotzé, P. B.: Signature of the 2007 geomagnetic jerk at the Hermanus magnetic observatory, S. Afr J. Geol., 114, 207–210, https://doi.org/10.2113/gssajg.114.2.207, 2011.
Kudin, D. V., Soloviev, A. A., Sidorov, R. V., Starostenko, V. I., Sumaruk, Y. P., and Legostayeva, O. V.: Advanced Production of Quasi-Definitive Magnetic Observatory Data of the INTERMAGNET Standard, Geomagn. Aeron.+, 61, 54–67, https://doi.org/10.1134/S0016793221010096, 2021.
Linthe, H. J., Reda, J., Isac, A., Matzka, J., and Turbitt, C.: Observatory data quality control-the instrument to ensure valuable research, in: Proceedings of the XVth IAGA Workshop on Geomagnetic Observatory Instruments, Data Acquisition and Processing: extended abstract volume, edited by: Hejda, P., San Fernando, Spain, March 2013, 173–177, https://core.ac.uk/download/pdf/20319986.pdf (last access: 18 November 2022), 2013.
Liu, C. M., Liu, L. G., and Pirjola, R.: Geomagnetically induced currents in the high voltage power grid in China, IEEE T. Power Deliver., 24, 2368–2374, 2009.
Liu, L. G., Liu, C. M., Zhang, B., Wang, Z. Z., Xiao, X. N., and Han, L. Z.: Strong magnetic storm's influence on China's Guangdong power grid, Chinese J. Geophys.-CH, 51, 976–981, https://doi.org/10.3321/j.issn:0001-5733.2008.04.004, 2008.
Liu, L. G., Ge, X. N., Wang, K. R., Zong, W., and Liu C. M.: Observation studies of encroachment by geomagnetic storms on high-speed railways and oil-and-gas pipelines in China, Sci. Sin. Tech., 46, 268–275, https://doi.org/10.1360/N092015-00279, 2016.
Lowes, F.: An estimate of the errors of the IGRF/DGRF fields 1945–2000, Earth Planets Space, 52, 1207–1211, 2000.
Lowes, F. J.: IGRF Health Warning, Errors, and Limitations, NOAA, https://www.ncei.noaa.gov/products/international-geomagnetic-reference-field/health-warning (last access: 29 December 2024), 2022.
Lutephy, M.: Interplanetary external driven quasidynamo as the origin of geomagnetic jerks correlated with length of day and gravity anomaly, Contrib. Geophys. Geod., 48, 23–74, https://doi.org/10.2478/congeo-2018-0002, 2018.
Ma, L. H., Han, Y. B., and Yin, Z. Q.: Progress on variable earth rotation rate and geophysical phenomena, Progress in Geophysics, 19, 968–974, https://doi.org/10.3969/j.issn.1004-2903.2004.04.043, 2004.
Malin, S. R. C. and Hodder, B. M.: Was the 1970 geomagnetic jerk of internal or external origin?, Nature, 296, 726–728, 1982.
Mandea, M. and Olsen, N.: Investigation of a secular variation impulse using satellite data: The 2003 geomagnetic jerk, Earth Planet. Sc. Lett., 255, 94–105, 2007.
Mandea, M., Bellanger, E., Le Mouël, J. L.: A geomagnetic jerk for the end of the 20th century?, Earth Planet. Sc. Lett., 183, 369–373, 2000.
Mandea, M., Holme, R, Pais, A., Pinheiro, K., Jackson, A., and Verbanac, G.: Geomagnetic jerks: rapid core field variations and core dynamics, Space Sci. Rev., 155, 147–175, 2010.
Marshall, R. A., Smith, E. A., Francis, M. J., Waters, C. L., and Sciffer, M. D.: A preliminary risk assessment of the Australian region power network to space weather, Space Weather, 9, S10004, https://doi.org/10.1029/2011SW000685, 2011.
Morozova, A. L., Ribeiro, P., and Pais, M. A.: Correction of artificial jumps in the historical geomagnetic measurements of Coimbra Observatory, Portugal, Ann. Geophys., 32, 19–40, https://doi.org/10.5194/angeo-32-19-2014, 2014.
Morozova, A. L., Ribeiro, P., and Pais, M. A.: Homogenization of the historical series from the Coimbra Magnetic Observatory, Portugal, Earth Syst. Sci. Data, 13, 809–825, https://doi.org/10.5194/essd-13-809-2021, 2021.
Nahayo, E., Kotzé, P. B., Korte, M., and Webb, S.: A harmonic spline magnetic main field model for Southern Africa combining ground and satellite data to describe the evolution of the South Atlantic Anomaly in this region between 2005 and 2010. Earth Planets Space, 70, 30, https://doi.org/10.1186/s40623-018-0796-6, 2018.
Nie, L. J., Qiu, Y. D., Shen, W. B., Zhang, S. Q., and Zhang, B. B.: Accuracy Evaluation and Applicability of IGRF12 and WMM2015 Model in Chinese Mainland, Geomatics and Information Science of Wuhan University, 42, 1229–1235, https://doi.org/10.13203/j.whugis20160143, 2017.
Ou, J. M., Du, A. M., and Xu, W. Y.: Investigation of the SA evolution by using the CHAOS-4 model over 1997–2013, Sci. China Earth Sci., 59, 1041–1050, https://doi.org/10.1007/s11430-016-5265-0, 2016.
Pedatella, N. M., Forbes, J. M., Maute, A., Richmond, A. D., Fang, T.-W., Larson, K. M., and Millward, G.: Longitudinal variations in the F region ionosphere and the topside ionosphere-plasmasphere: Observations and model simulations, J. Geophys. Res., 116, A12309, https://doi.org/10.1029/2011JA016600, 2011.
Pinheiro, K. J., Jackson, A., and Finlay, C. C.: Measurements and uncertainties of the occurrence time of the 1969, 1978, 1991, and 1999 geomagnetic jerks, Geochem. Geophy. Geosy., 12, Q10015, https://doi.org/10.1029/2011GC003706, 2011.
Qamili, E., De Santis, A., Isac, A., Mandea, M., Duka, B., and Simonyan, A.: Geomagnetic jerks as chaotic fluctuations of the Earth's magnetic field, Geochem. Geophy. Geosy., 14, 839–850, https://doi.org/10.1029/2012GC004398, 2013.
Rasson, J. J.: Observatories, instrumentation, in: Encyclopedia of geomagnetism and paleomagnetism, edited by: Gubbins, D. and Herrero-Bervera, E., Springer, New York, https://doi.org/10.1007/978-1-4020-4423-6_225, 711–713, 2007.
Reay, S. J., Allen, W., Baillie, O., Bowe, J., Clarke, E., Lesur, V., and Macmillan, S.: Space weather effects on drilling accuracy in the North Sea, Ann. Geophys., 23, 3081–3088, https://doi.org/10.5194/angeo-23-3081-2005, 2005.
Reay, S. J., Clarke, E., Dawson, E., and Macmillan, S.: Operations of the World Data Centre for Geomagnetism, Edinburgh, Data Science Journal, 12, WDS47–WDS51, 2013.
Reda, J., Fouassier, D., Isac, A., Linthe, H. J., Matzka, J., and Turbitt, C. W.: Improvements in Geomagnetic Observatory Data Quality, in: Geomagnetic Observations and Models, vol. 5, edited by: Mandea, M. and Korte, M., Springer Science + Business Media, 127–148, eBook ISBN 978-90-481-9858-0, 2011.
Sergeyeva, N., Gvishiani, A., Soloviev, A., Zabarinskaya, L., Krylova, T., Nisilevich, M., and Krasnoperov, R.: Historical K index data collection of Soviet magnetic observatories, 1957–1992, Earth Syst. Sci. Data, 13, 1987–1999, https://doi.org/10.5194/essd-13-1987-2021, 2021.
Soloviev, A., Chulliat, A., and Bogoutdinov, S.: Detection of secular acceleration pulses from magnetic observatory data, Phys. Earth Planet. In., 270, 128–142, https://doi.org/10.1016/j.pepi.2017.07.005, 2017.
Soloviev, A., Lesur, V., and Kudin, D.: On the feasibility of routine baseline improvement in processing of geomagnetic observatory data, Earth Planets Space, 70, 16, https://doi.org/10.1186/s40623-018-0786-8, 2018.
Sun, X. L.: Analysis of long-term variation characteristics of geomagnetic field in Changchun, Journal of Disaster Prevention and Reduction, 29, 44–48, 2013.
Torta, J. M., Pavón-Carrasco, F. J., Marsal, S., Finlay, C. C.: Evidence for a new geomagnetic jerk in 2014, Geophys. Res. Lett., 42, 7933–7940, https://doi.org/10.1002/2015GL065501, 2015.
Tozzi, R., De Michelis, P., and Meloni, A.: Geomagnetic jerks in the polar regions, Geophys. Res. Lett., 36, L15304, https://doi.org/10.1029/2009GL039359, 2009.
Vichare, G., Rawat, R., Jadhav, M., and Sinha, A. K.: Seasonal variation of the Sq focus position during 2006–2010, Adv. Space Res., 59, 542–556, https://doi.org/10.1016/j.asr.2016.10.009, 2017.
V-MOD Working Group: IGRF 14th generation, http://www.ngdc.noaa.gov/IAGA/vmod/ (last access: 20 May 2025).
Wang, D. W.: Analysis of the International Geomagnetic Reference Field Error in the China Continent, Chinese J. Geophys., 46, 63–73, 2003.
Xu, W. Y.: Physics of Electromagnetic Phenomena of the Earth, University of Science and Technology of China Press, Hefei, 558 pp., ISBN 978-7312022562, 2009.
Yamazaki, Y. and Maute, A.: Sq and EEJ – A review on the daily variation of the geomagnetic field caused by ionospheric dynamo currents, Space Sci. Rev., 206, 299–405, 2017.
Yamazaki, Y., Kathrin, H., and Anderson, W. J.: Day-to-day variability of midlatitude ionospheric currents due to magnetospheric and lower atmospheric forcing, J. Geophys. Res.-Space, 121, 7067–7086, https://doi.org/10.1002/2016JA022817, 2016.
Zhang, S., Fu, C., Wang, J., Zhu, G., Chen, C., He, S., Guo, P., and Chang, G.: Rescue and quality control of historical geomagnetic measurement at Sheshan observatory, China, Earth Syst. Sci. Data, 14, 5195–5212, https://doi.org/10.5194/essd-14-5195-2022, 2022b.
Zhang, S., Fu, C., Zhao, X., Zhang, X., He, Y., Li, Q., Chen, J., Wang, J., and Zhao, Q.: Strategies in the Quality Assurance of Geomagnetic Observation Data in China, Data Science Journal, 2, 1–11, https://doi.org/10.5334/dsj-2024-009, 2024.
Zhang, S., Zhu, G., Chen, J., Deng, N., Lu, J., Yu, H., Chen, C., and Wang, B.: An integrated and quality-controlled historical datasets of eight pioneering geomagnetic observatories in China, Zenodo [data set], https://doi.org/10.5281/zenodo.15481895, 2025.
Zhang, S. Q., Fu, C. H., He, Y. F., Yang, D. M., Li, Q., Zhao, X. D., and Wang, J. J.: Quality Control of Observation Data by the Geomagnetic Network of China, Data Science Journal, 15, 15, https://doi.org/10.5334/dsj-2016-015, 2016.
Zhang, S. Q., Zhu, G. H., Wang, J. J., Chen, C. H., He, S. P., and Guo, P. K.: Quality-controlled geomagnetic hourly mean values datasets of Sheshan observatory from 1933 to 2019, Zenodo [data set], https://doi.org/10.5281/zenodo.7005471, 2022a.
Zhang, S. Q., Fu, C. H., Wang, J. J., Zhao, Q., Hu, X. J., Zhang, X. X., Guo, P. K., He, S. P., and Chang, G. P.: A method for automatic identification and processing of step-like interference information in geomagnetic data, CN117687104B, Intellectual Property Press, China, https://max.book118.com/html/2024/0313/5341141102011122.shtm (last access: 29 Auguest 2025), 2023.
Zhang, X. L., Chang, G. P., and Zhang, M. D.: Interferences on the geomagnetism observation system in Beijing National Earth Observatory, Seismological and Geomagnetic Observation and Research, 39, 108–113, https://doi.org/10.3969/j.issn.1003-3246.2018.06.016, 2018.
Zhao, X. D., Yang, D. M., He, Y. Fei., Yu, P. Q., Liu, X. C., Zhang, S. Q., Luo, K. Q., Hu, X. J.: The study of Sq equivalent current during the solar cycle, Chinese J. Geophys., 57, 3777–3788, https://doi.org/10.6038/cjg20141131, 2014.
Zhao, X. K., Wu, B. Y., and N., B. Q.: The geomagnetic dataset of Beijing Ming Tombs station (1991–2001), China Scientific Data, 2, 1–9, https://www.sciengine.com/csD/doi/10.11922/csdata.170.2016.0074 (last access: 29 December 2024), 2017.
Zhou, J. P.: Reminiscences of the Lhasa Geomagnetic Observatory, Recent Developments in World Seismological, 1, 34–40, https://doi.org/10.3969/j.issn.0235-4975.2013.01.009, 2013.