the Creative Commons Attribution 4.0 License.
the Creative Commons Attribution 4.0 License.
 | 05 Sep 2025
Quantifying dust deposition over the Atlantic Ocean
Vassilis Amiridis
Carlos Pérez García-Pando
Svetlana Tsyro
Jan Griesfeller
Antonis Gkikas
Thanasis Georgiou
María Gonçalves Ageitos
Jeronimo Escribano
Stelios Myriokefalitakis
Elisa Bergas Masso
Enza Di Tomaso
Sara Basart
Jan-Berend W. Stuut
Angela Benedetti
Quantification of atmospheric dust deposition into the Atlantic Ocean is provided. The estimates rely on the four-dimensional structure of atmospheric dust provided by the ESA-LIVAS climate data record established on the basis of CALIPSO-CALIOP observations. The data record of the atmospheric dust deposition rate is provided for the Atlantic Ocean region, between latitudes 60° S and 40° N, and is characterized by 5° (zonal) × 2° (meridional) spatial resolution and seasonal-mean temporal resolution for the period December 2006–November 2022. The estimates of dust deposition are evaluated on the basis of sediment-trap measurements of deposited lithogenic material. The evaluation intercomparison shows a good agreement between the two datasets, revealing the capacity of the satellite-based product to quantitatively provide the amount of dust deposited into the Atlantic Ocean, characterized by a correlation coefficient of 0.79 and a mean bias of 5.42 mg m−2 d−1. Integration of the satellite-based dust deposition rate dataset into AeroVal allowed assessment comparison of the dust deposition product against dust deposition field estimates provided by the MONARCH, EMEP MSC-W, and EC-Earth3-Iron models. The comparison revealed the capacity of the satellite-based product to follow the seasonal activation of dust source regions and the four-dimensional migration of dust transport pathways. Overall, the annual-mean amount of dust deposition into the Atlantic Ocean is estimated at 274.79 ± 31.64 Tg yr−1, of which 243.98 ± 23.89 Tg yr−1 of dust is deposited into the North Atlantic Ocean and 30.81 ± 10.49 Tg yr−1 of dust is deposited into the South Atlantic Ocean. Moreover, a negative statistically significant trend in atmospheric dust deposition over the Atlantic Ocean is revealed. The satellite-based dust deposition product is considered unique with respect to a wide range of potential applications, including compensating for geographical and temporal gaps of sediment-trap measurements, supporting evaluation assessments of model simulations, unraveling physical processes related to the atmospheric cycle of dust, and providing a deeper understanding of dust biogeochemical impacts on oceanic ecosystems, weather, and eventually climate. The atmospheric dust in terms of optical depth and dust deposition rate climate data records relevant to this paper (Proestakis et al., 2025) are available at https://doi.org/10.5281/zenodo.14608539.
- Article
(16232 KB) - Full-text XML
- BibTeX
- EndNote


The ocean plays a key role in climate by modulating energy fluxes and exchanging climate-relevant gases with the atmosphere. According to the Intergovernmental Panel on Climate Change Fifth Assessment Report (IPCC, 2014), ∼ 90 % of the total energy in excess in the atmosphere was absorbed by the ocean between 1971 and 2010. At the same time, gaseous CO2 is absorbed in the surface layer of the ocean and becomes available for the process of “photosynthesis” performed by phytoplankton cells, contributing through the processes of the “biological carbon pump” and the “solubility carbon pump” (Volk and Hoffert, 1985; Ito and Follows, 2003) to the slowing down of the increase in atmospheric CO2 that results from anthropogenic activities (Raupach et al., 2008). Moreover, phytoplankton abundance and variability regulate ocean color, which in turn determines the extent of light penetration in the water column (Hostetler et al., 2018), affecting sea surface temperature and resulting in potentially significant ocean–atmosphere feedbacks, such as possible determination of the trajectory of tropical storms (Gnanadesikan et al., 2010).
Current estimates of primary production range between 30 and 70 Pg-C yr−1 (Carr et al., 2006; Anav et al., 2013), with spatial distribution depending, among other factors, on the input of nutrients from the atmosphere (Krishnamurthy et al., 2010; Guerreiro et al., 2019; 2023; Myriokefalitakis et al., 2020). Among the key nutrients deposited into the open ocean, nitrogen (N), phosphorus (P), silica (SiO2), and iron (Fe) are critical for regulating phytoplankton growth and, consequently, for modulating marine productivity, ocean color, and the ocean's capacity to absorb CO2. Among these atmospheric deposited species, Fe availability is the most predominant limiting nutrient for phytoplankton growth over large oceanic areas (Jickells et al., 2005; Okin et al., 2011). Indeed, due to the key role of phytoplankton in the conversion of CO2 into organic carbon and to carbon sequestration, Fe deposition, and more specifically its bioavailable (dissolved) forms (e.g., aqueous, colloidal, or nanoparticulate), likely plays a major role in oceanic primary productivity (Tagliabue et al., 2017), with impact on the global carbon cycle, hence modulating atmospheric CO2 concentrations (Falkowski et al., 2000; Guerreiro et al., 2021) and, in the long term, the global climate. Another important biogeochemical parameter to characterize ocean productivity is marine nitrogen fixation, i.e., the reduction of gaseous N2 to ammonium performed by marine organisms. N2-fixing species (e.g., diazotrophs) have elevated Fe requirements, and their growth may also be Fe-limited over large areas of the Atlantic Ocean (Pabortsava et al., 2017; Schlosser et al., 2014).
However, iron concentrations in vast areas of the ocean are very low, further enhanced by the characteristic low solubility of iron in seawater (Boyd and Ellwood, 2010). Across the broader surface of the open ocean, eolian dust is the principal source of Fe (∼ 95 %), followed by Fe-containing aerosols from biomass burning and fossil-fuel combustion emissions (Mahowald et al., 2009). It should be noted that observations and laboratory experiments suggest that the solubility of bioavailable dissolved iron (DFe) in pyrogenic aerosols may be significantly higher than that in lithogenic aerosols, though considerably more sporadic than DFe from mineral dust (Ito et al., 2021). Mineral dust of natural sources, essentially composed of clay, silt, and soil particles (Adebiyi et al., 2023), is mechanically produced by surface winds breaking soil cohesion over surfaces with no vegetation and dry soil such as deserts. According to Yu et al. (2015b) and Kok et al. (2021, 2023), North Africa, including the Sahara and the Sahel area, is the biggest producer of mineral dust, contributing to approximately 50 % of the global atmospheric dust load (∼ 2100 Tg yr−1). Other natural sources of dust emission encompassing the South Atlantic Ocean include the desert areas of South Africa and South America, with estimated emissions of ∼ 100 and ∼ 190 Tg yr−1, respectively (Kok et al., 2021, 2023). In addition to natural sources, the contribution of dust emitted into the atmosphere from anthropogenic activities remains elusive, with estimated values ranging between 10 % and 50 % (e.g., Ginoux et al., 2012). Upon emission into the atmosphere, mineral dust particles are subject to eolian transport over distances of thousands of kilometers downwind, prior removal through wet deposition (i.e., scavenging through precipitation in the water or ice phase), dry deposition/gravitational settling, and turbulent mixing in the planetary boundary layer (PBL) (Gao et al., 2003; Hand et al., 2004; Prospero et al., 2010; Mahowald et al., 2011; van der Does et al., 2021).
To date, one of the biggest unknowns in the dust cycle remains the amount of atmospheric dust that is actually deposited into the open ocean. Ridley et al. (2012), on the basis of reanalysis models and satellite observations, estimated dust deposition into the Atlantic Ocean on the order of approximately 218 ± 48 Tg yr−1, though the model time series covered only 2 years. Kaufman et al. (2005), on the basis of Terra Moderate Resolution Imaging Spectroradiometer (MODIS) routine aerosol observations, quantified the amount of Saharan dust deposited into the Atlantic Ocean and the Caribbean Sea as approximately 190 Tg yr−1. Huneeus et al. (2011) performed cross-evaluation of a dozen global aerosol models against observed dust deposition measurements and reported discrepancies of up to an order of magnitude. Kok et al. (2023) estimated that dust emissions from the Saharan, Namib, Kalahari, and Atacama hyper-arid, arid, semi-arid, and dry subhumid areas encompassing the broader Atlantic Ocean contribute to approximately 230 and 86 Tg yr−1 of dust deposition into the North and South Atlantic oceans, respectively. The estimated deposition fluxes were based on particles with geometric (volume-equivalent) diameters up to 20 µm, though larger dust particles that were eolian-transported into the atmosphere (Weinzierl et al., 2016; Ryder et al., 2018) and deposited into the ocean (van der Does et al., 2018b) have been measured, not accounting for high-latitude dust emission sources (Cvetkovic et al., 2022). Similarly, Yu et al. (2019), on the basis of a 10-year (2007–2016) analysis of Cloud–Aerosol Lidar with Orthogonal Polarization (CALIOP; Winker et al., 2010), MODIS (Remer et al., 2005), Multiangle Imaging Spectroradiometer (MISR) (Garay et al., 2020), and Infrared Atmospheric Sounding Interferometer (IASI) (Capelle et al., 2014) observations, estimated the amount of dust deposited into the Tropical Atlantic Ocean to be in the range of 136–222 Tg yr−1, though the estimations correspond only to the Saharan dust outflow region (5° S–40° N). Reanalysis datasets of dust deposition, such as the Copernicus Atmosphere Monitoring Service (CAMS; Inness et al., 2019), are available but have not yet been validated with independent observations over the ocean.
A better understanding and quantification of the atmospheric dust spatiotemporal variability in terms of deposition across the broader ocean would facilitate addressing long-open questions such as the relationship between dust deposition and dust biogeochemical impact processes on oceanic marine ecosystems. For instance, most IPCC-class Earth system models (ESMs) use simplified climatological representations of dust deposition and of its composition and solubility to account for the effect of atmospheric nutrient inputs on ocean biogeochemical cycles (Aumont et al., 2015; Seland et al., 2020), although it is widely accepted that dust deposition is by nature highly episodic (Guieu et al., 2014). To date, models of the atmospheric iron cycle employed to simulate atmospheric Fe dissolution are characterized by different levels of complexity: from simple schemes including first-order rate processing constants applied to a globally uniform 3.5 % of Fe in dust to more complex ones allowing different types of acidic species to interact with dust that account for mineral-specific dissolution rates and oxalate processing (Myriokefalitakis et al., 2018; Ito et al., 2019). Model-based estimations on the global atmospheric dissolved dust-related Fe deposition fluxes into the ocean lie in the range of 0.2–0.4 Tg-Fe yr−1 for present-day conditions (Myriokefalitakis et al., 2018; Ito et al., 2019), approximately a factor of 2 higher than during the preindustrial times (Scanza et al., 2018; Bergas-Massó et al., 2023). However, atmospheric dust transport and deposition are also highly variable. Overall, it has been reported that dust mass has increased by up to 55 ± 30 % since the preindustrial era (Kok et al., 2023). However, recent studies debate on the magnitude of dust transport over the Atlantic Ocean, whether there is, in recent years, a decrease (Ridley et al., 2014) or increase (Cuevas-Agulló et al., 2024) in emission, transport, and deposition. Furthermore, future scenarios show a decrease in bioavailable Fe deposition at mid- and high latitudes but an increase in equatorial regions such as the equatorial Pacific, Atlantic, and Indian Ocean. Those increases are sharper and have a broader extension for the SSP370 scenario, characterized by strong anthropogenic emission levels (Bergas-Massó et al., 2023). A potential increase (decrease) in dust transport and deposition over the ocean could make iron and other nutrients, such as silica and phosphorus, more (less) available for phytoplankton (Gittings et al., 2024), hence triggering changes in marine primary productivity (Rodríguez et al., 2023), the oceanic carbon pump (Volk and Hoffert, 1985; Ito and Follows, 2003), and climate.
The complex interactions of such mechanics are still not well understood. An integrated approach of modeling, satellite, and in situ observations is needed to quantify the strength and the spatiotemporal characteristics of mineral dust deposition in the surface of the open ocean. An approach facilitating a better representation of the mechanisms behind the spatial and temporal variability of atmosphere–ocean interactions is key to interpret observed climatic change responses and to better describe future ones.
To date, satellite-based Earth observations (EOs) allow addressing the link between atmospheric aerosol composition and ocean deposition over extensive areas and long temporal periods. It is important, though, to emphasize that aerosol optical depth (AOD) or dust optical depth (DOD), as indicators of columnar total aerosol and dust aerosol load, respectively, cannot be directly employed as proxies for total aerosol and dust deposition fluxes, as deposition processes are highly dependent on the vertical structure of aerosols in the atmosphere and the meteorologic conditions (Schepanski et al., 2009; Yu et al., 2013, 2015b, 2019). However, a wealth of satellite-based observations on the four-dimensional (4D) distribution of aerosols over oceans has become available during the past decades. The main satellite-based active systems include the Cloud–Aerosol Transport System (CATS) (McGill et al., 2015; Yorks et al., 2016; Proestakis et al., 2019) on board the International Space Station (ISS; Rodier et al., 2015), the Atmospheric Laser Doppler Instrument (ALADIN) on board Aeolus (Stoffelen et al., 2005; Ansmann et al., 2007), the joint European Space Agency (ESA) and JAXA satellite Earth Cloud, Aerosol, and Radiation Explorer (EarthCARE; Illingworth et al., 2015), and CALIOP on board the Cloud–Aerosol Lidar and Infrared Pathfinder Satellite Observation (CALIPSO; Winker et al., 2007, 2009). In addition, novel techniques have been proposed, including the one-step Polarization Lidar Photometer Networking (one-step POLIPHON; Tesche et al., 2009; Ansmann et al., 2012) developed in the framework of the European Aerosol Research Lidar Network (EARLINET; https://www.earlinet.org/, last access: 21 August 2024; Pappalardo et al., 2014), making it possible to decouple the atmospheric dust component from the total aerosol load and accordingly to estimate the dust mass concentration (Ansmann et al., 2019). To date, the one-step POLIPHON has been extensively applied to CALIOP and CATS optical products to provide information on atmospheric dust (Amiridis et al., 2013; Marinou et al., 2017; Proestakis et al., 2018, 2024). At the same time, state-of-the-art global atmospheric reanalysis datasets, such as the European Centre for Medium-Range Weather Forecasts (ECMWF) reanalysis (ERA5) (Hersbach et al., 2020), have been established, providing comprehensive climate and weather data, including information on the three-dimensional wind components. Such advances allow, through synergetic implementation, computation of dust mass fluxes in both the zonal and meridional directions over specified oceanic areas and thus estimations of the deposited component. Finally, during the past decades, the available observations of the ocean's interior in terms of atmospheric deposited lithogenic material have tremendously increased, thanks to the deployment of arrays of submerged sediment traps (Albani et al., 2014; van der Does et al., 2016; Korte et al., 2017).
The challenge of the present work is to bring together this wealth of information to provide a full four-dimensional reconstruction of the atmospheric dust component and accordingly to estimate the atmospheric dust deposited component across the broader Atlantic Ocean. The paper is structured as follows: Sect. 2 provides an overview of the implemented datasets in terms of both satellite-based EOs and models (Sect. 2.1) and discusses the applied methodology (Sect. 2.2). Section 3 provides an overview of the EO-based atmospheric dust and the dust deposition products (Sect. 3.1), the evaluation of the EO-based dust deposition estimates (Sect. 3.2), the quantification of the total atmospheric dust deposited into the broader Atlantic Ocean (Sect. 3.3), and finally the EO-based dust deposition rate intercomparison against respective ESM outcomes (Sect. 3.4). Section 4, as the final part of this work, provides the summary of the study along with the main concluding remarks.
2.1 Datasets
2.1.1 CALIPSO-CALIOP
The Cloud–Aerosol Lidar and Infrared Pathfinder Satellite Observation (CALIPSO) environmental satellite is a joint satellite mission between the U.S. National Aeronautics and Space Administration (NASA) and the French space agency Centre National D'Études Spatiales (CNES), developed to provide insight into and eventually advance our fundamental understanding of the role of aerosols and clouds in weather and climate (Winker et al., 2010). CALIPSO was launched on 28 April 2006 to join CloudSat in the international Afternoon-Train (A-Train) group of polar-orbiting sun-synchronous satellites (Stephens et al., 2018), carrying a suite of three Earth-observing instruments into space: an imaging infrared radiometer (IIR; Garnier et al., 2017), a wide field-of-view camera (WFC), and the Cloud–Aerosol Lidar with Orthogonal Polarization (CALIOP) (Hunt et al., 2009). CALIOP, the CALIPSO primal payload, consisted of a two-wavelength elastic backscatter Nd:YAG lidar system, emitting linearly polarized light pulses at 532 and 1064 nm and conducting range-resolved measurements of the parallel and perpendicular backscattered components at 532 nm and of the total backscatter intensity at 1064 nm (Winker et al., 2009).
CALIOP Level 2 (L2) optical products are established on the basis of a sequence of successive algorithms ensuring, among others, daytime and nighttime calibration (Powell et al., 2009; Getzewich et al., 2018; Kar et al., 2018; Vaughan et al., 2019), atmospheric layer detection (Vaughan et al., 2009), and cloud–aerosol discrimination (Liu et al., 2009; Liu et al., 2019; Zeng et al., 2019). The detected atmospheric features, classified as “tropospheric” or “stratospheric” aerosol, are further subclassified as “marine”, “dust”, “polluted continental/smoke”, “clean continental”, “polluted dust”, “elevated smoke”, “dusty marine”, “PSC aerosol”, “volcanic ash”, or “sulfate/other” (Omar et al., 2009; Kim et al., 2018, Kar et al., 2019), a classification crucial towards retrieval of extinction coefficient profiles on the basis of backscatter coefficient profiles (Young and Vaughan, 2009). Here, we use the CALIOP Level 2 (L2) Version 4.5 (V4.5) Aerosol Profile (APro) and Cloud Profile (CPro) optical products (i.e., backscatter coefficient and particulate depolarization ratio at 532 nm), profile geolocation descriptors (i.e., longitude, latitude, and time), quality assurance (i.e., cloud–aerosol discrimination), and atmospheric classification flags (i.e., feature type, aerosol subtype) along the CALIPSO orbit path, provided at 5 km horizontal resolution and 60 m vertical resolution, for the Atlantic Ocean geographical domain confined between 40° N and 60° S latitude and for the temporal period extending between December 2006 and November 2022. Accordingly, mean pure-dust extinction coefficients at 532 nm profiles within each 5° (zonal) × 2° (meridional) spatial resolution are produced through aggregation and averaging of all quality-assured cloud-free pure-dust profiles located within each latitude, longitude, and altitude grid cell per each season, following the averaging approach provided and discussed in Tackett et al. (2018) (Sect. 2.2.1).
2.1.2 ERA5
The ERA5 dataset is a global reanalysis product that provides estimates of atmospheric, land, and oceanic variables from 1950 onward, with continuous updates in near real time up to the present day (Hersbach et al., 2020). ERA5 is produced by ECMWF for the Copernicus Climate Change Service (C3S) by combining historical observations with ECMWF's Integrated Forecast System (IFS) model. Atmospheric variables are available at a horizontal resolution of 0.25° × 0.25°, considered as a continuous tiled surface with the point coordinates corresponding to the centroids of the tiles.
In the framework of the study, we use the ERA5 seasonally averaged zonal and meridional components of wind (m s−1) from December 2006 and November 2022. The vertical resolution of ERA5, at pressure levels between 1000 and 1 hPa, is converted to height above mean sea level based on geopotential (Φ) using an approximation for the variation of gravity with altitude and assuming a spherical Earth and no centrifugal force effects (Wallace and Hobbs, 2006). The ERA5 wind speed parameters in the original regular latitude/longitude grid in the region of interest are re-gridded into a uniform spatial grid of 2° latitude by 5° longitude and of seasonal temporal resolution. Figure 1 shows the ERA5 annual mean speed of the horizontal component of wind for the period extending between December 2006 and November 2022.
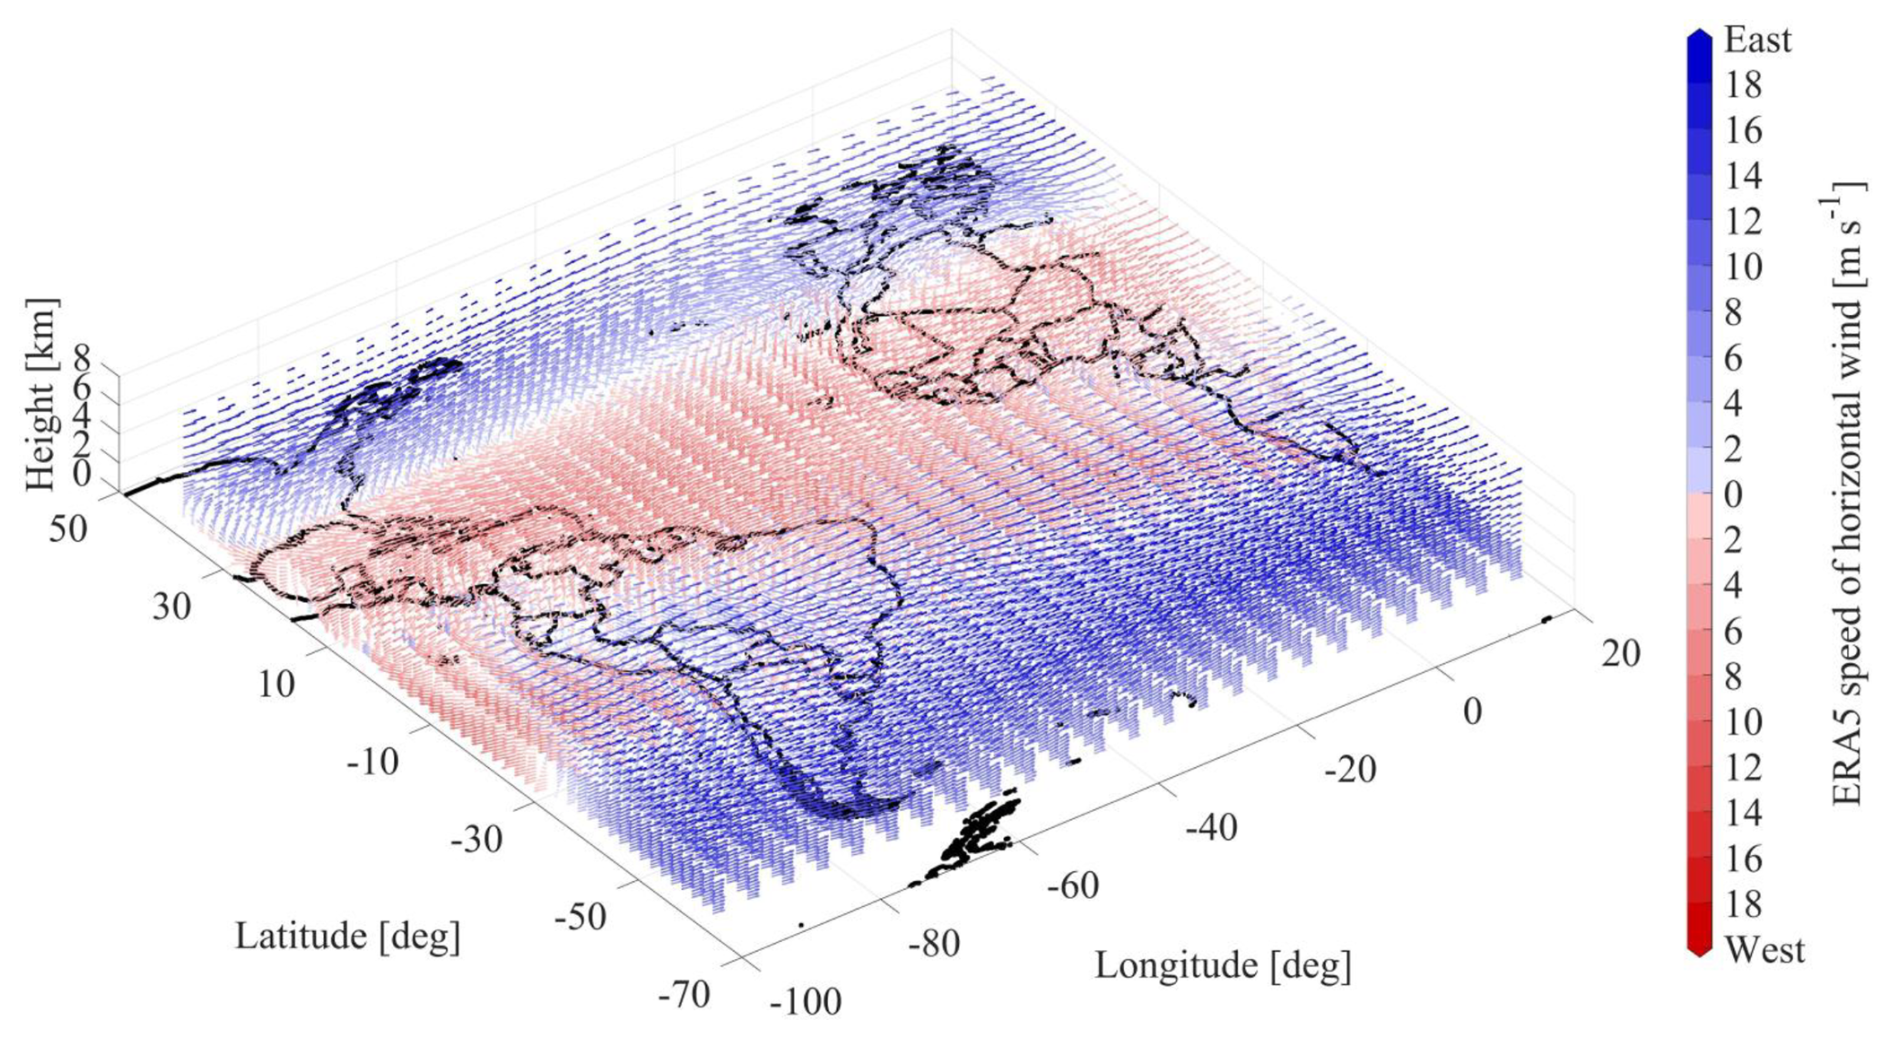
Figure 1ERA5 annual mean speed of the horizontal component of wind for the period from December 2006 to November 2022.
2.1.3 Dust deposition with the EC-Earth3-Iron Earth system model
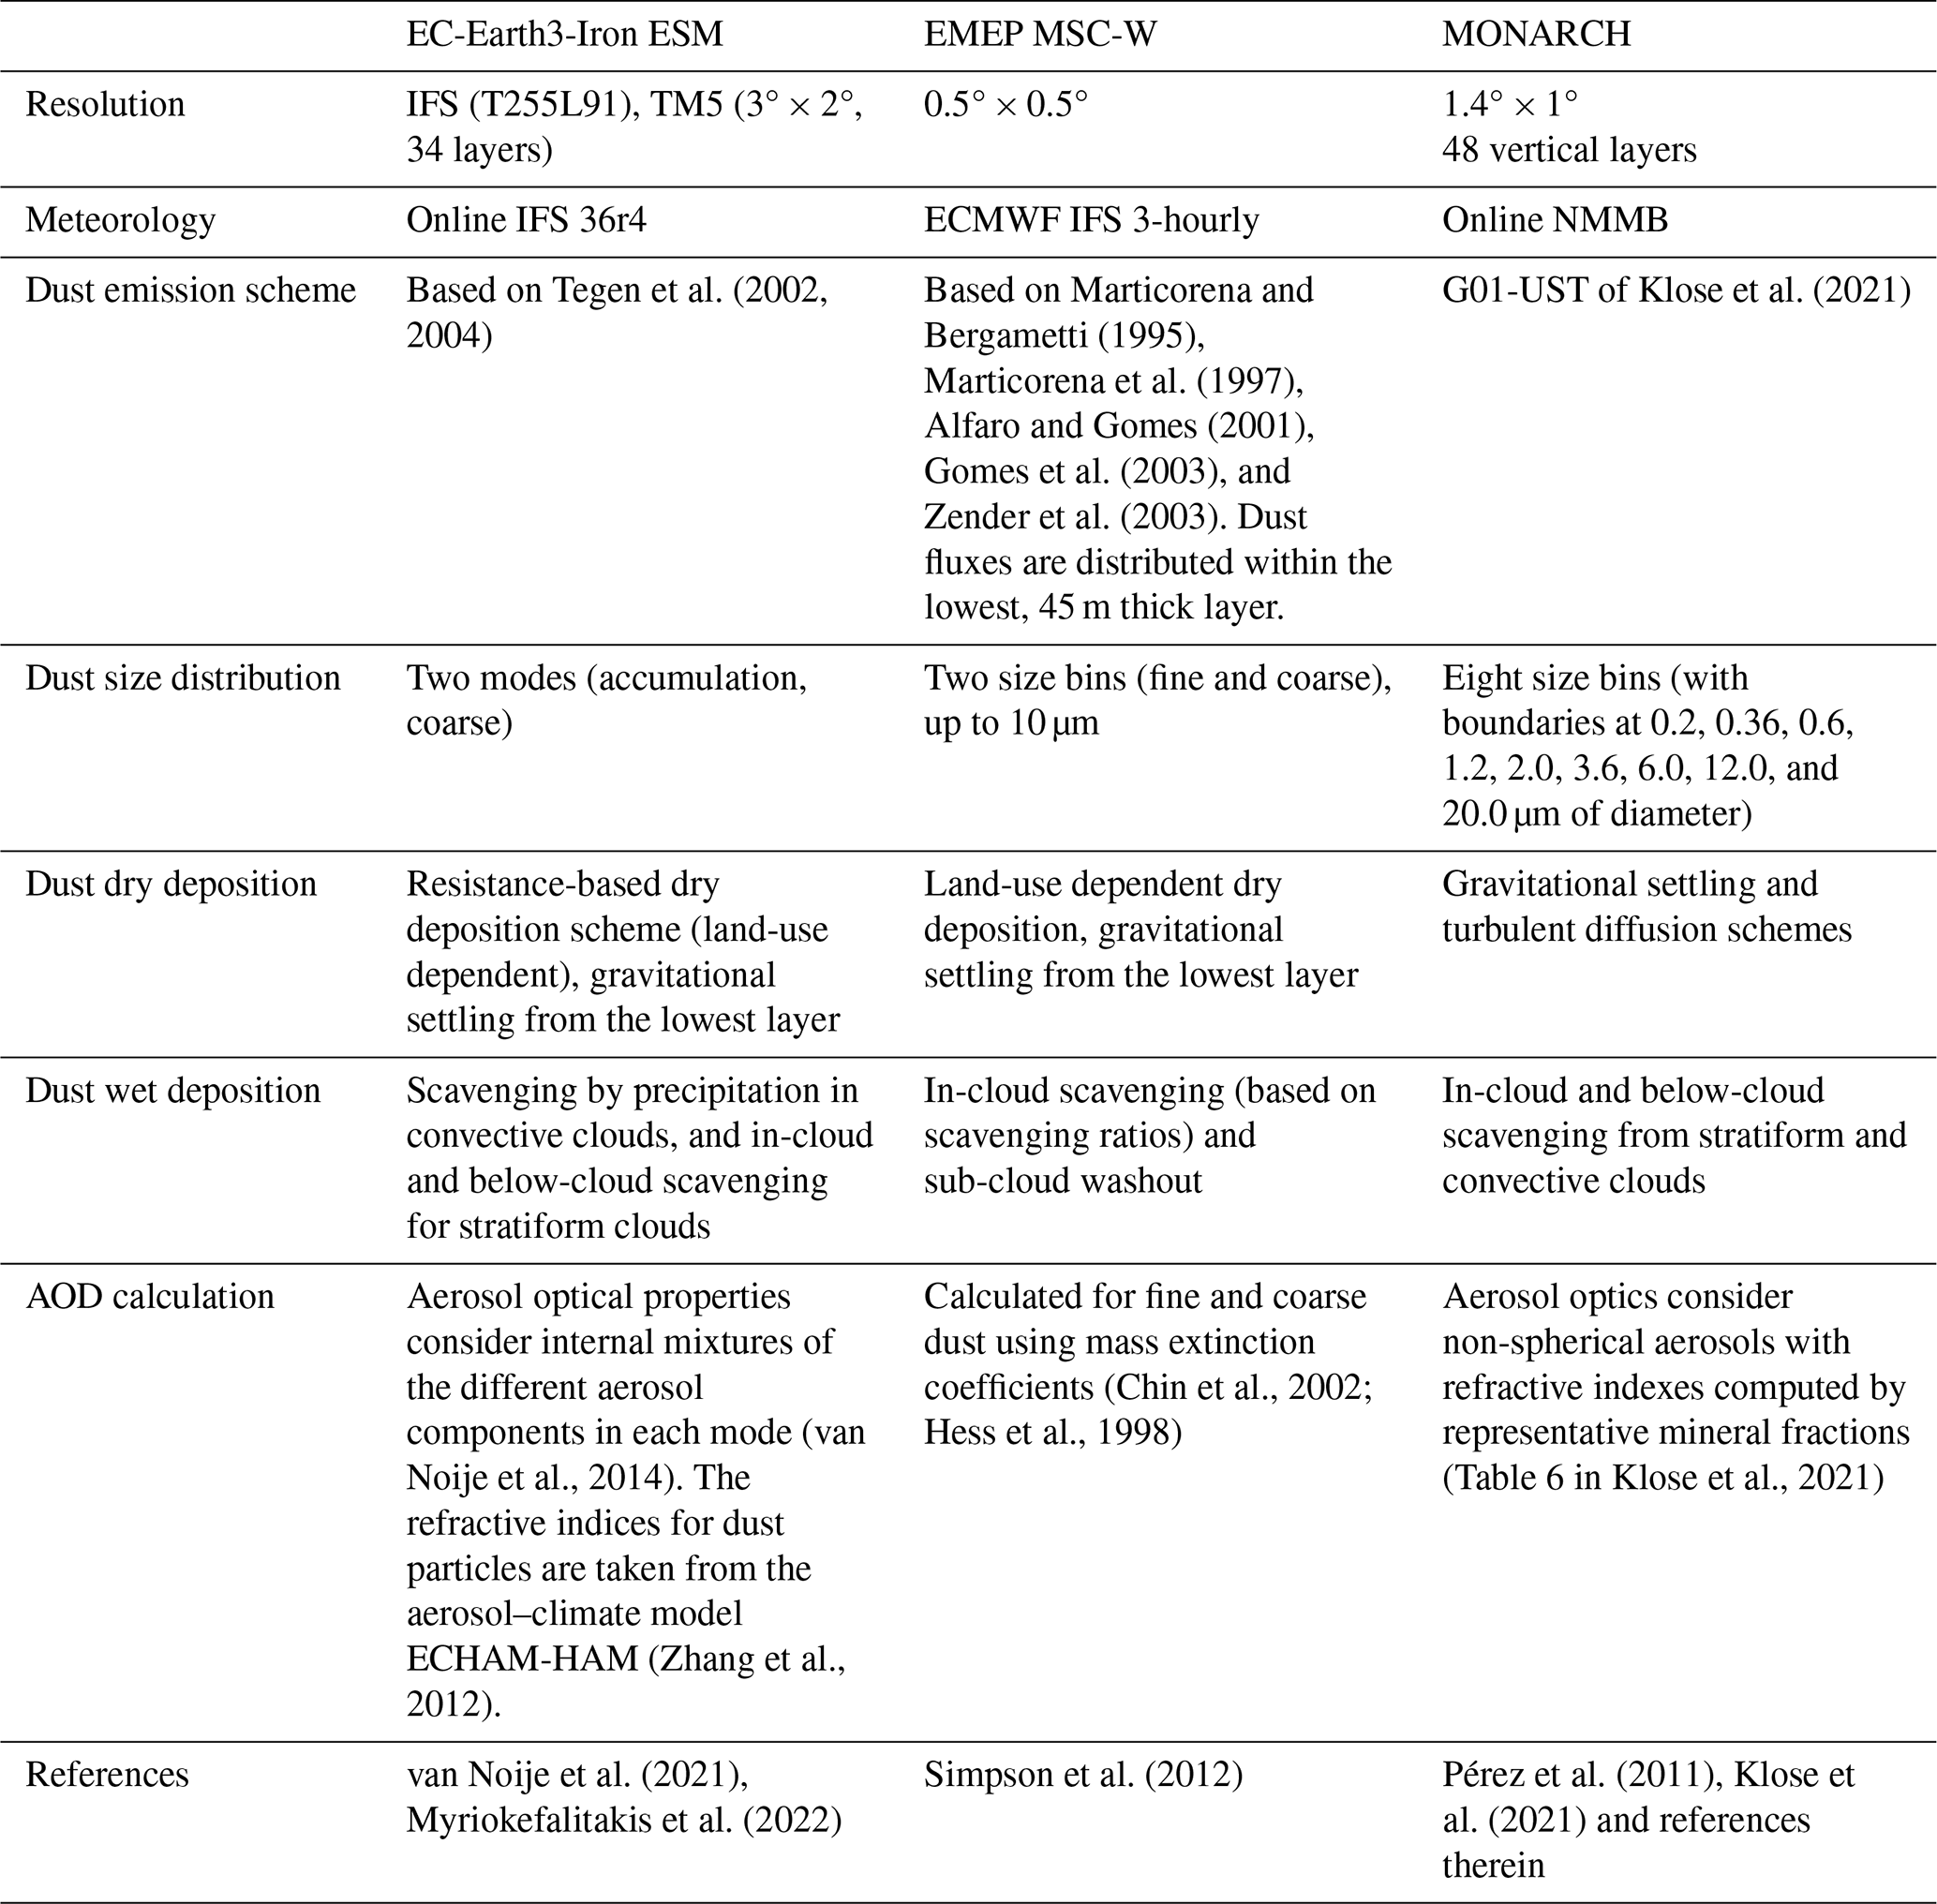
EC-Earth3 (Döscher et al., 2022) is a state-of-the-art ESM with a modular structure in which different Earth system components (atmosphere, ocean, sea ice, land surface, dynamic vegetation, atmospheric composition, and ocean biogeochemistry) can be coupled in various model configurations according to specific scientific needs. In this work, we apply the EC-Earth3-Iron (Myriokefalitakis et al., 2021; Bergas Massó et al., 2023) version, with a configuration that accounts for atmospheric dynamics and land surface processes through the Integrated Forecast System (IFS) cycle 36r4 from the ECMWF and the interactive simulation of atmospheric aerosols and reactive gas species via the Tracer Model 5 (TM5) (van Noije et al., 2021), including a complex aqueous phase chemistry and an interactive calculation of aerosol and in-cloud pH (Myriokefalitakis et al., 2022). The modal aerosol microphysical scheme M7 (Vignati et al., 2004) represents different aerosol components and considers internally mixed particles in four water-soluble (nucleation, Aitken, accumulation, and coarse) and three insoluble (Aitken, accumulation, and coarse) modes. Dust emission is calculated online following Tegen et al. (2002, 2004). Freshly emitted dust aerosols are allocated in the accumulation and coarse insoluble modes, but they are allowed to become soluble via atmospheric processing (further details are provided in Table 1).
To reproduce close-to-reality present-day climate conditions, the model is executed in an atmosphere–chemistry coupled mode using observed ocean conditions (sea surface temperature and sea ice concentration) as in the Atmospheric Model Intercomparison Project (AMIP) protocol (Gates et al., 1999). Furthermore, the atmospheric circulation is constrained towards ERA5 reanalysis data (Hersbach et al., 2020) by adjusting the modeled wind vorticity and divergence through Newtonian relaxation towards the reanalysis.
The simulation period spans from the year 1991 to 2020. For the 1991–2014 period, anthropogenic and biomass burning emissions are taken from the Coupled Model Intercomparison Phase 6 (CMIP6) historical datasets (Hoesly et al., 2018), while for 2015–2020, we have selected an intermediate scenario from those defined in the CMIP6 protocol, i.e., the SSP2-4.5 (Gidden et al., 2019). The model is executed at the standard spatial resolution, with T255L91 for IFS (approximately 80 km at mid-latitudes and 91 vertical levels) and with 3° × 2° and 34 vertical levels for TM5.
2.1.4 Dust simulation with the EMEP MSC-W model
The EMEP MSC-W chemical transport model (hereafter referred to as the EMEP model) has been used to perform simulations of the global load and deposition of mineral dust. The EMEP model is extensively used for air quality assessments in Europe and globally, both for policy-related issues and research studies. The parameterization of windblown dust emissions from deserts, arid areas, and arable lands used in the EMEP model is based on the works of Marticorena and Bergametti (1995), Marticorena et al. (1997), Alfaro and Gomes (2001), Gomes et al. (2003), and Zender et al. (2003). Dust particles up to 10 µm in diameter, represented by two size fractions (fine and coarse), are presently considered by the model. The aerosol extinction coefficient is diagnosed from the modeled three-dimensional fields of mass concentrations of individual aerosols, including mineral dust, using mass extinction coefficients based on Chin et al. (2002) and Hess et al. (1998). The EMEP simulations for the year 2020 have been made on a resolution of 0.5° × 0.5°, driven by ECMWF IFS 3-hourly meteorological fields for the actual year. Dry and wet deposition of mineral dust, as well as DOD, have been outputted on a daily basis. A comprehensive description of the EMEP MSC-W model can be found in Simpson et al. (2012), with further details provided in Table 1.
2.1.5 Dust simulation with the MONARCH model
The Multiscale Online Nonhydrostatic AtmospheRe CHemistry (MONARCH) model (Klose et al., 2021, and references therein) is a fully coupled atmosphere–chemistry model developed by the Earth Sciences Department of the Barcelona Supercomputing Center (BSC). MONARCH atmospheric dynamics rely on the Non-hydrostatic Multiscale Model on the B-grid (NMMB) (Janjic, 2003; Janjic and Gall, 2012). The model incorporates an advanced representation of the atmospheric dust cycle, including dust generation and uplift by surface winds and turbulence, transport through advection and diffusion, and vertically by turbulence and convection. Removal of dust from the atmosphere occurs in MONARCH through gravitational settling in the atmospheric column, dry deposition through turbulent diffusion, and wet deposition, including in-cloud and below-cloud scavenging from stratiform and convective clouds (Pérez et al., 2011, Haustein et al., 2012; Klose et al., 2021). Dust is represented by a sectional size distribution including eight log-normal bins that cover up to 20 µm in diameter. For this work, dust emission from saltation is represented following Ginoux et al. (2001) with the modifications described in Klose et al. (2021) and follows a size distribution at emission invariant with wind speed (Kok, 2011). Dust emissions are corrected by factors issued from a modified version of the local ensemble transform Kalman filter assimilation procedure, where we target the correction of emissions in spatial scales of tens to few hundreds of kilometers. This system assimilates dust-filtered AOD from SNPP-VIIRS Deep Blue retrievals in the MONARCH with the dust filtering procedure described in Escribano et al. (2022). The lagged assimilation method uses 20 members, with a moving 15 d assimilation window around and ahead of each estimate. The control vector consists of dust emission scaling factors, which have a temporal resolution of 3 d and the native spatial resolution of the model. These factors improve the spatial distribution of dust emissions in the model, but they do not change significatively the accumulated emissions of dust in seasonal and yearly scales (Escribano et al., 2023).
Dust interacts with long- and short-wave radiation, which is resolved by the model radiation scheme RRTM-G (Iacono et al., 2000, 2008). For the experiments presented here, dust particles are assumed non-spherical, long-wave optical properties are derived from the Optical Properties of Aerosols and Clouds (OPAC) dataset (Hess et al., 1998), and short-wave refractive indices consider internal mixtures of different minerals present in dust (Klose et al., 2021).
MONARCH experiments are run at the global scale (with 1° × 1.4° horizontal resolution in latitude and longitude and 48 vertical layers up to 10 hPa) for the year 2020 using more than 1 year of spin-up. The meteorological variables are initialized every 24 h from ERA-Interim reanalysis data (Berrisford et al., 2009; Dee et al., 2011) to constrain the modeled circulation towards close-to-reality fields, whereas the soil variables and dust are kept as calculated by the model in the initialization (further details are provided in Table 1). Dust concentrations, AOD, and dry/wet deposition rates are direct outputs from the models and were provided as daily fields (at their respective grids), which were averaged to obtain the monthly mean fields to be used in the AeroVal evaluations and consistency checks. No special selection of days with dust events has been made so that the monthly mean values include both data in dusty and non-dusty days, consistent with the EO-based dust products used here.
Table 1EC-Earth3-Iron ESM, EMEP MSC-W, and MONARCH configurations.
2.2 Methodology
2.2.1 Decoupling the atmospheric pure-dust component from the total aerosol load
Decoupling of the atmospheric dust component from the total aerosol load is performed on the basis of the one-step POLIPHON (Tesche et al., 2009; Ansmann et al., 2012) technique, established in the framework of EARLINET (https://www.earlinet.org/, last access: 21 August 2023; Pappalardo et al. 2014). As discussed and demonstrated in the framework of the European Space Agency (ESA) LIdar climatology of Vertical Aerosol Structure for space-based lidar simulation studies activity (LIVAS; Amiridis et al., 2015) project, proper implementation of the one-step POLIPHON technique to CALIPSO L2 optical products at 532 nm towards derivation of the four-dimensional atmospheric dust climate data record requires a sequence of intermediate steps, considerations, and assumptions. Figure 2 provides an illustration of the methodology towards establishing the ESA-LIVAS atmospheric dust product of the climate data record, on the basis of a CALIPSO nighttime granule over the broader Atlantic Ocean on 12 August 2012 (Fig. 2a). As shown, two distinct dust plumes emitted from the broader Sahara and the desert areas of South America were present over the North Atlantic Ocean and South Atlantic Ocean, respectively (areas “A” and “B”, delineated by ellipses in yellow).
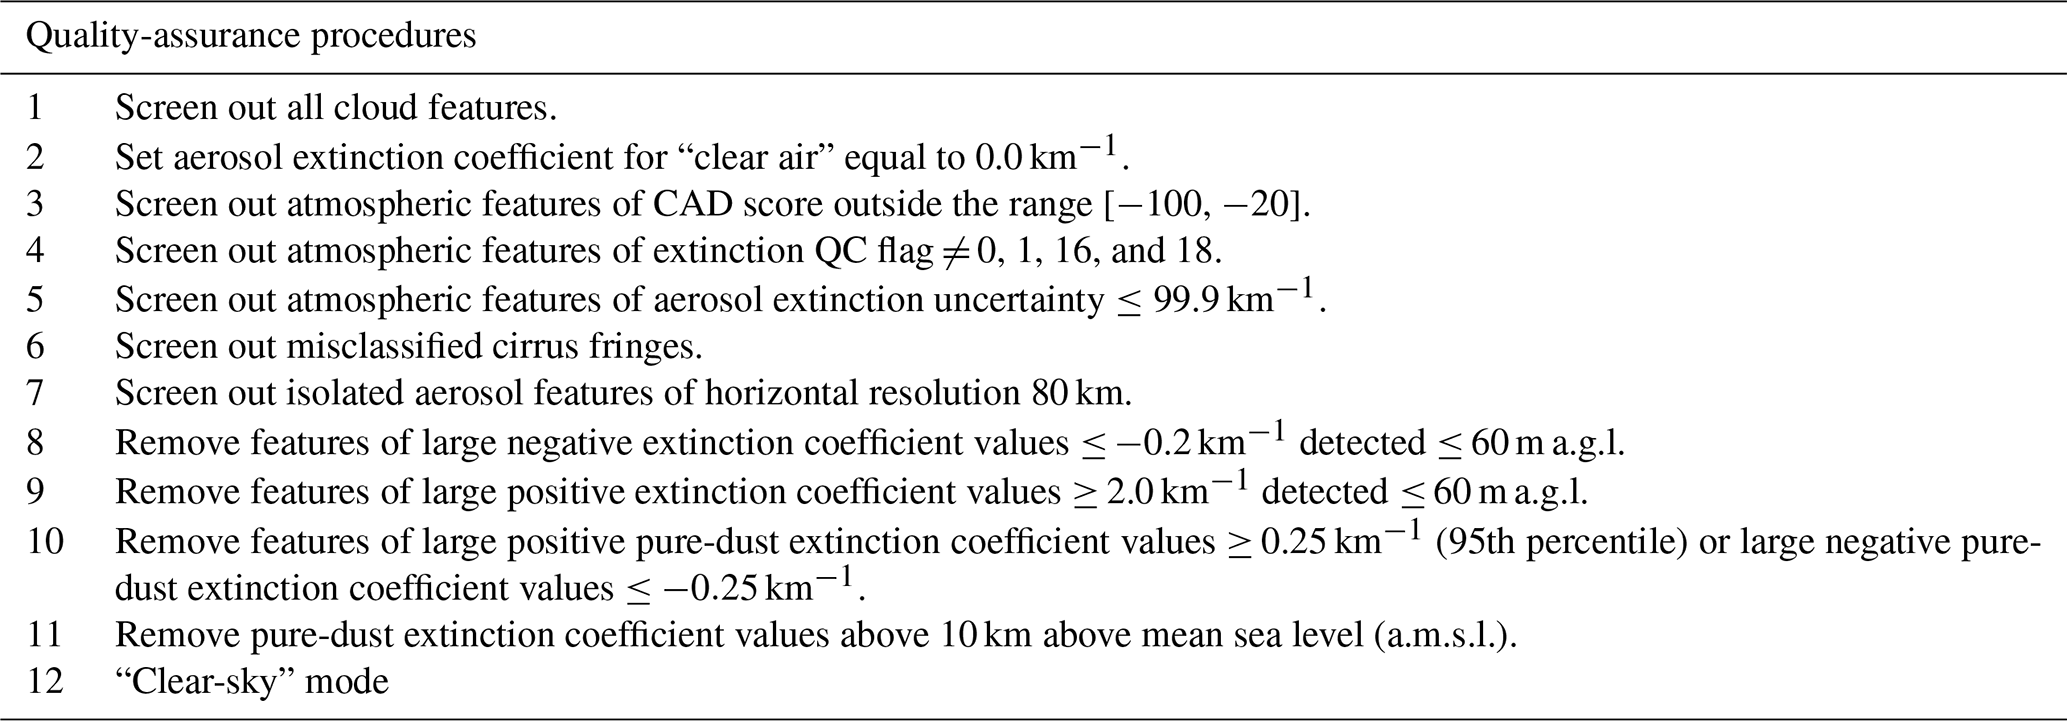
The first step relates to quality assurance of the generated CALIPSO-based L2 atmospheric pure-dust product, following the procedures established in the framework of the official CALIPSO Level 3 (L3) aerosol products (Winker et al., 2013; Tackett et al., 2018) and the ESA-LIVAS database (Amiridis et al., 2013; Marinou et al., 2017; Proestakis et al., 2018; Proestakis et al., 2024). The quality-assurance criteria (Table 2) are conservatively selected here, aiming to balance between the removal of a significant number of low-quality features and the preservation of the dataset. The quality-screening procedures are iteratively applied to both the CALIPSO L2 backscatter coefficient at 532 nm and particulate depolarization ratio at 532 nm profiles prior to application of the one-step POLIPHON technique.
Table 2Quality-control procedures and filtering applied to CALIPSO data.
Accordingly, the decoupling of the dust and non-dust atmospheric components is performed under two conditions. The first one relates to the consideration of atmospheric aerosol layers as external mixtures of two distinct aerosol-subtype classes with distinct depolarizing properties. Following the CALIPSO feature-type (Fig. 2b) and aerosol-subtype (Fig. 2c) classification algorithms and towards the overarching objective of decoupling the pure-dust component from the total aerosol load, the separation scheme assumes the “dust”, “polluted dust”, and “dusty marine” aerosol subtypes as external mixtures of a “dust” and a “non-dust” component, while the rest of the “tropospheric” and “stratospheric” defined aerosol-subtype classes are considered virtually dust-free (Kim et al., 2018, Kar et al., 2019). The first consideration, of external aerosol mixtures, allows for the second condition, that the total backscattered signal corresponds to the summation of the parallel and perpendicular backscattered signals by the two aerosol-subtype classes. Under these two conditions, and according to the one-step POLIPHON technique, the contribution of the pure-dust aerosol component to the total aerosol load, in terms of backscatter coefficient, is calculated by Eq. (1).
In Eq. (1), the parameters “δλ,p(z)”, “βλ,p(z)”, and “βλ,d(z)” correspond to the particulate depolarization ratio (Fig. 2d), total backscatter coefficient (Fig. 2e), and pure-dust backscatter coefficient (Fig. 2f), respectively, while the input constants of “ and “δλ,nd” correspond to the typical particulate depolarization ratio of the pure-dust and non-dust components of the external aerosol mixture, expressed as functions of wavelength “λ” and height “z”.
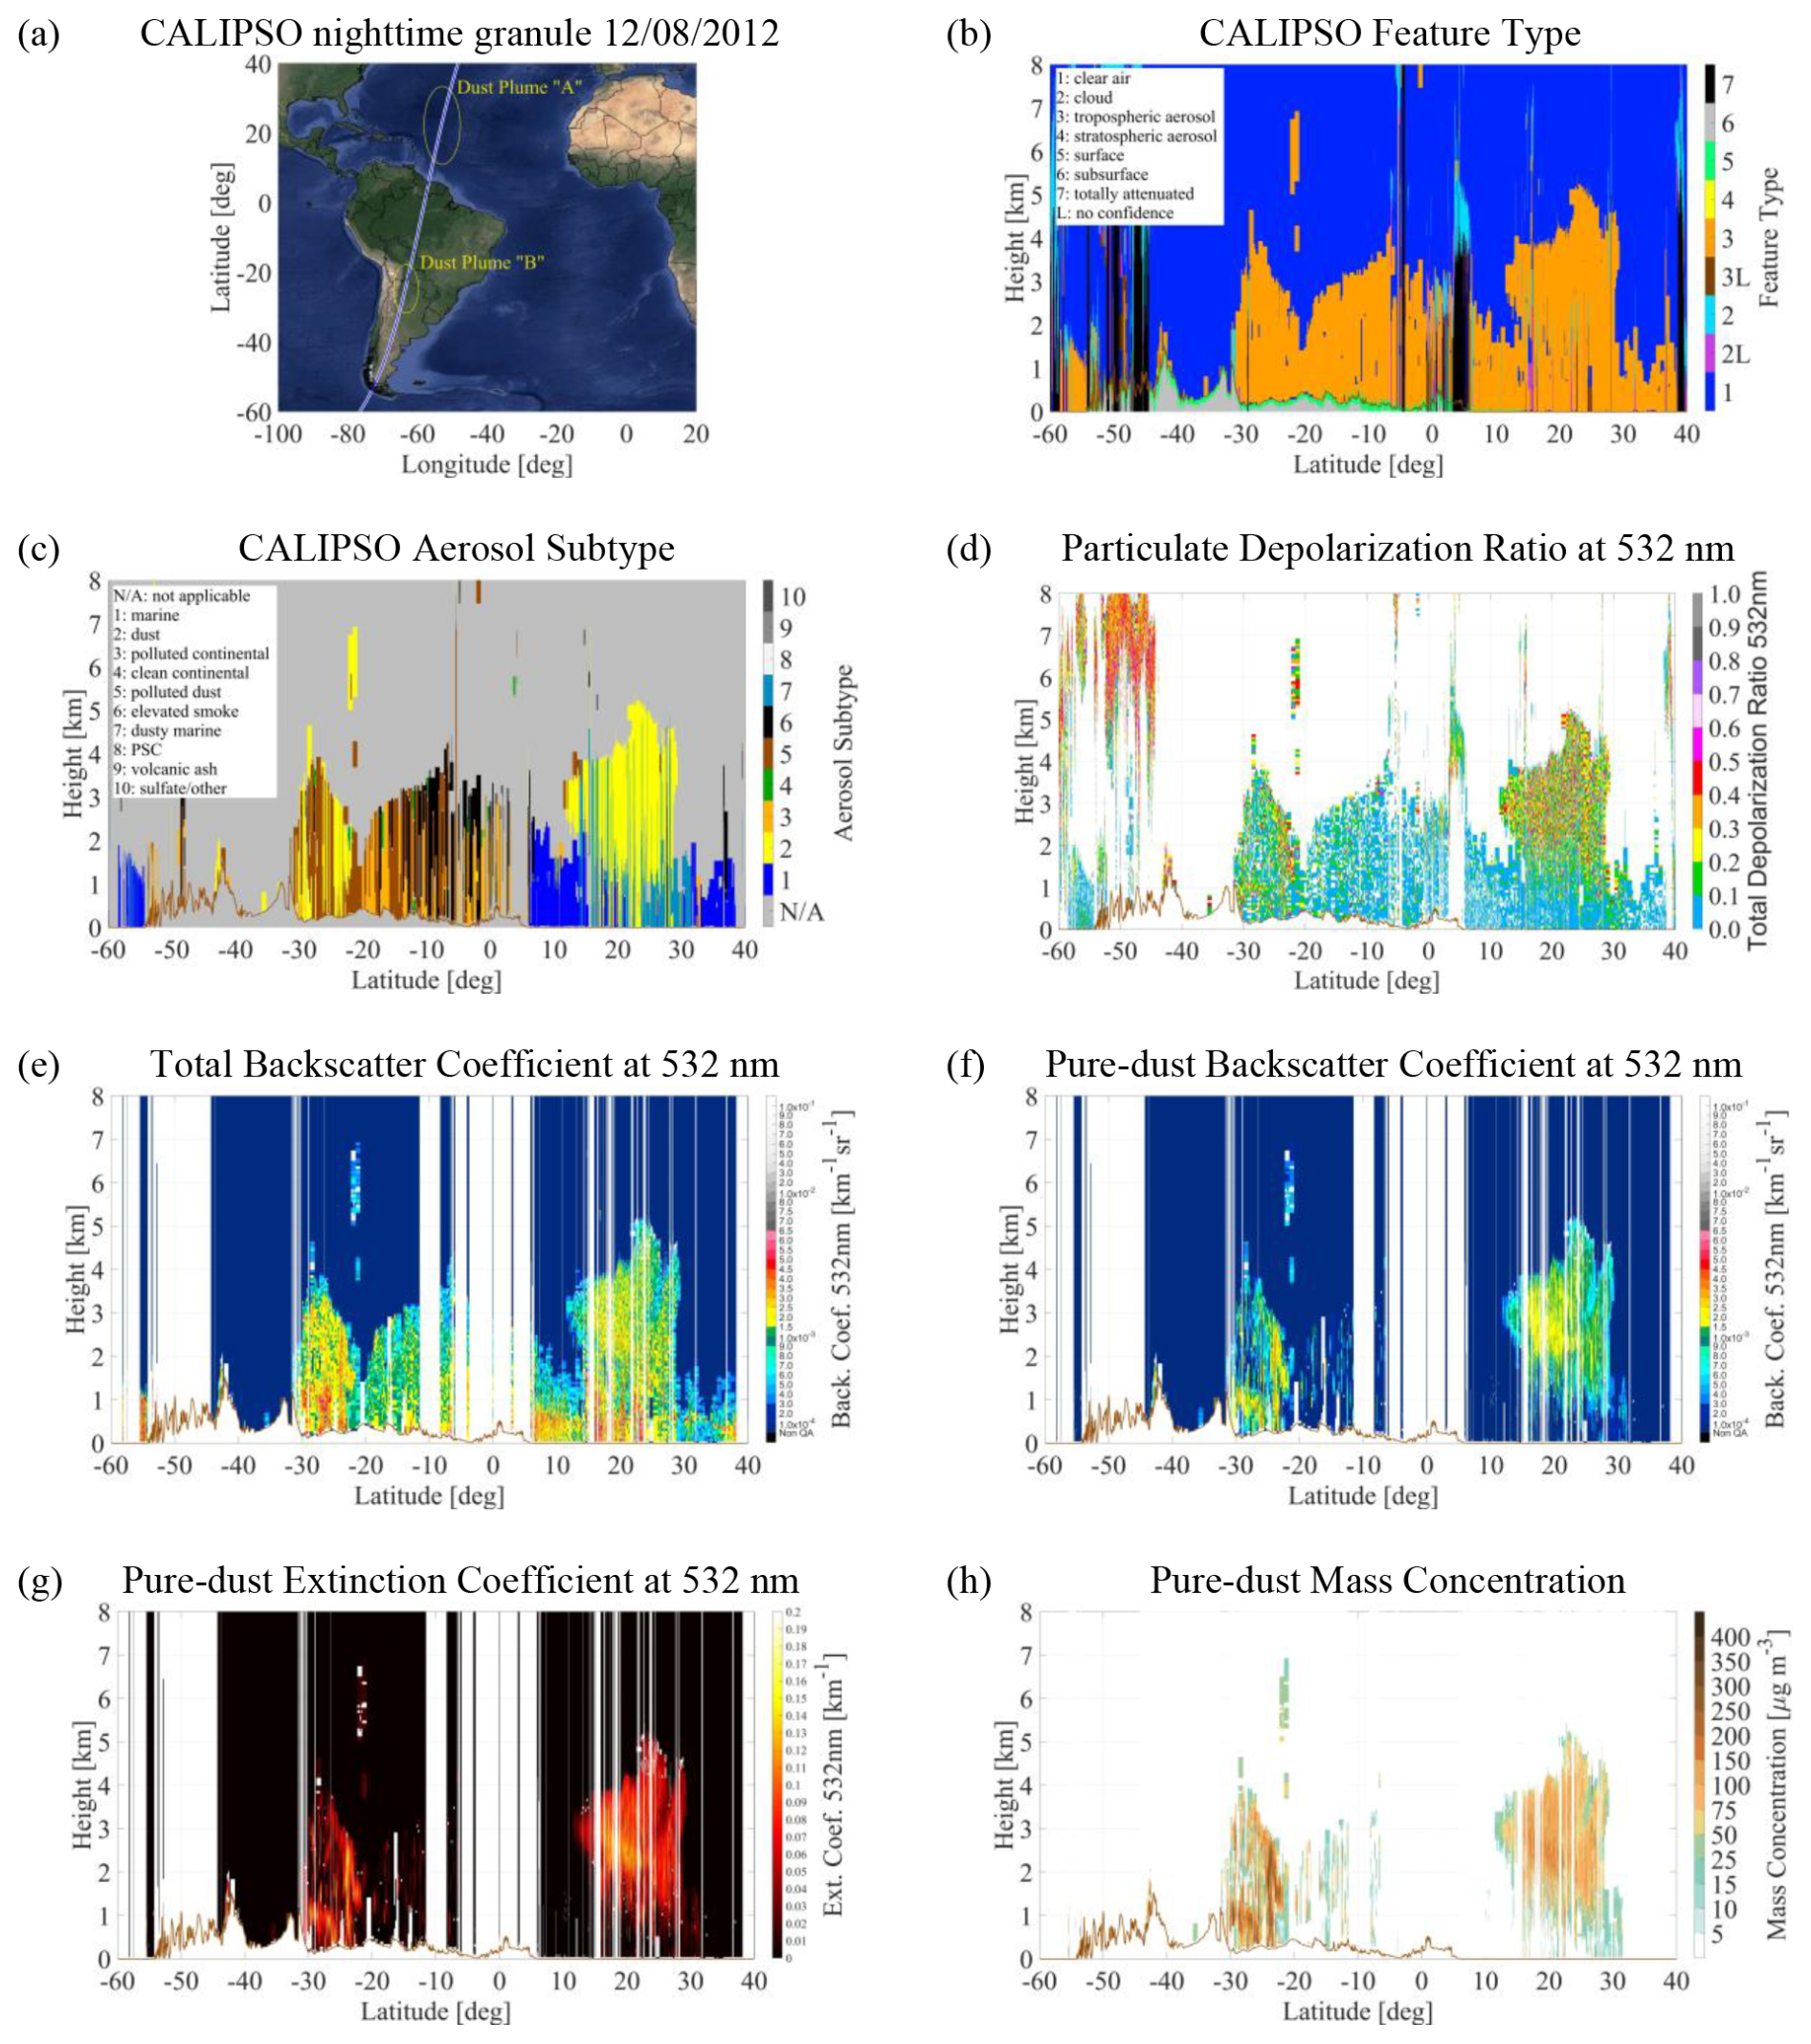
Figure 2CALIPSO nighttime granule on 12 August 2012 (a), feature type (b), aerosol subtype (c), particulate depolarization ratio at 532 nm (d), and total backscatter coefficient at 532 nm (e), implemented towards the extracting the pure-dust atmospheric component in terms of the backscatter coefficient at 532 nm (f), pure-dust extinction coefficient at 532 nm (g), and pure-dust mass concentration (h).
A crucial step towards proper implementation of the one-step POLIPHON technique to CALIPSO L2 optical products at 532 nm with the objective of decoupling the pure-dust and non-dust atmospheric components of the total aerosol load is the proper consideration of the δλ,d and δλ,nd parameters. With respect to δλ,d, an increasing number of studies report particulate depolarization ratio measurements of dust-dominant aerosol layers around 0.31 ± 0.04 at 532 nm (Sugimoto et al., 2003; Esselborn et al., 2009; Freudenthaler et al., 2009; Ansmann et al., 2011; Gross et al., 2011a; Wiegner et al., 2011; Mamouri et al., 2013; Baars et al., 2016; Hofer et al., 2017; Filioglou et al., 2020), corroborating on the assumption that the particulate depolarization ratio is a characteristic property of dust with little variability on a global scale. However, the assumption on δλ,nd requires consideration of the particulate depolarization ratio properties of the major non-dust tropospheric aerosol-subtype categories (i.e., marine, biomass burning smoke, pollen, and volcanic ash). The sea salt aerosol category is, in general, characterized by particulate depolarization ratio values on the order of 2 %–3 % at 532 nm, increasing however with decreasing relative humidity (RH) to values as high as 10 %–15 % at 532 nm in the marine boundary layer (MBL) – free troposphere entrainment zone (Haarig et al., 2017a). Generally, the smoke aerosol category is characterized also by low particulate depolarization ratio values, on the order of 1 %–4 % at 532 nm (Müller et al., 2007; Nicolae et al., 2013). Significantly higher particulate depolarization ratio values are reported for pollen and volcanic ash, on the order of 4 %–15 % and 30 %–40 % at 532 nm, respectively (Ansmann et al., 2010; Groß et al., 2012; Noh et al., 2013; Sicard et al., 2016; Shang et al., 2020; Bohlmann et al., 2021). However, pollen is usually confined within the planetary boundary layer (PBL), is characterized by high seasonality, and is observed in high concentrations at high latitudinal bands outside the domain of the study area, the dust belt, and the major dust transport pathways (Prospero et al., 2002). Volcanic ash emissions, despite the high intensity, are significantly less frequently observed than the dust, marine, smoke, and pollen aerosol categories. Thus, an average δnd effect of 0.05 ± 0.02 at 532 nm is assumed for the broader non-dust aerosol-subtype class in the assumed external aerosol mixtures (Marinou et al., 2017; Proestakis et al., 2024). Following the consideration of the δλ,d and δλ,nd central parameters, the one-step POLIPHON technique allows decoupling of the pure-dust and non-dust components of an assumed external aerosol mixture of particulate depolarization ratios lower than δλ,d and greater than δλ,nd, while cases of are considered dust-free and cases of are considered composed entirely of dust.
The one-step POLIPHON technique applied to CALIOP L2 optical products at 532 nm results in pure-dust backscatter coefficient profiles at 532 nm (βλ,d(z)) along the CALIPSO orbit path, at uniform horizontal and vertical resolutions of 5 km and 60 m, respectively. Because CALIOP is an elastic backscatter lidar system, to convert the profiles of the pure-dust backscatter coefficient at 532 nm (Fig. 2f) into profiles of the pure-dust extinction coefficient at 532 nm (Fig. 2g), suitable pure-dust extinction-to-backscatter ratio (lidar ratio; LR) values are required (Eq. 2).
The CALIPSO V4 algorithm assumes a universal LR of 44 sr at 532 nm for dust (Kim et al., 2018). However, recent studies report on the remarkable regional variability of dust LR at 532 nm (Floutsi et al., 2023). More specifically, the broader Atlantic Ocean is affected in the north mainly by intense loads of dust originating from the Sahara (Prospero, 1999; Kanitz et al., 2014; Marinou et al., 2017; Gkikas et al., 2022) and in the south by dust emissions from the desert areas located in South Africa (Bryant et al., 2007) and South America (Gassó and Torres, 2019). Thus, this study applies suitable geographically dependent dust LR at 532 nm values for the region of interest, towards the development of the atmospheric pure-dust product in terms of the extinction coefficient at 532 nm. More specifically, in the domain of the North Atlantic Ocean Saharan dust outflow region, a mean LR at 532 nm of 53.1 ± 8 sr is used (Tesche et al., 2009; Gross et al., 2011a; Gross et al., 2011b, Tesche et al., 2011; Kanitz et al., 2013; Kanitz et al., 2014; Groß et al., 2015; Weinzierl et al., 2016; Haarig et al., 2017b; Rittmeister et al., 2017; Bohlmann et al., 2018; Floutsi et al., 2023); in the domain of South America, a mean LR at 532 nm of 42 ± 17 sr is used (Kanitz et al., 2013); and the default CALIPSO V4 dust LR of 44 sr at 532 nm is used in the intermediate Atlantic Ocean region (Kim et al., 2018). As a next step, the regionally dependent extinction coefficient at 532 nm (Fig. 2g) to mass concentration conversion factors (Ansmann et al., 2019) and typical particle density of ρd: 2.6 g cm−3 for dust (Ansmann et al., 2012) are applied towards establishing the final pure-dust mass concentration product (Fig. 2h) along the CALIPSO orbit path (Eq. 3). The climatologically representative extinction coefficient-to-mass concentration conversion factors, discussed in detail by Mamouri and Ansmann (2014, 2015, 2016, 2017) and Ansmann et al. (2019), were determined on the basis of AERONET (Version 3; Level 2.0) long-term observations during atmospheric conditions characterized by dust presence (Ångström exponent < 0.3 and aerosol optical thickness (AOT) > 0.1), synergistically obtained with lidar-provided particle extinction coefficient profiles, allowing eventually provision of extinction-to-volume conversion factors Cv,d.
Accordingly, a uniform spatial grid of 2° latitude by 5° longitude is established for the Atlantic Ocean domain extending between 60° S and 40° N. Iteration through all pure-dust mass concentration profiles within each 2° × 5° deg2 grid is performed to establish for each grid seasonal-mean atmospheric profiles of quality-assured pure-dust mass concentration, grouped by seasons (December–January–February, DJF; March–April–May, MAM; June–July–August, JJA; and September–October–November, SON) and for the period December 2006–November 2022. The final dataset provides the atmospheric dust conditions. Figure 3 provides the long-term annual-mean total backscatter coefficient at 532 nm (Fig. 3a), pure-dust backscatter coefficient at 532 nm (Fig. 3b), pure-dust extinction coefficient at 532 nm (Fig. 3c), and pure-dust mass concentration (Fig. 3d), with the latter one subsequently implemented with spatial resolution 5° × 2° deg2 grids and a seasonal-mean temporal resolution, towards computation of the atmospheric pure-dust component deposited into the broader Atlantic Ocean. More specifically, the figure constitutes a three-dimensional reconstruction of the atmosphere in the geographical region confined between 100° W and 20° E longitude (x axis) and 60° S and 40° N latitude (y axis) and for the altitudinal range 0 to 8 km a.m.s.l (z axis). Through utilizing parallel slices in the atmosphere for every 20° longitude, each figure provides insight into the three-dimensional total and dust atmospheric aerosol components, in terms of the total backscatter coefficient at 532 nm (Fig. 3a), and for the dust component of the total aerosol load in terms of the backscatter coefficient at 532 nm (Fig. 3b), extinction coefficient at 532 nm (Fig. 3c), and mass concentration (Fig. 3d), over the broader region covering South America (lower-left corner of figures), part of North America (upper-left corner of figures), Central-Western Africa (right side of figures), and the broader Atlantic Ocean confined in-between. The state of the atmospheric aerosol load in Fig. 3 is provided in terms of annual mean EO-based products computed for the period December 2006–November 2022 to provide visualization of the long-term mean atmospheric dust transport pattern over the region of interest.
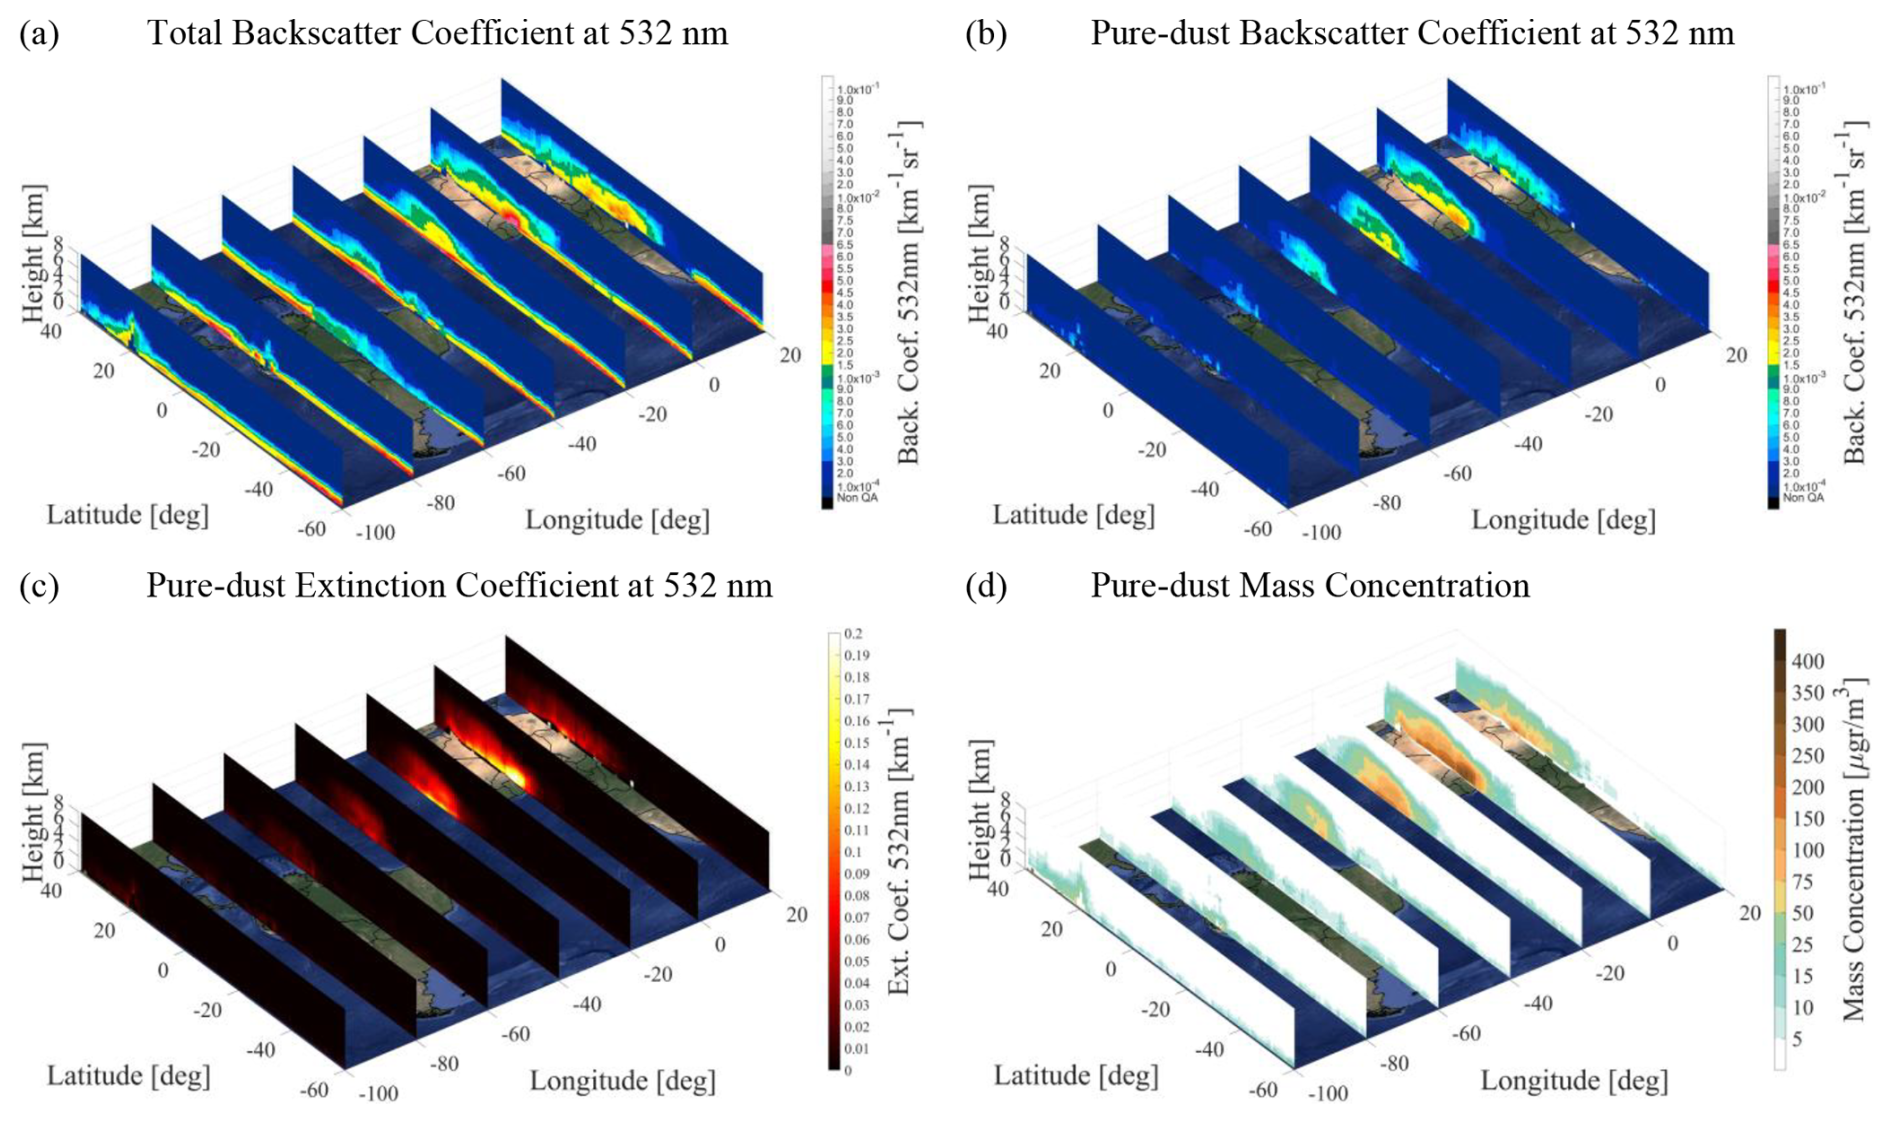
Figure 3Annual-mean three-dimensional (3D) reconstruction of the atmosphere in terms of the total backscatter coefficient at 532 nm (a), pure-dust backscatter coefficient at 532 nm (b), pure-dust extinction coefficient at 532 nm (c), and pure-dust mass concentration (d) based on the period December 2006–November 2022.
Uncertainties in the retrieval of atmospheric dust properties (i.e., backscatter coefficient, extinction coefficient, and mass concentration) originate from multiple sources, primarily (a) the uncertainties in the CALIPSO L2 optical products and aerosol classification flags, (b) the methodology applied towards atmospheric dust decoupling from the total aerosol load, and (c) the assumed constants and conversion factors (i.e., LRs and extinction-to-mass conversion parameters) (Marinou et al., 2017; Proestakis et al., 2018, 2024). CALIPSO L2 retrieval uncertainties, particularly in the backscatter coefficient and particulate depolarization ratio at 532 nm, are assumed to be random and uncorrelated (Vaughan et al., 2009; Winker et al., 2009) yet can be significant; particulate depolarization ratio uncertainties often exceed 100 %, and the limitations in aerosol subtype classification introduce further biases, especially for mixed or tenuous layers. The aerosol subtype classification algorithm (Omar et al., 2009; Kim et al., 2018) may result in positive or negative biases depending on feature type misclassification, with particularly low accuracy (∼ 35 %) in identifying polluted dust layers (Burton et al., 2013). Moreover, CALIOP's limited sensitivity to optically thin layers (Kacenelenbogen et al., 2011; Rogers et al., 2014) leads to systematic underestimation of AOD, with negative biases of ∼ 0.02 (nighttime) and < 0.1 (daytime), primarily due to its detection sensitivity (Toth et al., 2018). The application of dust decoupling methodologies (Shimizu et al., 2004; Tesche et al., 2009, 2011; Ansmann et al., 2019) introduces additional uncertainties, with the depolarization-based separation approach contributing 5 %–10 % uncertainty during strong dust events and up to 20 %–30 % in less pronounced cases, primarily linked to variability in assumed dust depolarization ratios (Tesche et al., 2009, 2011; Ansmann et al., 2012; Mamouri et al., 2013). The conversion of decoupled backscatter profiles to extinction coefficients using regional LRs introduces relative uncertainties on the order of 15 %–25 %, while the final conversion to dust mass concentration profiles introduces further uncertainties of approximately 10 %–15 % (Tesche et al., 2009; Amiridis et al., 2013; Marinou et al., 2017; Proestakis et al., 2024). Cumulatively, uncertainties propagate and increase with each processing step, resulting in total uncertainties that can reach 10 %–30 % in the backscatter coefficient, 15 %–50 % in the extinction coefficient, and 20 %–60 % in the mass concentration for ground-based lidar observations (Mamouri and Ansmann, 2017; Ansmann et al., 2019). However, in the case of CALIPSO-based retrievals, where the dominant uncertainty sources are the backscatter and depolarization ratio inputs, frequently of the same order of magnitude or even higher than the optical products, total uncertainties in mass concentration retrievals can escalate to as high as 100 %–150 %, underscoring the challenge of achieving high precision in satellite-based dust mass estimates (Marinou et al., 2017; Proestakis et al., 2018, 2024).
2.2.2 Extracting the atmospheric pure-dust component deposited into the Atlantic Ocean
The present section aims to capitalize on the established four-dimensional reconstruction of the pure-dust atmospheric component in terms of mass concentration profiles, based on ERA5 zonal (U) and meridional (V) wind components, to extract a multiyear satellite-based estimation of the atmospheric pure-dust component deposited into the broader Atlantic Ocean, following the approach suggested by Yu et al. (2019). The estimation of pure-dust deposition fluxes is realized through several successive discrete steps, as visualized in Fig. 4 for the indicative grid case extending between 20 and 22° latitude and −30 and −25° longitude of JJA 2020.
The first step accounts for the different vertical resolutions of the established LIVAS atmospheric pure-dust aerosol product and ERA5 horizontal wind components. More specifically, the pure-dust mass concentration atmospheric product follows the original high vertical resolution of CALIPSO of 60 and 180 m for the altitude range of −0.5–20.2 and 20.2–30 km a.m.s.l., respectively (Sect. 2.1.1), while the ERA5 U and V wind components are provided in 37 pressure levels between 1000 and 1 hPa, converted to height above mean sea level (Sect. 2.1.2). Thus, the first step performs a reconstruction of the LIVAS pure-dust mass concentration product, from the higher vertical resolution of CALIPSO (Fig. 4a) to the lower vertical resolution of ERA5 (Fig. 4c). The zonal and meridional atmospheric dust transport and the seasonal transition of atmospheric transport pathways highly depend on the meteorological conditions (Prospero et al., 1987), including, among others, the wind patterns (Fig. 4b). Thus, the second step accounts for decoupling the pure-dust mass concentration atmospheric product into the zonal (eastward and westward) and meridional (northward and southward) transported components on the basis of the (1) magnitude and (2) direction of the ERA5 U and V horizontal wind components (Fig. 4c). The third step, on the basis of (1) the zonal and meridional atmospheric transport components of pure dust and (2) the U and V wind vector profiles from ERA5 (Fig. 4c), provides the fluxes of pure dust both in the zonal and meridional directions (Fig. 4d). More specifically, the mass flux (µg m−2 s−1) is computed as the amount of mass transported per unit time (s) across a unit area (m2) that is perpendicular to the direction of mass transport, thus in the conceptual approach adopted in the framework of the study in meridional and zonal directions, through the implementation of ERA5 U and V wind fields, respectively. The mass fluxes are computed on a seasonal basis, meaning based on seasonal-mean atmospheric dust profiles (Fig. 4a) and seasonal-mean profiles of the ERA5 zonal and meridional wind components (Fig. 4c).
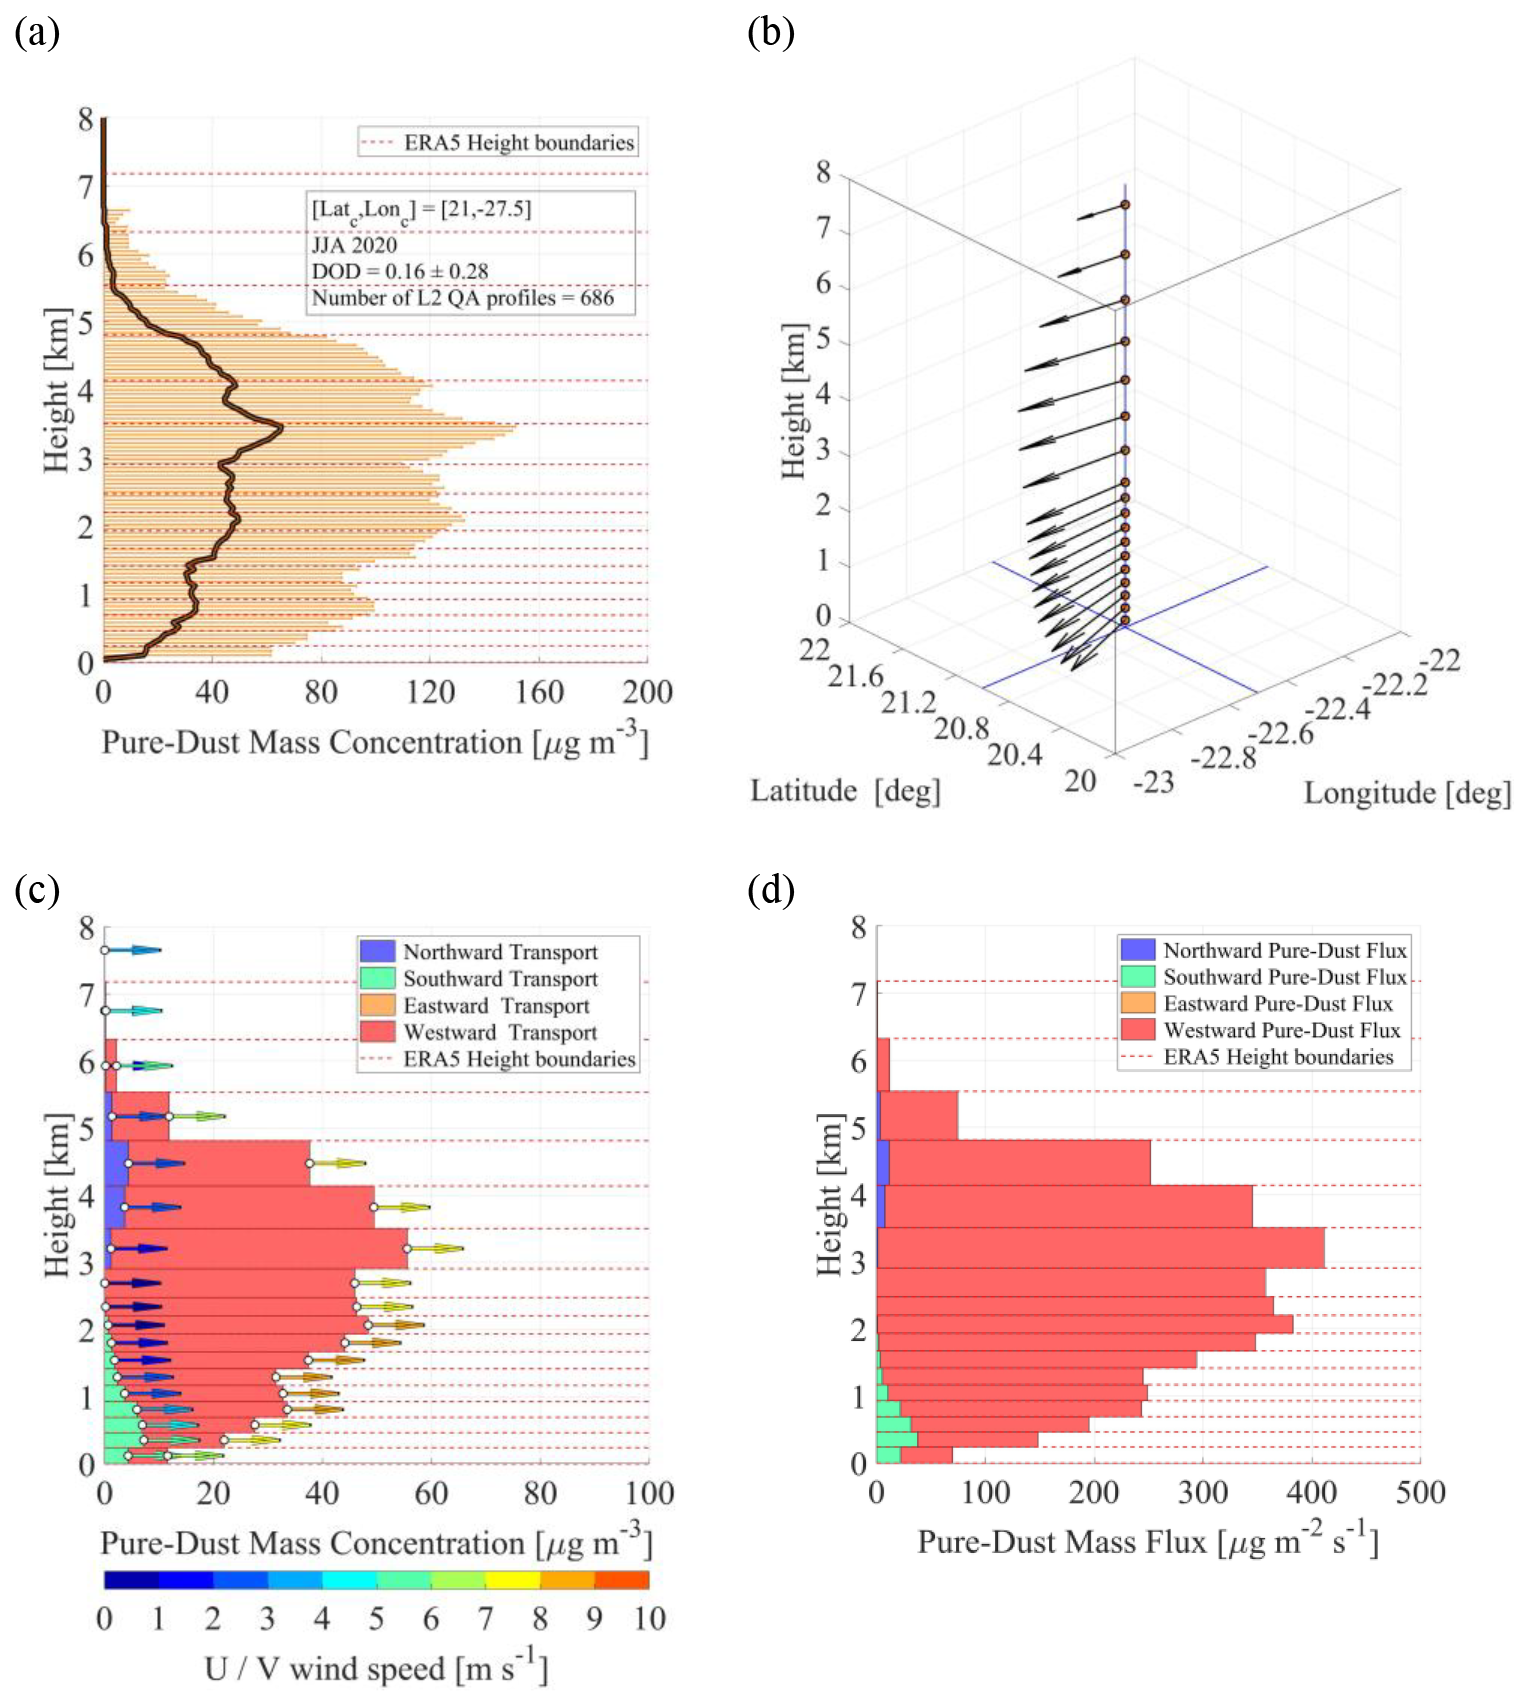
Figure 4Illustrative case of the followed methodology towards the estimation of pure-dust mass fluxes in the zonal and meridional directions for the Atlantic Ocean area extending between 20 and 22° latitude and −30 and −25° longitude for JJA 2020. From top left to bottom right: the ESA-LIVAS mass-concentration pure-dust aerosol product (a), the ERA5 U and V profiles of wind (b), the profile of pure-dust mass concentration decoupled into zonal and meridional atmospheric transport components (c), and the pure-dust mass fluxes in the zonal and meridional directions (d). In (c), the horizontal arrows indicate the wind speed, according to the color bar, and the different colors in the legend indicate the dust transport direction.
As a next step, a three-dimensional (3D) closed cuboid surface is assumed, of 5° length (zonal), 2° width (meridional), and 10 km height (vertical), with the base surface at 0 km a.m.s.l. The approach to extract the atmospheric dust component deposited into the Atlantic Ocean is based on the condition that the net input-output mass flux through a Gaussian surface, without dust sources or sinks present in the enclosed volume, should equal 0. Towards this condition, we assume no output or input dust fluxes from the top surface area of the cuboid and in general – climatologically – no presence of atmospheric dust at heights beyond 10 km a.m.s.l. (Marinou et al., 2017), a hypothesis supported by the CALIPSO-based climatology over the region of interest (not shown). Moreover, we assume no dust sources over the Atlantic Ocean domain and thus no dust input flux from the surface area of the cuboid. To support this assumption, the Clouds and Earth's Radiant Energy System (CERES) International Geosphere–Biosphere Programme (IGBP) comprehensive map land classification is implemented (Schneider et al., 2013), and, more specifically, we consider as Atlantic Ocean grids only surface areas within the domain of interest classified as at least 25 % covered by “Water Bodies” and no more than 10 % classified as “Closed Shrublands”, “Open Shrublands”, or “Bare Soil and Rocks”. Accordingly, the input and output pure-dust mass flow rates from-and-towards all neighboring three-dimensional cuboids through all neighboring zonal and meridional surfaces are calculated. The total mass flow rates (µg s−1) across the meridional and zonal directions are computed, through the consideration of the mass fluxes and the total surface areas of the conceptual cuboid that atmospheric dust is transported through. Following the conservation of mass and the aforementioned assumptions, the dust flow rate and accordingly the dust flux through the base of the conceptual cuboid column, corresponding to the deposited dust, is derived by subtracting all output components from all input components. The conceptual approach towards estimating the atmospheric deposited dust component is illustrated in Fig. 5 for the Atlantic Ocean area extending between 20 and 22° latitude and −30 and −25° longitude for JJA 2020, yielding a dust deposition rate in this case of 192.8 mg m−2 d−1.
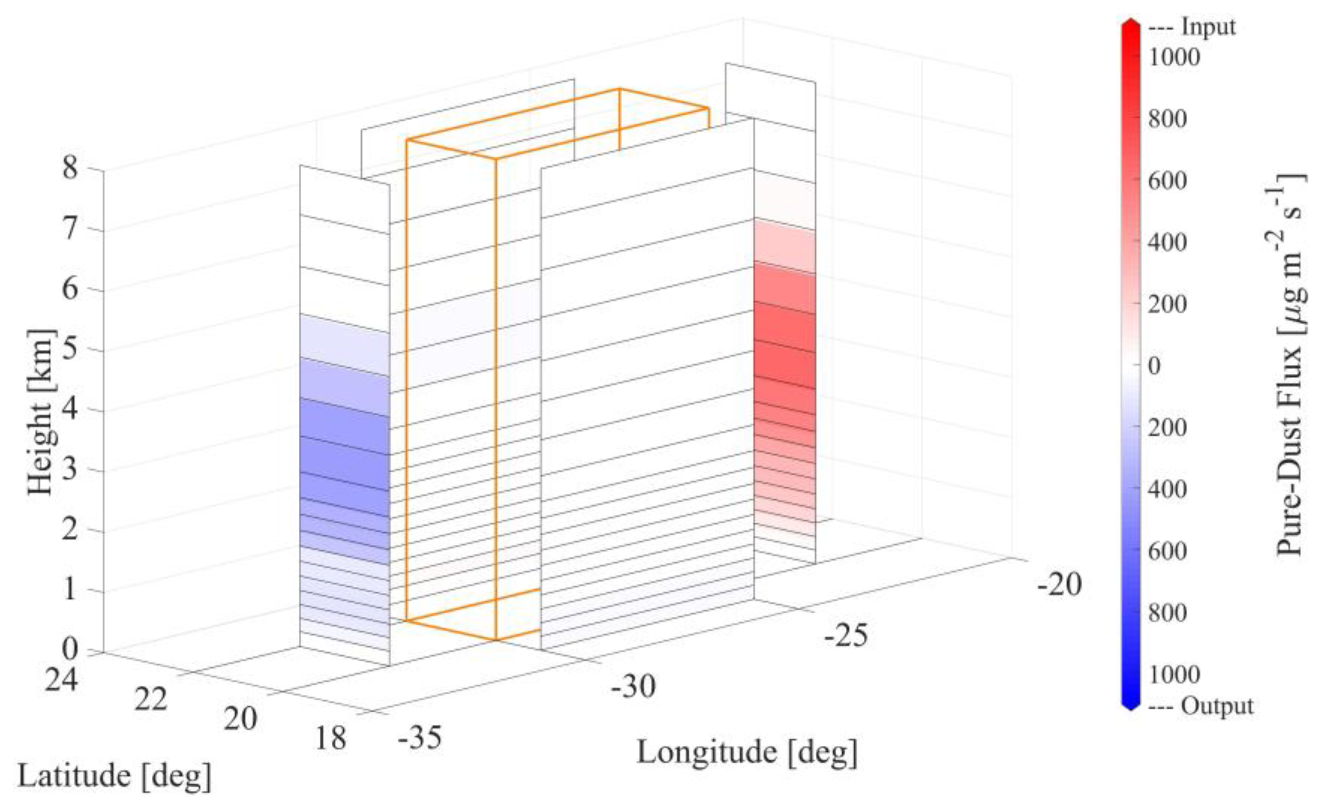
Figure 5Illustration of the conceptual approach applied towards extracting the pure-dust atmospheric component deposited in the Atlantic Ocean for the area extending between 20 and 22° latitude and −30 and −25° longitude for JJA 2020.
The method provides the amount of dust deposited into the ocean based on the estimation of the pure-dust aerosol atmospheric component; however, it recurrently may result in non-physical, either negative or extremely high, values of the dust deposition rate. More specifically, the atmospheric dust component deposited into the Atlantic Ocean (Fig. 5) is determined by differentiation of the zonal and meridional seasonal-mean profiles of pure-dust mass flow rates from the ESA-LIVAS pure-dust climate data record (Fig. 4), and thus the applied method is sensitive to CALIPSO orbital characteristics and CALIOP inherited limitations. Factors that may contaminate the four-dimensional atmospheric dust product and subsequently result in non-physical retrievals of the dust deposition rate along the dust transport pathways include (1) clouds misclassified as aerosols in terms of feature type classification and dust layers misclassified as non-dust layers and vice versa in terms of aerosol subtype classification, (2) weighting effects resulting from complete attenuation of the CALIOP lidar signal due to the presence of optically opaque atmospheric layers and underestimations due to the presence of tenuous and defuse atmospheric layers of signal-to-noise ratios (SNRs) below the minimum detection threshold of CALIOP, and (3) high variability in the sampling frequency of quality-assurance L2 profiles due to the CALIPSO revisit frequency over specific grid areas and cloud-coverage variability. To account for negative values of the dust deposition rate, indicating that the ocean surface would act as an emission source of dust, values lower than 0 are masked as not physical. In addition, to account for unrealistic values of the dust deposition rate over areas residing outside the documented atmospheric dust transport pathways (Prospero, 1999; Prospero et al., 2002; Kanitz et al., 2014; Marinou et al., 2017; Gassó and Torres, 2019; Gkikas et al., 2022), grids with virtually no presence of dust on a seasonal-mean temporal resolution (DOD at 532 nm ≤ 0.01) are considered most probably contaminated by clouds misclassified as aerosols in terms of feature-type classification and/or by non-dust layers misclassified as dust layers in terms of aerosol-subtype classification (Burton et al., 2013; Haarig et al., 2017a) and thus not contributing to dust deposited into the ocean. Finally, in order to reduce noise in the final grid, a 3×3 uniform filter is applied, which applies a moving window over the data replacing dust deposition rate values with the mean of the dust deposition rate values inside the moving window.
3.1 Atmospheric dust and dust deposition
The present section aims to capitalize on the performed developments resulting in decoupling the atmospheric pure-dust component from the total aerosol load (Sect. 2.2.1.) and extracting the atmospheric pure-dust component deposited into the Atlantic Ocean (Sect. 2.2.2.) to provide (i) a comprehensive reconstruction of the atmospheric dust aerosol component and (ii) quantification of the atmospheric dust aerosol component deposited into the Atlantic Ocean. The products are generated over the broader Atlantic Ocean, encompassing the dust emission sources of West Africa and South America, the Atlantic Ocean, the Caribbean Sea, and the Gulf of Mexico, confined between latitudes 40° N and 60° S and with a 5° (zonal) × 2° (meridional) spatial resolution, a seasonal-mean temporal resolution, and temporal coverage between December 2006 and November 2022. Figure 6 provides the annual- and seasonal-mean horizontal distributions of the pure-dust atmospheric aerosol component (Fig. 6 – left column) and the corresponding pure-dust component deposited into the ocean along the trans-Atlantic transport (Fig. 6 – right column).
The pure-dust atmospheric aerosol load is shown in terms of DOD at 532 nm (Fig. 6 – left column), computed through vertical integration of the L2 annual-mean and seasonal-mean quality-assured pure-dust extinction coefficient profiles at 532 nm within each grid of spatial resolution 2° × 5°, providing the columnar pure-dust atmospheric load under cloud-free sky conditions. The standard deviation of the annual mean and seasonal mean of the EO-based products is also computed, both for atmospheric dust and dust deposition, providing a metric of the spread of dispersion and variability within each grid of spatial resolution 2° × 5°. It should be noted that the variability within each grid is usually large, driven by the large variability of the episodic nature of dust events, highly heterogeneous in both space and time, the large variability in the strength of the emission, atmospheric transport, the removal processes, and the variability of meteorological conditions (Prospero et al., 1987).
Overall, the horizontal distributions of DOD at 532 nm reveal similar patterns, although the magnitude of atmospheric dust load is characterized by high interannual, spatial, and temporal variability, over both land and ocean. Over land, arid regions of little vegetation and of easily erodible soils contributing to the dust life circle and encompassing the broader Atlantic Ocean include the western Sahara in North Africa (Prospero et al., 2002; Huneeus et al., 2011; Marinou et al., 2017, Gkikas et al., 2022), the Etosha Pan (Namibia), Makgadikgadi Pan (Botswana), Kalahari Desert (Namibia, Botswana, and South Africa), and Namib Desert (Angola and Namibia) in South Africa (Bryant et al., 2007; Vickery et al., 2013; Gkikas et al., 2022), and the Patagonia Desert (Rio Negro and Chubut provinces) in South America (Gassó and Torres, 2019; Gkikas et al., 2022).
Over the western Sahara, persistent intense loads of dust aerosol are observed throughout the year, dust emissions that are considered of both anthropogenic and natural origin (Ginoux et al., 2012). Dust emission mechanisms of anthropogenic origin include processing of soils through agricultural activities, such as cultivation and overgrazing (Ginoux et al., 2012). Natural dust emission microscale to synoptic-scale mobilization mechanisms, favored by the development of the Saharan heat low (SHL; Schepanski et al., 2017), include pressure gradients (Tyson et al., 1996; Klose et al., 2010), dust devils (Koch and Renno, 2005), “haboobs” (Knippertz et al., 2007; Ansmann et al., 2009b; 2011), and low-level jets (LLJ; Fiedler et al., 2013). Though inhomogeneous in time and space and of variable strength (Knippertz et al., 2009, 2011), the emission mechanisms over the western Sahara trigger uplift and accumulation in the atmosphere of several million tonnes of mineral dust each year (Kok et al., 2023). In terms of DOD at 532 nm, on a seasonal-mean basis, and following the annual cycle of dust source activation (Washington et al., 2009), less pronounced dust activity is apparent during DJF (0.159 ± 0.119; Fig. 6c) and higher dust activity during JJA (0.341 ± 0.182; Fig. 6g), with intermediate observed DOD values during SON (0.174 ± 0.066; Fig. 6i) and MAM (0.325 ± 0.133; Fig. 6e).
In South Africa, the observed dust activity over the arid areas is characterized by high spatial and temporal variability, however of lower dust emission strength compared to North Africa arid areas. Activation of the dust sources of the Etosha and Makgadikgadi pans is mostly related to the lakes' inundation, resulting in high seasonal variability in dust emission strength (Gkikas et al., 2022), while over the Namib Desert and along the broader Namibian coastline, dust emission activity is mainly related to frequent berg winds (katabatic winds) blowing from inland plateaus and towards the Atlantic Ocean, resulting in low intra-annual variability in dust emission strength throughout the year (Eckardt and Kuring, 2005). Dust activity over the dust source regions of this area is more pronounced primarily during SON (DOD at 532 nm of 0.011 ± 0.007; Fig. 6i) and secondarily during JJA (DOD at 532 nm of 0.008 ± 0.003; Fig. 6g) and DJF (DOD at 532 nm of 0.008 ± 0.004; Fig. 6c), and there is significantly lower dust activity during MAM (DOD at 532 nm of 0.005 ± 0.002; Fig. 6e). The observed annual-mean DOD at 532 nm is computed at 0.008 ± 0.019 (Fig. 6a).
In South America and the Patagonian Desert, higher strength in dust emissions is observed over the broader arid area extending between the river basins of the Rio Negro and Chubut provinces and the southern end of the desert (McConnell, et al., 2007; Mazzonia and Vazquez, 2009). Over this area, annual-mean DODs of 0.014 ± 0.024 (Fig. 6a) are observed. With respect to seasonal dust activity, higher DOD values are recorded during SON (0.017 ± 0.008; Fig. 6i) and DJF (0.014 ± 0.004; Fig. 6c) and lower during JJA (0.013 ± 0.008; Fig. 6g) and MAM (0.009 ± 0.003; Fig. 6e).
The export of dust layers entrained into the atmosphere and transport across the broader Atlantic Ocean are largely controlled by the prevailing wind systems and the regional meteorology, shaping the major dust transport pathways (Adams et al., 2012; Ben-Ami et al., 2012; Amiridis et al., 2013; Marinou et al., 2017; Yu et al., 2015b; Proestakis et al., 2024). In the Northern Hemisphere, the westward atmospheric transport of Saharan dust layers is largely modulated by the seasonal latitudinal migration of the intertropical convergence zone (ITCZ; Schneider et al., 2014). More specifically, during boreal summer (JJA), the enhanced cyclonic circulation of the Saharan heat low (SHL; Schepanski et al., 2017), positioned between the Hoggar Massif and Atlas Mountains (Lavaysse et al., 2009), increases the strength of the northeasterly Harmattan winds to the west (Lavaysse et al., 2009; Parker et al., 2005a) and of the southwesterly African monsoon flow to the east (Parker et al., 2005b), and vice versa (Schepanski et al., 2017). The increased pressure gradients of the SHL affect the position of the African easterly jet (AEJ; Knippertz and Todd, 2012) and the development of the African easterly waves (AEWs; Jones et al., 2003), modulating the large-scale circulation systems over North Africa and determining the ITCZ position along the 10–20° N route (Fig. 6g), and also enhance dust emission and export towards and over the Atlantic Ocean (Schepanski et al., 2009; Doherty et al., 2014). Exported within the Saharan air layer (SAL; Carlson and Prospero, 1972; Prospero and Carlson, 1981; Braun, 2010; Dunion, 2011; Adams et al., 2012; Schepanski et al., 2009; Weinzierl et al., 2016; Rittmeister et al., 2017), the major transport highway for dust layers across the northern Atlantic Ocean, dust plumes during boreal summer are frequently transported as far as the Caribbean Basin and the coast of North America (Prospero, 1999; Prospero et al., 2014; van der Does et al., 2018a). In the winter season (DJF), the decreasing depth and extent of the SHL and the migration of the center of the cyclonic system southwest of the Hoggar Massif (Schepanski et al., 2017) result in generally lower levels of DOD (Fig. 6c). During the winter season, the strong Harmattan winds export plumes of dust southwestward over the Gulf of Guinea (Engelstaedter et al., 2006), mainly within the marine boundary layer and the lower troposphere (0–3 km a.m.s.l.) (Adams et al., 2012; Stuut et al., 2005; Tsamalis et al., 2013), where the dust plumes are transported westwards, mainly between the Equator and 10° N, reaching as far as the Amazon Basin in South America (Huang et al., 2010; Prospero et al., 2014; Yu et al., 2015a). During the intermediate seasons of spring (MAM) and autumn (SON), following the seasonal northward and southward migration of the ITCZ, respectively, dust plumes of intermediate depth and intensity between winter and summer are transported along the 5–15° N latitudinal band across the North Atlantic Ocean (Fig. 6e/i).
In the Southern Hemisphere and in the case of dust plumes originating from the arid areas of South Africa (Eckardt and Kuring, 2005; Bryant et al., 2007; Ginoux et al., 2012; Vickery et al., 2013; Gkikas et al., 2022), barotropic easterly waves forming between continental high-pressure systems and the South Atlantic anticyclonic systems (Tyson et al., 1996) result in westward export and transport of short-range and short-lived dust layers (Vickery et al., 2013) across the southern Atlantic Ocean (Gkikas et al., 2022), mainly below 600 hPa and primarily in the latitudinal zone extending between 20 and 10° S. In contrast, the relatively weak dust plumes (Fig. 6a) (Foth et al., 2019) originating from the arid areas of South America (McConnell et al., 2007; Mazzonia and Vazquez, 2009; Ginoux et al., 2012), under favorable meteorological conditions related to strong easterly winds (Gassó et al., 2010; Gassó and Torres, 2019), are frequently advected over the South Atlantic Ocean, primarily in the latitudinal zone extending between 50 and 20° S, where, subject to long-range eolian transport, the dust layers may reach as far as 20° W (Fig. 6b). Finally, it should be noted that the presence of low DOD values over the area extending below South Africa and to the east of 5° W (Fig. 6a) most probably results from the extended cloud coverage over the region (Gassó and Torres, 2019) and the presence of cubic-like sea salt emissions in the marine boundary layer – free troposphere entrainment zone (Haarig et al., 2017a), classified as dust mixtures due to the increased depolarizing properties in the CALIPSO aerosol-subtype classification scheme (Kim et al., 2018), possible resulting in contaminating effects of the atmospheric dust dataset in this case.
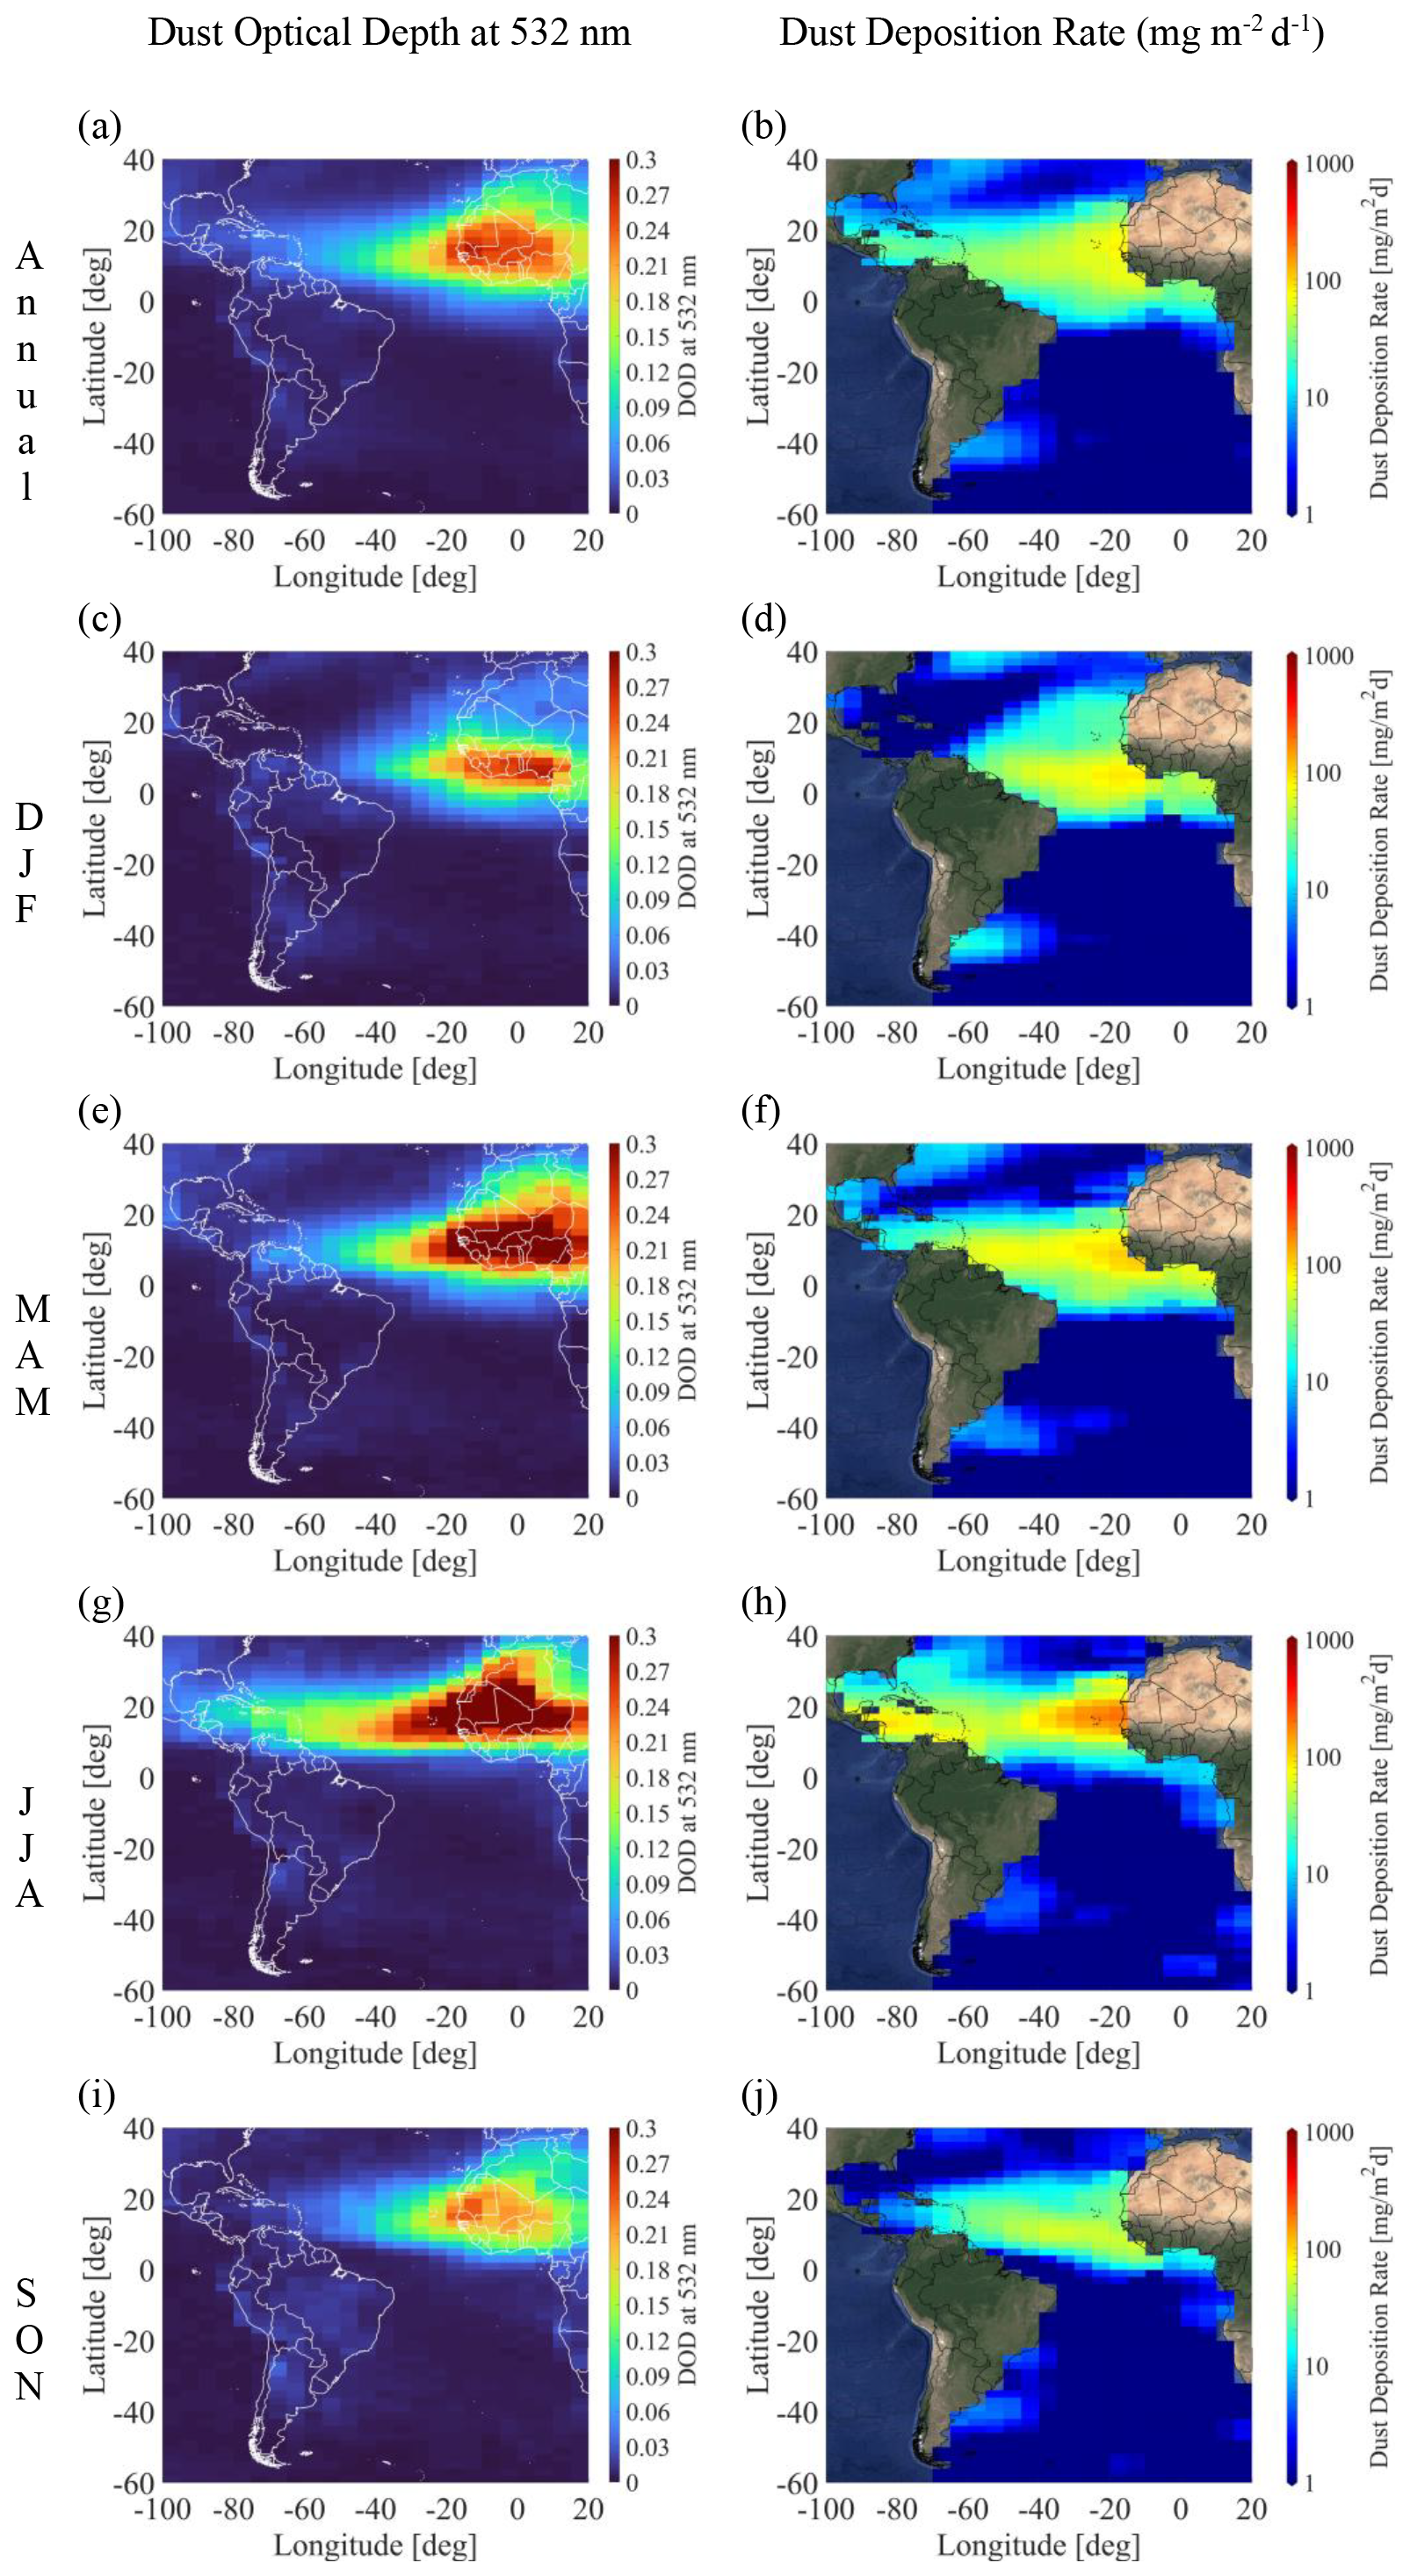
Figure 6LIVAS dust optical depth at 532 nm (DOD; left column) and dust deposition rate (DDR; right column), provided in annual mean (a, b), DJF (c, d), MAM (e, f), JJA (g, h), and SON (i, j), estimated for the period December 2006–November 2022.
The annual and seasonal variations of the dust deposition rate (DDR; unit: mg m−2 d−1) into the broader Atlantic Ocean, as derived by differentiation of the zonal and meridional pure-dust input/output mass flow rates of the atmospheric pure-dust aerosol component and on the basis of the mass conservation hypothesis (Sect. 2.2.2), are provided in Fig. 6 – right column. In general, as expected, there is a strong seasonality in dust deposition, with higher estimates of the dust deposition rate revealed mainly during the hot seasons of the year and in the proximity of the major arid areas encompassing the broader Atlantic Ocean domain, decreasing with increasing distance from the dust emission sources, subject to both dry and wet deposition (Schepanski et al., 2009; Adler et al., 2018; van der Does et al., 2020). More specifically, the observed spatial and temporal patterns of DDR (Fig. 6 – right column) follow the seasonal shifts of the major trans-Atlantic dust transport pathways, both in terms of extent and intensity, as shown and discussed in terms of DOD at 532 nm (Fig. 6 – left column). It should be emphasized though that DDR and DOD spatiotemporal patterns are not directly compatible, as DDR depends not only on the three-dimensional structure of atmospheric dust and the horizontal components of the wind profiles but, more importantly, on the zonal and meridional divergence of the dust mass fluxes. Hence, higher DDR values are apparent over areas not necessarily characterized by higher DOD values but over areas where the meridional and zonal gradients towards downwind adjusted areas are larger.
In the Northern Hemisphere (Table 3; Fig. 7), dust deposition is largely modulated by the seasonal migration of the ITCZ (Schneider et al., 2014). In the winter and spring seasons, when the Sahara Harmattan northeasterly trade winds are stronger (Lavaysse et al., 2009; Parker et al., 2005a) and the trans-Atlantic dust transport route follows the latitudinal migration of ITCZ to the south of 10 and 15° N, respectively (Fig. 6c/e), considerable amounts of dust are transported towards and over the Gulf of Guinea (lon: 10° W–15° E/lat: 6° S–6° N). In this case, removal of dust particles from the atmosphere is largely controlled by intense rainfall (Schepanski et al., 2009), resulting, mainly through wet deposition, in estimated DDR values as high as 37.24 ± 8.36 mg m−2 d−1 (Fig. 6d) and 46.49 ± 15.49 mg m−2 d−1 (Fig. 6f) for DJF and MAM, respectively. In the summer and autumn seasons, the intersection of the weakened Saharan northeasterly and of the amplified southern Africa southeasterly export pathways over the Gulf of Guinea results in estimated DDR values as high as 8.09 ± 2.59 mg m−2 d−1 (Fig. 6h) and 8.77 ± 5.61 mg m−2 d−1 (Fig. 6j), respectively. To the north of the Gulf of Guinea, in the proximity of the western coast of North Africa – the Sahara, the high presence of dust is apparent throughout the year, which results in significant amounts of dust deposited into the domain of the northeast Atlantic Ocean (lon: 30–10° W/lat: 10° S–40° N). The fluxes of dust deposition show a maximum of 37.94 ± 55.99 mg m−2 d−1 in summer (Fig. 6h) and a minimum of 17.42 ± 17.91 mg m−2 d−1 in autumn (Fig. 6j), while during spring (Fig. 6f) and winter (Fig. 6d), intermediate values of 34.01 ± 34.05 and 31.96 ± 27.03 mg m−2 d−1, respectively, are observed. Moving further west, in the middle of the tropical Atlantic Ocean (lon: 60–30° W/lat: 10° S–40° N), relatively high values of DDR also appear, subject to long-range atmospheric transport of dust (Weinzierl et al., 2016; van der Does et al., 2018a; Drakaki et al., 2022) mainly within the SAL (Carlson and Prospero 1972; Prospero and Carlson, 1981; Braun 2010; Dunion 2011; Adams et al., 2012; Schepanski et al., 2009). More specifically, estimated dust deposition fluxes over the North-Middle Atlantic Ocean area equal 19.46 ± 18.41 mg m−2 d−1 in winter (Fig. 6d), 23.16 ± 24.97 mg m−2 d−1 in spring (Fig. 6f), 24.04 ± 29.31 mg m−2 d−1 in summer (Fig. 6h), and 14.29 ± 16.31 mg m−2 d−1 in autumn (Fig. 6j). With respect to the Northwest Atlantic Ocean area (lon: 100–60° W/lat: 10–40° N), during summer, relatively high dust deposition fluxes are observed mainly in the Caribbean Sea – southern United States – Gulf of Mexico area, with DDR values as high as 31.67 ± 23.85 mg m−2 d−1 (Fig. 6h). However, following the seasonal northward and southward migration of the ITCZ and the weaker export of Saharan dust into the SAL (Schepanski et al., 2017) during spring and autumn, significantly lower values of DDR are observed, equalling 8.77 ± 7.88 mg m−2 d−1 (Fig. 6f) and 4.74 ± 5.74 mg m−2 d−1 (Fig. 6j), respectively, reaching a minimum of 1.31 ± 2.19 mg m−2 d−1 in winter (Fig. 6d). However, despite the relatively low amounts of dust reaching the east coast of South America or even beyond over the mainland (Huang et al., 2010; Prospero et al., 2014; Yu et al., 2015a), several studies report on the vital role of the dust-related deposited nutrients (i.e., nitrogen, phosphorus, silica, and iron) in the sustainability of the Amazon rainforest (Koren et al., 2006; Tegen et al., 2006; Ansmann et al., 2009a; Ben-Ami et al., 2010; Abouchami et al., 2013; Gläser et al., 2015).
In the Southern Hemisphere (Table 3; Fig. 7), the amount of dust deposited into the broader South Atlantic Ocean is significantly lower compared to the Northern Hemisphere. More specifically, the dust plumes (Fig. 6a) (Foth et al., 2019) originating from the arid areas of South America (McConnell et al., 2007; Mazzonia and Vazquez, 2009; Ginoux et al., 2012) advected over the Atlantic Ocean (lon: 65–35° W/lat: 50–22° S) result in dust deposition fluxes over the southwest Atlantic Ocean area of 3.79 ± 4.02 mg m−2 d−1 in winter (Fig. 6d), 2.97 ± 2.26 mg m−2 d−1 in spring (Fig. 6f), 2.17 ± 1.38 mg m−2 d−1 in summer (Fig. 6h), and 1.41 ± 2.32 mg m−2 d−1 in fall (Fig. 6j). With respect to dust plumes originating from the arid areas of South Africa (Eckardt and Kuring, 2005; Bryant et al., 2007; Ginoux et al., 2012; Vickery et al., 2013; Gkikas et al., 2022) (lon: 10° W–15° E/lat: 14–6° S), the westward export and transport of short-range and short-lived dust layers (Vickery et al., 2013) across the southern Atlantic Ocean (Gkikas et al., 2022) result in relatively low values of dust deposition fluxes, equalling 3.14 ± 3.59 mg m−2 d−1 in winter (Fig. 6d), 2.61 ± 2.21 mg m−2 d−1 in spring (Fig. 6f), 4.42 ± 2.79 mg m−2 d−1 in summer (Fig. 6h), and 2.28 ± 1.28 mg m−2 d−1 in fall (Fig. 6j).
Table 3Seasonal DDR averages (in mg m−2 d−1) for the period December 2006–November 2022, along with the associated variability, for the Northeast Atlantic Ocean (NEAO), North-Middle Atlantic Ocean (NMAO), Northwest Atlantic Ocean (NWAO), Gulf of Guinea (GG), Southeast Atlantic Ocean (SEAO), and Southwest Atlantic Ocean (SWAO) sub-domains of the Atlantic Ocean.
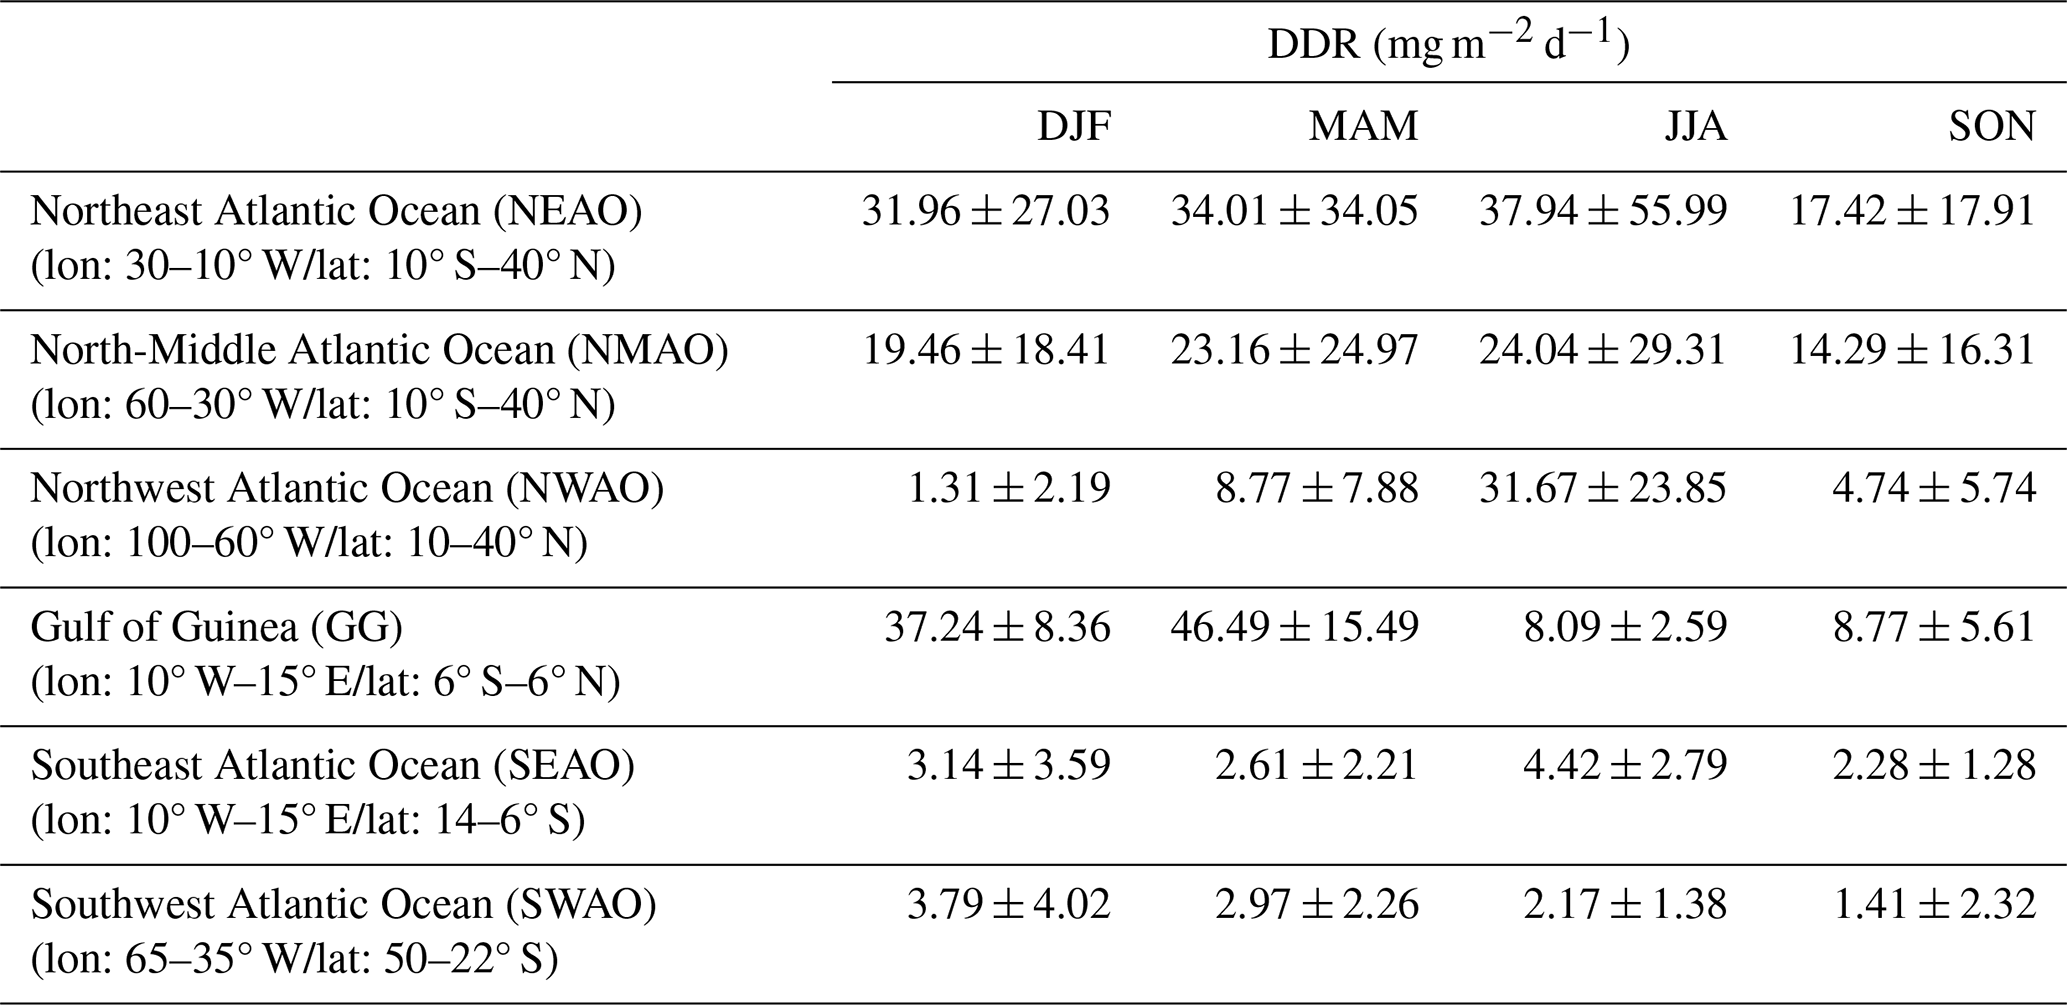
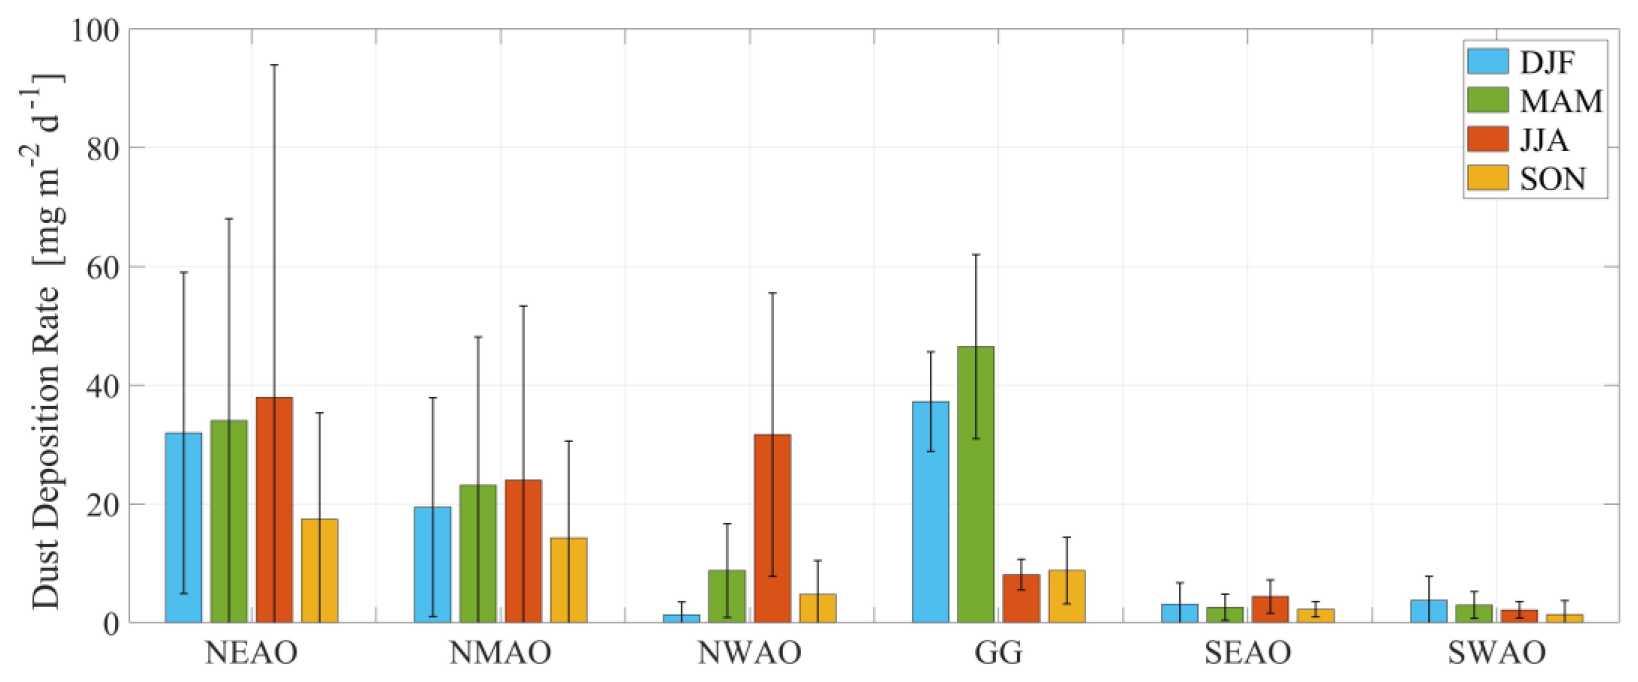
Figure 7Visualization of seasonal DDR averages (in mg m−2 d−1) for the period December 2006–November 2022, along with the associated variability, for the Northeast Atlantic Ocean (NEAO), North-Middle Atlantic Ocean (NMAO), Northwest Atlantic Ocean (NWAO), Gulf of Guinea (GG), Southeast Atlantic Ocean (SEAO), and Southwest Atlantic Ocean (SWAO) sub-domains of the Atlantic Ocean.
3.2 Evaluation of EO-based dust deposition estimates
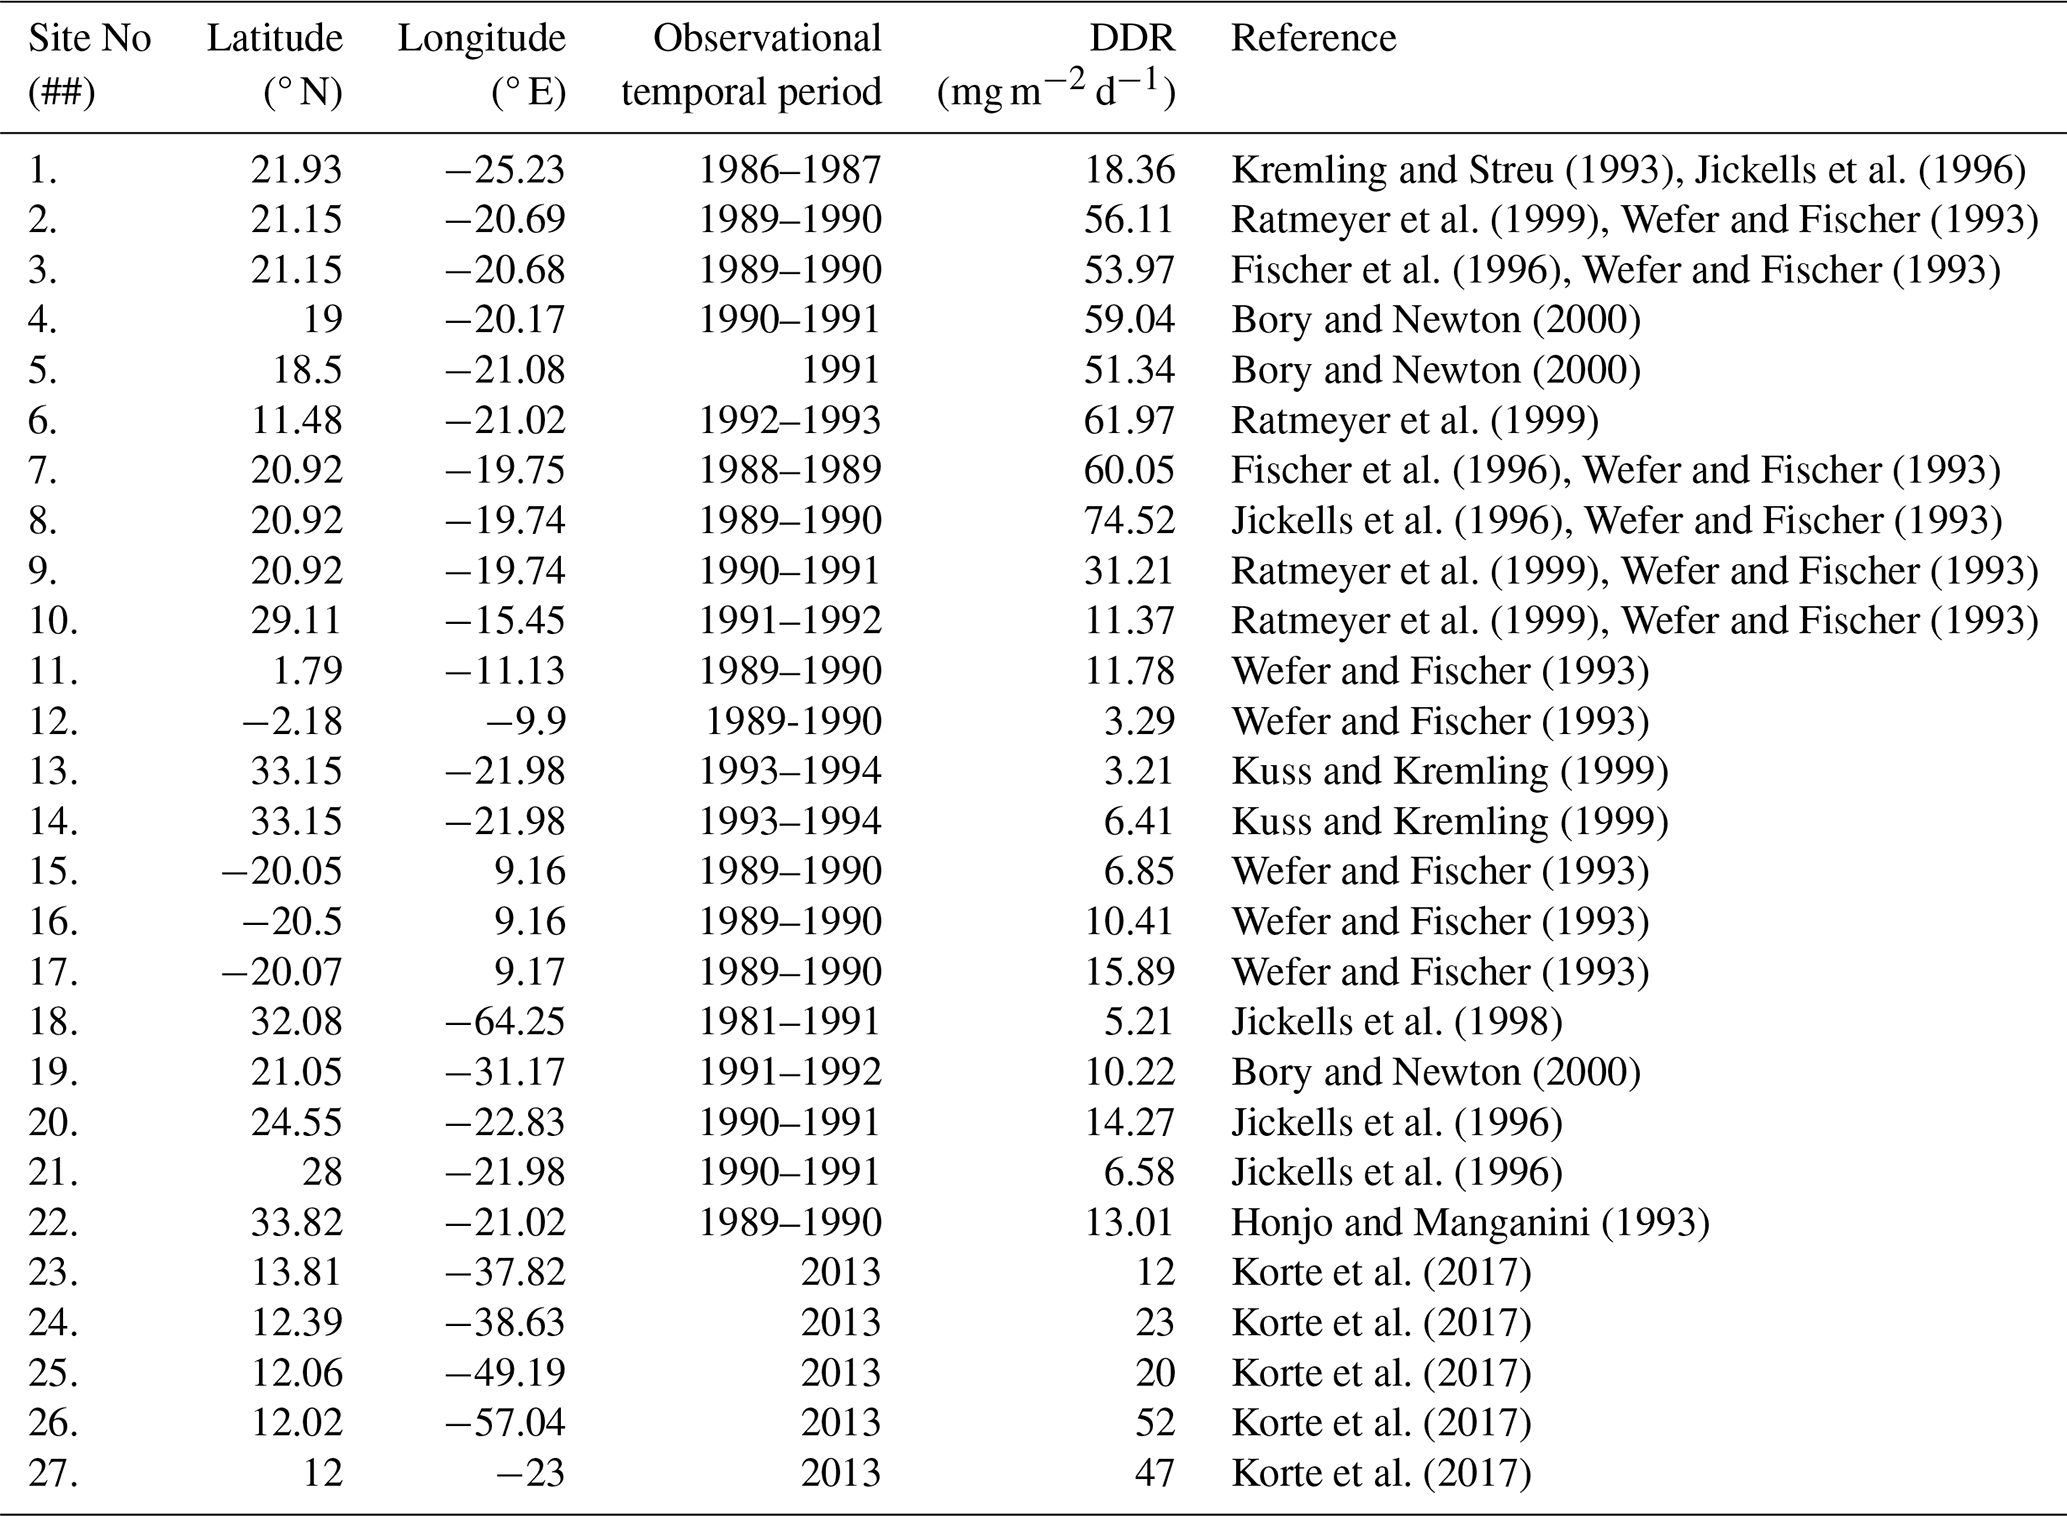
Towards verifying the accuracy, ensuring the reliability, and quantifying the uncertainties of the satellite-based estimations of the dust deposition rate, the implementation of in situ observations of dust deposition fluxes as reference datasets is essential. However, numerous significant challenges inherent to the complex nature of oceanographic research hamper the feasibility of establishing long-term and continuous in situ measurements of high spatial coverage over extensive geographical areas and temporal periods, leading to limited availability of observational-reference datasets. In this study, we focus on the Albani et al. (2014) compiled data record of in situ dust deposition flux measurements, as enriched by Yu et al. (2019) with more recent observations in the region of interest (Table 4). To be more specific, the utilized reference dataset (Albani et al., 2014; Yu et al., 2019) was established through revision and integration of pre-existing in situ dust deposition flux measurements (Honjo and Manganini, 1993; Kremling and Streu, 1993; Wefer and Fischer, 1993; Fischer et al., 1996; Jickells et al., 1996, 1998; Kuss and Kremling, 1999; Ratmeyer et al., 1999; Bory and Newton, 2000; Friese et al., 2017; Korte et al., 2017) across the broader Atlantic Ocean (Fig. 8a), through efforts towards homogenization (Albani et al., 2014; Yu et al., 2019), resulting in a robust record suitable to be used for scientific studies related to modern climate deposition of dust aerosols (Ginoux et al., 2001; Tegen et al., 2002; Lawrence and Neff, 2009; Mahowald et al., 2009).
Table 4Compilation of sediment-trap climatologies of dust deposition fluxes.
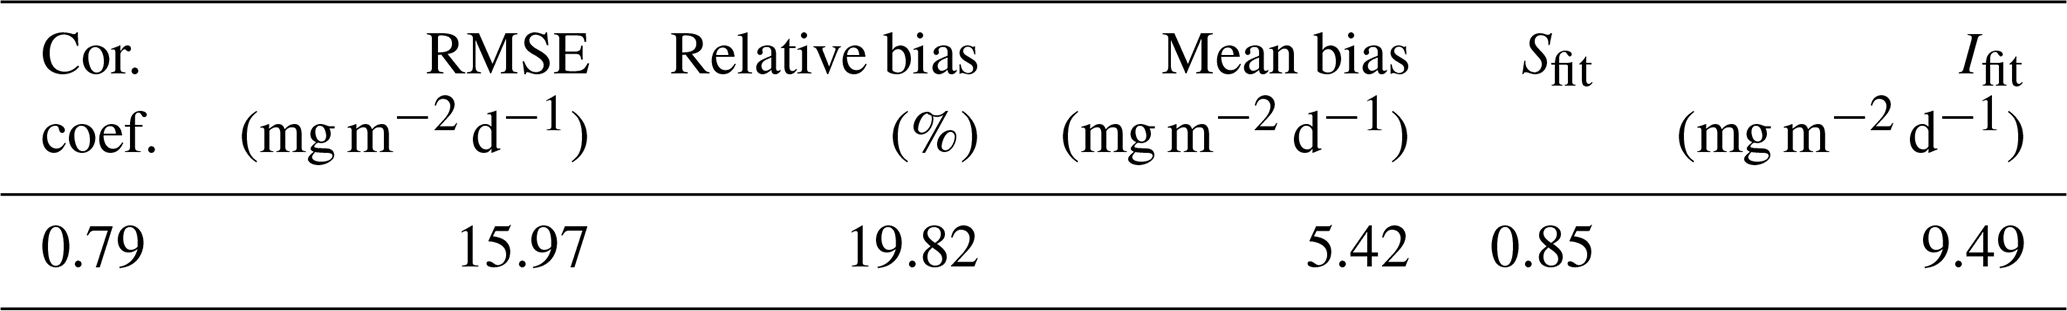
This section aims to quantitatively evaluate the ability of the satellite-based derived dust deposition rate product to replicate the characteristics of dust deposition measured by sediment traps while also quantifying associated uncertainties. However, it should be emphasized that implementation of the in situ observational dataset as the reference record towards a direct and rigorous validation of the satellite-based dust deposition rate product established is not feasible, as most of the sediment-trap measurements date back to the 1980s and 1990s. The assessment follows the methodology proposed by Yu et al. (2019) to account for the different temporal spans of sediment-trap measurements and satellite-based observations. More specifically, under the apparent limitations, the intercomparison is conducted on the basis of long-term climatological means, evaluating the total dataset of spatially collocated satellite-based dust deposition rates against the correlative in situ measurements (Fig. 8b), for the Atlantic Ocean sediment-trap sites (Fig. 8a). Overall, the performed evaluation reveals a general tendency of the satellite-based dust deposition rate product to overestimate the dust deposition rate measurements conducted at the sediment-trap observational sites (Table 5). This feature can be attributed to several sources and factors driving the spatially correlative evaluation, as discussed hereinafter, resulting in the observed discrepancies.
Table 5EO-based dust deposition rate product overall evaluation metrics established on the basis of reference dust deposition rate measurements conducted at sediment-trap observational sites, including absolute biases, relative biases, the root mean square error (RMSE), the correlation coefficient, and the slope (Sfit) and intercept (Ifit) of a linear regression fit.
First, with respect to the CALIPSO-CALIOP observations, issues contaminating the dust deposition rate product resulting in the apparent overestimations can be attributed, among others, to misclassification of cloud layers (i.e., cirrus fringes) as aerosol layers (Liu et al., 2009, 2019) even under strict quality-assurance criteria (Tackett et al., 2018) and to further erroneous subclassification of the classified layers as aerosol (Omar et al., 2009; Kim et al., 2018; Kar et al., 2019). For instance, marine aerosol layers (i.e., sea salt emissions) in the marine boundary layer (MBL) – free troposphere (FT) entrainment zone, characterized by low relative humidity (RH) conditions, tend to obtain a crystal cubic-like shape (Haarig et al., 2017a), leading, due to increased depolarizing capacity, to aerosol subtype classification distinction ambiguities (Burton et al., 2013).
Second, application of the atmospheric dust decoupling technique to optical products of the CALIPSO mission (Winker et al., 2010), namely, the one-step POLIPHON (Tesche et al., 2009), is performed on the basis of several assumptions with respect to the depolarizing properties of the dust (Esselborn et al., 2009; Freudenthaler et al., 2009; Ansmann et al., 2011; Gross et al., 2011a; Groß et al., 2015; Tesche et al., 2011; Veselovskii et al., 2016; Haarig et al., 2017b) and non-dust (Müller et al., 2007; Ansmann et al., 2010; Groß et al., 2012; Nicolae et al., 2013; Noh et al., 2013; Haarig et al., 2017a; Bohlmann et al., 2021; Veselovskii et al., 2022) aerosol layers, introducing further uncertainties in the final near-global atmospheric dust aerosol product (Amiridis et al., 2013; Marinou et al., 2017; Proestakis et al., 2018, 2024; Aslanoğlu et al., 2022). More significant is the impact of incorrect implementation of dust lidar ratio values for the layers classified as dust aerosol, allowing conversion of the backscatter coefficient at 532 nm profiles to extinction coefficient at 532 nm profiles and accordingly to mass concentration profiles (Ansmann et al., 2019). For instance, implementation of the CALIPSO-default Version 4 (V4) dust aerosol-subtype lidar ratio of 44 sr (Kim et al., 2018) and not of the (updated in the present study) Saharan dust LR of 53.1 sr for the North Atlantic Ocean dust outflow region (Floutsi et al., 2023) would reduce the rate of dust deposition and the estimate of the total deposited dust in the North Atlantic Ocean region up to ∼ 20.7 %. However, several studies and extensive experimental campaigns report significantly higher Saharan dust lidar ratio values for the West Sahara and the North Atlantic Ocean dust outflow region (Tesche et al., 2009, 2011; Gross et al., 2011a, b; Groß et al., 2015; Kanitz et al., 2013, 2014; Weinzierl et al., 2016; Haarig et al., 2017b; Rittmeister et al., 2017; Bohlmann et al., 2018; Floutsi et al., 2023) than the CALIPSO V4 default (Kim et al., 2018), attributed mainly to the different mineralogies of dust particles emitted from different dust sources into the atmosphere (Castellanos et al., 2024).
Third, marine sediment-trap observations of atmospheric dust deposition into the ocean are challenging to interpret (e.g., Kohfeld and Harrison 2001), as the provided measurements do not necessarily represent the true atmospheric dust deposition to the surface of the ocean at the monitoring locations of the mooring sites (Siegel and Deuser, 1997; Bory et al., 2002). One of the main sources of uncertainties in the intercomparison of satellite-based dust deposition products and sediment-trap records is the time lag between dust emission and export towards and over the broader Atlantic Ocean, related to the EO-based estimation of dust deposition, and the arrival time at the depth of the operated sediment traps. More specifically, it is estimated that the Saharan dust layers leaving the African continent are transported westward at a speed of approximately 1000 km d−1, needing about 5 to 7 d to cross as far as the eastern coast of the United States or the Gulf of Mexico (Huang et al., 2010; Prospero et al., 2014; Weinzierl et al., 2016). Upon deposition, the atmospheric dust layers release into the ocean dust particles characterized by a size distribution spanning over several orders of magnitude, extending between 0.1 µm and more than 100 µm in diameter (Weinzierl et al., 2016; Ryder et al., 2018; van der Does et al., 2018b). The different sizes of the deposited dust particles are characterized by different dust transport pathways through the water column, as finer particles are characterized by a slower settling speed (van der Jagt et al., 2018; Guerreiro et al., 2021). More specifically, it is estimated that finer dust particles, with sinking speeds of about 1 to 35 m d−1, would have a lateral transport range during this period possible as far as 500 km from the oceanic surface deposition area, depending also on the sampling depth (Siegel et al., 1990). Overall, it is estimated that the sinking speed of deposited particles towards the installed collectors operated at ∼ 1200 m leads to a transit period of ∼ 5 d, while for deeper-depth collectors, the transit period ranges between 10 and 20 d (Fischer et al., 1996; Ratmeyer et al., 1999; van der Does et al., 2016), introducing uncertainties into the temporal intercomparison process of the satellite-based dust deposition products and sediment-trap records.
It should be emphasized that with respect to the spatial intercomparison, during the transit period between atmospheric deposition and the collection by the sediment traps, deposited dust layers are subject to currents of variable pathways. For instance, upon deposition of Saharan dust into the proximity of the western coast of the Sahara, off Cabo Blanco, the oceanic circulation carries the deposited layers thousands of kilometers southwards, where the Canary Current meets either the westward North Equatorial Current (NEC) or the eastward North Equatorial Counter Current (NECC), possibly resulting not only in extended diffusion of the deposited layers but also in different oceanic transport pathways and thus in collection of the deposited atmospheric dust particles over a relatively well-specified area by sediment traps established and operated over distances of hundreds of kilometers apart (Ratmeyer et al., 1999). During this period, deposited dust particles may be subject to several mechanical and chemical alteration processes, of hydrodynamic nature (i.e., fractionation and sorting; McCave et al., 1995), remineralization, coagulation or aggregation, disaggregation or decomposition (Duce et al., 1991; Jickells et al., 2005; Ratmeyer et al., 1999; Korte et al., 2017), or dissolution and microbiological partial disintegration (Alldredge et al., 1990). The temporal intercomparison may be further affected by the oceanic seasonality, as reported by time series of lithogenic fluxes in sediment traps, which is substantially different from the seasonality of atmospheric dust emission, transport, and deposition (Amiridis et al., 2013; Gkikas et al., 2022; Proestakis et al., 2024). More specifically, on the basis of an array of five moorings deployed below the SAL, van der Does et al. (2016) and Korte et al. (2017) reported that several of the installed moorings demonstrated a clear seasonality in lithogenic fluxes, mainly during summer and autumn (van der Does et al., 2016), while in other cases of sediment traps, no clear seasonality was evident (Korte et al., 2017). The outcomes of oceanic medium to weak seasonality support documented findings as reported by Ratmeyer et al. (1999) on the basis of lithogenic samples collected by several sediment traps operated in the broader area of the Cabo Blanco–Cabo Verde islands.
Another source of uncertainties arises by the variable methods used to extract the dust-related component of the total mass collected by the sediment traps, containing quartz, clay minerals, and feldspars parts – the so-called lithogenic fraction (Wefer and Fischer, 1993; Fischer and Wefer, 1996; Neuer et al., 2002; Fischer and Karakaş, 2009; Fischer et al., 2016). As discussed by McCave et al. (1995) and Ratmeyer et al. (1999), the comparison between different methods, also on the basis of the different applied instrumentation, is especially challenging, mainly due to the complexity of the analysis techniques and the detectable size ranges. Moreover, the detectable sensitivity may result in substantial differences (underestimation) against the EO-based dust deposition rate product established in the framework of the present study. Because a sufficient overlap of the sediment-trap lithogenic fraction sizes and the atmospheric dust particle size distribution (PSD) reported on the basis of extensive experimental campaigns over the Atlantic Ocean conducted with airborne in situ measurements is not accounted for, a more direct and accurate comparison is not feasible. More specifically, while measured atmospheric dust PSDs range between 0.1 and 100 µm in terms of diameter (Weinzierl et al., 2016; Ryder et al., 2018), frequent measurements of such broad PSDs with sediment-trap techniques, especially during the past decades, have been particularly challenging. For instance, in Ratmeyer et al. (1999), volume distribution spectra analysis and grain size statistics were performed only for the fraction 6–63 µm in order that the provided sediment-trap record would be comparable with previously established grain size distributions with surface sediments in the proximity of Northwest Africa (Koopmann, 1981; Sarnthein et al., 1982; McCave et al., 1995).
Moreover, oceanic conditions are not always favorable, with strong currents (> 12 cm s−1) and deep eddy penetration resulting in vertical displacement of the mooring line, possibly contaminating the unbiased collection of settling particles (Knauer and Asper, 1989; Korte et al., 2017). It should be mentioned that though dust sedimentation measurements are frequently used to support quantitatively evaluation of model outputs or satellite-based products, time series of records are frequently partially interrupted or incomplete (Ratmeyer et al., 1999). Due to the highly episodic nature of dust (Prospero et al., 1987; Mahowald et al., 2003), evidence suggests that, in some cases, the available records are based on a relatively small number of dust events (Avila et al., 1997). It should be noted that temporal and spatial sampling limitations of dust deposition rate measurements conducted at the sediment-trap observational sites, related to inherent challenges of oceanic research, may result in a lack of observations over extensive geographical areas or the inability to cover a full year and thus records that are not fully representative of dust deposition patterns (Yu et al., 2019).
Finally, the sediment-trap observations record and the EO-based dust deposition product refer to different time spans. More specifically, the majority of the performed sediment-trap measurements were carried out in the 1980s and 1990s, approximately a decade before CALIPSO optical products became available. Thus, the performed intercomparison serves more as an indirect evaluation of the satellite-based product of the dust deposition rate against the sediment-trap observations rather than a rigorous validation.
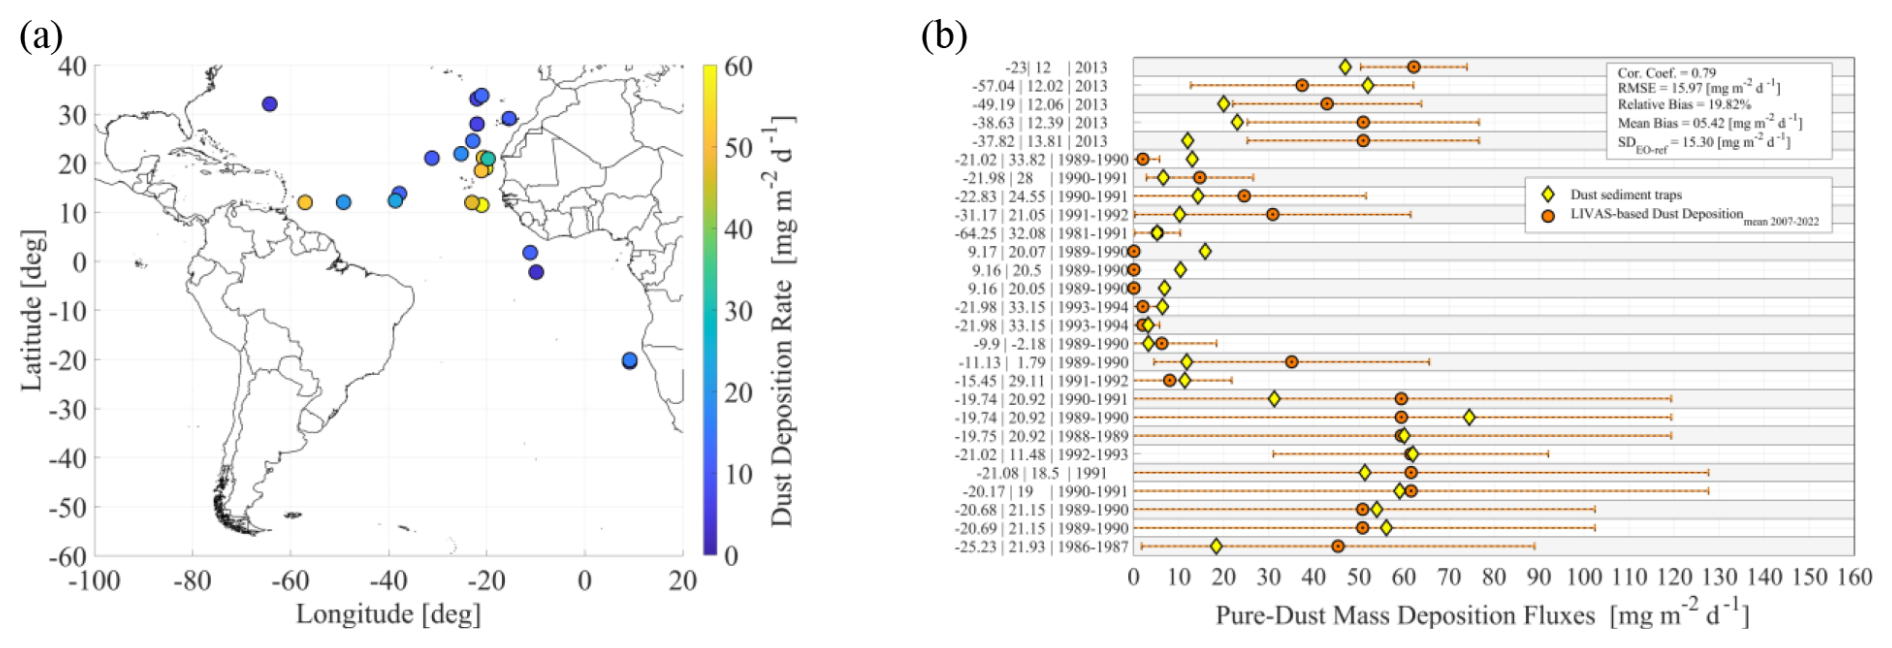
Figure 8In situ dust deposition flux measurements and locations of sediment sites (Table 4) (a). Long-term evaluation of the satellite lidar-based dust deposition rate product against the corresponding in situ dust deposition flux climatology (mg m−2 d−1) (b).
Overall, considering the several sources of uncertainties and the methodological factors driving the observed discrepancies, the EO-based dust deposition rate product and the sediment-trap observations are in rather good agreement (slope of 0.85, intercept of 9.49 mg m−2 d−1, and Pearson correlation coefficient ∼ 0.79). The apparent feature of satellite-based dust deposition is to overestimate those from the in situ-provided observations (mean bias of 5.42 mg m−2 d−1, relative bias of 19.82 %, and RMSE of 30.3 mg m−2 d−1). However, it is notable that the satellite-based dust deposition rate product consistently reproduces the dust deposition spatial patterns recorded by the sediment traps installed and operated across the broader Atlantic Ocean, with a positional accuracy and magnitude generally within a factor of 2 compared to sediment-trap measurements (Table 5).
3.3 Total dust deposited into the broader Atlantic Ocean
Figure 9 provides the quantification of the total annual-mean (Fig. 9a) and seasonal-mean (Fig. 9b) dust deposition (Tg, 1 Tg = 1012 g) into the broader Atlantic Ocean (60° S–40° N, 100° W–20° E) per year. On the basis of 16 full years of CALIPSO observations (December 2006–November 2022), it is estimated that on a basin scale, the yearly average dust deposition amounts to 274.79 ± 31.64 Tg (Fig. 9 – left panel). With respect to the intra-annual-seasonal variability (Fig. 9 – right panel), dust deposition into the ocean is generally highest in summer and lowest in autumn, estimated at 93.10 ± 11.65 and 40.62 ± 11.44 Tg for JJA and SON, respectively. In spring and winter, intermediate activity of dust deposition into the ocean is observed, estimated to be 77.3 ± 19.93 and 63.78 ± 12.03 Tg for MAM and DJF, respectively. The apparent seasonal variability, subject to the high variability of the dust emission, transport, and removal processes, propagates into the observed interannual fluctuations of the amount of dust deposited into the Atlantic Ocean, resulting in high year-to-year heterogeneity. Moreover, a negative statistically significant trend in dust deposition at the significance level of 0.05 is observed, characterized by a slope of −13.35 Tg yr−1 and an offset of 306.97 Tg. In addition, with respect to the year-to-year variability, it is estimated that the total dust deposition at the basin scale ranges from as low as ∼ 221.1 Tg (2019) to as high as ∼ 324.6 Tg (2008). As an indicator of the interannual and seasonal-intra-annual variability of dust deposition, the normalized standard deviation (NSD) is provided, calculated as the ratio of the standard deviation of the seasonal dust deposition of each year to the mean seasonal dust deposition of each year and as the ratio of the standard deviation of the seasonal dust deposition for all seasons to the mean seasonal dust deposition for all seasons over the December 2006–November 2022 period, respectively. The larger the NSD, the greater the variability of dust deposition. With respect to the year-to-year amount of dust deposited into the Atlantic Ocean basin, NSD shows mean intra-annual variability of about ∼ 36.03 %. With respect to the seasonal amount of dust deposited at the basin scale, NSD shows the largest and lowest variability in spring (MAM) and summer (JJA) of ∼ 25.78 % and ∼ 12.52 %, respectively. In autumn and winter, dust deposition into the ocean is slightly lower than in spring, estimated to be ∼ 28.16 % and ∼ 18.87 % for SON and DJF, respectively.
Table 6Annual-mean and seasonal-mean dust deposition (Tg, 1 Tg = 1012 g) and normalized standard deviation (%) into the broader Atlantic Ocean (60° S–40° N, 100° W–20° E) on the basis of 16 full years of CALIPSO observations (December 2006–November 2022).
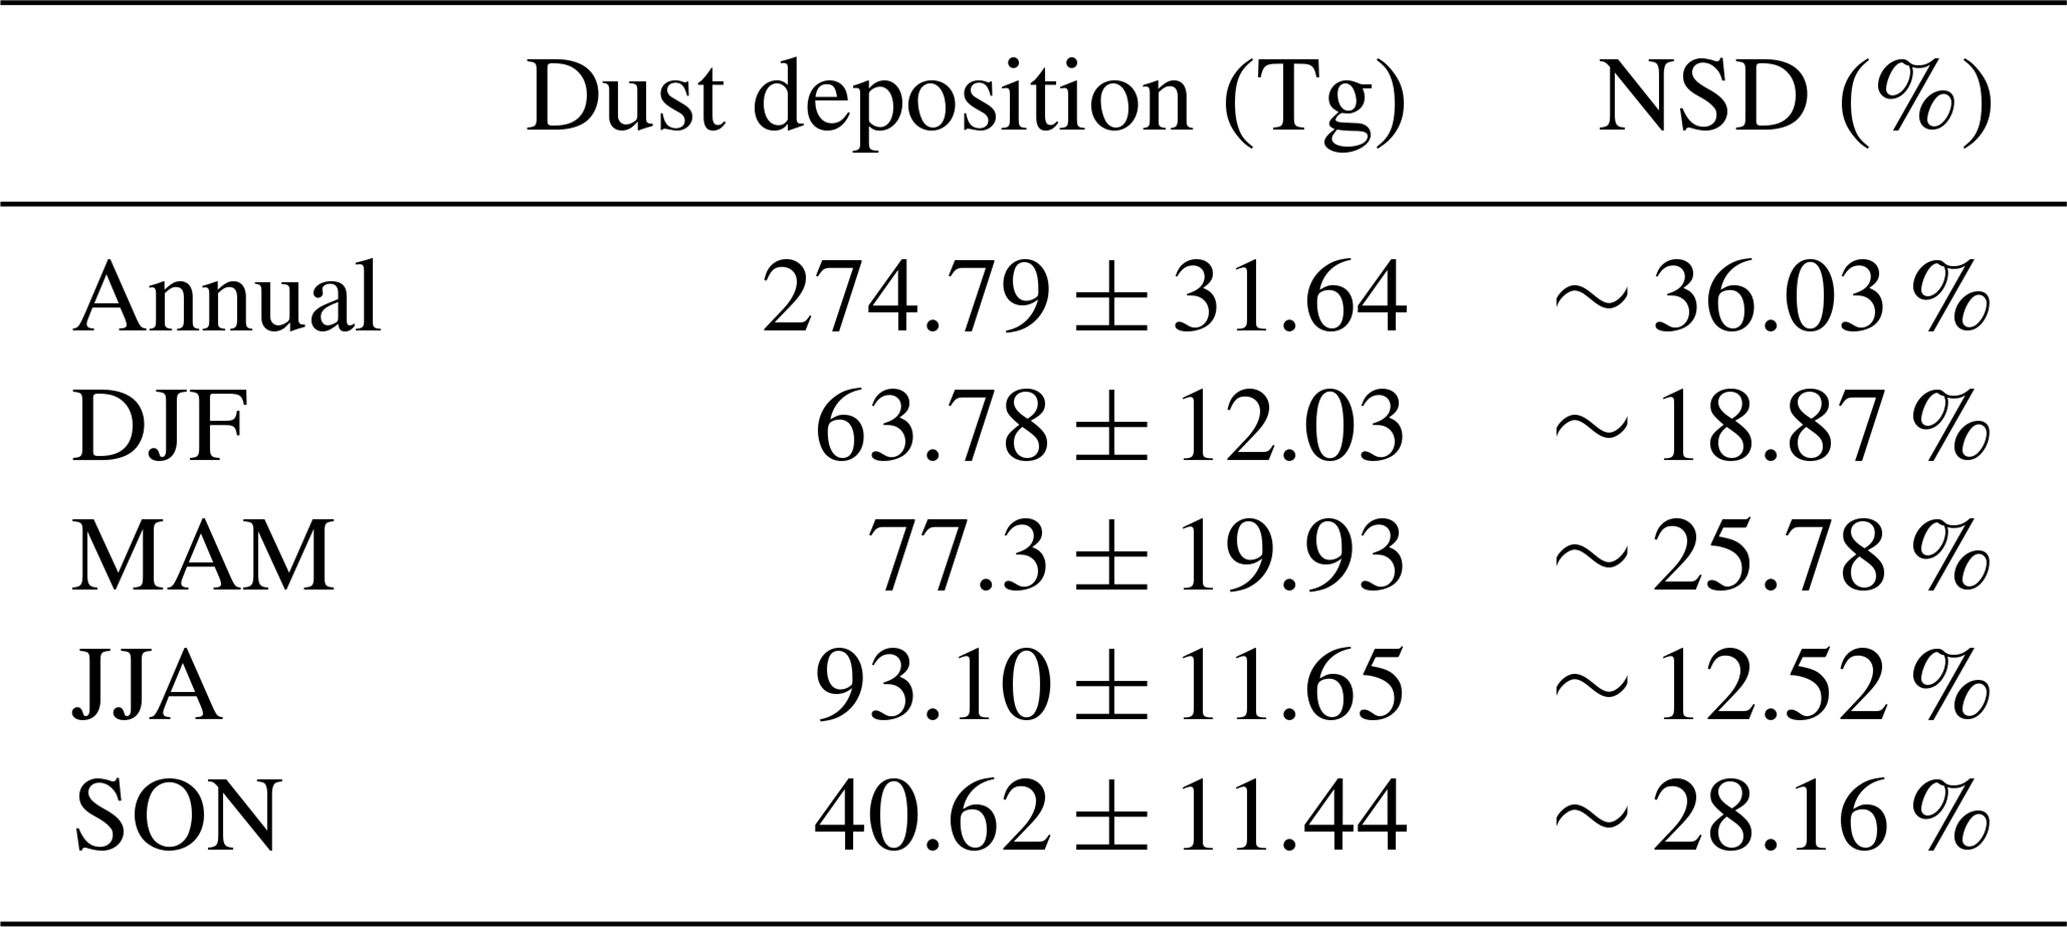
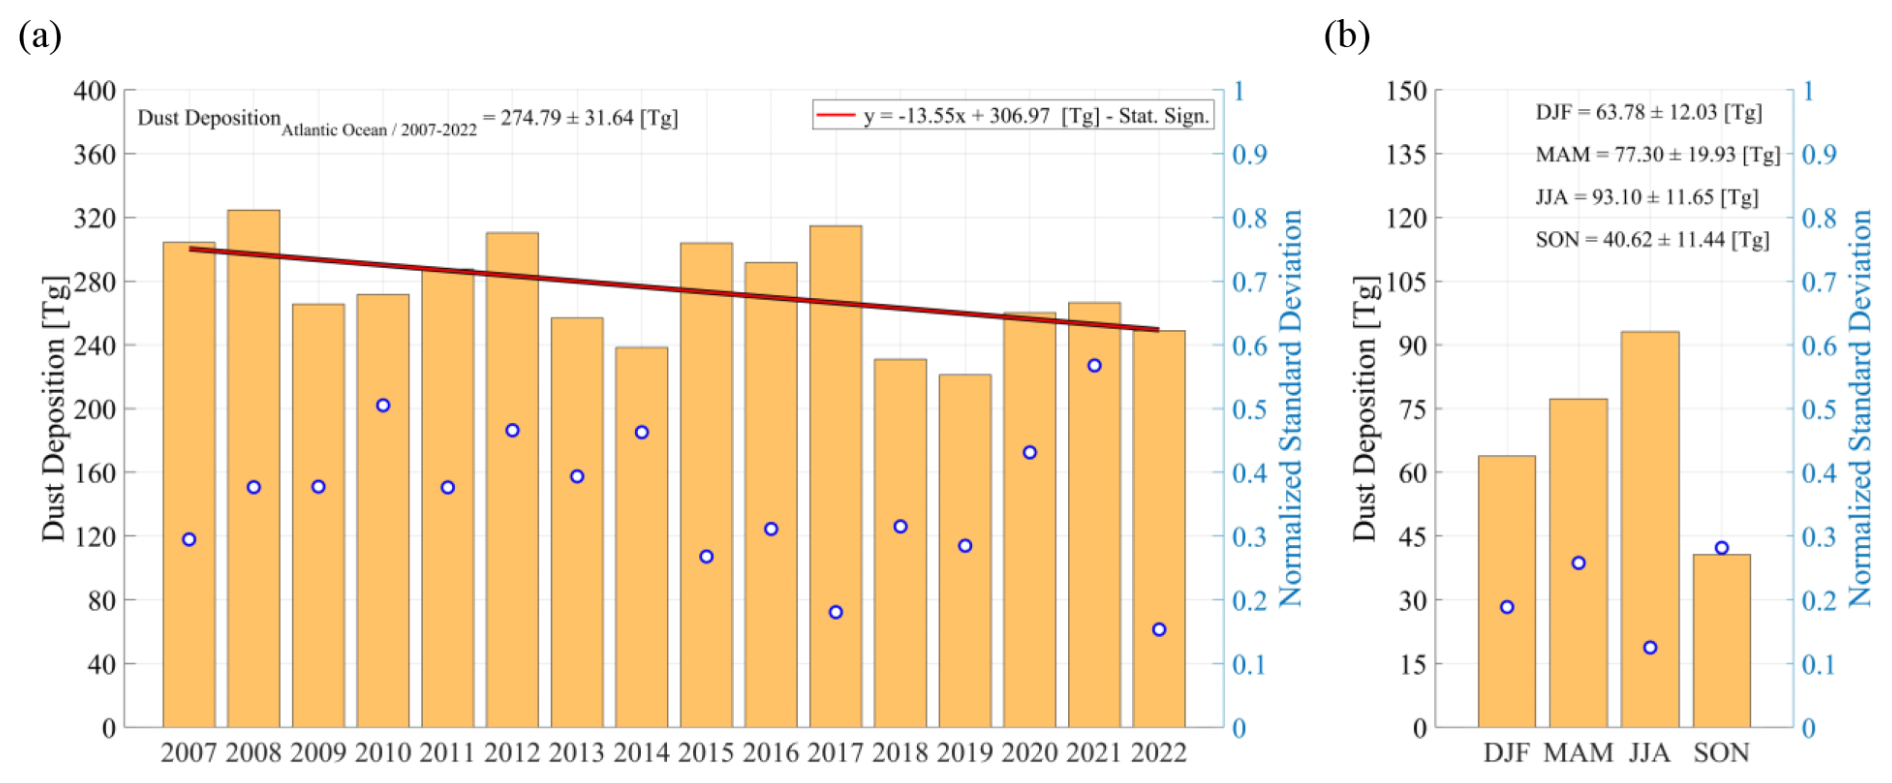
Figure 9Quantification of the (a) total annual-mean and (b) seasonal-mean dust deposition (Tg yr−1, 1 Tg = 1012 g) into the broader Atlantic Ocean (60° S–40° N, 100° W–20° E) on the basis of 16 years of CALIPSO observations (December 2006–November 2022). Open circles in blue denote the annual-mean (a) and seasonal-mean (b) normalized standard deviation (NSD).
Despite the vital role of atmospheric deposited lithogenic material for ocean biogeochemistry and for understanding the environmental impact of the atmospheric dust cycle, the availability of direct mineral dust deposition measurements is limited. Thus, in order to connect these sparse in situ observations and gain insight into the highly heterogeneous (both in time and space) influx of dust particles into the broader ocean, several efforts have been undertaken (Table 7), primarily relying on numerical model simulations (i.e., Duce et al., 1991; Prospero, 1996; Ginoux et al., 2001; Zender et al., 2003; Luo et al., 2003; Ginoux et al., 2004; Tegen et al., 2004; Jickells et al., 2005; Johnson et al., 2010; Kim et al., 2014; Kok et al., 2023) but also following the unprecedented increase in the range, quality, and frequency of satellite-based observations in the remote sensing of dust (i.e., Kaufman et al., 2005; Foltz, 2014; Yu et al., 2015, 2019). Figure 10 compares the satellite-based estimates of dust deposition of the present study (December 2006–November 2022 average) across the broader Atlantic Ocean (AO), North Atlantic Ocean (NAO), and South Atlantic Ocean (SAO), with documented estimates of dust deposition by other studies. This approach serves more as a cross-assessment rather than a rigorous evaluation because the majority of the reported estimates rely on highly variable approaches, assumptions, parameterizations, considered meteorology, temporal periods, and domains.
As examples of the variability of the methods used, the numerical model simulations of Ginoux et al. (2001) on the sources and distributions of dust aerosols, reporting a dust deposition rate of ∼ 184, ∼ 20, and ∼ 204 Tg yr−1 across the North Atlantic Ocean, South Atlantic Ocean, and broader Atlantic Ocean, respectively, averaged over a 5-year period (1987–1990 and 1996), were based on the Georgia Global Ozone Chemistry Aerosol Radiation and Transport (GOCART) model, implementing as input assimilated meteorology fields from the Goddard Earth Observing System Data Assimilation System (GEOS DAS; Schubert et al., 1993), the dust size distribution of seven modes between 0.1 and 6 µm (radius), and a dust density of 2.5 g m−3 (Chin et al., 2000). The 1990s climatology of Zender et al. (2003), based on the Dust Entrainment and Deposition (DEAD) model driven by the National Center for Environment Prediction (NCEP) meteorology (Kalnay et al., 1996), reports a dust deposition rate of ∼ 178, ∼ 29, and ∼ 207 Tg yr−1 across the North Atlantic Ocean, South Atlantic Ocean, and broader Atlantic Ocean, respectively, accounting though for larger dust particles of size 0.1 to 10 µm in terms of diameter. A few years later, the dust deposition estimates of Johnson et al. (2010) were based on simulations with the global chemical transport model GEOS-Chem for the period extending between October 2006 and September 2007, distributing dust in four modes between 0.2 and up to 12.0 µm in terms of diameter (Fairlie et al., 2007). The study reported dust deposition of ∼ 22 Tg yr−1, slightly lower than the dust deposition estimates provided by Gaiero et al. (2003) of ∼ 30 Tg yr−1, focusing on the South Atlantic Ocean domain and more specifically on the Patagonian dust source regions. The corresponding total South Atlantic Ocean total dust deposition, upon accounting, in addition to South American arid areas (McConnell et al., 2007; Mazzonia and Vazquez, 2009; Ginoux et al., 2012), the major dust sources of South Africa (Eckardt and Kuring, 2005; Bryant et al., 2007; Ginoux et al., 2012; Vickery et al., 2013; Gkikas et al., 2022), was estimated to be significantly higher (∼ 86 Tg yr−1) by Kok et al. (2023). Kaufman et al. (2005), on the basis not of model simulations but of satellite-based observations of aerosols provided by Terra – MODIS (Remer et al., 2005) in 2001, estimated dust emitted from Africa and deposited into the Atlantic Ocean as far as the Caribbean of approximately ∼ 190 Tg yr−1 for the year 2001. Yu et al. (2019) implemented CALIPSO-CALIOP (Winker et al., 2010) dust profiles on synergy with DOD products established on the basis of observations provided by MODIS (Remer et al., 2005), MISR (Garay et al., 2020), and IASI (Capelle et al., 2014) radiometers over the Tropical Atlantic Ocean domain. On the basis of a 10-year period (2007–2016) and basin-scale average (5° S–35° N), Yu et al. (2019) reported ∼ 151.6 Tg yr−1 on the basis of CALIOP, ∼ 221.5 Tg yr−1 on the basis of CALIOP-MODIS, ∼ 168 Tg yr−1 on the basis of CALIOP-MISR, and ∼ 136 Tg yr−1 on the basis of CALIOP-IASI synergies. These indicative examples of performed studies highlight the discrepancies between reported dust deposition quantification estimates on the basis of the highly variable approaches applied, assumptions and parameterizations considered, meteorology fields used, and temporal periods and regions of interest of each study.
Table 7Documented numerical model simulations and satellite-based estimates of dust deposition across the broader Atlantic Ocean (AO), North Atlantic Ocean (NAO), and South Atlantic Ocean (SAO).
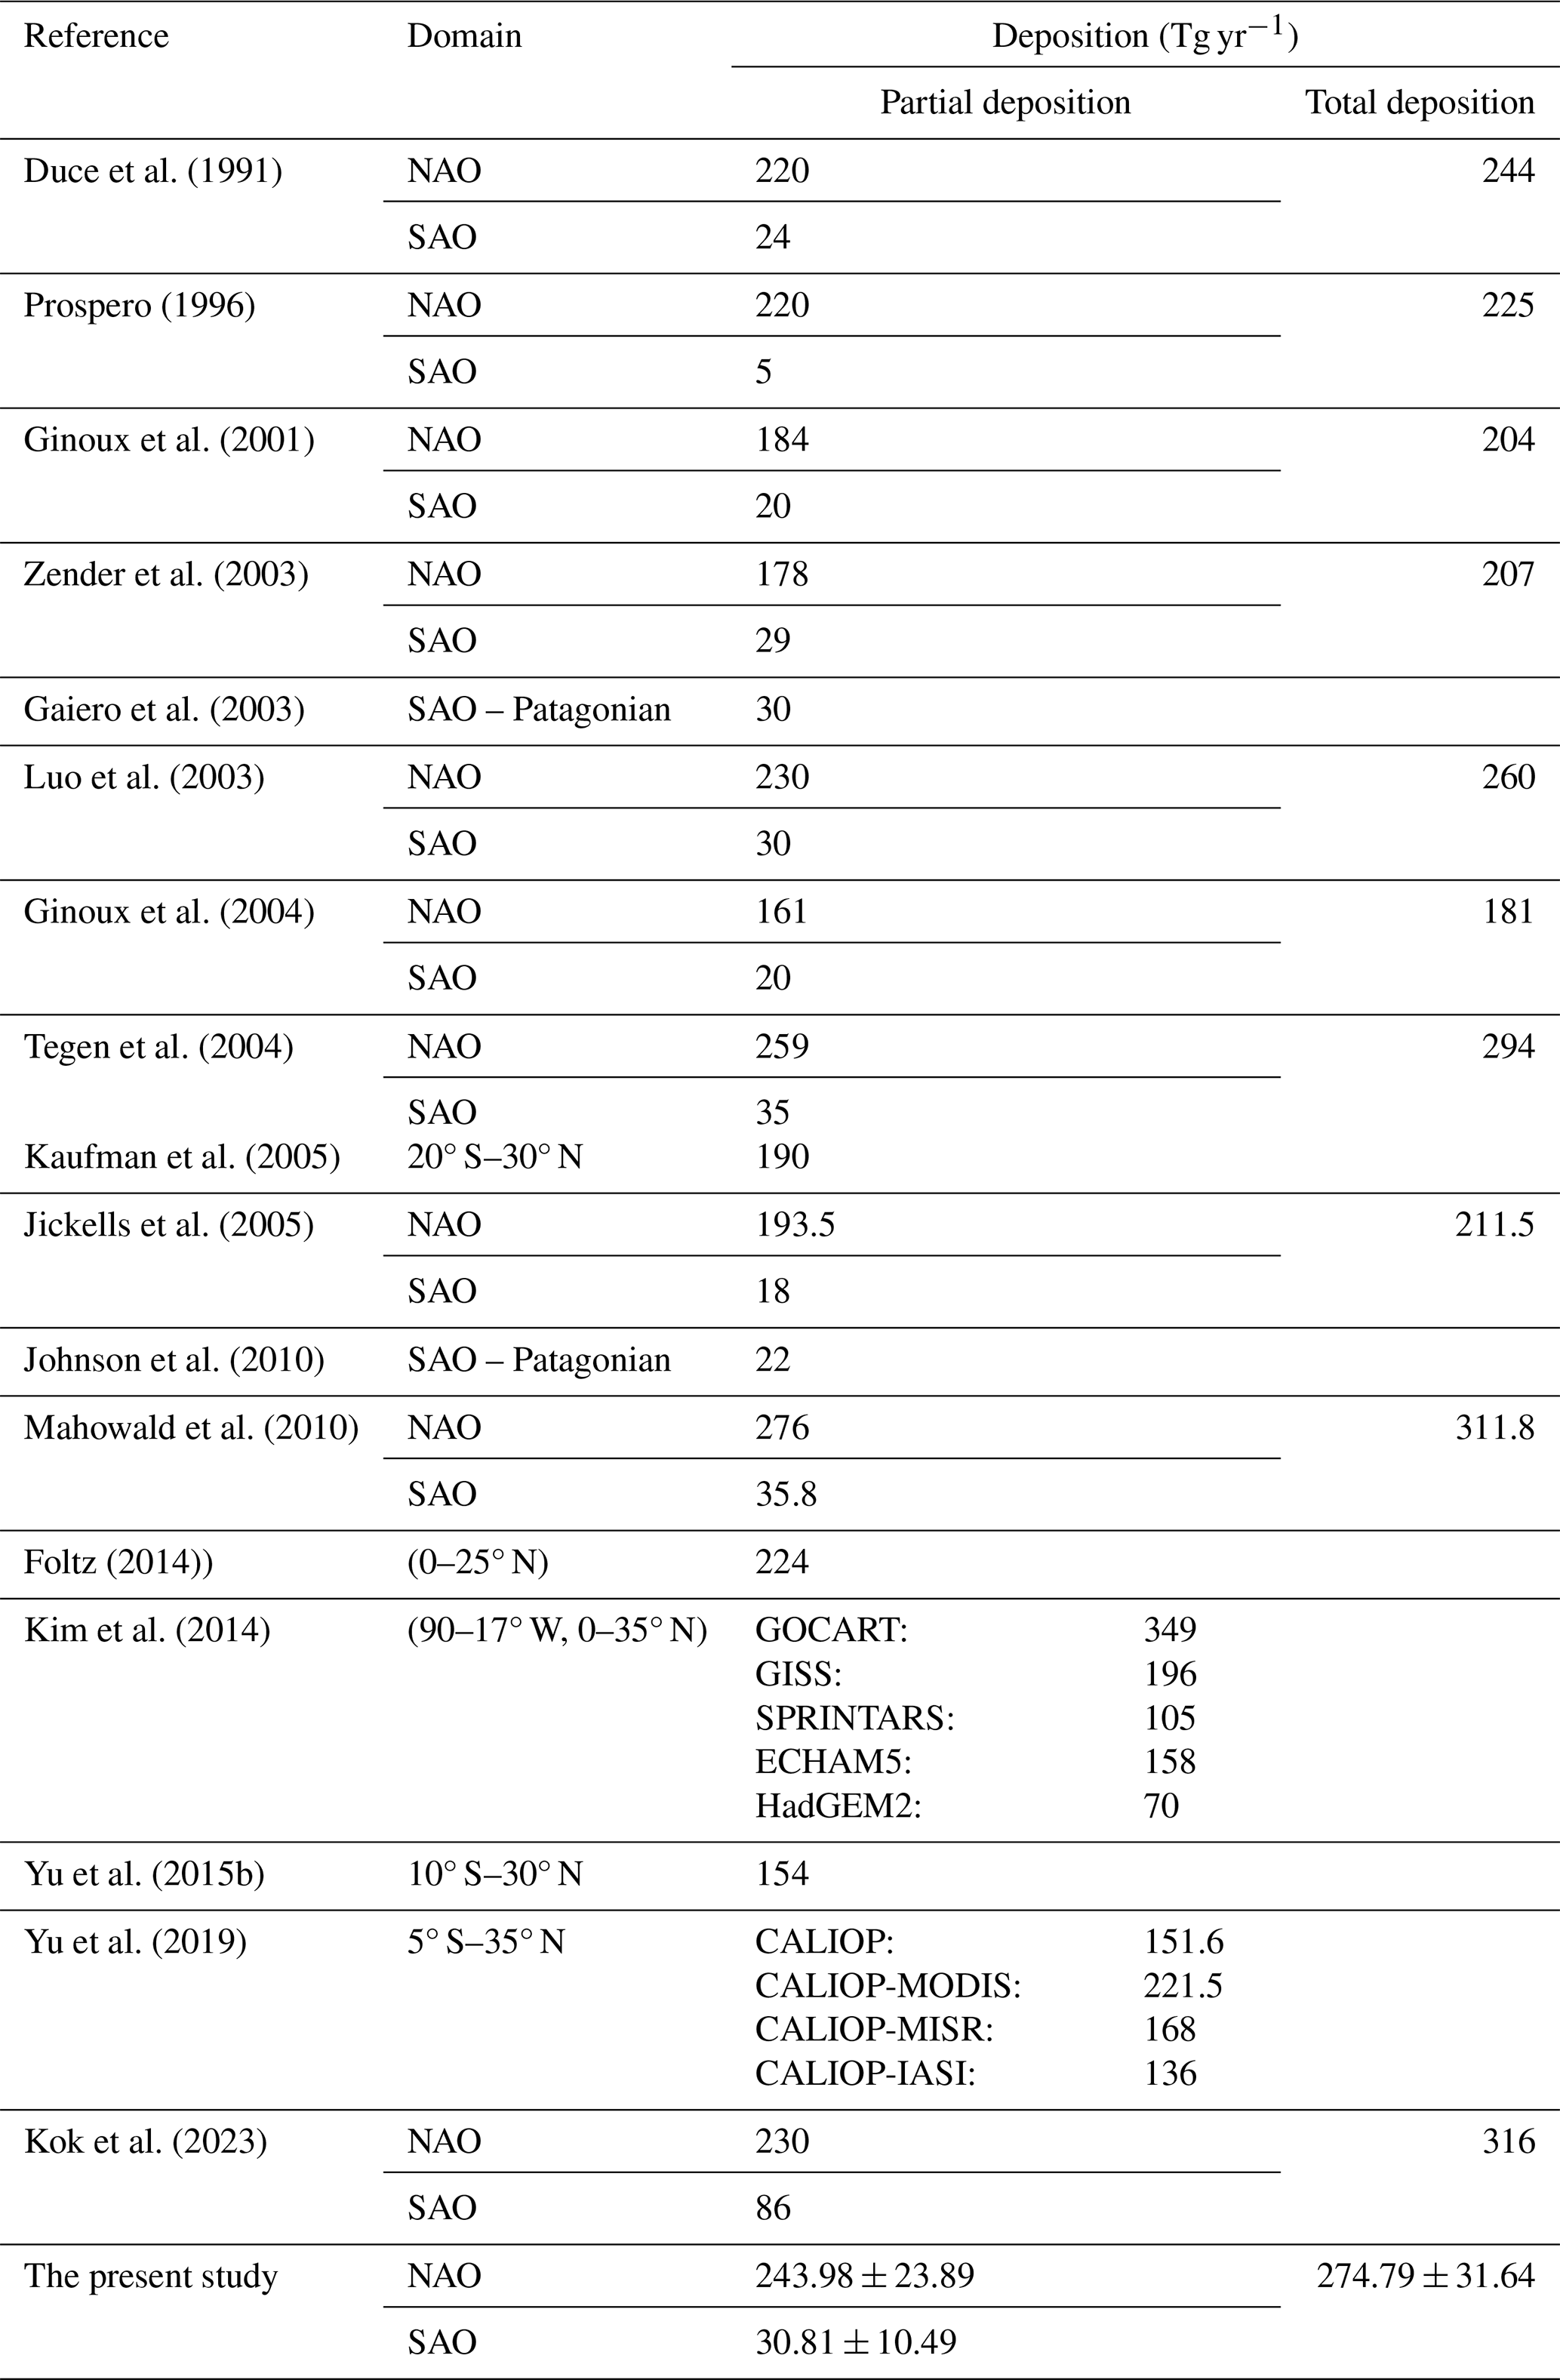
Figure 10 shows the comparison between the documented dust deposition estimates (Table 7) and our estimates of dust deposition across the broader Atlantic Ocean (Fig. 10a), North Atlantic Ocean (Fig. 10b), and South Atlantic Ocean (Fig. 10c). Overall, on the basis of CALIOP observations between December 2006 and November 2022, the annual-mean deposited dust into the broader Atlantic Ocean is estimated to be 274.79 ± 31.64 Tg yr−1, of which 243.98 ± 23.89 Tg yr−1 of dust is deposited across the North Atlantic Ocean and 30.81 ± 10.49 Tg yr−1 of dust is deposited across the South Atlantic Ocean. These satellite-derived estimates of dust deposition lie within the much larger documented range of dust deposition rates (Table 7), varying by a factor of 2 and ranging from 181 Tg yr−1 (Ginoux et al., 2004) to 316 Tg yr−1 (Kok et al., 2023) for the case of the broader Atlantic Ocean, by a factor of 5 ranging from 70 to 349 Tg yr−1 for the case of the North Atlantic Ocean (Kim et al., 2014), and by a factor of 17 ranging from 5 Tg yr−1 (Prospero, 1996) to 86 Tg yr−1 for the case of the South Atlantic Ocean (Kok et al., 2023). More specifically, based on the average of all documented dust deposition estimates by previous studies (Table 7), the annual dust deposition is 245.43 ± 48.16 Tg yr−1 into the broader Atlantic Ocean, 194.30 ± 59.39 Tg yr−1 into the North Atlantic Ocean or Tropical Atlantic Ocean, and 29.57 ± 19.68 Tg yr−1 into the South Atlantic Ocean. The present study reports larger quantified dust deposition estimates with respect to the average of all documented dust deposition estimates of 29.36 Tg yr−1 (11.96 %) across the broader Atlantic Ocean, of 49.68 Tg yr−1 (25.57 %) across the North Atlantic Ocean, and of 1.24 Tg yr−1 (4.21 %) across the South Atlantic Ocean. However, the dust deposition estimates of our study fall well within the variability of the reported dust deposition outcomes, within one standard deviation. These satellite-derived estimates of dust deposition are rather promising, given that the documented quantifications of dust deposition used in the intercomparison framework were performed over different time spans and spatial scales and given the significant variability in model representations of emission and transport processes, which are highly heterogeneous in both space and time, the parameterizations of the vertical structure of dust in the atmosphere and of dry and wet dust deposition, the substantial disparity in the size range, distribution, and density of dust in model simulations, and the different utilized satellite-based sensors and applied techniques.
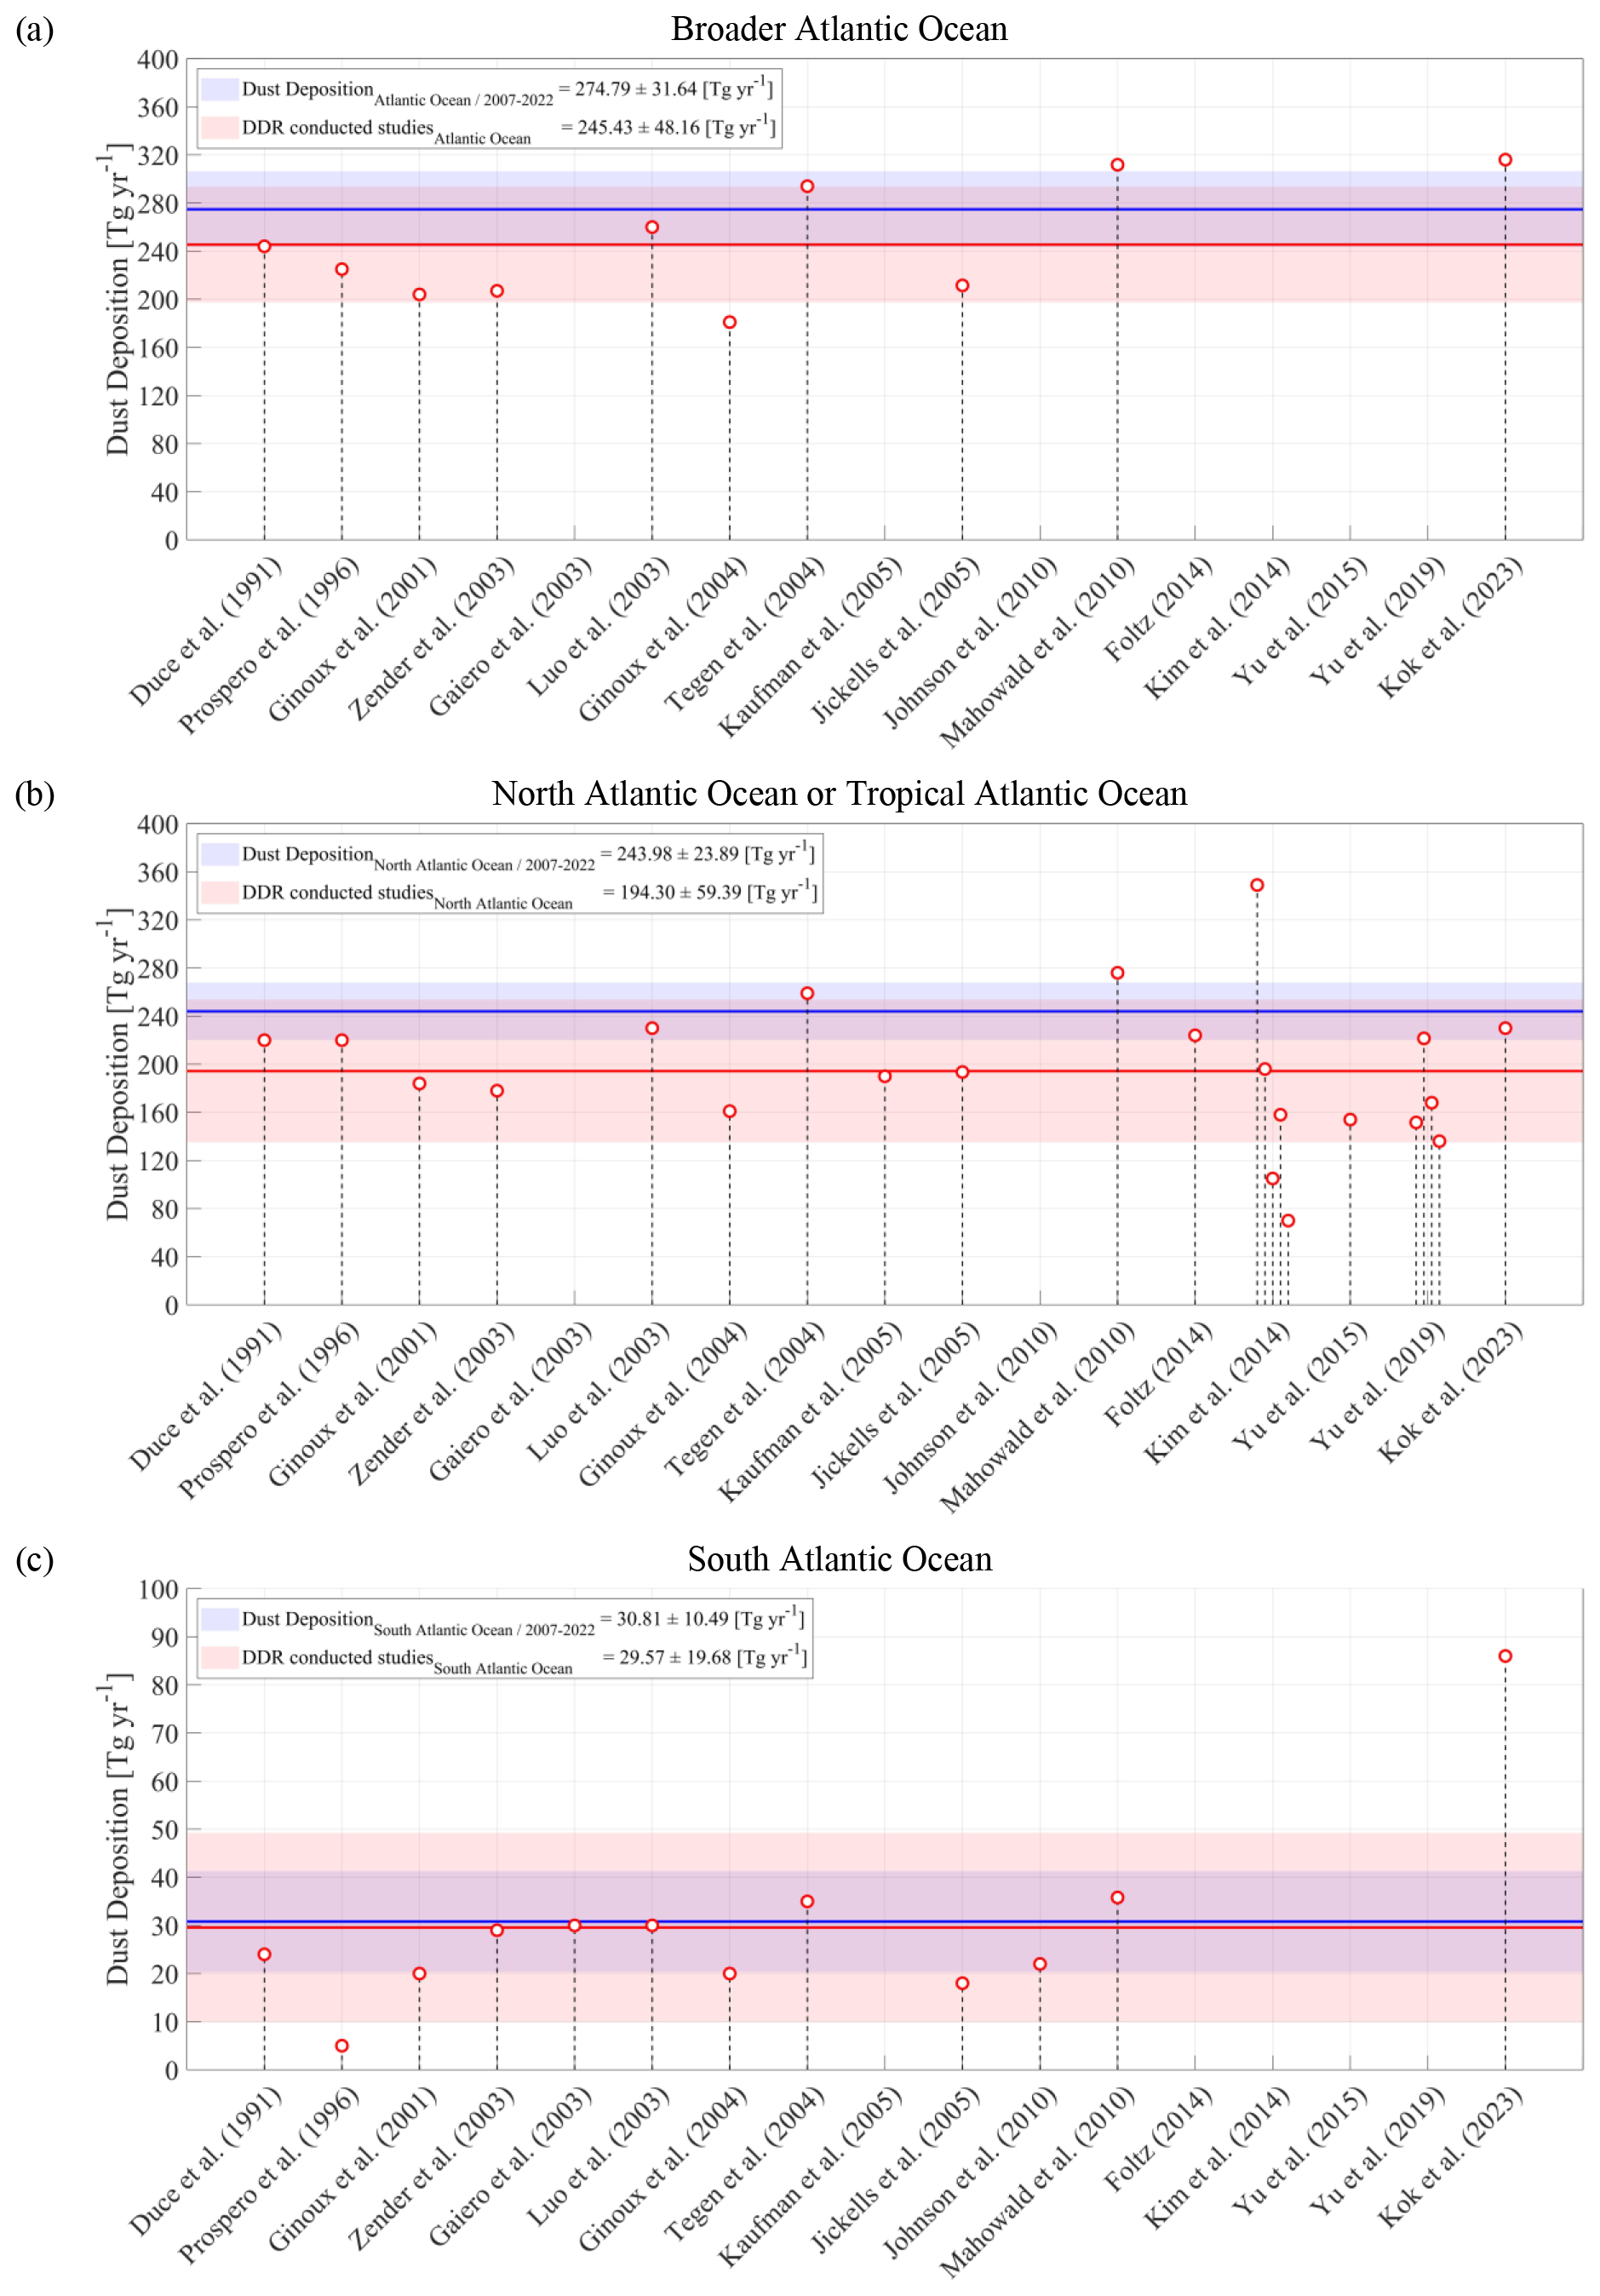
Figure 10Comparison between the present satellite-based estimates of dust deposition (December 2006–November 2022 average) across (a) the broader Atlantic Ocean (AO), (b) North Atlantic Ocean (NAO), and (c) South Atlantic Ocean (SAO), with documented estimates of dust deposition. In each sub-figure, the horizontal blue and red lines correspond to the EO-based long-term mean dust deposition and the mean dust deposition reported in relevant scientific studies, respectively, while the light-blue and light-red shaded enveloped areas correspond to their standard deviation. The red open circles provide the quantified dust deposition within the Atlantic Ocean region reported by relevant studies.
3.4 EO-based dust deposition rate vs respective ESM results
The present section aims to intercompare the EO-based dust deposition rate products and estimates of dust deposition provided by Earth system models (ESMs). The objective of the comparison lies in identifying common dust spatial and seasonal patterns, addressing whether the EO-based dust deposition rate product shares similar characteristics in terms of spatiotemporal variability with model-based deposition estimates, implemented in AeroVal (https://aeroval.met.no/, last access: 21 January 2025). AeroVal is a web-based platform, developed at the Norwegian Meteorological Institute, designed for the evaluation of climate and air quality models. The platform employs the pyaerocom library (a successor to the AeroCom evaluation and visualization tool) to collocate model data with observations from a variety of sources, including ground-based observation networks (EBAS, EEA, AERONET) and satellites (MODIS, AATSR, etc.). AeroVal allows for the computation of statistics, such as biases and correlations, and provides an interactive web interface to facilitate easy exploration of data, model intercomparison, and evaluation statistics. It is utilized in several projects, including, among others, the CMIP (Mortier et al., 2020), AeroCom (e.g., Gliß et al., 2021), CAMS, and EMEP (https://aeroval.met.no/pages/evaluation/?project=domos-paper, last access: 20 May 2025). The comparison is performed for only the year 2020; however, we believe that the presented AeroVal consistency check between EO-based and model-simulated dust AOD and deposition rates for 2020 provides a good indication of reasonable data correspondence.
As an initial step, the EO-based atmospheric dust product of the ESA-LIVAS climate data record in terms of DOD at 532 nm is compared against the AErosol RObotic NETwork (AERONET; https://aeronet.gsfc.nasa.gov/, last access: 3 January 2025; Holben et al., 1998) coarse-mode AOD optical product, derived via the spectral deconvolution algorithm (SDA; Eck et al., 1999; O'Neill et al., 2001a, b, 2003), as well as against DOD at 550 nm from the models. This step is applied because the capacity of the EO-based climate data record to provide the spatiotemporal variability of the atmospheric dust conditions with high accuracy is a crucial cornerstone for accordingly quantitatively and qualitatively quantifying the dust deposited component across the dust transport pathways into the ocean. More specifically, as the accuracy of dust deposition calculations relies on the accuracy of the estimates of the dust load in the atmosphere, DODs from the LIVAS, EMEP, EC-Earth3, and MONARCH models are, as a first step, evaluated against AERONET coarse-mode AOD (Dubovik et al., 2006) and intercompared in AeroVal. The coarse-mode AOD was selected for the evaluation because it ensures a more consistent dust signal, minimizing contamination from fine-mode aerosols such as biomass burning or anthropogenic pollution, though it may underestimate the total dust AOD by ∼ 20 %–30 % (Mamouri and Ansmann, 2014). Note that while model results are produced at a daily resolution, the EO-based DOD and DDR climate data records are provided in the framework of the study at seasonal temporal resolution. As a first approach, all 3 months within a season are assigned the seasonal value, i.e., the seasonal mean, in the AeroVal intercomparison. It should be emphasized that implementation of the AERONET coarse-mode AODs may underestimate the total dust AERONET (fine- and coarse-mode) by ∼ 20 %–30 % (Mamouri and Ansmann, 2014). Accordingly, the AeroVal tool is used for consistency checks by comparing the EO-based DDR climate data record with simulation results from three ESMs, i.e., EMEP MSC-W (hereafter EMEP; Sect. 2.1.4), EC-Earth3-Iron (EC-Earth3; Sect. 2.1.3), and MONARCH (Sect. 2.1.5).
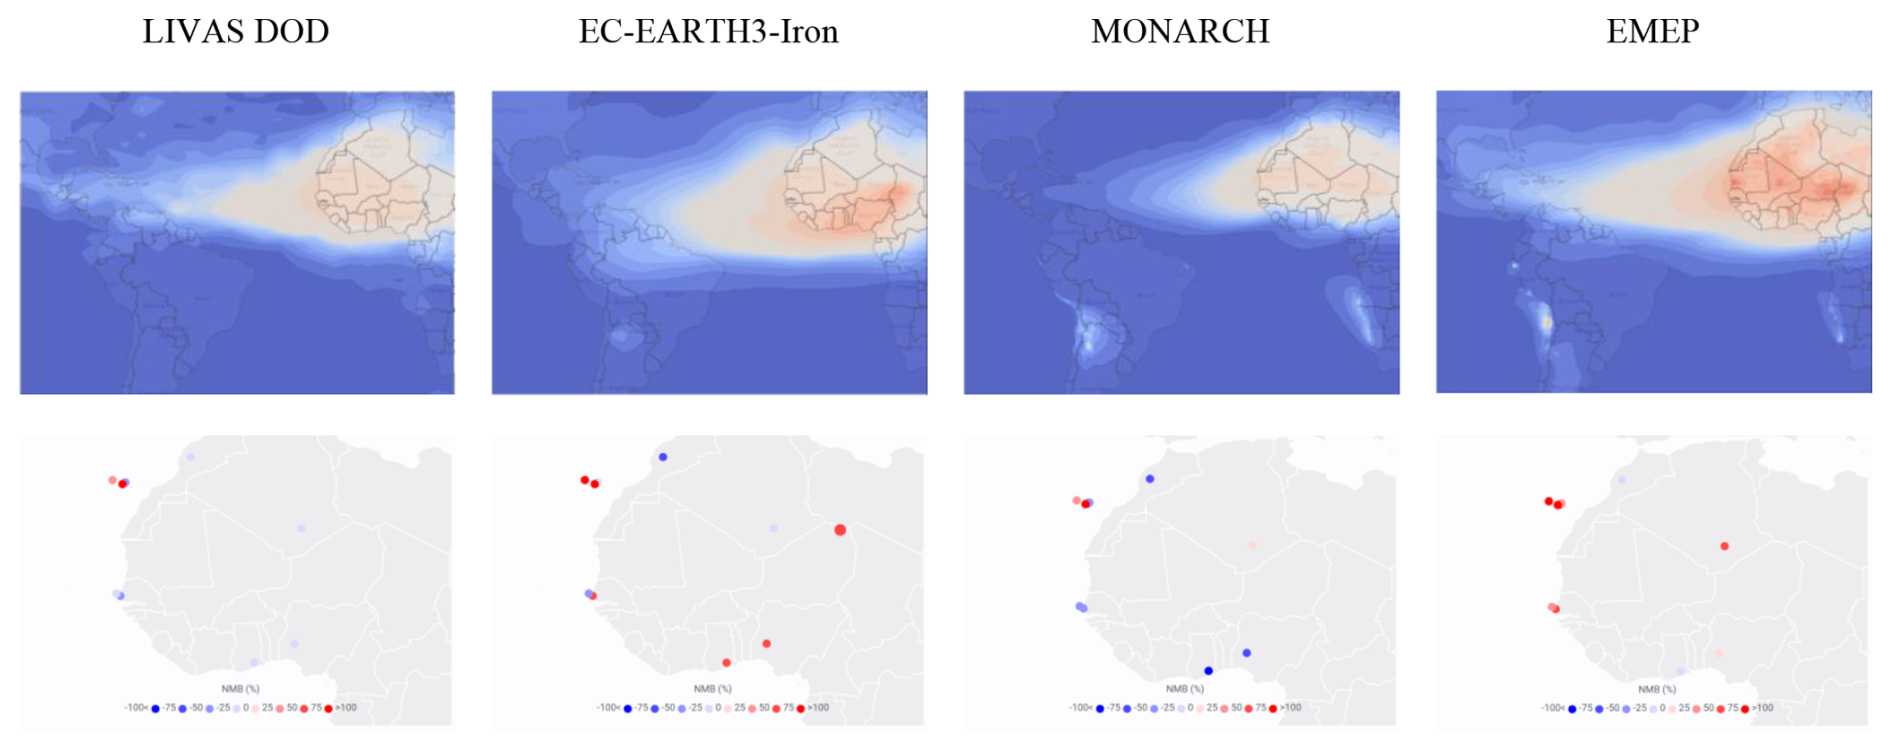
Figure 11Yearly mean DOD (upper panels) and normalized mean bias with respect to AERONET coarse-mode AOD (lower panels) for LIVAS, EC-Earth3, MONARCH, and EMEP for the year 2020. On the lower maps, AERONET data are also presented (circles).
The maps of yearly mean DOD from the LIVAS product and simulated by the EC-Earth3, EMEP, and MONARCH models presented in Fig. 11 (upper panels) show similar patterns of spatial distribution, representing the emissions of dust in the African deserts and its westward outflow over the Atlantic Ocean. EC-Earth3 simulates the largest values of DOD, followed by MONARCH, LIVAS, and EMEP. The lower panels in Fig. 11 show the yearly normalized mean biases of LIVAS and modeled DOD with respect to AERONET coarse-mode AOD. The observations with acceptable time coverage (over 50 %) within the LIVAS estimated area were available from 12 AERONET sites: six continental sites and six sites west of the African coast (i.e., on Tenerife, Cabo Verde, and La Palma). LIVAS DOD is around 20 %–30 % lower compared to AERONET coarse-mode AOD at the continental sites and in Cabo Verde, while it is 47 % higher on La Palma. For the sites on Tenerife, we see both under- and overestimation by LIVAS. LIVAS DOD is higher than AERONET coarse-mode AOD at the mountain sites, i.e., at Izaña (2410 m a.s.l.) by 44 % and at Teide (3555 m a.s.l.) by a factor of 5.5, where the greatest overestimation occurs from October through December (the only available observations at Teide). On the other hand, LIVAS underestimates by around 45 % observations at La Laguna and Santa Cruz de Tenerife (observations available only for January–June and December), with the largest bias in June–July.
The largest difference among the models is that MONARCH, and especially EC-Earth3, simulates larger dust emissions from the Sahel desert compared to EMEP. DOD from MONARCH is the closest to AERONET coarse-mode AOD south of Sahel; EC-Earth3 overestimates it by 60 %–70 %, while EMEP underestimates it by 70 %–80 %. The agreement is better between EMEP DOD and AERONET at the site located in the Sahara, whereas EC-Earth3 underestimates and MONARCH overestimates AERONET coarse-mode AOD at this site, respectively. MONARCH overestimates AERONET coarse-mode AOD at the African coastal sites and the islands. At the low-altitude sites on Tenerife and Cabo Verde, DODs from LIVAS and EC-Earth3 are closer to those of AERONET, while EMEP underestimates and MONARCH overestimates those. LIVAS and all three ESMs are biased rather high at all high-elevation AERONET sites (i.e., Tenerife and La Palma).
The monthly variation of EO-based DOD and modeled DOD vs AERONET coarse-mode AOD at all considered sites are shown in Fig. 12 (left panel). As described above, the EO-based DOD at 523 nm and ESM dust outputs include both the fine-mode and coarse-mode dust components, while the AERONET AOD at 550 nm component represents the coarse-mode fraction of dust, which probably contributes to increasing comparison uncertainties.
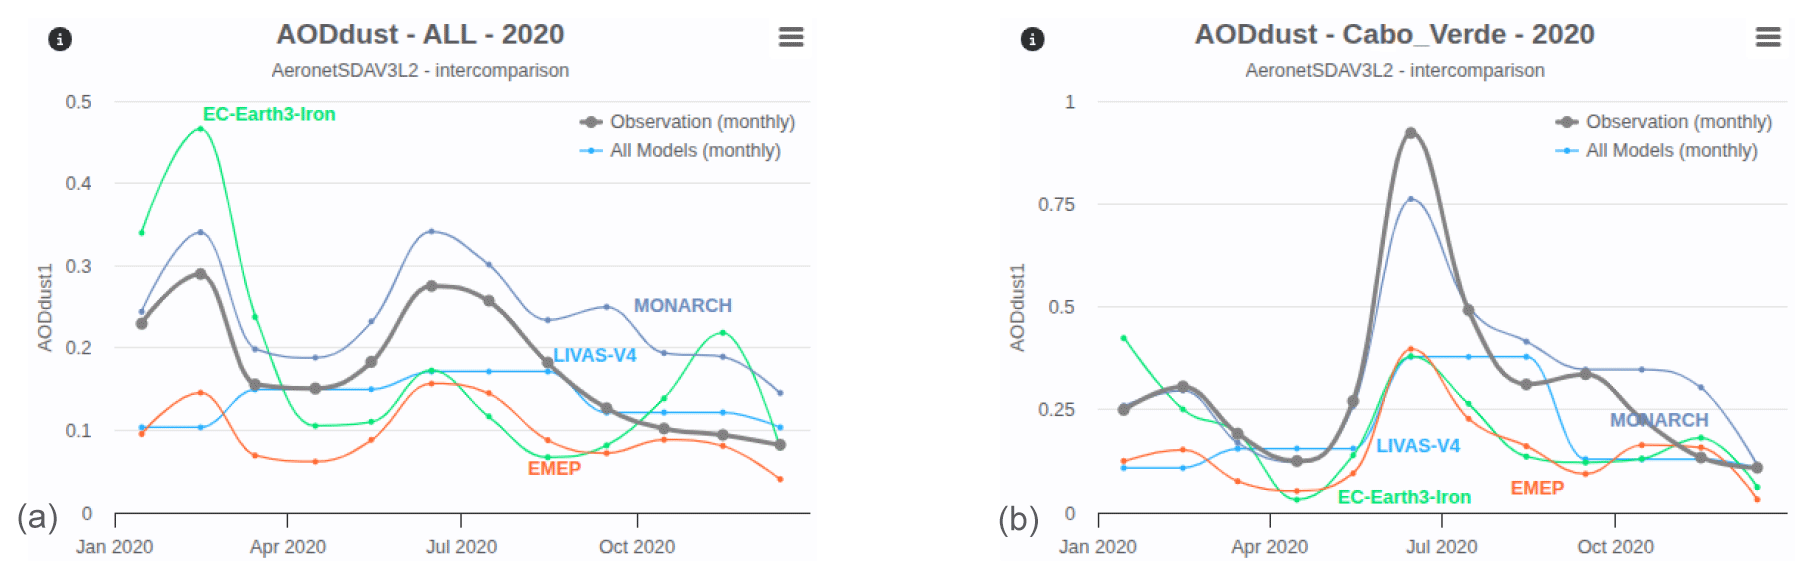
Figure 12Monthly series (a) comparing the EO-based DOD, the DOD simulated by the models (EC-EARTH3-Iron, MONARCH, and EMEP), and the AERONET coarse-mode AOD at all the sites shown in Fig. 11, and the monthly series for Cabo Verde (b) for the year 2020.
The monthly time series of LIVAS and the modeled DOD, compared in Fig. 12, reflect the seasonality in African dust emissions, transport, and deposition. The left panel of Fig. 12 shows that, averaged over the 12 AERONET sites, the observed temporal pattern of coarse dust AOD is reasonably well reproduced by the models (with EMEP and MONARCH being consistently biased low and high, respectively, while EC-Earth3-Iron shifts from overestimation in the cold season to underestimation in the warm season). The monthly profile from LIVAS lies well within the modeled spread of monthly DODs, though it looks smoother because seasonal mean DOD was used for all 3 months within the season. LIVAS tends to underestimate DOD for January–February, which is particularly pronounced at two sites in Tenerife (La Laguna and Santa Cruz), which could, to some extent, be explained by using the DJF seasonal mean. Similar to EC-Earth3-Iron and EMEP, LIVAS also underestimates in June–July (which is mostly driven by underestimation beyond the main dust emission regions, i.e., at the coastal and island-type sites). The right panel of Fig. 12 compares the monthly time series of EO-based and modeled DOD and coarse-mode AOD at Cabo Verde – a location representative of the dust plume transported westward off the African deserts over the subtropical eastern North Atlantic. LIVAS DOD variation is very close to those simulated by EC-Earth3-Iron and EMEP, underestimating the AERONET data, especially in June 2020. The overall evaluation statistics (bias and spatial correlation) for LIVAS and the modeled DOD with respect to AERONET coarse-mode AOD are summarized in Table 8.
Table 8Overall evaluation statistics in terms of normalized bias and spatial correlation for the LIVAS DOD at 532 nm and the modeled DOD with respect to AERONET coarse-mode AOD (SDA V3 L2) for the year 2020.
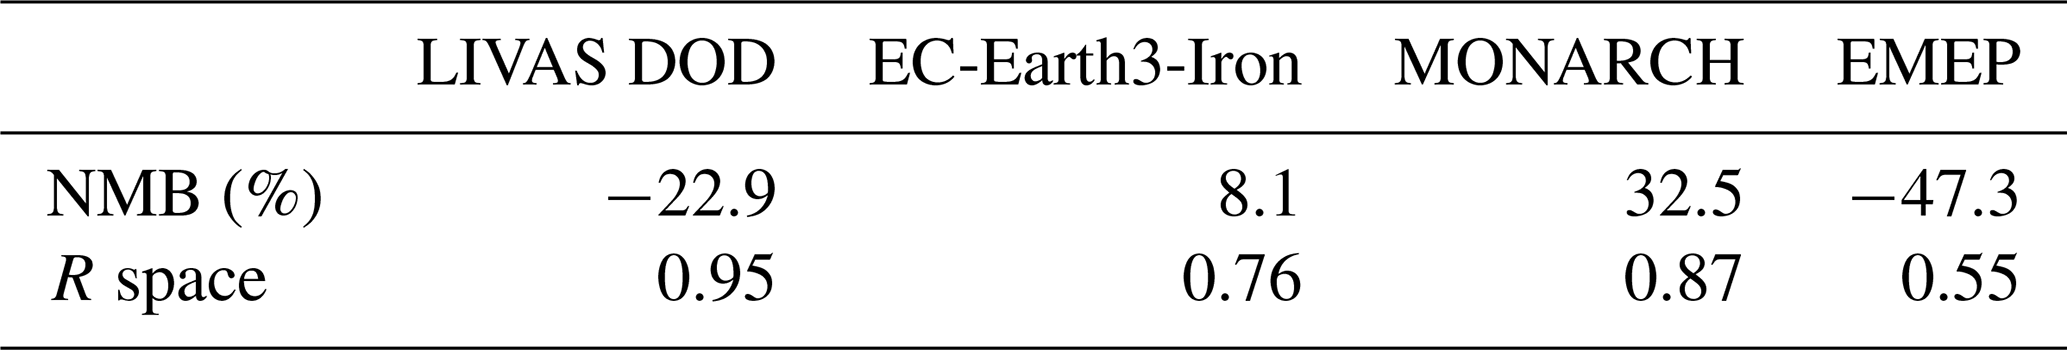
In a further comparison, we assess the models' results against the LIVAS DOD at 532 nm data. The comparison is done on a monthly basis at 2° × 2° grid cells with the available LIVAS DOD at 532 nm data. Figure 13 presents the maps of normalized mean biases with respect to LIVAS for EC-Earth3, MONARCH, and EMEP. Over the African deserts, MONARCH (which includes dust particles up to 20 µm in diameter), EC-Earth3, and EMEP have relatively small biases (especially EC-Earth3), i.e., positive in eastern–southeastern parts of the Sahara and slightly negative in central/western parts. MONARCH also simulates DOD higher than LIVAS over the subtropical North Atlantic and in the eastern part of the South Atlantic Ocean. EC-Earth3 has quite small (positive and negative, respectively) biases compared to LIVAS DOD in the grid cells over the North Atlantic Ocean, whereas it overestimates over its equatorial part and the South Atlantic Ocean. The EMEP results are quite close to LIVAS DOD over the Atlantic north of the Equator but underestimates over the South Atlantic Ocean. It should be noted that due to a rather simplified description of AOD in the EMEP model, the uncertainties in DOD modeling are associated with both dust three-dimensional concentrations and assumptions for dust-specific extinction.
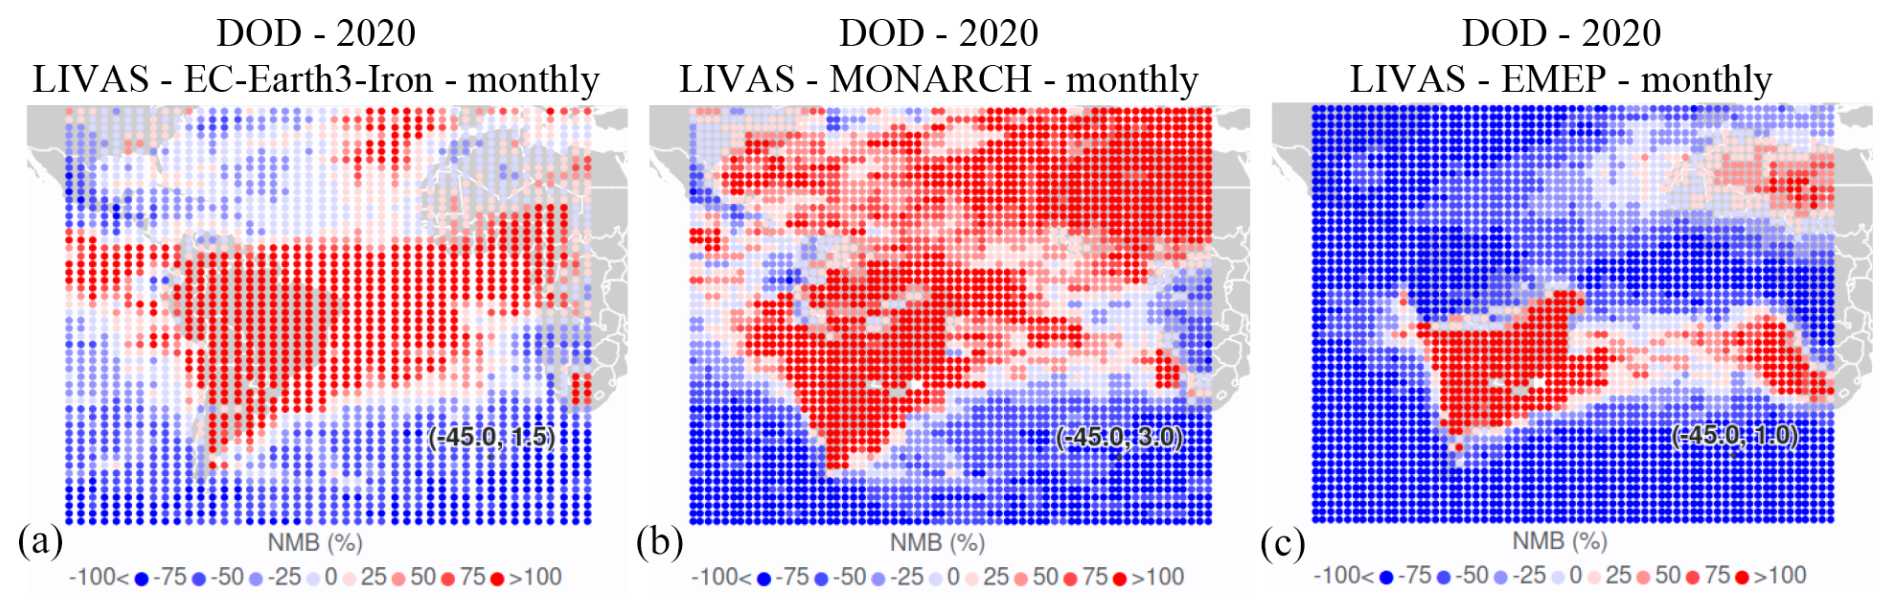
Figure 13Normalized mean bias of modeled DOD compared with LIVAS data for EC-Earth3 (a), MONARCH (b), and EMEP (c).
The maps of the yearly mean dust total (dry and wet) deposition rate, established on the basis of LIVAS and simulated with the EC-Earth3-Iron, EMEP, and MONARCH models, are shown in Fig. 14. The general pattern of dust deposition over the Atlantic Ocean is quite similar, though the models simulated dust deposition rates smaller than the EO-based dust deposition rate estimates, with the MONARCH results being closer to those and EC-Earth3-Iron providing the lowest dust deposition rates in terms of magnitude. Figure 15 presents the maps of relative biases for the dust deposition rate from the three ESMs with respect to the estimates of the present study. Along the dust plume core, EC-Earth3-Iron has the largest negative bias (mostly around −65 % to −80 %), EMEP mostly underestimates (with the bias varying mostly between 30 % and 60 %), and MONARCH has the lowest bias (an order of 15 %–40 %). Zonally, the models' biases remain quite similar across the Atlantic Ocean to almost as far as the Caribbean Sea, indicating similar east-to-west dust deposition gradients. However, over the Caribbean Sea, the models' underestimation of the LIVAS dust deposition increases. To the north and south of the main dust plume, the models' results show smaller negative and positive biases with respect to the LIVAS dust deposition, respectively.
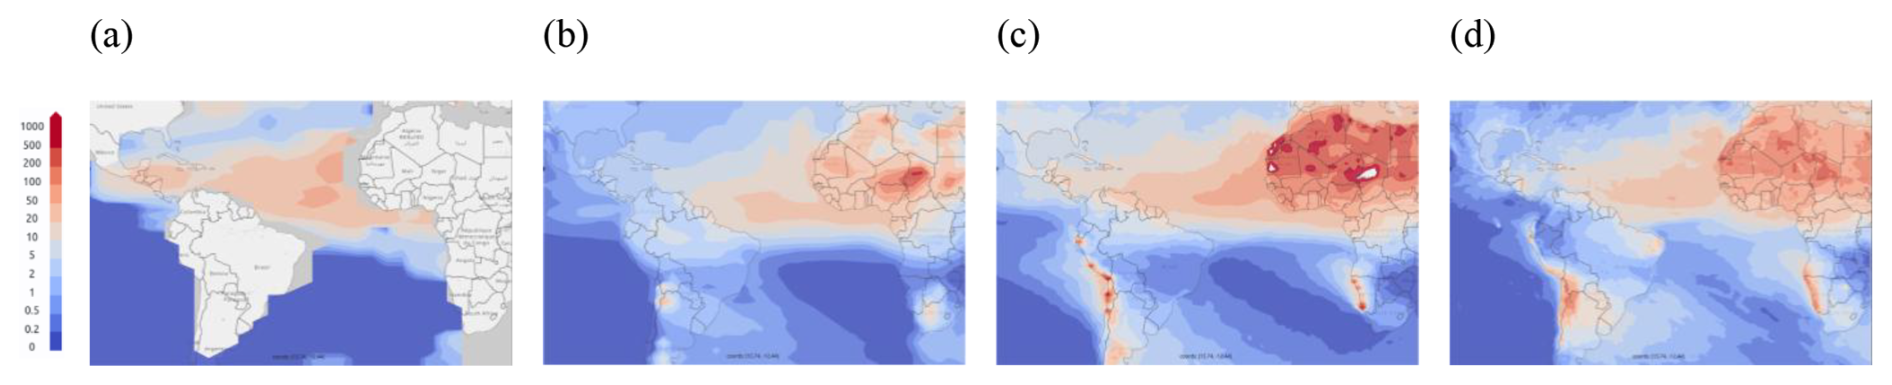
Figure 14Yearly mean dust deposition rate (mg m−2 d−1) from LIVAS (a) and simulated with EC-Earth3-Iron (b), MONARCH (c), and EMEP (d). Year: 2020.
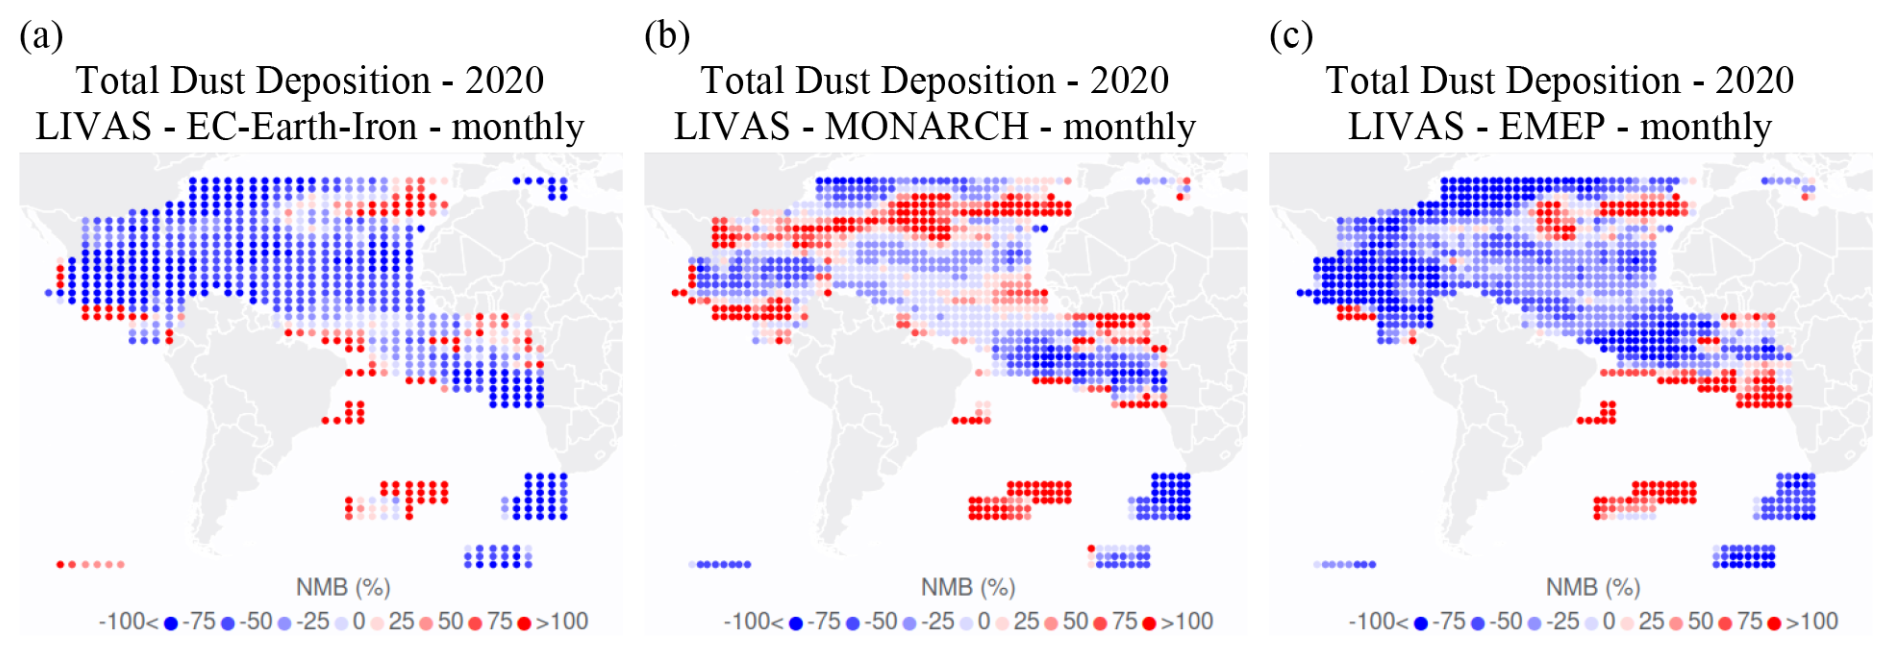
Figure 15Yearly mean bias (mg m−2 d−1) for dust total deposition for EC-Earth3_Iron (a), MONARCH (b), and EMEP (c) with respect to the LIVAS data for the year 2020. Here, the empty grid cells are those without LIVAS data.
The time series in Fig. 16 compare profiles of DOD (a) and deposition rate (b) simulated by the three models and those produced by LIVAS. The profiles are the averages over all 2° × 2° grid cells with LIVAS data. The EMEP model shows better agreement with LIVAS DOD, slightly underestimating it. EC-Earth3-Iron overestimates LIVAS DOD for January to March, showing quite good correspondence otherwise. MONARCH simulated DOD higher than LIVAS throughout the year. For dust deposition, none of the models manages to reproduce the LIVAS summer maximum, with EC-Earth3-Iron underestimating LIVAS the most and simulating winter/autumn maxima instead. The reported higher dust deposition by LIVAS compared to the ESMs relates, among others, to the historic “Godzilla” dust intrusion over the Atlantic Ocean in June 2020, with the atmospheric dust load substantially underestimated by dust models (Yu et al., 2021) and the dust removal processes more efficiently removing dust layers from the atmosphere (Yu et al., 2019; Kim et al., 2014). For the other seasons, MONARCH overestimates the LIVAS dust deposition, while the EMEP and Earth3-Iron dust deposition rates are quite close to LIVAS.
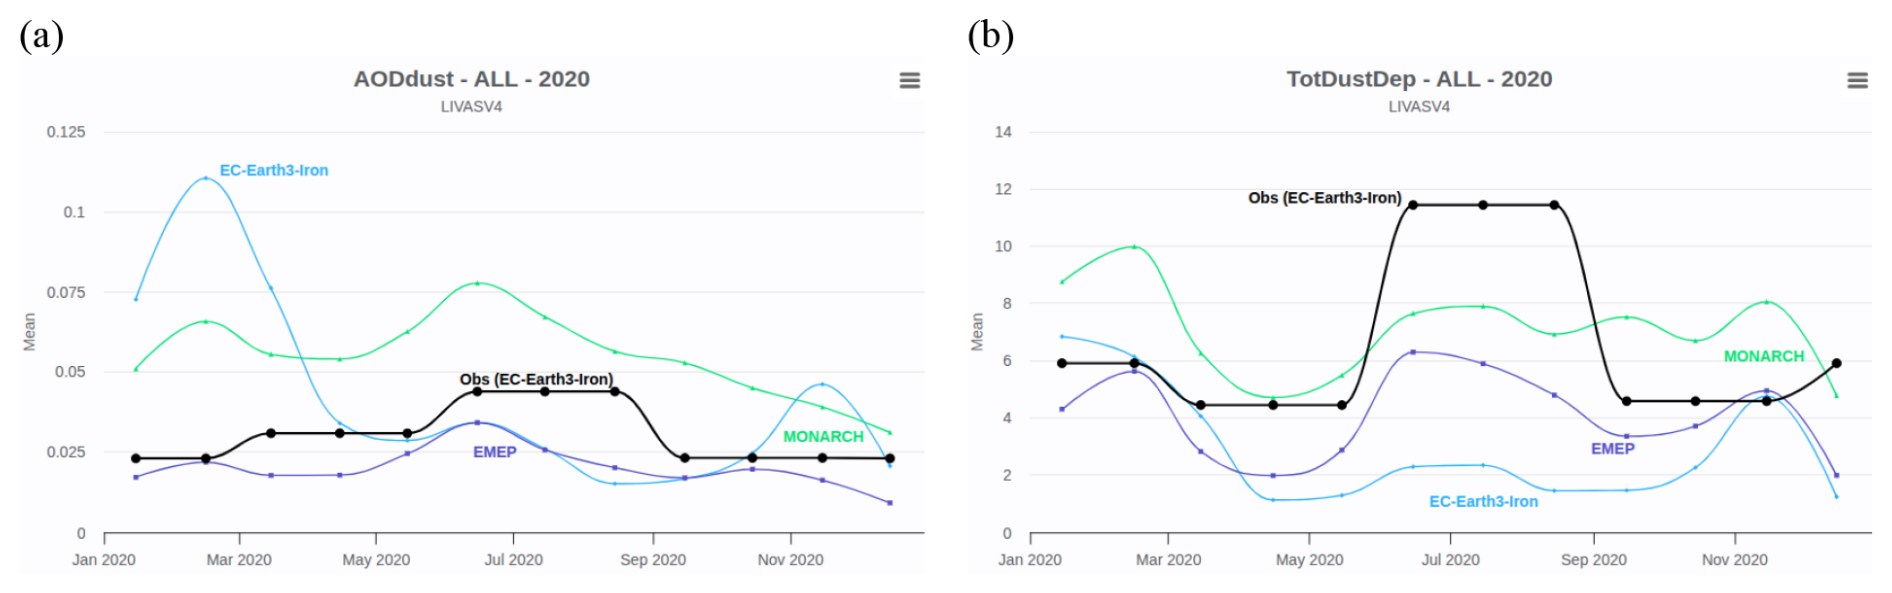
Figure 16Monthly series of EO-based DOD and dust total deposition (Obs, black line) and those of EC-Earth3, MONARCH, and EMEP (models' results are collocated with LIVAS data at grid cells of 2° × 2°).
The overall evaluation statistics (bias and spatial correlation) for the model-simulated DOD and deposition rate with respect to the LIVAS data are summarized in the heatmaps (Fig. 17). Those are yearly mean statistics, averaged over all grid cells of 2° × 2° where LIVAS data available. The spatial correlation between the models and LIVAS is quite high (between 0.7 and 0.94). The EMEP model underestimates both DOD and deposition by about 35 %, which partly could be due to somewhat lower African dust emissions compared with LIVAS (as seen from a comparison with AERONET coarse-mode AOD (Figs. 11–12)). EC-Earth3-Iron overestimates LIVAS DOD by 42 % but underestimates LIVAS dust deposition by 55 %. The largest positive bias with respect to the LIVAS data is seen for DOD from MONARCH (81 %), while its dust deposition is quite close to that from LIVAS.
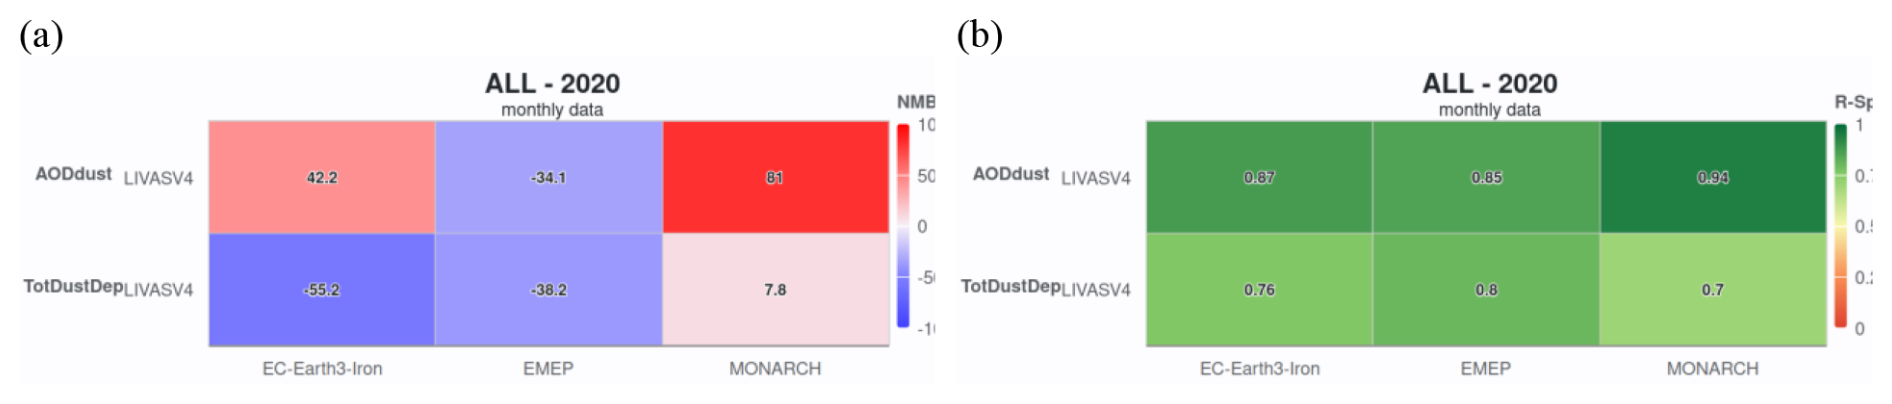
Figure 17Summary of statistics (relative bias and NMB (%) (a) and spatial correlation and R space (b)) of the models' comparison with the LIVAS DOD and total deposition.
The CALIPSO Level 2 data products are publicly available from the Atmospheric Science Data Center at the NASA Langley Research Center (https://earthdata.nasa.gov/eosdis/daacs/asdc, EARTHDATA; last access: 23 November 2023). The ESA-LIVAS climate data record in terms of Level 2 and Level 3 pure-dust products (i.e., backscatter coefficient at 532 nm, extinction coefficient at 532 nm, and mass concentration profiles and DOD at 532 nm) is available upon personal communication with Emmanouil Proestakis (proestakis@noa.gr) and/or Vassilis Amiridis (vamoir@noa.gr). The data from AERONET can be freely obtained from https://aeronet.gsfc.nasa.gov (last access: 23 November 2023). The satellite-based dust deposition climate data record is available through the Zenodo repository: https://doi.org/10.5281/zenodo.14608539 (Proestakis et al., 2025).
Atmospheric dust deposition across the open ocean fertilizes marine ecosystems with essential nutrients (e.g., N, P, SiO2, Fe), regulating phytoplankton growth and modulating marine productivity, ocean color, and the global carbon cycle, eventually affecting weather and climate. However, despite the vital role of atmospheric deposited lithogenic material for the ocean biogeochemistry and for dust-cycle-related processes, the amount of atmospheric dust that is actually deposited into the open ocean remains poorly quantified. Significant challenges related to the complexity of oceanographic research prevent long-term, high-coverage in situ measurements, while numerical model simulations rely on highly parameterized dust processes and variable assumptions, with few constraints.
This study provides and discusses a novel satellite-based climate data record of dust deposition rate estimates (mg m−2 d−1) for the broader Atlantic Ocean region, confined between 60° S and 40° N, at 5° (zonal) × 2° (meridional) spatial resolution, at seasonal-mean temporal resolution, and for the period December 2006–November 2022. Dust deposition rates are derived from atmospheric dust fluxes using two central enabling components: (1) the four-dimensional structure of dust aerosols in the atmosphere in terms of mass concentration (µg m−3) provided by the ESA-LIVAS climate data record, established based on the one-step POLIPHON technique applied to CALIPSO-CALIOP observations at 532 nm, and (2) the eastward and northward wind components (m s−1) provided by the ECMWF ERA5 reanalysis. Synergistic implementation of the two datasets provides the capacity to estimate dust mass fluxes (mg m−2 d−1) into the ocean by differentiating zonal and meridional input/output dust fluxes across conceptual cuboid atmospheric columns and on the basis of the mass conservation principle.
To verify accuracy, ensure reliability, and quantify uncertainties of the satellite-based dust deposition rate estimates, sediment-trap observations were used as reference datasets. Despite inherent uncertainties and methodological discrepancies, good agreement was found between satellite-based estimates and sediment-trap data (slope: 0.85, intercept: 9.49 mg m−2 d−1, and Pearson correlation coefficient: 0.79), although the satellite-based estimates tend to overestimate in situ observations (mean bias: 5.42 mg m−2 d−1, relative bias: 19.82 %, and RMSE: 30.3 mg m−2 d−1). Because the capacity of the ESA-LIVAS climate data record to accurately provide the spatiotemporal variability of the atmospheric dust is crucial to quantify the dust deposited component across the dust transport pathways over the open ocean, the DOD at 532 nm product was additionally evaluated against AERONET SDA coarse-mode AOD at 500 nm, showing high quality (normalized mean bias of 0.4 %, Pearson correlation coefficient of 0.77). AeroVal intercomparisons between the satellite-based dust deposition product and MONARCH, EMEP MSC-W, and EC-Earth3-Iron ESMs for the year 2020 revealed strong consistency, with normalized mean biases of 9.2 %, −50.2 %, and 38.1 % and Pearson correlation coefficients of 0.87, 0.85, and 0.93, respectively. Cross-comparison of the dust deposition rates showed reasonable agreement, within a factor of 2. Overall, the satellite product reliably reproduces spatiotemporal dust deposition patterns across the Atlantic Ocean, aligning with sediment-trap measurements and ESM outputs, while capturing seasonal dust source activation and the migration of transport pathways.
The study reports an annual-mean amount of dust deposition into the broader Atlantic Ocean of 274.79 ± 31.64 Tg yr−1, of which 243.98 ± 23.89 Tg yr−1 of dust is deposited into the North Atlantic Ocean and 30.81 ± 10.49 Tg yr−1 of dust is deposited into the South Atlantic Ocean each year. Seasonally, deposition peaks in summer (93.10 ± 11.65 Tg, JJA) and is lowest in autumn (40.62 ± 11.44 Tg, SON), with intermediate levels in spring (77.3 ± 19.93 Tg) and winter (63.78 ± 12.03 Tg). Comparison of the satellite-based estimates of dust deposition (December 2006–November 2022 average) with the average of documented model-based and satellite-based estimates of dust deposition over the broader Atlantic Ocean, the North Atlantic Ocean, and the South Atlantic Ocean was performed. The intercomparison reveals larger dust deposition estimates of our satellite-based dust deposition product with respect to the average of all documented dust deposition estimates of 29.36 Tg yr−1 (11.96 %) across the broader Atlantic Ocean, of 49.68 Tg yr−1 (25.57 %) across the North Atlantic Ocean, and of 1.24 Tg yr−1 (4.21 %) across the South Atlantic Ocean, falling, though, well within each other's variability, within one standard deviation. It should be noted that the EO-based outcomes on the basis of observations between December 2006 and November 2022 reveal a negative statistically significant trend in the Atlantic Ocean dust deposition, characterized by a slope of −13.35 Tg yr−1 and an offset of 306.97 Tg.
The satellite-based dust deposition climate data record is considered unique with respect to a diverse range of potential applications. These include filling spatial and temporal gaps in sediment-trap observational datasets (thus extending their limited coverage), evaluating model simulations, and elucidating physical processes involved in the dust cycle from emission to transport and eventually deposition. The dust deposition estimates can further be used to address major knowledge gaps in marine sciences and advance our capacity to better understand, describe, and predict complex and poorly understood processes, including the impact of deposited dust nutrients on the sustainability of the Atlantic Ocean biogeochemistry, and in this way enhance science-based effective adaptation and mitigation strategies to preserve the oceans under ongoing climate change.
EP: conceptualization, methodology, software, data curation, formal analysis. VA: methodology, supervision, conceptualization. CPGP: methodology, supervision, conceptualization. ST: software, formal analysis, visualization. JG: software, formal analysis, visualization. AG: methodology, formal analysis, conceptualization. TG: software. MGA: software, methodology, formal analysis. EBM: software, methodology, formal analysis. SM: software, methodology, formal analysis. EDT: software, methodology, formal analysis. SB: project administration. JBS: validation, investigation, data curation. JE: software, methodology, formal analysis. AB: project administration, supervision, conceptualization.
The contact author has declared that none of the authors has any competing interests.
Publisher’s note: Copernicus Publications remains neutral with regard to jurisdictional claims made in the text, published maps, institutional affiliations, or any other geographical representation in this paper. While Copernicus Publications makes every effort to include appropriate place names, the final responsibility lies with the authors.
This research was supported by the Dust Observation and Modelling Study (DOMOS) under ESA contract number 4000135024/21/I-NB. Emmanouil Proestakis acknowledges support from the AXA Research Fund for postdoctoral researchers under the project entitled “Earth Observation for Air-Quality – Dust Fine-Mode (EO4AQ-DustFM)”. The support of scientific project officer Simon Pinnock is gratefully acknowledged. We would like to thank the NASA CALIPSO team and NASA/LaRC/ASDC for making the CALIPSO products available, which have been used to build the LIVAS products, and ESA, who funded the LIVAS project (contract no. 4000104106/11/NL/FF/fk). We thank AERONET (https://aeronet.gsfc.nasa.gov/, last access: 7 January 2024) and AERONET-Europe for the data collection, calibration, processing, and dissemination. We thank ECMWF for providing the fifth-generation ERA5 reanalysis data and the Marenostrum5 support team and Computational Earth Sciences team of BSC for their support in maintaining and using the HPC infrastructure. We would like to thank the anonymous reviewers, who were very helpful and who provided constructive comments that helped us improve the paper.
Carlos Pérez García-Pando, Elisa Bergas Masso, María Gonçalves Ageitos, Jeronimo Escribano, and Enza Di Tomaso were funded by the ESA-DOMOS contract and acknowledge the funding received through the AXA-Chair in Sand and Dust Storms. Emmanouil Proestakis has been supported by the AXA Research Fund (Earth Observation for Air-Quality – Dust Fine-Mode (EO4AQ-DustFM). Jan-Berend W. Stuut was funded by NWO with the TRAFFIC project 822.01.008 and the ERC with starting grant 311152: DUSTTRAFFIC. María Gonçalves Ageitos acknowledges the support of the BIOTA Spanish I+D+i Grant PID2022-139362OB-I00 funded by MICIU/AEI/10.13039/501100011033 and by ERDF, EU. This research has been supported by the European Space Agency (grant no. 4000135024/21/I-NB) and the AXA Research Fund (grant no. EO4AQ-DustFM).
This paper was edited by Martin Wild and reviewed by two anonymous referees.
Abouchami, W., Näthe, K., Kumar, A., Galer, S. J. G., Jochum, K. P., Williams, E., Horbe, A. M. C., Rosa, J. W. C., Balsam, W., Adams, D., Mezger, K., and Andreae, M. O.: Geochemical and isotopic characterization of the Bodélé Depression dust source and implications for transatlantic dust transport to the Amazon Basin, Earth Planet. Sc. Lett., 380, 112–123, https://doi.org/10.1016/j.epsl.2013.08.028, 2013.
Adams, A. M., Prospero, J. M., and Zhang, C.: CALIPSO-Derived Three-Dimensional Structure of Aerosol over the Atlantic Basin and Adjacent Continents, J. Climate, 25, 6862–6879, https://doi.org/10.1175/JCLI-D-11-00672.1, 2012.
Adebiyi, A., Kok, J. F., Murray, B. J., Ryder, C. L., Stuut, J.-B. W., Kahn, R. A., Knippertz, P., Formenti, P., Mahowald, N. M., Pérez García-Pando, C., Klose, M., Ansmann, A., Samset, B. H., Ito, A., Balkanski, Y., Di Biagio, C., Romanias, M. N., Huang, Y., and Meng, J.: A review of coarse mineral dust in the Earth system, Aeolian Res., 60, 100849, https://doi.org/10.1016/j.aeolia.2022.100849, 2023.
Adler, R. F., Sapiano, M. R. P., Huffman, G. J., Wang, J.-J., Gu, G., Bolvin, D., Chiu, L., Schneider, U., Becker, A., Nelkin, E., Xie, P., Ferraro, R., and Shin, D.-B.: The Global Precipitation Climatology Project (GPCP) Monthly Analysis (New Version 2.3) and a Review of 2017 Global Precipitation, Atmosphere, 9, 138, https://doi.org/10.3390/atmos9040138, 2018.
Albani, S., Mahowald, N. M., Perry, A. T., Scanza, R. A., Zender, C. S., Heavens, N. G., Maggi, V., Kok, J. F., and Otto-Bliesner, B. L.: Improved dust representation in the Community Atmosphere Model, J. Adv. Model. Earth Sy., 6, 541–570, https://doi.org/10.1002/2013MS000279, 2014.
Alfaro, S. D. and Gomes, L.: Modeling mineral aerosol production by wind erosion: Emission intensities and aerosol size distributions in source areas., J. Geophys. Res., 106, 18075–18084, https://doi.org/10.1029/2000jd900339, 2001.
Alldredge, A. L., Granata, T. C., Gotschalk, C. C., and Dickey, T. D.: The physical strength of marine snow and its implications for particle disaggregation in the ocean, Limnol. Oceanogr., 35, 1415–1428, https://doi.org/10.4319/lo.1990.35.7.1415, 1990.
Amiridis, V., Wandinger, U., Marinou, E., Giannakaki, E., Tsekeri, A., Basart, S., Kazadzis, S., Gkikas, A., Taylor, M., Baldasano, J., and Ansmann, A.: Optimizing CALIPSO Saharan dust retrievals, Atmos. Chem. Phys., 13, 12089–12106, https://doi.org/10.5194/acp-13-12089-2013, 2013.
Amiridis, V., Marinou, E., Tsekeri, A., Wandinger, U., Schwarz, A., Giannakaki, E., Mamouri, R., Kokkalis, P., Binietoglou, I., Solomos, S., Herekakis, T., Kazadzis, S., Gerasopoulos, E., Proestakis, E., Kottas, M., Balis, D., Papayannis, A., Kontoes, C., Kourtidis, K., Papagiannopoulos, N., Mona, L., Pappalardo, G., Le Rille, O., and Ansmann, A.: LIVAS: a 3-D multi-wavelength aerosol/cloud database based on CALIPSO and EARLINET, Atmos. Chem. Phys., 15, 7127–7153, https://doi.org/10.5194/acp-15-7127-2015, 2015.
Anav, A., Friedlingstein, P., Kidston, M., Bopp, L., Ciais, P., Cox, P., Jones, C., Jung, M., Myneni, R., and Zhu, Z.: Evaluating the Land and Ocean Components of the Global Carbon Cycle in the CMIP5 Earth System Models, J. Climate, 26, 6801–6843, https://doi.org/10.1175/JCLI-D-12-00417.1, 2013.
Ansmann, A., Wandinger, U., Rille, O. L., Lajas, D., and Straume, A. G.: Particle backscatter and extinction profiling with the spaceborne high-spectral-resolution Doppler lidar ALADIN: methodology and simulations, Appl. Optics, 46, 6606–6622, https://doi.org/10.1364/AO.46.006606, 2007.
Ansmann, A., Baars, H., Tesche, M., Müller, D., Althausen, D., Engelmann, R., Pauliquevis, T., and Artaxo, P.: Dust and smoke transport from Africa to South America: Lidar profiling over Cabo Verde and the Amazon rainforest, Geophys. Res. Lett., 36, https://doi.org/10.1029/2009GL037923, 2009a.
Ansmann, A., Tesche, M., Knippertz, P., Bierwirth, E., Althausen, D., Müller, D., and Schulz, O.: Vertical profiling of convective dust plumes in southern Morocco during SAMUM, Tellus B, 61, 340–353, https://doi.org/10.1111/j.1600-0889.2008.00384.x, 2009b.
Ansmann, A., Tesche, M., Gross, S., Freudenthaler, V., Seifert, P., Hiebsch, A., Schmidt, J., Wandinger, U., Mattis, I., Müller, D. and Wiegner, M.: The 16 April 2010 major volcanic ash plume over central Europe: EARLINET lidar and AERONET photometer observations at Leipzig and Munich, Germany, Geophys. Res. Lett., 37, https://doi.org/10.1029/2010GL043809, 2010.
Ansmann, A., Petzold, A., Kandler, K., Tegen, I., Wendisch, M., Müller, D., Weinzierl, B., Müller, T. and Heintzenberg, J.: Saharan Mineral Dust Experiments SAMUM–1 and SAMUM–2: what have we learned?, Tellus B, 63, 403–429, https://doi.org/10.1111/j.1600-0889.2011.00555.x, 2011.
Ansmann, A., Seifert, P., Tesche, M., and Wandinger, U.: Profiling of fine and coarse particle mass: case studies of Saharan dust and Eyjafjallajökull/Grimsvötn volcanic plumes, Atmos. Chem. Phys., 12, 9399–9415, https://doi.org/10.5194/acp-12-9399-2012, 2012.
Ansmann, A., Mamouri, R.-E., Hofer, J., Baars, H., Althausen, D., and Abdullaev, S. F.: Dust mass, cloud condensation nuclei, and ice-nucleating particle profiling with polarization lidar: updated POLIPHON conversion factors from global AERONET analysis, Atmos. Meas. Tech., 12, 4849–4865, https://doi.org/10.5194/amt-12-4849-2019, 2019.
Aslanoğlu, S. Y., Proestakis, E., Gkikas, A., Güllü, G., and Amiridis, V.: Dust Climatology of Turkey as a Part of the Eastern Mediterranean Basin via 9-Year CALIPSO-Derived Product, Atmosphere, 13, 733, https://doi.org/10.3390/atmos13050733, 2022.
Aumont, O., Ethé, C., Tagliabue, A., Bopp, L., and Gehlen, M.: PISCES-v2: an ocean biogeochemical model for carbon and ecosystem studies, Geosci. Model Dev., 8, 2465–2513, https://doi.org/10.5194/gmd-8-2465-2015, 2015.
Avila, A., Queralt-Mitjans, I., and Alarcón, M.: Mineralogical composition of African dust delivered by red rains over northeastern Spain, J. Geophys. Res.-Atmos., 102, 21977–21996, https://doi.org/10.1029/97JD00485, 1997.
Baars, H., Kanitz, T., Engelmann, R., Althausen, D., Heese, B., Komppula, M., Preißler, J., Tesche, M., Ansmann, A., Wandinger, U., Lim, J.-H., Ahn, J. Y., Stachlewska, I. S., Amiridis, V., Marinou, E., Seifert, P., Hofer, J., Skupin, A., Schneider, F., Bohlmann, S., Foth, A., Bley, S., Pfüller, A., Giannakaki, E., Lihavainen, H., Viisanen, Y., Hooda, R. K., Pereira, S. N., Bortoli, D., Wagner, F., Mattis, I., Janicka, L., Markowicz, K. M., Achtert, P., Artaxo, P., Pauliquevis, T., Souza, R. A. F., Sharma, V. P., van Zyl, P. G., Beukes, J. P., Sun, J., Rohwer, E. G., Deng, R., Mamouri, R.-E., and Zamorano, F.: An overview of the first decade of PollyNET: an emerging network of automated Raman-polarization lidars for continuous aerosol profiling, Atmos. Chem. Phys., 16, 5111–5137, https://doi.org/10.5194/acp-16-5111-2016, 2016.
Ben-Ami, Y., Koren, I., Rudich, Y., Artaxo, P., Martin, S. T., and Andreae, M. O.: Transport of North African dust from the Bodélé depression to the Amazon Basin: a case study, Atmos. Chem. Phys., 10, 7533–7544, https://doi.org/10.5194/acp-10-7533-2010, 2010.
Ben-Ami, Y., Koren, I., Altaratz, O., Kostinski, A., and Lehahn, Y.: Discernible rhythm in the spatio/temporal distributions of transatlantic dust, Atmos. Chem. Phys., 12, 2253–2262, https://doi.org/10.5194/acp-12-2253-2012, 2012.
Bergas-Massó, E., Gonçalves Ageitos, M., Myriokefalitakis, S., Miller, R. L., van Noije, T., Le Sager, P., Montané Pinto, G., and Pérez García-Pando, C.: Pre-Industrial, Present and Future Atmospheric Soluble Iron Deposition and the Role of Aerosol Acidity and Oxalate Under CMIP6 Emissions, Earth's Future, 11, e2022EF003353, https://doi.org/10.1029/2022EF003353, 2023.
Berrisford, P., Dee, D., Fielding, K., Fuentes, M., Kallberg, P., Kobayashi, S., and Uppala, S.: The ERA-interim archive, ERA report series, ECMWF, Reading, 1–16, 2009.
Bohlmann, S., Baars, H., Radenz, M., Engelmann, R., and Macke, A.: Ship-borne aerosol profiling with lidar over the Atlantic Ocean: from pure marine conditions to complex dust–smoke mixtures, Atmos. Chem. Phys., 18, 9661–9679, https://doi.org/10.5194/acp-18-9661-2018, 2018.
Bohlmann, S., Shang, X., Vakkari, V., Giannakaki, E., Leskinen, A., Lehtinen, K. E. J., Pätsi, S., and Komppula, M.: Lidar depolarization ratio of atmospheric pollen at multiple wavelengths, Atmos. Chem. Phys., 21, 7083–7097, https://doi.org/10.5194/acp-21-7083-2021, 2021.
Bory, A. J.-M. and Newton, P. P.: Transport of airborne lithogenic material down through the water column in two contrasting regions of the eastern subtropical North Atlantic Ocean, Global Biogeochem. Cy., 14, 297–315, https://doi.org/10.1029/1999GB900098, 2000.
Bory, A., Dulac, F., Moulin, C., Chiapello, I., Newton, P. P., Guelle, W., Lambert, C. E., and Bergametti, G.: Atmospheric and oceanic dust fluxes in the northeastern tropical Atlantic Ocean: how close a coupling?, Ann. Geophys., 20, 2067–2076, https://doi.org/10.5194/angeo-20-2067-2002, 2002.
Boyd, P. W. and Ellwood, M. J.: The biogeochemical cycle of iron in the ocean, Nat. Geosci., 3, 675–682, https://doi.org/10.1038/ngeo964, 2010.
Braun, S. A.: Reevaluating the Role of the Saharan Air Layer in Atlantic Tropical Cyclogenesis and Evolution, Mon. Weather Rev., 138, 2007–2037, https://doi.org/10.1175/2009MWR3135.1, 2010.
Bryant, R. G., Bigg, G. R., Mahowald, N. M., Eckardt, F. D., and Ross S. G.: Dust emission response to climate in southern Africa, J. Geophys. Res., 112, D09207, https://doi.org/10.1029/2005JD007025, 2007.
Burton, S. P., Ferrare, R. A., Vaughan, M. A., Omar, A. H., Rogers, R. R., Hostetler, C. A., and Hair, J. W.: Aerosol classification from airborne HSRL and comparisons with the CALIPSO vertical feature mask, Atmos. Meas. Tech., 6, 1397–1412, https://doi.org/10.5194/amt-6-1397-2013, 2013.
Capelle, V., Chédin, A., Siméon, M., Tsamalis, C., Pierangelo, C., Pondrom, M., Crevoisier, C., Crepeau, L., and Scott, N. A.: Evaluation of IASI-derived dust aerosol characteristics over the tropical belt, Atmos. Chem. Phys., 14, 9343–9362, https://doi.org/10.5194/acp-14-9343-2014, 2014.
Carlson, T. N. and Prospero, J. M.: The Large-Scale Movement of Saharan Air Outbreaks over the Northern Equatorial Atlantic, J. Appl. Meteorol. Clim., 11, 283–297, https://doi.org/10.1175/1520-0450(1972)011, 1972.
Carr, M.-E., Friedrichs, M. A. M., Schmeltz, M., Noguchi Aita, M., Antoine, D., Arrigo, K. R., Asanuma, I., Aumont, O., Barber, R., Behrenfeld, M., Bidigare, R., Buitenhuis, E. T., Campbell, J., Ciotti, A., Dierssen, H., Dowell, M., Dunne, J., Esaias, W., Gentili, B., Gregg, W., Groom, S., Hoepffner, N., Ishizaka, J., Kameda, T., Le Quéré, C., Lohrenz, S., Marra, J., Mélin, F., Moore, K., Morel, A., Reddy, T. E., Ryan, J., Scardi, M., Smyth, T., Turpie, K., Tilstone, G., Waters, K., and Yamanaka, Y.: A comparison of global estimates of marine primary production from ocean color, Deep-Sea Res. Pt. II, 53, 741–770, https://doi.org/10.1016/j.dsr2.2006.01.028, 2006.
Castellanos, P., Colarco, P., Espinosa, W. R., Guzewich, S. D., Levy, R. C., Miller, R. L., Chin, M., Kahn, R. A., Kemppinen, O., Moosmüller, H., Nowottnick, E. P., Rocha-Lima, A., Smith, M. D., Yorks, J. E., and Yu, H.: Mineral dust optical properties for remote sensing and global modeling: A review, Remote Sens. Environ., 303, 113982, https://doi.org/10.1016/j.rse.2023.113982, 2024.
Chin, M., Rood, R. B., Lin, S.-J., Müller, J.-F., and Thompson, A. M.: Atmospheric sulfur cycle simulated in the global model GOCART: Model description and global properties, J. Geophys. Res.-Atmos., 105, 24671–24687, https://doi.org/10.1029/2000JD900384, 2000.
Chin, M., Ginoux, P., Kinne, S., Torres, O., Holben, B. N., Duncan, B. N., Martin, R. V., Logan, J. A., Higurashi, A., and Nakajima, T.: Tropospheric Aerosol Optical Thickness from the GOCART Model and Comparisons with Satellite and Sun Photometer Measurements, J. Atmos. Sci., 59, 461–483, 2002.
Cuevas-Agulló, E., Barriopedro, D., García, R. D., Alonso-Pérez, S., González-Alemán, J. J., Werner, E., Suárez, D., Bustos, J. J., García-Castrillo, G., García, O., Barreto, Á., and Basart, S.: Sharp increase in Saharan dust intrusions over the western Euro-Mediterranean in February–March 2020–2022 and associated atmospheric circulation, Atmos. Chem. Phys., 24, 4083–4104, https://doi.org/10.5194/acp-24-4083-2024, 2024.
Cvetkovic, B., Dagsson-Waldhauserová, P., Petkovic, S., Arnalds, Ó., Madonna, F., Proestakis, E., Gkikas, A., Vukovic Vimic, A., Pejanovic, G., Rosoldi, M., Ceburnis, D., Amiridis, V., Lisá, L., Nickovic, S., and Nikolic, J.: Fully Dynamic High–Resolution Model for Dispersion of Icelandic Airborne Mineral Dust, Atmosphere, 13, 1345, https://doi.org/10.3390/atmos13091345, 2022.
Dee, D. P., Källén, E., Simmons, A. J., and Haimberger, L.: Comments on “Reanalyses Suitable for Characterizing Long-Term Trends,” B. Am. Meteorol. Soc., https://doi.org/10.1175/2010BAMS3070.1, 2011.
Doherty, O. M., Riemer, N., and Hameed, S.: Role of the convergence zone over West Africa in controlling Saharan mineral dust load and transport in the boreal summer, Tellus B, 66, 23191, https://doi.org/10.3402/tellusb.v66.23191, 2014.
Döscher, R., Acosta, M., Alessandri, A., Anthoni, P., Arsouze, T., Bergman, T., Bernardello, R., Boussetta, S., Caron, L.-P., Carver, G., Castrillo, M., Catalano, F., Cvijanovic, I., Davini, P., Dekker, E., Doblas-Reyes, F. J., Docquier, D., Echevarria, P., Fladrich, U., Fuentes-Franco, R., Gröger, M., v. Hardenberg, J., Hieronymus, J., Karami, M. P., Keskinen, J.-P., Koenigk, T., Makkonen, R., Massonnet, F., Ménégoz, M., Miller, P. A., Moreno-Chamarro, E., Nieradzik, L., van Noije, T., Nolan, P., O'Donnell, D., Ollinaho, P., van den Oord, G., Ortega, P., Prims, O. T., Ramos, A., Reerink, T., Rousset, C., Ruprich-Robert, Y., Le Sager, P., Schmith, T., Schrödner, R., Serva, F., Sicardi, V., Sloth Madsen, M., Smith, B., Tian, T., Tourigny, E., Uotila, P., Vancoppenolle, M., Wang, S., Wårlind, D., Willén, U., Wyser, K., Yang, S., Yepes-Arbós, X., and Zhang, Q.: The EC-Earth3 Earth system model for the Coupled Model Intercomparison Project 6, Geosci. Model Dev., 15, 2973–3020, https://doi.org/10.5194/gmd-15-2973-2022, 2022.
Drakaki, E., Amiridis, V., Tsekeri, A., Gkikas, A., Proestakis, E., Mallios, S., Solomos, S., Spyrou, C., Marinou, E., Ryder, C. L., Bouris, D., and Katsafados, P.: Modeling coarse and giant desert dust particles, Atmos. Chem. Phys., 22, 12727–12748, https://doi.org/10.5194/acp-22-12727-2022, 2022.
Dubovik, O., Sinyuk, A., Lapyonok, T., Holben, B. N., Mishchenko, M., Yang, P., Eck, T. F., Volten, H., Munõz, O., Veihelmann, B., van der Zande, W. J., Leon, J.-F., Sorokin, M., and Slutsker, I.: Application of spheroid models to account for aerosol particle nonsphericity in remote sensing of desert dust, J. Geophys. Res.-Atmos., 111, https://doi.org/10.1029/2005JD006619, 2006.
Duce, R. A., Liss, P. S., Merrill, J. T., Atlas, E. L., Buat-Menard, P., Hicks, B. B., Miller, J. M., Prospero, J. M., Arimoto, R., Church, T. M., Ellis, W., Galloway, J. N., Hansen, L., Jickells, T. D., Knap, A. H., Reinhardt, K. H., Schneider, B., Soudine, A., Tokos, J. J., Tsunogai, S., Wollast, R., and Zhou, M.: The atmospheric input of trace species to the world ocean, Global Biogeochem. Cy., 5, 193–259, https://doi.org/10.1029/91GB01778, 1991.
Dunion, J. P.: Rewriting the Climatology of the Tropical North Atlantic and Caribbean Sea Atmosphere, J. Climate, 24, 893–908, https://doi.org/10.1175/2010JCLI3496.1, 2011.
Eck, T. F., Holben, B. N., Reid, J. S., Dubovik, O., Smirnov, A., O'Neill, N. T., Slutsker, I., and Kinne, S.: Wavelength dependence of the optical depth of biomass burning, urban and desert dust aerosols, J. Geophys. Res., 104, 31333–31350, 1999.
Eckardt, F. D. and Kuring, N.: SeaWiFS identifies dust sources in the Namib Desert, Int. J. Remote Sens., 26, 4159–4167, 2005.
Engelstaedter, S., Tegen, I., and Washington, R.: North African dust emissions and transport, Earth-Sci. Rev., 79, 73–100, https://doi.org/10.1016/j.earscirev.2006.06.004, 2006.
Escribano, J., Di Tomaso, E., Jorba, O., Klose, M., Gonçalves Ageitos, M., Macchia, F., Amiridis, V., Baars, H., Marinou, E., Proestakis, E., Urbanneck, C., Althausen, D., Bühl, J., Mamouri, R.-E., and Pérez García-Pando, C.: Assimilating spaceborne lidar dust extinction can improve dust forecasts, Atmos. Chem. Phys., 22, 535–560, https://doi.org/10.5194/acp-22-535-2022, 2022.
Escribano, J., Di Tomaso, E., Jorba, O., Gonçalves Ageitos, M., Klose, M., Basart, S., and Pérez García-Pando, C.: Constraining spatio-temporal variations in dust emission at global scale with ensemble data assimilation of satellite optical depth retrievals, EGU General Assembly 2023, Vienna, Austria, 24–28 Apr 2023, EGU23-9569, https://doi.org/10.5194/egusphere-egu23-9569, 2023.
Esselborn, M., Wirth, M., Fix, A., Weinzierl, B., Rasp, K., Tesche, M., and Petzold, A.: Spatial distribution and optical properties of Saharan dust observed by airborne high spectral resolution lidar during SAMUM 2006, Tellus B, 61, 131–143, https://doi.org/10.1111/j.1600-0889.2008.00394.x, 2009.
Fairlie, T. D., Jacob, D. J., and Park, R. J.: The impact of transpacific transport of mineral dust in the United States, Atmos. Environ., 41, 1251–1266, https://doi.org/10.1016/j.atmosenv.2006.09.048, 2007.
Falkowski, P., Scholes, R. J., Boyle, E., Canadell, J., Canfield, D., Elser, J., Gruber, N., Hibbard, K., Högberg, P., Linder, S., Mackenzie, F. T., Moore III, B., Pedersen, T., Rosenthal, Y., Seitzinger, S., Smetacek, V., and Steffen, W.: The Global Carbon Cycle: A Test of Our Knowledge of Earth as a System, Science, 290, 291–296, https://doi.org/10.1126/science.290.5490.291, 2000.
Fiedler, S., Schepanski, K., Heinold, B., Knippertz, P., and Tegen, I.: Climatology of nocturnal low-level jets over North Africa and implications for modeling mineral dust emission, J. Geophys. Res.-Atmos., 118, 6100–6121, https://doi.org/10.1002/jgrd.50394, 2013.
Filioglou, M., Giannakaki, E., Backman, J., Kesti, J., Hirsikko, A., Engelmann, R., O'Connor, E., Leskinen, J. T. T., Shang, X., Korhonen, H., Lihavainen, H., Romakkaniemi, S., and Komppula, M.: Optical and geometrical aerosol particle properties over the United Arab Emirates, Atmos. Chem. Phys., 20, 8909–8922, https://doi.org/10.5194/acp-20-8909-2020, 2020.
Fischer, G., Donner, B., Ratmeyer, V., Davenport, R., and Wefer, G.: Distinct year-to-year particle flux variations off Cape Blanc during 1988–1991: relation to d18O-deduced sea-surface temperatures and trade winds, J. Mar. Res. 54, 73–98, https://doi.org/10.1357/0022240963213484, 1996.
Fischer, G. and Karakaş, G.: Sinking rates and ballast composition of particles in the Atlantic Ocean: implications for the organic carbon fluxes to the deep ocean, Biogeosciences, 6, 85–102, https://doi.org/10.5194/bg-6-85-2009, 2009.
Fischer, G., Romero, O., Merkel, U., Donner, B., Iversen, M., Nowald, N., Ratmeyer, V., Ruhland, G., Klann, M., and Wefer, G.: Deep ocean mass fluxes in the coastal upwelling off Mauritania from 1988 to 2012: variability on seasonal to decadal timescales, Biogeosciences, 13, 3071–3090, https://doi.org/10.5194/bg-13-3071-2016, 2016.
Floutsi, A. A., Baars, H., Engelmann, R., Althausen, D., Ansmann, A., Bohlmann, S., Heese, B., Hofer, J., Kanitz, T., Haarig, M., Ohneiser, K., Radenz, M., Seifert, P., Skupin, A., Yin, Z., Abdullaev, S. F., Komppula, M., Filioglou, M., Giannakaki, E., Stachlewska, I. S., Janicka, L., Bortoli, D., Marinou, E., Amiridis, V., Gialitaki, A., Mamouri, R.-E., Barja, B., and Wandinger, U.: DeLiAn – a growing collection of depolarization ratio, lidar ratio and Ångström exponent for different aerosol types and mixtures from ground-based lidar observations, Atmos. Meas. Tech., 16, 2353–2379, https://doi.org/10.5194/amt-16-2353-2023, 2023.
Foltz, R. G.: Satellite and in situ estimates of dust deposition in the tropical North Atlantic, Conference Proceedings, 1st International Conference on Atmospheric Dust – DUST2014, vol. 1, 156–161, https://doi.org/10.14644/dust.2014.025, 2014.
Foth, A., Kanitz, T., Engelmann, R., Baars, H., Radenz, M., Seifert, P., Barja, B., Fromm, M., Kalesse, H., and Ansmann, A.: Vertical aerosol distribution in the southern hemispheric midlatitudes as observed with lidar in Punta Arenas, Chile (53.2° S and 70.9° W), during ALPACA, Atmos. Chem. Phys., 19, 6217–6233, https://doi.org/10.5194/acp-19-6217-2019, 2019.
Freudenthaler, V., Esselborn, M., Wiegner, M., Heese, B., Tesche, M., Ansmann, A., Mueller, D., Althausen, D., Wirth, M., Fix, A., Ehret, G., Knippertz, P., Toledano, C., Gasteiger, J., Garhammer, M., and Seefeldner, A.: Depolarization ratio profiling at several wavelengths in pure Saharan dust during SAMUM 2006, Tellus B, 61, 165–179, https://doi.org/10.1111/j.1600-0889.2008.00396.x, 2009.
Friese, C. A., van Hateren, J. A., Vogt, C., Fischer, G., and Stuut, J.-B. W.: Seasonal provenance changes in present-day Saharan dust collected in and off Mauritania, Atmos. Chem. Phys., 17, 10163–10193, https://doi.org/10.5194/acp-17-10163-2017, 2017.
Gaiero, D. M., Probst, J.-L., Depetris, P. J., Bidart, S. M., and Leleyter, L.: Iron and other transition metals in Patagonian riverborne and windborne materials: geochemical control and transport to the southern South Atlantic Ocean, Geochim. Cosmochim. Ac., 67, 3603–3623, https://doi.org/10.1016/S0016-7037(03)00211-4, 2003.
Gao, Y., Fan, S.-M., and Sarmiento, J. L.: Aeolian iron input to the ocean through precipitation scavenging: A modeling perspective and its implication for natural iron fertilization in the ocean, J. Geophys. Res.-Atmos., 108, https://doi.org/10.1029/2002JD002420, 2003.
Garay, M. J., Witek, M. L., Kahn, R. A., Seidel, F. C., Limbacher, J. A., Bull, M. A., Diner, D. J., Hansen, E. G., Kalashnikova, O. V., Lee, H., Nastan, A. M., and Yu, Y.: Introducing the 4.4 km spatial resolution Multi-Angle Imaging SpectroRadiometer (MISR) aerosol product, Atmos. Meas. Tech., 13, 593–628, https://doi.org/10.5194/amt-13-593-2020, 2020.
Garnier, A., Scott, N. A., Pelon, J., Armante, R., Crépeau, L., Six, B., and Pascal, N.: Long-term assessment of the CALIPSO Imaging Infrared Radiometer (IIR) calibration and stability through simulated and observed comparisons with MODIS/Aqua and SEVIRI/Meteosat, Atmos. Meas. Tech., 10, 1403–1424, https://doi.org/10.5194/amt-10-1403-2017, 2017.
Gassó, S. and Torres, O.: Temporal characterization of dust activity in the Central Patagonia desert (years 1964–2017), J. Geophys. Res.-Atmos., 124, 3417–3434, https://doi.org/10.1029/2018JD030209, 2019.
Gassó, S., Stein, A., Marino, F., Castellano, E., Udisti, R., and Ceratto, J.: A combined observational and modeling approach to study modern dust transport from the Patagonia desert to East Antarctica, Atmos. Chem. Phys., 10, 8287–8303, https://doi.org/10.5194/acp-10-8287-2010, 2010.
Gates, W. L., Boyle, J. S., Covey, C., Dease, C. G., Doutriaux, C. M., Drach, R. S., Fiorino, M., Gleckler, P. J., Hnilo, J. J., Marlais, S. M., Phillips, T. J., Potter, G. L., Santer, B. D., Sperber, K. R., Taylor, K. E., and Williams, D. N.: An Overview of the Results of the Atmospheric Model Intercomparison Project (AMIP I), B. Am. Meteorol. Soc., 80, 29–56, https://doi.org/10.1175/1520-0477(1999)080<0029:AOOTRO>2.0.CO;2, 1999.
Getzewich, B. J., Vaughan, M. A., Hunt, W. H., Avery, M. A., Powell, K. A., Tackett, J. L., Winker, D. M., Kar, J., Lee, K.-P., and Toth, T. D.: CALIPSO lidar calibration at 532 nm: version 4 daytime algorithm, Atmos. Meas. Tech., 11, 6309–6326, https://doi.org/10.5194/amt-11-6309-2018, 2018.
Gidden, M. J., Riahi, K., Smith, S. J., Fujimori, S., Luderer, G., Kriegler, E., van Vuuren, D. P., van den Berg, M., Feng, L., Klein, D., Calvin, K., Doelman, J. C., Frank, S., Fricko, O., Harmsen, M., Hasegawa, T., Havlik, P., Hilaire, J., Hoesly, R., Horing, J., Popp, A., Stehfest, E., and Takahashi, K.: Global emissions pathways under different socioeconomic scenarios for use in CMIP6: a dataset of harmonized emissions trajectories through the end of the century, Geosci. Model Dev., 12, 1443–1475, https://doi.org/10.5194/gmd-12-1443-2019, 2019.
Ginoux, P., Chin, M., Tegen, I., Prospero, J. M., Holben, B., Dubovik, O., and Lin, S.-J.: Sources and distributions of dust aerosols simulated with the GOCART model, J. Geophys. Res.-Atmos., 106, 20255–20273, https://doi.org/10.1029/2000JD000053, 2001.
Ginoux, P., Prospero, J. M., Torres, O., and Chin, M.: Long-term simulation of global dust distribution with the GOCART model: correlation with North Atlantic Oscillation, Environ. Model. Softw., 19, 113–128, https://doi.org/10.1016/S1364-8152(03)00114-2, 2004.
Ginoux, P., Prospero, J. M., Gill, T. E., Hsu, N. C., and Zhao, M.: Global-scale attribution of anthropogenic and natural dust sources and their emission rates based on MODIS Deep Blue aerosol products, Rev. Geophys., 50, RG3005, https://doi.org/10.1029/2012RG000388, 2012.
Gittings, J. A., Dall'Olmo, G., Tang, W., Llort, J., Jebri, F., Livanou, E., Nencioli, F., Darmaraki, S., Theodorou, I., Brewin, R. J. W., Srokosz, M., Cassar, N., and Raitsos, D. E.: An exceptional phytoplankton bloom in the southeast Madagascar Sea driven by African dust deposition, PNAS Nexus, 3, pgae386, https://doi.org/10.1093/pnasnexus/pgae386, 2024.
Gkikas, A., Proestakis, E., Amiridis, V., Kazadzis, S., Di Tomaso, E., Marinou, E., Hatzianastassiou, N., Kok, J. F., and García-Pando, C. P.: Quantification of the dust optical depth across spatiotemporal scales with the MIDAS global dataset (2003–2017), Atmos. Chem. Phys., 22, 3553–3578, https://doi.org/10.5194/acp-22-3553-2022, 2022.
Gläser, G., Wernli, H., Kerkweg, A., and Teubler, F.: The transatlantic dust transport from North Africa to the Americas – Its characteristics and source regions, J. Geophys. Res.-Atmos., 120, 11231–11252, https://doi.org/10.1002/2015JD023792, 2015.
Gliß, J., Mortier, A., Schulz, M., Andrews, E., Balkanski, Y., Bauer, S. E., Benedictow, A. M. K., Bian, H., Checa-Garcia, R., Chin, M., Ginoux, P., Griesfeller, J. J., Heckel, A., Kipling, Z., Kirkevåg, A., Kokkola, H., Laj, P., Le Sager, P., Lund, M. T., Lund Myhre, C., Matsui, H., Myhre, G., Neubauer, D., van Noije, T., North, P., Olivié, D. J. L., Rémy, S., Sogacheva, L., Takemura, T., Tsigaridis, K., and Tsyro, S. G.: AeroCom phase III multi-model evaluation of the aerosol life cycle and optical properties using ground- and space-based remote sensing as well as surface in situ observations, Atmos. Chem. Phys., 21, 87–128, https://doi.org/10.5194/acp-21-87-2021, 2021.
Gnanadesikan, A., Emanuel, K., Vecchi, G. A., Anderson, W. G., and Hallberg, R.: How ocean color can steer Pacific tropical cyclones, Geophys. Res. Lett., 37, https://doi.org/10.1029/2010GL044514, 2010.
Gomes, L., Rajot, J. L., Alfaro, S. C., and Gaudichet, A.: Validation of a dust production model from measurements performed in semi-arid agricultural areas of Spain and Niger, Catena, 52, 257–271, 2003.
Gross, S., Tesche, M., Freudenthaler, V., Toledano, C., Wiegner, M., Ansmann, A., Althausen, D., and Seefeldner, M.: Characterization of Saharan dust, marine aerosols and mixtures of biomass-burning aerosols and dust by means of multi-wavelength depolarization and Raman lidar measurements during SAMUM 2, Tellus B, 63, 706–724, https://doi.org/10.1111/j.1600-0889.2011.00556.x, 2011a.
Gross, S., Wiegner, M., Freudenthaler, V., and Toledano, C.: Lidar ratio of Saharan dust over Cabo Verde Islands: Assessment and error calculation, J. Geophys. Res.-Atmos., 116, D15203, https://doi.org/10.1029/2010JD015435, 2011b.
Groß, S., Freudenthaler, V., Wiegner, M., Gasteiger, J., Geiss, A., and Schnell, F.: Dual-wavelength linear depolarization ratio of volcanic aerosols: Lidar measurements of the Eyjafjallajokull plume over Maisach, Germany, Atmos. Environ., 48, 85–96, https://doi.org/10.1016/j.atmosenv.2011.06.017, 2012.
Groß, S., Freudenthaler, V., Schepanski, K., Toledano, C., Schäfler, A., Ansmann, A., and Weinzierl, B.: Optical properties of long-range transported Saharan dust over Barbados as measured by dual-wavelength depolarization Raman lidar measurements, Atmos. Chem. Phys., 15, 11067–11080, https://doi.org/10.5194/acp-15-11067-2015, 2015.
Guerreiro, C. V., Baumann, K.-H., Brummer, G.-J. A., Korte, L. F., Sá, C., and Stuut, J.-B. W.: Transatlantic gradients in calcifying phytoplankton (coccolithophore) fluxes, Prog. Oceanogr., 176, 102140, https://doi.org/10.1016/j.pocean.2019.102140, 2019.
Guerreiro, C. V., Baumann, K.-H., Brummer, G.-J. A., Valente, A., Fischer, G., Ziveri, P., Brotas, V., and Stuut, J.-B. W.: Carbonate fluxes by coccolithophore species between NW Africa and the Caribbean: Implications for the biological carbon pump, Limnol. Oceanogr., 66, 3190–3208, https://doi.org/10.1002/lno.11872, 2021.
Guieu, C., Dulac, F., Ridame, C., and Pondaven, P.: Introduction to project DUNE, a DUst experiment in a low Nutrient, low chlorophyll Ecosystem, Biogeosciences, 11, 425–442, https://doi.org/10.5194/bg-11-425-2014, 2014.
Haarig, M., Ansmann, A., Gasteiger, J., Kandler, K., Althausen, D., Baars, H., Radenz, M., and Farrell, D. A.: Dry versus wet marine particle optical properties: RH dependence of depolarization ratio, backscatter, and extinction from multiwavelength lidar measurements during SALTRACE, Atmos. Chem. Phys., 17, 14199–14217, https://doi.org/10.5194/acp-17-14199-2017, 2017a.
Haarig, M., Ansmann, A., Althausen, D., Klepel, A., Groß, S., Freudenthaler, V., Toledano, C., Mamouri, R.-E., Farrell, D. A., Prescod, D. A., Marinou, E., Burton, S. P., Gasteiger, J., Engelmann, R., and Baars, H.: Triple-wavelength depolarization-ratio profiling of Saharan dust over Barbados during SALTRACE in 2013 and 2014, Atmos. Chem. Phys., 17, 10767–10794, https://doi.org/10.5194/acp-17-10767-2017, 2017b.
Hand, J. L., Mahowald, N. M., Chen, Y., Siefert, R. L., Luo, C., Subramaniam, A., and Fung, I.: Estimates of atmospheric-processed soluble iron from observations and a global mineral aerosol model: Biogeochemical implications, J. Geophys. Res.-Atmos., 109, https://doi.org/10.1029/2004JD004574, 2004.
Haustein, K., Pérez, C., Baldasano, J. M., Jorba, O., Basart, S., Miller, R. L., Janjic, Z., Black, T., Nickovic, S., Todd, M. C., Washington, R., Müller, D., Tesche, M., Weinzierl, B., Esselborn, M., and Schladitz, A.: Atmospheric dust modeling from meso to global scales with the online NMMB/BSC-Dust model – Part 2: Experimental campaigns in Northern Africa, Atmos. Chem. Phys., 12, 2933–2958, https://doi.org/10.5194/acp-12-2933-2012, 2012.
Hersbach, H., Bell, B., Berrisford, P., Hirahara, S., Horányi, A., Muñoz-Sabater, J., Nicolas, J., Peubey, C., Radu, R., Schepers, D., Simmons, A., Soci, C., Abdalla, S., Abellan, X., Balsamo, G., Bechtold, P., Biavati, G., Bidlot, J., Bonavita, M., De Chiara, G., Dahlgren, P., Dee, D., Diamantakis, M., Dragani, R., Flemming, J., Forbes, R., Fuentes, M., Geer, A., Haimberger, L., Healy, S., Hogan, R. J., Hólm, E., Janisková, M., Keeley, S., Laloyaux, P., Lopez, P., Lupu, C., Radnoti, G., de Rosnay, P., Rozum, I., Vamborg, F., Villaume, S., and Thépaut, J.-N.: The ERA5 global reanalysis, Q. J. Roy. Meteor. Soc., 146, 1999–2049, https://doi.org/10.1002/qj.3803, 2020.
Hess, M., Koepke, P., and Schult, I.: Optical Properties of Aerosols and Clouds: The Software Package OPAC, B. Am. Meteorol. Soc., 79, 831–844, 1998.
Hoesly, R. M., Smith, S. J., Feng, L., Klimont, Z., Janssens-Maenhout, G., Pitkanen, T., Seibert, J. J., Vu, L., Andres, R. J., Bolt, R. M., Bond, T. C., Dawidowski, L., Kholod, N., Kurokawa, J.-I., Li, M., Liu, L., Lu, Z., Moura, M. C. P., O'Rourke, P. R., and Zhang, Q.: Historical (1750–2014) anthropogenic emissions of reactive gases and aerosols from the Community Emissions Data System (CEDS), Geosci. Model Dev., 11, 369–408, https://doi.org/10.5194/gmd-11-369-2018, 2018.
Hofer, J., Althausen, D., Abdullaev, S. F., Makhmudov, A. N., Nazarov, B. I., Schettler, G., Engelmann, R., Baars, H., Fomba, K. W., Müller, K., Heinold, B., Kandler, K., and Ansmann, A.: Long-term profiling of mineral dust and pollution aerosol with multiwavelength polarization Raman lidar at the Central Asian site of Dushanbe, Tajikistan: case studies, Atmos. Chem. Phys., 17, 14559–14577, https://doi.org/10.5194/acp-17-14559-2017, 2017.
Holben, B. N., Eck, T. F., Slutsker, I., Tanre, D., Buis, J. P., Setzer, A., Vermote, E., Reagan, J. A., Kaufman, Y. J., Nakajima, T., Lavenu, F., Jankowiak, I., and Smirnov, A.: AERONET – A federated instrument network and data archive for aerosol characterization, Remote Sens. Environ., 66, 1–16, https://doi.org/10.1016/S0034-4257(98)00031-5, 1998.
Honjo, S. and Manganini, S. J.: Annual biogenic particle fluxes to the interior of the North Atlantic Ocean; studied at 34° N 21° W and 48° N 21° W, Deep-Sea Res. Pt. II:, 40, 587–607, https://doi.org/10.1016/0967-0645(93)90034-K, 1993.
Hostetler, C. A., Behrenfeld, M. J., Hu, Y., Hair, J. W., and Schulien, J. A.: Spaceborne Lidar in the Study of Marine Systems, Annu. Rev. Mar. Sci., 10, 121–147, https://doi.org/10.1146/annurev-marine-121916-063335, 2018.
Huang, J., Zhang, C., and Prospero, J. M.: African dust outbreaks: A satellite perspective of temporal and spatial variability over the tropical Atlantic Ocean, J. Geophys. Res.-Atmos., 115, https://doi.org/10.1029/2009JD012516, 2010.
Huneeus, N., Schulz, M., Balkanski, Y., Griesfeller, J., Prospero, J., Kinne, S., Bauer, S., Boucher, O., Chin, M., Dentener, F., Diehl, T., Easter, R., Fillmore, D., Ghan, S., Ginoux, P., Grini, A., Horowitz, L., Koch, D., Krol, M. C., Landing, W., Liu, X., Mahowald, N., Miller, R., Morcrette, J.-J., Myhre, G., Penner, J., Perlwitz, J., Stier, P., Takemura, T., and Zender, C. S.: Global dust model intercomparison in AeroCom phase I, Atmos. Chem. Phys., 11, 7781–7816, https://doi.org/10.5194/acp-11-7781-2011, 2011.
Hunt, W. H., Winker, D. M., Vaughan, M. A., Powell, K. A., Lucker, P. L., and Weimer, C.: CALIPSO Lidar Description and Performance Assessment, J. Atmos. Ocean. Tech., 26, 1214–1228, https://doi.org/10.1175/2009JTECHA1223.1, 2009.
Iacono, M. J., Mlawer, E. J., Clough, S. A., and Morcrette, J. J.: Impact of an improved longwave radiation model, RRTM, on the energy budget and thermodynamic properties of the NCAR community climate model, CCM3, J. Geophys. Res., 105, 14873–14890, 2000.
Iacono, M. J., Delamere, J. S., Mlawer, E. J., Shephard, M. W., Clough, S. A., and Collins, W. D.: Radiative forcing by long-lived greenhouse gases: Calculations with the AER radiative transfer models, J. Geophys. Res.-Atmos., 113, https://doi.org/10.1029/2008JD009944, 2008.
Illingworth, A. J., Barker, H. W., Beljaars, A., Ceccaldi, M., Chepfer, H., Clerbaux, N., Cole, J., Delanoe, J., Domenech, C., Donovan, D. P., Fukuda, S., Hirakata, M., Hogan, R. J., Huenerbein, A., Kollias, P., Kubota, T., Nakajima, T., Nakajima, T. Y., Nishizawa, T., Ohno, Y., Okamoto, H., Oki, R., Sato, K., Satoh, M., Shephard, M. W., Velazquez-Blazquez, A., Wandinger, U., Wehr, T., and van Zadelhoff, G.-J.: THE EARTHCARE SATELLITE The Next Step Forward in Global Measurements of Clouds, Aerosols, Precipitation, and Radiation, B. Am. Meteorol. Soc., 96, 1311–1332, https://doi.org/10.1175/BAMS-D-12-00227.1, 2015.
Inness, A., Ades, M., Agustí-Panareda, A., Barré, J., Benedictow, A., Blechschmidt, A.-M., Dominguez, J. J., Engelen, R., Eskes, H., Flemming, J., Huijnen, V., Jones, L., Kipling, Z., Massart, S., Parrington, M., Peuch, V.-H., Razinger, M., Remy, S., Schulz, M., and Suttie, M.: The CAMS reanalysis of atmospheric composition, Atmos. Chem. Phys., 19, 3515–3556, https://doi.org/10.5194/acp-19-3515-2019, 2019.
IPCC: Climate Change 2014: Synthesis Report. Contribution of Working Groups I, II and III to the Fifth Assessment Report of the Intergovernmental Panel on Climate Change, edited by: Pachauri, R. K. and Meyer, L. A., IPCC, Geneva, Switzerland, 151 pp., ISBN 978-92-9169-143-2, 2014.
Ito, A., Myriokefalitakis, S., Kanakidou, M., Mahowald, N. M., Scanza, R. A., Hamilton, D. S., Baker, A. R., Jickells, T., Sarin, M., Bikkina, S., Gao, Y., Shelley, R. U., Buck, C. S., Landing, W. M., Bowie, A. R., Perron, M. M. G., Guieu, C., Meskhidze, N., Johnson, M. S., Feng, Y., Kok, J. F., Nenes, A., and Duce, R. A.: Pyrogenic iron: The missing link to high iron solubility in aerosols, Sci. Adv., 5, eaau7671, https://doi.org/10.1126/sciadv.aau7671, 2019.
Ito, A., Ye, Y., Baldo, C., and Shi, Z.: Ocean fertilization by pyrogenic aerosol iron, npj Clim. Atmos. Sci., 4, 1–20, https://doi.org/10.1038/s41612-021-00185-8, 2021.
Ito, T. and Follows, M.: Upper ocean control on the solubility pump of CO2, J. Mar. Res., 61, 465–489, https://doi.org/10.1357/002224003322384898, 2003.
Janjic, Z. and Gall, R.: Scientific documentation of the NCEP nonhydrostatic multiscale model on the B grid (NMMB). Part 1 Dynamics, NCAR Technical Note, NCAR Tech. Note NCAR/TN-489+STR, https://doi.org/10.5065/D6WH2MZX, 2012.
Janjic, Z. I.: A nonhydrostatic model based on a new approach, Meteorol. Atmos. Phys., 82, 271–285, https://doi.org/10.1007/s00703-001-0587-6, 2003.
Jickells, T. and Moore, C. M.: The Importance of Atmospheric Deposition for Ocean Productivity, Annu. Rev. Ecol. Evol. Sys., 46, https://doi.org/10.1146/annurev-ecolsys-112414-054118, 2015.
Jickells, T. D., Newton, P. P., King, P., Lampitt, R. S., and Boutle, C.: A comparison of sediment trap records of particle fluxes from 19 to 48° N in the northeast Atlantic and their relation to surface water productivity, Deep-Sea Res. Pt. I, 43, 971–986, https://doi.org/10.1016/0967-0637(96)00063-5, 1996.
Jickells, T. D., Dorling, S., Deuser, W. G., Church, T. M., Arimoto, R., and Prospero, J. M.: Air-borne dust fluxes to a deep water sediment trap in the Sargasso Sea, Global Biogeochem. Cy., 12, 311–320, https://doi.org/10.1029/97GB03368, 1998.
Jickells, T. D., An, Z. S., Andersen, K. K., Baker, A. R., Bergametti, G., Brooks, N., Cao, J. J., Boyd, P. W., Duce, R. A., Hunter, K. A., Kawahata, H., Kubilay, N., laRoche, J., Liss, P. S., Mahowald, N., Prospero, J. M., Ridgwell, A. J., Tegen, I., and Torres, R.: Global Iron Connections Between Desert Dust, Ocean Biogeochemistry, and Climate, Science, 308, 67–71, https://doi.org/10.1126/science.1105959, 2005.
Johnson, M. S., Meskhidze, N., Solmon, F., Gassó, S., Chuang, P. Y., Gaiero, D. M., Yantosca, R. M., Wu, S., Wang, Y., and Carouge, C.: Modeling dust and soluble iron deposition to the South Atlantic Ocean, J. Geophys. Res.-Atmos., 115, https://doi.org/10.1029/2009JD013311, 2010.
Jones, C., Mahowald, N., and Luo, C.: The Role of Easterly Waves on African Desert Dust Transport, J. Climate, 16, 3617–3628, https://doi.org/10.1175/1520-0442(2003)016, 2003.
Kacenelenbogen, M., Vaughan, M. A., Redemann, J., Hoff, R. M., Rogers, R. R., Ferrare, R. A., Russell, P. B., Hostetler, C. A., Hair, J. W., and Holben, B. N.: An accuracy assessment of the CALIOP/CALIPSO version 2/version 3 daytime aerosol extinction product based on a detailed multi-sensor, multi-platform case study, Atmos. Chem. Phys., 11, 3981–4000, https://doi.org/10.5194/acp-11-3981-2011, 2011.
Kalnay, E., Kanamitsu, M., Kistler, R., Collins, W., Deaven, D., Gandin, L., Iredell, M., Saha, S., White, G., Woollen, J., Zhu, Y., Chelliah, M., Ebisuzaki, W., Higgins, W., Janowiak, J., Mo, K.C., Ropelewski, C., Wang, J., Leetmaa, A., Reynolds, R., Jenne, R., and Joseph, D.: The NCEP/NCAR 40-Year Reanalysis Project, B. Am. Meteorol. Soc., 77, 437–472, https://doi.org/10.1175/1520-0477(1996)077<0437:TNYRP>2.0.CO;2, 1996.
Kanitz, T., Ansmann, A., Engelmann, R., and Althausen, D.: North-south cross sections of the vertical aerosol distribution over the Atlantic Ocean from multiwavelength Raman/polarization lidar during Polarstern cruises, J. Geophys. Res.-Atmos., 118, 2643–2655, https://doi.org/10.1002/jgrd.50273, 2013.
Kanitz, T., Engelmann, R., Heinold, B., Baars, H., Skupin, A., and Ansmann, A.: Tracking the Saharan Air Layer with shipborne lidar across the tropical Atlantic, Geophys. Res. Lett., 41, 1044–1050, https://doi.org/10.1002/2013GL058780, 2014.
Kar, J., Vaughan, M. A., Lee, K.-P., Tackett, J. L., Avery, M. A., Garnier, A., Getzewich, B. J., Hunt, W. H., Josset, D., Liu, Z., Lucker, P. L., Magill, B., Omar, A. H., Pelon, J., Rogers, R. R., Toth, T. D., Trepte, C. R., Vernier, J.-P., Winker, D. M., and Young, S. A.: CALIPSO lidar calibration at 532 nm: version 4 nighttime algorithm, Atmos. Meas. Tech., 11, 1459–1479, https://doi.org/10.5194/amt-11-1459-2018, 2018.
Kar, J., Lee, K.-P., Vaughan, M. A., Tackett, J. L., Trepte, C. R., Winker, D. M., Lucker, P. L., and Getzewich, B. J.: CALIPSO level 3 stratospheric aerosol profile product: version 1.00 algorithm description and initial assessment, Atmos. Meas. Tech., 12, 6173–6191, https://doi.org/10.5194/amt-12-6173-2019, 2019.
Kaufman, Y. J., Koren, I., Remer, L. A., Tanré, D., Ginoux, P., and Fan, S.: Dust transport and deposition observed from the Terra-Moderate Resolution Imaging Spectroradiometer (MODIS) spacecraft over the Atlantic Ocean, J. Geophys. Res.-Atmos., 110, https://doi.org/10.1029/2003JD004436, 2005.
Kim, D., Chin, M., Yu, H., Diehl, T., Tan, Q., Kahn, R. A., Tsigaridis, K., Bauer, S. E., Takemura, T., Pozzoli, L., Bellouin, N., Schulz, M., Peyridieu, S., Chédin, A., and Koffi, B.: Sources, sinks, and transatlantic transport of North African dust aerosol: A multimodel analysis and comparison with remote sensing data, J. Geophys. Res.-Atmos., 119, 6259–6277, https://doi.org/10.1002/2013JD021099, 2014.
Kim, M.-H., Omar, A. H., Tackett, J. L., Vaughan, M. A., Winker, D. M., Trepte, C. R., Hu, Y., Liu, Z., Poole, L. R., Pitts, M. C., Kar, J., and Magill, B. E.: The CALIPSO version 4 automated aerosol classification and lidar ratio selection algorithm, Atmos. Meas. Tech., 11, 6107–6135, https://doi.org/10.5194/amt-11-6107-2018, 2018.
Klose, M., Shao, Y., Karremann, M. K., and Fink, A.: Sahel dust zone and synoptic background, Geophys. Res. Lett., 37, L09802, https://doi.org/10.1029/2010GL042816, 2010.
Klose, M., Jorba, O., Gonçalves Ageitos, M., Escribano, J., Dawson, M. L., Obiso, V., Di Tomaso, E., Basart, S., Montané Pinto, G., Macchia, F., Ginoux, P., Guerschman, J., Prigent, C., Huang, Y., Kok, J. F., Miller, R. L., and Pérez García-Pando, C.: Mineral dust cycle in the Multiscale Online Nonhydrostatic AtmospheRe CHemistry model (MONARCH) Version 2.0, Geosci. Model Dev., 14, 6403–6444, https://doi.org/10.5194/gmd-14-6403-2021, 2021.
Knippertz, P. and Todd, M. C.: Mineral dust aerosols over the Sahara: Meteorological controls on emission and transport and implications for modeling, Rev. Geophys., 50, RG1007, https://doi.org/10.1029/2011RG000362, 2012.
Knippertz, P., Deutscher, C., Kandler, K., Mueller, T., Schulz, O., and Schuetz, L.: Dust mobilization due to density currents in the Atlas region: Observations from the Saharan Mineral Dust Experiment 2006 field campaign, J. Geophys. Res.-Atmos., 112, D21109, https://doi.org/10.1029/2007JD008774, 2007.
Knippertz, P., Ansmann, A., Althausen, D., Mueller, D., Tesche, M., Bierwirth, E., Dinter, T., Mueller, T., Von Hoyningen-Huene, W., Schepanski, K., Wendisch, M., Heinold, B., Kandler, K., Petzold, A., Schuetz, L., and Tegen, I.: Dust mobilization and transport in the northern Sahara during SAMUM 2006 – a meteorological overview, Tellus B, 61, 12–31, https://doi.org/10.1111/j.1600-0889.2008.00380.x, 2009.
Knippertz, P., Tesche, M., Heinold, B., Kandler, K., Toledano, C., and Esselborn, M.: Dust mobilization and aerosol transport from West Africa to Cabo Verde-a meteorological overview of SAMUM-2, Tellus B, 63, 430–447, https://doi.org/10.1111/j.1600-0889.2011.00544.x, 2011.
Koch, J. and Renno, N. O.: The role of convective plumes and vortices on the global aerosol budget, Geophys. Res. Lett., 32, L18806, https://doi.org/10.1029/2005GL023420, 2005.
Kohfeld, K. E. and Harrison, S. P.: DIRTMAP: the geological record of dust, Earth-Sci. Rev., 54, 81–114, https://doi.org/10.1016/S0012-8252(01)00042-3, 2001.
Kok, J. F.: A scaling theory for the size distribution of emitted dust aerosols suggests climate models underestimate the size of the global dust cycle, P. Natl. Acad. Sci. USA, 108, 1016–1021, https://doi.org/10.1073/pnas.1014798108, 2011.
Kok, J. F., Adebiyi, A. A., Albani, S., Balkanski, Y., Checa-Garcia, R., Chin, M., Colarco, P. R., Hamilton, D. S., Huang, Y., Ito, A., Klose, M., Li, L., Mahowald, N. M., Miller, R. L., Obiso, V., Pérez García-Pando, C., Rocha-Lima, A., and Wan, J. S.: Contribution of the world's main dust source regions to the global cycle of desert dust, Atmos. Chem. Phys., 21, 8169–8193, https://doi.org/10.5194/acp-21-8169-2021, 2021.
Kok, J. F., Storelvmo, T., Karydis, V. A., Adebiyi, A. A., Mahowald, N. M., Evan, A. T., He, C., and Leung, D. M.: Mineral dust aerosol impacts on global climate and climate change, Nat. Rev. Earth Environ., https://doi.org/10.1038/s43017-022-00379-5, 2023.
Koopmann, B.: Sedimentation von Saharastaub im subtropischen Nordatlantik während der letzten 25.000 Jahre, “Meteor” Forschungs-Ergebnisse, C, Bremerhaven, PANGAEA, 35, 23–59, 1981.
Koren, I., Kaufman, Y. J., Washington, R., Todd, M. C., Rudich, Y., Martins, J. V., and Rosenfeld, D.: The Bodélé depression: a single spot in the Sahara that provides most of the mineral dust to the Amazon forest, Environ. Res. Lett., 1, 014005, https://doi.org/10.1088/1748-9326/1/1/014005, 2006.
Korte, L. F., Brummer, G.-J. A., van der Does, M., Guerreiro, C. V., Hennekam, R., van Hateren, J. A., Jong, D., Munday, C. I., Schouten, S., and Stuut, J.-B. W.: Downward particle fluxes of biogenic matter and Saharan dust across the equatorial North Atlantic, Atmos. Chem. Phys., 17, 6023–6040, https://doi.org/10.5194/acp-17-6023-2017, 2017.
Kremling, K. and Streu, P.: Saharan dust influenced trace element fluxes in deep North Atlantic subtropical waters, Deep-Sea Res. Pt. I, 40, 1155–1168, https://doi.org/10.1016/0967-0637(93)90131-L, 1993.
Krishnamurthy, A., Moore, J. K., Mahowald, N., Luo, C., and Zender, C. S.: Impacts of atmospheric nutrient inputs on marine biogeochemistry, J. Geophys. Res., 115, G01006, https://doi.org/10.1029/2009JG001115, 2010.
Kuss, J. and Kremling, K.: Particulate trace element fluxes in the deep northeast Atlantic Ocean, Deep-Sea Res. Pt. I, 46, 149–169, https://doi.org/10.1016/S0967-0637(98)00059-4, 1999.
Lavaysse, C., Flamant, C., Janicot, S., Parker, D. J., Lafore, J.-P., Sultan, B., and Pelon, J.: Seasonal evolution of the West African heat low: a climatological perspective, Clim. Dynam., 33, 313–330, https://doi.org/10.1007/s00382-009-0553-4, 2009.
Lawrence, C. R. and Neff, J. C.: The contemporary physical and chemical flux of aeolian dust: A synthesis of direct measurements of dust deposition, Chem. Geol., 267, 46–63, https://doi.org/10.1016/j.chemgeo.2009.02.005, 2009.
Liu, Z., Vaughan, M., Winker, D., Kittaka, C., Getzewich, B., Kuehn, R., Omar, A., Powell, K., Trepte, C., and Hostetler, C.: The CALIPSO Lidar Cloud and Aerosol Discrimination: Version 2 Algorithm and Initial Assessment of Performance, J. Atmos. Ocean. Tech., 26, 1198–1213, https://doi.org/10.1175/2009JTECHA1229.1, 2009.
Liu, Z., Kar, J., Zeng, S., Tackett, J., Vaughan, M., Avery, M., Pelon, J., Getzewich, B., Lee, K.-P., Magill, B., Omar, A., Lucker, P., Trepte, C., and Winker, D.: Discriminating between clouds and aerosols in the CALIOP version 4.1 data products, Atmos. Meas. Tech., 12, 703–734, https://doi.org/10.5194/amt-12-703-2019, 2019.
Luo, C., Mahowald, N. M., and del Corral, J.: Sensitivity study of meteorological parameters on mineral aerosol mobilization, transport, and distribution, J. Geophys. Res.-Atmos., 108, https://doi.org/10.1029/2003JD003483, 2003.
Mahowald, N., Luo, C., del Corral, J., and Zender, C. S.: Interannual variability in atmospheric mineral aerosols from a 22-year model simulation and observational data, J. Geophys. Res.-Atmos., 108, https://doi.org/10.1029/2002JD002821, 2003.
Mahowald, N., Albani, S., Engelstaedter, S., Winckler, G., and Goman, M.: Model insight into glacial–interglacial paleodust records, Quaternary Sci. Rev., 30, 832–854, https://doi.org/10.1016/j.quascirev.2010.09.007, 2011.
Mahowald, N. M., Engelstaedter, S., Luo, C., Sealy, A., Artaxo, P., Benitez-Nelson, C., Bonnet, S., Chen, Y., Chuang, P. Y., Cohen, D. D., Dulac, F., Herut, B., Johansen, A. M., Kubilay, N., Losno, R., Maenhaut, W., Paytan, A., Prospero, J. M., Shank, L. M., and Siefert, R. L.: Atmospheric Iron Deposition: Global Distribution, Variability, and Human Perturbations, Annu. Rev. Mar. Sci., 1, 245–278, https://doi.org/10.1146/annurev.marine.010908.163727, 2009.
Mahowald, N. M., Kloster, S., Engelstaedter, S., Moore, J. K., Mukhopadhyay, S., McConnell, J. R., Albani, S., Doney, S. C., Bhattacharya, A., Curran, M. A. J., Flanner, M. G., Hoffman, F. M., Lawrence, D. M., Lindsay, K., Mayewski, P. A., Neff, J., Rothenberg, D., Thomas, E., Thornton, P. E., and Zender, C. S.: Observed 20th century desert dust variability: impact on climate and biogeochemistry, Atmos. Chem. Phys., 10, 10875–10893, https://doi.org/10.5194/acp-10-10875-2010, 2010.
Mamouri, R. E. and Ansmann, A.: Fine and coarse dust separation with polarization lidar, Atmos. Meas. Tech., 7, 3717–3735, https://doi.org/10.5194/amt-7-3717-2014, 2014.
Mamouri, R. E. and Ansmann, A.: Estimated desert-dust ice nuclei profiles from polarization lidar: methodology and case studies, Atmos. Chem. Phys., 15, 3463–3477, https://doi.org/10.5194/acp-15-3463-2015, 2015.
Mamouri, R.-E. and Ansmann, A.: Potential of polarization lidar to provide profiles of CCN- and INP-relevant aerosol parameters, Atmos. Chem. Phys., 16, 5905–5931, https://doi.org/10.5194/acp-16-5905-2016, 2016.
Mamouri, R.-E. and Ansmann, A.: Potential of polarization/Raman lidar to separate fine dust, coarse dust, maritime, and anthropogenic aerosol profiles, Atmos. Meas. Tech., 10, 3403–3427, https://doi.org/10.5194/amt-10-3403-2017, 2017.
Mamouri, R. E., Ansmann, A., Nisantzi, A., Kokkalis, P., Schwarz, A., and Hadjimitsis, D.: Low Arabian dust extinction-to-backscatter ratio, Geophys. Res. Lett., 40, 4762–4766, https://doi.org/10.1002/grl.50898, 2013.
Marinou, E., Amiridis, V., Binietoglou, I., Tsikerdekis, A., Solomos, S., Proestakis, E., Konsta, D., Papagiannopoulos, N., Tsekeri, A., Vlastou, G., Zanis, P., Balis, D., Wandinger, U., and Ansmann, A.: Three-dimensional evolution of Saharan dust transport towards Europe based on a 9-year EARLINET-optimized CALIPSO dataset, Atmos. Chem. Phys., 17, 5893–5919, https://doi.org/10.5194/acp-17-5893-2017, 2017.
Marticorena, B. and Bergametti, G.: Modelling the atmospheric dust cycle: 1. Design of a soil drived dust emission scheme, J. Geophys. Res., 100, 16415–16430, https://doi.org/10.1029/95jd00690, 1995.
Marticorena, B., Bergametti, G., Aumont, B., Callot, Y., N'Doumé, C., and Legrand, M.: Modelling the atmospheric dust cycle: 2. Simulation of Saharan dust sources, J. Geophys. Res., 102, 4387–4404, 1997.
Mazzonia, E. and Vazquez, M.: Desertification in Patagonia, in: Natural hazards and human-exacerbated disasters in Latin America, edited by: Latrubesse, E. M., 13, 351–377, https://doi.org/10.1016/S0928-2025(08)10017-7, 2009.
McCave, I. N., Manighetti, B., and Robinson, S. G.: Sortable silt and fine sediment size/composition slicing: Parameters for palaeocurrent speed and palaeoceanography, Paleoceanography, 10, 593–610, https://doi.org/10.1029/94PA03039, 1995.
McConnell, J. R., Aristarain, A. J., Banta, J. R., Edwards, P. R., and Simões, J. C.: 20th-century doubling in dust archived in an Antarctic Peninsula ice core parallels climate change and desertification in South America, P. Natl. Acad. Sci. USA, 104, 5743–5748, 2007.
McGill, M. J., Yorks, J. E., Scott, V. S., Kupchock, A. W., and Selmer, P. A.: The Cloud-Aerosol Transport System (CATS): a technology demonstration on the International Space Station, in: Lidar Remote Sensing for Environmental Monitoring XV, Lidar Remote Sensing for Environmental Monitoring XV, 34–39, https://doi.org/10.1117/12.2190841, 2015.
Mortier, A., Gliß, J., Schulz, M., Aas, W., Andrews, E., Bian, H., Chin, M., Ginoux, P., Hand, J., Holben, B., Zhang, H., Kipling, Z., Kirkevåg, A., Laj, P., Lurton, T., Myhre, G., Neubauer, D., Olivié, D., von Salzen, K., Skeie, R. B., Takemura, T., and Tilmes, S.: Evaluation of climate model aerosol trends with ground-based observations over the last 2 decades – an AeroCom and CMIP6 analysis, Atmos. Chem. Phys., 20, 13355–13378, https://doi.org/10.5194/acp-20-13355-2020, 2020.
Müller, D., Ansmann, A., Mattis, I., Tesche, M., Wandinger, U., Althausen, D., and Pisani, G.: Aerosol-type-dependent lidar ratios observed with Raman lidar, J. Geophys. Res.-Atmos., 112, https://doi.org/10.1029/2006JD008292, 2007.
Myriokefalitakis, S., Ito, A., Kanakidou, M., Nenes, A., Krol, M. C., Mahowald, N. M., Scanza, R. A., Hamilton, D. S., Johnson, M. S., Meskhidze, N., Kok, J. F., Guieu, C., Baker, A. R., Jickells, T. D., Sarin, M. M., Bikkina, S., Shelley, R., Bowie, A., Perron, M. M. G., and Duce, R. A.: Reviews and syntheses: the GESAMP atmospheric iron deposition model intercomparison study, Biogeosciences, 15, 6659–6684, https://doi.org/10.5194/bg-15-6659-2018, 2018.
Myriokefalitakis, S., Gröger, M., Hieronymus, J., and Döscher, R.: An explicit estimate of the atmospheric nutrient impact on global oceanic productivity, Ocean Sci., 16, 1183–1205, https://doi.org/10.5194/os-16-1183-2020, 2020.
Myriokefalitakis, S., Bergas-Massó, E., Gonçalves-Ageitos, M., Pérez García Pando, C., van Noije, T., and Le Sager, P.: EC-Earth3.3.2.1-Fe, Zenodo [data set], https://doi.org/10.5281/zenodo.5752596, 2021.
Myriokefalitakis, S., Bergas-Massó, E., Gonçalves-Ageitos, M., Pérez García-Pando, C., van Noije, T., Le Sager, P., Ito, A., Athanasopoulou, E., Nenes, A., Kanakidou, M., Krol, M. C., and Gerasopoulos, E.: Multiphase processes in the EC-Earth model and their relevance to the atmospheric oxalate, sulfate, and iron cycles, Geosci. Model Dev., 15, 3079–3120, https://doi.org/10.5194/gmd-15-3079-2022, 2022.
Neuer, S., Freudenthal, T., Davenport, R., Llinás, O., and Rueda, M.-J.: Seasonality of surface water properties and particle flux along a productivity gradient off NW Africa, Deep-Sea Res. Pt. II, 49, 3561–3576, https://doi.org/10.1016/S0967-0645(02)00098-X, 2002.
Nicolae, D., Nemuc, A., Müller, D., Talianu, C., Vasilescu, J., Belegante, L., and Kolgotin, A.: Characterization of fresh and aged biomass burning events using multiwavelength Raman lidar and mass spectrometry, J. Geophys. Res.-Atmos., 118, 2956–2965, https://doi.org/10.1002/jgrd.50324, 2013.
Noh, Y. M., Müller, D., Lee, H., and Choi, T. J.: Influence of biogenic pollen on optical properties of atmospheric aerosols observed by lidar over Gwangju, South Korea, Atmos. Environ., 69, 139–147, https://doi.org/10.1016/j.atmosenv.2012.12.018, 2013.
Okin, G. S., Baker, A. R., Tegen, I., Mahowald, N. M., Dentener, F. J., Duce, R. A., Galloway, J. N., Hunter, K., Kanakidou, M., Kubilay, N., Prospero, J. M., Sarin, M., Surapipith, V., Uematsu, M., and Zhu, T.: Impacts of atmospheric nutrient deposition on marine productivity: Roles of nitrogen, phosphorus, and iron, Global Biogeochem. Cy., 25, https://doi.org/10.1029/2010GB003858, 2011.
Omar, A. H., Winker, D. M., Vaughan, M. A., Hu, Y., Trepte, C. R., Ferrare, R. A., Lee, K.-P., Hostetler, C. A., Kittaka, C., Rogers, R. R., Kuehn, R. E., and Liu, Z.: The CALIPSO Automated Aerosol Classification and Lidar Ratio Selection Algorithm, J. Atmos. Ocean. Tech., 26, 1994–2014, https://doi.org/10.1175/2009JTECHA1231.1, 2009.
O'Neill, N. T., Eck, T. F., Holben, B. N., Smirnov, A., Dubovik, O., and Royer, A.: Bimodal size distribution influences on the variation of Angstrom derivatives in spectral and optical depth space, J. Geophys. Res., 106, 9787–9806, 2001a.
O'Neill, N. T., Dubovik, O., and Eck, T. F.: A modified Angstrom coefficient for the characterization of sub-micron aerosols, Appl. Optics, 40, 2368–2374, 2001b.
O'Neill, N. T., Eck, T. F., Smirnov, A., Holben, B. N., and Thulasiraman, S.: Spectral discrimination of coarse and fine mode optical depth, J. Geophys. Res., 108, 4559–4573, https://doi.org/10.1029/2002JD002975, 2003.
Pabortsava, K., Lampitt, R. S., Benson, J., Crowe, C., McLachlan, R., Le Moigne, F. A. C., Mark Moore, C., Pebody, C., Provost, P., Rees, A. P., Tilstone, G. H., and Woodward, E. M. S.: Carbon sequestration in the deep Atlantic enhanced by Saharan dust, Nat. Geosci., 10, 189–194, https://doi.org/10.1038/ngeo2899, 2017.
Pappalardo, G., Amodeo, A., Apituley, A., Comeron, A., Freudenthaler, V., Linné, H., Ansmann, A., Bösenberg, J., D'Amico, G., Mattis, I., Mona, L., Wandinger, U., Amiridis, V., Alados-Arboledas, L., Nicolae, D., and Wiegner, M.: EARLINET: towards an advanced sustainable European aerosol lidar network, Atmos. Meas. Tech., 7, 2389–2409, https://doi.org/10.5194/amt-7-2389-2014, 2014.
Parker, D. J., Thorncroft, C. D., Burton, R. R., and Diongue-Niang, A.: Analysis of the African easterly jet, using aircraft observations from the JET2000 experiment, Q. J. Roy. Meteor. Soc., 131, 1461–1482, https://doi.org/10.1256/qj.03.189, 2005a.
Parker, D. J., Burton, R. R., Diongue-Niang, A., Ellis, R. J., Felton, M., Taylor, C. M., Thorncroft, C. D., Bessemoulin, P., and Tompkins, A. M.: The diurnal cycle of the West African monsoon circulation, Q. J. Roy. Meteor. Soc., 131, 2839–2860, https://doi.org/10.1256/qj.04.52, 2005b.
Pérez, C., Haustein, K., Janjic, Z., Jorba, O., Huneeus, N., Baldasano, J. M., Black, T., Basart, S., Nickovic, S., Miller, R. L., Perlwitz, J. P., Schulz, M., and Thomson, M.: Atmospheric dust modeling from meso to global scales with the online NMMB/BSC-Dust model – Part 1: Model description, annual simulations and evaluation, Atmos. Chem. Phys., 11, 13001–13027, https://doi.org/10.5194/acp-11-13001-2011, 2011.
Powell, K. A., Hostetler, C. A., Vaughan, M. A., Lee, K.-P., Trepte, C. R., Rogers, R. R., Winker, D. M., Liu, Z., Kuehn, R. E., Hunt, W. H., and Young, S. A.: CALIPSO Lidar Calibration Algorithms. Part I: Nighttime 532-nm Parallel Channel and 532-nm Perpendicular Channel, J. Atmos. Ocean. Tech., 26, 2015–2033, https://doi.org/10.1175/2009JTECHA1242.1, 2009.
Proestakis, E., Amiridis, V., Marinou, E., Georgoulias, A. K., Solomos, S., Kazadzis, S., Chimot, J., Che, H., Alexandri, G., Binietoglou, I., Daskalopoulou, V., Kourtidis, K. A., de Leeuw, G., and van der A, R. J.: Nine-year spatial and temporal evolution of desert dust aerosols over South and East Asia as revealed by CALIOP, Atmos. Chem. Phys., 18, 1337–1362, https://doi.org/10.5194/acp-18-1337-2018, 2018.
Proestakis, E., Amiridis, V., Marinou, E., Binietoglou, I., Ansmann, A., Wandinger, U., Hofer, J., Yorks, J., Nowottnick, E., Makhmudov, A., Papayannis, A., Pietruczuk, A., Gialitaki, A., Apituley, A., Szkop, A., Muñoz Porcar, C., Bortoli, D., Dionisi, D., Althausen, D., Mamali, D., Balis, D., Nicolae, D., Tetoni, E., Liberti, G. L., Baars, H., Mattis, I., Stachlewska, I. S., Voudouri, K. A., Mona, L., Mylonaki, M., Perrone, M. R., Costa, M. J., Sicard, M., Papagiannopoulos, N., Siomos, N., Burlizzi, P., Pauly, R., Engelmann, R., Abdullaev, S., and Pappalardo, G.: EARLINET evaluation of the CATS Level 2 aerosol backscatter coefficient product, Atmos. Chem. Phys., 19, 11743–11764, https://doi.org/10.5194/acp-19-11743-2019, 2019.
Proestakis, E., Gkikas, A., Georgiou, T., Kampouri, A., Drakaki, E., Ryder, C. L., Marenco, F., Marinou, E., and Amiridis, V.: A near-global multiyear climate data record of the fine-mode and coarse-mode components of atmospheric pure dust, Atmos. Meas. Tech., 17, 3625–3667, https://doi.org/10.5194/amt-17-3625-2024, 2024.
Proestakis E., Amiridis, V., Pérez García-Pando, C., Tsyro, S., Griesfeller, J., Gkikas, A., Georgiou, T., Gonçalves Ageitos, M., Escribano, J., Myriokefalitakis, S., Bergas Masso, E., Di Tomaso, E. Basart, S., Stuut, JB., and Benedetti, A.: Atlantic Ocean Dust Optical Depth (DOD) and Dust Deposition Rate (DDR) [data set], https://doi.org/10.5281/zenodo.14608539, 2025.
Prospero, J. M.: Saharan dust transport over the North Atlantic Ocean and Mediterranean: an overview, in: The Impact of Desert Dust Across the Mediterranean, edited by: Guerzoni, S., and Chester, R., Kluwer Academic, Dordrecht, 133–151, https://doi.org/10.1007/978-94-017-3354-0_13, 1996.
Prospero, J. M.: Long-range transport of mineral dust in the global atmosphere: Impact of African dust on the environment of the southeastern United States, P. Natl. Acad. Sci. USA, 96, 3396–3403, 1999.
Prospero, J. M. and Carlson, T. N.: Saharan air outbreaks over the tropical North Atlantic, Pure Appl. Geophys., 119, 677–691, https://doi.org/10.1007/BF00878167, 1981.
Prospero, J. M., Nees, R. T., and Uematsu, M.: Deposition rate of particulate and dissolved aluminum derived from saharan dust in precipitation at Miami, Florida, J. Geophys. Res.-Atmos., 92, 14723–14731, https://doi.org/10.1029/JD092iD12p14723, 1987.
Prospero, J. M., Ginoux, P., Torres, O., Nicholson, S. E., and Gill, T. E.: Environmental Characterization of Global Sources of Atmospheric Soil Dust Identified with the Nimbus 7 Total Ozone Mapping Spectrometer (toms) Absorbing Aerosol Product, Rev. Geophys., 40, 2-1–2-31, https://doi.org/10.1029/2000RG000095, 2002.
Prospero, J. M., Landing, W. M., and Schulz, M.: African dust deposition to Florida: Temporal and spatial variability and comparisons to models, J. Geophys. Res.-Atmos., 115, https://doi.org/10.1029/2009JD012773, 2010.
Prospero, J. M., Collard, F.-X., Molinié, J., and Jeannot, A.: Characterizing the annual cycle of African dust transport to the Caribbean Basin and South America and its impact on the environment and air quality, Global Biogeochem. Cy., 28, 757–773, https://doi.org/10.1002/2013GB004802, 2014.
Ratmeyer, V., Fischer, G., and Wefer, G.: Lithogenic particle fluxes and grain size distributions in the deep ocean off northwest Africa: Implications for seasonal changes of aeolian dust input and downward transport, Deep-Sea Res. Pt. I, 46, 1289–1337, https://doi.org/10.1016/S0967-0637(99)00008-4, 1999.
Raupach, M. R., Canadell, J. G., and Le Quéré, C.: Anthropogenic and biophysical contributions to increasing atmospheric CO2 growth rate and airborne fraction, Biogeosciences, 5, 1601–1613, https://doi.org/10.5194/bg-5-1601-2008, 2008.
Remer, L. A., Kaufman, Y. J., Tanré, D., Mattoo, S., Chu, D. A., Martins, J. V., Li, R.-R., Ichoku, C., Levy, R. C., Kleidman, R. G., Eck, T. F., Vermote, E., and Holben, B. N.: The MODIS Aerosol Algorithm, Products, and Validation, J. Atmos. Sci., 62, 947–973, https://doi.org/10.1175/JAS3385.1, 2005.
Ridley, D. A., Heald, C. L., and Ford, B.: North African dust export and deposition: A satellite and model perspective, J. Geophys. Res.-Atmos., 117, https://doi.org/10.1029/2011JD016794, 2012.
Ridley, D. A., Heald, C. L., and Prospero, J. M.: What controls the recent changes in African mineral dust aerosol across the Atlantic?, Atmos. Chem. Phys., 14, 5735–5747, https://doi.org/10.5194/acp-14-5735-2014, 2014.
Rittmeister, F., Ansmann, A., Engelmann, R., Skupin, A., Baars, H., Kanitz, T., and Kinne, S.: Profiling of Saharan dust from the Caribbean to western Africa – Part 1: Layering structures and optical properties from shipborne polarization/Raman lidar observations, Atmos. Chem. Phys., 17, 12963–12983, https://doi.org/10.5194/acp-17-12963-2017, 2017.
Rodríguez, S., Riera, R., Fonteneau, A., Alonso-Pérez, S., and López-Darias, J.: African desert dust influences migrations and fisheries of the Atlantic skipjack-tuna, Atmos. Environ., 312, 120022, https://doi.org/10.1016/j.atmosenv.2023.120022, 2023.
Rogers, R. R., Vaughan, M. A., Hostetler, C. A., Burton, S. P., Ferrare, R. A., Young, S. A., Hair, J. W., Obland, M. D., Harper, D. B., Cook, A. L., and Winker, D. M.: Looking through the haze: evaluating the CALIPSO level 2 aerosol optical depth using airborne high spectral resolution lidar data, Atmos. Meas. Tech., 7, 4317–4340, https://doi.org/10.5194/amt-7-4317-2014, 2014.
Ryder, C. L., Marenco, F., Brooke, J. K., Estelles, V., Cotton, R., Formenti, P., McQuaid, J. B., Price, H. C., Liu, D., Ausset, P., Rosenberg, P. D., Taylor, J. W., Choularton, T., Bower, K., Coe, H., Gallagher, M., Crosier, J., Lloyd, G., Highwood, E. J., and Murray, B. J.: Coarse-mode mineral dust size distributions, composition and optical properties from AER-D aircraft measurements over the tropical eastern Atlantic, Atmos. Chem. Phys., 18, 17225–17257, https://doi.org/10.5194/acp-18-17225-2018, 2018.
Scanza, R. A., Hamilton, D. S., Perez Garcia-Pando, C., Buck, C., Baker, A., and Mahowald, N. M.: Atmospheric processing of iron in mineral and combustion aerosols: development of an intermediate-complexity mechanism suitable for Earth system models, Atmos. Chem. Phys., 18, 14175–14196, https://doi.org/10.5194/acp-18-14175-2018, 2018.
Schepanski, K., Tegen, I., and Macke, A.: Saharan dust transport and deposition towards the tropical northern Atlantic, Atmos. Chem. Phys., 9, 1173–1189, https://doi.org/10.5194/acp-9-1173-2009, 2009.
Schepanski, K., Heinold, B., and Tegen, I.: Harmattan, Saharan heat low, and West African monsoon circulation: modulations on the Saharan dust outflow towards the North Atlantic, Atmos. Chem. Phys., 17, 10223–10243, https://doi.org/10.5194/acp-17-10223-2017, 2017.
Schlosser, C., Klar, J. K., Wake, B. D., Snow, J. T., Honey, D. J., Woodward, E. M. S., Lohan, M. C., Achterberg, E. P., and Moore, C. M.: Seasonal ITCZ migration dynamically controls the location of the (sub)tropical Atlantic biogeochemical divide, P. Natl. Acad. Sci. USA, 111, 1438–1442, https://doi.org/10.1073/pnas.1318670111, 2014.
Schneider, D. P., Deser, C., Fasullo, J., and Trenberth, K. E.: Climate Data Guide Spurs Discovery and Understanding, Eos Trans. AGU, 94, 121–122, https://doi.org/10.1002/2013eo130001, 2013.
Schneider, T., Bischoff, T., and Haug, G. H.: Migrations and dynamics of the intertropical convergence zone, Nature, 513, 45–53, https://doi.org/10.1038/nature13636, 2014.
Schubert, S., J. Pfaendtner, and R. Rood, 1993: An assimilated dataset for earth science applications. Bull. Amer. Meteor. Soc., 74, 2331–2342, 1993.
Seland, Ø., Bentsen, M., Olivié, D., Toniazzo, T., Gjermundsen, A., Graff, L. S., Debernard, J. B., Gupta, A. K., He, Y.-C., Kirkevåg, A., Schwinger, J., Tjiputra, J., Aas, K. S., Bethke, I., Fan, Y., Griesfeller, J., Grini, A., Guo, C., Ilicak, M., Karset, I. H. H., Landgren, O., Liakka, J., Moseid, K. O., Nummelin, A., Spensberger, C., Tang, H., Zhang, Z., Heinze, C., Iversen, T., and Schulz, M.: Overview of the Norwegian Earth System Model (NorESM2) and key climate response of CMIP6 DECK, historical, and scenario simulations, Geosci. Model Dev., 13, 6165–6200, https://doi.org/10.5194/gmd-13-6165-2020, 2020.
Shang, X., Giannakaki, E., Bohlmann, S., Filioglou, M., Saarto, A., Ruuskanen, A., Leskinen, A., Romakkaniemi, S., and Komppula, M.: Optical characterization of pure pollen types using a multi-wavelength Raman polarization lidar, Atmos. Chem. Phys., 20, 15323–15339, https://doi.org/10.5194/acp-20-15323-2020, 2020.
Shimizu, A., Sugimoto, N., Matsui, I., Arao, K., Uno, I., Murayama, T., Kagawa, N., Aoki, K., Uchiyama, A., and Yamazaki, A.: Continuous observations of Asian dust and other aerosols by polarization lidars in China and Japan during ACE-Asia, J. Geophys. Res.-Atmos., 109, D19S17, https://doi.org/10.1029/2002JD003253, 2004.
Siegel, D. A. and Deuser, W. G.: Trajectories of sinking particles in the Sargasso Sea: modeling of statistical funnels above deep-ocean sediment traps, Deep-Sea Res. Pt. I, 44, 1519–1541, https://doi.org/10.1016/S0967-0637(97)00028-9, 1997.
Siegel, D. A., Granata, T. C., Michaels, A. F., and Dickey, T. D.: Mesoscale eddy diffusion, particle sinking, and the interpretation of sediment trap data, J. Geophys. Res.-Oceans, 95, 5305–5311, https://doi.org/10.1029/JC095iC04p05305, 1990.
Sicard, M., Izquierdo, R., Alarcón, M., Belmonte, J., Comerón, A., and Baldasano, J. M.: Near-surface and columnar measurements with a micro pulse lidar of atmospheric pollen in Barcelona, Spain, Atmos. Chem. Phys., 16, 6805–6821, https://doi.org/10.5194/acp-16-6805-2016, 2016.
Simpson, D., Benedictow, A., Berge, H., Bergström, R., Emberson, L. D., Fagerli, H., Flechard, C. R., Hayman, G. D., Gauss, M., Jonson, J. E., Jenkin, M. E., Nyíri, A., Richter, C., Semeena, V. S., Tsyro, S., Tuovinen, J.-P., Valdebenito, Á., and Wind, P.: The EMEP MSC-W chemical transport model – technical description, Atmos. Chem. Phys., 12, 7825–7865, https://doi.org/10.5194/acp-12-7825-2012, 2012.
Stephens, G., Winker, D., Pelon, J., Trepte, C., Vane, D., Yuhas, C., L'Ecuyer, T., and Lebsock, M.: CloudSat and CALIPSO within the A-Train: Ten Years of Actively Observing the Earth System, B. Am. Meteorol. Soc., 99, 569–581, https://doi.org/10.1175/BAMS-D-16-0324.1, 2018.
Stoffelen, A., Pailleux, J., Källén, E., Vaughan, J. M., Isaksen, L., Flamant, P., Wergen, W., Andersson, E., Schyberg, H., Culoma, A., Meynart, R., Endemann, M., and Ingmann, P.: The atmospheric dynamics mission for global wind field measurement, Bulletin of the American Meteorological Society, 86, 73–88, https://doi.org/10.1175/BAMS-86-1-73, 2005.
Stuut, J.-B., Zabel, M., Ratmeyer, V., Helmke, P., Schefuß, E., Lavik, G., and Schneider, R.: Provenance of present-day eolian dust collected off NW Africa, J. Geophys. Res.-Atmos., 110, https://doi.org/10.1029/2004JD005161, 2005.
Sugimoto, N., Uno, I., Nishikawa, M., Shimizu, A., Matsui, I., Dong, X., Chen, Y., and Quan, H.: Record heavy Asian dust in Beijing in 2002: Observations and model analysis of recent events, Geophys. Res. Lett., 30, https://doi.org/10.1029/2002GL016349, 2003.
Tackett, J. L., Winker, D. M., Getzewich, B. J., Vaughan, M. A., Young, S. A., and Kar, J.: CALIPSO lidar level 3 aerosol profile product: version 3 algorithm design, Atmos. Meas. Tech., 11, 4129–4152, https://doi.org/10.5194/amt-11-4129-2018, 2018.
Tagliabue, A., Bowie, A. R., Boyd, P. W., Buck, K. N., Johnson, K. S., and Saito, M. A.: The integral role of iron in ocean biogeochemistry, Nature, 543, 51–59, https://doi.org/10.1038/nature21058, 2017.
Tegen, I., Harrison, S. P., Kohfeld, K., Prentice, I. C., Coe, M., and Heimann, M.: Impact of vegetation and preferential source areas on global dust aerosol: Results from a model study, J. Geophys. Res.-Atmos., 107, AAC 14-1–AAC 14-27, https://doi.org/10.1029/2001JD000963, 2002.
Tegen, I., Werner, M., Harrison, S. P., and Kohfeld, K. E.: Relative importance of climate and land use in determining present and future global soil dust emission, Geophys. Res. Lett., 31, https://doi.org/10.1029/2003GL019216, 2004.
Tegen, I., Heinold, B., Todd, M., Helmert, J., Washington, R., and Dubovik, O.: Modelling soil dust aerosol in the Bodélé depression during the BoDEx campaign, Atmos. Chem. Phys., 6, 4345–4359, https://doi.org/10.5194/acp-6-4345-2006, 2006.
Tesche, M., Ansmann, A., Müller, D., Althausen, D., Engelmann, R., Freudenthaler, V., and Gross, S.: Vertically resolved separation of dust and smoke over Cabo Verde using multiwavelength Raman and polarization lidars during Saharan Mineral Dust Experiment 2008, J. Geophys. Res.-Atmos., 114, D13202, https://doi.org/10.1029/2009JD011862, 2009.
Tesche, M., Gross, S., Ansmann, A., Müller, D., Althausen, D., Freudenthaler, V., and Esselborn, M.: Profiling of Saharan dust and biomass-burning smoke with multiwavelength polarization Raman lidar at Cabo Verde, Tellus B, 63, 649–676, https://doi.org/10.1111/j.1600-0889.2011.00548.x, 2011.
Toth, T. D., Campbell, J. R., Reid, J. S., Tackett, J. L., Vaughan, M. A., Zhang, J., and Marquis, J. W.: Minimum aerosol layer detection sensitivities and their subsequent impacts on aerosol optical thickness retrievals in CALIPSO level 2 data products, Atmos. Meas. Tech., 11, 499–514, https://doi.org/10.5194/amt-11-499-2018, 2018.
Tsamalis, C., Chédin, A., Pelon, J., and Capelle, V.: The seasonal vertical distribution of the Saharan Air Layer and its modulation by the wind, Atmos. Chem. Phys., 13, 11235–11257, https://doi.org/10.5194/acp-13-11235-2013, 2013.
Tyson, P. D., Garstang, M., Swap, R., Kallberg, P., and Edwards, M.: An air transport climatology for subtropical southern Africa, Int. J. Climatol., 16, 265–291, 1996.
van der Does, M., Korte, L. F., Munday, C. I., Brummer, G.-J. A., and Stuut, J.-B. W.: Particle size traces modern Saharan dust transport and deposition across the equatorial North Atlantic, Atmos. Chem. Phys., 16, 13697–13710, https://doi.org/10.5194/acp-16-13697-2016, 2016.
van der Does, M., Pourmand, A., Sharifi, A., and Stuut, J.-B. W.: North African mineral dust across the tropical Atlantic Ocean: Insights from dust particle size, radiogenic Sr-Nd-Hf isotopes and rare earth elements (REE), Aeolian Res., 33, 106–116, https://doi.org/10.1016/j.aeolia.2018.06.001, 2018a.
van der Does, M., Knippertz, P., Zschenderlein, P., Giles Harrison, R., and Stuut, J.-B. W.: The mysterious long-range transport of giant mineral dust particles, Sci. Adv., 4, eaau2768, https://doi.org/10.1126/sciadv.aau2768, 2018b.
van der Does, M., Brummer, G.-J. A., van Crimpen, F. C. J., Korte, L. F., Mahowald, N. M., Merkel, U., Yu, H., Zuidema, P., and Stuut, J.-B. W.: Tropical Rains Controlling Deposition of Saharan Dust Across the North Atlantic Ocean, Geophys. Res. Lett., 47, e2019GL086867, https://doi.org/10.1029/2019GL086867, 2020.
van der Does, M., Brummer, G.-J. A., Korte, L. F., and Stuut, J.-B. W.: Seasonality in Saharan Dust Across the Atlantic Ocean: From Atmospheric Transport to Seafloor Deposition, J. Geophys. Res.-Atmos., 126, e2021JD034614, https://doi.org/10.1029/2021JD034614, 2021.
van der Jagt, H., Friese, C., Stuut, J.-B. W., Fischer, G., and Iversen, M. H.: The ballasting effect of Saharan dust deposition on aggregate dynamics and carbon export: Aggregation, settling, and scavenging potential of marine snow, Limnol. Oceanogr., 63, 1386–1394, https://doi.org/10.1002/lno.10779, 2018.
van Noije, T. P. C., Le Sager, P., Segers, A. J., van Velthoven, P. F. J., Krol, M. C., Hazeleger, W., Williams, A. G., and Chambers, S. D.: Simulation of tropospheric chemistry and aerosols with the climate model EC-Earth, Geosci. Model Dev., 7, 2435–2475, https://doi.org/10.5194/gmd-7-2435-2014, 2014.
van Noije, T., Bergman, T., Le Sager, P., O'Donnell, D., Makkonen, R., Gonçalves-Ageitos, M., Döscher, R., Fladrich, U., von Hardenberg, J., Keskinen, J.-P., Korhonen, H., Laakso, A., Myriokefalitakis, S., Ollinaho, P., Pérez García-Pando, C., Reerink, T., Schrödner, R., Wyser, K., and Yang, S.: EC-Earth3-AerChem: a global climate model with interactive aerosols and atmospheric chemistry participating in CMIP6 , Geosci. Model Dev., 14, 5637–5668, https://doi.org/10.5194/gmd-14-5637-2021, 2021.
Vaughan, M., Garnier, A., Josset, D., Avery, M., Lee, K.-P., Liu, Z., Hunt, W., Pelon, J., Hu, Y., Burton, S., Hair, J., Tackett, J. L., Getzewich, B., Kar, J., and Rodier, S.: CALIPSO lidar calibration at 1064 nm: version 4 algorithm, Atmos. Meas. Tech., 12, 51–82, https://doi.org/10.5194/amt-12-51-2019, 2019.
Vaughan, M. A., Powell, K. A., Winker, D. M., Hostetler, C. A., Kuehn, R. E., Hunt, W. H., Getzewich, B. J., Young, S. A., Liu, Z., and McGill, M. J.: Fully Automated Detection of Cloud and Aerosol Layers in the CALIPSO Lidar Measurements, J. Atmos. Ocean. Tech., 26, 2034–2050, https://doi.org/10.1175/2009JTECHA1228.1, 2009.
Veselovskii, I., Goloub, P., Podvin, T., Bovchaliuk, V., Derimian, Y., Augustin, P., Fourmentin, M., Tanre, D., Korenskiy, M., Whiteman, D. N., Diallo, A., Ndiaye, T., Kolgotin, A., and Dubovik, O.: Retrieval of optical and physical properties of African dust from multiwavelength Raman lidar measurements during the SHADOW campaign in Senegal, Atmos. Chem. Phys., 16, 7013–7028, https://doi.org/10.5194/acp-16-7013-2016, 2016.
Veselovskii, I., Hu, Q., Goloub, P., Podvin, T., Barchunov, B., and Korenskii, M.: Combining Mie–Raman and fluorescence observations: a step forward in aerosol classification with lidar technology, Atmos. Meas. Tech., 15, 4881–4900, https://doi.org/10.5194/amt-15-4881-2022, 2022.
Vickery, K. J., Eckardt, F. D., and Bryant, R. G.: A sub-basin scale dust plume source frequency inventory for southern Africa, 2005–2008, Geophys. Res. Lett., 40, 5274–5279, https://doi.org/10.1002/grl.50968, 2013.
Vignati, E., Wilson, J., and Stier, P.: M7: An efficient size-resolved aerosol microphysics module for large-scale aerosol transport models, J. Geophys. Res.-Atmos., 109, https://doi.org/10.1029/2003JD004485, 2004.
Volk, T. and Hoffert, M. I.: Ocean Carbon Pumps: Analysis of Relative Strengths and Efficiencies in Ocean-Driven Atmospheric CO2 Changes, in: The Carbon Cycle and Atmospheric CO2: Natural Variations Archean to Present, American Geophysical Union (AGU), 99–110, https://doi.org/10.1029/GM032p0099, 1985.
Wallace, J. M. and Hobbs, P. V.: 3 – Atmospheric Thermodynamics, in: Atmospheric Science, 2nd Edn., Academic Press, San Diego, 63–111, https://doi.org/10.1016/B978-0-12-732951-2.50008-9, 2006.
Washington, R., Bouet, C., Cautenet, G., Mackenzie, E., Ashpole, I., Engelstaedter, S., Lizcano, G., Henderson, G. M., Schepanski, K., and Tegen, I.: Dust as a tipping element: the Bodélé Depression, Chad, P. Natl. Acad. Sci. USA, 106, 20564–20571, https://doi.org/10.1073/pnas.0711850106, 2009.
Wefer, G. and Fischer, G.: Seasonal patterns of vertical particle flux in equatorial and coastal upwelling areas of the eastern Atlantic, Deep-Sea Res. Pt. I, 40, 1613–1645, https://doi.org/10.1016/0967-0637(93)90019-Y, 1993.
Weinzierl, B., Ansmann, A., Prospero, J. M., Althausen, D., Benker, N., Chouza, F., Dollner, M., Farrell, D., Fomba, W. K., Freudenthaler, V., Gasteiger, J., Gross, S., Haarig, M., Heinold, B., Kandler, K., Kristensen, T. B., Mayol-Bracero, O. L., Müller, T., Reitebuch, O., Sauer, D., Schäfler, A., Schepanski, K., Spanu, A., Tegen, I., Toledano, C., and Walser, A.: The Saharan Aerosol Long-Range Transport and Aerosol–Cloud-Interaction Experiment: Overview and Selected Highlights, B. Am. Meteorol. Soc., 98, 1427–1451, https://doi.org/10.1175/BAMS-D-15-00142.1, 2016.
Wiegner, M., Gross, S., Freudenthaler, V., Schnell, F., and Gasteiger, J.: The May/June 2008 Saharan dust event over Munich: Intensive aerosol parameters from lidar measurements, J. Geophys. Res.-Atmos., 116, https://doi.org/10.1029/2011JD016619, 2011.
Winker, D. M., Hunt, W. H., and McGill, M. J.: Initial performance assessment of CALIOP, Geophys. Res. Lett., 34, https://doi.org/10.1029/2007GL030135, 2007.
Winker, D. M., Vaughan, M. A., Omar, A., Hu, Y., Powell, K. A., Liu, Z., Hunt, W. H., and Young, S. A.: Overview of the CALIPSO Mission and CALIOP Data Processing Algorithms, J. Atmos. Ocean. Tech., 26, 2310–2323, https://doi.org/10.1175/2009JTECHA1281.1, 2009.
Winker, D. M., Pelon, J., Coakley, J. A., Ackerman, S. A., Charlson, R. J., Colarco, P. R., Flamant, P., Fu, Q., Hoff, R. M., Kittaka, C., Kubar, T. L., Le Treut, H., Mccormick, M. P., Mégie, G., Poole, L., Powell, K., Trepte, C., Vaughan, M. A., and Wielicki, B. A.: The CALIPSO MissionA Global 3D View of Aerosols and Clouds, B. Am. Meteorol. Soc., 91, 1211–1230, https://doi.org/10.1175/2010BAMS3009.1, 2010.
Winker, D. M., Tackett, J. L., Getzewich, B. J., Liu, Z., Vaughan, M. A., and Rogers, R. R.: The global 3-D distribution of tropospheric aerosols as characterized by CALIOP, Atmos. Chem. Phys., 13, 3345–3361, https://doi.org/10.5194/acp-13-3345-2013, 2013.
Yorks, J. E., McGill, M. J., Palm, S. P., Hlavka, D. L., Selmer, P. A., Nowottnick, E. P., Vaughan, M. A., Rodier, S. D., and Hart, W. D.: An overview of the CATS level 1 processing algorithms and data products, Geophys. Res. Lett., 43, 4632–4639, https://doi.org/10.1002/2016GL068006, 2016.
Young, S. and Vaughan, M.: The retrieval of profiles of particulate extinction from Cloud Aerosol Lidar Infrared Pathfinder Satellite, Observations (CALIPSO) data: algorithm description, J. Atmos. Ocean. Tech., 26, 1105–1119, https://doi.org/10.1175/2008JTECHA1221.1, 2009.
Yu, H., Remer, L. A., Kahn, R. A., Chin, M., and Zhang, Y.: Satellite perspective of aerosol intercontinental transport: From qualitative tracking to quantitative characterization, Atmos. Res., 124, 73–100, https://doi.org/10.1016/j.atmosres.2012.12.013, 2013.
Yu, H., Chin, M., Yuan, T., Bian, H., Remer, L. A., Prospero, J. M., Omar, A., Winker, D., Yang, Y., Zhang, Y., Zhang, Z., and Zhao, C.: The fertilizing role of African dust in the Amazon rainforest: A first multiyear assessment based on data from Cloud-Aerosol Lidar and Infrared Pathfinder Satellite Observations, Geophys. Res. Lett., 42, 1984–1991, https://doi.org/10.1002/2015GL063040, 2015a.
Yu, H., Chin, M., Bian, H., Yuan, T., Prospero, J. M., Omar, A. H., Remer, L. A., Winker, D. M., Yang, Y., Zhang, Y., and Zhang, Z.: Quantification of trans-Atlantic dust transport from seven-year (2007–2013) record of CALIPSO lidar measurements, Remote Sens. Environ., 159, 232–249, https://doi.org/10.1016/j.rse.2014.12.010, 2015b.
Yu, H., Tan, Q., Chin, M., Remer, L. A., Kahn, R. A., Bian, H., Kim, D., Zhang, Z., Yuan, T., Omar, A. H., Winker, D. M., Levy, R. C., Kalashnikova, O., Crepeau, L., Capelle, V., and Chédin, A.: Estimates of African Dust Deposition Along the Trans-Atlantic Transit Using the Decadelong Record of Aerosol Measurements from CALIOP, MODIS, MISR, and IASI, J. Geophys. Res.-Atmos., 124, 7975–7996, https://doi.org/10.1029/2019JD030574, 2019.
Yu, H., Zhou, Y., Bian, H., and Song, Q.: Godzilla dust plume: Evolution of MODIS and GEOS AOD from June 10 to 30, 2020, TIB [video], https://doi.org/10.5446/50830, 2021.
Zender, C., Bian, H., and Newman, D.: Mineral Dust Entrainment and Deposition (DEAD) model: Description and 1990s dust climatology, J. Geophys. Res., 108, 4416–4437, https://doi.org/10.1029/2002jd002775, 2003.
Zeng, S., Vaughan, M., Liu, Z., Trepte, C., Kar, J., Omar, A., Winker, D., Lucker, P., Hu, Y., Getzewich, B., and Avery, M.: Application of high-dimensional fuzzy k-means cluster analysis to CALIOP/CALIPSO version 4.1 cloud–aerosol discrimination, Atmos. Meas. Tech., 12, 2261–2285, https://doi.org/10.5194/amt-12-2261-2019, 2019.
Zhang, K., O'Donnell, D., Kazil, J., Stier, P., Kinne, S., Lohmann, U., Ferrachat, S., Croft, B., Quaas, J., Wan, H., Rast, S., and Feichter, J.: The global aerosol-climate model ECHAM-HAM, version 2: sensitivity to improvements in process representations, Atmos. Chem. Phys., 12, 8911–8949, https://doi.org/10.5194/acp-12-8911-2012, 2012.