the Creative Commons Attribution 4.0 License.
the Creative Commons Attribution 4.0 License.
 | 26 Aug 2025
CAMELS-AUS v2: updated hydrometeorological time series and landscape attributes for an enlarged set of catchments in Australia
Keirnan J. A. Fowler
Ziqi Zhang
Xue Hou
This paper presents version 2 (v2) of the Australian edition of the Catchment Attributes and Meteorology for Large-sample Studies (CAMELS) series of datasets. Since publication in 2021, CAMELS-AUS (Australia) has served as a resource for the study of hydrological change, arid-zone hydrology and hydrological model improvement. In this update, the dataset has been significantly enhanced both temporally and spatially. The new dataset comprises information for more than twice as many catchments (561 compared to 222). The streamflow and climatic information have been updated with a further 8 years (to 2022 compared to 2014). Lastly, the catchment attribute information has been improved, particularly with respect to hydrological statistics (signatures) and uncertainty in streamflow. Together, these updates make CAMELS-AUS v2 a more comprehensive and current resource for hydrological research and applications. CAMELS-AUS v2 is freely downloadable from https://doi.org/10.5281/zenodo.12575680 (Fowler et al., 2024).
- Article
(2379 KB) - Full-text XML
- Version 2021
- BibTeX
- EndNote


Large-sample hydrology plays a crucial role in understanding hydrological processes across diverse catchments and is essential for developing generalisable insights in hydrology (Gupta et al., 2014). The large-sample approach enhances the robustness and generalisability of hydrological models, contributes to schemes for prediction in ungauged or poorly gauged regions, and contributes to the development of machine learning methods in hydrology (Addor et al., 2019; Kratzert et al., 2023). Among many large-sample hydrology datasets and projects, the CAMELS initiative (Catchment Attributes and Meteorology for Large-sample Studies) is a prominent example, offering comprehensive data for various regions including the United States (Newman et al., 2015; Addor et al., 2017), Great Britain (Coxon et al., 2020), Chile (Alvarez-Garreton et al., 2018), Brazil (Chagas et al., 2020), France (Delaigue et al., 2022), Switzerland (Höge et al., 2023), Sweden (Teutschbein, 2024) and India (Mangukiya et al., 2025). These datasets provide streamflow data, climatic information suitable as forcing data for hydrological modelling, and catchment attributes such as catchment properties and hydroclimatic statistics.
This paper presents the second version of CAMELS-AUS, the CAMELS dataset for Australia. Since publication in 2021 (Fowler et al., 2021a), CAMELS-AUS has supported a wide variety of hydrological studies, including the development and testing of machine learning techniques (Kapoor et al., 2023), exploring properties and causes of hydrological drought (Fowler et al., 2022; Brunner and Stahl, 2023), and road-testing methods for rainfall–runoff and river system modelling (Fowler et al., 2021b; John et al., 2021; McInerney et al., 2024). A particular focus has been the study of evapotranspiration as CAMELS-AUS is one of few large-sample hydrology datasets providing several potential evapotranspiration formulations (Abbas et al., 2022; Kim et al., 2022; Niu et al., 2024). Many studies have combined CAMELS-AUS with other datasets to create near-global samples of catchments (e.g. McMillan et al., 2022; Althoff and Destouni, 2023; Chen and Ruan, 2023; Wang et al., 2023; Lei et al., 2024; Rasiya Koya and Roy, 2024; van Oorschot et al., 2024). Responding to the same imperative to create combined datasets, the CAMELS datasets have recently been merged into a global freely available dataset, termed CARAVAN, with a particular focus on consistency and inter-continental comparability (Kratzert et al., 2023).
Given the wide spectrum of research activity supported by CAMELS-AUS, it is highly desirable to update and expand the dataset where possible. The current expansion has been facilitated by recent updates to the CAMELS-AUS source datasets, which have made streamflow information easily available for a wider set of catchments. Specifically, the Hydrological Reference Stations (HRS) dataset, maintained by Australia's Bureau of Meteorology (BOM), which provided the streamflow component of CAMELS-AUS v1, has been updated with a significant increase in the number of catchments. Note that the contribution of the HRS to CAMELS-AUS is limited to streamflow data, while non-streamflow data (hydroclimatic time series and catchment attributes) are sourced from elsewhere. An additional factor is the opportunity to augment the catchment set via a separate dataset which has become available since publication of CAMELS-AUS v1. This second dataset (Saft et al., 2023) has been used by several hydrological studies in Australia (see list in Sect. 3.2.2). Although most Saft et al. (2023) catchments are also in HRS, including all such catchments gives users the option to adopt the same selection of catchments as these earlier studies, improving comparability between different research efforts (see Sect. 3.2.2 for more details).
The remainder of this paper is concerned with describing the changes between v1 and v2 in more detail (Sect. 3) in addition to providing guidance and advice for users of the new dataset (Sect. 4). The Appendix provides tables with information on each hydrometeorological time series and each catchment attribute, highlighting new or altered information for this update.
3.1 Overview of changes
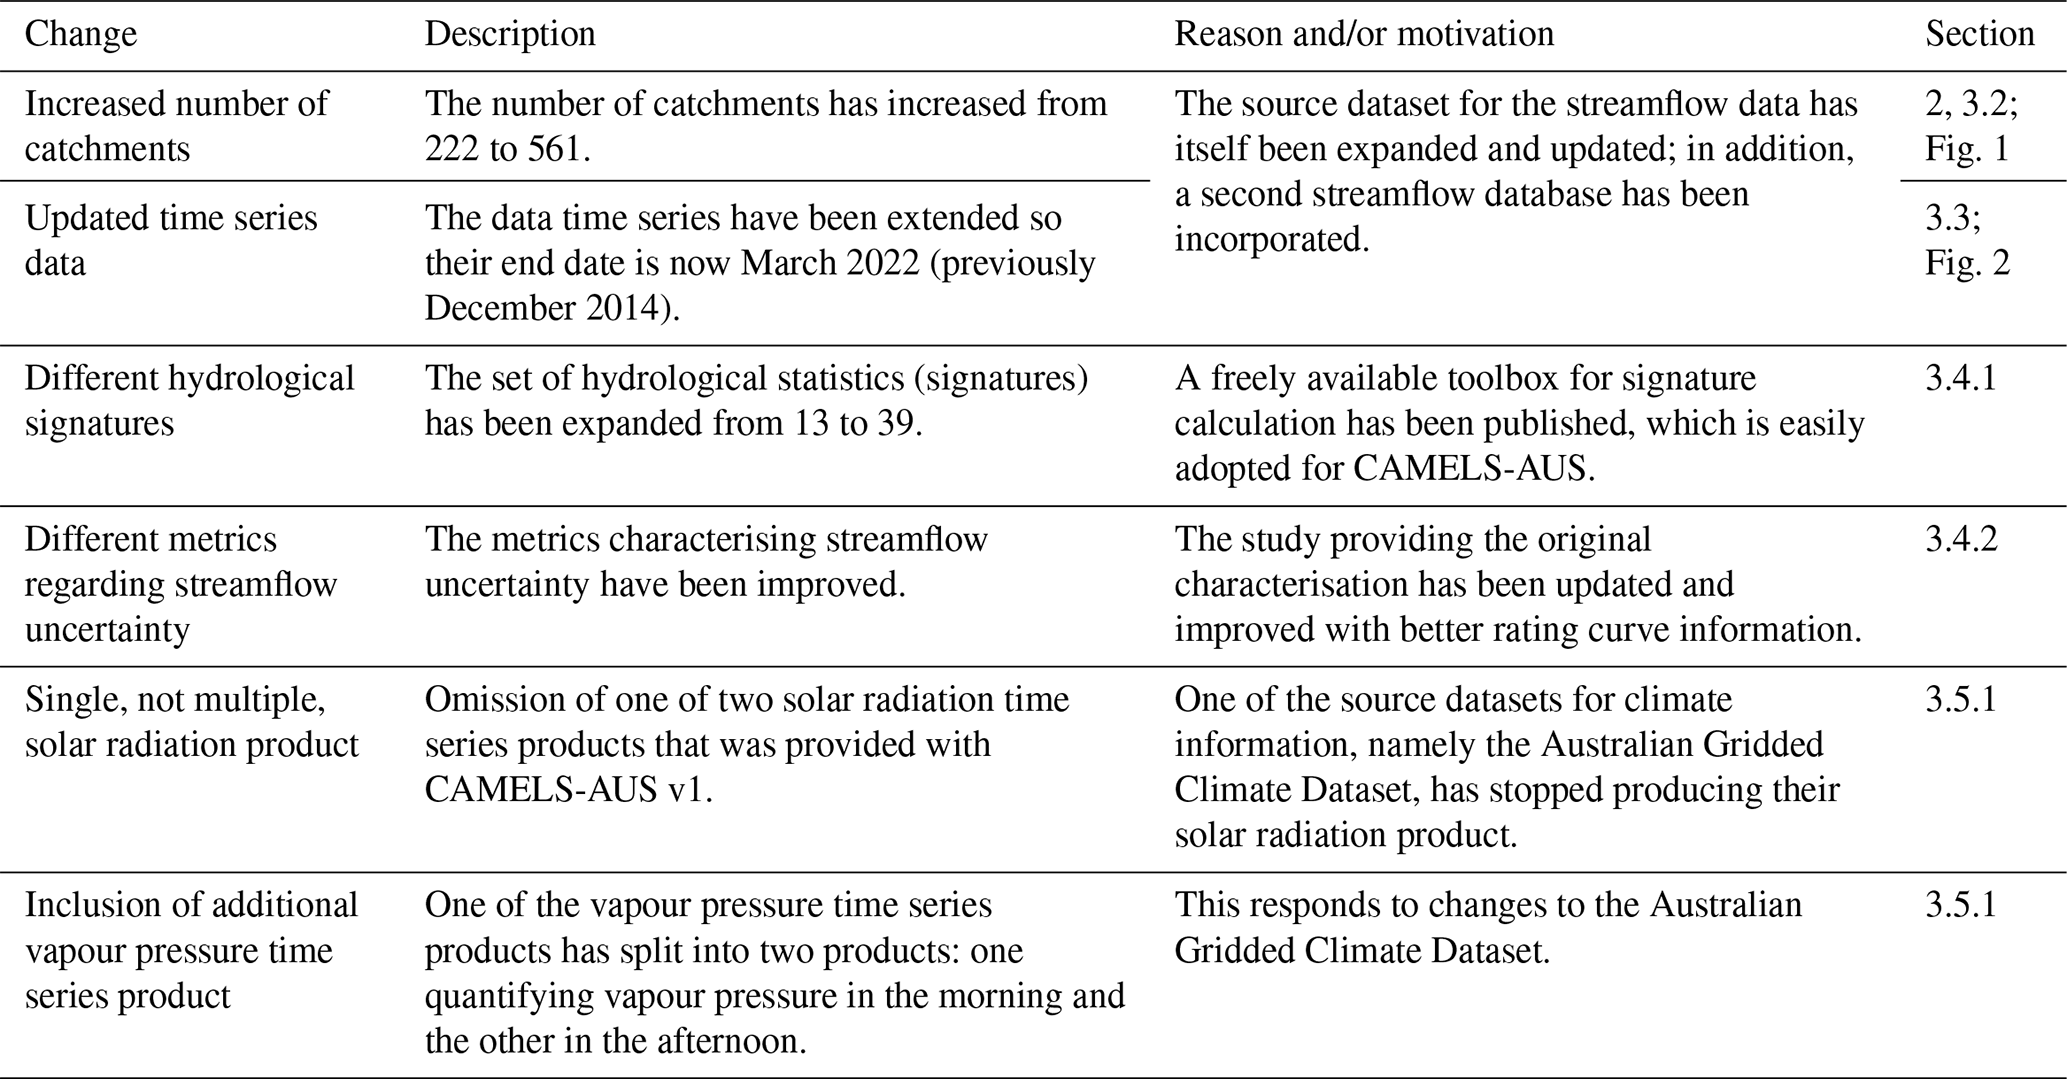
Table 1 summarises the changes made to CAMELS-AUS for v2. Aside from the additional catchments, several minor changes have been made, some opportunistically as better information has become available, while others are responding to changes in source datasets.
Table 1Summary of changes to CAMELS-AUS dataset for version 2.
3.2 Enlarging the selection of catchments
As mentioned, the primary change to the dataset is an increase in the number of catchments from 222 to 561. All the original catchments have been retained, with additional catchments originating from
-
an update to the source dataset of CAMELS-AUS v1, namely the Hydrological Reference Stations compiled by Australia's Bureau of Meteorology;
-
inclusion of additional catchments from the dataset of Saft et al. (2023), which has supported several hydrological studies, as outlined below.
These data sources are each discussed in more detail in the following subsections.
Figure 1 shows the spatial distribution of the updated set. This figure demonstrates that the updated set provides denser coverage overall in addition to newfound coverage for some areas of Australia, notably in the west.
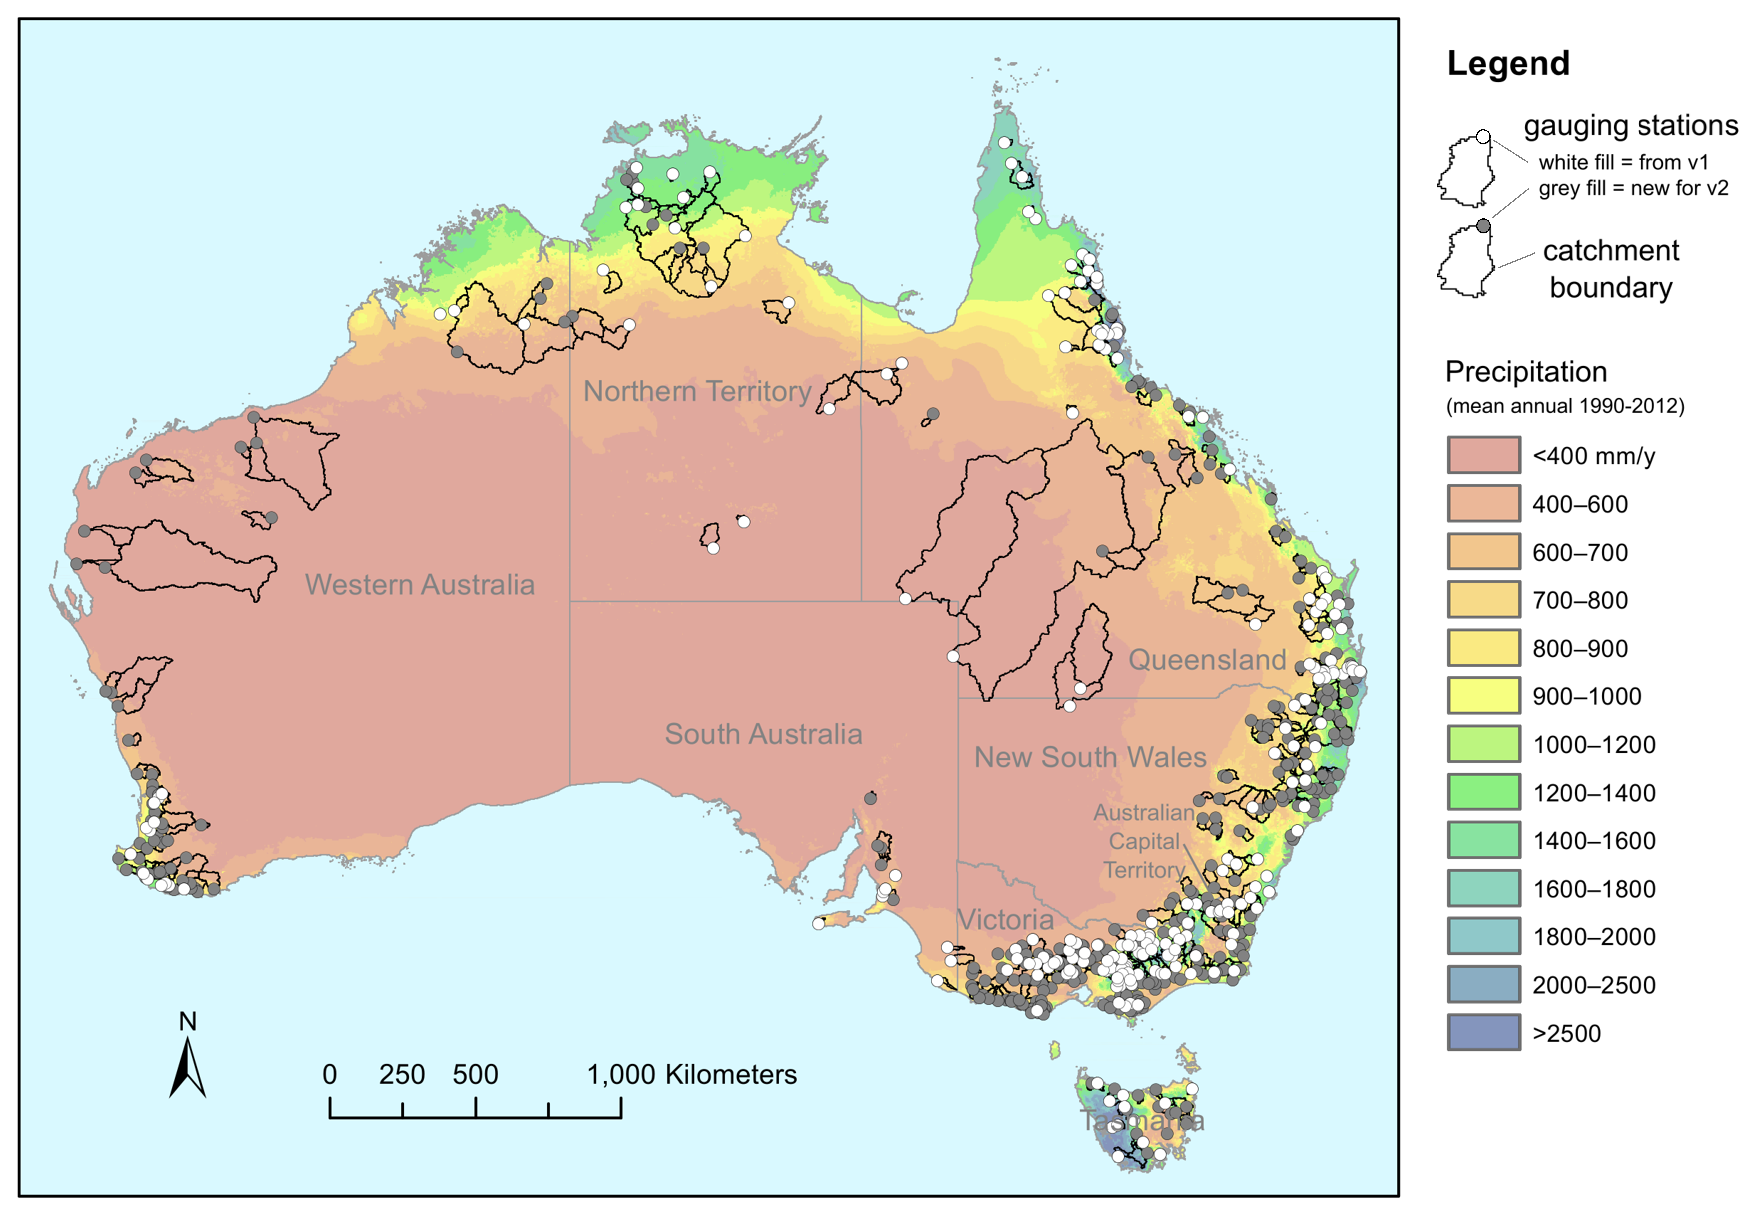
Figure 1Map after Fowler et al. (2021a) showing the location of the CAMELS-AUS flow gauging stations and catchments, distinguishing v1 catchments from those added for v2. Shown along with mean annual precipitation (from Jones et al., 2009) and Australian states and territories.
3.2.1 Hydrologic reference stations (HRS) update
The HRS, first published in 2013, was updated in 2015 (HRS-2015 – the basis for CAMELS-AUS v1) and subsequently in 2020 and 2022. HRS-2020 was notable for considering a wider range of catchments than before while also tightening the rules for station selection, as discussed below. HRS-2015 had 222 catchments, while HRS-2020 saw the number of catchments increase to 467. A further update in 2022 (HRS-2022) extended the streamflow time series without altering catchment selection, and this latest update is adopted for CAMELS-AUS v2.
Note that all actions described in Sect. 3.2.1 were taken by Australia's Bureau of Meteorology, not the authors. Further information on these actions can be found at http://www.bom.gov.au/water/hrs/update_2020.shtml (last access: 3 December 2024).
When station selection was undertaken for HRS-2013, data quality information such as quality codes and rating curves was not available for some catchments. For affected catchments, the issue was not that this information did not exist but rather that it was not provided by the data owners (the states and territories of Australia) in time for the selection process. This led to a relatively smaller sample of catchments being initially considered for HRS-2013. Later, during the selection process for HRS-2020, this information was available for a much wider set of catchments. In addition, the selection requirements – namely, the requirement of a 30 years' record with less than 5 % missing data – were more easily met due to the passage of time between the two updates.
However, two rules were more restrictive than before – namely, the following:
-
no more than 25 % of measured flow volume could be extrapolated above the highest available rating, and
-
missing data could constitute a maximum of 10 % by volume (where volumes on missing days were estimated via a rainfall–runoff model).
The first of these rules was new, whereas the second one was a redefinition of an existing missing data rule.
Of the 222 HRS-2015 stations, 179 were included in HRS-2020, while 43 failed the new selection guidelines. In addition to the 179 catchments from the previous version, HRS-2020 included 288 new catchments that were not previously included, for a total of 467.
Despite the omission of these 43 failed catchments from HRS-2020, they are included in CAMELS-AUS v2. Partly, this is to allow for users of CAMELS-AUS v1 who may wish to continue to use the same set of catchments as before. More broadly, while we do not intend to trivialise the issues of missing data or flow extrapolation, we prefer to provide information relevant to these issues directly to CAMELS-AUS users (e.g. uncertainty information; Sect. 3.4.2) and then let users decide upon the inclusion or otherwise of such catchments depending on the study context. However, we do provide some guidance on this issue in Sect. 4.2.
Given the above, the net effect of the 2020 HRS update to the CAMELS-AUS dataset is the addition of 288 catchments to CAMELS-AUS v2 compared to v1, while no catchments are removed. Note that the adopted basis for CAMELS-AUS v2 is the most recent HRS version (HRS-2022), which updated time series data without altering HRS-2020 catchment selection.
3.2.2 Saft et al. (2023) dataset
The Saft et al. (2023) dataset was compiled with the support of the State Government of Victoria and covers only that state. It is a significant dataset in the sense that it has been used by several hydrological studies, including Peterson et al. (2021), Trotter et al. (2021, 2023, 2024), Gardiya Weligamage et al. (2021, 2023, 2024) and Fowler et al. (2022). Given the importance of those studies in examining recent unusual hydrological behaviour in response to multi-year drought, we wish to give users the option to adopt the same selection of catchments as the earlier studies, and thus we include any catchment in the Saft dataset not otherwise present in CAMELS-AUS v1 or HRS-2020 – a total of 51 catchments. This is done using the streamflow data provided by Saft et al. (2023) for those 51 catchments.
The rules used for catchment selection are listed in Peterson et al. (2021). In summary, the criteria include the consideration of upstream reservoirs and diversions, which can sum to a maximum of 5 % of mean annual streamflow. Separate criteria were framed around availability of high-quality data associated with the multi-year drought that formed the focus of all the above studies, called the millennium drought (1997–2010). Catchments were eliminated with less than 15, 7 or 5 years of streamflow data prior to, during or after this drought, respectively.
3.2.3 Summary of changes to catchment selection
In summary, CAMELS-AUS v1 had 222 catchments to which 288 catchments have been added from the 2020 HRS update, and a further 51 have been added from Saft et al. (2023). Thus, the total number of catchments in CAMELS-AUS v2 is 561.
3.3 Updating time series to 2022
Relative to the temporal coverage of CAMELS-AUS v1 (to 2014), the new source datasets both have more recent data. Time series data in CAMELS-AUS v2 are now provided up to 31 March 2022. Figure 2 shows the range of record length across the updated catchment sample, along with missing data proportions for different periods.
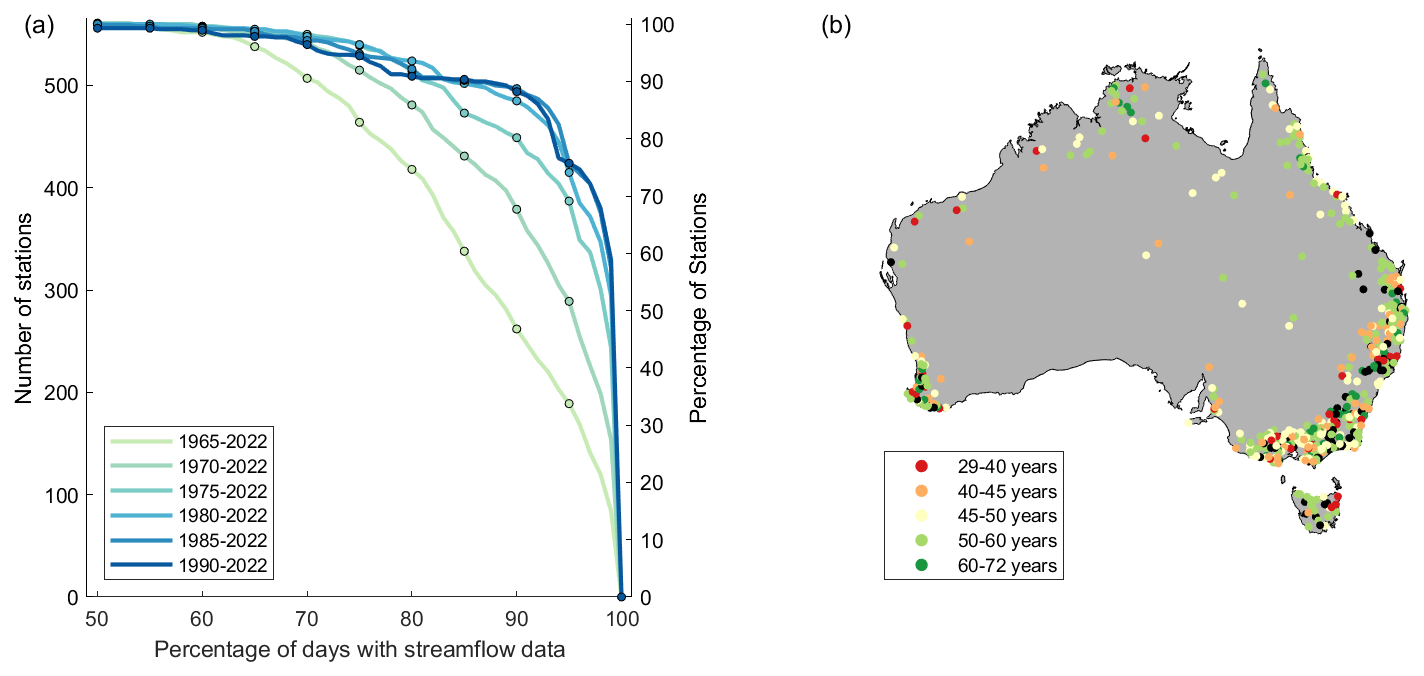
Figure 2Figure after Fowler et al. (2021a) and Coxon et al. (2020) showing (a) the number of stations with percentage of available streamflow data for different periods and (b) the length of the flow time series for each gauge.
3.4 Improved attributes
Most of the attributes remain unchanged, but the following subsections outline the exceptions where the formulation or calculation of the attribute did change relative to version 1. Figure 3 shows the spatial distribution of selected attributes using the updated methods and catchment set.
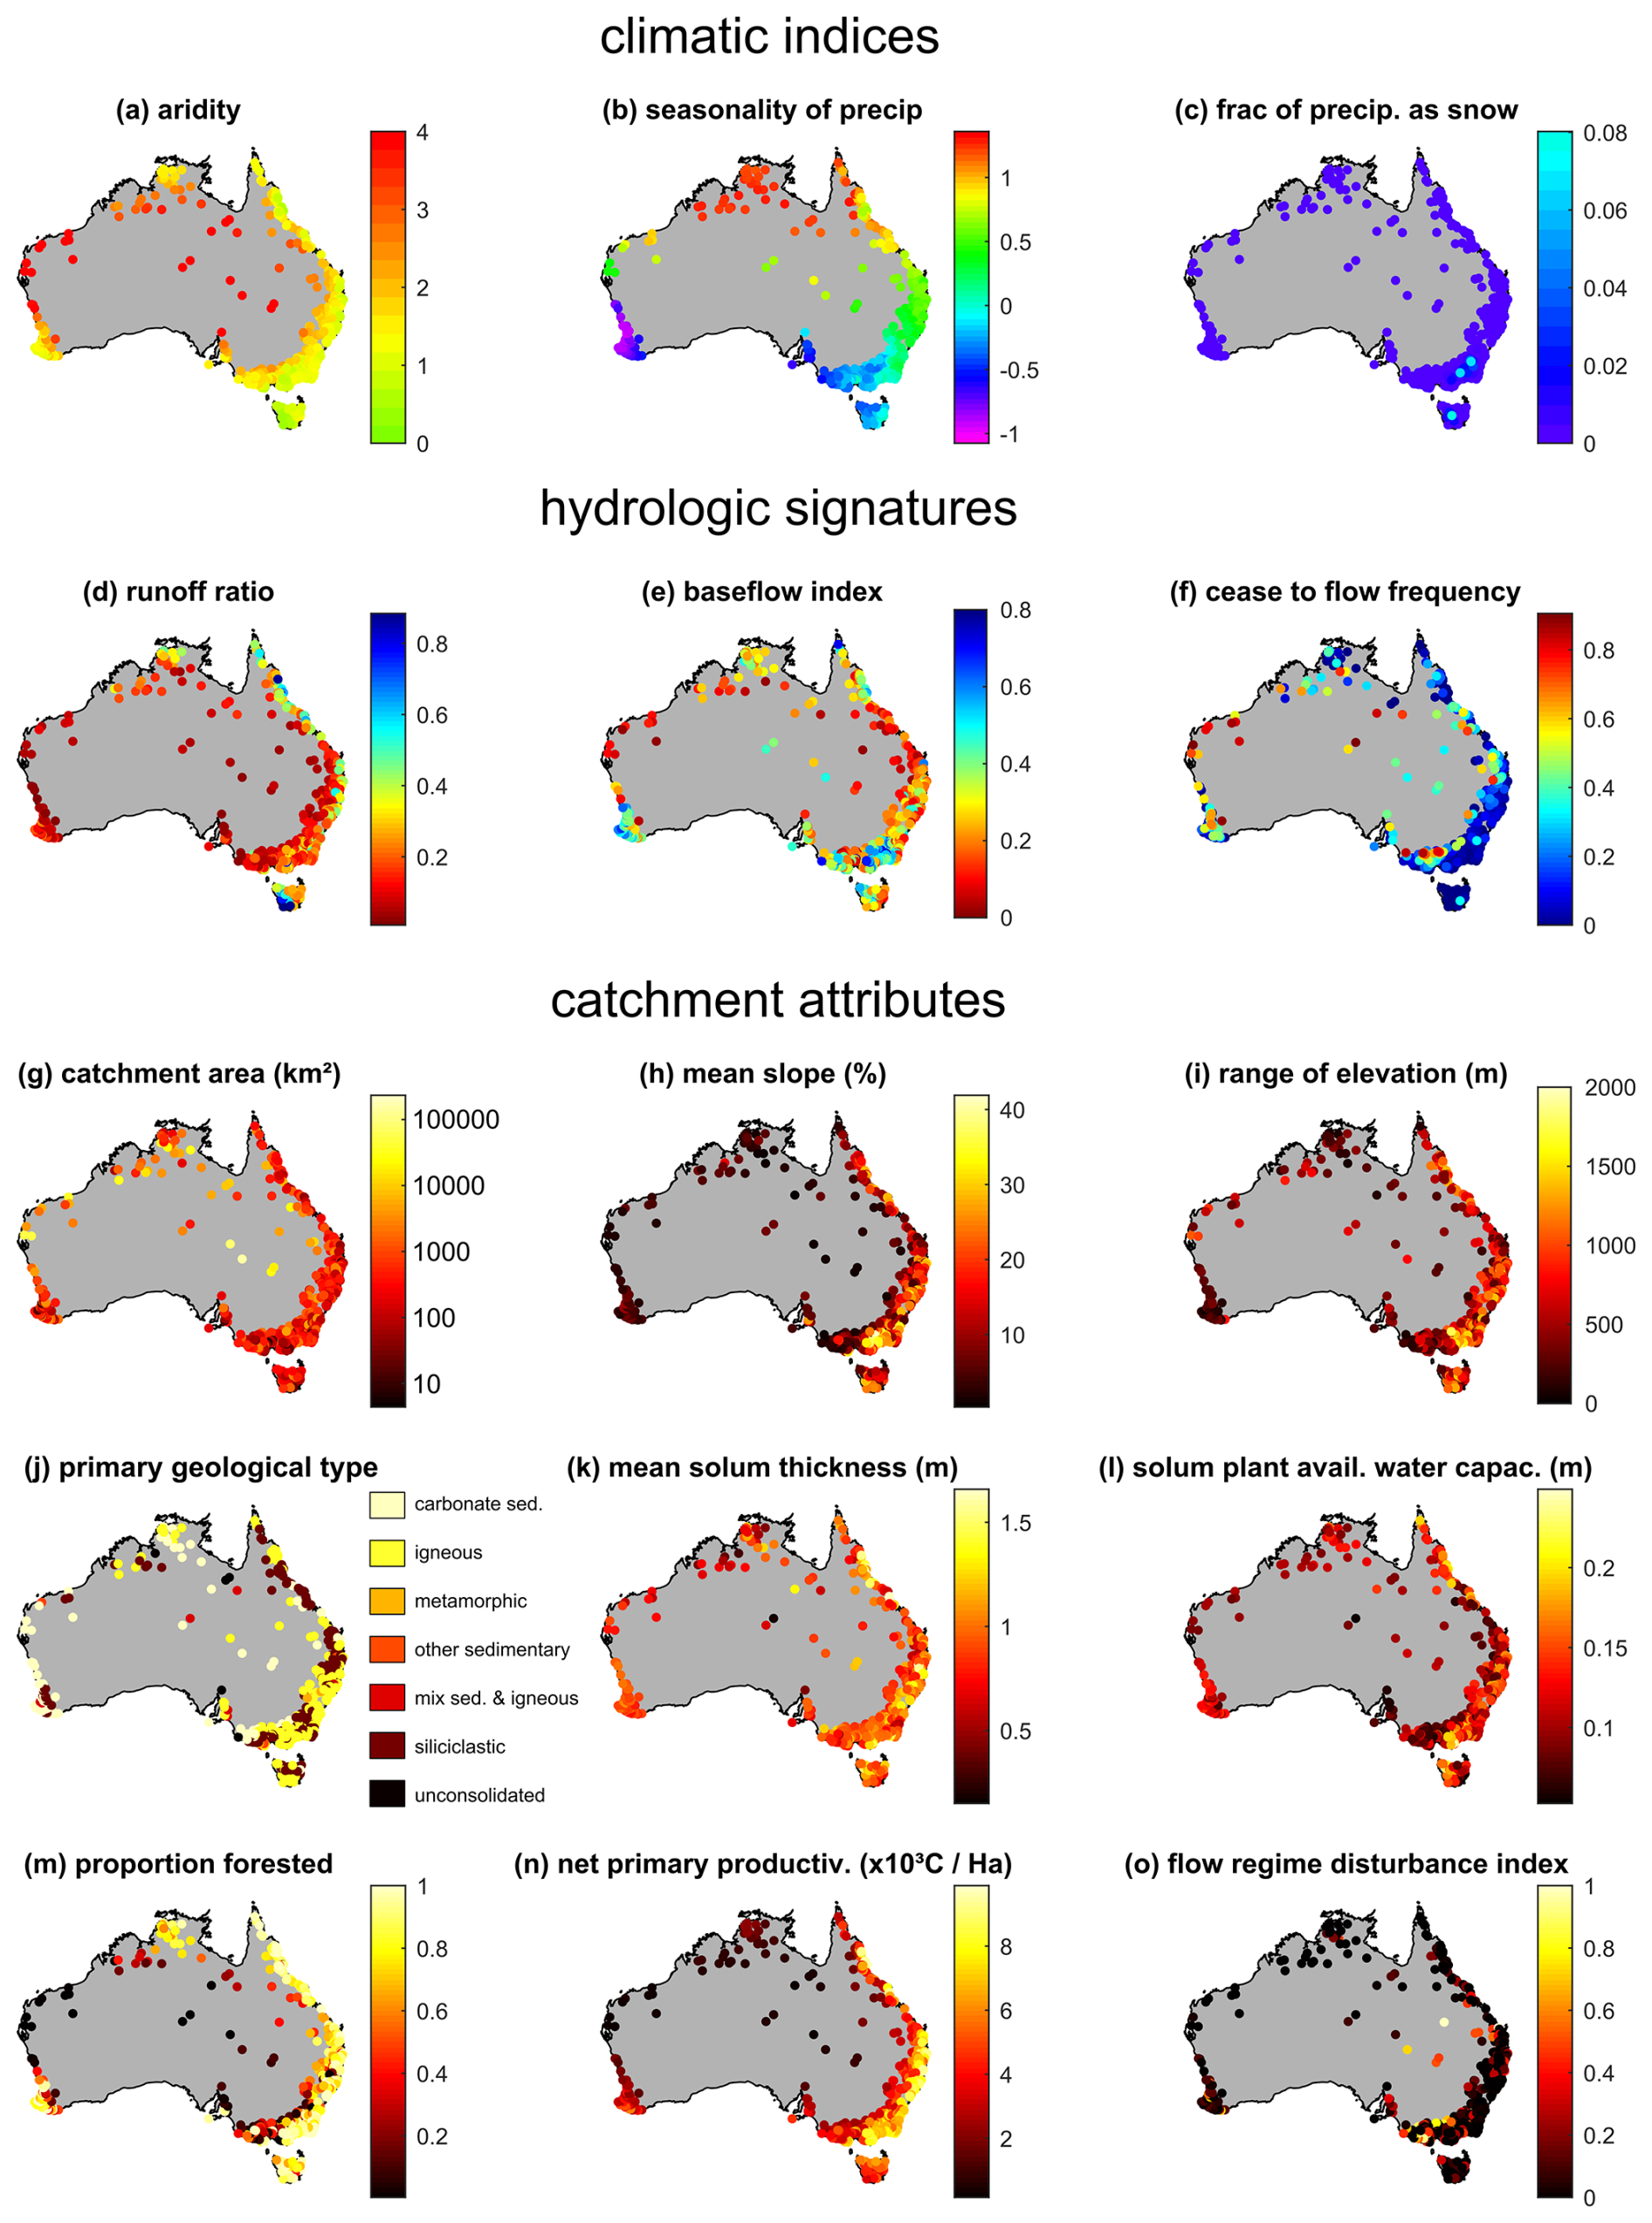
Figure 3Maps of selected climatic indices (a–c), hydrologic signatures (d–f) and other catchment attributes (g–o). For definitions, see Tables A3 and A4; for easy identification, attributes shown here are written in bold in those tables.
3.4.1 Hydrological signatures
In the new version of CAMELS-AUS, we have transitioned to using TOSSH (Toolbox for Streamflow Signatures in Hydrology; Gnann et al., 2021) for calculating streamflow statistics (signatures). TOSSH offers a comprehensive and standardised approach to signature calculations, incorporating both the 13 signatures used in CAMELS-AUS version 1 by Addor et al. (2018) and additional signatures from related research (e.g. Sawicz et al., 2011; Euser et al., 2013; McMillan, 2020).
We ran all the calculation functions in TOSSH and obtained a unique set of 49 streamflow signatures (note the number of signatures in Gnann et al. (2021) appears greater, but some functions produce overlapping results). Among these, 10 signatures have multiple outputs, so we stored only the 39 single-output signatures in the dataset attribute table. For users who need the complete set, we also provided a .mat file that includes all outputs of TOSSH, including the 49 signatures and associated information such as run-time messages. For easy use, we categorised the 39 single-output signatures into six categories based on Poff et al. (1997): magnitude, frequency, duration, timing, rate of change and other. Within each category, the signatures are ordered alphabetically (see Table A3 for details).
3.4.2 Metrics of streamflow uncertainty
We have adopted the new method proposed by McMahon et al. (2024) for streamflow uncertainty assessment. This method offers a straightforward and practical approach for estimating uncertainty in daily streamflow data. For CAMELS-AUS v1, the uncertainty information was from an earlier study (McMahon and Peel, 2019) which was not provided with the rating curves used for flow estimation (only the raw data) and thus was forced to use a method (Chebyshev polynomials) to estimate its own rating curves. Since then, the Bureau of Meteorology organised for the same authors to be supplied with the actual rating curves, leading to a new study (McMahon et al., 2024) using this updated information. McMahon et al. (2024) post-processed their data for 459 stations in CAMELS-AUS v2 to derive the following statistics (Table A3): (i) the number of unique rating curves; (ii) the root mean square error (RMSE) of the gauged versus rating curve discharges as a percentage of the mean discharge for all non-zero gauged values, the lower half of non-zero gauged values and the upper half of non-zero gauged values; (iii) the percentage of days for which the published discharge values exceed the maximum gauged discharge; and (iv) the percentage of the total discharge volume that is above the maximum gauged discharge.
3.5 Other changes
3.5.1 Changes to hydrometeorological data
A significant source of gridded climate information is the Bureau of Meteorology's Australian Gridded Climate Dataset (AGCD). This superseded an earlier programme called the Australian Water Availability Project (AWAP). Thus, whereas v1 of CAMELS-AUS referred to AWAP, v2 refers to AGCD instead. Regarding changes to the underlying methods, the following applies:
-
Our understanding is that no changes have been made to the underlying method in the case of temperature and precipitation data.
Significant investment was made to improve the monthly gridded precipitation dataset, as described in Evans et al. (2020). However, the monthly data are not included with CAMELS-AUS, and the improvement efforts have not affected the daily gridded precipitation dataset, the derivation of which is described by Jones et al. (2009).
-
Regarding solar radiation, whereas AWAP provided solar radiation, the most recent update of AGCD (v1.0.1) no longer includes solar radiation data, but solar radiation data are still provided within CAMELS-AUS v2 from an alternate source (namely, the Scientific Information for Land Owners, SILO, dataset, as it was in v1).
-
Regarding vapour pressure, the AGCD now provides two variants of vapour pressure data collected at either 09:00 or 15:00 local time (Jones et al., 2009; https://doi.org/10.25914/hjqj-0x55), and each is incorporated into CAMELS-AUS, as shown in Table A2.
Here we provide guidance for users on various issues and decisions to be made when using the updated dataset.
4.1 Karst topography
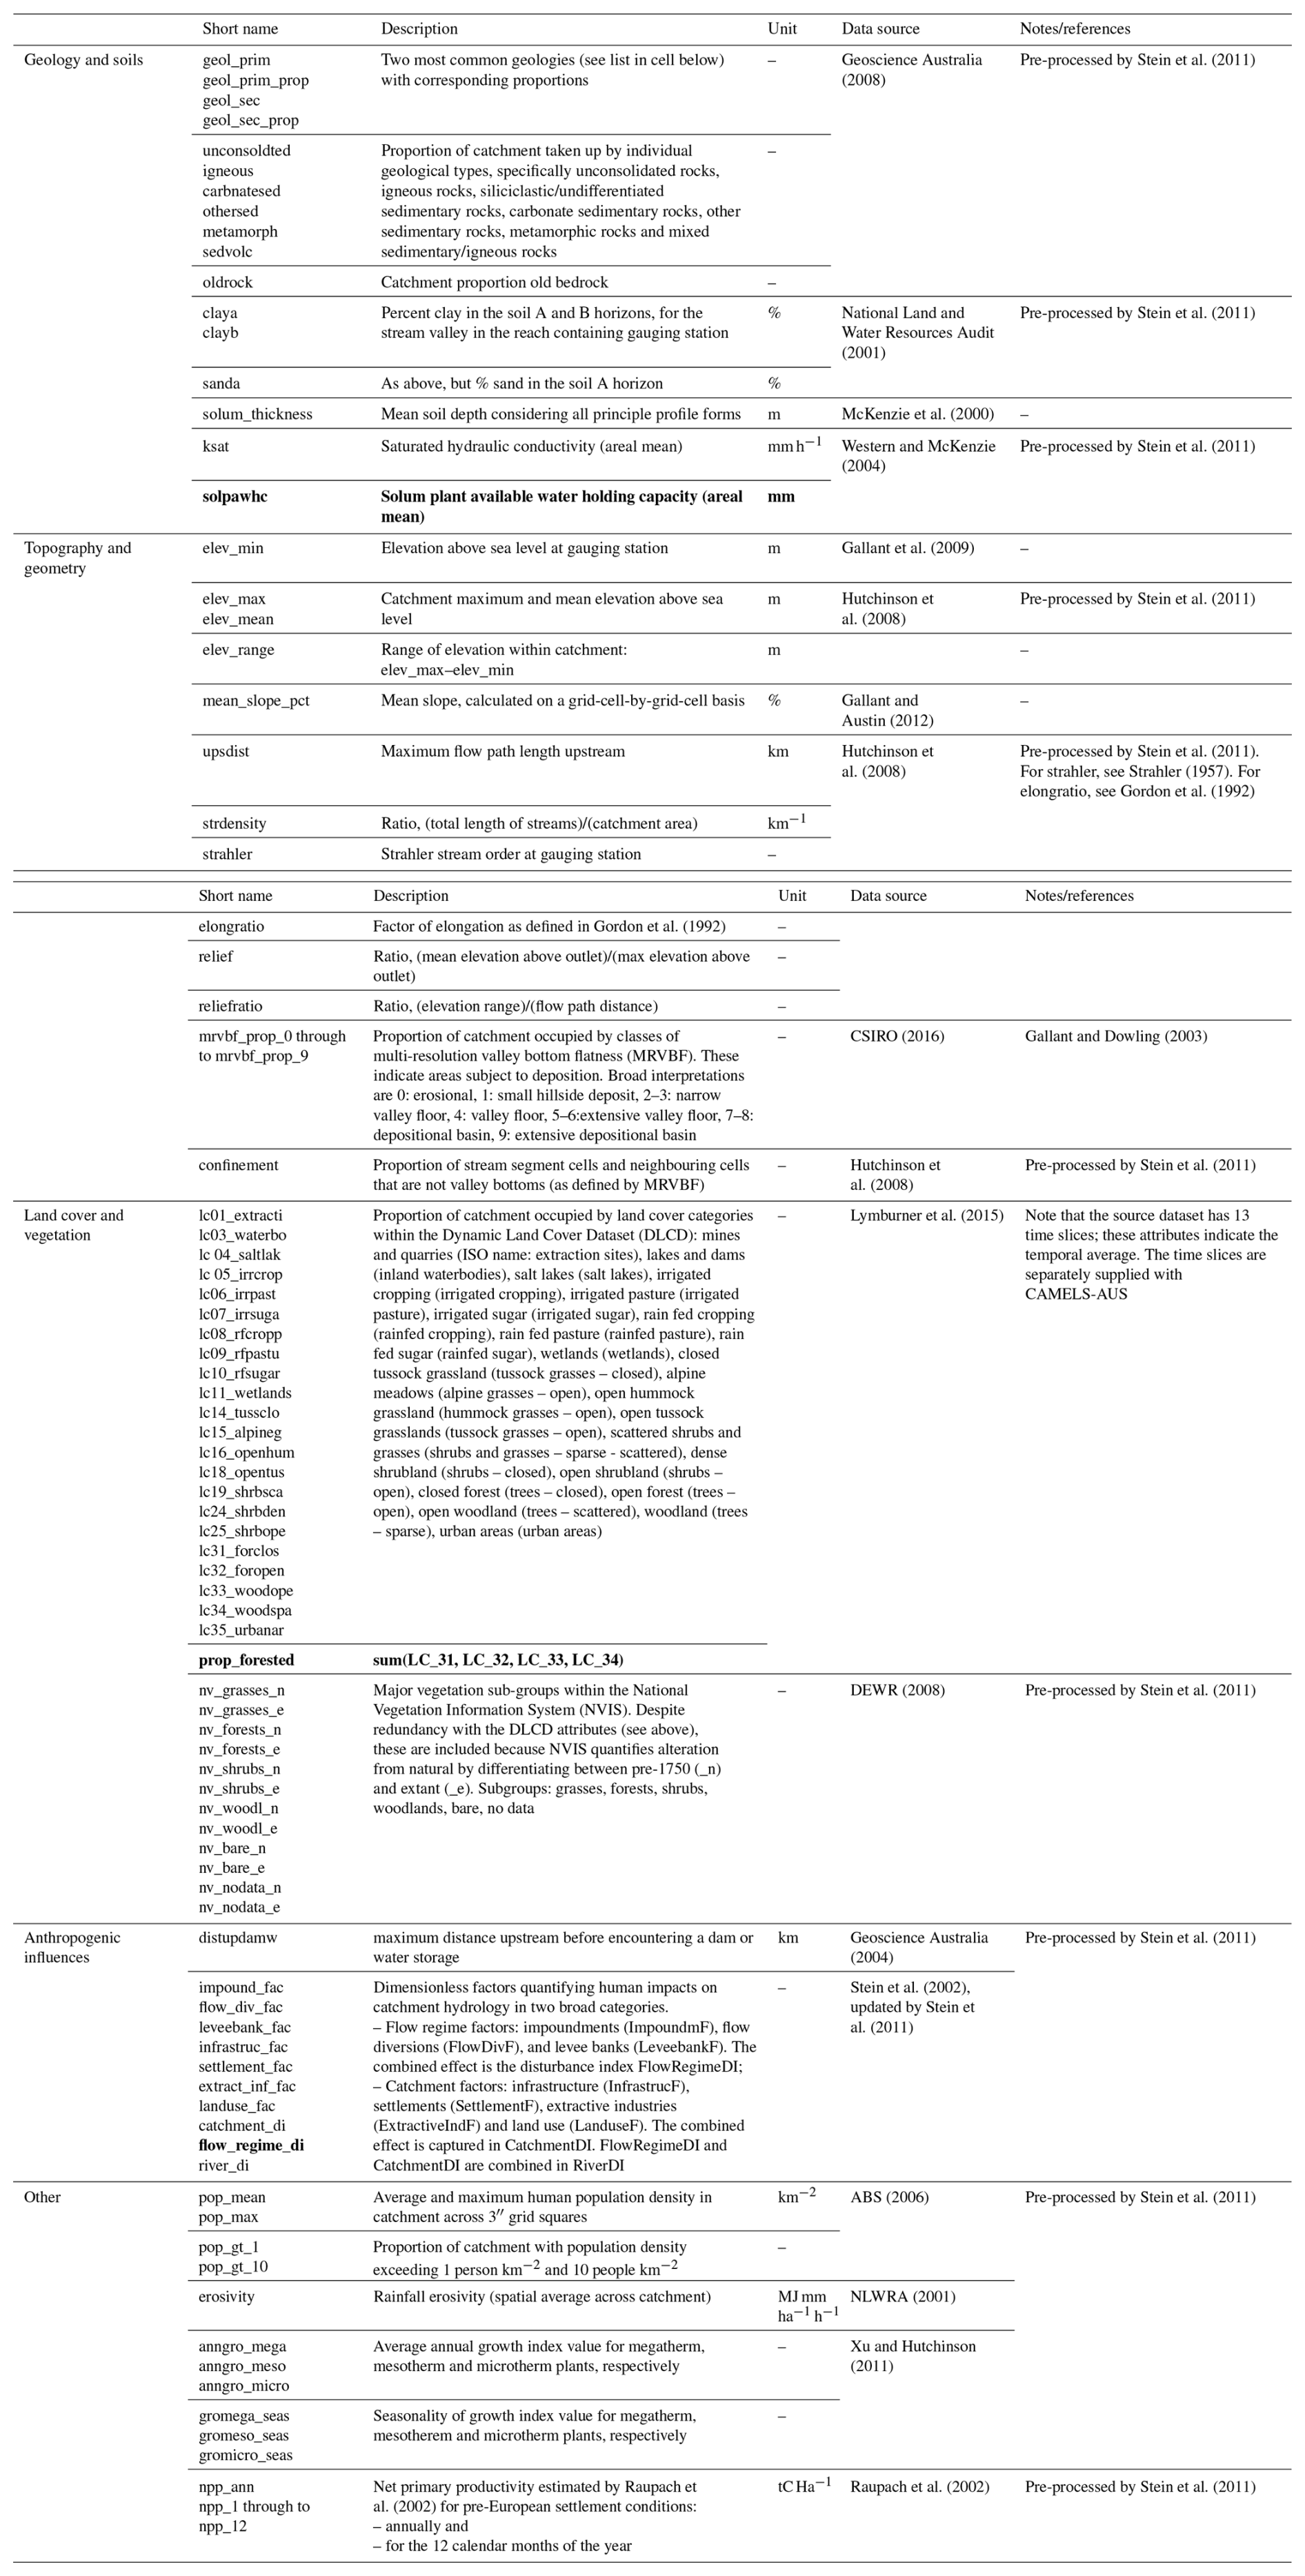
Karst topography, characterised by drainage systems such as sinkholes and caves, can significantly affect surface runoff. Thus, it is important to note any catchments that are affected. Karst topography is relatively rare in Australia, and as such, the relevant Geoscience Australia dataset (Geoscience Australia, 2008) reveals that only 20 catchments contain any carbonate sedimentary rocks. Of these, the only five that have more than 10 % covered are 912105A (approximately 60 % covered by this rock type), 912101A (50 %), G8110004 (50 %), 304040 (30 %) and G9070142 (15 %). This coverage should be considered when users are analysing hydrological information or modelling results from these catchments.
4.2 Decisions regarding catchment choice
Although the extra catchments are welcome in this dataset, the difference in quality standards applied among the source datasets does raise questions for users. For example, since many of the original catchments (from version 1) were subsequently excluded from HRS2022 based on data quality rules, the question arises as to whether users should now avoid such catchments even though they are included in CAMELS-AUS v2. A key focus for the data quality rules is the degree of extrapolation of the rating curve since this affects uncertainty. However, some studies can account for variable levels of uncertainty because they explicitly consider it in the study design (this could be done with reference to the CAMELS-AUS v1 and v2 attributes regarding uncertainty; see Sect. 3.4.2 above and Fowler et al., 2021a). For such studies, it is recommended that all 561 catchments are used. Furthermore, for studies that combine across several datasets, vetting the catchments may have limited value unless such vetting is done consistently across the other datasets, which might be difficult given that uncertainty information is different for different datasets (or omitted entirely). Ultimately, it is a question of whether the information content in those catchments outweighs the increased uncertainty in their data, and the answer to this question is context-specific because it depends on how the data are being used. We recommend that researchers give due consideration to these matters, including the option of using the smaller subset of 467 catchments from HRS2022.
Furthermore, some users of the dataset may seek a set of catchments that are almost natural (i.e. mostly free of human impact). To identify such rivers, Stein et al. (2002) defined various indices of disturbance (see the anthropogenic influences section of Table A4). They suggested that the aggregate index (river disturbance index or river_di in Table A4) should ideally be below 0.01 for truly wild rivers, but this may be untenable for a large-sample study since only 20 out of 561 CAMELS-AUS v2 catchments are under this threshold. Stein et al. (2002) also tested a threshold of 0.05, and this threshold provides a sample of 81 catchments which are relatively well spread over Australia's climatic zones (not shown). Thus, a threshold of 0.05 is recommended for users seeking a set of catchments that are almost natural. Lastly, note that a key factor that disqualifies many catchments is altered land use relative to pre-European settlement; thus, studies seeking a larger sample size of almost natural catchments might consider relaxing this criterion first.
4.3 Decisions regarding selection of forcing data for modelling
The next decision is the selection of forcing data – namely, which precipitation and which potential evapotranspiration product should be used for hydrological modelling. Whereas many large-sample datasets have only one option, CAMELS-AUS has several, and in the interests of consistency between studies, it is useful to nominate which dataset is the preferred option. For potential evapotranspiration, the Australian Gridded Climate Dataset (AGDC) provides no estimates, and thus a SILO product must be adopted, but the question remains of which formulation to adopt. Some formulations contain rather specific assumptions (regarding crops being grown) which may not be appropriate in broader contexts including natural catchments; this disqualifies the FAO56 short-crop and the ASCE tall-crop formulations. Other formulations are disqualified because they give no consideration to land–atmosphere feedbacks whereby evaporated water can change the properties of the overlying air mass. Such considerations are important when modelling at catchment scale and greater, so this disqualifies the pan evaporation and Morton point potential estimates. The Morton wet environment evaporation is recommended as it avoids both these criticisms.
For precipitation, we feel either product is suitable for modelling purposes, but we recommend the AGCD gridded precipitation product over SILO. The SILO interpolation “is set to accurately reproduce the observed data” (Tozer et al., 2012), meaning that SILO matches its calibration gauges much more closely than AGCD. For example, Tozer et al. (2012) reported that the Nash–Sutcliffe efficiency scores exceed 0.99 in approximately half of the stations tested. Given each 0.05° grid cell covers an area of approximately 25 km2 or 10 mi2, in our opinion it is unreasonable to expect that the gauged precipitation at a point will exactly match the areal average (particularly in areas with a high runoff ratio, which tend to be steeper). Thus, we recommend the method that does not require this exact matching in the interpolation – namely, the AGCD. Nonetheless, it is noted that Tozer et al. (2012) reported that the SILO and AGDC datasets had similar accuracy when tested on gauges not included in the calibration, which is why either dataset is considered suitable for modelling. It is noted that SILO has recently increased in popularity in academic studies due to a period during which AGDC data were temporarily placed behind a paywall, but pleasingly this has now been retracted, and both datasets are once again freely available.
Regardless of which gridded dataset is adopted, it is noted that the quality of the precipitation data changes over time due to the sensitivity of interpolated precipitation to gauge network density, among other things. A comparison conducted by Lucas Pamminger (Monash University), which examined the degree of agreement between AGCD and SILO precipitation estimates, indicates greater agreement post-1960 for many catchments. This may reflect the fact that the gauging network density approached its zenith around this time. It is recommended that studies use post-1960 precipitation data if possible and employ caution if earlier data are required. Note that the Pamminger analysis is included in the repository in the folder entitled Comparison of AGCD and SILO precipitation.
To summarise, we recommend for standard users of these dataset to use the SILO Morton wet environment evaporation and the AGDC precipitation data as forcing data for hydrological modelling studies.
The CAMELS-AUS dataset is freely available for download from the Zenodo online repository at https://doi.org/10.5281/zenodo.12575680 (Fowler et al., 2024). The dataset (along with datasets on which it is based) is subject to a Creative Commons BY (attribution) licence agreement (https://creativecommons.org/licenses/, last access: 28 June 2024).
This paper presents an updated version of the CAMELS-AUS dataset, in which the temporal coverage has been extended to 2022 and the spatial coverage has been expanded to 561 catchments. Changes in hydrometeorological data and catchment attributes make this dataset more comprehensive, current and valuable for research. These updates provide critical support for hydrological research and water resource management, facilitating the study of Australia's unique and variable hydroclimate for researchers globally.
Table A1Basic catchment information provided in the attribute table of CAMELS-AUS v2. Changes compared to CAMELS-AUS v1 are written in italics. Variables that are mapped in Fig. 3 are written in bold font.
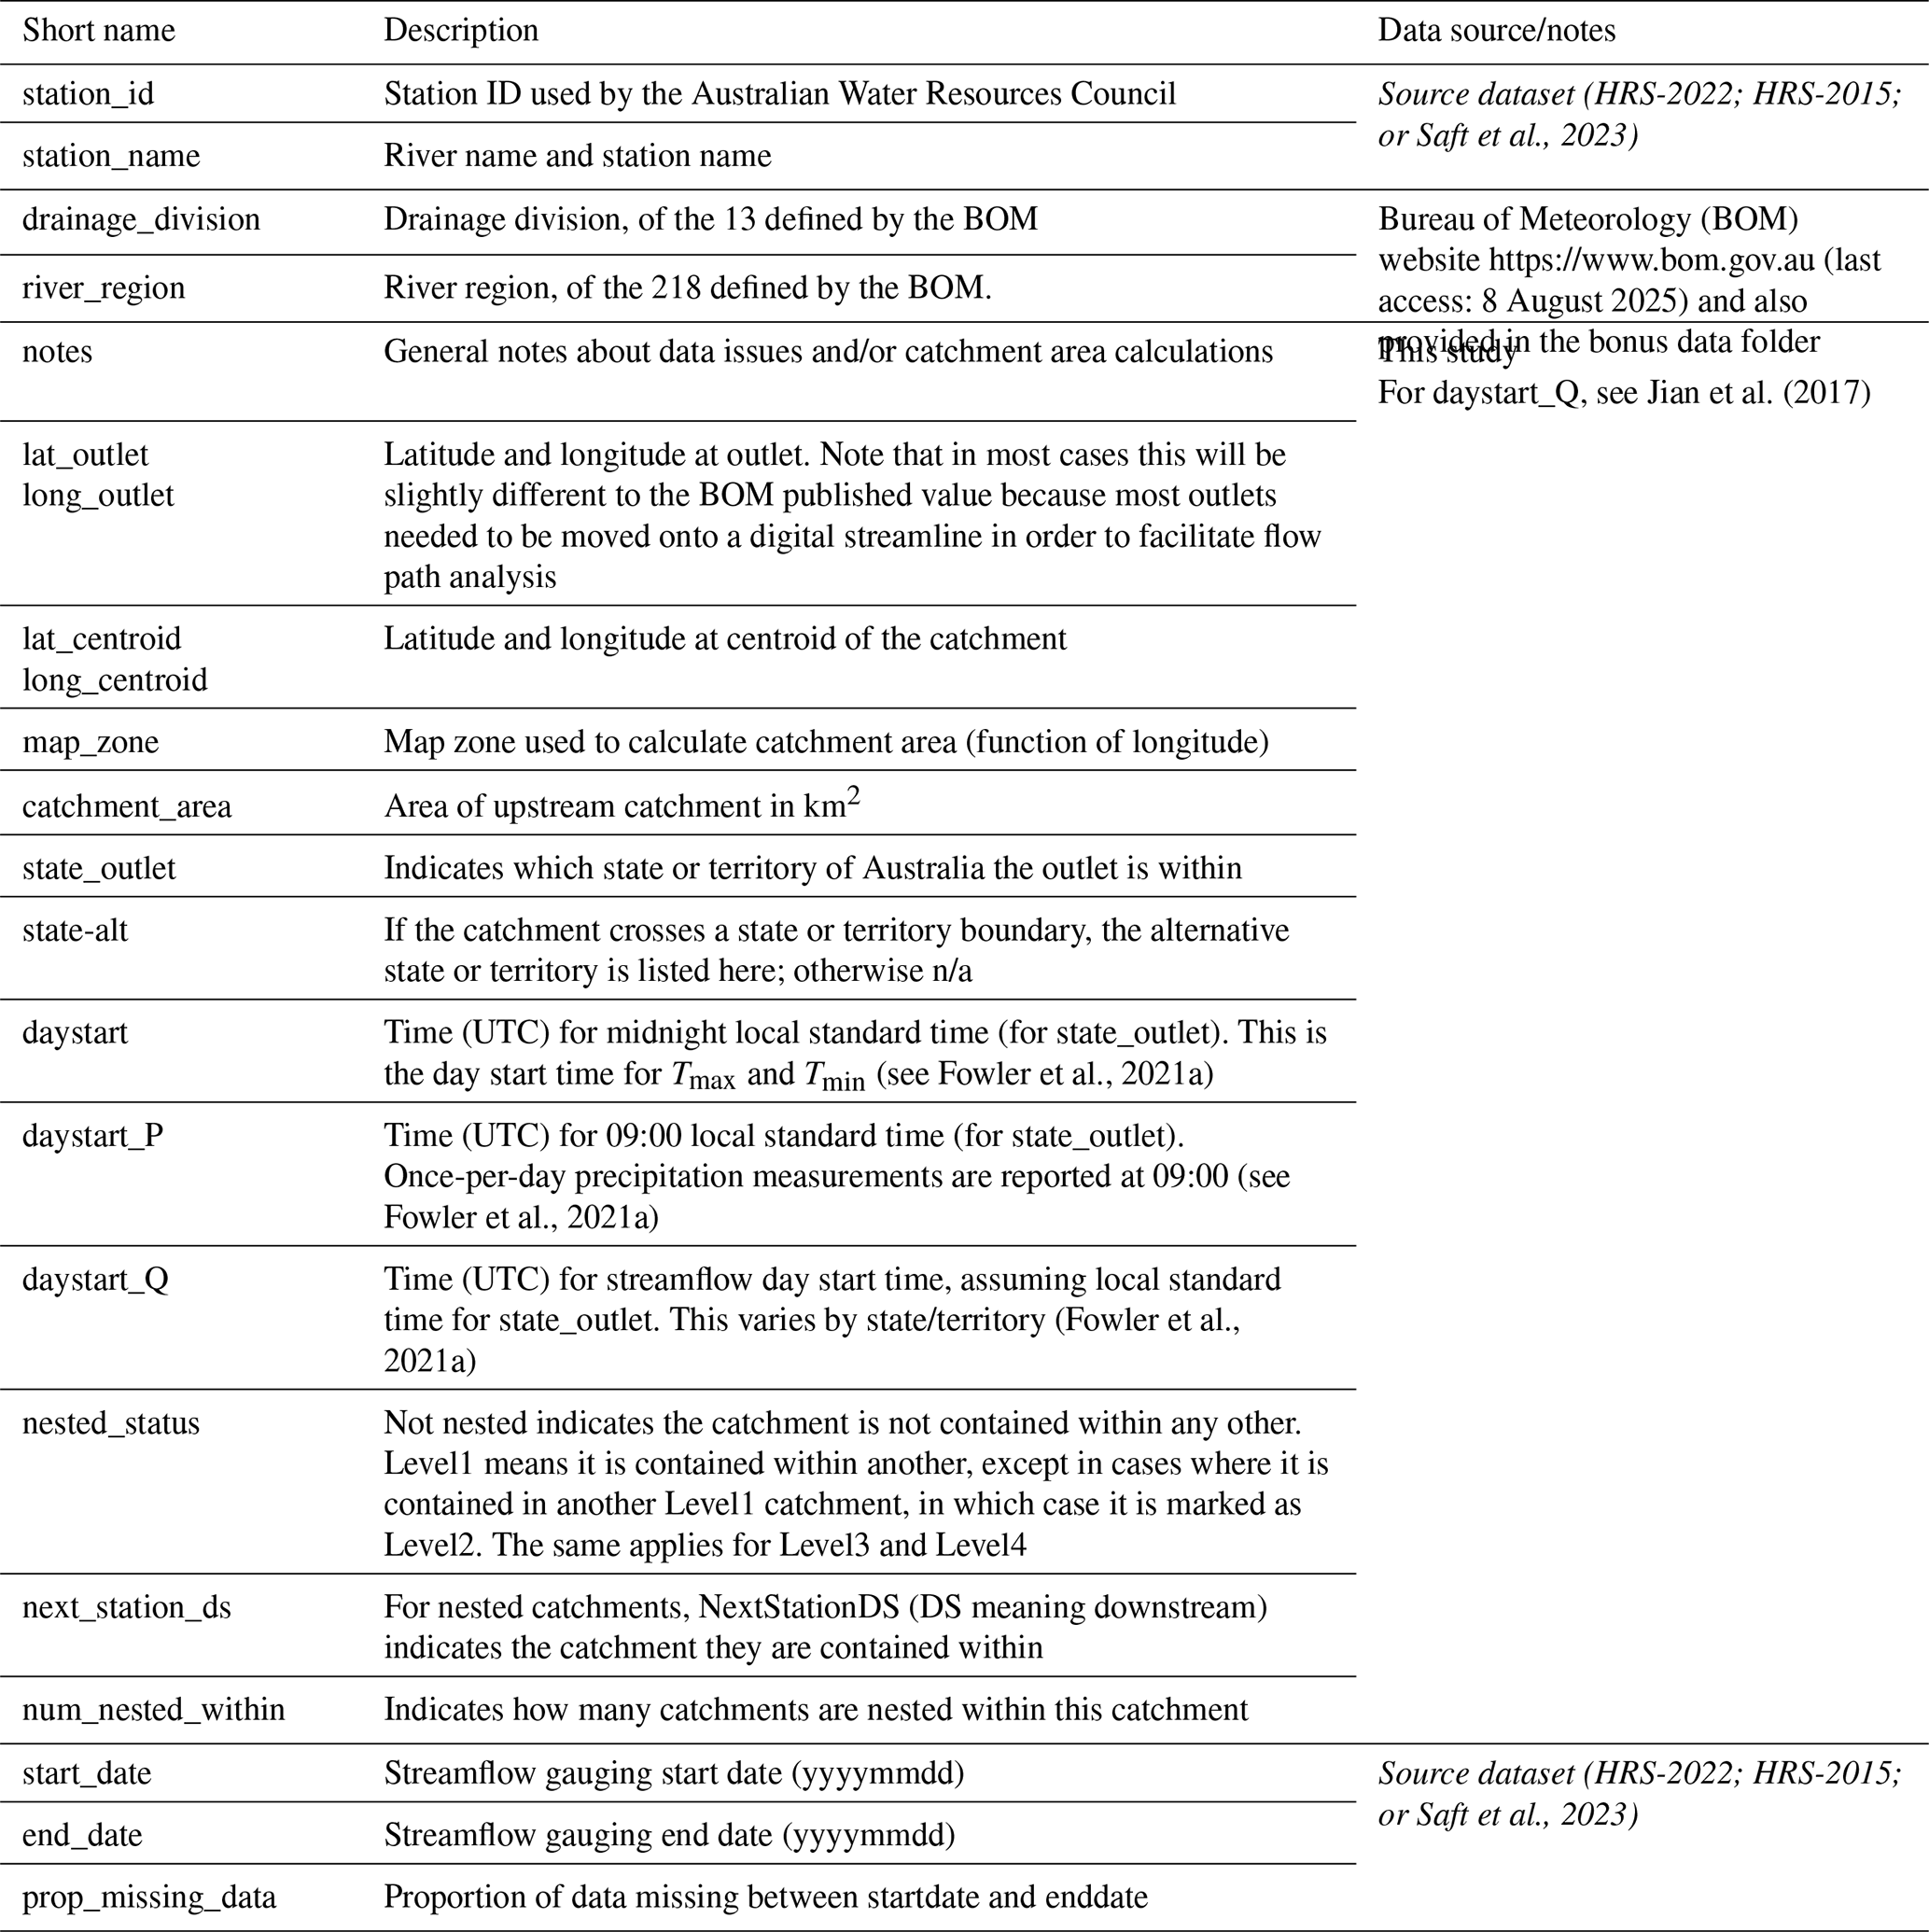
n/a: not applicable
Table A2Hydrometeorological time series data supplied with CAMELS-AUS v2. All time steps are daily. All non-streamflow data were processed as part of the CAMELS-AUS version 2 to extract catchment averages from Australia-wide AGCD/SILO grids. Changes compared to CAMELS-AUS v1 are highlighted in red. Changes compared to CAMELS-AUS v1 are written in italics.
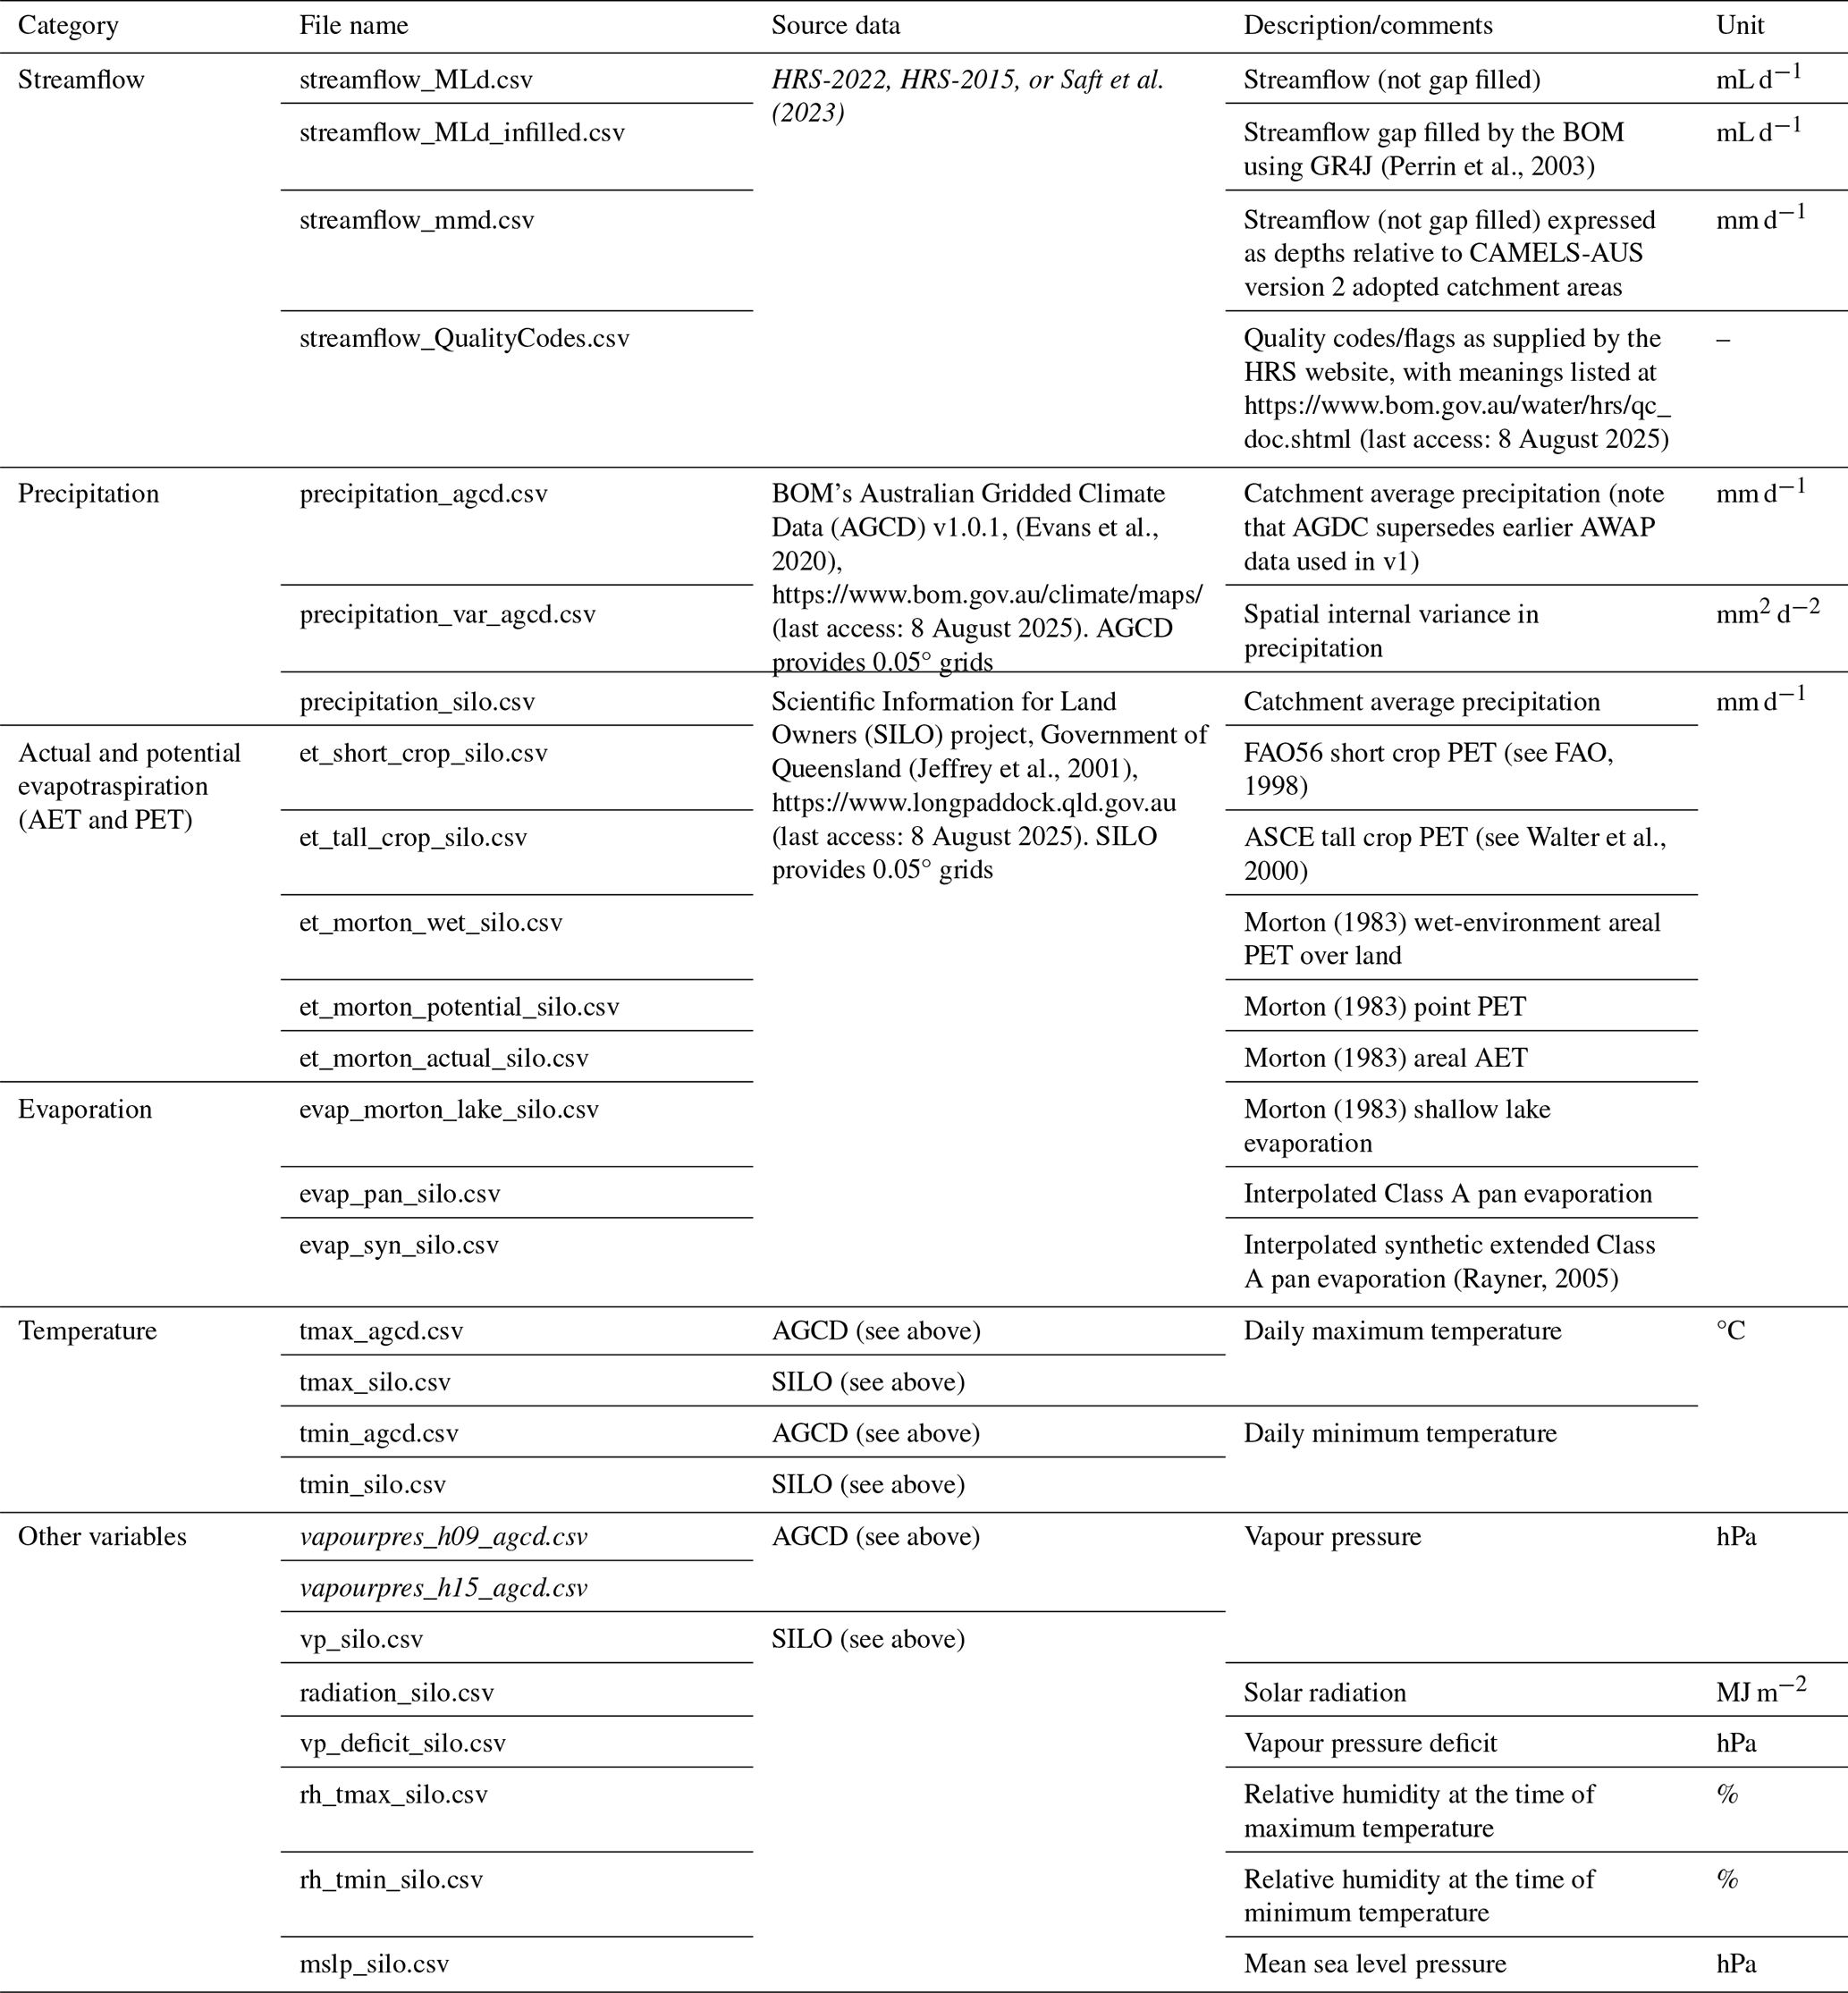
Table A3Flow uncertainty information, climatic indices and streamflow signatures provided in the attribute table of CAMELS-AUS v2. Changes compared to CAMELS-AUS v1 are written in italics, and variables that are mapped in Fig. 3 are written in bold font.
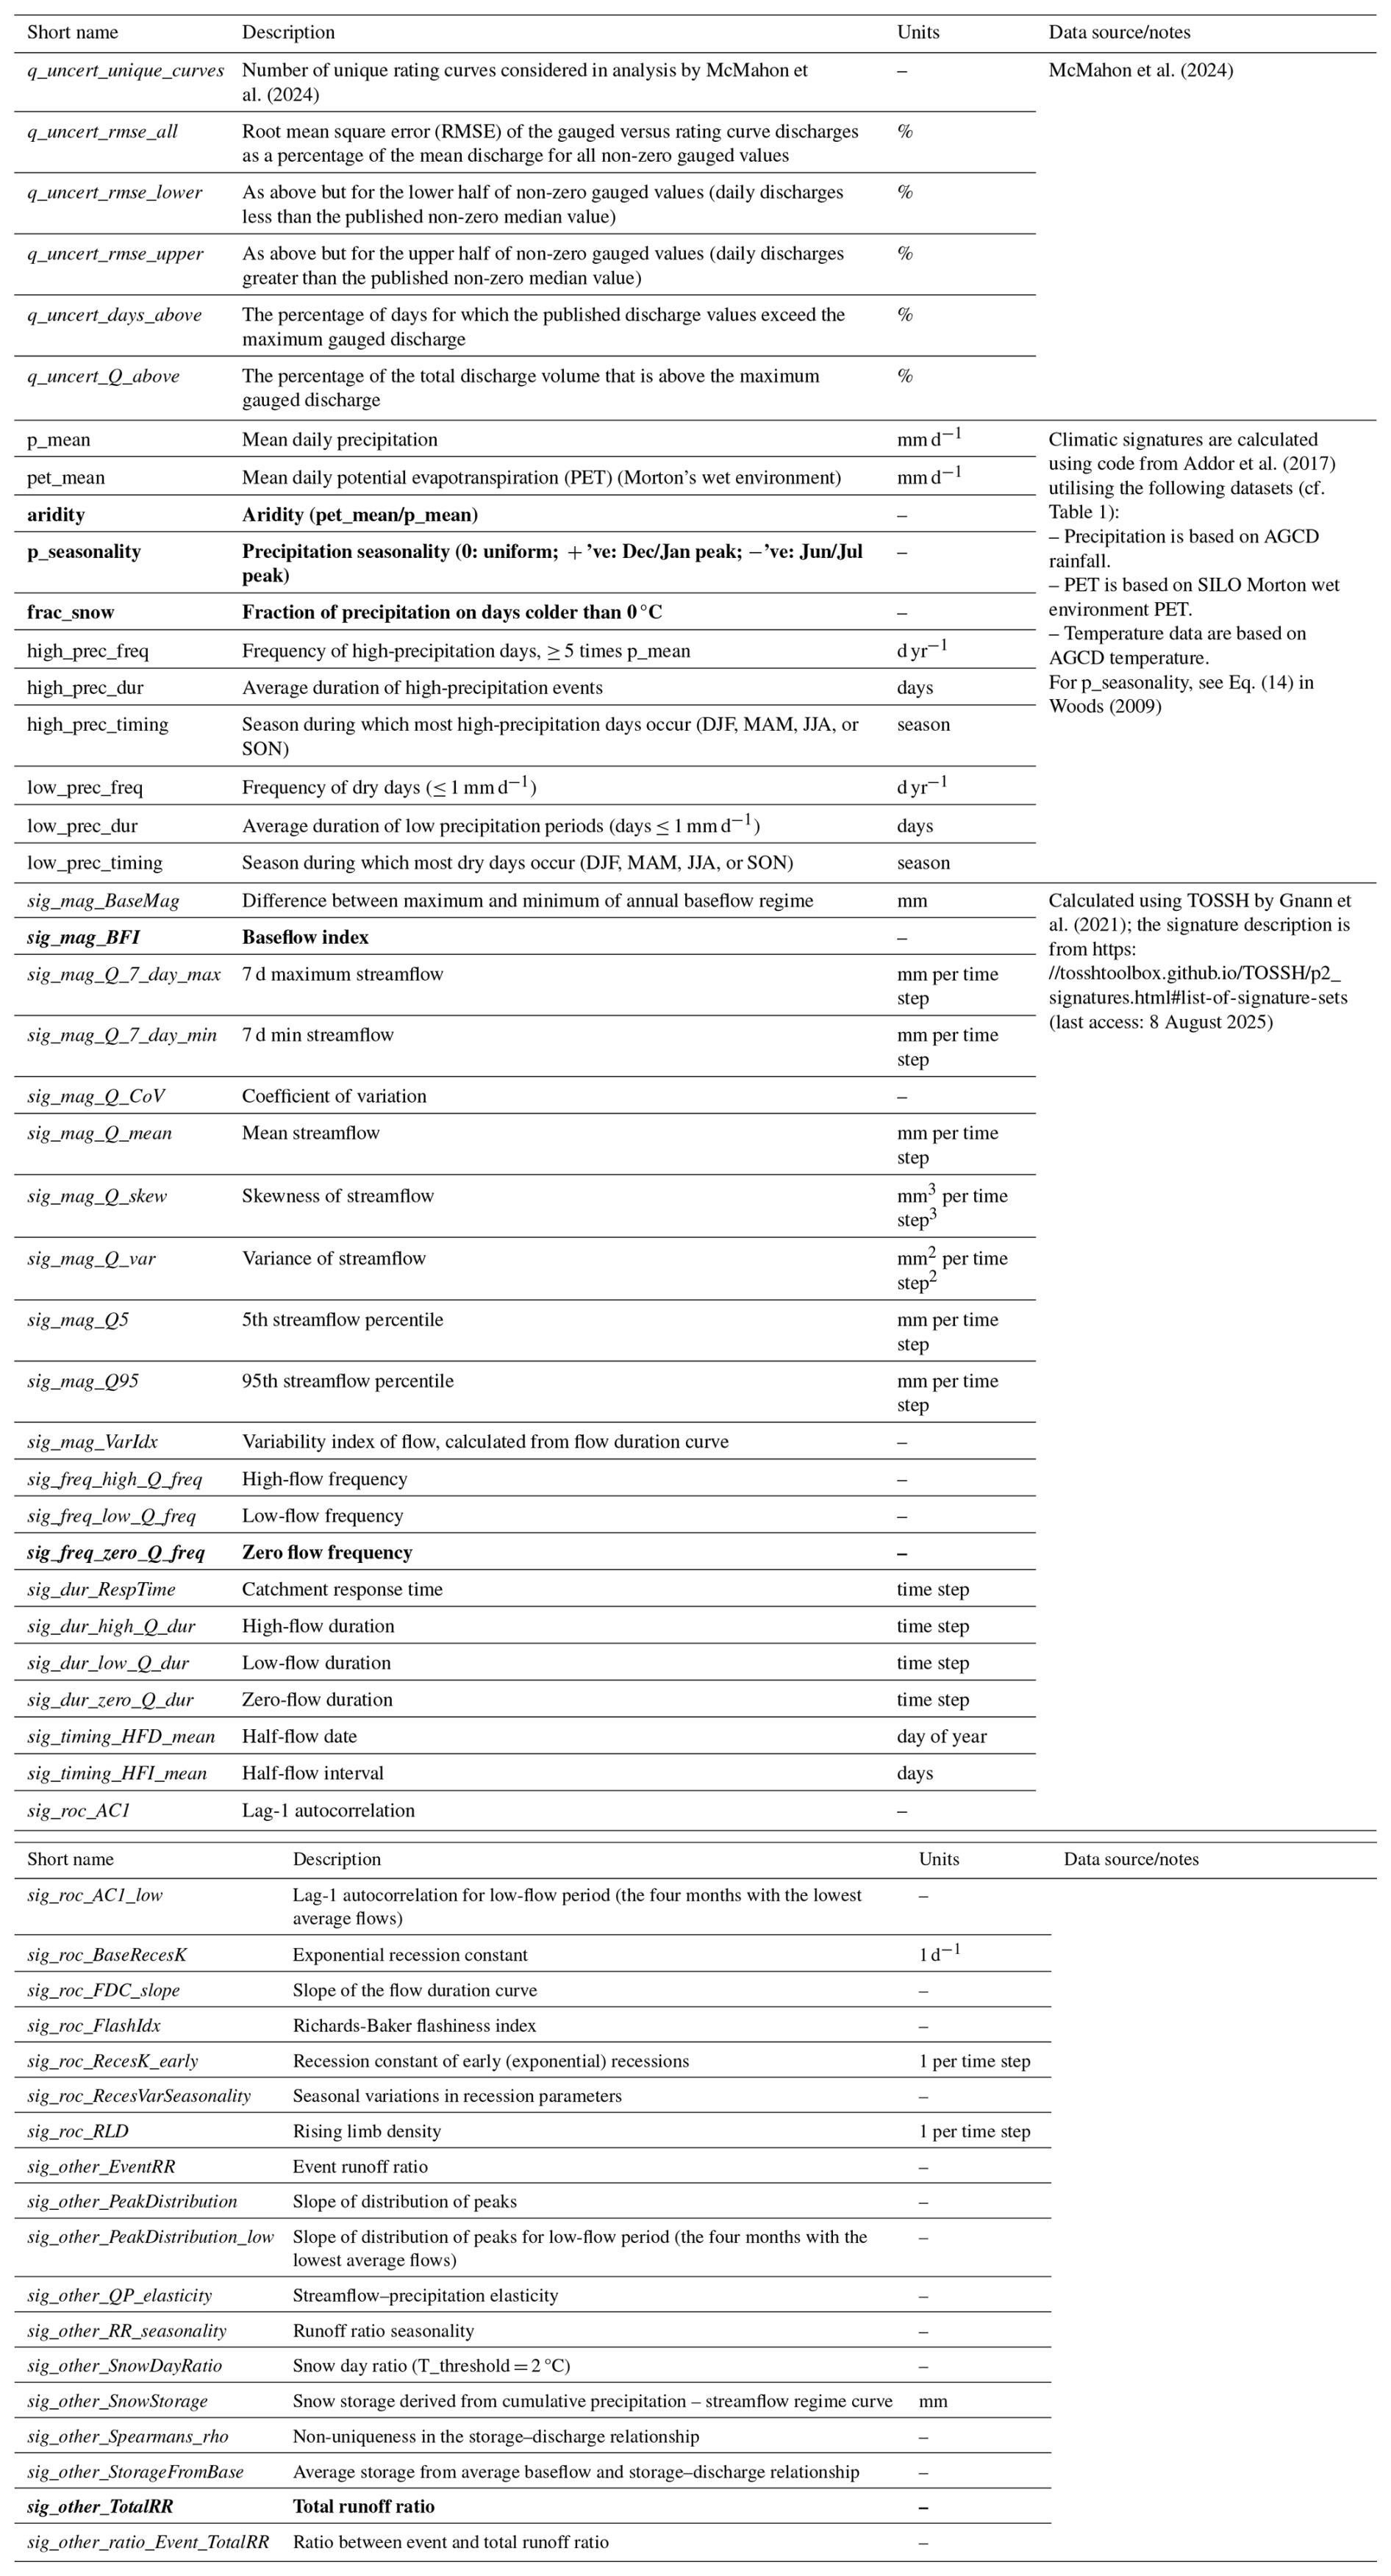
Table A4Catchment attributes included in the attributes table of CAMELS-AUS v2 (apart from climatic and hydrologic indices). Changes compared to CAMELS-AUS v1 are written in italics, and variables that are mapped in Fig. 3 are written in bold font.
A former version of this article was published on 6 August 2021 and is available at https://doi.org/10.5194/essd-13-3847-2021.
KJAF conceived the project, supervised all data processing, liaised with supporting organisations (notably the Bureau of Meteorology) and led the drafting of the manuscript. ZZ did the majority of the data processing and contributed to the manuscript. XH contributed to data processing with a particular focus on derivation of catchment boundaries.
The contact author has declared that none of the authors has any competing interests.
Publisher’s note: Copernicus Publications remains neutral with regard to jurisdictional claims made in the text, published maps, institutional affiliations, or any other geographical representation in this paper. While Copernicus Publications makes every effort to include appropriate place names, the final responsibility lies with the authors.
The authors gratefully acknowledge the cooperation of Australia's Bureau of Meteorology, particularly for their proactive assistance in supplying the Hydrological Reference Stations data to the authors in a timely fashion. The contribution of Murray Peel, who assisted with provision and interpretation of uncertainty information, is also acknowledged. The contributions of Lucas Pamminger (together with supervisors Murray Peel and Tim Peterson) to characterise precipitation data quality through time are acknowledged (see Sect. 4.3).
The authors received support from the University of Melbourne Early Career Researcher Grant scheme (grant no. 2021ECR155).
This paper was edited by Sibylle K. Hassler and reviewed by Vazken Andréassian and one anonymous referee.
Abbas, A., Boithias, L., Pachepsky, Y., Kim, K., Chun, J. A., and Cho, K. H.: AI4Water v1.0: an open-source python package for modeling hydrological time series using data-driven methods, Geosci. Model Dev., 15, 3021–3039, https://doi.org/10.5194/gmd-15-3021-2022, 2022.
ABS (Australian Bureau of Statistics): Australian Census 2006 Population Statistics [data set], https://www.abs.gov.au/websitedbs/censushome.nsf/home/historicaldata2006?opendocument&navpos=280 (last access: 9 August 2025), 2006.
Addor, N., Newman, A. J., Mizukami, N., and Clark, M. P.: The CAMELS data set: catchment attributes and meteorology for large-sample studies, Hydrol. Earth Syst. Sci., 21, 5293–5313, https://doi.org/10.5194/hess-21-5293-2017, 2017.
Addor, N., Nearing, G., Prieto, C., Newman, A. J., Le Vine, N., and Clark, M. P.: A Ranking of Hydrological Signatures Based on Their Predictability in Space, Water Resour. Res., 54, 8792–8812, https://doi.org/10.1029/2018WR022606, 2018.
Addor, N., Do, H. X., Alvarez-Garreton, C., Coxon, G., Fowler, K., and Mendoza, P. A.: Large-sample hydrology: recent progress, guidelines for new datasets and grand challenges, Hydrolog. Sci. J., 65, 712–725, https://doi.org/10.1080/02626667.2019.1683182, 2019.
Althoff, D. and Destouni, G.: Global patterns in water flux partitioning: Irrigated and rainfed agriculture drives asymmetrical flux to vegetation over runoff, One Earth, 6, 1246–1257, https://doi.org/10.1016/j.oneear.2023.08.002, 2023.
Alvarez-Garreton, C., Mendoza, P. A., Boisier, J. P., Addor, N., Galleguillos, M., Zambrano-Bigiarini, M., Lara, A., Puelma, C., Cortes, G., Garreaud, R., McPhee, J., and Ayala, A.: The CAMELS-CL dataset: catchment attributes and meteorology for large sample studies – Chile dataset, Hydrol. Earth Syst. Sci., 22, 5817–5846, https://doi.org/10.5194/hess-22-5817-2018, 2018.
Brunner, M. I. and Stahl, K.: Temporal hydrological drought clustering varies with climate and land-surface processes, Environ. Res. Lett., 18, 034011, https://doi.org/10.1088/1748-9326/acb8ca, 2023.
Chagas, V. B. P., Chaffe, P. L. B., Addor, N., Fan, F. M., Fleischmann, A. S., Paiva, R. C. D., and Siqueira, V. A.: CAMELS-BR: hydrometeorological time series and landscape attributes for 897 catchments in Brazil, Earth Syst. Sci. Data, 12, 2075–2096, https://doi.org/10.5194/essd-12-2075-2020, 2020.
Chen, S. and Ruan, X.: A hybrid Budyko-type regression framework for estimating baseflow from climate and catchment attributes, J. Hydrol., 618, 129118, https://doi.org/10.1016/j.jhydrol.2023.129118, 2023.
Coxon, G., Addor, N., Bloomfield, J. P., Freer, J., Fry, M., Hannaford, J., Howden, N. J. K., Lane, R., Lewis, M., Robinson, E. L., Wagener, T., and Woods, R.: CAMELS-GB: hydrometeorological time series and landscape attributes for 671 catchments in Great Britain, Earth Syst. Sci. Data, 12, 2459–2483, https://doi.org/10.5194/essd-12-2459-2020, 2020.
CSIRO: AUS SRTM 1sec MRVBF mosaic v01, Bioregional Assessment Source Dataset, data.gov.au [data set], https://data.gov.au/data/dataset/6c9b35fd-6985-4751-b66f-f5a510cfe84d (last access: 9 August 2025), 2016.
Delaigue, O., Brigode, P., Andréassian, V., Perrin, C., Etchevers, P., Soubeyroux, J.-M., Janet, B., and Addor, N.: CAMELS-FR: A large sample hydroclimatic dataset for France to explore hydrological diversity and support model benchmarking, IAHS-AISH Scientific Assembly 2022, Montpellier, France, 29 May–3 Jun 2022, IAHS2022-521, https://doi.org/10.5194/iahs2022-521, 2022.
DEWR (Department of the Environment and Water Resources, Australia): Estimated Pre-1750 Major Vegetation Subgroups – NVIS Stage 1, Version 3.1, Australian Government [data set], https://www.environment.gov.au/land/native-vegetation/national-vegetation-information-system (last access: 9 August 2025), 2008.
Euser, T., Winsemius, H. C., Hrachowitz, M., Fenicia, F., Uhlenbrook, S., and Savenije, H. H. G.: A framework to assess the realism of model structures using hydrological signatures, Hydrol. Earth Syst. Sci., 17, 1893–1912, https://doi.org/10.5194/hess-17-1893-2013, 2013.
Evans, A., Jones, D., Smalley, R., and Lellyett, S.: An enhanced gridded rainfall analysis scheme for Australia, Bureau of Meteorology (Australia) Research Report – BRR041, ISBN 978-1-925738-12-4, http://www.bom.gov.au/research/publications/researchreports/BRR-041.pdf (last access: 9 August 2025), 2020.
FAO (Food and Agriculture Organization of the United Nations): Irrigation and drainage paper 56: Crop evapotranspiration – Guidelines for computing crop water requirements, https://www.fao.org/4/x0490e/x0490e00.htm (last access: 9 August 2025), 1998.
Fowler, K. J. A., Acharya, S. C., Addor, N., Chou, C., and Peel, M. C.: CAMELS-AUS: hydrometeorological time series and landscape attributes for 222 catchments in Australia, Earth Syst. Sci. Data, 13, 3847–3867, https://doi.org/10.5194/essd-13-3847-2021, 2021a.
Fowler, K. J. A., Coxon, G., Freer, J. E., Knoben, W. J. M., Peel, M. C., Wagener, T., Western, A. W., Woods, R. A., and Zhang, L.: Towards more realistic runoff projections by removing limits on simulated soil moisture deficit, J. Hydrol., 600, 126505, https://doi.org/10.1016/j.jhydrol.2021.126505, 2021b.
Fowler, K., Peel, M., Saft, M., Peterson, T. J., Western, A., Band, L., Petheram, C., Dharmadi, S., Tan, K. S., Zhang, L., Lane, P., Kiem, A., Marshall, L., Griebel, A., Medlyn, B. E., Ryu, D., Bonotto, G., Wasko, C., Ukkola, A., Stephens, C., Frost, A., Gardiya Weligamage, H., Saco, P., Zheng, H., Chiew, F., Daly, E., Walker, G., Vervoort, R. W., Hughes, J., Trotter, L., Neal, B., Cartwright, I., and Nathan, R.: Explaining changes in rainfall–runoff relationships during and after Australia's Millennium Drought: a community perspective, Hydrol. Earth Syst. Sci., 26, 6073–6120, https://doi.org/10.5194/hess-26-6073-2022, 2022.
Fowler, K., Zhang, Z., and Hou, X: Dataset for CAMELS-AUS v2: updated hydrometeorological timeseries and landscape attributes for an enlarged set of catchments in Australia, Zenodo [data set], https://doi.org/10.5281/zenodo.12575680, 2024.
Gallant, J. and Austin, J.: Slope derived from 1” SRTM DEM-S. v4, CSIRO Data Collection [data set], https://doi.org/10.4225/08/5689DA774564A, 2012.
Gallant, J. C. and Dowling, T. I.: A multiresolution index of valley bottom flatness for mapping depositional areas, Water Resour. Res., 39, 1347, https://doi.org/10.1029/2002WR001426, 2003.
Gallant, J., Wilson, N., Tickle, P. K., Dowling, T., and Read, A.: 3 second SRTM Derived Digital Elevation Model (DEM) Version 1.0. Record 1.0, Geoscience Australia, Canberra, Australian Government [data set], http://pid.geoscience.gov.au/dataset/ga/69888 (last access: 9 August 2025), 2009.
Gardiya Weligamage, H., Fowler, K., Peterson, T. J., Saft, M., and Peel, M. C.: Observation based gridded annual runoff estimates over Victoria, Australia, in: MODSIM2021, 24th International Congress on Modelling and Simulation, Sydney, Australia, 5–10 December 2021, 602–608, https://doi.org/10.36334/modsim.2021.k11.weligamage, 2021.
Gardiya Weligamage, H., Fowler, K., Peterson, T. J., Saft, M., Peel, M. C., and Ryu, D.: Partitioning of Precipitation Into Terrestrial Water Balance Components Under a Drying Climate, Water Resour. Res., 59, e2022WR033538, https://doi.org/10.1029/2022WR033538, 2023.
Gardiya Weligamage, H., Fowler, K., Ryu, D., Saft, M., Peterson, T., and Peel, M. C.: Vegetation as a driver of shifts in rainfall-runoff relationship: Synthesising hydrological evidence with remote sensing, J. Hydrol., 132389, https://doi.org/10.1016/j.jhydrol.2024.132389, 2024.
Geoscience Australia: Dams and Water Storages 1990, Geoscience Australia, Canberra [data set], https://data.gov.au/data/dataset/ce5b77bf-5a02-4cf8-9cf2-be4a2cee2677 (last access: 9 August 2025), 2004.
Geoscience Australia: Surface Geology of Australia 1:1 million scale dataset, Australian Government [data set], https://pid.geoscience.gov.au/dataset/ga/74619 (last access: 9 August 2025), 2008.
Gnann, S. J., Coxon, G., Woods, R. A., Howden, N. J. K., and McMillan, H. K.: TOSSH: A Toolbox for Streamflow Signatures in Hydrology, Environ. Model. Softw., 138, 104983, https://doi.org/10.1016/j.envsoft.2021.104983, 2021.
Gordon, N. D., McMahon, T. A., Finlayson, B. L., and Christopher, J.: Stream Hydrology: an Introduction for Ecologists. John Wiley & Sons, Ltd., ISBN 978-0-470-84358-1, 1992.
Gupta, H. V., Perrin, C., Blöschl, G., Montanari, A., Kumar, R., Clark, M., and Andréassian, V.: Large-sample hydrology: a need to balance depth with breadth, Hydrol. Earth Syst. Sci., 18, 463–477, https://doi.org/10.5194/hess-18-463-2014, 2014.
Höge, M., Kauzlaric, M., Siber, R., Schönenberger, U., Horton, P., Schwanbeck, J., Floriancic, M. G., Viviroli, D., Wilhelm, S., Sikorska-Senoner, A. E., Addor, N., Brunner, M., Pool, S., Zappa, M., and Fenicia, F.: CAMELS-CH: hydro-meteorological time series and landscape attributes for 331 catchments in hydrologic Switzerland, Earth Syst. Sci. Data, 15, 5755–5784, https://doi.org/10.5194/essd-15-5755-2023, 2023.
Hutchinson, M. F., Stein, J. L., Stein, J. A., Anderson, H., and Tickle, P. K.: GEODATA 9 second DEM and D8: Digital Elevation Model Version 3 and Flow Direction Grid 2008, Record DEM-9S.v3, Geoscience Australia, Canberra [data set], http://pid.geoscience.gov.au/dataset/ga/66006 (last access: 9 August 2025), 2008.
Jeffrey, S. J., Carter, J. O., Moodie, K. B., and Beswick, A. R.: Using spatial interpolation to construct a comprehensive archive of Australian climate data, Environ. Model. Softw., 16, 309–330, https://doi.org/10.1016/S1364-8152(01)00008-1, 2001.
Jian, J., Costelloe J., Ryu D., and Wang Q. J.: Does a fifteen-hour shift make much difference? – Influence of time lag between rainfall and discharge data on model calibration, in 22nd International Congress on Modelling and Simulation, Hobart, Tasmania, Australia, 3–8 December 2017, https://doi.org/10.36334/modsim.2017.H3.jian, 2017.
John, A., Fowler, K., Nathan, R., Horne, A., and Stewardson, M.: Disaggregated monthly hydrological models can outperform daily models in providing daily flow statistics and extrapolate well to a drying climate, J. Hydrol., 598, 126471, https://doi.org/10.1016/j.jhydrol.2021.126471, 2021.
Jones, D., Wang, W., and Fawcett, R.: High-quality spatial climate data-sets for Australia, Aust. Meteorol. Ocean., 58, 233–248, https://doi.org/10.22499/2.5804.003, 2009.
Kapoor, A., Pathiraja, S., Marshall, L., and Chandra, R.: DeepGR4J: A deep learning hybridization approach for conceptual rainfall-runoff modelling, Environ. Model. Softw., 169, 105831, https://doi.org/10.1016/j.envsoft.2023.105831, 2023.
Kim, D., Choi, M., and Chun, J. A.: Linking the complementary evaporation relationship with the Budyko framework for ungauged areas in Australia, Hydrol. Earth Syst. Sci., 26, 5955–5969, https://doi.org/10.5194/hess-26-5955-2022, 2022.
Kratzert, F., Nearing, G., Addor, N., Erickson, T., Gauch, M., Gilon, O., Gudmundsson, L., Hassidim, A., Klotz, D., Nevo, S., Shalev, G., and Matias, Y.: Caravan – A global community dataset for large-sample hydrology, Sci. Data, 10, 61, https://doi.org/10.1038/s41597-023-01975-w, 2023.
Lei, X., Cheng, L., Zhang, L., Cheng, S., Qin, S., and Liu, P.: Improving the Applicability of Lumped Hydrological Models by Integrating the Generalized Complementary Relationship, Water Resour. Res., 60, e2023WR035567, https://doi.org/10.1029/2023WR035567, 2024.
Lymburner, L., Tan, P., McIntyre, A., Thankappan, M., and Sixsmith, J.: Dynamic Land Cover Dataset Version 2.1, Geoscience Australia, Canberra [data set], http://pid.geoscience.gov.au/dataset/ga/83868 (last access: 9 August 2025), 2015.
Mangukiya, N. K., Kumar, K. B., Dey, P., Sharma, S., Bejagam, V., Mujumdar, P. P., and Sharma, A.: CAMELS-IND: hydrometeorological time series and catchment attributes for 228 catchments in Peninsular India, Earth Syst. Sci. Data, 17, 461–491, https://doi.org/10.5194/essd-17-461-2025, 2025.
McInerney, D., Thyer, M., Kavetski, D., Westra, S., Maier, H. R., Shanafield, M., Croke, B., Gupta, H., Bennett, B., and Leonard, M.: Neglecting hydrological errors can severely impact predictions of water resource system performance, J. Hydrol., 634, 130853, https://doi.org/10.1016/j.jhydrol.2024.130853, 2024.
McKenzie, N. J., Jacquier, D. W., Ashton L. J., and Cresswell, H. P.: Estimation of Soil Properties Using the Atlas of Australian Soils, CSIRO Land and Water Technical Report 11/00, https://www.asris.csiro.au/themes/Atlas.html#Atlas_Digital (last access: 9 August 2025), 2000.
McMahon, T. A. and Peel, M. C. Uncertainty in stage–discharge rating curves: application to Australian Hydrologic Reference Stations data. Hydrolog. Sci. J., 64, 255–275, https://doi.org/10.1080/02626667.2019.1577555, 2019
McMahon, T. A., Peel, M. C., and Amirthanathan, G. E.: Assessing rating curve uncertainty, Hydrolog. Sci. J., 70, 687–694, https://doi.org/10.1080/02626667.2024.2442736, 2025.
McMillan, H.: Linking hydrologic signatures to hydrologic processes: A review, Hydrol. Process., 34, 1393–1409, https://doi.org/10.1002/hyp.13632, 2020.
McMillan, H. K., Gnann, S. J., and Araki, R.: Large Scale Evaluation of Relationships Between Hydrologic Signatures and Processes, Water Resour. Res., 58, e2021WR031751, https://doi.org/10.1029/2021WR031751, 2022.
Morton, F. I.: Operational estimates of areal evapotranspiration and their significance to the science and practice of hydrology, J. Hydrol., 66, 1–76, https://doi.org/10.1016/0022-1694(83)90177-4, 1983.
National Land and Water Resources Audit: Gridded soil information layers, Canberra [data set], https://www.asris.csiro.au/mapping/viewer.htm (last access: 9 August 2025), 2001.
Newman, A. J., Clark, M. P., Sampson, K., Wood, A., Hay, L. E., Bock, A., Viger, R. J., Blodgett, D., Brekke, L., Arnold, J. R., Hopson, T., and Duan, Q.: Development of a large-sample watershed-scale hydrometeorological data set for the contiguous USA: data set characteristics and assessment of regional variability in hydrologic model performance, Hydrol. Earth Syst. Sci., 19, 209–223, https://doi.org/10.5194/hess-19-209-2015, 2015.
Niu, J., Vis, M., and Seibert, J.: Evaluation of different precipitation and potential evapotranspiration time series for hydrological modeling in Australian catchments, EGU General Assembly 2024, Vienna, Austria, 14–19 Apr 2024, EGU24-1022, https://doi.org/10.5194/egusphere-egu24-1022, 2024.
Perrin, C., Michel, C., and Andréassian, V.: Improvement of a parsimonious model for streamflow simulation, J. Hydrol., 279, 275–289, https://doi.org/10.1016/S0022-1694(03)00225-7, 2003.
Peterson, T. J., Saft, M., Peel, M. C., and John, A.: Watersheds may not recover from drought, Science, 372, 745–749, https://doi.org/10.1126/science.abd5085, 2021.
Poff, N. L., Allan, J. D., Bain, M. B., Karr, J. R., Prestegaard, K. L., Richter, B. D., Sparks, R. E., and Stromberg, J. C.: The Natural Flow Regime, BioScience, 47, 769–784, https://doi.org/10.2307/1313099, 1997.
Rasiya Koya, S. and Roy, T.: Temporal Fusion Transformers for streamflow Prediction: Value of combining attention with recurrence, J. Hydrol., 637, 131301, https://doi.org/10.1016/j.jhydrol.2024.131301, 2024.
Raupach, M. R., Kirby, J. M., Barrett, D. J., and Briggs, P. R.: Balances of Water, Carbon, Nitrogen and Phosphorus in Australian Landscapes version 2.04, CSIRO Land and Water, Canberra, https://www.researchgate.net/publication/43515086_Balances_of_Water_Carbon_Nitrogen_and_Phosphorus_in_Australian_Landscapes_1_Project_Description_and_Results (last access: 22 August 2025), 2002.
Rayner, D.: Australian synthetic daily Class A pan evaporation. Technical Report December, Queensland Department of Natural Resources and Mines, Indooroopilly, Qld., Australia [data set], https://data.longpaddock.qld.gov.au/static/silo/pdf/AustralianSyntheticDailyClassAPanEvaporation.pdf (last access: 9 August 2025), 2005.
Saft, M., Weligamage, H. G., Peel, M., Peterson, T., Brown, R., Jordan, P., Morden, R., and Fowler, K.: Victorian Water and Climate dataset: long-term streamflow, climate, and vegetation observation records and catchment attributes (1.0), Zenodo [data set], https://doi.org/10.5281/zenodo.7527565, 2023.
Sawicz, K., Wagener, T., Sivapalan, M., Troch, P. A., and Carrillo, G.: Catchment classification: empirical analysis of hydrologic similarity based on catchment function in the eastern USA, Hydrol. Earth Syst. Sci., 15, 2895–2911, https://doi.org/10.5194/hess-15-2895-2011, 2011.
Stein, J. L., Stein, J. A., and Nix, H. A.: Spatial analysis of anthropogenic river disturbance at regional and continental scales: identifying the wild rivers of Australia, Landscape Urban Plan., 60, 1–25, https://doi.org/10.1016/S0169-2046(02)00048-8, 2002.
Stein, J. L., Hutchinson, M. F., and Stein, J. A.: National Catchment and Stream Environment Database version 1.1.4, Australian Government [data set], http://pid.geoscience.gov.au/dataset/ga/73045 (last access: 9 August 2025), 2011.
Strahler, A. N.: Quantitative analysis of watershed geomorphology, Eos Transactions American Geophysical Union, 38, 913–920, https://doi.org/10.1029/TR038i006p00913, 1957.
Teutschbein, C.: CAMELS-SE: Long-term hydroclimatic observations (19612020) across 50 catchments in Sweden as a resource for modelling, education, and collaboration, Geosci. Data J., 11, gdj3.239, https://doi.org/10.1002/gdj3.239, 2024.
Tozer, C. R., Kiem, A. S., and Verdon-Kidd, D. C.: On the uncertainties associated with using gridded rainfall data as a proxy for observed, Hydrol. Earth Syst. Sci., 16, 1481–1499, https://doi.org/10.5194/hess-16-1481-2012, 2012.
Trotter, L., Saft, M., Peel, M. C., and Fowler, K. J. A.: “Naïve” inclusion of diverse climates in calibration is not sufficient to improve model reliability under future climate uncertainty, in: MODSIM2021, 24th International Congress on Modelling and Simulation, Sydney, Australia, 5–10 December 2021, https://doi.org/10.36334/modsim.2021.J8.trotter, 2021.
Trotter, L., Saft, M., Peel, M. C., and Fowler, K. J. A.: Symptoms of Performance Degradation During Multi-Annual Drought: A Large-Sample, Multi-Model Study, Water Resour. Res., 59, e2021WR031845, https://doi.org/10.1029/2021WR031845, 2023.
Trotter, L., Saft, M., Peel, M. C., and Fowler, K. J. A.: Recession constants are non-stationary: Impacts of multi-annual drought on catchment recession behaviour and storage dynamics, J. Hydrol., 630, 130707, https://doi.org/10.1016/j.jhydrol.2024.130707, 2024.
van Oorschot, F., van der Ent, R. J., Alessandri, A., and Hrachowitz, M.: Influence of irrigation on root zone storage capacity estimation, Hydrol. Earth Syst. Sci., 28, 2313–2328, https://doi.org/10.5194/hess-28-2313-2024, 2024.
Walter, I., Allen, R., Elliot, R., Jensen, M., Itenfisu, D., Mecham, B., Howell, T., Snyder, R., Brown, P., Echings, S., Spofford, T., Hattendorf, M., Cuenca, R., Wright, J., and Martin, D.: ASCE’s standardized reference evapotranspiration equation, Proc. National Irrigation Symposium on Watershed management and operations management, Pheonix, Arizone, 1–11, https://doi.org/10.1061/40499(2000)126, 2000.
Wang, H., Li, X., Tong, C., Xu, Y., Lin, D., Wang, J., Yao, F., Zhu, P., and Yan, G.: Varying performance of eight evapotranspiration products with aridity and vegetation greenness across the globe, Front. Environ. Sci., 11, 1079520, https://doi.org/10.3389/fenvs.2023.1079520, 2023.
Western, A. and McKenzie, N.: Soil hydrological properties of Australia Version 1.0.1, CRC for Catchment Hydrology, Melbourne, 2004.
Woods, R. A.: Analytical model of seasonal climate impacts on snow hydrology: Continuous snowpacks, Adv. Water Resour., 32, 1465–1481, https://doi.org/10.1016/j.advwatres.2009.06.011, 2009.
Xu, T. and Hutchinson, M.: ANUCLIM version 6.1 user guide. The Australian National University, Fenner School of Environment and Society, Canberra, https://fennerschool.anu.edu.au/files/anuclim61.pdf (last access: 9 August 2025), 2011.