the Creative Commons Attribution 4.0 License.
the Creative Commons Attribution 4.0 License.
 | 07 Aug 2025
An annual cropland extent dataset for Africa at 30 m spatial resolution from 2000 to 2022
Zihang Lou
Dailiang Peng
Zhou Shi
Hongyan Wang
Ke Liu
Yaqiong Zhang
Xue Yan
Zhongxing Chen
Su Ye
Jinkang Hu
Yulong Lv
Hao Peng
Yizhou Zhang
Bing Zhang
Accurate cropland mapping is essential for understanding agricultural dynamics in Africa and critical for achieving Sustainable Development Goals (SDGs) such as Zero Hunger. Large-scale cropland mapping encounters several challenges, including the varying landscape characteristics of cropland across different regions, extended cultivation periods, and limited availability of reference data. This study develops a 30 m resolution African annual cropland distribution (namely AFCD) dataset spanning the years 2000 to 2022. To extract this large-scale cropland distribution data, we employed random forest (RF) classification and continuous change-detection (CCD) algorithms on the Google Earth Engine platform. Robust training samples were generated, and a locally adaptive model was applied for cropland extraction. The final output consists of annual binary crop/non-crop maps from 2000 to 2022. Independent validation samples from numerous third-party sources confirm that the map's accuracy is 0.86 ± 0.01. A comparison of the cropland area estimates from AFCD with those of the Food and Agriculture Organization (FAO) for Africa yielded an R2 value of 0.86. According to our estimates, Africa's cropland expanded from 1.9435×10⁸ ha in 2000 to 2.1092×10⁸ ha in 2022, marking a net increase of 8.53 %. Prior to 2005, changes in Africa's cropland area were gradual, but after 2006, there has been a marked acceleration in cropland expansion. Despite this continued growth, Africa also experienced significant cropland abandonment. By 2018, abandoned cropland accounted for 11.52 % of the total active cropland area. AFCD also avoided the misclassification of buildings, roads, and trees surrounding cropland common in existing products. The study further highlights the unique advantage of AFCD in providing a dynamic annual cropland dataset at 30 m resolution for Africa. This dataset is a crucial resource for understanding the spatial–temporal dynamics of cropland and can support policies on food security and sustainable land management. The cropland dataset is available at https://doi.org/10.5281/zenodo.14920706 (Lou et al., 2025).
- Article
(14743 KB) - Full-text XML
- BibTeX
- EndNote


According to the Food and Agriculture Organization (FAO), croplands are of critical importance to global food sustainable development and poverty alleviation. The FAO's State of Food Security and Nutrition in the World (SOFI) report highlights the fact that monitoring and managing agricultural lands were crucial for achieving the UN's Sustainable Development Goals (SDGs), particularly in addressing food security challenges and balancing agricultural production with ecosystem services (FAO et al., 2024). Agricultural land directly or indirectly contributes to 90 % of global food calories (Cassidy et al., 2013). Beyond supplying food, cropland plays a crucial role as a provider of various ecosystem services (Pereira et al., 2018; Stephens et al., 2018), not only mitigating climate change through carbon sequestration and water and soil regulation (Lana-Renault et al., 2020), but also influencing biodiversity (Traba and Morales, 2019). Emerging agricultural paradigms prioritize climate-smart cultivation practices (Xiao et al., 2024), rational land use policymaking (Duan et al., 2021), and productivity enhancement for smallholder farmers. The expansion and abandonment of croplands have long been focal points of research as the extent, distribution, and characteristics of cropland often influence a region's agricultural development pathways, food security, and poverty alleviation efforts (Jayne et al., 2014).
The SOFI report revealed that 20.4 % of Africa's population faces hunger, with one in five people being undernourished, severely hindering progress toward SDGs such as No Poverty and Zero Hunger and sustainable agriculture–ecosystem balance (FAO et al., 2024; Ibrahim et al., 2023). While Africa has accounted for 34 % of global cropland expansion since 2000, driven by its perceived land abundance (Searchinger et al., 2015; Schneider et al., 2024), this growth has largely involved converting natural vegetation, causing significant deforestation and habitat destruction (Crawford et al., 2024; Kehoe et al., 2017). However, the economic and ecological trade-offs of such expansion remain understudied, necessitating nuanced land use assessments (Chamberlin et al., 2014). Sub-Saharan Africa's food systems, dominated by small-scale farms (<1 ha), grapple with stagnant yields and rising imports (Fader et al., 2013; Giller et al., 2021), while larger farms (>1 ha) demonstrate higher productivity and food security through land consolidation (Nilsson, 2019). Yet unchecked agricultural intensification risks biodiversity and ecosystem stability (Adolph et al., 2023; Mano et al., 2020), highlighting the urgent need to monitor cropland dynamics. Detailed annual mapping of land use changes is critical for guiding sustainable policies on food security, resource management, and environmental protection (Debonne et al., 2021; Waldner et al., 2015), balancing Africa's agricultural needs with ecological preservation.
The rapid development of remote sensing technology has enabled accurate cropland mapping through synergistic use of multi-source satellite data. Moderate Resolution Imaging Spectroradiometer (MODIS) imagery offers unique advantages for large-scale cropland extent monitoring (Xiong et al., 2017a; Zhang et al., 2015, 2022), while higher-resolution sensors aboard Landsat and Sentinel-2 satellites provide precise boundary delineation capabilities. Global and regional land use/cover change (LUCC) products, such as MCD12Q1 (Friedl and Sulla-Menashe, 2022), ESA (2017), GLC_FCS30D (Zhang et al., 2024b; Liu et al., 2023), and ESA WorldCover (Zanaga et al., 2021, 2022), offer multi-scale data support for studying cropland distribution in Africa across a range of spatial resolutions (10–500 m). However, their accuracy is generally limited, and they exhibit significant spatial inconsistencies (Cui et al., 2024; Song et al., 2022). These discrepancies arise from the varying land cover definitions, temporal gaps due to cloud cover interference in remote sensing data, and highly fragmented nature of African cropland landscapes (Xiong et al., 2017b). Specialized cropland products, such as the Landsat Global Cropland Extent (Potapov et al., 2022), GFSAD Landsat-Derived Global Rainfed and Irrigated-Cropland Product (LGRIP) (Teluguntla et al., 2023), GFSAD Global Cropland Extent Product (GCEP) (Thenkabail et al., 2021), and Digital Earth Africa (Burton et al., 2022), offer high spatial resolution (ranging from 10 to 30 m), allowing for detailed landscape characterization. However, their temporal coverage is often limited to single years or sparse intervals, which significantly restricts their ability to track rapid interannual changes in African agricultural systems (Kerner et al., 2024).
Key processes, such as cropland expansion into natural ecosystems and cyclical abandonment patterns, remain poorly understood and inadequately quantified due to these temporal gaps. Current LUCC products are mainly based on single- or multi-year remote sensing data combined with expert-driven classification systems or machine learning algorithms such as random forest (RF). However, challenges such as the scarcity of ground validation samples and significant surface heterogeneity in Africa hinder the improvement of classification accuracy. Notably, the successful application of sample generation methods in crop recognition (Hu et al., 2024; Zhang et al., 2024a) and coastal zone monitoring (Zuo et al., 2025) demonstrates the potential of overcoming data bottlenecks through innovative sample construction techniques. Therefore, there is an urgent need to develop consensus label generation methods that integrate multiple LUCC products (Kerner et al., 2024; Tubiello et al., 2023a). By leveraging the strengths of existing cropland datasets, this would enable the creation of high-temporal-resolution dynamic cropland maps for Africa. Furthermore, establishing a unified cropland classification standard system could effectively reduce spatial inconsistencies across existing products, providing more accurate spatial information to support sustainable agricultural development and food security decision-making in Africa.
In summary, in recent decades, a lot of global or regional cropland mapping and monitoring has made significant progress. However, a 30 m annual cropland extent time series product derived from change-detection algorithms is still lacking. The aims of this study are (1) to construct locally optimal consensus crop/non-crop labels using LUCC/cropland extent products from 2000 to 2022, which will serve as training samples; (2) to utilize the continuous change-detection (CCD) algorithm and the full time series of Landsat observations to generate the first African 30 m annual cropland extent product that covers the period from 2000 to 2022, named AFCD; and (3) to quantitatively analyze the performance of the AFCD product using multi-source validation datasets.
2.1 Previous LUCC and cropland datasets
To investigate the spatial distribution of Africa within the study's temporal scope, we amassed a comprehensive dataset from Google Earth Engine (GEE) and its community platform encompassing global or Africa-specific LUCC datasets as well as cropland distribution, with a spatial resolution finer than 500 m, spanning the period from 2000 to 2022 (as summarized in Table 1). However, definitions of cropland and other land use/cover types exhibit variations across different datasets. In this context, both GLC_FCS30D and ESA CCI-LC employ the FAO's Land Cover Classification System (LCCS) (ESA, 2017; Zhang et al., 2024b). The LCCS has been utilized to define diverse land cover types, demonstrating both flexibility and effectiveness across various geographical contexts (Ahlqvist, 2008) while simultaneously promoting interoperability for land cover data and facilitating the scrutiny of classification processes (Herold et al., 2006). ESRI 10 m Annual Land Cover, ESA WorldCover, and Dynamic World all employ a multi-tiered land cover classification system, defining cropland as areas planted or sown by humans with cereals, grasses, and other crops that can be harvested within a year, excluding perennial woody crops (Karra et al., 2021; Van De Kerchove et al., 2021; Brown et al., 2022). Specialized cropland products define cropland as areas used for growing annual or perennial crops (Burton et al., 2022; Potapov et al., 2022), including forage and biofuel crops under both rainfed and irrigated systems (Teluguntla et al., 2023) and also consider land permanently used for plantations, such as orchards and vineyards, as cropland (Thenkabail et al., 2021).
Table 1Description of map data products utilized in this study.
2.2 Continuous Landsat imagery from 2000 to 2022
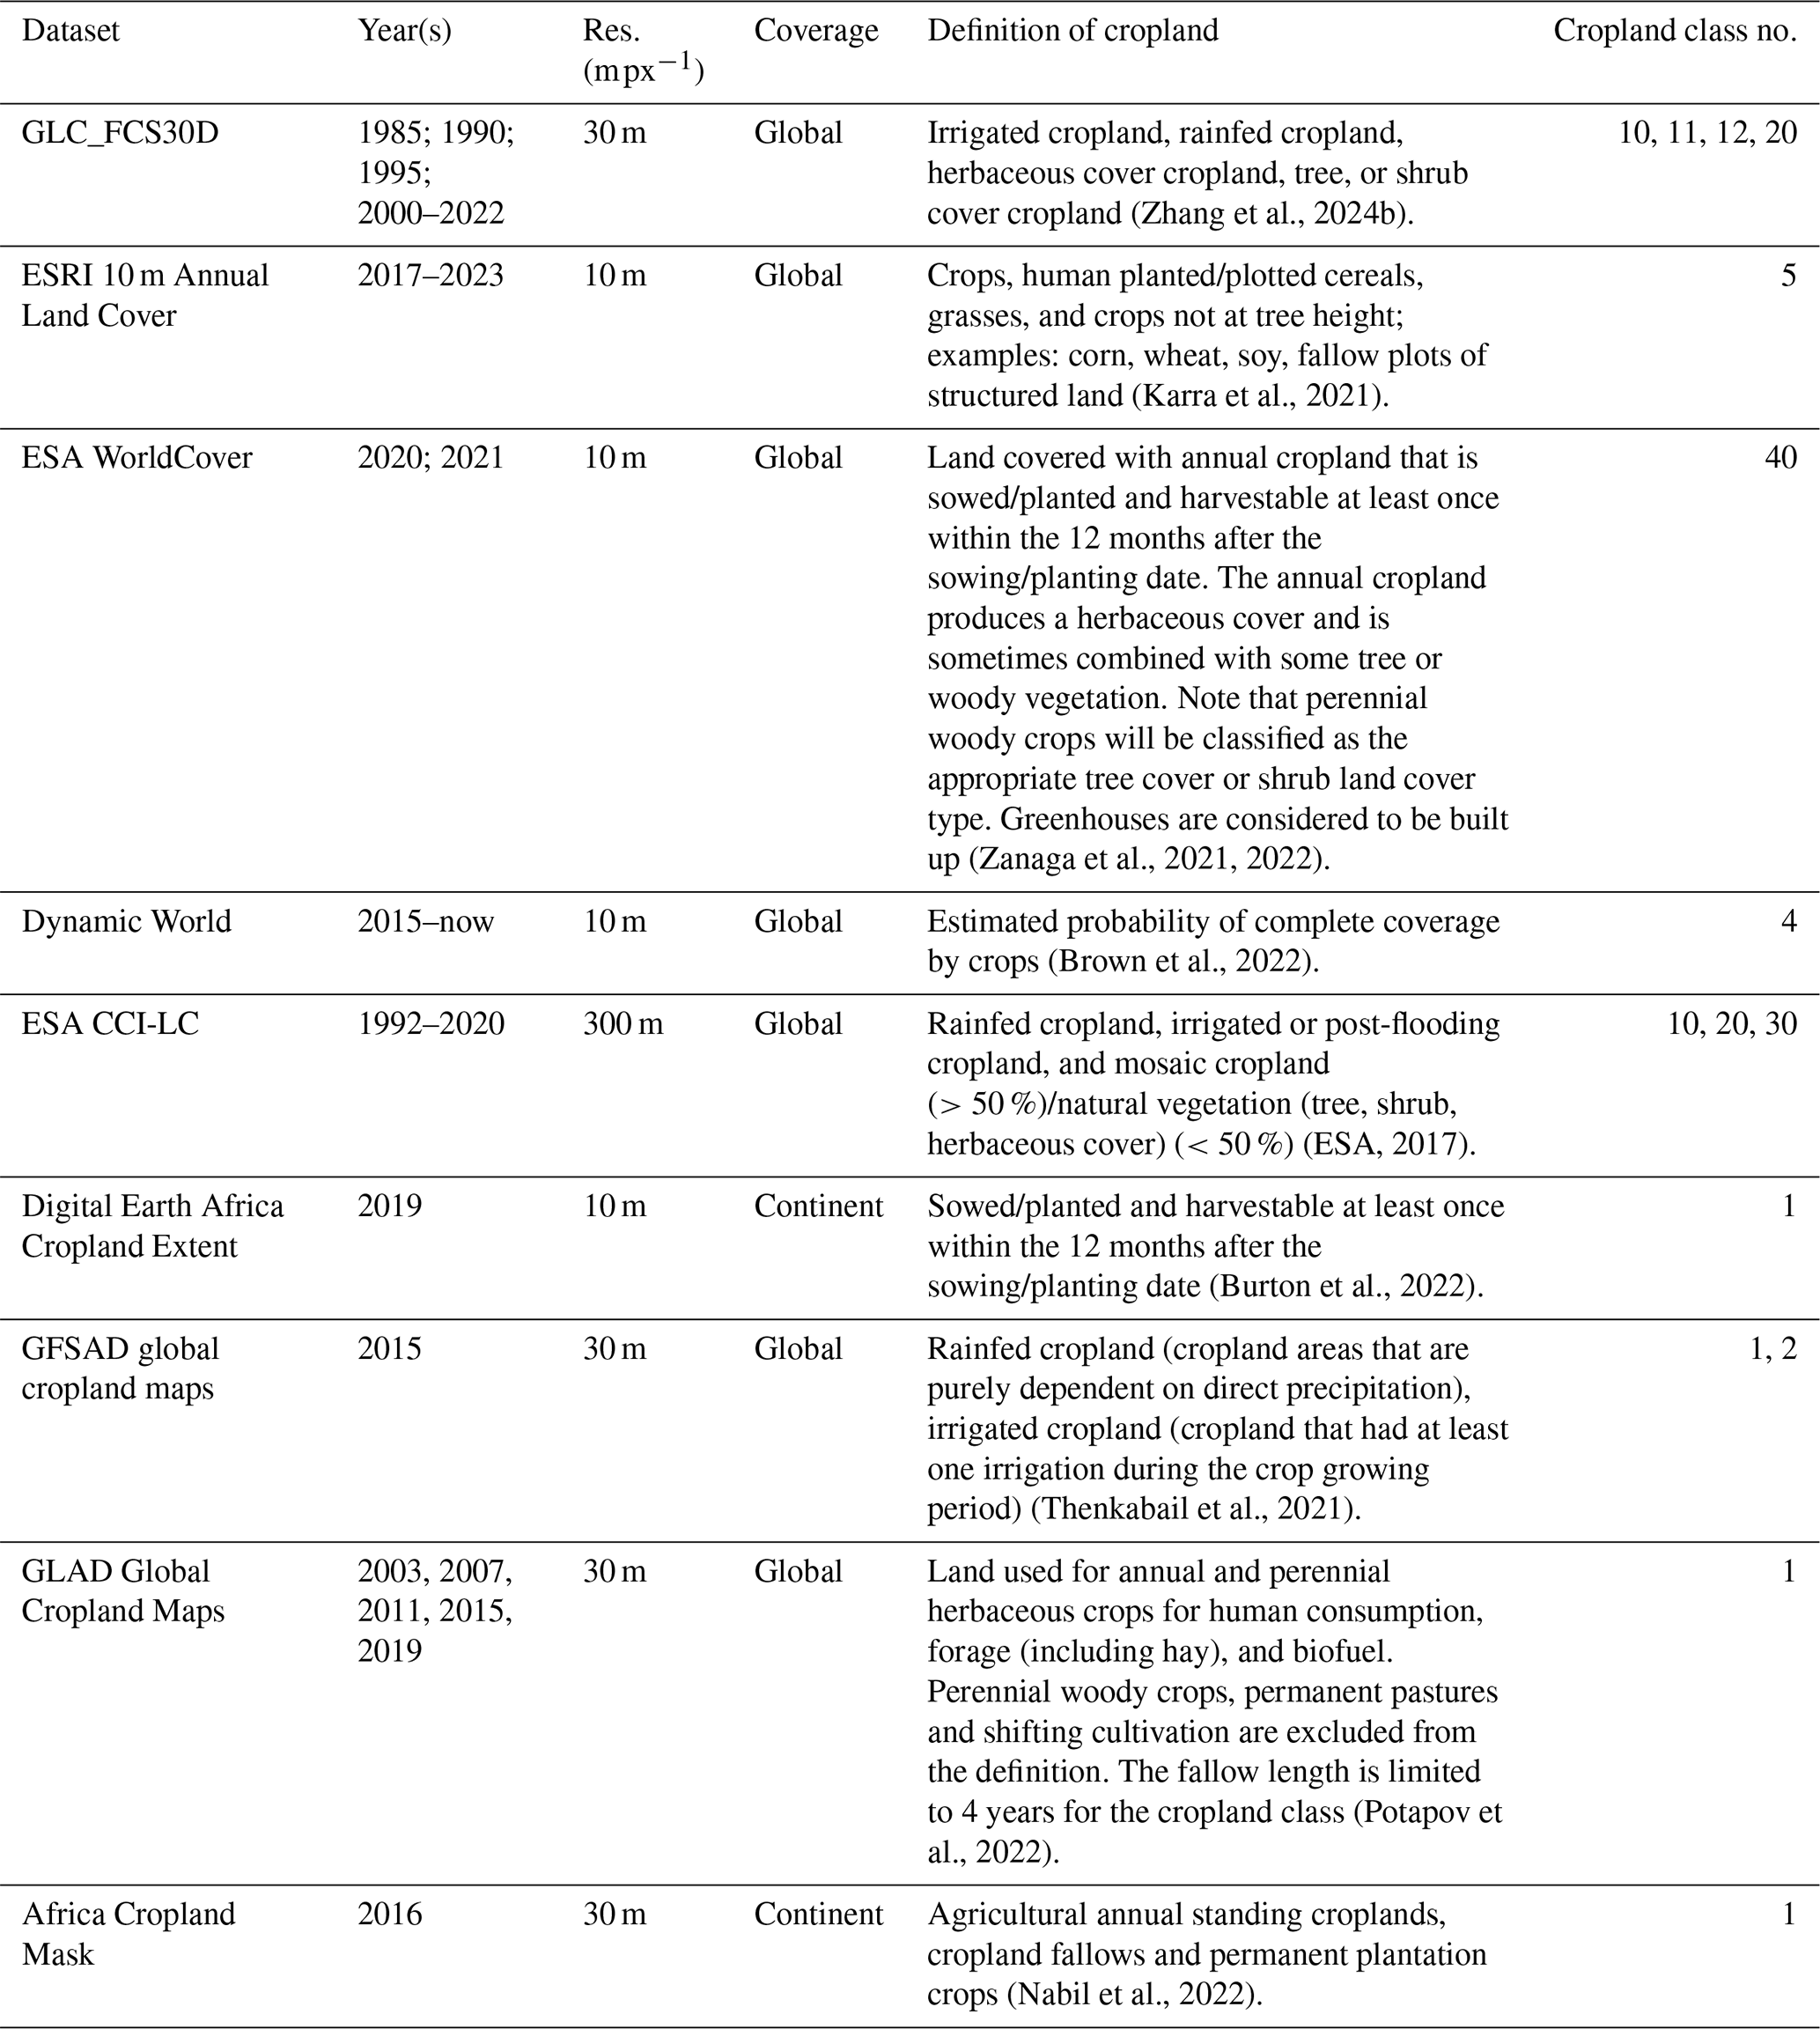
All available surface reflectance (SR) from Landsat imagery (Level 2, Collection 2, Tier 1) spanning 2000 to 2022, including Landsat 5, 7, 8, and 9, stored in the GEE computational platform was collected to monitor the spatiotemporal dynamics of cropland extent in Africa. To minimize the spectral discrepancies among different Landsat sensors, calibration coefficients were applied to recalibrate the surface reflectance data from Thematic Mapper (TM) and Enhanced Thematic Mapper Plus (ETM+) to align with the comparable standards of Operational Land Imager (OLI) (Roy et al., 2016). Subsequently, the Landsat Ecosystem Disturbance Adaptive Processing System (LEDAPS) and the Land Surface Reflectance Code (LaSRC) algorithms were employed to perform atmospheric correction on Landsat imagery and construct a high-quality, continuous Landsat temporal dataset (Vermote and Saleous, 2007; Vermote and Kotchenova, 2008). As shown in Fig. 1a–e, the spatial distribution of valid Landsat observations over five time periods exhibits significant spatiotemporal variability, which can directly affect the accuracy of cropland mapping. To mitigate this influence and enhance spatial consistency, we incorporated a cropland consensus layer derived from six global LUCC/cropland products, where cropland agreement levels are categorized from SA1 to SA6 (Fig. 1f) (Tubiello et al., 2023a, b). This consensus informed the construction of a 2°×2° grid framework, delineated by red lines in Fig. 1f, with each grid cell serving as the minimum classification unit for the cropland mapping process.
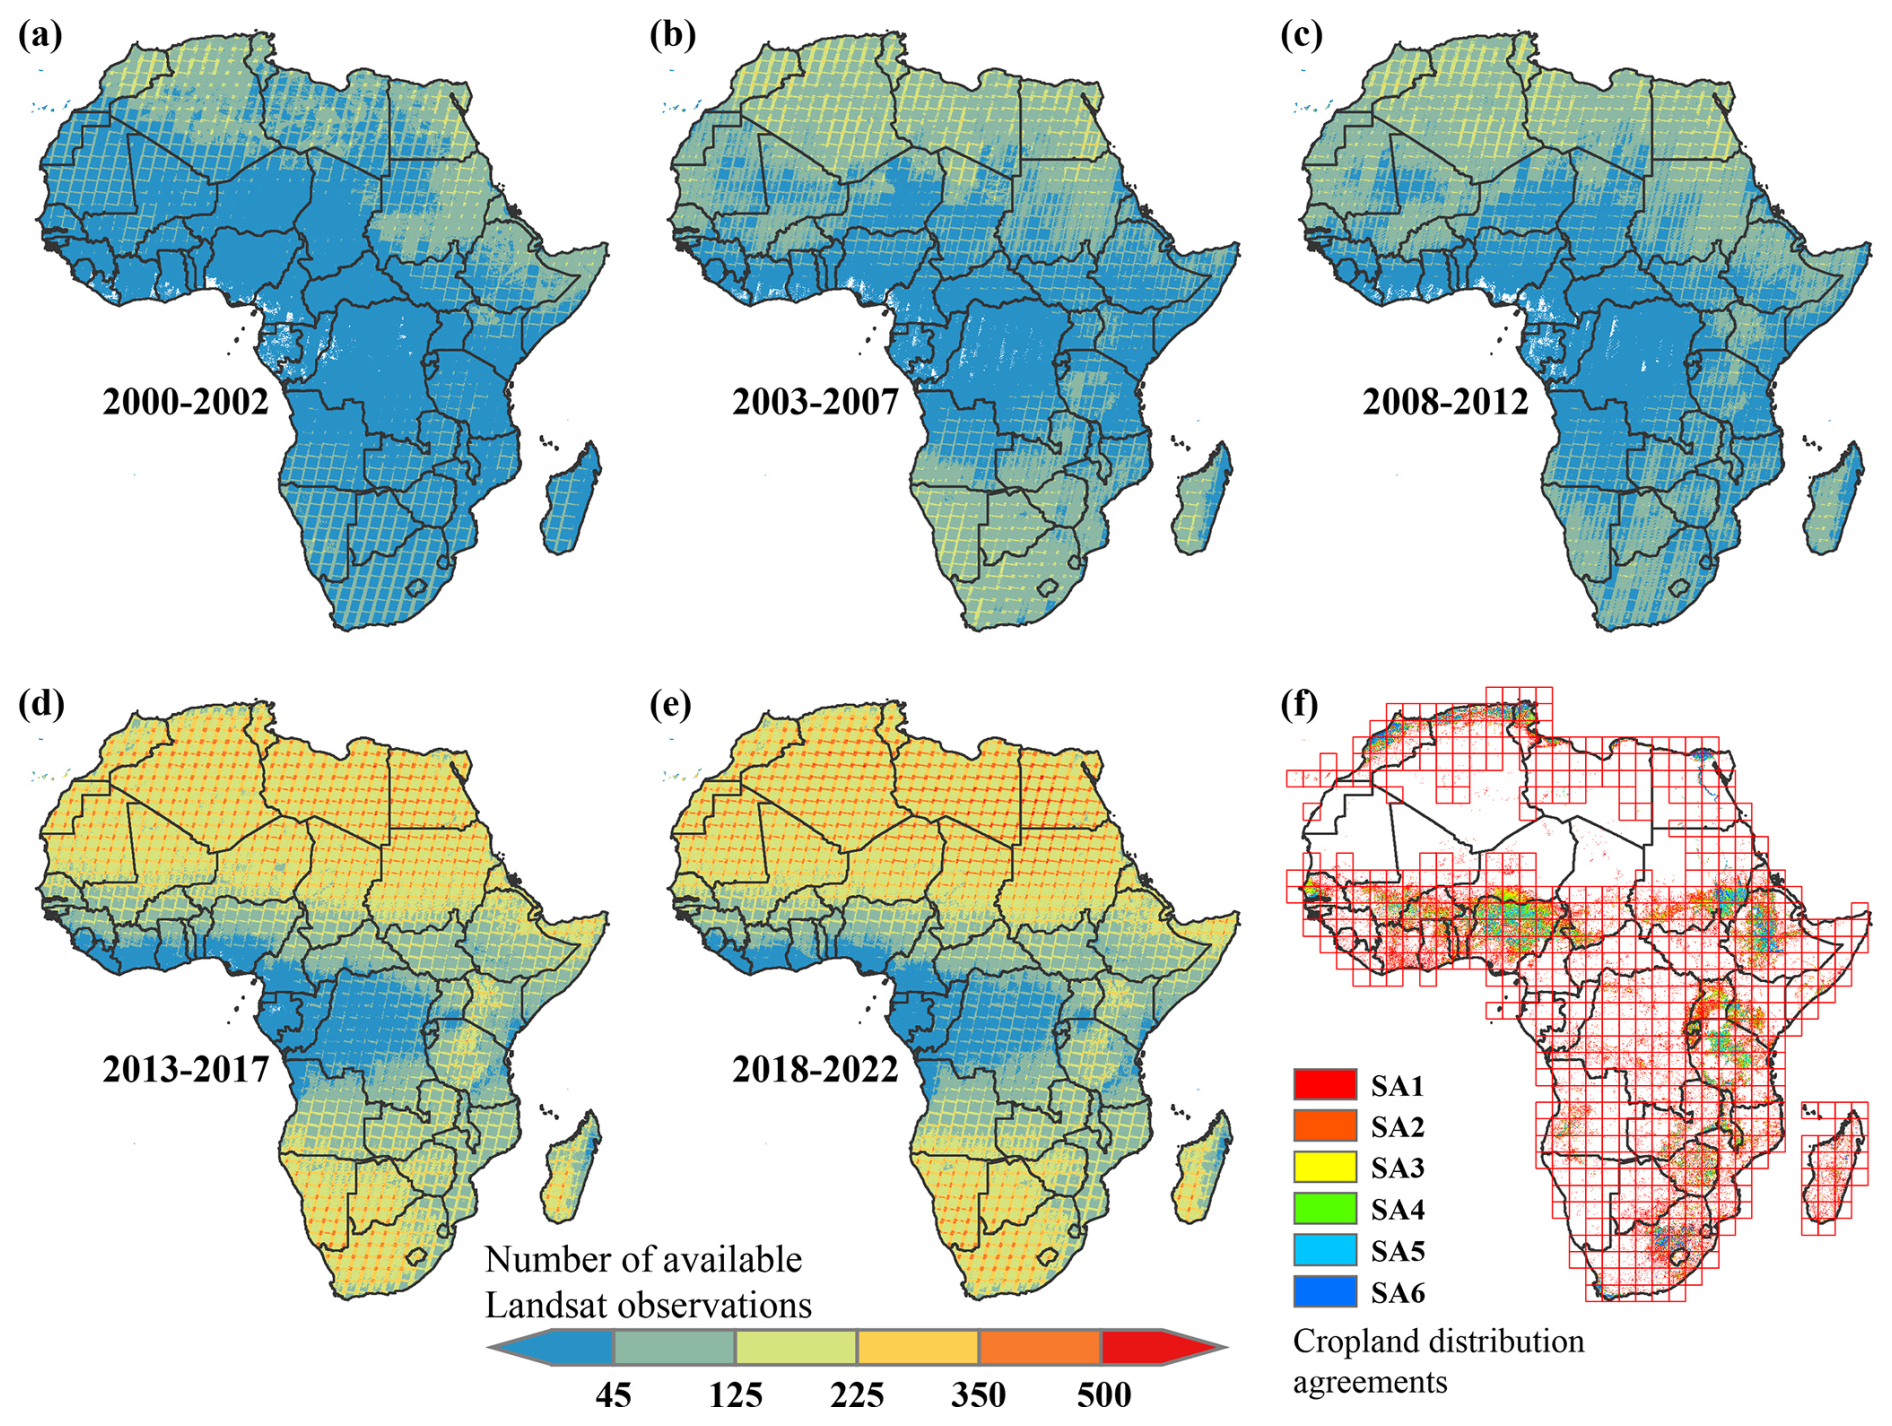
Figure 1Temporal and spatial distribution of available Landsat imagery data over Africa and (a–e) and spatial distribution of cropland derived from six global LUCC/cropland products (f). In (f), SA1–SA6 represent increasing cropland agreement levels (Tubiello et al., 2023a, b).
2.3 Validation datasets
To comprehensively analyze the accuracy metrics of the AFCD map, we collected two validation datasets: cropland samples across Africa in 2016 and 2019. Initially, we utilized 3386 independent validation samples provided by Kerner et al. (2024a) collected through field surveys and visual interpretation across eight countries in sub-Saharan Africa (shown as Fig. 2a; Kerner et al., 2024b). Additionally, we utilized crowdsourced data provided by Laso Bayas et al. (2017), collected via the Geo-Wiki platform, for validation (Fig. 2b). The dataset includes 35 866 cropland samples collected globally through a crowdsourcing campaign on the Geo-Wiki platform, with 7313 samples located in Africa (See, 2017). Each sample corresponds to a 300 m×300 m PROBA-V grid cell and records the proportion of cropland within the frame based on visual interpretation by participants. To ensure data quality, a subset of samples was randomly selected for secondary validation by three trained students (provided as control samples). Samples with inconsistent results among the student interpretations were excluded. Additionally, experts further reviewed and validated the control samples to enhance the overall reliability of the dataset (provided as expert samples) (Laso Bayas et al., 2017; See, 2017).
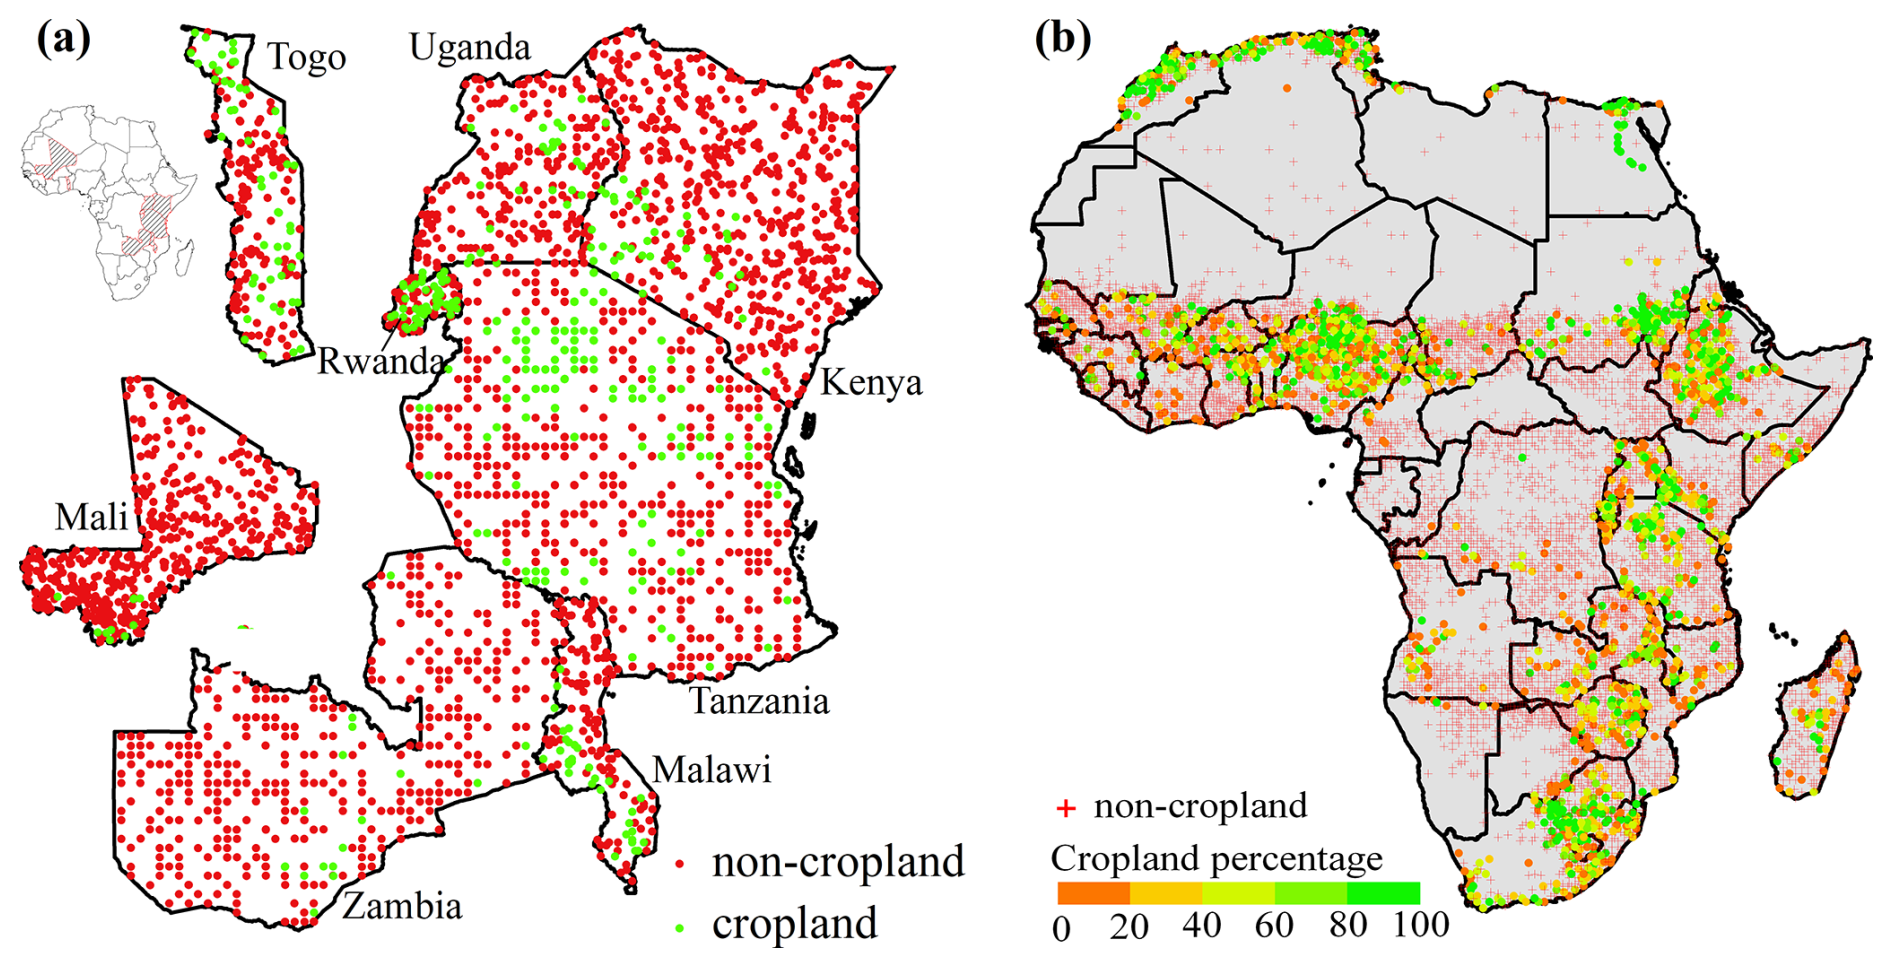
Figure 2Spatial distribution of validation points for regional and time series.
As the framework shows in Fig. 3, we propose a land cover change-detection-based approach that combines machine learning and the continuous change-detection (CCD) algorithm for mapping annual cropland extent in Africa. Therefore, we define the cropland as land used for annual and perennial herbaceous crops for human consumption, forage (including hay), and biofuel. Perennial woody crops, permanent pastures, and crop rotations are excluded from the definition. The identification of active cropland relies on significant variations in vegetation signals within time series remote sensing data over a 12-month period, indicating planting and harvesting activities. When periodic vegetation signals exhibit anomalies, we hypothesize that changes in cropping patterns or systems may have occurred.
Figure 3Flowchart of this study for mapping African annual cropland extent spanning the years 2000 to 2022.
3.1 Generate training datasets
In the process of generating training data, we employed a dual-window sliding-window strategy for the creation of cropland and non-cropland training samples. Prior studies have revealed that the distribution of training data (proportional to area and equally distributed) and data balance significantly impact classification outcomes. Quantitative analyses have demonstrated that the proportional allocation method typically achieves higher overall accuracy compared to an equally distributed approach (Jin et al., 2014; Zhu et al., 2016). Specifically, our procedure for generating reference samples is as follows:
-
All annual and multi-year products were categorized into five groups centered around the years 2000, 2005, 2010, 2015, and 2020, each group encompassing the product from the respective center year plus or minus 2 years.
-
Based on the cropland definitions and class label numbers in Table 1, each LUCC product was reclassified into cropland and non-cropland (excluding categories with significant discrepancies from other products). The data were then resampled to the WGS84 coordinate system with a spatial resolution of 0.0002875° (approximately 30 m at the Equator). For multi-year products, areas where various land cover types had not changed were extracted; for single-year products, they were used directly.
-
A dual-window methodology was applied to assess binary image classification, requiring complete category occupancy within a 150 m×150 m inner window for homogeneity and at least 80 % dominance in a 330 m×330 m outer window, ensuring spatial stability of the central pixel as a representative sample point.
-
An evaluation was performed to ascertain the recognition consistency of the central pixel's classification across various products.
-
A hexagonal grid dataset with a resolution of 0.01° was employed to randomly filter the generated excess sample points. Within each grid cell, a maximum of 10 samples of the same category with the highest recognition level was retained.
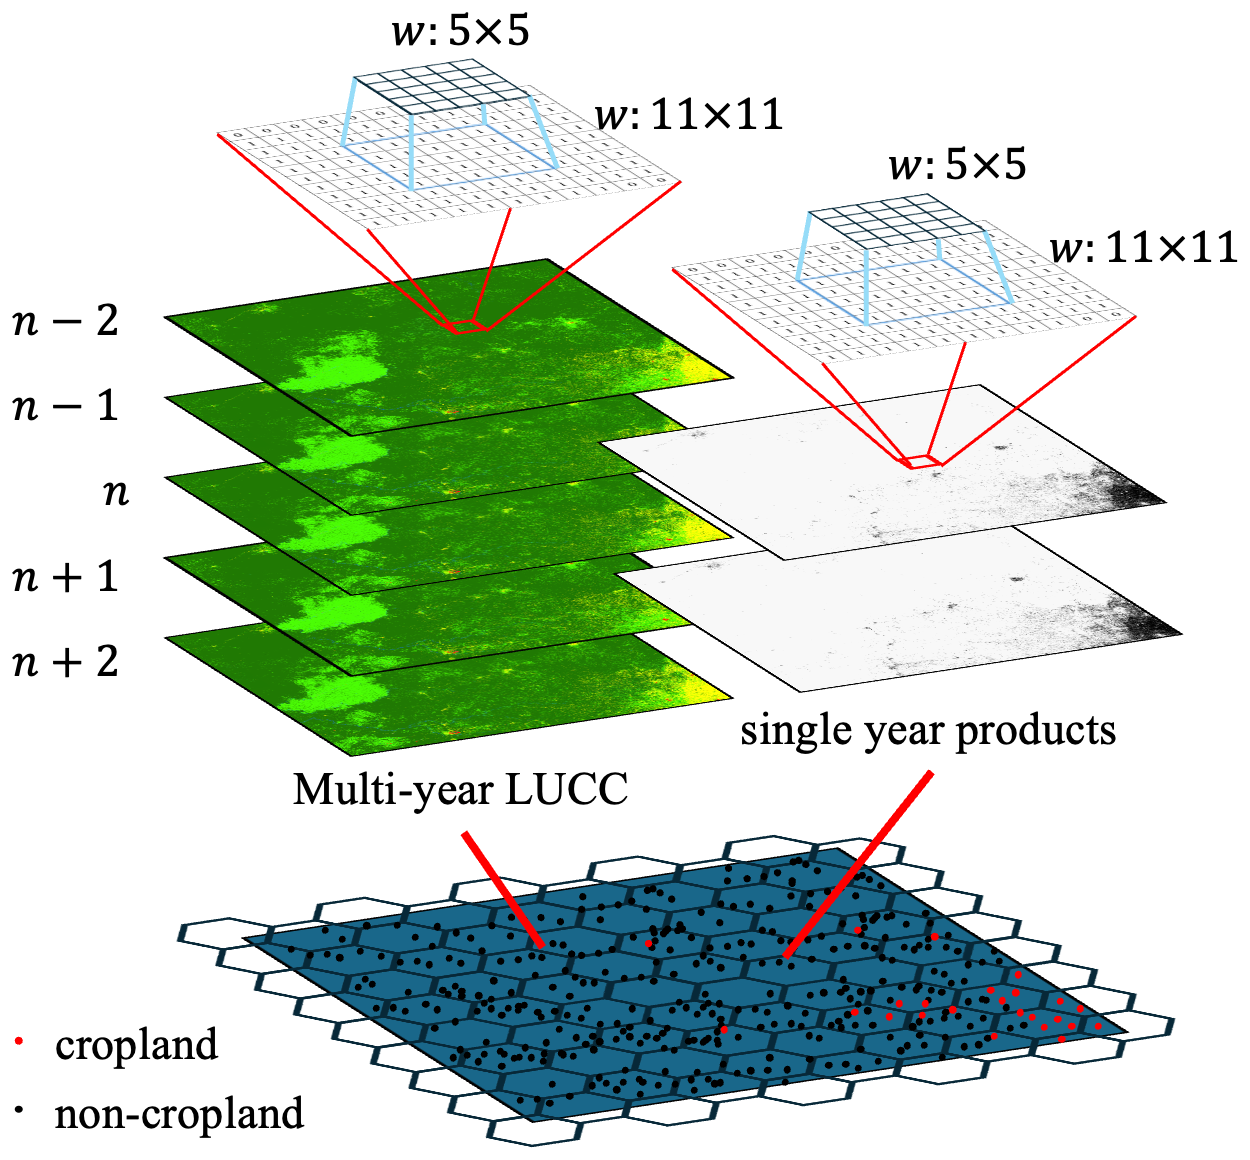
Figure 4Schematic Diagram of Training sample dataset generation using a dual-window approach.
Through the procedures, a total of five sets of sample datasets were generated, each corresponding to the classification sample data for a central year and the 2 preceding and following years.
3.2 Cropland mapping with classification methods
3.2.1 Original cropland mapping
The temporal scope for cropland extraction was extended from 2000 to 2022. Utilizing multi-temporal Landsat surface reflectance (SR) imagery is a primary method for preprocessing in contemporary land use classification. This approach mitigates the limitations of single-scene imagery by facilitating the extraction of seasonal changes on the Earth's surface. Consequently, two methods for temporal data synthesis have been developed: seasonal composites (e.g., 16 d, monthly, and seasonal composites) and metrics composites. The metrics composite method, introduced by Hansen et al. (2013), captures phenological and land cover changes without requiring assumptions or prior knowledge about seasonal timing, making it globally applicable without location-specific modifications.
In this study, five spectral bands from Landsat, excluding the blue band, were used along with four spectral indices: enhanced vegetation index (EVI), soil-adjusted vegetation index (SAVI), normalized difference water index (NDWI), and normalized burn ratio (NBR). From these nine spectral features, five percentiles (10th, 25th, 50th, 75th, and 90th) were calculated, resulting in a total of 45 spectral features. Additionally, topographic parameters (elevation, slope, and aspect) were derived from the global 30 m digital elevation model (DEM) provided by ASTER GDEM. Texture features (variance, homogeneity, contrast, dissimilarity, entropy, and correlation) were generated from the gray-level co-occurrence matrix based on the near-infrared (NIR) band, yielding a total of 54 feature parameters for subsequent classification tasks.
For classifier selection, we utilized the ee.Classifier.smileRandomForest() method available on the GEE cloud platform. This algorithm determines pixel class membership by adjusting two key parameters: the number of decision trees (Ntree) and the number of predictor variables (Mtry) at each node split, using a combination of training samples and multivariate features. Previous studies have shown that the classification accuracy of this algorithm is not significantly affected by the specific parameter values (Belgiu, 2016; Zhang et al., 2019). Therefore, Ntree was set to the default value of 500, and Mtry was set to the square root of the total number of input features. A separate classifier was trained for each 2° grid (Fig. 1f) cell using the random forest method, with training samples drawn from the four neighboring grid cells surrounding the target grid unit.
3.2.2 Change detection by CCD algorithm and updating changes
Changes in cropland are generally more complex than other forms of land use changes, such as deforestation and urban expansion. These changes can be categorized as follows: (1) acquisition of new agricultural land, achieved through clearing forests or converting savannah regions into arable land; (2) short-term fallowing, which involves temporarily resting the land to restore soil fertility; (3) abandonment, where agricultural land is left unused due to various factors; and (4) urban replacement, where agricultural fields are progressively replaced by urban areas as a result of socioeconomic development. In this study, the CCD algorithm (Zhu and Woodcock, 2014) is applied to identify changes in cropland areas. This algorithm employs Fourier transform techniques to model time series observations using trend terms (to estimate trend changes) and harmonic terms (to describe periodic changes) and then identifies potential land use disruptions when the time series reflectance data exhibit six consecutive outliers that significantly deviate from the model-fitted curve (Zhu and Woodcock, 2014). This detection criterion typically corresponds to substantial surface modifications, including but not limited to afforestation initiatives (Decuyper et al., 2022), agricultural reclamation projects (Chen et al., 2023), or spontaneous cropland abandonment, thereby facilitating precise detection of changes in cropland regions. Specifically, the algorithm decomposes the time series data into trend and periodic components using the Fourier transform as shown in Eq. (1):
where represents the estimated value at Julian day t and band i. The parameter a0,i is the intercept term at band i, reflecting the average level of the time series, while c1,i is the linear trend coefficient, indicating the linear change over time at that location. The summation includes the harmonic components, where n is the number of harmonics. The coefficients ak,i and bk,i are the cosine and sine coefficients for the kth harmonic, describing the amplitude and phase of periodic changes. The functions and are the cosine and sine functions for the kth harmonic, with T being the period length (default is 365.25) used to capture periodic variations (Xian et al., 2022).
In this study, we utilize the JavaScript API provided by the GEE platform, specifically the ee.Algorithms.TemporalSegmentation.Ccdc() function, to detect land use changes. This algorithm identifies change points in land use by analyzing time series data. In this study, we apply the CCD algorithm alongside continuous Landsat imagery data to determine the stable time intervals of agricultural land pixels and identify specific temporal points of land use changes. This approach also enabled the identification and correction of misclassifications occurring during these stable periods by majority voting.
3.3 Accuracy assessment
The validation of the African cropland product involved three complementary approaches. First, we evaluated the accuracy of AFCD by comparing its national-scale area statistics with official FAO reports and other existing cropland products, using R-square (R2, shown in Eq. 2) as the evaluation metric. Second, we performed sample-based validation using multiple independent datasets. Third, we performed spatial consistency analysis by comparing our product with existing remote-sensing-derived cropland maps.
For the sample-based validation, we employed three distinct strategies: (1) we reserved 30 % of consensus samples from model training for internal validation of classification accuracy, (2) utilized the cropland/non-cropland samples from sub-Saharan Africa compiled by Kerner et al. (2024) for independent accuracy assessment (as described in Sect. 2.3), and (3) applied the global cropland sample dataset from Laso Bayas et al. (2017) for sample-based area estimation validation (as described in Sect. 2.3). The first two validation approaches employed four key accuracy metrics calculated through confusion matrix analysis, as shown in Eq. (3):
For binary classification (cropland vs. non-cropland), we define the number of classes as m=2, corresponding to class labels 0 and 1. Let N be the total number of validation samples and pij denote the number of samples belonging to class i but classified as class j, with pkk representing correctly classified cases. The marginal sums and correspond to row and column totals, respectively.
For the Laso Bayas et al. (2017) dataset validation, we calculated mean absolute error (MAE) by comparing our mapped cropland area proportions against reference values within 300 m×300 m sample units. The MAE computation is shown in Eq. (4):
where Am denotes the mapped cropland proportion, Ar is the reference proportion, and n is the sample count.
In addition, we evaluated the similarity of AFCD with other multi-source remote sensing cropland extent maps through comparative analysis. First, five representative agricultural zones were selected as sample areas based on cropland intensification levels and spatial continuity characteristics, including (1) contiguous irrigated agricultural zones, (2) dispersed traditional rainfed agricultural areas, (3) mountainous terrace farming systems, (4) semi-intensive agro-pastoral transition areas, and (5) fragmented transitional cropland regions. Within each sample area, 1500 validation points were systematically collected, with similarity matrices employed to compare our maps with other remote-sensing-based land cover products (Phalke et al., 2020). From these matrices, we computed standard accuracy metrics including PA, UA, F1 score, and overall similarity (equivalent in calculation to OA). It should be specifically noted that the comparative datasets (e.g., GLAD, as described in Sect. 2.1) exhibit significant discrepancies in cropland definitions, spatial resolution, mapping years, and classification methodologies. To mitigate the impacts of these disparities during comparison, spatial resampling of our map products was occasionally required along with temporal alignment using outputs from identical reference years as comparator products.
4.1 Classification results
The outcomes of this study are an annual 30 m cropland extent map for Africa spanning 2000 to 2020 (Fig. 5), which demonstrates strong performance in capturing cultivated areas across diverse agricultural landscapes. As illustrated in Fig. 5, five representative regions were selected to evaluate the AFCD's capability in recognizing varying cropland patterns under different agricultural conditions. The contiguous irrigated agricultural zones in Egypt, characterized by large, contiguous cropland due to intensive agriculture, were easily identified (Fig. 5b). Similarly, the dispersed traditional rainfed agricultural areas in Senegal were accurately captured (Fig. 5b). The mountainous terrace farming systems in Rwanda were also well mapped (Fig. 5b) along with the semi-intensive agro-pastoral transition areas in Kenya (Fig. 5b). Lastly, the fragmented transitional cropland regions in Sudan were correctly identified, showcasing the AFCD's capacity to detect various agricultural systems across different landscapes.
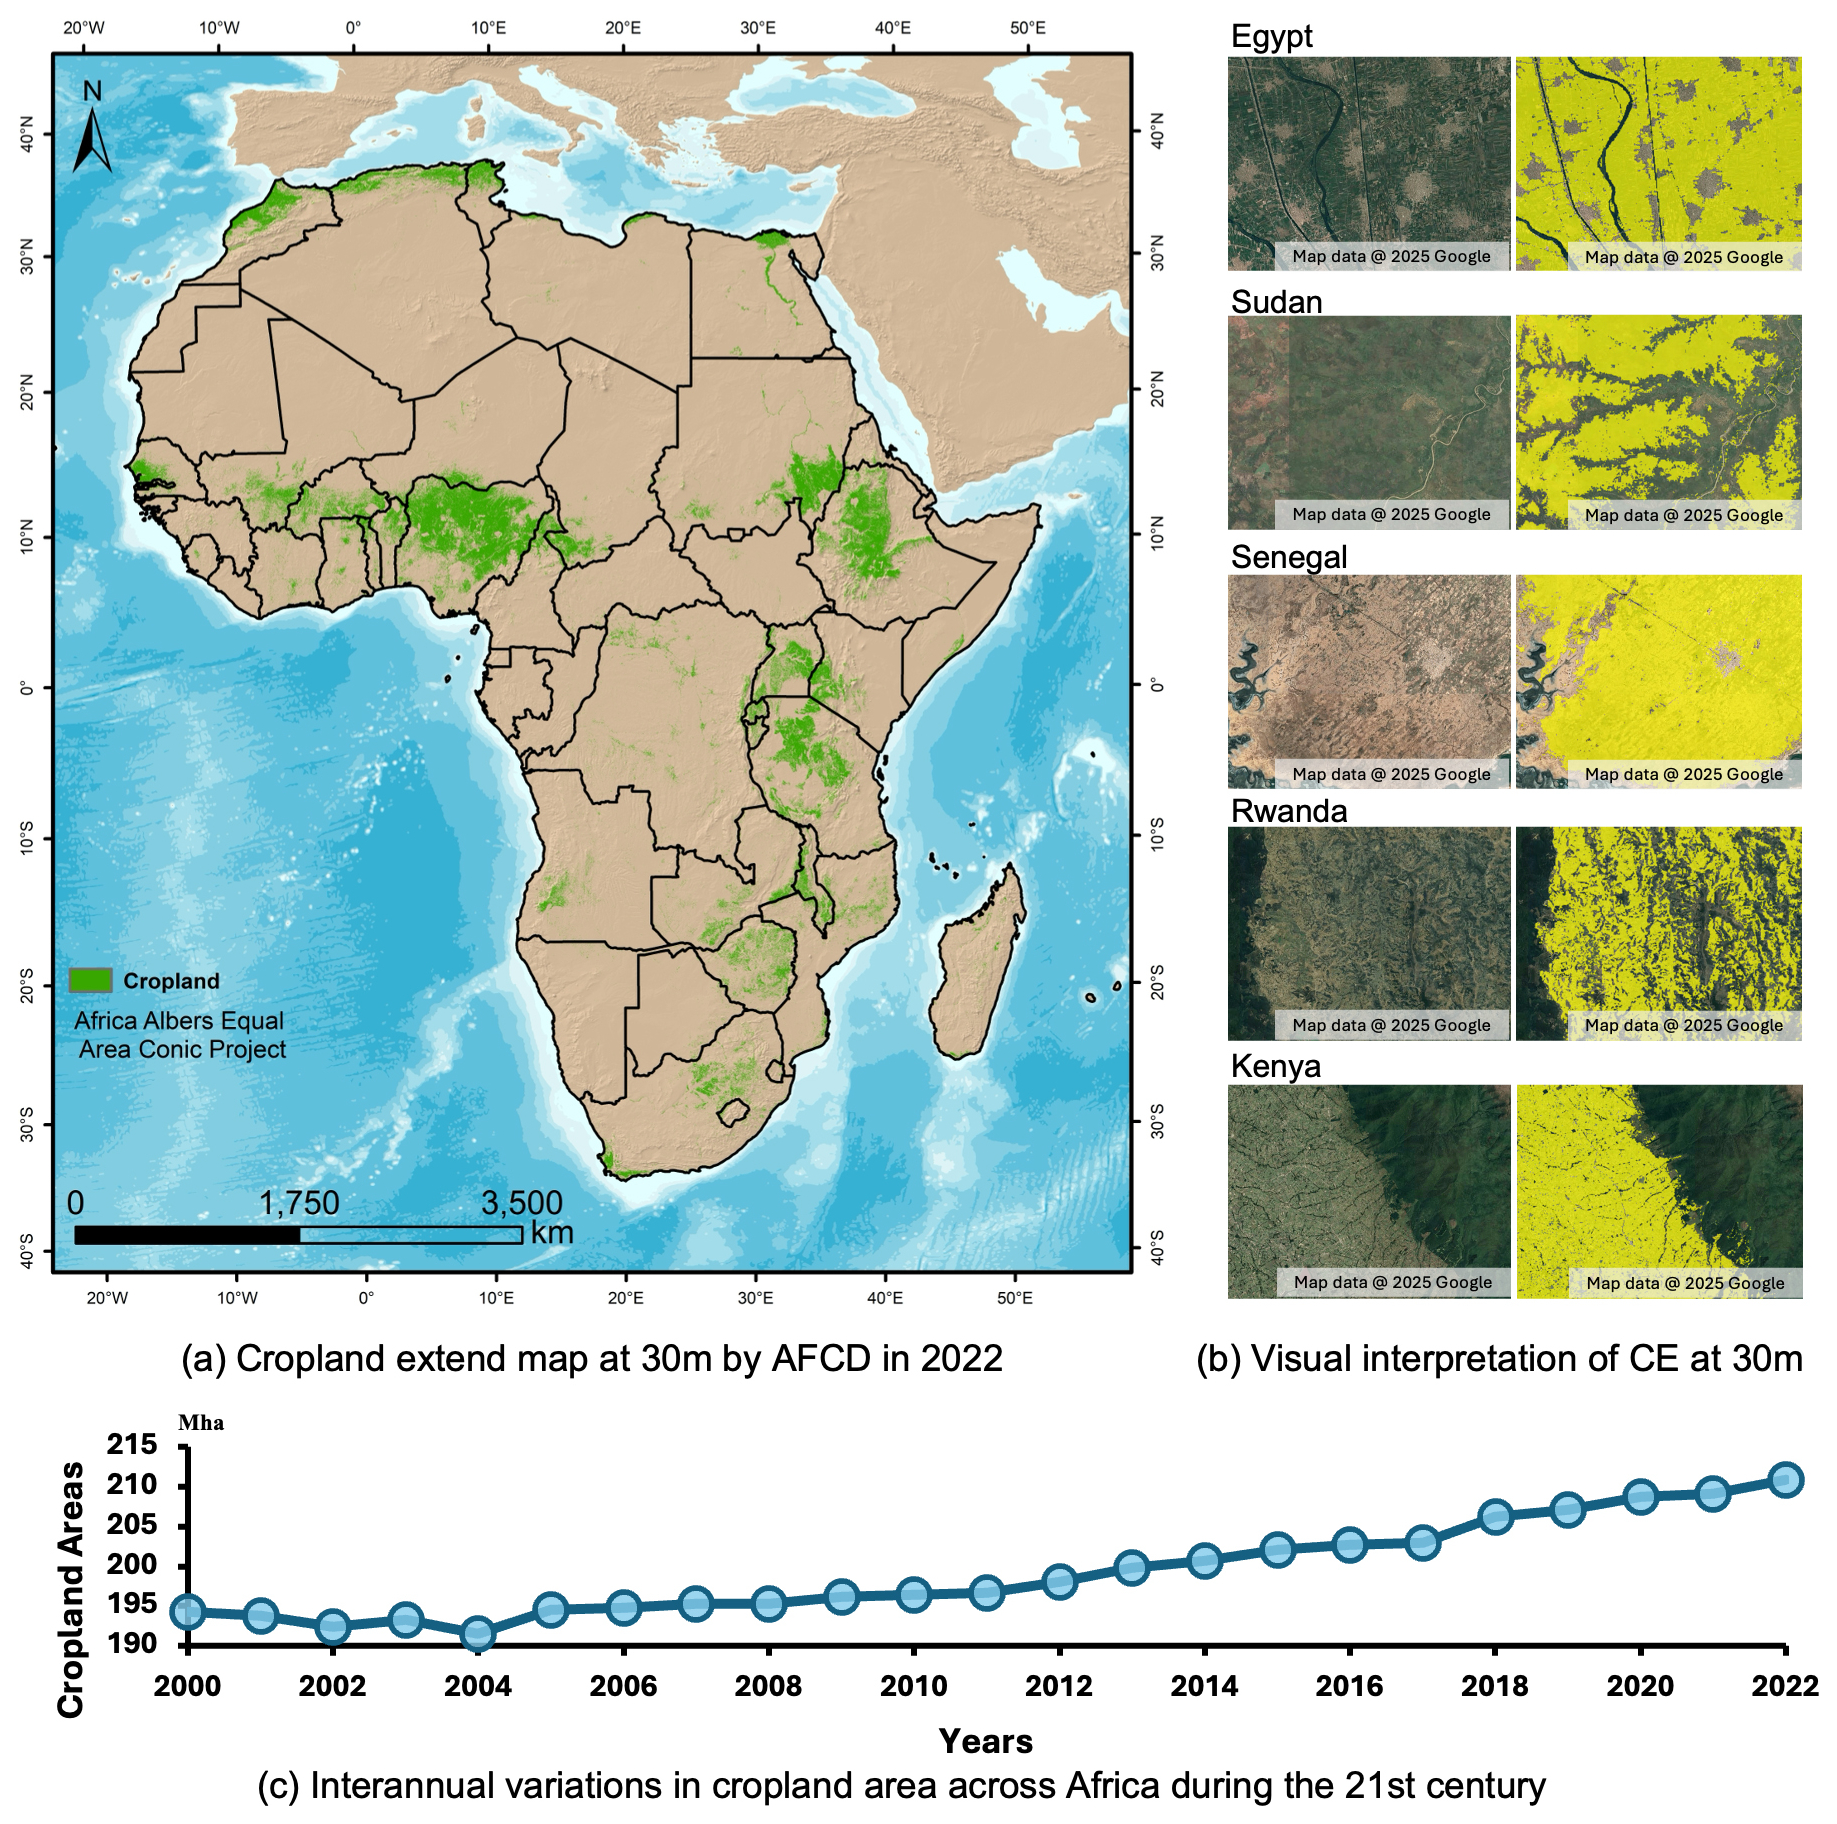
Figure 5Cropland extent map of Africa in 2022 at 30 m resolution by the Africa Cropland Dynamic map (AFCD) project (a); visual interpretation of cropland extent for selected African countries (b) and interannual variations in cropland areas across Africa during the 21st century (c). Yellow color represents the cropland mask, and the background is the natural color composite high-resolution imagery available in Google Earth Engine (© Google Earth 2025).
4.2 Independent accuracy assessment of AFCD map
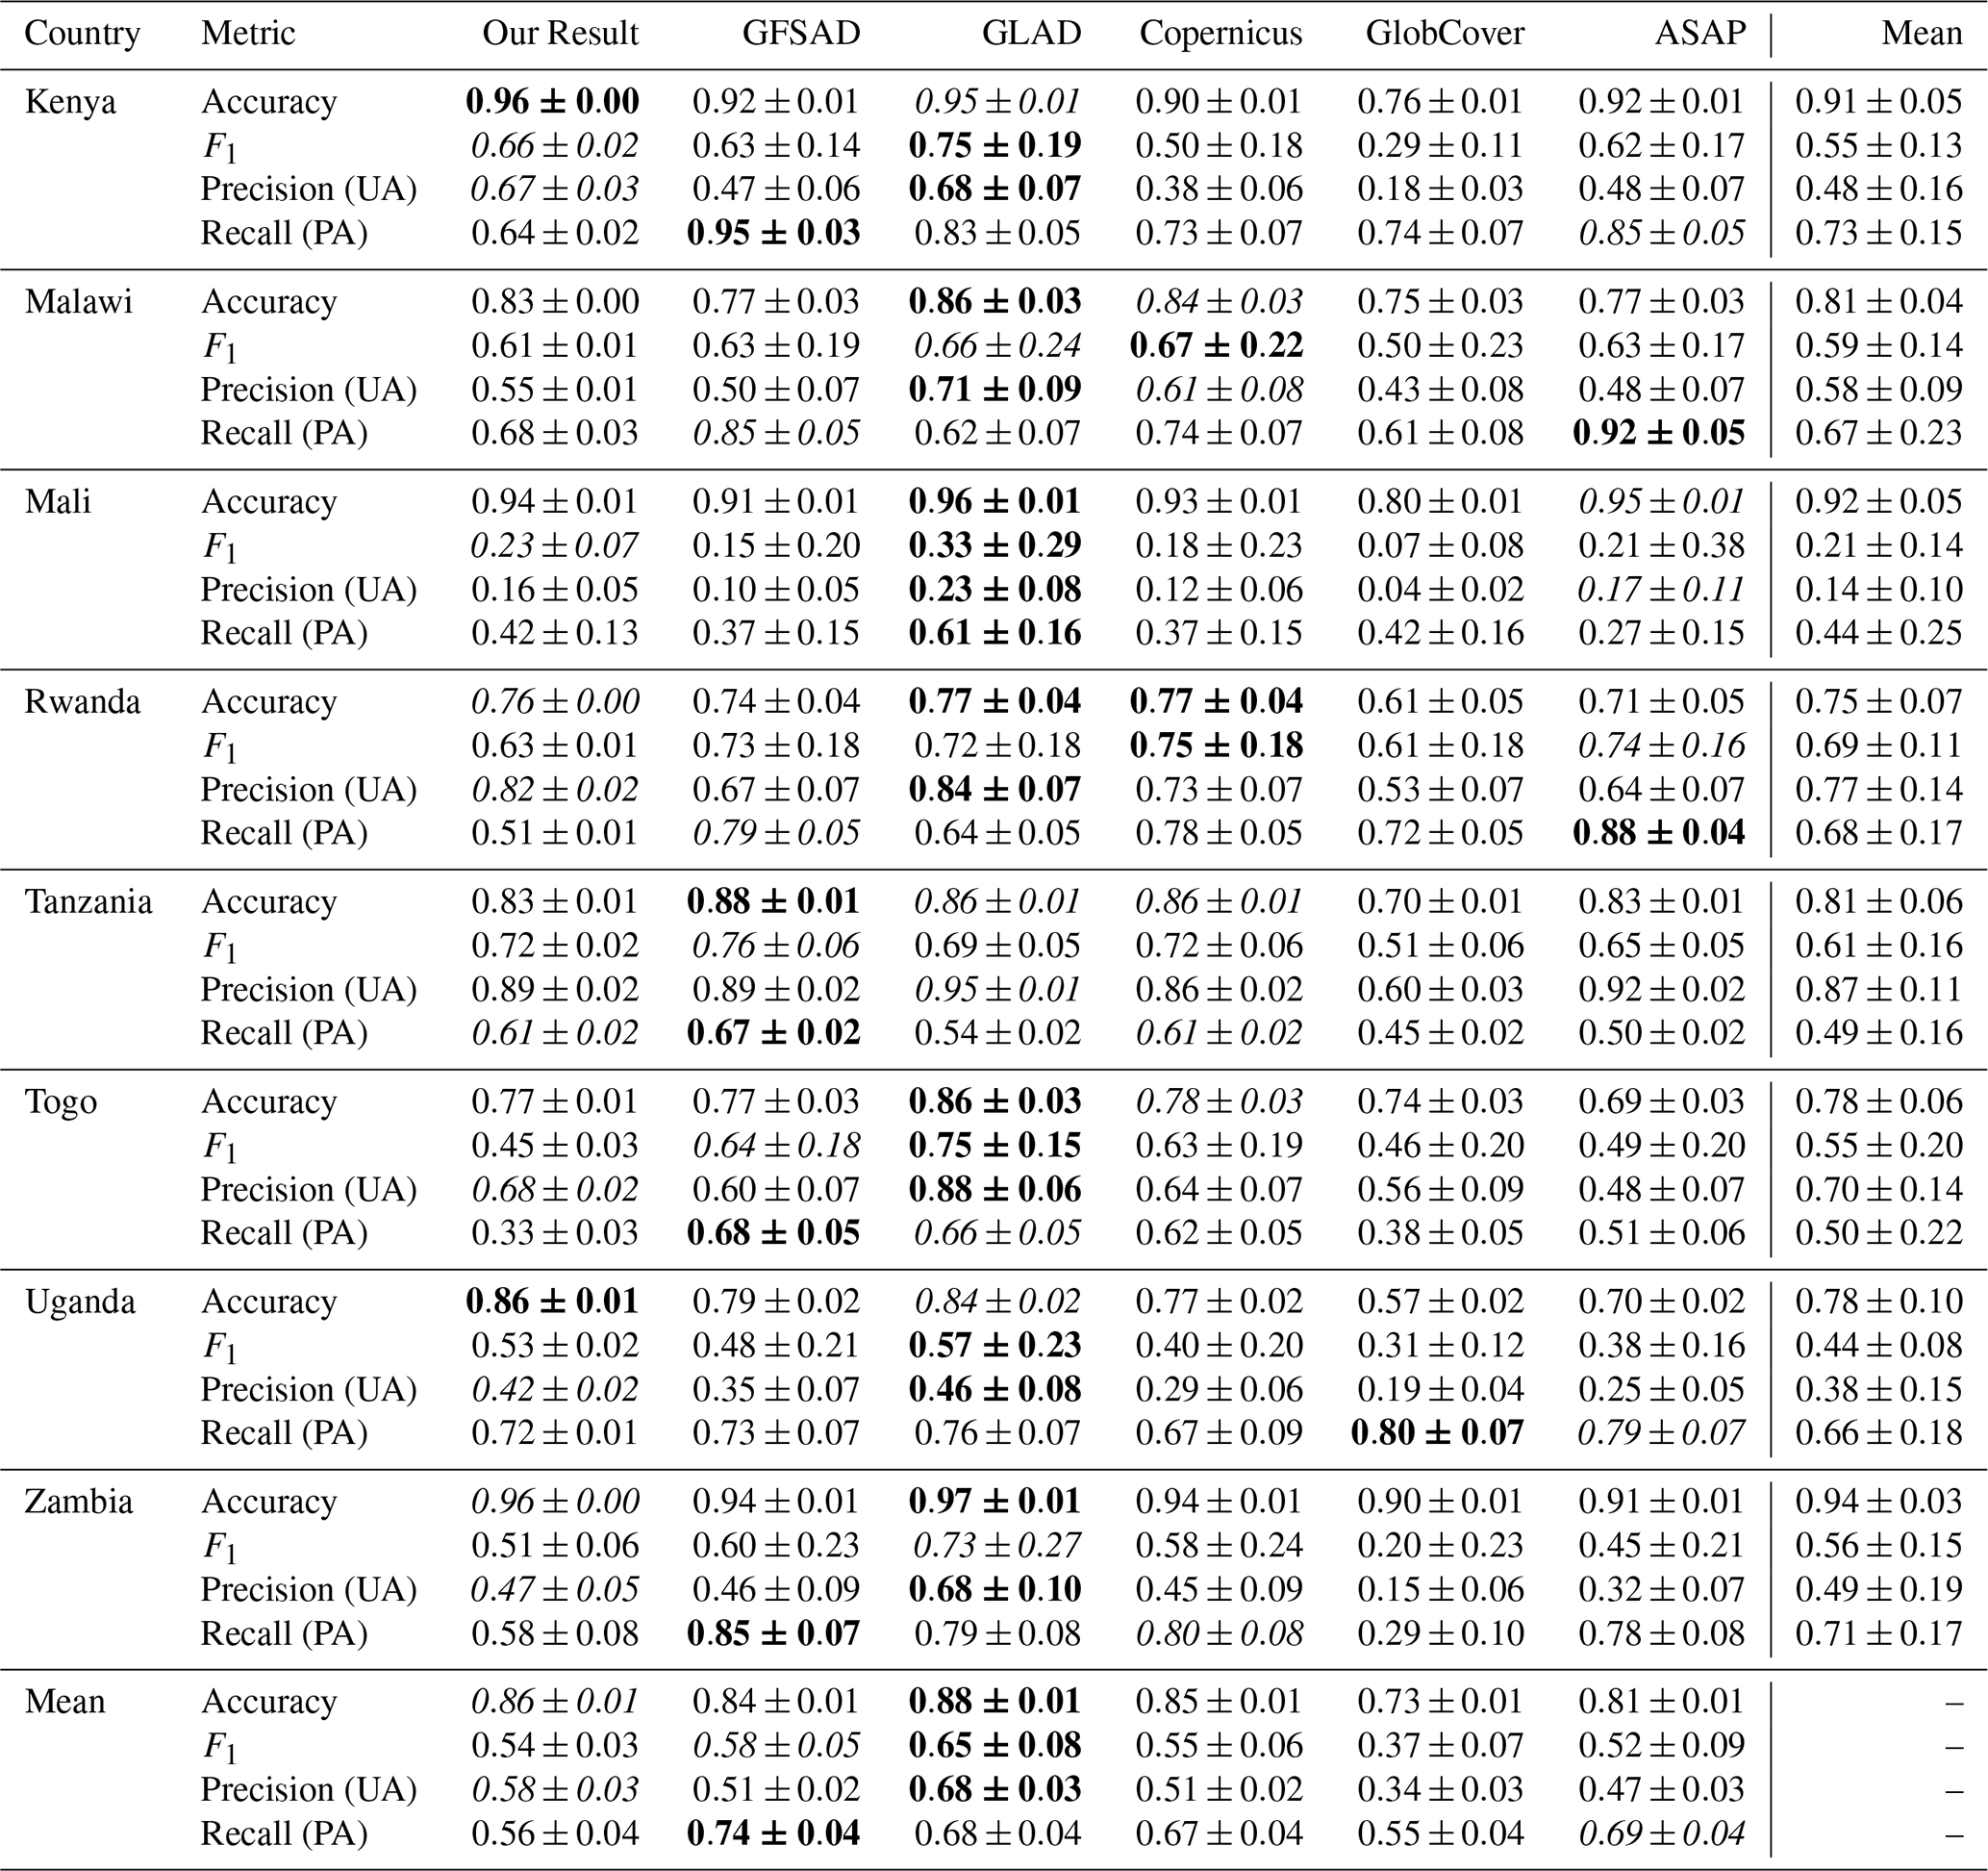
We performed a pixel-wise accuracy assessment of annual cropland map based on the validation sample set. The F1 score, OA, UA, PA, and kappa coefficient of annual maps on average were 0.86 ± 0.01, 0.97 ± 0.01, 0.88 ± 0.07, 0.77 ± 0.07, and 0.93 ± 0.01, respectively. Spatially, mapping accuracy can vary across different tiles, likely due to the sparse distribution of cropland. The overall classification accuracy of the model exceeds 90 % across most regions, except for central and southern Niger, where the accuracy is lower. In most areas, the F1 scores are above 0.80 and both omission and commission errors are lower than 0.2. For the sample data provided by Kerner for eight countries in sub-Saharan Africa, the sample collection year is 2019. Consequently, we selected cropland extraction results from this time frame for validation. The outcomes and comparisons with other products are presented in Table 2. We primarily utilized this sample to evaluate our product, while the accuracy metrics for other products were sourced from the study by Kerner et al. (2024). Based on four evaluation metrics and results from eight target countries, we compared the performance of our product against that in other nations and the average level. Our cropland identification model performed exceptionally well in countries such as Kenya and Mali, achieving an accuracy of 0.96 and an F1 score of 0.92, indicating a strong balance between precision and recall. However, the model's performance was relatively weaker in Zambia, Togo, and Uganda, with accuracies of 0.82 and 0.78, respectively.
Table 2Performance metrics and associated standard errors for our results and other maps based on Kerner's reference dataset. The highest value in each row is formatted in bold typeface, while the second-highest value appears in italic.
Secondly, we utilized the crowdsourced sample data provided by Laso Bayas et al. (2017) to extract the proportion of cropland area within a 300 m×300 m square around each point. We then calculated the MAE between the extraction results and visual interpretation, and the result indicated values of 15.07 % ± 1.70 % for all samples, 10.78 % ± 1.56 % for control samples, and 31.45 % ± 8.47 % for expert samples.
4.3 Comparison of cropland areas
The net cropland area for Africa has grown from an estimated 1.9435×10⁸ ha in 2000 to 2.1092×10⁸ ha in 2022. This estimate is in line with other remote-sensing-based estimates although major differences exist. This study conducted cross-validation between national-scale cultivated land area estimations and statistical data from the FAO covering 50 African countries/regions (partial areas excluded due to data gaps), demonstrating strong concordance (R2=0.83; Fig. 6a). It should be specifically noted that our total cropland estimates exhibit a 10 %–24 % discrepancy range compared with official FAO statistics. This divergence may originate from two principal factors: (1) FAO's statistical framework heavily relies on self-reported national data, inherently constrained by inconsistent survey methodologies and update delays (Fritz et al., 2015), and (2) the remote-sensing-based classification and limited temporal consistency may lead to the misclassification of intermittently fallowed croplands. Comparative analysis with independent remote sensing products (GLAD and LGRIP) revealed three critical findings: first, the 30 m resolution GLAD dataset showed optimal linear agreement with our estimates ( ha, R2=0.94; Fig. 6b). Second, the 100 m resolution LGRIP dataset exhibited a larger intercept of 1.19×10³ ha (R2=0.86; Fig. 6c). Notably, the minimal area discrepancy between GLAD and our study (slope coefficient=0.98 ± 0.03) primarily stems from mutual adoption of 30 m resolution detection criteria. However, the observed high consistency with LGRIP (R2=0.86) mainly reflects mutual recognition of dominant cropland types given LGRIP's emphasis on rainfed/irrigated classifications (unaddressed in our study) and Africa's overwhelming predominance of rainfed cultivation systems (FAO, 2020).
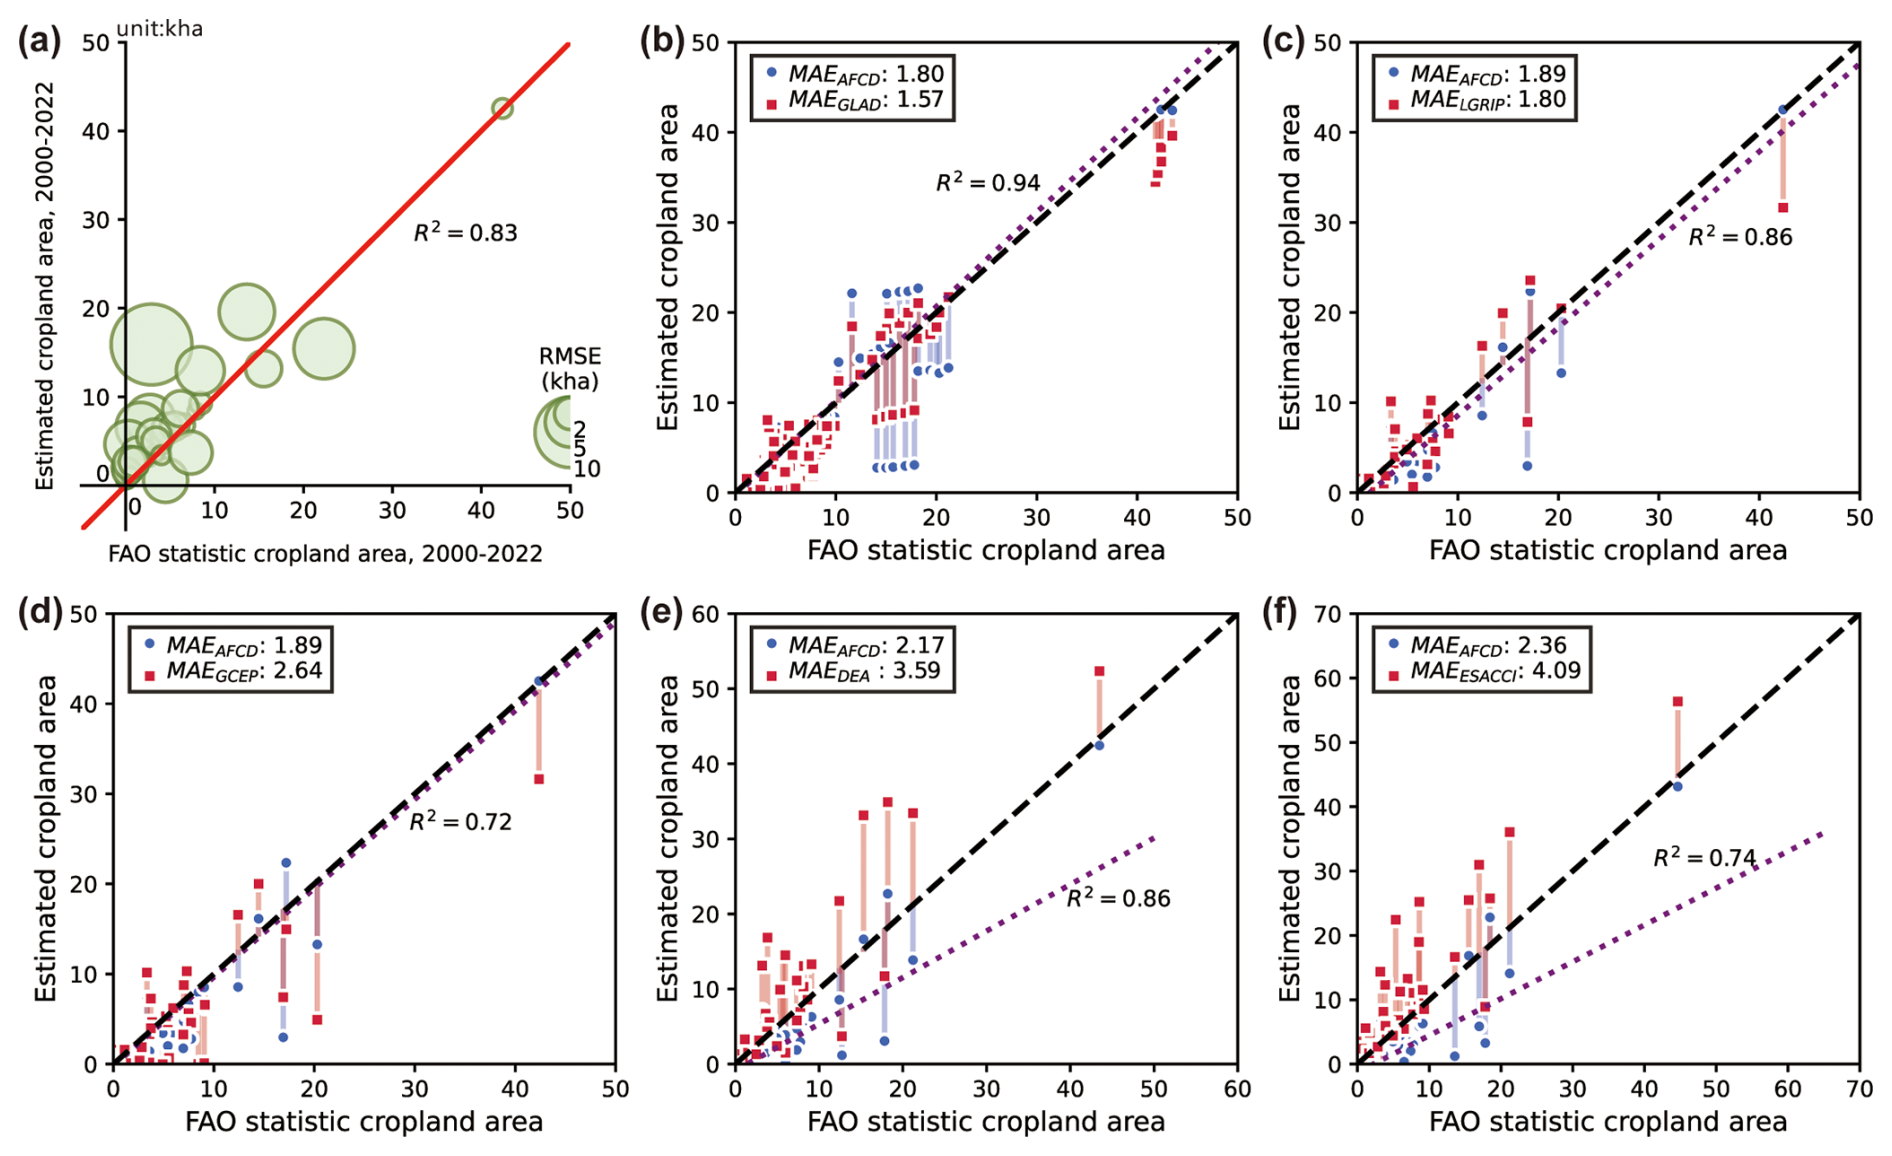
Figure 6Comparison of AFCD with FAO statistical cropland area (a) and other LUCC/cropland products (b–f) (2000–2022). In (b)–(f), blue dots and red squaresPl show the differences from FAO estimates for AFCD and other products, respectively. The purple line indicates the linear fit between AFCD and each product.
4.4 Map-to-map comparison results
The comparison of cropland maps derived from this study with the cropland labels in GLAD2019 reveals a high level of agreement across the entire study area, with an overall similarity of 87.7 %. Specifically, the producer's cropland similarity was 85.2 % (corresponding to an omission error of 14.8 %), while the user's cropland similarity was slightly higher at 86.9 % (resulting in a commission error of 13.1 %). Among the selected regions, Nigeria exhibited the highest similarity at 94.6 % with an F1 score of 0.963. Senegal followed closely with an overall similarity of 94.4 % (F1 score=0.858), while Rwanda showed the lowest similarity at 76.7 % (F1 score=0.766). Visual comparisons highlighted the successful identification of major irrigated agricultural zones (such as in Egypt) and rainfed cultivation areas (notably in Nigeria).
When compared with the 10 m African cropland product from Digital Earth Africa (DEA) for 2019, the similarity in Egypt was particularly high, with an overall similarity of 90.1 % (F1 score=0.913). In this case, the producer's cropland similarity was 86.5 % (omission error=13.5 %), while the user's cropland similarity reached 96.5 % (commission error=3.5 %). The primary cause of discrepancies is the use of Sentinel-2 10 m resolution imagery in the DEA product, which improves boundary delineation between cropland and adjacent land covers, reducing mixed-pixel effects. As a result, our AFCD product tends to show more omission errors compared to DEA, while the commission errors remain below 5 %, highlighting its strong performance in detecting cropland areas.
A cross-comparison with the LGRIP30 global 30 m irrigated/rainfed cropland dataset (2015 vintage) in Nigeria's predominantly rainfed systems showed an overall similarity of 89.7 % (F1 score=0.932). The producer's cropland similarity was notably high at 95.8 % (omission error=4.2 %), while the user's cropland similarity was 88.4 % (commission error=11.6 %). The discrepancy is mainly due to occasional misclassifications in the LGRIP30 dataset, where buildings, roads, and neighboring woodlands are sometimes incorrectly labeled as cropland. Nevertheless, the spatial agreement between the AFCD and LGRIP30 datasets remains substantial, with a similarity of nearly 90 %.
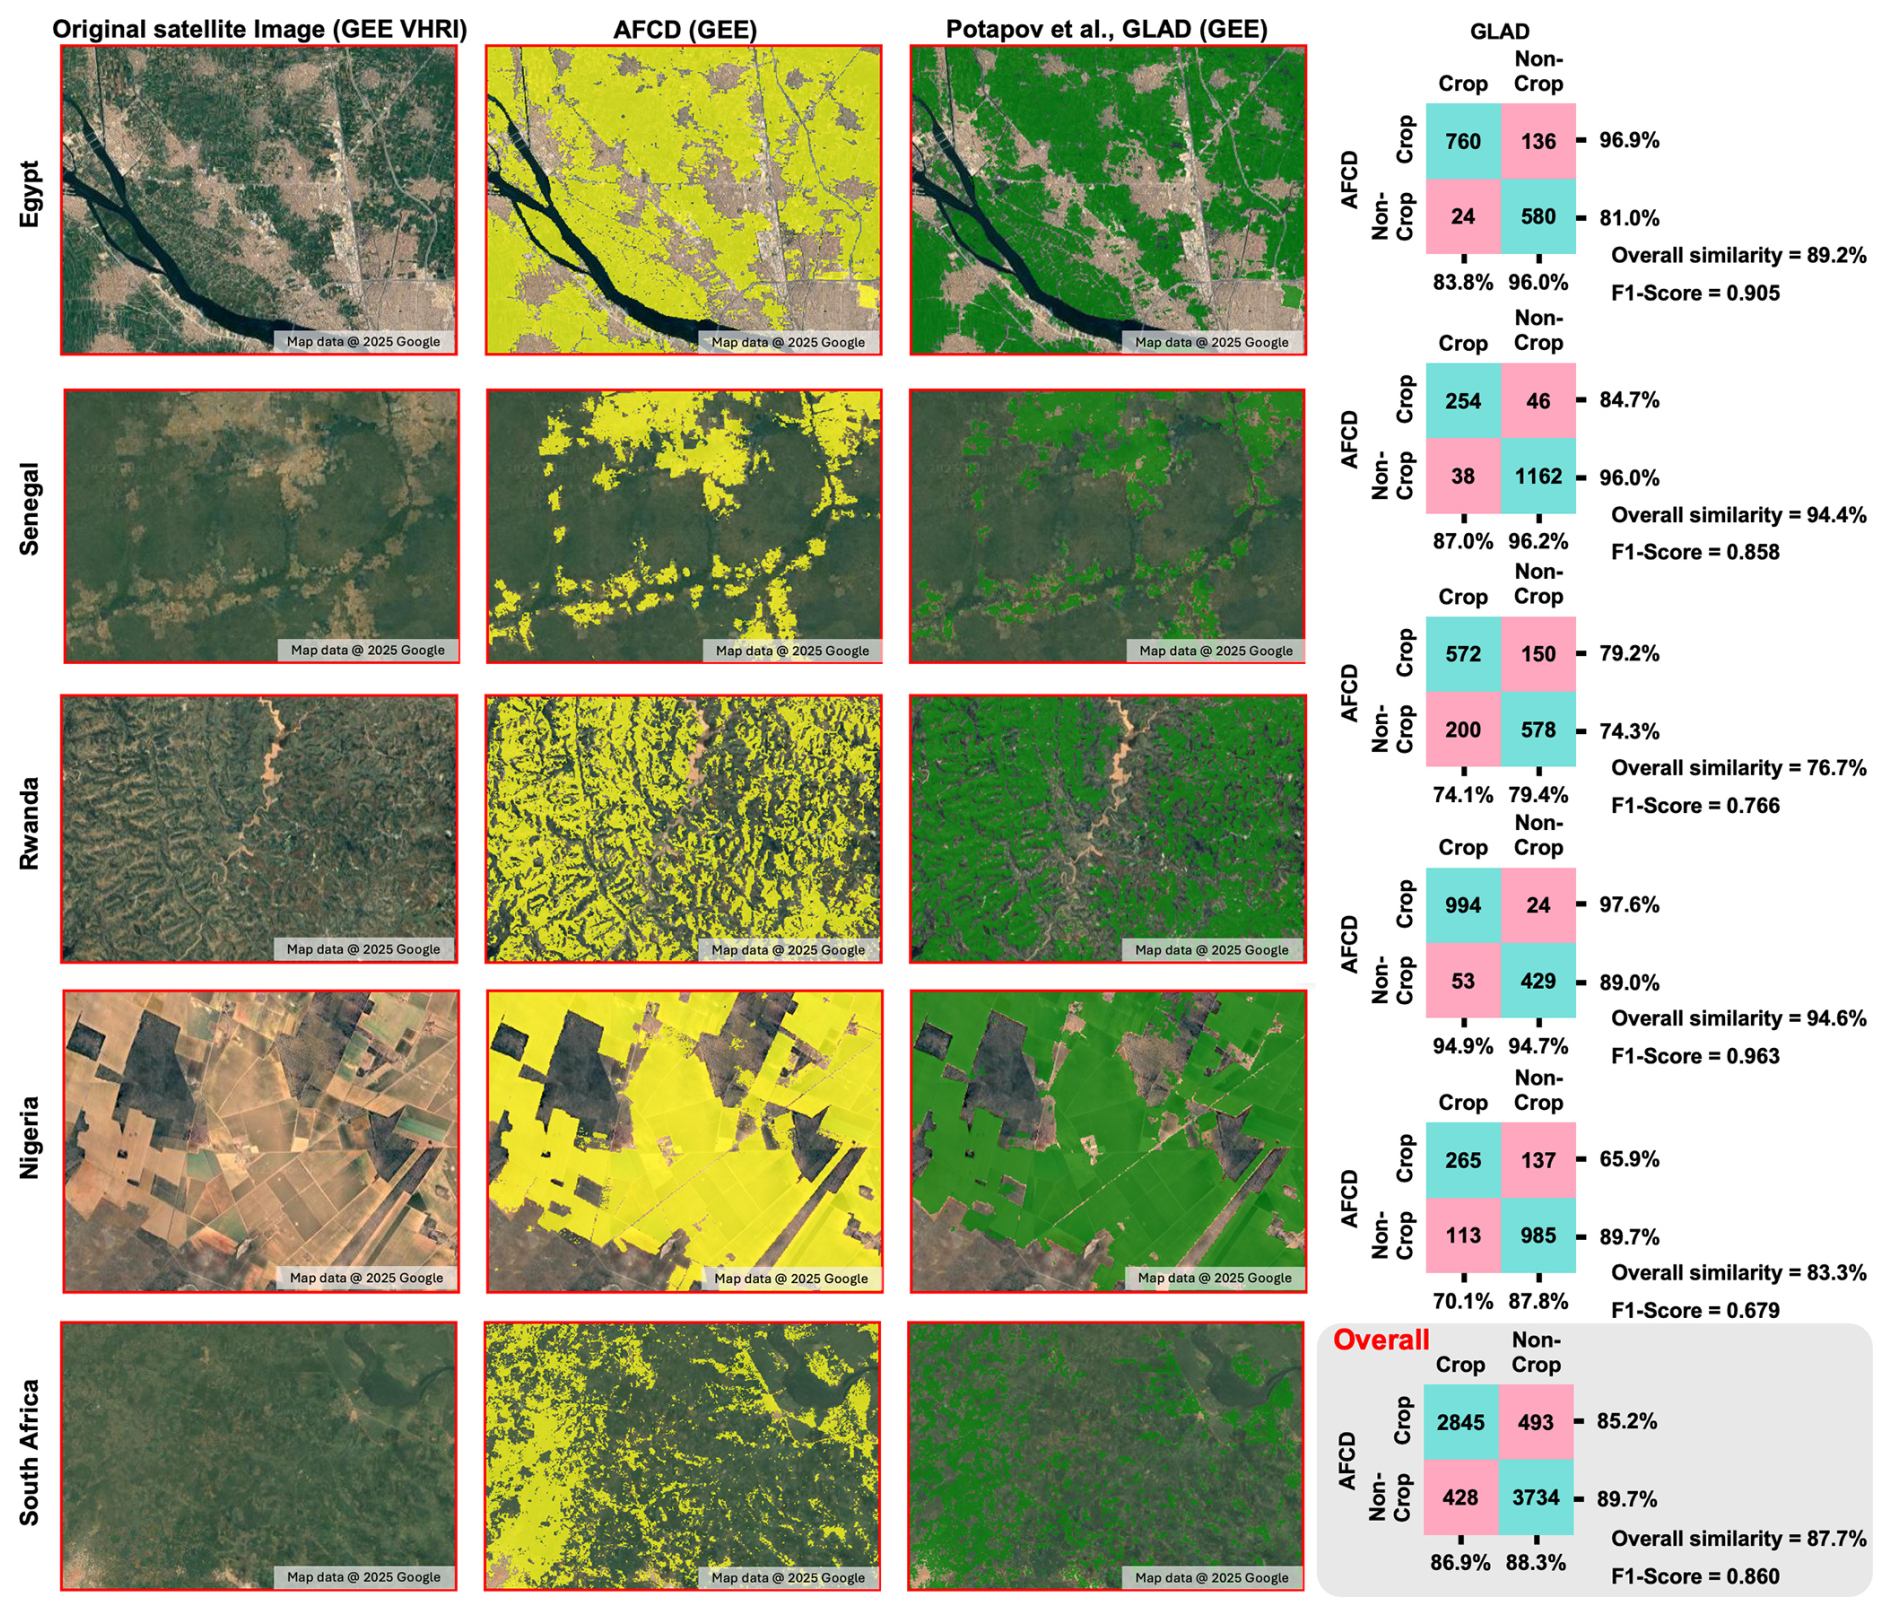
Figure 7Visual comparison of cropland and non-cropland classification results from AFCD and Potapov et al. (2022) (glad) across multiple African countries, and the background is the natural color composite high-resolution imagery available in Google Earth Engine (© Google Earth 2025).
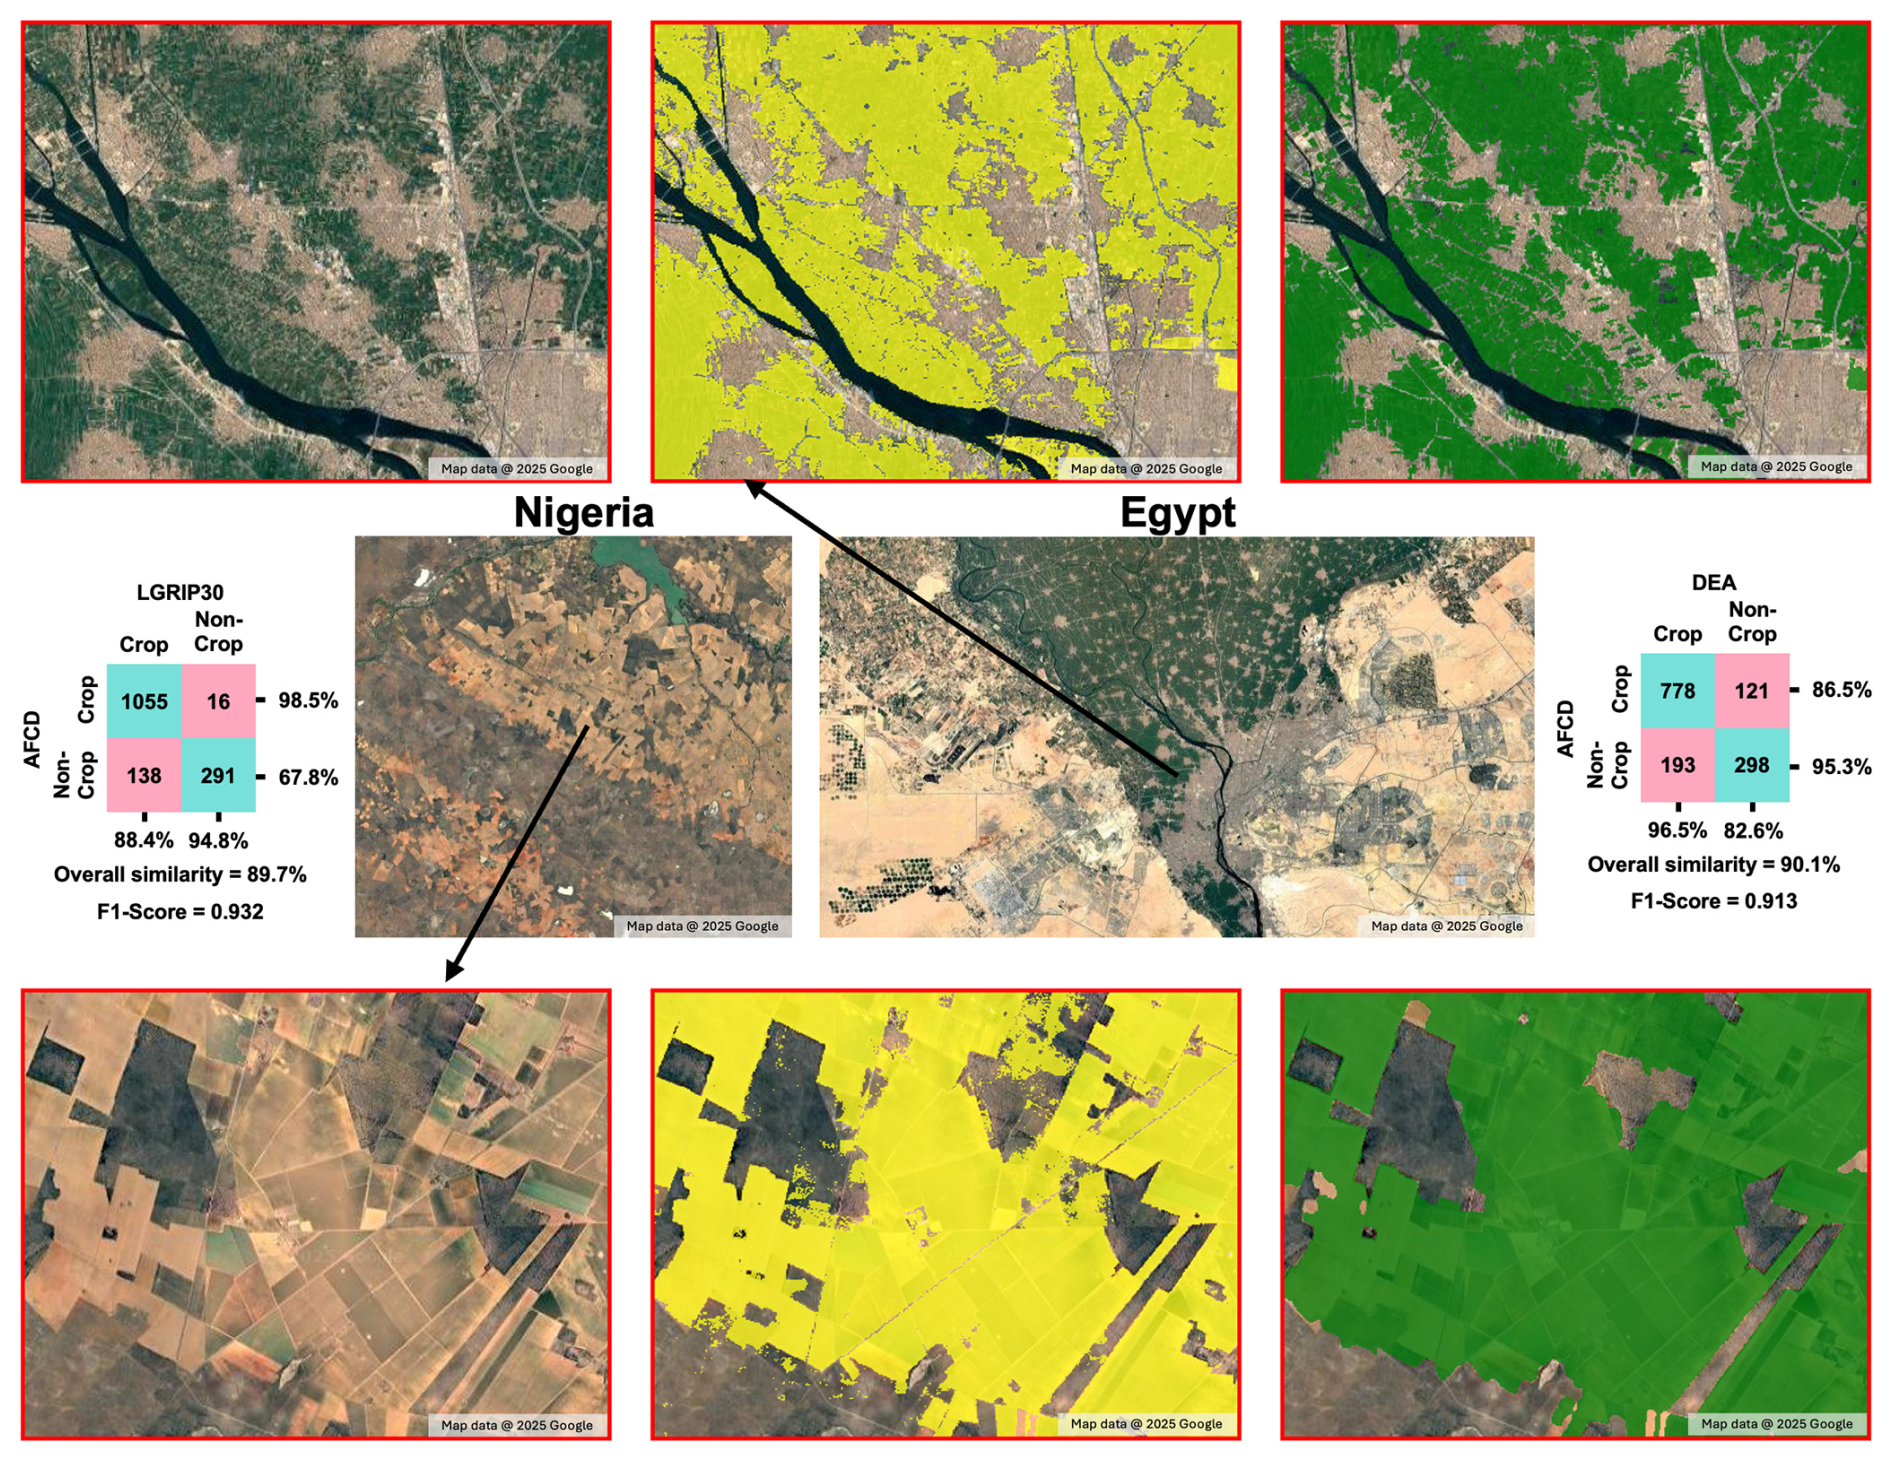
Figure 8Map-to-map comparison of cropland extent develop by AFCD and LGRIP30 in Egypt and Nigeria, and the background is the natural color composite high-resolution imagery available in Google Earth Engine (© Google Earth 2025).
5.1 Cropland dynamics in Africa
Based on the produced AFCD map, we calculated country-level net changes in cropland area between 2000 and 2022, and we plotted annual cropland area dynamics at the continental scale. Overall, Africa's total cropland grew from 1.9435×10⁸ ha in 2000 to 2.1092×10⁸ ha in 2022 (Fig. 5c), a net increase of 16.57×10⁶ ha (8.53 %). In terms of temporal changes, before 2005, the changes in arable land followed a wave-like pattern with gradual fluctuations. However, after 2006, a sharp increase was observed (as shown in Fig. 5c). As seen in Fig. 9, the overall arable land area in Africa shows a spatial increasing trend. Countries such as the Democratic Republic of the Congo, Tanzania, and Mozambique have seen increases of over 1.5×10⁶ ha, while most countries experienced an increase of less than 5×10⁵ ha (kha). For example, in the Democratic Republic of the Congo, 1.53×10⁶ ha of land has been converted into arable land since the 21st century. In contrast, a few countries, including Zimbabwe (4.61×10⁵ ha), South Sudan (8.87×10⁴ ha), and Libya (250 ha), have seen a decline in arable land area. This trend is linked to factors such as the growth of the mining industry in African nations, rural labor migration to mining areas, or regional conflicts leading to the abandonment of arable land.
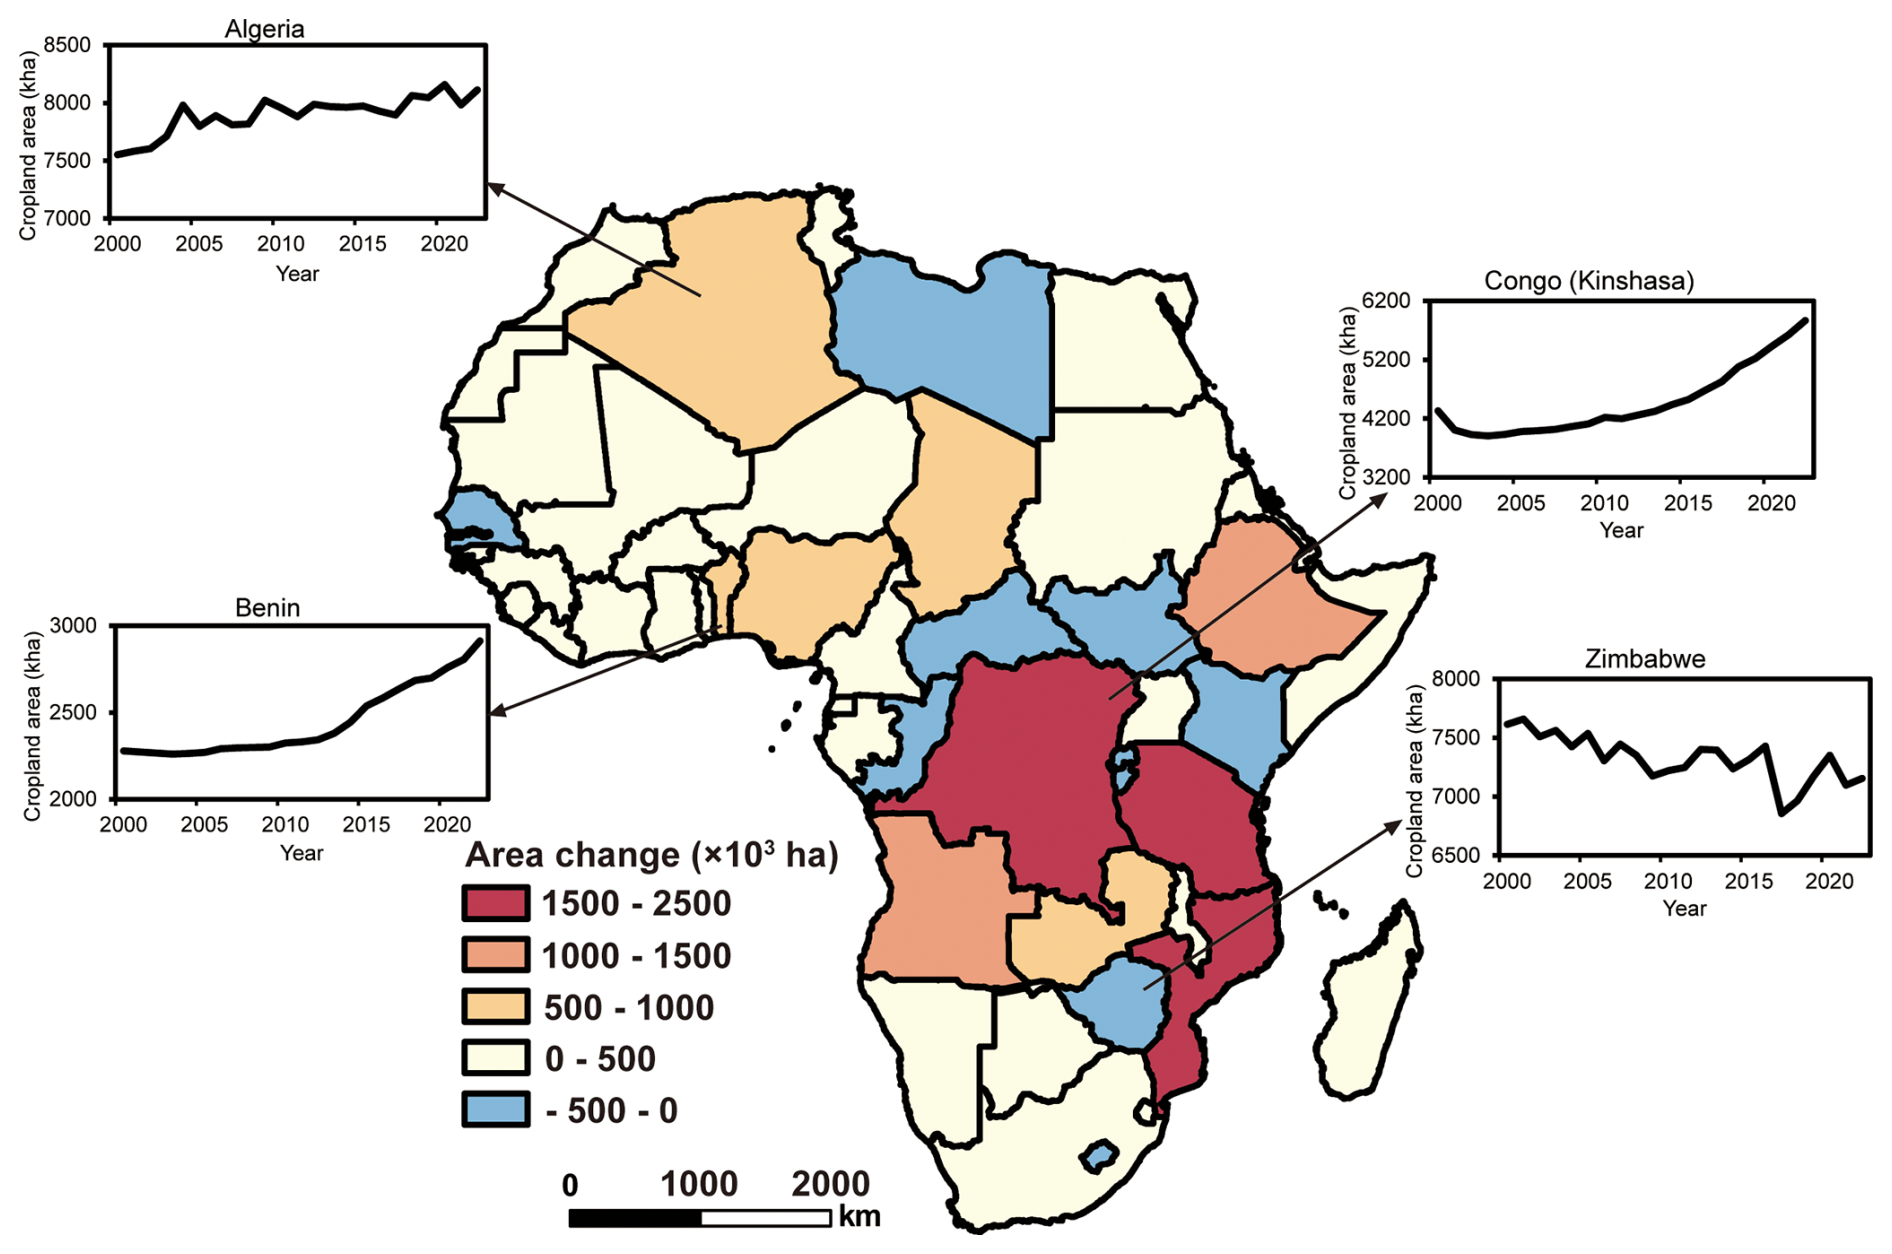
Figure 9Cropland area changes in Africa between 2000 and 2022 and country-level cropland change patterns based on AFCD data.
From 2000 to 2022, Africa's cropland area steadily increased; however, the area of abandoned cropland also rose. According to the FAO, cropland abandonment refers to formerly cultivated land that has not been used for agricultural production for a period exceeding 5 consecutive years. By 2018, abandoned cropland accounted for 11.52 % (24.70×10⁶ ha) of active cropland. In 2022, the increase in potentially abandoned cropland, projecting that abandoned cropland will constitute 13.31 % of active cropland. The abandonment of cropland is driven by a combination of natural constraints, land degradation, demographic shifts, socioeconomic factors, and institutional frameworks, which interact across different spatial and temporal scales (Zumkehr and Campbell, 2013). We quantitatively evaluated the spatiotemporal trends and primary drivers of cropland abandonment in Africa (shown as Fig. 10). Countries situated between 23 and 39° E, including Egypt, Sudan, South Sudan, Uganda, Malawi, and Zimbabwe, account for 50.1 % of the continent's abandoned cropland. Nationally, we found that most abandoned cropland remains unused for over 5 years. South Africa and Sudan exhibit the highest reclamation rates, with 10 % of active cropland regenerated from previously abandoned areas, while most other nations have rates below 5 %.
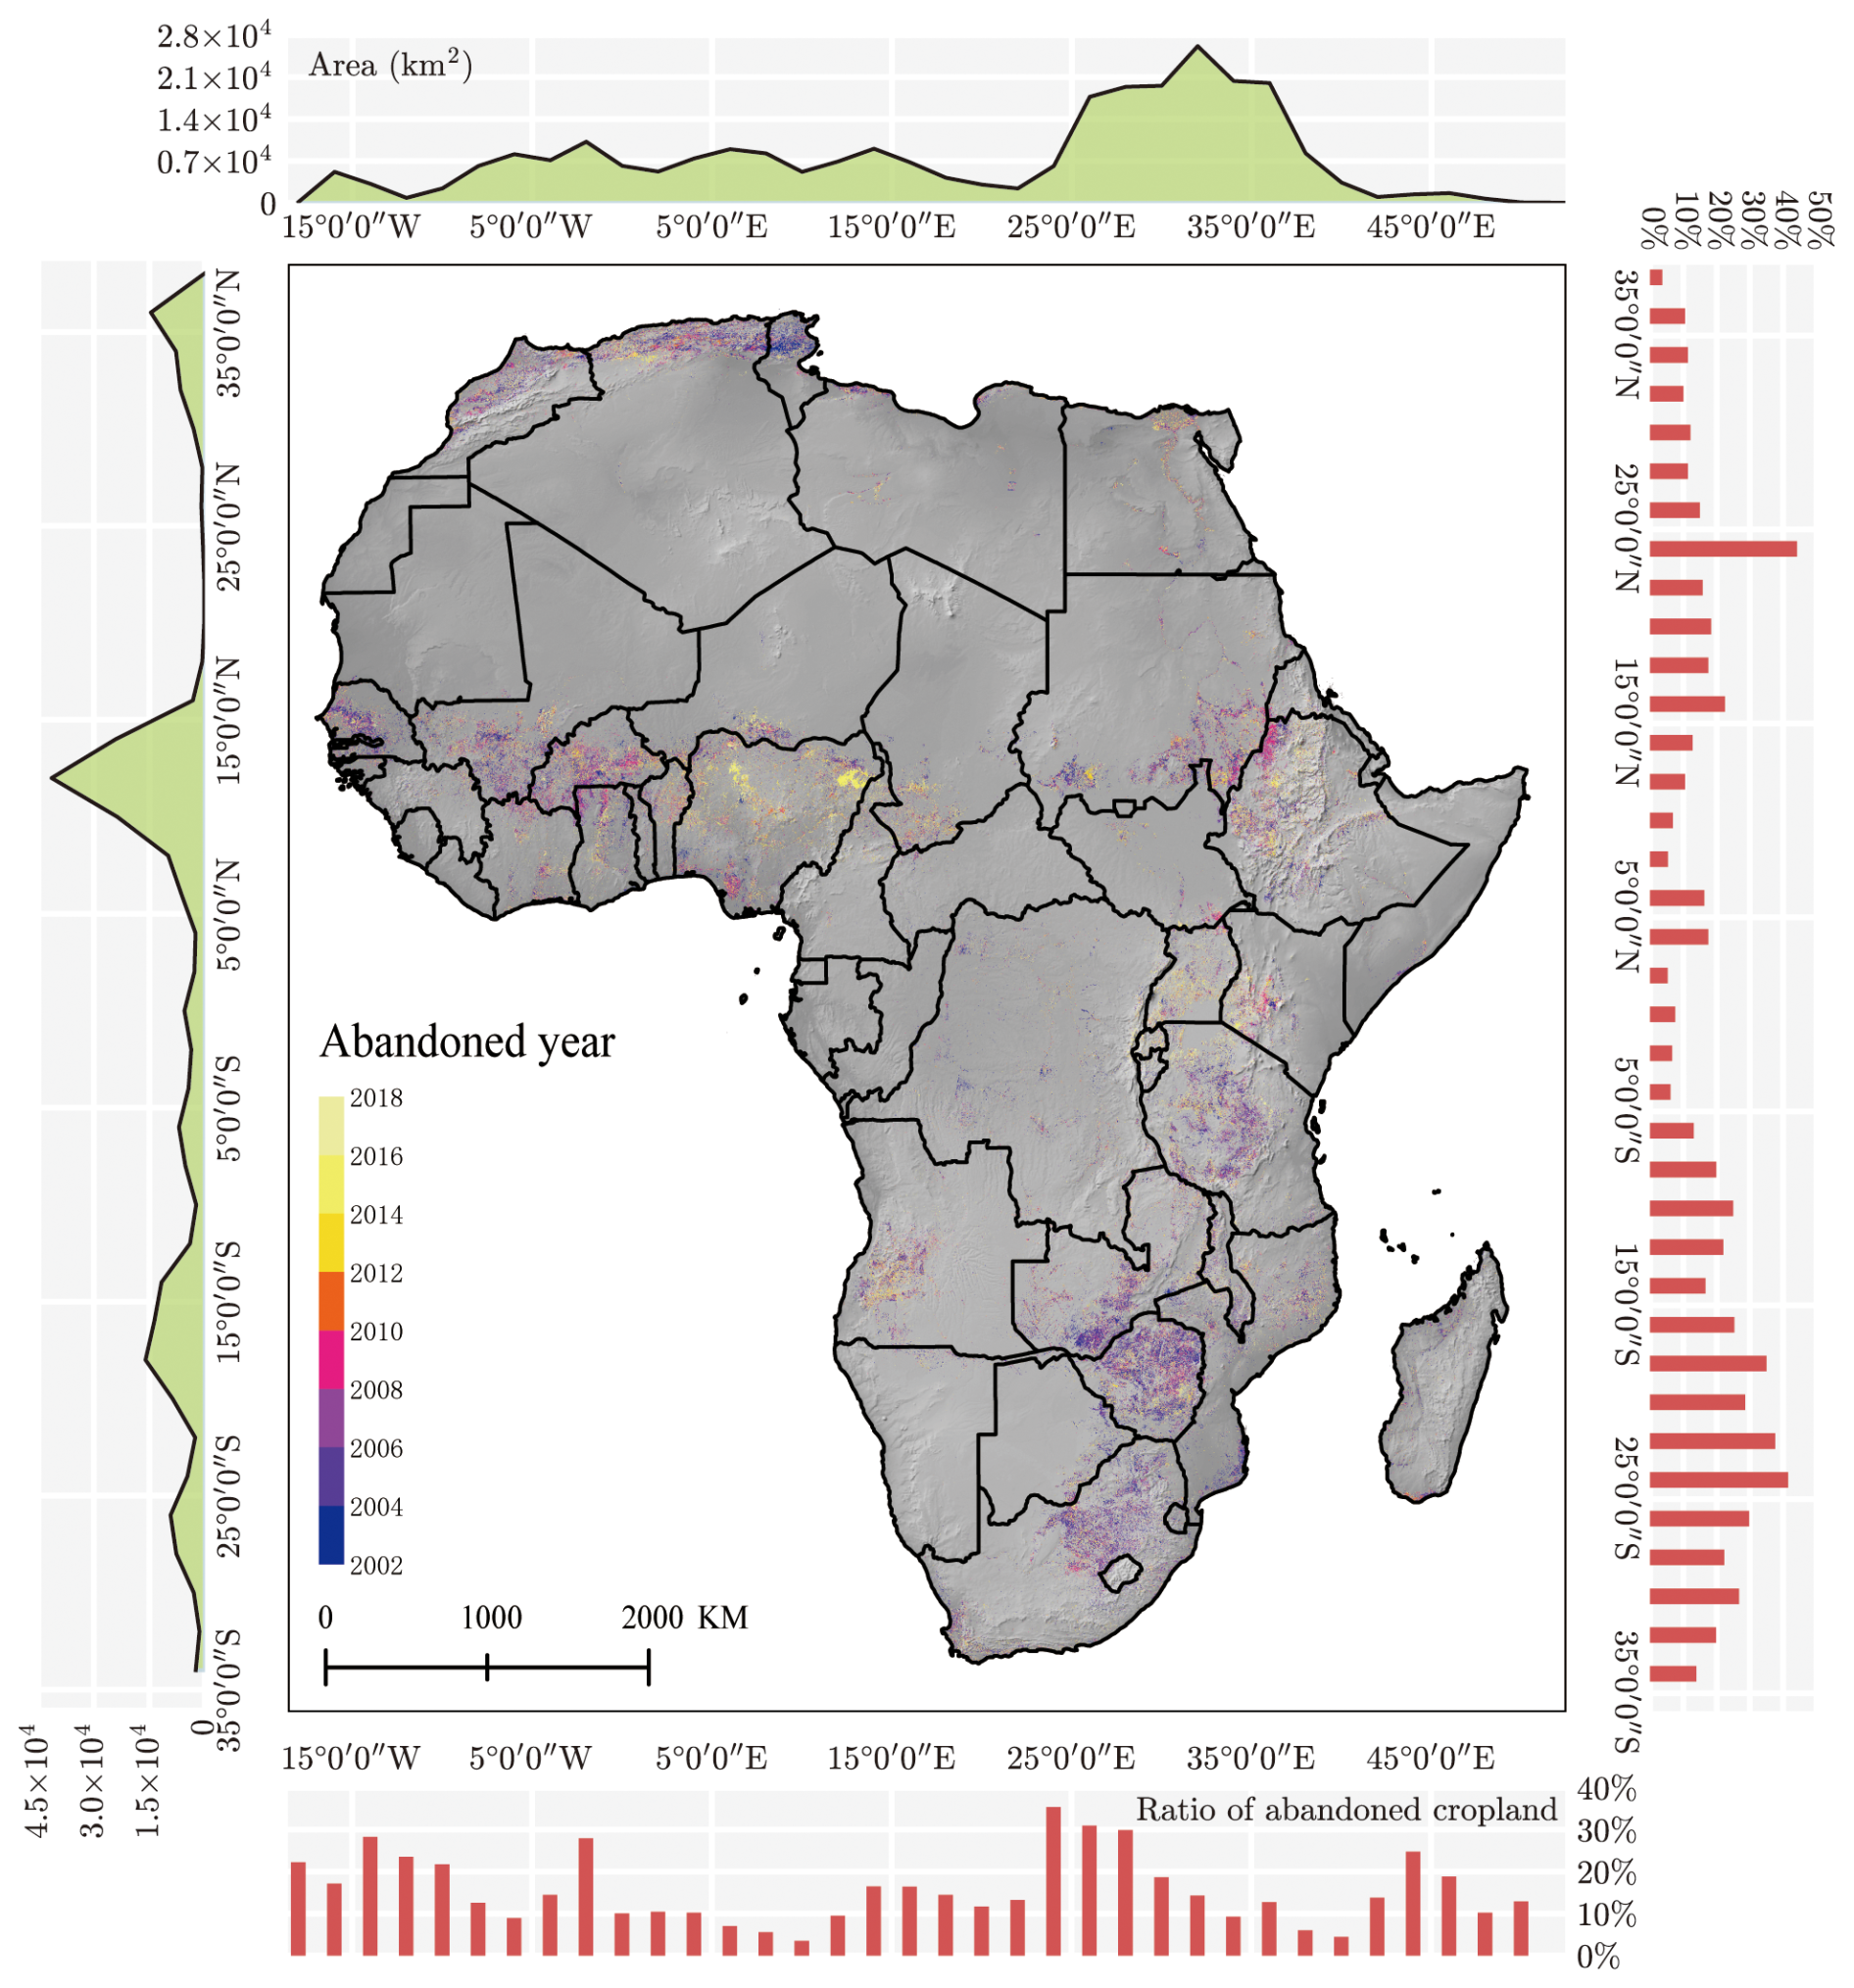
Figure 10Spatial distribution of cropland abandonment in Africa, indicating the year abandonment began. It includes a summary of abandoned cropland area and the ratio of abandoned to active cropland at 2° longitude and latitude intervals.
Cropland abandonment is influenced by a myriad of objective factors, encompassing agricultural conditions and the degree of regional development. Furthermore, economic circumstances, demographic shifts, and urban expansion also significantly contribute to this phenomenon. A national-level analysis of cropland abandonment across Africa offers a spatial perspective on the magnitude of abandonment, simultaneously reflecting the alterations in socioeconomic variables that underlie this trend. The results revealed that countries such as Burundi, the Central African Republic, and Ghana exhibit both low areas and ratios of cropland abandonment (<5 %). Conversely, nations like Algeria, Burkina Faso, Mali, and Zambia consistently maintain higher levels of cropland abandonment annually, with abandoned areas exceeding 25 % of active cropland. Furthermore, South Africa, Nigeria, Zimbabwe, and Sudan demonstrate elevated abandonment levels, notably with Nigeria experiencing significant abandonment around 2015.
Cropland, a heavily modified landscape within the wildland–urban interface (WUI), is a critical source of carbon emissions due to agricultural biomass burning, which substantially influences climate change (Mallet et al., 2024). In Africa, rainfed cropland predominates over irrigated cropland. As a result, farming activities are concentrated in the rainy season when water resources are abundant. During the dry season, arid conditions and natural vegetation growth create favorable conditions for wildfires driven by meteorological and fuel moisture dynamics. Studies indicate a global rise in wildfire risk, with Africa's WUI being the most affected (Chen et al., 2024). However, wildfire detection using MODIS sensors underestimates burned areas smaller than 100 ha by over 200 % due to limited spatial resolution (Ramo et al., 2021). Agricultural fire management, commonly used by African farmers to clear crop residues and reduce wildfire risk during fallow periods (Laris et al., 2023; Ramo et al., 2021), is often absent on abandoned cropland, significantly heightening wildfire risks. This study's long-term mapping of abandoned cropland in Africa offers a critical foundation for future research on fire management and monitoring wildfire risks in these areas.
Finally, cropland extent mapping in Africa is particularly challenging due to the complex crop-planting structures in the region and the dynamic changes driven by climatic, environmental, and socioeconomic factors. The long-term cropland data provided in this study is essential for understanding the interannual variation of cropland in Africa and its relationship to environmental, climatic, land use, and policy influences.
5.2 The advantages of the AFCD map
This study presents an algorithm developed using Landsat time series data (2000–2022) implemented in GEE with random forest and CCD algorithms, producing a 30 m resolution cropland extent map for Africa (Fig. 5). By integrating existing LUCC products with the CCD algorithm, we developed a consistent cropland map for Africa. This approach minimizes the impact of seasonal false changes, ensuring stable and continuous identification of both active and abandoned croplands. Our method achieved an overall classification accuracy of 86 % based on an independent validation dataset. Over the 22-year period, Africa experienced a net cropland expansion of 16.57×10⁶ ha, representing nearly a 10 % increase relative to the baseline levels at the start of the millennium. By comparing our product with other global and regional LUCC or cropland extent (CE) products, we gain valuable insights into its strengths and limitations.
Existing LUCC products, such as the ESRI 10 m Annual Land Cover, GLAD's global cropland maps, and GlobeLand30, provide useful information; however, the AFCD product distinguishes itself through longer temporal coverage (2000–2022) and higher temporal frequency with Landsat-based annual observations at 30 m resolution. This enables a more extended temporal observation of agricultural dynamics starting from the early 2000s. For example, compared to GLAD's quadrennial cropland extent product – aligned with FAO's 5-year abandoned land definition – the AFCD product offers enhanced temporal resolution. This improvement significantly boosts detection capabilities for long-term land abandonment patterns. Additionally, the AFCD map reduces misclassifications of roads and buildings near cropland, a common issue in products like LGRIP.
When compared to other 30 m resolution products such as GLAD, GCEP, and LGRIP, the AFCD product shows good consistency in terms of total cropland area. However, it tends to slightly underestimate cropland areas when compared to higher-resolution products such as the 10 m resolution DEA or the 300 m resolution ESA CCI-LC. As shown in Fig. 8, while AFCD preserves much of the object-level detail, the 30 m resolution results in many mixed pixels, leading to small cropland areas being overlooked, especially when surrounded by vegetation.
A significant challenge in large-scale classification tasks is acquiring high-quality reference training and testing data. In this study, we generated a large number of sample data points and performed training and classification based on a grid approach. However, our training data relied on sample points derived from the limited overlap of different products. Cropland in sub-Saharan Africa is often fragmented, forming mosaics with savannas, woodlands, and grasslands. As a result, various products may identify the same pixel containing cropland in different ways, leading to inconsistencies. Regions with low classification consistency across products are especially vulnerable to misclassification. Consequently, we included these challenging samples with limited recognition in our training dataset. While this introduces some uncertainty, it is a necessary trade-off to minimize the omission of cropland as much as possible.
The AFCD product facilitates (1) continuous temporal tracking of non-linear cropland system evolution, (2) precise identification of abandonment onset years and associated trigger events, and (3) robust attribution analysis of climate and anthropogenic impacts on agricultural landscapes. Serving as both a historical record of 21st-century cropland dynamics in Africa and a foundational dataset for future abandonment studies, this product contributes significantly to continental food security initiatives, hunger mitigation strategies, and sustainable land management efforts.
Cropland mapping is a complex and dynamic process marked by gradual or abrupt changes in land cover due to human activities. Previous studies have employed soft classification approaches alongside the LandTrendr algorithm to track cropland change trajectories (Dara et al., 2018; Xie et al., 2024). However, these methods rely heavily on the accuracy of cropland probability distribution maps, which can be affected by seasonal variations in image quality and difficulties in determining classification thresholds. Additionally, most research has focused on developed regions like Europe, China, and the United States, leaving cropland change mapping in Africa, a region with diverse climates and complex land cover, a major challenge. The AFCD map provides more reliable information for cross-regional and cross-national comparisons and assessments. Such granular data are essential for understanding cropland transitions and guiding agricultural management practices in Africa.
5.3 The limitations and prospects of the AFCD map
Our study acknowledges several limitations in terms of methodology and data. First, while we track cropland dynamics annually, we do not account for intra-annual variations in crops, such as differences in crop calendars or planting intensities. As a result, our approach may not effectively capture perennial crops or multi-cropping systems. Second, we map the general extent of cropland without distinguishing between specific types, which is crucial when assessing crop yields or cropland's responses to climate and anthropogenic factors. Future research will likely benefit from incorporating advanced techniques for high-resolution crop type mapping. Third, while AFCD performs above the average accuracy level for similar products in Africa, several factors contribute to its limitations. In terms of temporal accuracy, AFCD shows relatively lower precision in the early 21st century, mainly due to limited data availability for creating consensus label samples in the early 2000s, but also due to uneven coverage of Landsat 5 data. Spatially, mapping accuracy varies by region, with relatively higher errors in countries near the Gulf of Guinea and in east Africa. This is due to local climate conditions and fragmented agricultural landscapes, which have long presented challenges for accurate cropland identification. Recent studies have highlighted the significant discrepancies in cropland mapping across Africa (Kerner et al., 2024; Tubiello et al., 2023a). Additionally, the quality of Landsat data (e.g., unmasked cloud cover) and the sensitivity of the Continuous Change Detection and Classification (CCDC) parameters have further impacted the mapping results. To improve cropland classification accuracy in these regions, future work should focus on comprehensive surveys and tailored strategies. Finally, it is important to note that the datasets used to generate consensus crop/non-crop samples define cropland differently, which may introduce noise and errors in our results. For instance, GLAD includes perennial herbaceous plants, while GFSAD may encompass plantation lands such as those cultivated with fruits, coffee, and tea. By relying on consistency across products, our consensus labeling process partially excludes these areas. Lastly, although we assume that land cover types should not change between breakpoints identified by CCDC, significant breaks caused by human activities can alter the classification of cropland's duration of use. This can lead to overestimation or underestimation of cropland areas in certain regions in different years within the AFCD dataset.
The developed AFCD map dataset can be freely accessed via https://doi.org/10.5281/zenodo.14920706 (Lou et al., 2025). To help users to navigate this dataset, it is saved as 23 independent files. Each file is named “AFCD_YYYY.tif”, where YYYY is the year of cropland map. The AFCD map contains 23 maps for time steps from 2000 to 2022 updated annually. In each TIFF file, a value of 1 indicates cropland area.
Cropland dynamics serve as a fundamental driver of human modification and adaptation to natural environments while also constituting one of the ultimate objectives in Earth observation research. Conducting large-scale and long-term cropland monitoring across Africa remains a significant challenge, particularly given the continent's complex agro-ecological conditions and persistent data limitations. This study generates an annual map of cropland extent at a 30 m resolution for Africa (namely AFCD) utilizing Landsat-5, Landsat-7, and Landsat-8 data spanning from 2002 to 2022. It highlights the efficacy of mapping croplands over extensive areas by employing high-resolution satellite data processed through pixel-based RF algorithms and CCD algorithms on GEE. The research introduced a novel methodology for sample generation, incorporating crop and non-crop samples from previous LUCC and cropland extent products, alongside RF and CCD algorithms, to produce annual maps of cropland extent in Africa. An independent accuracy assessment revealed an overall map accuracy of 0.86. By 2022, Africa's cropland expanded from with a net increase of 8.53 %. The high spatial and temporal resolution of the maps enabled detailed capture of cropland change across Africa, helping to uncover the impact of cropland on the climate, improve food security, and develop sustainable land management practices.
DP and ZL conceived the research idea. ZL designed the study, created the dataset, carried out the analysis, and wrote the first draft of the manuscript under the supervision of other authors. All authors participated in the review and editing of the manuscript.
The contact author has declared that none of the authors has any competing interests.
Publisher's note: Copernicus Publications remains neutral with regard to jurisdictional claims made in the text, published maps, institutional affiliations, or any other geographical representation in this paper. While Copernicus Publications makes every effort to include appropriate place names, the final responsibility lies with the authors.
The authors express their great gratitude to the following organizations for their contributions to this research: USGS for providing free access to Landsat imagery and GFSAD data; University of Maryland for providing GLAD data, the Aerospace Information Research Institute for providing GLC_FCS30D; ESA for providing WorldCover, Dynamic World and CCI Land cover data; Esri for providing 10 m annual land cover data (2017–2023); and Geo-Wiki for sharing the third-party validation samples.
This study was supported by the National Key R&D Program of China (grant no. 2023YFE0207900).
This paper was edited by Kaiguang Zhao and reviewed by two anonymous referees.
Adolph, B., Jellason, N. P., Kwenye, J. M., Davies, J., Dray, A. G., Waeber, P. O., Jeary, K., and Franks, P.: Exploring farmers' decisions on agricultural intensification and cropland expansion in Ethiopia, Ghana, and Zambia through serious gaming, Land, 12, 556, https://doi.org/10.3390/land12030556, 2023.
Ahlqvist, O.: In Search of Classification that Supports the Dynamics of Science: The FAO Land Cover Classification System and Proposed Modifications, Environ. Plann. B, 35, 169–186, https://doi.org/10.1068/b3344, 2008.
Belgiu, M.: Random forest in remote sensing: a review of applications and future directions, ISPRS J. Photogramm., 114, 24–31, https://doi.org/10.1016/j.isprsjprs.2016.01.011, 2016.
Brown, C. F., Brumby, S. P., Guzder-Williams, B., Birch, T., Hyde, S. B., Mazzariello, J., Czerwinski, W., Pasquarella, V. J., Haertel, R., Ilyushchenko, S., Schwehr, K., Weisse, M., Stolle, F., Hanson, C., Guinan, O., Moore, R., and Tait, A. M.: Dynamic World, Near real-time global 10 m land use land cover mapping, Sci. Data, 9, 251, https://doi.org/10.1038/s41597-022-01307-4, 2022.
Burton, C., Yuan, F., Ee-Faye, C., Halabisky, M., Ongo, D., Mar, F., Addabor, V., Mamane, B., and Adimou, S.: Co-production of a 10 m cropland extent map for continental africa using sentinel-2, cloud computing, and the open-data-cube, Authorea, https://doi.org/10.1002/essoar.10510081.1, 2022.
Cassidy, E. S., West, P. C., Gerber, J. S., and Foley, J. A.: Redefining agricultural yields: from tonnes to people nourished per hectare, Environ. Res. Lett., 8, 34015, https://doi.org/10.1088/1748-9326/8/3/034015, 2013.
Chamberlin, J., Jayne, T. S., and Headey, D.: Scarcity amidst abundance? Reassessing the potential for cropland expansion in Africa, Food Policy, 48, 51–65, https://doi.org/10.1016/j.foodpol.2014.05.002, 2014.
Chen, B., Wu, S., Jin, Y., Song, Y., Wu, C., Venevsky, S., Xu, B., Webster, C., and Gong, P.: Wildfire risk for global wildland–urban interface areas, Nat. Sustain., 7, 474–484, https://doi.org/10.1038/s41893-024-01291-0, 2024.
Chen, S., Olofsson, P., Saphangthong, T., and Woodcock, C. E.: Monitoring shifting cultivation in Laos with landsat time series, Remote Sens. Environ., 288, 113507, https://doi.org/10.1016/j.rse.2023.113507, 2023.
Crawford, C. L., Wiebe, R. A., Yin, H., Radeloff, V. C., and Wilcove, D. S.: Biodiversity consequences of cropland abandonment, Nat. Sustain., 7, 1596–1607, https://doi.org/10.1038/s41893-024-01452-1, 2024.
Cui, Y., Dong, J., Zhang, C., Yang, J., Chen, N., Guo, P., Di, Y., Chen, M., Li, A., and Liu, R.: Validation and refinement of cropland map in southwestern china by harnessing ten contemporary datasets, Sci. Data, 11, 671, https://doi.org/10.1038/s41597-024-03508-5, 2024.
Dara, A., Baumann, M., Kuemmerle, T., Pflugmacher, D., Rabe, A., Griffiths, P., Hölzel, N., Kamp, J., Freitag, M., and Hostert, P.: Mapping the timing of cropland abandonment and recultivation in northern Kazakhstan using annual landsat time series, Remote Sens. Environ., 213, 49–60, https://doi.org/10.1016/j.rse.2018.05.005, 2018.
Debonne, N., Van Vliet, J., Ramkat, R., Snelder, D., and Verburg, P.: Farm scale as a driver of agricultural development in the kenyan rift valley, Agr. Syst., 186, 102943, https://doi.org/10.1016/j.agsy.2020.102943, 2021.
Decuyper, M., Chávez, R. O., Lohbeck, M., Lastra, J. A., Tsendbazar, N., Hackländer, J., Herold, M., and Vågen, T.-G.: Continuous monitoring of forest change dynamics with satellite time series, Remote Sens. Environ., 269, 112829–112841, https://doi.org/10.1016/j.rse.2021.112829, 2022.
Duan, J., Ren, C., Wang, S., Zhang, X., Reis, S., Xu, J., and Gu, B.: Consolidation of agricultural land can contribute to agricultural sustainability in China, Nat. Food, 2, 1014–1022, https://doi.org/10.1038/s43016-021-00415-5, 2021.
ESA: Land Cover CCI Product User Guide Version 2. Tech. Rep., http://maps.elie.ucl.ac.be/CCI/viewer/download/ESACCI-LC-Ph2-PUGv2_2.0.pdf (last access: 31 July 2025), 2017.
Fader, M., Gerten, D., Krause, M., Lucht, W., and Cramer, W.: Spatial decoupling of agricultural production and consumption: quantifying dependences of countries on food imports due to domestic land and water constraints, Environ. Res. Lett., 8, 14046, https://doi.org/10.1088/1748-9326/8/1/014046, 2013.
FAO: The State of Agricultural Commodity Markets 2020: Agricultural markets and sustainable development – Global value chains, smallholder farmers and digital innovations. Rome, Italy, https://doi.org/10.4060/cb0665en, 2020.
FAO, IFAD, UNICEF, WFP, and WHO: The State of Food Security and Nutrition in the World 2024 – Financing to end hunger, food insecurity and malnutrition in all its forms, FAO, IFAD, UNICEF, WFP, WHO, Rome, Italy, https://doi.org/10.4060/cd1254en, 2024.
Friedl, M. and Sulla-Menashe, D.: MODIS/Terra+Aqua Land Cover Type Yearly L3 Global 500 m SIN Grid V061, NASA Land Processes Distributed Active Archive Center [data set], https://doi.org/10.5067/MODIS/MCD12Q1.061, 2025.
Fritz, S., See, L., McCallum, I., You, L., Bun, A., Moltchanova, E., Duerauer, M., Albrecht, F., Schill, C., Perger, C., Havlik, P., Mosnier, A., Thornton, P., Wood-Sichra, U., Herrero, M., Becker-Reshef, I., Justice, C., Hansen, M., Gong, P., Abdel Aziz, S., Cipriani, A., Cumani, R., Cecchi, G., Conchedda, G., Ferreira, S., Gomez, A., Haffani, M., Kayitakire, F., Malanding, J., Mueller, R., Newby, T., Nonguierma, A., Olusegun, A., Ortner, S., Rajak, D. R., Rocha, J., Schepaschenko, D., Schepaschenko, M., Terekhov, A., Tiangwa, A., Vancutsem, C., Vintrou, E., Wenbin, W., van der Velde, M., Dunwoody, A., Kraxner, F., and Obersteiner, M.: Mapping global cropland and field size, Glob. Change Biol., 21, 1980–1992, https://doi.org/10.1111/gcb.12838, 2015.
Giller, K. E., Delaune, T., Silva, J. V., van Wijk, M., Hammond, J., Descheemaeker, K., van de Ven, G., Schut, A. G. T., Taulya, G., Chikowo, R., and Andersson, J. A.: Small farms and development in sub-saharan africa: farming for food, for income or for lack of better options?, Food Secur., 13, 1431–1454, https://doi.org/10.1007/s12571-021-01209-0, 2021.
Hansen, M. C., Potapov, P. V., Moore, R., Hancher, M., Turubanova, S. A., Tyukavina, A., Thau, D., Stehman, S. V., Goetz, S. J., Loveland, T. R., Kommareddy, A., Egorov, A., Chini, L., Justice, C. O., and Townshend, J. R. G.: High-Resolution Global Maps of 21st-Century Forest Cover Change, Science, 342, 850–853, https://doi.org/10.1126/science.1244693, 2013.
Herold, M., Latham, J. S., Di Gregorio, A., and Schmullius, C. C.: Evolving standards in land cover characterization, J. Land Use Sci., 1, 157–168, https://doi.org/10.1080/17474230601079316, 2006.
Hu, J., Zhang, B., Peng, D., Huang, J., Zhang, W., Zhao, B., Li, Y., Cheng, E., Lou, Z., Liu, S., Yang, S., Tan, Y., and Lv, Y.: Mapping 10 m harvested area in the major winter wheat-producing regions of China from 2018 to 2022, Sci. Data, 11, 1038, https://doi.org/10.1038/s41597-024-03867-z, 2024.
Ibrahim, R. L., Al-Mulali, U., Ajide, K. B., Mohammed, A., and Al-Faryan, M. A. S.: The implications of food security on sustainability: do trade facilitation, population growth, and institutional quality make or mar the target for SSA?, Sustainability-Basel, 15, 2089, https://doi.org/10.3390/su15032089, 2023.
Jayne, T. S., Chamberlin, J., and Headey, D. D.: Land pressures, the evolution of farming systems, and development strategies in Africa: A synthesis, Food Policy, 48, 1–17, https://doi.org/10.1016/j.foodpol.2014.05.014, 2014.
Jin, H., Stehman, S. V., and Mountrakis, G.: Assessing the impact of training sample selection on accuracy of an urban classification: a case study in Denver, Colorado, Int. J. Remote Sens., 35, 2067–2081, https://doi.org/10.1080/01431161.2014.885152, 2014.
Karra, K., Kontgis, C., Statman-Weil, Z., Mazzariello, J. C., Mathis, M., and Brumby, S. P.: Global land use/land cover with Sentinel 2 and deep learning, 2021 IEEE International Geoscience and Remote Sensing Symposium IGARSS, Brussels, Belgium, 2021m 4704–4707, https://doi.org/10.1109/IGARSS47720.2021.9553499, 2021.
Kehoe, L., Romero-Muñoz, A., Polaina, E., Estes, L., Kreft, H., and Kuemmerle, T.: Biodiversity at risk under future cropland expansion and intensification, Nat. Ecol. Evol., 1, 1129–1135, https://doi.org/10.1038/s41559-017-0234-3, 2017.
Kerner, H., Nakalembe, C., Yang, A., Zvonkov, I., McWeeny, R., Tseng, G., and Becker-Reshef, I.: How accurate are existing land cover maps for agriculture in sub-saharan africa?, Sci. Data, 11, 486, https://doi.org/10.1038/s41597-024-03306-z, 2024a.
Kerner, H., Nakalembe, C., Yang, A., Zvonkov, I., McWeeny, R., Tseng, G., and Becker-Reshef, I.: Comparison of cropland maps derived from land cover maps in sub-saharan africa, Zenodo [data set], https://doi.org/10.5281/zenodo.10694610, 2024b.
Lana-Renault, N., Romero, E. N., Cammeraat, E., and Llorente, J. Á.: Impact of farmland abandonment on water resources and soil conservation, MDPI, https://doi.org/10.3390/books978-3-03936-612-5, 2020.
Laris, P., Koné, M., Dembélé, F., Rodrigue, C. M., Yang, L., Jacobs, R., Laris, Q., and Camara, F.: The Pyrogeography of Methane Emissions from Seasonal Mosaic Burning Regimes in a West African Landscape, Fire, 6, 52, https://doi.org/10.3390/fire6020052, 2023.
Laso Bayas, J. C., Lesiv, M., Waldner, F., Schucknecht, A., Duerauer, M., See, L., Fritz, S., Fraisl, D., Moorthy, I., McCallum, I., Perger, C., Danylo, O., Defourny, P., Gallego, J., Gilliams, S., Akhtar, I. u. H., Baishya, S. J., Baruah, M., Bungnamei, K., Campos, A., Changkakati, T., Cipriani, A., Das, K., Das, K., Das, I., Davis, K. F., Hazarika, P., Johnson, B. A., Malek, Z., Molinari, M. E., Panging, K., Pawe, C. K., Pérez-Hoyos, A., Sahariah, P. K., Sahariah, D., Saikia, A., Saikia, M., Schlesinger, P., Seidacaru, E., Singha, K., and Wilson, J. W.: A global reference database of crowdsourced cropland data collected using the geo-wiki platform, Sci. Data, 4, 170136, https://doi.org/10.1038/sdata.2017.136, 2017.
Liu, L., Zhang, X., and Zhao, T.: GLC_FCS30D: the first global 30-m land-cover dynamic monitoring product with fine classification system from 1985 to 2022, Zenodo [data set], https://doi.org/10.5281/zenodo.8239305, 2023.
Lou, Z., Peng, D., Shi, Z., Wang, Y., Zhang, Y., Yan, X., Chen, Z., Ye, S., Yu, L., Hu, J., Lv, Y., Peng, H., Zhang, Y., and Zhang, B.: AFCD: a 30 m resolution annual cropland extent dataset of Africa in recent decades of the 21st century, Zenodo [data set], https://doi.org/10.5281/zenodo.14920706, 2025.
Mallet, M., Voldoire, A., Solmon, F., Nabat, P., Drugé, T., and Roehrig, R.: Impact of biomass burning aerosols (BBA) on the tropical African climate in an ocean–atmosphere–aerosol coupled climate model, Atmos. Chem. Phys., 24, 12509–12535, https://doi.org/10.5194/acp-24-12509-2024, 2024.
Mano, Y., Takahashi, K., and Otsuka, K.: Mechanization in land preparation and agricultural intensification: the case of rice farming in the cote d'ivoire, Agr. Econ., 51, 899–908, https://doi.org/10.1111/agec.12599, 2020.
Nabil, M., Zhang, M., Wu, B., Bofana, J., and Elnashar, A.: Constructing a 30 m African Cropland Layer for 2016 by Integrating Multiple Remote sensing, crowdsourced, and Auxiliary Datasets, Big Earth Data, 6, 54–76, https://doi.org/10.1080/20964471.2021.1914400, 2022.
Nilsson, P.: The role of land use consolidation in improving crop yields among farm households in Rwanda, J. Dev. Stud., 55, 1726–1740, https://doi.org/10.1080/00220388.2018.1520217, 2019.
Pereira, P., Brevik, E., and Trevisani, S.: Mapping the environment, Sci. Total Environ., 610–611, 17–23, https://doi.org/10.1016/j.scitotenv.2017.08.001, 2018.
Phalke, A. R., Özdoğan, M., Thenkabail, P. S., Erickson, T., Gorelick, N., Yadav, K., and Congalton, R. G.: Mapping croplands of Europe, middle east, russia, and central asia using landsat, random forest, and google earth engine, ISPRS J. Photogramm., 167, 104–122, https://doi.org/10.1016/j.isprsjprs.2020.06.022, 2020.
Potapov, P., Turubanova, S., Hansen, M. C., Tyukavina, A., Zalles, V., Khan, A., Song, X.-P., Pickens, A., Shen, Q., and Cortez, J.: Global maps of cropland extent and change show accelerated cropland expansion in the twenty-first century, Nat. Food, 3, 19–28, https://doi.org/10.1038/s43016-021-00429-z, 2022.
Ramo, R., Roteta, E., Bistinas, I., van Wees, D., Bastarrika, A., Chuvieco, E., and van der Werf, G. R.: African burned area and fire carbon emissions are strongly impacted by small fires undetected by coarse resolution satellite data, P. Natl. Acad. Sci. USA, 118, e2011160118, https://doi.org/10.1073/pnas.2011160118, 2021.
Roy, D. P., Kovalskyy, V., Zhang, H. K., Vermote, E. F., Yan, L., Kumar, S. S., and Egorov, A.: Characterization of landsat-7 to landsat-8 reflective wavelength and normalized difference vegetation index continuity, Remote Sens. Environ., 185, 57–70, https://doi.org/10.1016/j.rse.2015.12.024, 2016.
Schneider, J. M., Delzeit, R., Neumann, C., Heimann, T., Seppelt, R., Schuenemann, F., Söder, M., Mauser, W., and Zabel, F.: Effects of profit-driven cropland expansion and conservation policies, Nat. Sustain., 7, 1335–1347, https://doi.org/10.1038/s41893-024-01410-x, 2024.
Searchinger, T. D., Estes, L., Thornton, P. K., Beringer, T., Notenbaert, A., Rubenstein, D., Heimlich, R., Licker, R., and Herrero, M.: High carbon and biodiversity costs from converting Africa's wet savannahs to cropland, Nat. Clim. Change, 5, 481–486, https://doi.org/10.1038/nclimate2584, 2015.
See, L.: A global reference database of crowdsourced cropland data collected using the geo-wiki platform, PANGAEA [data set], https://doi.org/10.1594/PANGAEA.873912, 2017.
Song, W., Prishchepov, A. V., and Song, W.: Mapping the spatial and temporal patterns of fallow land in mountainous regions of China, Int. J. Digit. Earth, 15, 2148–2167, https://doi.org/10.1080/17538947.2022.2148765, 2022.
Stephens, E. C., Jones, A. D., and Parsons, D.: Agricultural systems research and global food security in the 21st century: an overview and roadmap for future opportunities, Agr. Syst., 163, 1–6, https://doi.org/10.1016/j.agsy.2017.01.011, 2018.
Teluguntla, P., Thenkabail, P., Oliphant, A., Gumma, M., Aneece, I., Foley, D., and McCormick, R.: Landsat-Derived Global Rainfed and Irrigated-Cropland Product 30 m V001, NASA Land Processes Distributed Active Archive Center [data set], https://doi.org/10.5067/COMMUNITY/LGRIP/LGRIP30.001, 2023.
Thenkabail, P. S., Teluguntla, P. G., Xiong, J., Oliphant, A., Congalton, R. G., Ozdogan, M., Gumma, M. K., Tilton, J. C., Giri, C., Milesi, C., Phalke, A., Massey, R., Yadav, K., Sankey, T., Zhong, Y., Aneece, I., and Foley, D.: Global cropland-extent product at 30 m resolution (GCEP30) derived from landsat satellite time-series data for the year 2015 using multiple machine-learning algorithms on Google earth engine cloud, Professional Paper, U. S. Geological Survey, https://doi.org/10.3133/pp1868, 2021.
Traba, J. and Morales, M. B.: The decline of farmland birds in Spain is strongly associated to the loss of fallowland, Sci. Rep.-UK, 9, 9473, https://doi.org/10.1038/s41598-019-45854-0, 2019.
Tubiello, F. N., Conchedda, G., Casse, L., Hao, P., De Santis, G., and Chen, Z.: A new cropland area database by country circa 2020, Earth Syst. Sci. Data, 15, 4997–5015, https://doi.org/10.5194/essd-15-4997-2023, 2023a.
Tubiello, F. N., Conchedda, G., Casse, L., Pengyu, H., Zhongxin, C., De Santis, G., Fritz, S., and Muchoney, D.: Measuring the world's cropland area, Nat. Food, 4, 30–32, https://doi.org/10.1038/s43016-022-00667-9, 2023b.
Van De Kerchove, R., Zanaga, D., Keersmaecker, W., Souverijns, N., Wevers, J., Brockmann, C., Grosu, A., Paccini, A., Cartus, O., and Santoro, M.: ESA WorldCover: Global land cover mapping at 10 m resolution for 2020 based on Sentinel-1 and 2 data, AGU Fall Meeting Abstracts, 2021, GC45I-0915, https://ui.adsabs.harvard.edu/abs/2021AGUFMGC45I0915V (last access: 31 July 2025), 2021.
Vermote, E.: LEDAPS surface reflectance product description, https://www.usgs.gov/media/files/landsat-4-7-collection-1-surface-reflectance-code-ledaps-product-guide (last access: 31 July 2025), 2007.
Vermote, E. F. and Kotchenova, S.: Atmospheric correction for the monitoring of land surfaces, J. Geophys. Res.-Atmos., 113, D23S90, https://doi.org/10.1029/2007JD009662, 2008.
Waldner, F., Fritz, S., Di Gregorio, A., and Defourny, P.: Mapping Priorities to Focus Cropland Mapping Activities: Fitness Assessment of Existing Global, Regional and National Cropland Maps, Remote Sens.-Basel, 7, 7959–7986, https://doi.org/10.3390/rs70607959, 2015.
Xian, G. Z., Smith, K., Wellington, D., Horton, J., Zhou, Q., Li, C., Auch, R., Brown, J. F., Zhu, Z., and Reker, R. R.: Implementation of the CCDC algorithm to produce the LCMAP Collection 1.0 annual land surface change product, Earth Syst. Sci. Data, 14, 143–162, https://doi.org/10.5194/essd-14-143-2022, 2022.
Xiao, L., Wang, G., Wang, E., Liu, S., Chang, J., Zhang, P., Zhou, H., Wei, Y., Zhang, H., Zhu, Y., Shi, Z., and Luo, Z.: Spatiotemporal co-optimization of agricultural management practices towards climate-smart crop production, Nat. Food, 1–13, https://doi.org/10.1038/s43016-023-00891-x, 2024.
Xie, Y., Spawn-Lee, S. A., Radeloff, V. C., Yin, H., Robertson, G. P., and Lark, T. J.: Cropland abandonment between 1986 and 2018 across the United States: spatiotemporal patterns and current land uses, Environ. Res. Lett., 19, 44009, https://doi.org/10.1088/1748-9326/ad2d12, 2024.
Xiong, J., Thenkabail, P. S., Gumma, M. K., Teluguntla, P., Poehnelt, J., Congalton, R. G., Yadav, K., and Thau, D.: Automated cropland mapping of continental africa using google earth engine cloud computing, ISPRS J. Photogramm., 126, 225–244, https://doi.org/10.1016/j.isprsjprs.2017.01.019, 2017a.
Xiong, J., Thenkabail, P. S., Tilton, J. C., Gumma, M. K., Teluguntla, P., Oliphant, A., Congalton, R. G., Yadav, K., and Gorelick, N.: Nominal 30 m cropland extent map of continental africa by integrating pixel-based and object-based algorithms using sentinel-2 and landsat-8 data on Google earth engine, Remote Sens.-Basel, 9, 1065, https://doi.org/10.3390/rs9101065, 2017b.
Zanaga, D., Van De Kerchove, R., De Keersmaecker, W., Souverijns, N., Brockmann, C., Quast, R., Wevers, J., Grosu, A., Paccini, A., Vergnaud, S., Cartus, O., Santoro, M., Fritz, S., Georgieva, I., Lesiv, M., Carter, S., Herold, M., Li, L., Tsendbazar, N.-E., Ramoino, F., and Arino, O.: ESA WorldCover 10 m 2020 v100 (v100), Zenodo [data set], https://doi.org/10.5281/zenodo.5571936, 2021.
Zanaga, D., Van De Kerchove, R., Daems, D., De Keersmaecker, W., Brockmann, C., Kirches, G., Wevers, J., Cartus, O., Santoro, M., Fritz, S., Lesiv, M., Herold, M., Tsendbazar, N.-E., Xu, P., Ramoino, F., and Arino, O.: ESA WorldCover 10 m 2021 v200 (v200), Zenodo [data set], https://doi.org/10.5281/zenodo.7254221, 2022.
Zhang, C., Dong, J., and Ge, Q.: Mapping 20 years of irrigated croplands in China using MODIS and statistics and existing irrigation products, Sci. Data, 9, 407, https://doi.org/10.1038/s41597-022-01522-z, 2022.
Zhang, G., Xiao, X., Dong, J., Kou, W., Jin, C., Qin, Y., Zhou, Y., Wang, J., Menarguez, M. A., and Biradar, C.: Mapping paddy rice planting areas through time series analysis of MODIS land surface temperature and vegetation index data, ISPRS J. Photogramm., 106, 157–171, https://doi.org/10.1016/j.isprsjprs.2015.05.011, 2015.
Zhang, H., Lou, Z., Peng, D., Zhang, B., Luo, W., Huang, J., Zhang, X., Yu, L., Wang, F., Huang, L., Liu, G., Gao, S., Hu, J., Yang, S., and Cheng, E.: Mapping annual 10 m soybean cropland with spatiotemporal sample migration, Sci. Data, 11, 439, https://doi.org/10.1038/s41597-024-03273-5, 2024a.
Zhang, X., Liu, L., Chen, X., Xie, S., and Gao, Y.: Fine land-cover mapping in China using landsat datacube and an operational SPECLib-based approach, Remote Sens.-Basel, 11, 1056, https://doi.org/10.3390/rs11091056, 2019.
Zhang, X., Zhao, T., Xu, H., Liu, W., Wang, J., Chen, X., and Liu, L.: GLC_FCS30D: the first global 30 m land-cover dynamics monitoring product with a fine classification system for the period from 1985 to 2022 generated using dense-time-series Landsat imagery and the continuous change-detection method, Earth Syst. Sci. Data, 16, 1353–1381, https://doi.org/10.5194/essd-16-1353-2024, 2024b.
Zhu, Z. and Woodcock, C. E.: Continuous change detection and classification of land cover using all available landsat data, Remote Sens. Environ., 144, 152–171, https://doi.org/10.1016/j.rse.2014.01.011, 2014.
Zhu, Z., Gallant, A. L., Woodcock, C. E., Pengra, B., Olofsson, P., Loveland, T. R., Jin, S., Dahal, D., Yang, L., and Auch, R. F.: Optimizing selection of training and auxiliary data for operational land cover classification for the LCMAP initiative, ISPRS J. Photogramm., 122, 206–221, https://doi.org/10.1016/j.isprsjprs.2016.11.004, 2016.
Zumkehr, A. and Campbell, J. E.: Historical U. S. cropland areas and the potential for bioenergy production on abandoned croplands, Environ. Sci. Technol., 47, 3840–3847, https://doi.org/10.1021/es3033132, 2013.
Zuo, J., Zhang, L., Xiao, J., Chen, B., Zhang, B., Hu, Y., Mamun, M. M. A. A., Wang, Y., and Li, K.: GCL_FCS30: a global coastline dataset with 30 m resolution and a fine classification system from 2010 to 2020, Sci. Data, 12, 129, https://doi.org/10.1038/s41597-025-04430-0, 2025.