the Creative Commons Attribution 4.0 License.
the Creative Commons Attribution 4.0 License.
 | 05 Aug 2025
Biologically effective daily radiant exposure for erythema appearance, previtamin D3 synthesis, and clearing of psoriatic lesions derived from erythemal broadband meters at Belsk, Poland, for the period 1976–2023
Janusz W. Krzyścin
Agnieszka Czerwińska
Bonawentura Rajewska-Więch
Janusz Jarosławski
Piotr S. Sobolewski
Izabela Pawlak
A long-term series of exposures to solar ultraviolet radiation (UVR) is required to assess the risks and benefits of radiation for different human biological processes. However, homogenisation of the amount of biologically effective solar energy (i.e. energy-weighted according to the sensitivity of the selected biological process to solar radiation) reaching the Earth's surface over long periods is challenging due to changes in measurement methods and instruments. This paper presents the world's longest homogenised time series of biologically effective daily radiant exposures (DRE) from regular monitoring with different erythemal broadband radiometers (EBRs) operated at the Central Geophysical Laboratory of the Institute of Geophysics, Polish Academy of Sciences (IG PAS), Belsk (20.79° E, 51.84° N), from 1 January 1976 to 31 December 2023. The following biological effects were considered: erythema, cutaneous synthesis of previtamin D3, and clearing of psoriatic lesions. The data for the latter two biological effects are estimated based on the proposed method of using EBR measurements to calculate other non-erythemal DRE. The following EBRs were used in the monitoring: Robertson–Berger meter (1975–1992), Solar Light model 501 (1993–1994 with #927, 1995–2013 with #2011), and Kipp & Zonen UV-AE-T #30616 from 5 August 2013 to the present. From 1976 to 2013, the homogenisation procedure consisted of comparing the measured erythemal DRE and daily maximum of UV index (UVIMAX) with the corresponding modelled values from simulations using a radiation transfer model for cloudless conditions. Between 2014 and 2023, the EBR data were compared with data from a collocated reference instrument, the Brewer Mark II #64 spectrophotometer. Such comparisons resulted in a set of multipliers that were applied to the EBR measurements. Two different versions of the homogenisation method were applied, analysing modelled and observed values for erythemal DRE and UVIMAX assuming different criteria for cloudless days. Three regression models of the erythemal data on common UVR proxy data (total column ozone, aerosol optical depth, and global clear-sky irradiance index) were used to reconstruct the UVR data from the beginning of the Belsk observations, allowing further validation of the homogenised UVR data. Linear trends calculated showed a statistically significant increase in erythemal annual and summer (June to August) radiant exposures of about 6 % per decade over the period 1976–2005. Thereafter, no trend was observed. Similar trend estimates were found for all biological effects considered. The data are made freely available via the following repository: https://doi.org/10.1594/PANGAEA.972139 (Krzyścin et al., 2024). An additional version of the re-evaluated data, together with the corresponding clear-sky and proxy data used in the UVR data reconstruction, is archived at https://doi.org/10.25171/InstGeoph_PAS_IGData_Biologically_Effective_Solar_Radiation_Belsk_1976_2023 (Krzyścin, 2024).
- Article
(4689 KB) - Full-text XML
- BibTeX
- EndNote


Molina and Rowland (1974), winners of the 1995 Nobel Prize in Chemistry, argued that human-made chlorofluorocarbons (CFCs), which were widely used in industry in the 1970s, could reach the stratospheric ozone layer where they would be destroyed by shortwave ultraviolet radiation (UVR), releasing free chlorine atoms and causing stratospheric O3 depletion in a catalytic reaction cycle. Solar radiation in the shortest part of its spectrum that reaches the Earth's surface (290–315 nm), known as UV-B, is strongly absorbed by stratospheric ozone. The discovery of the ozone hole over Antarctica (Chubachi, 1984; Farman et al., 1985) and the predicted decreasing trend in total column ozone (TCO3) in other regions have stimulated interest in establishing continuous monitoring of UV-B irradiance reaching the ground. In addition, there is growing evidence that such UVR trends can cause various adverse health effects, such as skin cancers (including the deadly melanoma), DNA damage, immunosuppression, oxidative stress, and skin ageing (Neale et al., 2023).
Solar UV-B radiation from space is attenuated as it passes through the atmosphere due to light scattering (by cloud particles, atmospheric gases, and aerosols) and absorption (by O3, NO2, SO2, and aerosols). The attenuation of light increases with its path length through the atmosphere (i.e. usually described by the air mass), so solar elevation and ground surface altitude are key parameters to consider in surface UVR modelling. Other factors forcing UVR variability at the surface that are often used as proxies for atmospheric UV-B attenuation are total column O3 (TCO3) to account for UVR absorption by ozone, the clear-sky index (CI) (i.e. a quotient of the all-sky global solar irradiance, G, at the surface and the corresponding modelled clear-sky value, G0, to account for combined cloud/aerosol scattering effects on UVR), and aerosol optical depth (AOD) in the solar UV range (parameterising UVR attenuation by aerosols). TCO3 and G have been found to be the most important factors for modelling surface UV-B radiation (Koepke et al., 2006; den Outer et al., 2010).
In the early 1970s, the broadband Robertson–Berger (RB) meter was developed to measure the biologically effective (BE) UVR that causes skin redness, also known as erythema (Berger, 1976). The spectral characteristics of RB resembled the erythemal sensitivity of human skin. RB instruments began continuous monitoring of erythemal irradiance in 1974 at eight sites in the United States (Scotto et al., 1988). During the 1970s, instruments were operated in other countries (Austria, Australia, Germany, Poland, Sweden, Switzerland) (WMO, 1977). At the beginning of this global network, RB meters were calibrated using a travelling standard meter provided by the Photobiology Center at Philadelphia University. After a few years, at some stations, including the Institute of Geophysics, Polish Academy of Sciences (IG PAS) station at Belsk (51.84° N, 20.78° E), this calibration method was replaced by comparisons with values modelled by a radiative transfer model. The Dave–Halpern model (Dave and Halpern, 1976) was used to estimate erythemally weighted irradiance for cloudless sky conditions to calibrate the Belsk data (Słomka and Słomka, 1985). Serious drawbacks of RB measurements were that their results were reported in relative units (counts), temperature sensitivity, a lot of manual work in data preparation, sometimes rapid ageing, and difficulties in accurately converting counts into the so-called sunburn unit (the minimum erythemal radiation exposure that causes redness of the skin). These problems were significantly reduced in a new version of the RB meter, a prototype of the current erythemal broadband radiometer (EBR), developed in the late 1980s as a result of collaboration between IG PAS and the Institute of Medical Physics of the University of Innsbruck (Blumthaler et al., 1989; Słomka and Słomka, 1993). Further prototype work at Solar Light (SL) Co. in Philadelphia resulted in the production of the commercial SL Biometer model 501A, which replaced the RB meter.
Other EBR versions were introduced in the 1990s, including those from Yankee Environmental Systems (Turner Falls, USA) and Kipp & Zonen (KZ) Co. (Delf, Netherlands). However, there was a need to standardise the correction procedure for the broadband UVR meters as it became apparent that the calibration provided by the manufacturer could not be relied upon even for the same type of instrument (Leszczynski et al., 1998). A standard calibration method that takes into account the individual spectral characteristics of the instrument and the loss of sensitivity has been proposed (Hülsen and Gröbner, 2007). However, uncertainties of ∼7 % can still be expected for well-maintained EBRs (Gröbner et al., 2009).
Long-term series of surface UVR from ground-based observations with a length of at least a few decades are rare. To the authors' knowledge, the longest UVR monitoring series began in Moscow in 1968 with a broadband (300–380 nm) instrument developed at the Moscow State University Meteorological Observatory (Chubarova and Nezval', 2000). One of the world's longest measurement records of solar UVR at the Earth's surface (and probably the longest taken by erythemal broadband instruments) is from Belsk. Measurements began in 1975 and continuous monitoring started on 1 January 1976. From a global perspective, the first UVR results appeared at the World Ozone and Radiation Data Centre (WOUDC) in 1989, but continuous UVR time series over three decades are only available for a limited number of stations: Uccle (Belgium), Edmonton, Resolute, Toronto, Churchill, Saturna Island (Canada), Tateno (Japan), and Syowa (Antarctica) (WOUDC, 2025). The data archive of the Network for the Detection of Atmospheric Composition Change (NDACC) also includes stations with at least three decades of UVR measurements such as Lauder (New Zealand), Mauna Loa (USA), and three Antarctica stations – Arrival Heights, Palmer Station, and South Pole (NDACC, 2025).
This article presents a retrospective evaluation of all UVR measurements (1976–2023) at Belsk made with different EBRs, including RB (1976–1992), SL Biometer model 501A (SL501A) (two instruments were used: #927 and #2011 for the period 1993–1994 and 1995–2013, respectively), and KZ UV-AE-T #30616 (KZ616) from 5 August 2013 to the present. The re-evaluation for the period 1976–2013 is based on a comparison of the measurements with the modelled daily erythemal radiant exposure and the UV index at local solar noon from a radiative model simulation for clear-sky conditions using TCO3 and AOD measured at Belsk as model input parameters. The quality of the KZ616 data (2013–2023) will be accessed through comparisons with clear-sky erythemal irradiances simultaneously measured by the well-maintained Brewer spectrophotometer Mark II #64 (BS64). The details of the Brewer maintenance can be found in Czerwińska and Krzyścin (2024a). Erythemal daily radiant exposures (DREs) for the entire period of the UVR measurements at Belsk will be transferred to the corresponding vitamin D3 and antipsoriatic DRE using a method proposed by Czerwińska and Krzyścin (2024a). A comparison of these DREs with those from BS64 spectral measurements in the period 2014–2023 will indicate the accuracy of the proposed reconstruction method of past BE data based on a statistical approach using typical proxies (TCO3 and G) characterising atmospheric UVR attenuation. Finally, trend calculations for annual (January–December) and summer (June–July–August) radiant exposures (REs) for all biological effects considered and three versions of recalculated UVR data from 1976–2023 will be presented to confirm the robustness of the long-term changes in the BE radiation measured at Belsk.
2.1 UVR monitoring
Recording of erythema irradiance with a standard RB meter (detector recorder No. 40) started in May 1975 at Belsk, but continuous monitoring began on 1 January 1976 and lasted until 1994. From May 1993, in parallel with the RB measurements, the monitoring of erythemal irradiance using the SL Biometer 501A #927 was initiated in order to establish monthly transfer coefficients for converting the RB output in sunburn units (SU) into erythemal units, i.e. the minimum erythemal dose (MED) causing skin redness in typical Caucasian skin, which was entered into the SL Biometer 501A measurements (Puchalski, 1995). MEDs were converted to the erythemal doses by multiplication with 210 Jeryt m−2, where Jeryt denotes spectral irradiance integrated over time and wavelengths (290–400 nm) after weighting by the erythema action spectrum. Simultaneous measurements continued until December 1994, and all erythemal DREs measured with the RB meter before 1993 were multiplied by these transfer coefficients to produce data comparable to those obtained with the SL Biometer 501A.
As the RB meter showed sensitivity to ambient temperature, a correction for temperature effect was applied to the raw daily RB values (Borkowski, 1998) using empirical formulas proposed by Koskela et al. (1994). In addition, the RB Belsk series was also found to be affected by a change in calibration method in 1985, as the Dave–Halpern model (Dave and Halpern, 1976) calculations for cloudless conditions replaced field comparisons with the travelling standard instrument. This resulted in a downward step change of 14 % in the UVR series (Borkowski, 2000). The re-evaluated time series of erythemal DRE for the period 1976–1992 as made by Borkowski (2008) was archived and formed part of the Belsk erythemal time series (1976–2023), which is further homogenised in this study.
Subsequent UVR measurements included SL501A #927 (1993–1994) and #2011 (1995–2013), which were calibrated by the instrument manufacturer prior to shipment, but these calibrations proved to be very inaccurate. Therefore, this paper is another attempt to recalculate past UVR data. In 2005, KZ616 was added to the IG PAS UV network and served as the reference instrument. It was not used for everyday UVR monitoring but only for occasional international calibration campaigns to provide a source for further calibrations with our SL biometers operating in Belsk and Hornsund (Spitzbergen). KZ616 started regular UVR monitoring on 5 August 2013, replacing the raw SL501A #2011, as BS64 (normally measuring TCO3 and Umkehr ozone at Belsk since 1992) was established as the new UVR reference instrument for the IG PAS network, which has been in operation since then. The performance of KZ616 has proven to be very stable and it is still used in regular UVR monitoring.
In the following, we use the term “raw data” for the results of the EBR measurements in W m−2 and J m−2 that were previously archived in the internal databases of IG PAS before the release of the Krzyścin et al. (2024) and Krzyścin (2024) databases.
2.2 Ancillary data
Daily representative values of TCO3 at Belsk are taken from the IG PAS data portal (Krzyścin, 2024), which contains results of daily average TCO3 measurements, prepared for UVR modelling purposes. For example, the most reliable daily representative value of TCO3 (marked with flag no. 1) was calculated as an average of the most accurate measurements (the so-called direct sun measurements) made by the Dobson spectrophotometer between 09:00 and 13:00 UTC. The least accurate case of ground-based TCO3 observations (with flag no. 5) occurred under cloudy and low sun elevation conditions, i.e. before 09:00 and after 13:00 UTC. In this case, only the least reliable Dobson observations were available for calculating the daily TCO3 representative under overcast zenith and high air masses. In the rare cases when ground observations were not available, satellite data (flag 6 or 7 depending on the data source) and/or TCO3 reanalysis data (flag 8) were used.
The daily representative value of CI, DCI, which is further used in regression models (Sect. 2.3.4), is calculated as the quotient of the daily integrals (sunrise to sunset) of G and G0. Typically, the former values were obtained from routine monitoring of global solar irradiance by various pyranometers (since 1965) including the following instruments: Kipp & Zonen CM 6, Sonntag PRM-2, Kipp & Zonen CM 5, Kipp & Zonen CM 11, and Kipp & Zonen CM 21. The data were calibrated using the Polish national standard, which had previously been adjusted to the world standard during intercomparison campaigns at the World Radiation Centre in Davos, Switzerland. In addition, the Campbell–Stokes sunshine recorder provided the duration of sunshine per day to pre-select sunny days. All these data are archived in the IG PAS Data Portal (Krzyścin, 2024).
To validate the corrected UV observations at Belsk, the long-term variability of BE radiation was also obtained from the UVR reconstruction models (Sect. 2.3) using proxies (TCO3 and DCI) from the ground-based observations and reanalysis datasets. The European Centre for Medium-Range Weather Forecasts (ECMWF) v5 (ERA5) reanalysis provides, in addition to many other variables, intraday TCO3 values, G0, and G for the period 1940–2024, which are freely available on the ERA5 (2025) website. Also included are data (from 1 January 1980 to the present) downloaded from the Modern-Era Retrospective Analysis for Research and Applications version 2 (MERRA-2) database (GMAO, 2025) using the Giovanni data search tool, which is freely available on the Giovanni (2025) website.
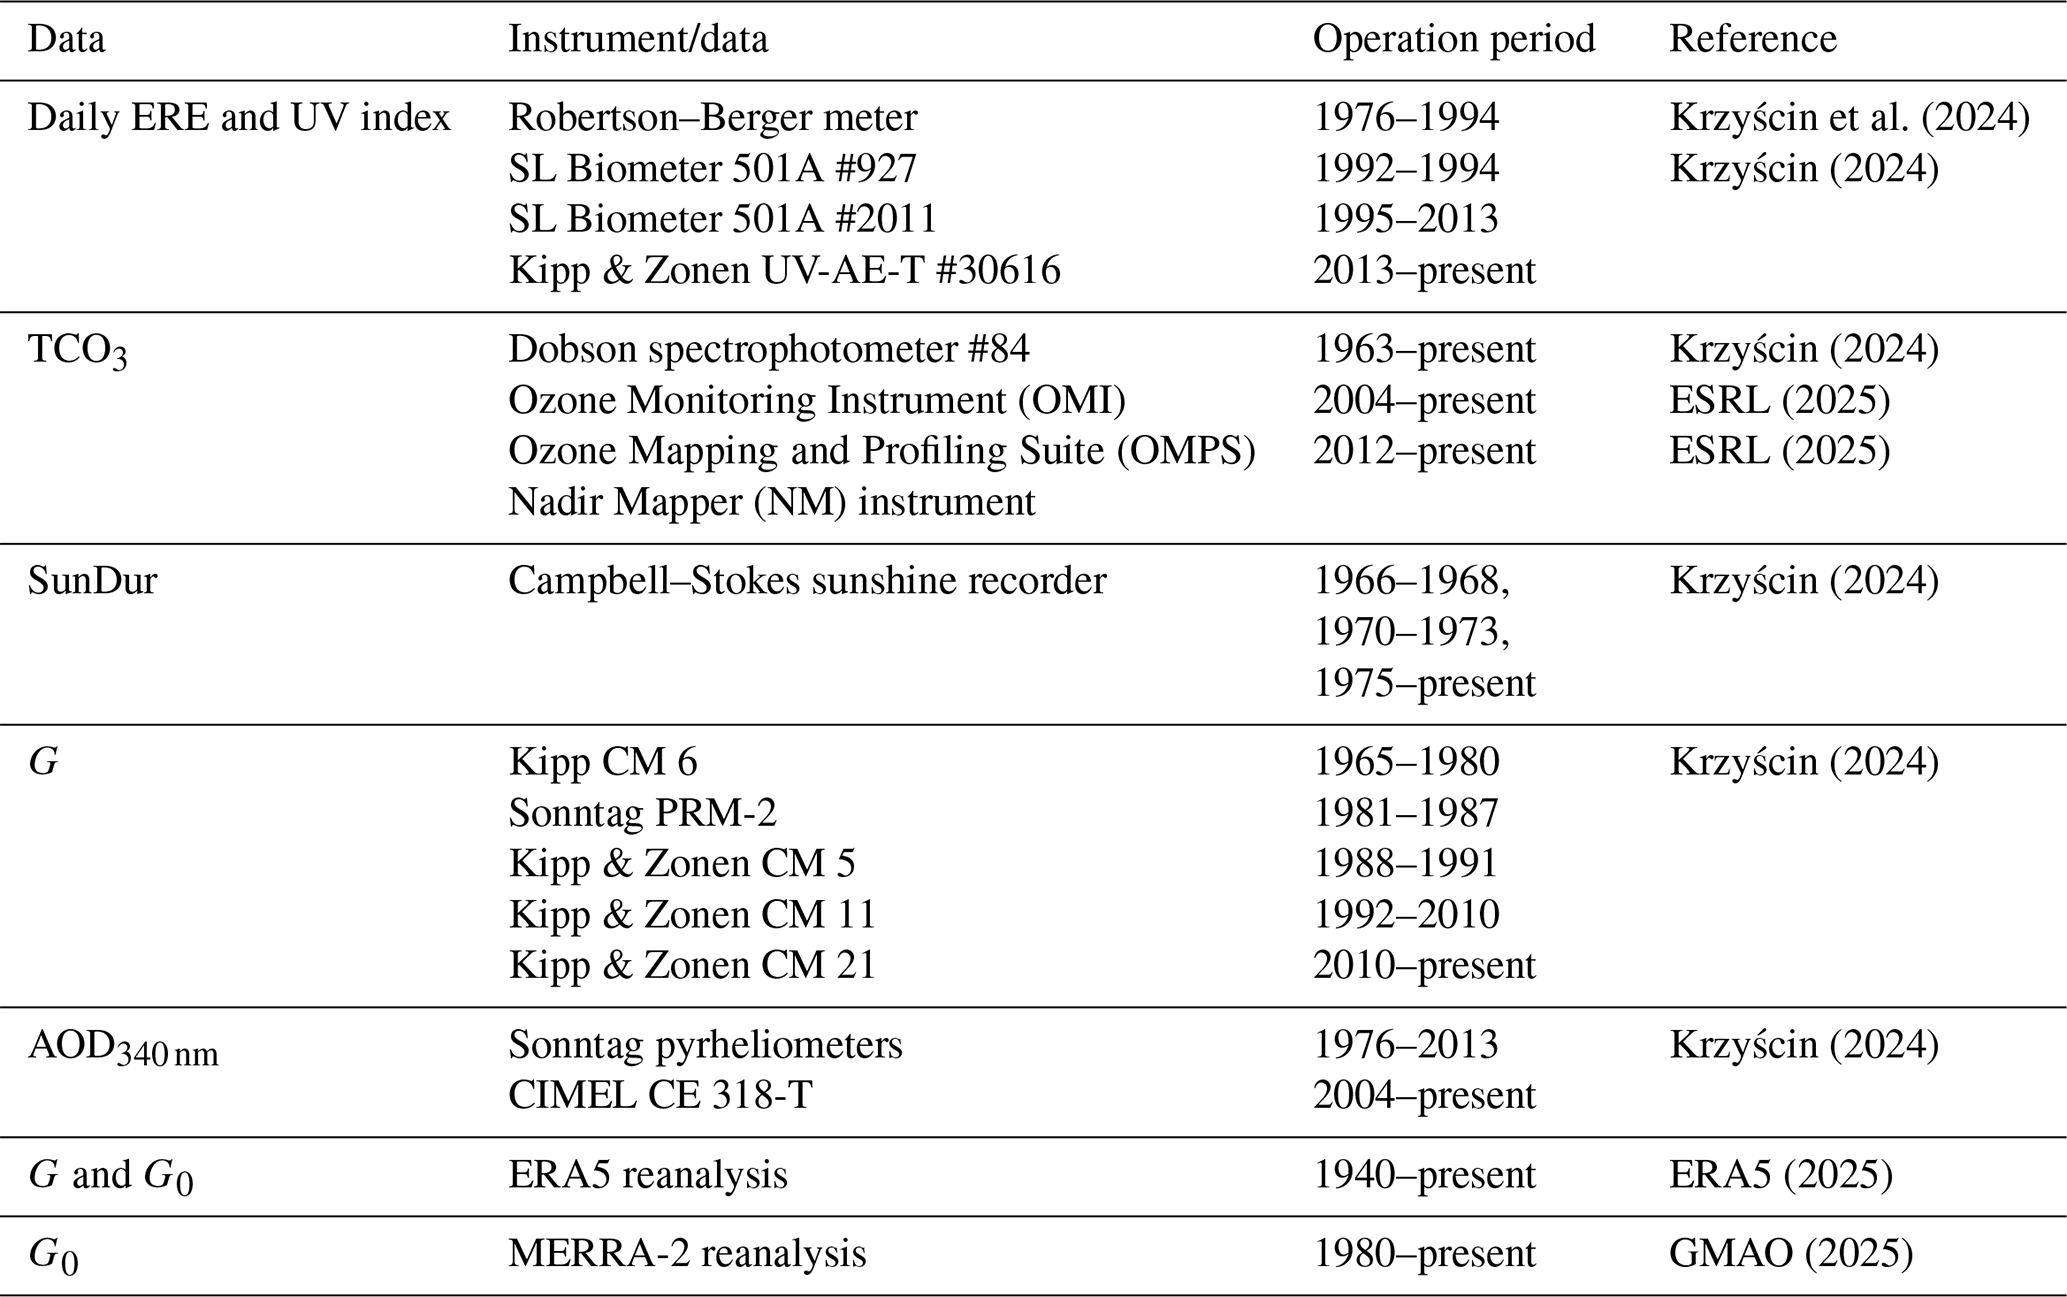
Atmospheric aerosols can be significant drivers of surface UVR, especially under clear-sky conditions (Krzyścin and Puchalski, 1998). The column properties of aerosols can be obtained from ground-based observations and used in the modelling of radiative transfer in the atmosphere. Aerosol properties are described by various characteristics (including AOD, single-scattering albedo, asymmetry factor). In this article, we use Belsk's AOD at 340 nm (IG PAS Data Portal, Krzyścin, 2024), which is estimated from the Linke turbidity factor measurements with Sonntag pyrheliometers between 1976 and 2013 (Posyniak et al., 2016) and from the collocated solar photometer CIMEL CE 318-T (2004–2023) operating within the Aerosol Robotic Network (AERONET) (AERONET, 2025). Other aerosol properties are kept constant and equal to their typical values for the rural site. Taking into account the climatology of Belsk's aerosol characteristics (AERONET, 2025), values of 0.95 and 0.69 are taken for single-scattering albedo and the asymmetry factor, respectively. Table 1 summarises the sources of the data used in this paper.
2.3 UVR models
2.3.1 Clear-sky model
Radiative transfer model simulations for clear-sky conditions are used to quantify and correct biases in the output of the Belsk UVR radiometers. To speed up the calculations, look-up tables were obtained using the Tropospheric Ultraviolet and Visible (TUV) Radiative Transfer Model (TUV, 2025). The TUV model, which was introduced by Madronich (1993), has since been widely used in UVR simulations.
Modelled clear-sky values of BE (erythema, previtamin D3 synthesis, clearing of psoriasis lesions) RE on day D, REEFF, CS(D) in JEFF m−2, and irradiance at local solar noon, IrEFF, CS, MAX, in WEFF m−2, respectively, are calculated using the following formulas:
where IrCS(λ,t) is the spectral irradiance at time t and at wavelength λ, and ASEFF(λ) denotes the action spectrum for a specific biological effect EFF: EFF=ERYT for erythema (CIE, 2019), EFF=VITD3 for photosynthesis of previtamin D3 in human skin (CIE, 2006), and EFF=PSOR for psoriasis clearing (Krzyścin et al., 2012). Figure 1 presents the action spectra used.
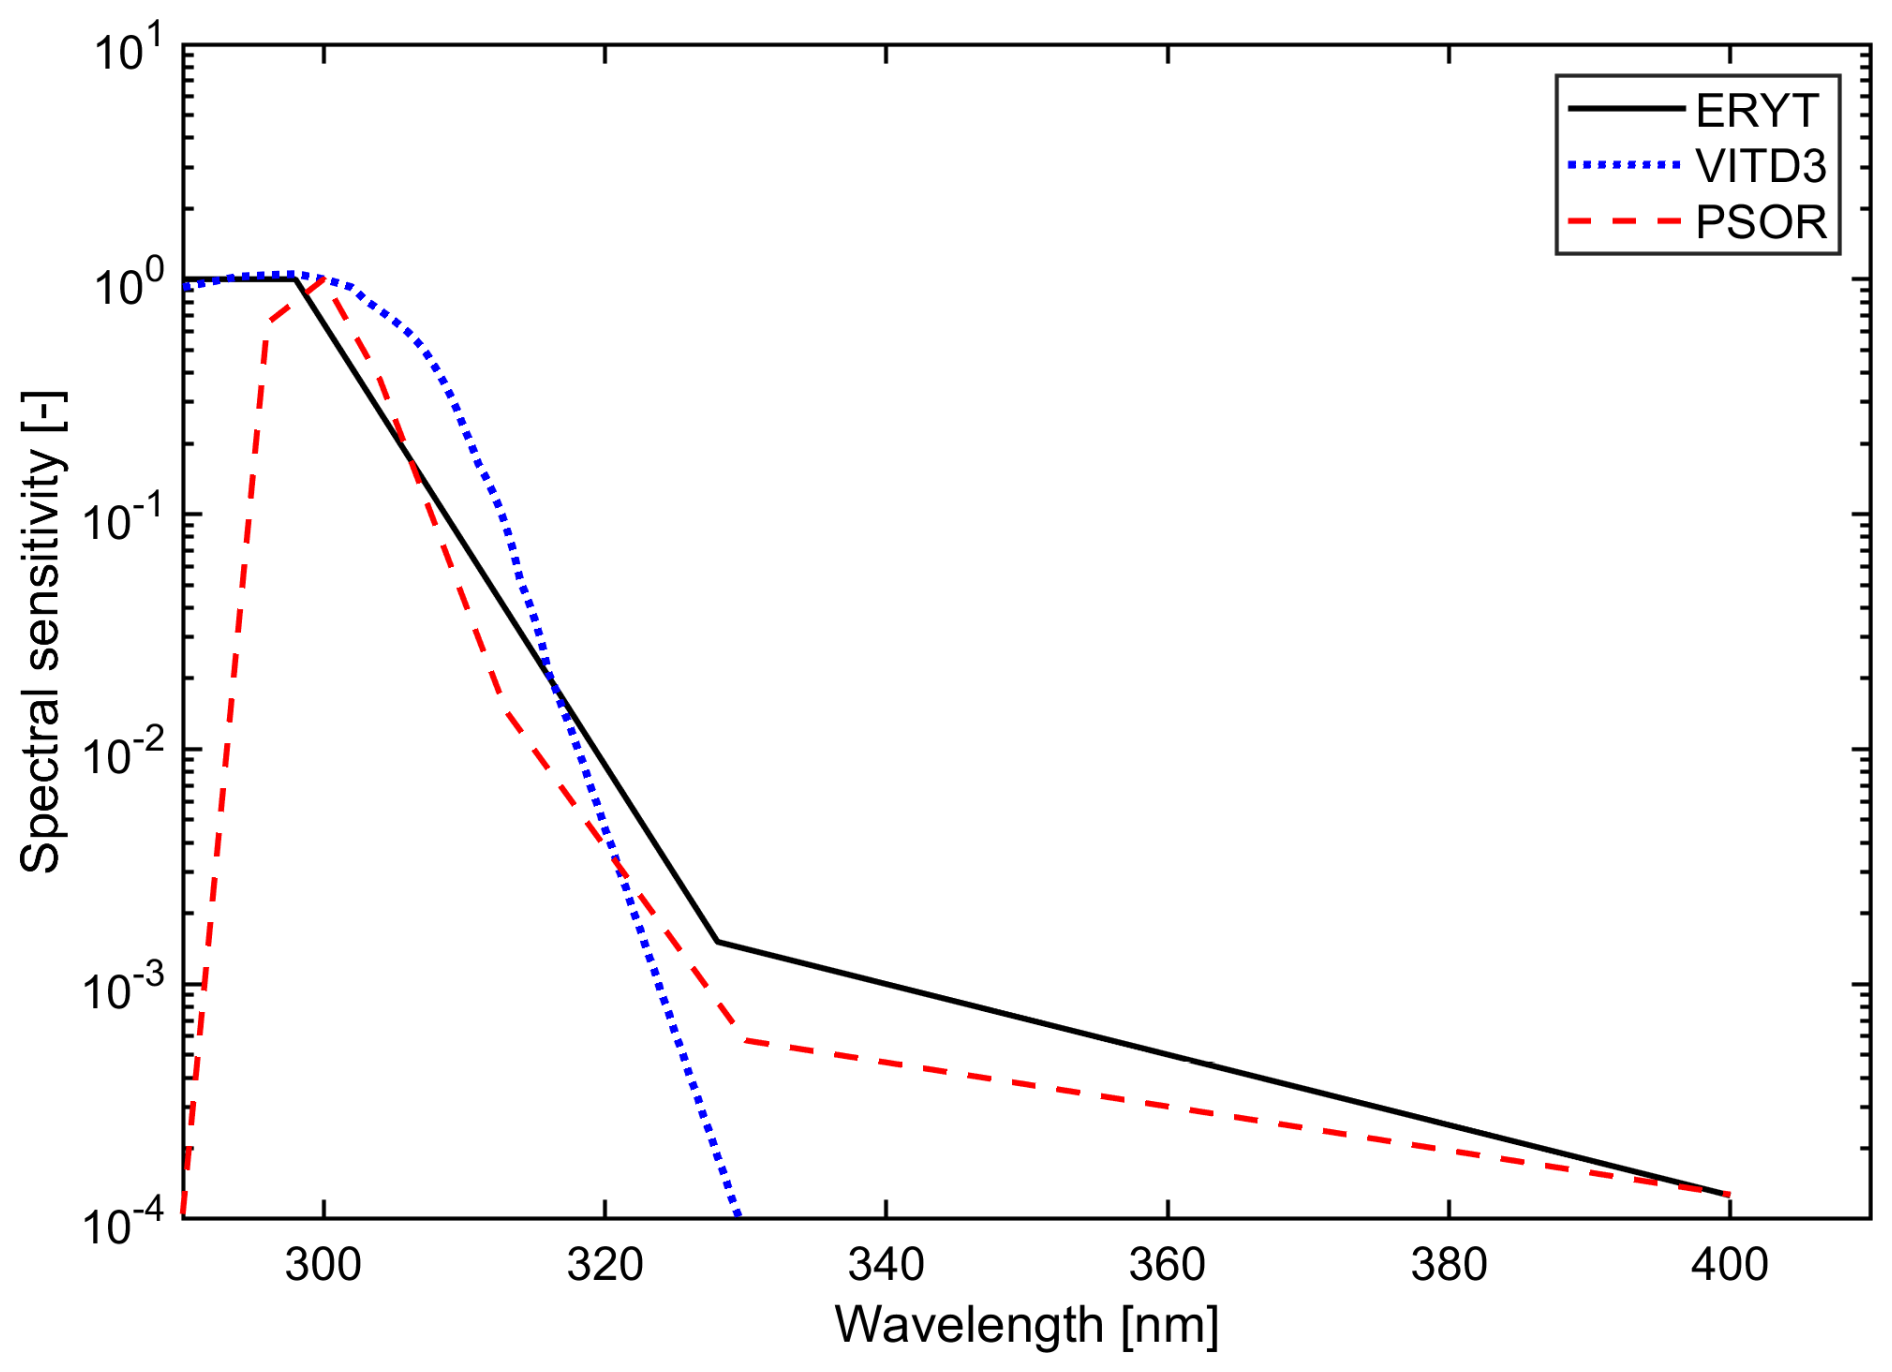
Figure 1Normalised action spectra for the specific biological effects: erythema (ERYT), photosynthesis of previtamin D3 in human skin (VITD3), and psoriasis clearing (PSOR).
Input to the clear-sky version of the TUV model (daily representative values of TCO3, annual and monthly mean AOD at 340 nm for the period 1976–2013 and 2014–2023, respectively) and output (REEFF, CS(D) and IrEFF, CS, MAX, where ) are archived in the IG PAS Data Portal (Krzyścin, 2024).
2.3.2 Re-evaluation of the UVR measurements
Model simulations of erythemal DRE and UVIMAX under cloudless sky provide a basis for the correction procedure of the past UVR data. A selection of clear-sky conditions throughout the entire day from the daily proxy values (relative sunshine duration and DCI), which were available for Belsk, is not straightforward as only the examination of the daily course of these measurements would allow capturing cloudless moments within the day. Thus, two different sets of correction coefficients are proposed, called CC1 and CC2.
The UVR measurements at Belsk from 1976 to 2023 can be clearly divided into three periods: 1 January 1976–31 December 1992, 1 January 1993–4 August 2013, and 5 August 2013–31 December 2023, according to the different broadband instruments used for UVR monitoring, i.e. RB, SL501A, and KZ616, respectively. For the first period, only the erythemal DREs were archived, whereas for other periods UVIMAX was also available (equal to the value of erythemal irradiance at local solar noon during a cloudless day). There were also periods when both instruments were operated simultaneously for calibration purposes: March 1992–December 1994 (RB versus SL501A), 5 August 2013–31 December 2014 (SL501A #2011 versus KZ616), and 5 August 2013–31 December 2023 (KZ616 versus BS64).
The correction procedure before 5 August 2013 consisted of comparing the raw erythemal data with the corresponding modelled values obtained from the radiative model simulations (described in Sect. 2.3.1) for days when ancillary data indicated that the sky was clear throughout the day. The locally weighted scatterplot smoothing (LOWESS) proposed by Cleveland (1979) was used to extract the smoothed pattern of the multipliers of the raw UVR data, i.e. the correction coefficients (CCs), from the daily ratios between modelled and erythemal REs (for version CC1 of the correction) or from the ratios between UVIMAX values (version CC2). The following conditions were applied for the selection of clear-sky data used in the two correction methods.
-
CC1 – direct sun TCO3 measurements occurred between 09:00–13:00 UTC (code 1 for the TCO3 observation in IG PAS Data Portal, Krzyścin, 2024) and the daily difference between the observed and the theoretical maximum sunshine duration is less than 30 min at solar zenith angles (SZAs) less than 85°. This limit was chosen because broadband UVR measurements at larger SZAs are unreliable and the Campbell–Stokes instruments start when direct sun irradiance exceeds 120 W m−2.
-
CC2 – for TCO3, the same condition was set as for CC1, and the ratio between the observed and theoretical sunshine hours (for SZA<85°) is not less than 85 %. CC2 values have only been calculated for the period since 1 January 1993. Prior to this date, a re-evaluation of the RB data with a model mimicking the KZ radiometer measurements by Krzyścin et al. (2011) showed that the correction was not necessary, i.e. CC2=1. This choice is also confirmed here by the constant long-term patterns of the ratio between modelled and observed DRE in the period 1976–1992 (see Sect. 3.2.1 for more details).
The smoothing procedure was applied to the long (1976–2013) and short (1993–2013) UVR time series for the CC1 and CC2 versions, respectively. A small jump (∼0.01) in the smoothed UVImax ratio was found in January 1993 (Sect. 3.2.1), which further corroborates the selection of CC2=1 prior to 1993.
The CC1 and CC2 versions of the re-evaluated Belsk UVR data are stored in the following free-access data archives: https://doi.org/10.1594/PANGAEA.972139 (Krzyścin et al., 2024) and https://doi.org/10.25171/InstGeoph_PAS_IGData_Biologically_Effective_Solar_Radiation_Belsk_1976_2023 (Krzyścin, 2024).
2.3.3 Reconstruction of BE radiation from the erythemal data
Broadband instruments for measurement of the erythemal irradiance can also estimate non-erythemal irradiance by multiplying the erythemal irradiance by the so-called conversion factors (CFEFF) derived from spectral UVR measurements and/or radiative transfer simulations (Schmalwieser et al., 2022; Czerwińska and Krzyścin, 2024a):
where SZA denotes the solar zenith angle at time t. According to this concept, the daily radiant exposures for previtamin D3 synthesis and psoriasis clearance in year Y, month M, and day of month D, and , respectively, were estimated using the product of daily conversion factor, , and the erythemal DRE :
where depends on TCO3 and DY (day of the year corresponding to the current day ). and CFEFF values were obtained from radiative transfer model simulations. The time series (1976–2023) of the conversion factors, , and the corresponding value of the biologically effective irradiance at local solar noon, IrEFF, MAX, have been archived in the IG PAS Data Portal (Krzyścin, 2024).
2.3.4 Regression models
The CCs described in Sect. 2.3.2 were obtained for cloudless conditions and applied to all-sky conditions, where the contribution of the diffuse part of the radiation increases with cloud cover and dominates under overcast conditions. It cannot be ruled out that the instruments used to monitor UVR at Belsk have their own specific characteristics for recording diffuse radiation and that and CFEFF in Eqs. (3) and (4) also depend on the combined characteristics of clouds and instruments. To test whether this is the case, we investigated how different regression models, which were trained using the UVR data collected between 2014 and 2023 (for this period, the quality of the broadband radiometer was confirmed by the Brewer Mark II observations), reproduce the daily doses of erythemal radiation throughout the 1976–2023 monitoring period.
The first model (Mod1) is based on clear-sky spectra determined with the RT model discussed in Sect. 2.3.1 and a cloud modification factor (CMF) derived from DCI data. The second and third models (Mod2 and Mod3) are based on TCO3 and DCI data evaluated on a monthly basis. TCO3 and DCI were taken from either observations at Belsk (Mod2) or ERA5 reanalysis (Mod3).
According to a widely used UVR modelling concept (e.g. Rieder et al., 2008; den Outer et al., 2010; Čížková et al., 2018; Czerwińska and Krzyścin, 2024b) the erythemal DRE on a given day , , is the product of CMF (empirical function of DCI parameterising UVR attenuation by clouds) for that day and the modelled clear-sky value REERYT, CS (Sect. 2.3.1):
CMF is calculated here as a power function with the regression coefficients, α and β, depending on SZA at local solar noon, SZAN, for the day :
where estimates for the regression coefficients, α and β, were obtained from the 2014–2023 data when the KZ616 measurements were well matched to the BS64 data (Sect. 3.1). In DCI calculation, the daily integral of global solar irradiance, DG, is from observations at Belsk or ERA5 and its clear-sky equivalent, DG0, from ERA5 (before 1980) and thereafter the mean of ERA5 and MERRA-2 values.
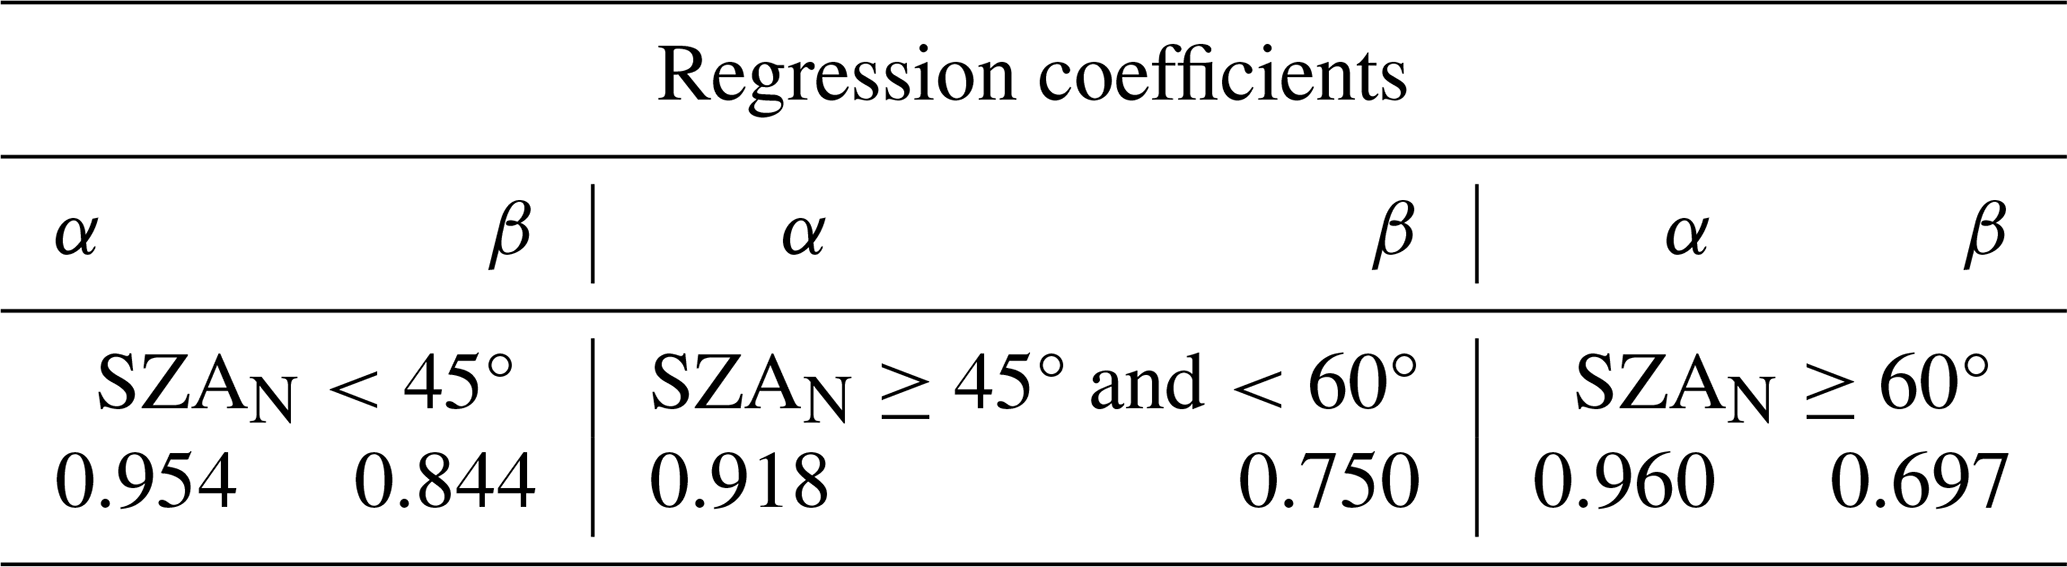
The standard least-squares subroutine (MATLAB function – fitlm(x,y)) provided the estimates for three arbitrarily selected local solar noon (SZAN) ranges (Table 2). These regression coefficients were used for the reconstruction of the REERYT time series for the entire period of UVR measurements (1 January 1976 up to 31 December 2023). This model will be referred to as Mod1 in this paper.
Table 2Estimates of the regression coefficients, α and β, describing the attenuation of erythemal DRE by the empirical model, Mod1, defined by Eqs. (5) and (6), for the three ranges of local solar noon (SZAN).
The next two regression models were trained using the monthly averages of erythemal DRE, REERYT(Y,M), for month M in year Y (from 2014 up to 2023), averaging all available daily values in M month for Y year. The corresponding long-term (2014–2023) monthly means, , are from the averages of all data for this calendar month. The idea of these models is to explain relative changes in the erythemal monthly RE, i.e. , with the corresponding relative changes in variables X that affect UVR, , where X(Y,M) is the monthly mean of DG or TCO3 in year Y and month M, and X∗(M) is the long-term monthly mean for month M.
Here, K=OBS (for Mod2) and ERA5 (Mod3) are for the regression using the explaining variables from the measurements at Belsk and ERA5 reanalysis, respectively. Finally, the modelled REERYT, K value is equal to
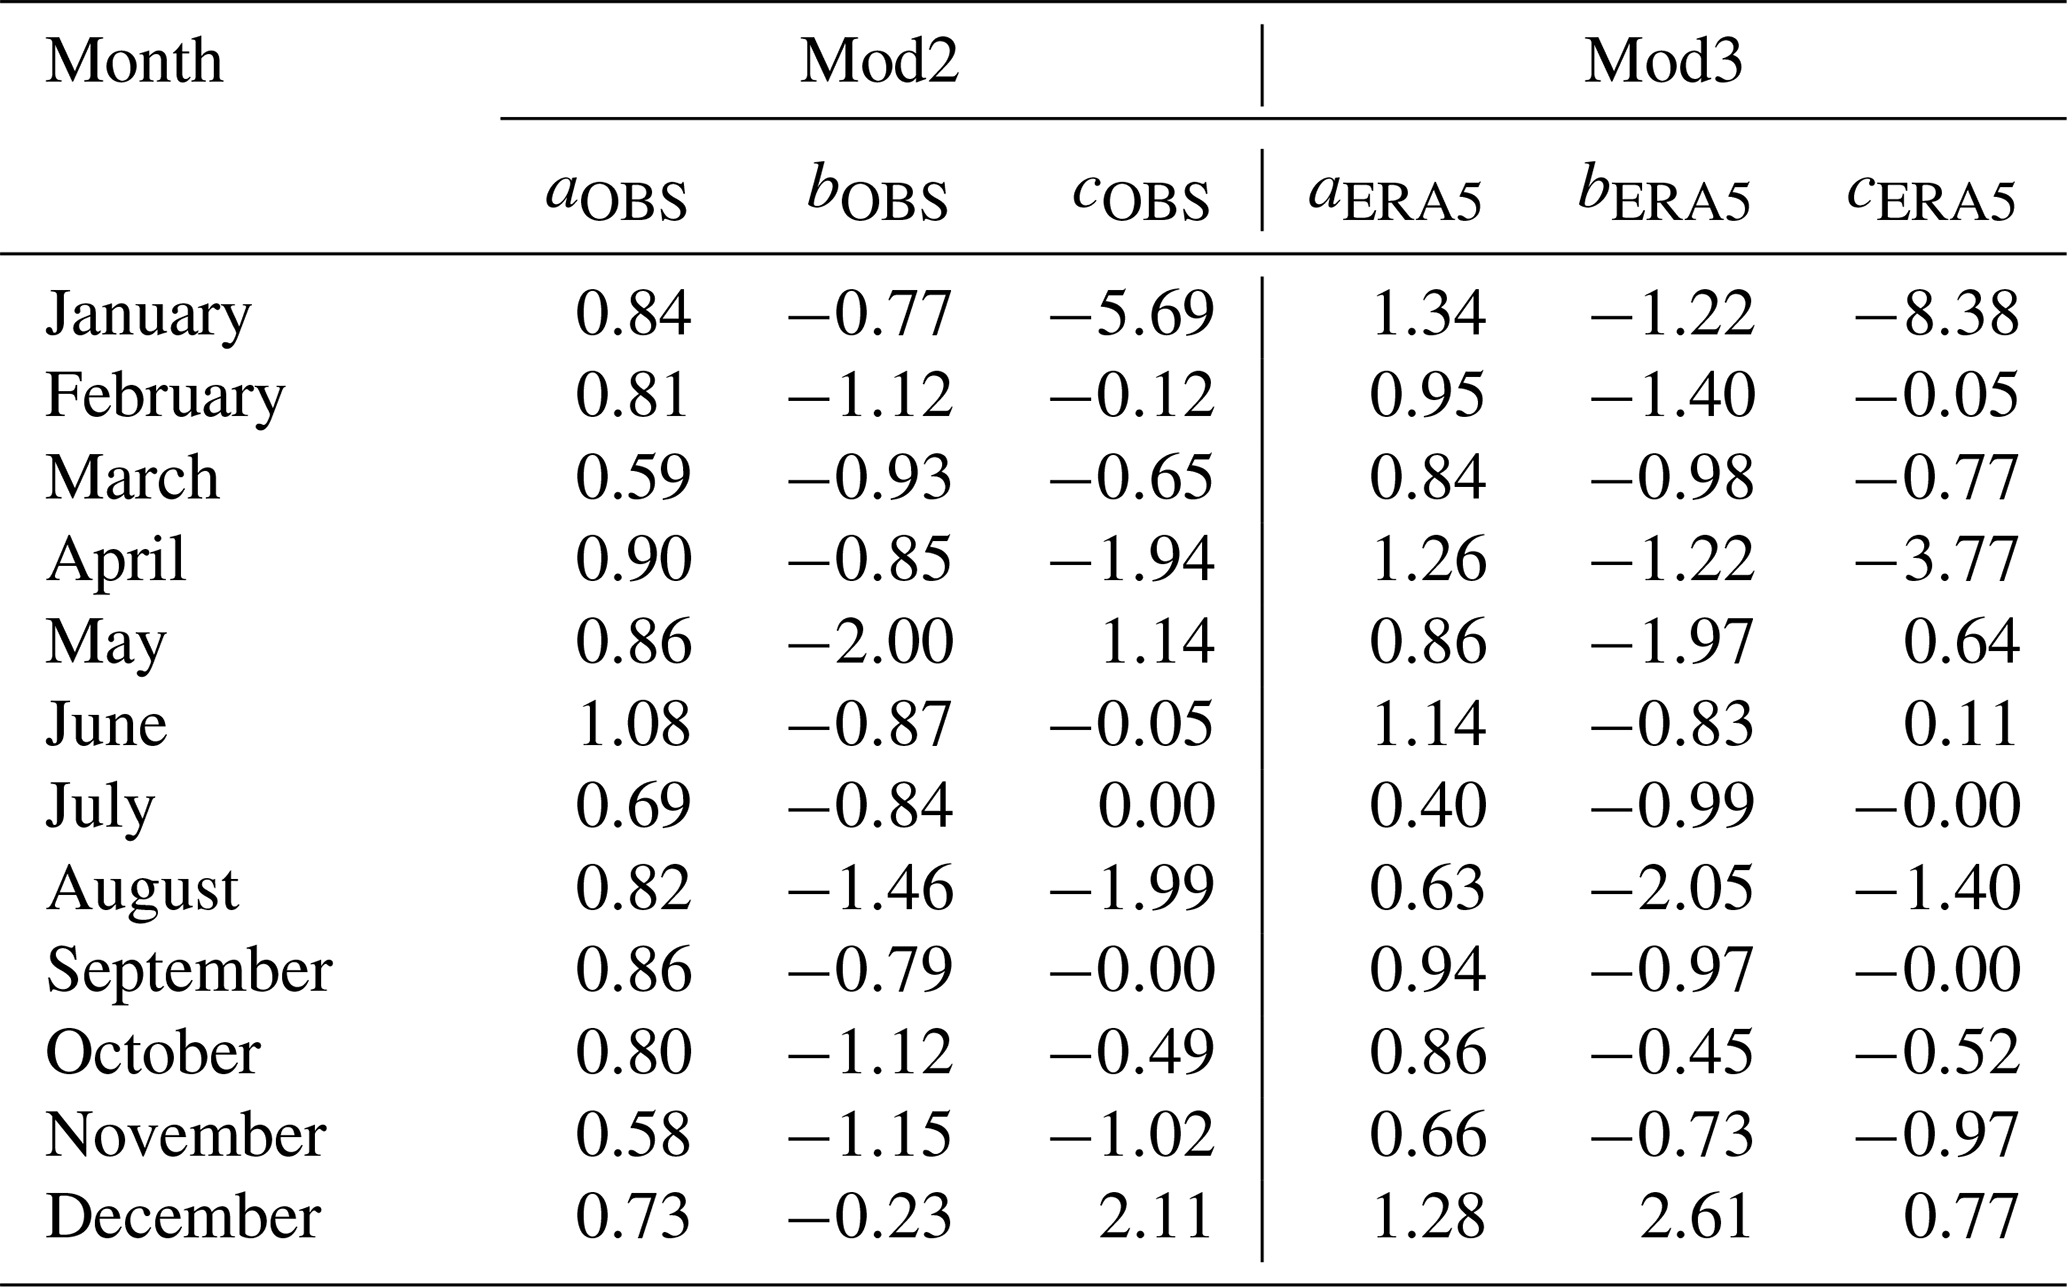
Models defined by Eq. (8) were used to compare fluctuations in UVR data in periods with RB and SL501A measurements relative to the long-term monthly means in these periods: values that were approximated using the long-term averages of the measured values for the period 1976–1992 and 1993–2013, respectively. The regression coefficients, aK, bK, and cK, which were calculated using the standard least-squares linear fit to the most reliable (2014–2023) data (Table 3), were applied to construct monthly time series for the entire measurement period (1976–2023).
Table 3Coefficients of the multilinear regressions derived for each calendar month based on the explaining variables from the measurements at Belsk (Mod2) and ERA5 reanalysis (Mod3) data for the period 2014–2023.
2.4 Statistical methods
Several standard statistical characteristics, which are calculated from the relative differences, zi, between the observed, xi, and the value of the regression model, yi, expressed in percentage of the observed value, are used to determine the level of agreement between two time series. These are as follows: mean relative deviation (MRD), mean absolute deviation (MAD), standard deviation (SD), root mean square deviation (RMSD), and Pearson's correlation coefficient (R):
Standard least-squares linear regression is applied to find the long-term tendency in the data. According to Weatherhead et al. (1998), the standard error of the linear trend estimate, SELS, by the standard least-squares approach should be multiplied by the factor to obtain the standard error corrected for the autocorrelation (with a time lag of 1) in the trend residuals, SELS, COR, if the trend residuals are positively correlated with the autocorrelation coefficient equal to Rk+1. F is set to 1 if the autocorrelation coefficient in the residual time series is negative.
Further in the text (Sect. 3.3), the slopes of the regression line will be calculated by the MATLAB function fitlm(x,y), and the corrected standard error of the slope, SELS, COR, for cases with , will be enlarged by the factor proposed by Weatherhead et al. (1998) (see Eq. 15).
3.1 The re-evaluation of the UVR measurements since 5 August 2013
On 5 August 2013, data from KZ616 replaced the raw data from SL501A #2011, which had been routinely used for UVR monitoring since 1995, as its performance had deteriorated (Fig. 2). Following this change, a new correction procedure for the Belsk UVR meter was introduced for early detection of instrument failure. Each month its output (erythemal irradiance) was compared with the corresponding output of the collocated BS64. An example of such a monthly comparison (for June 2023) is shown in the scatterplot between the BS64 and KZ616 erythemal irradiances measured under clear-sky conditions (Fig. 3a). In addition, Fig. 3b shows the monthly mean ratios between BS64 and KZ616 erythemal irradiance obtained during cloud-free periods from 2014 to 2023.
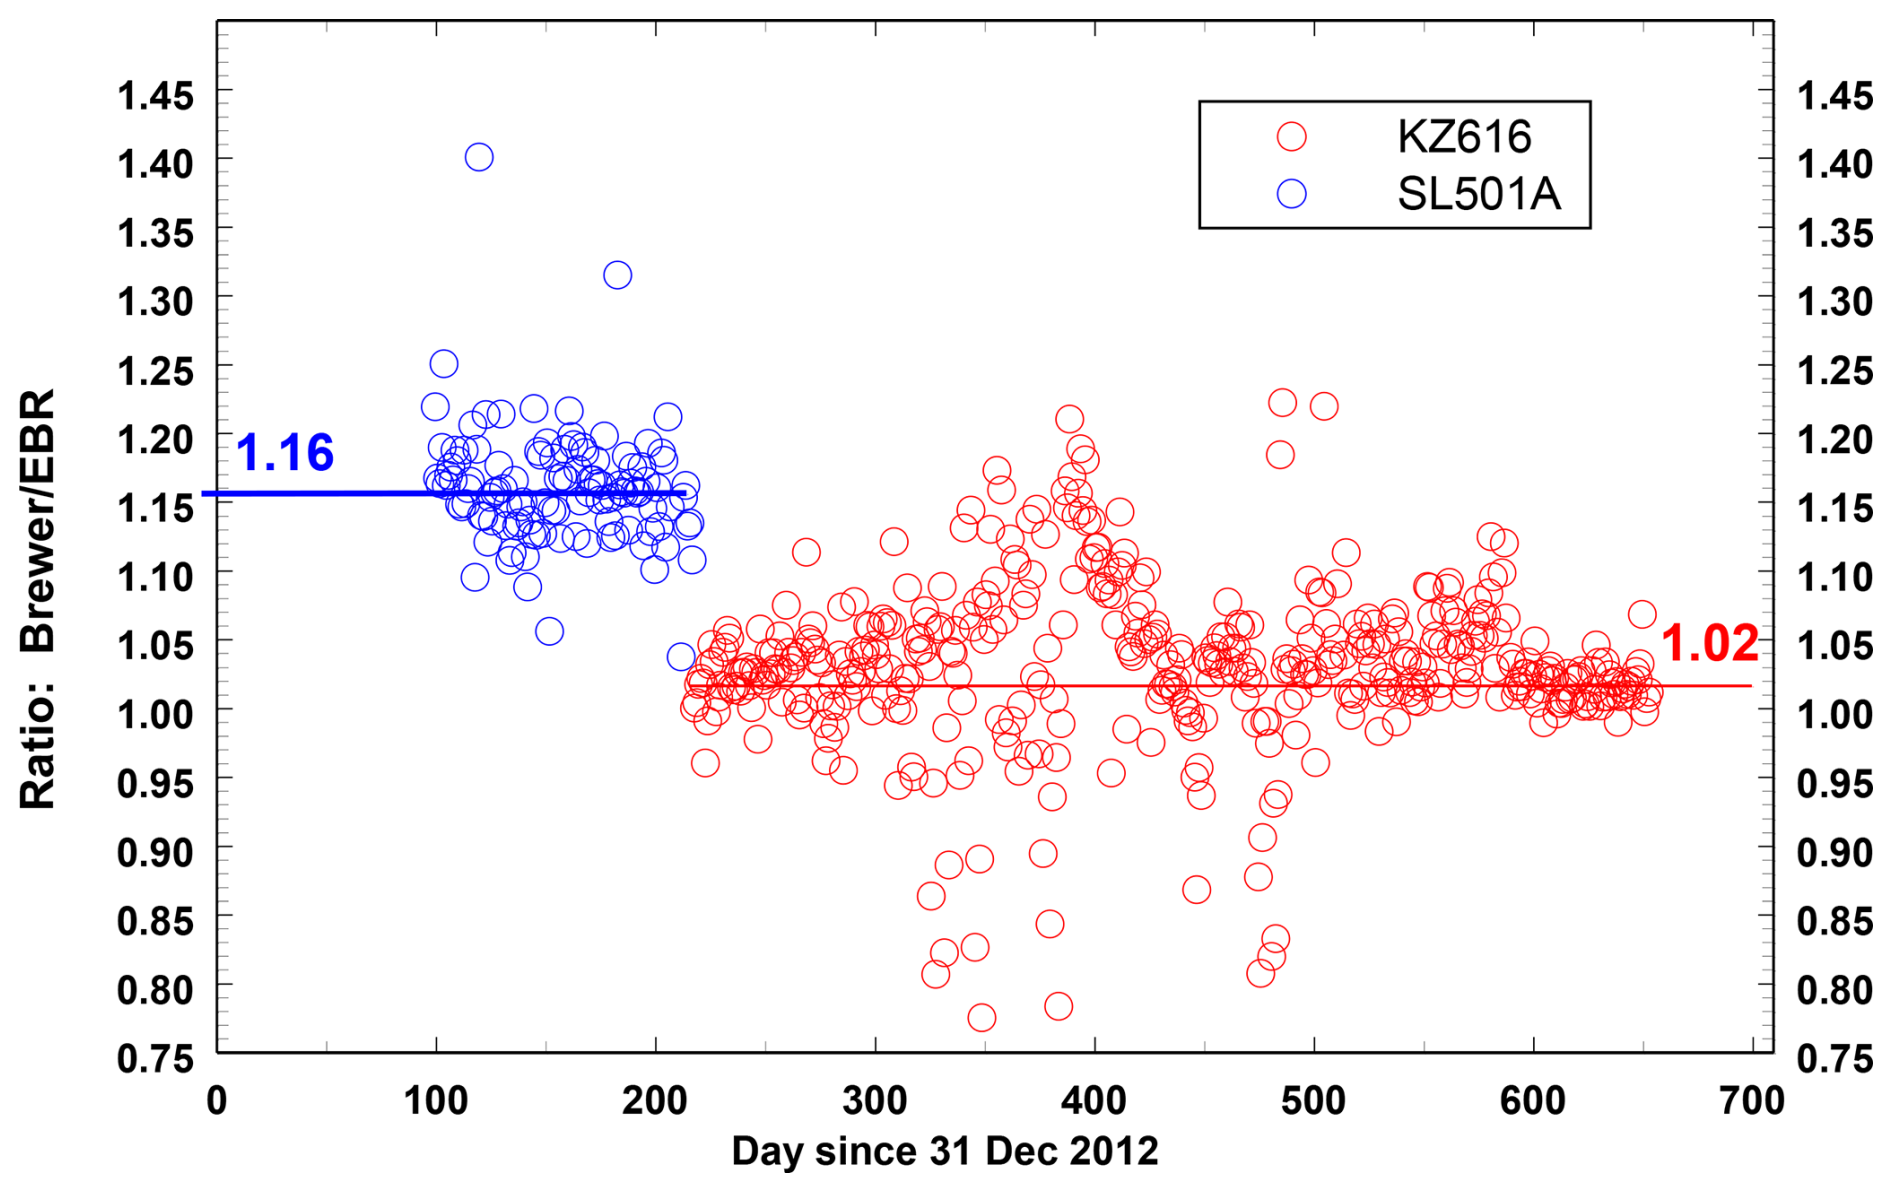
Figure 2The ratio between the erythemal daily radiant exposures from the erythemal radiometers (SL501A #2011 before 5 August 2013 and KZ616 afterwards) and the Brewer Mark II spectrophotometer for the 2013–2014 period. The horizontal lines denote the mean value of the ratio.
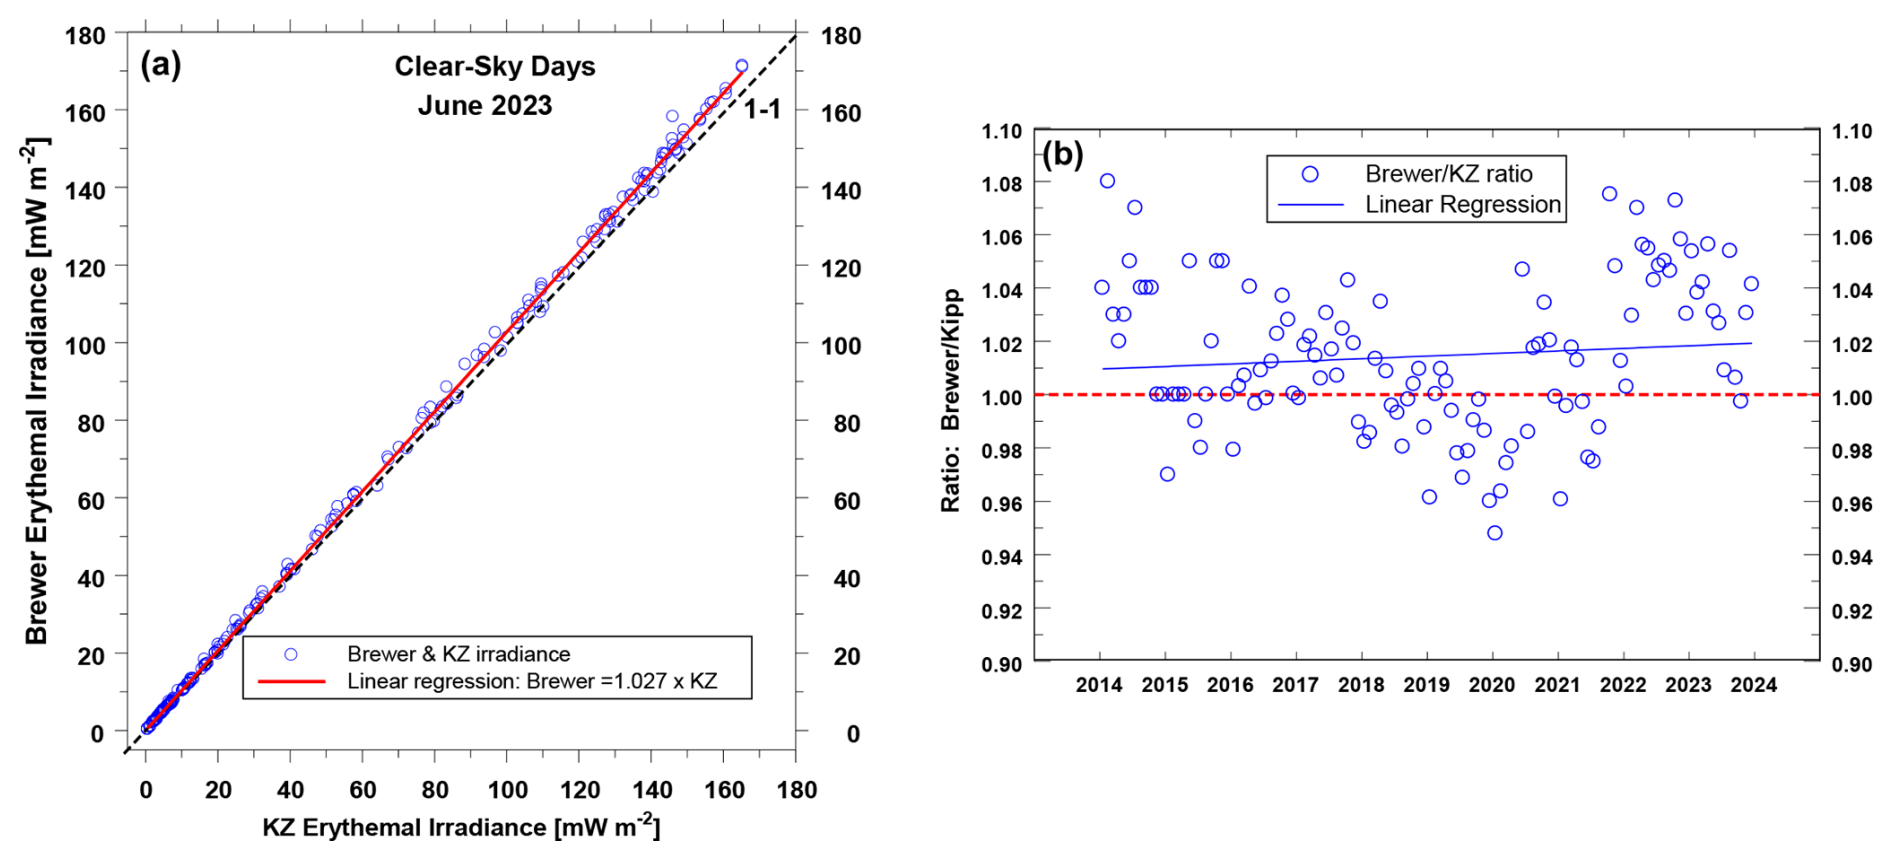
Figure 3Comparison of the BS64 and KZ616 erythemal data for the period 2014–2023: (a) the erythemal irradiances measured by the BS64 versus corresponding output of KZ616 in June 2023 for clear-sky days and (b) time series of the monthly average of BS64/KZ616 ratios. The dashed line in Fig. 3a shows the ideal 1:1 line.
Given the insignificant trend in the time series of the monthly BS64/KZ ratios (Fig. 3b), it was decided to keep the KZ616 data without additional adjustments. This assumption is also supported by the BS64/KZ616 comparisons as shown in the scatterplots of Fig. 4, which indicate that the Brewer and BE data cluster about the ideal 1:1 line. For the daily vitamin D3 and antipsoriatic RE, the values were reconstructed from the daily erythemal RE using the transfer coefficients defined by Eq. (4) (the values are archived in the IG PAS Data Portal), but the corresponding Brewer values were calculated from the real measured spectra weighted with the action spectra shown in Fig. 1.
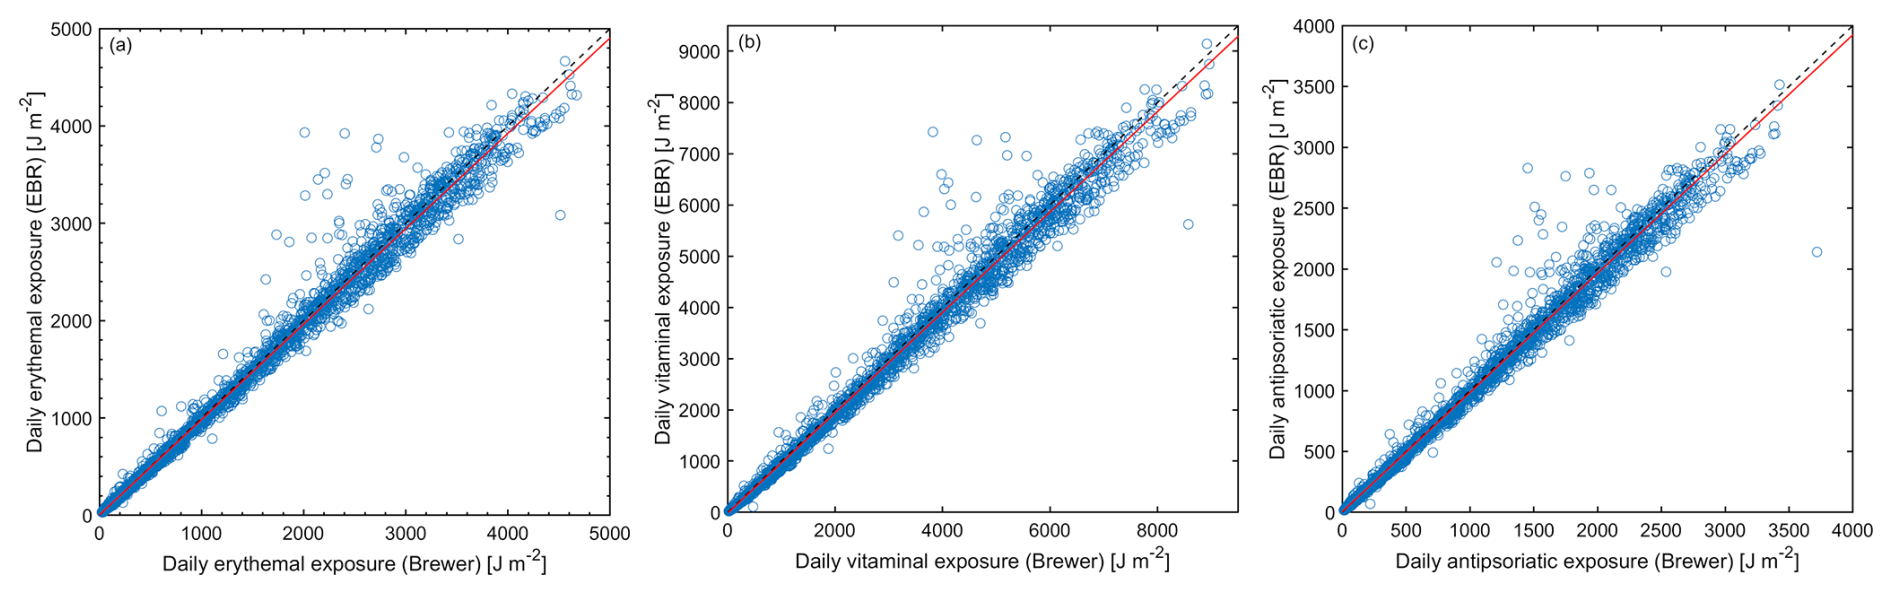
Figure 4Scatterplots (KZ616 versus BS64) for biologically effective daily radiant exposures in the period 2014–2023: (a) erythema, (b) previtamin D3 synthesis, and (c) psoriasis clearance.
Additional support for keeping the KZ616 data without a correction is found in Fig. 5 where the long-term (2014–2023) means of the monthly CC1 and erythemal DRE for each calendar month are shown in the upper and lower graphs. The CC1 values are in the range of 1.00 to 1.02 during the period (April–September) when the intensity of solar UVR is usually high and the fine weather often allows prolonged outdoor activity.
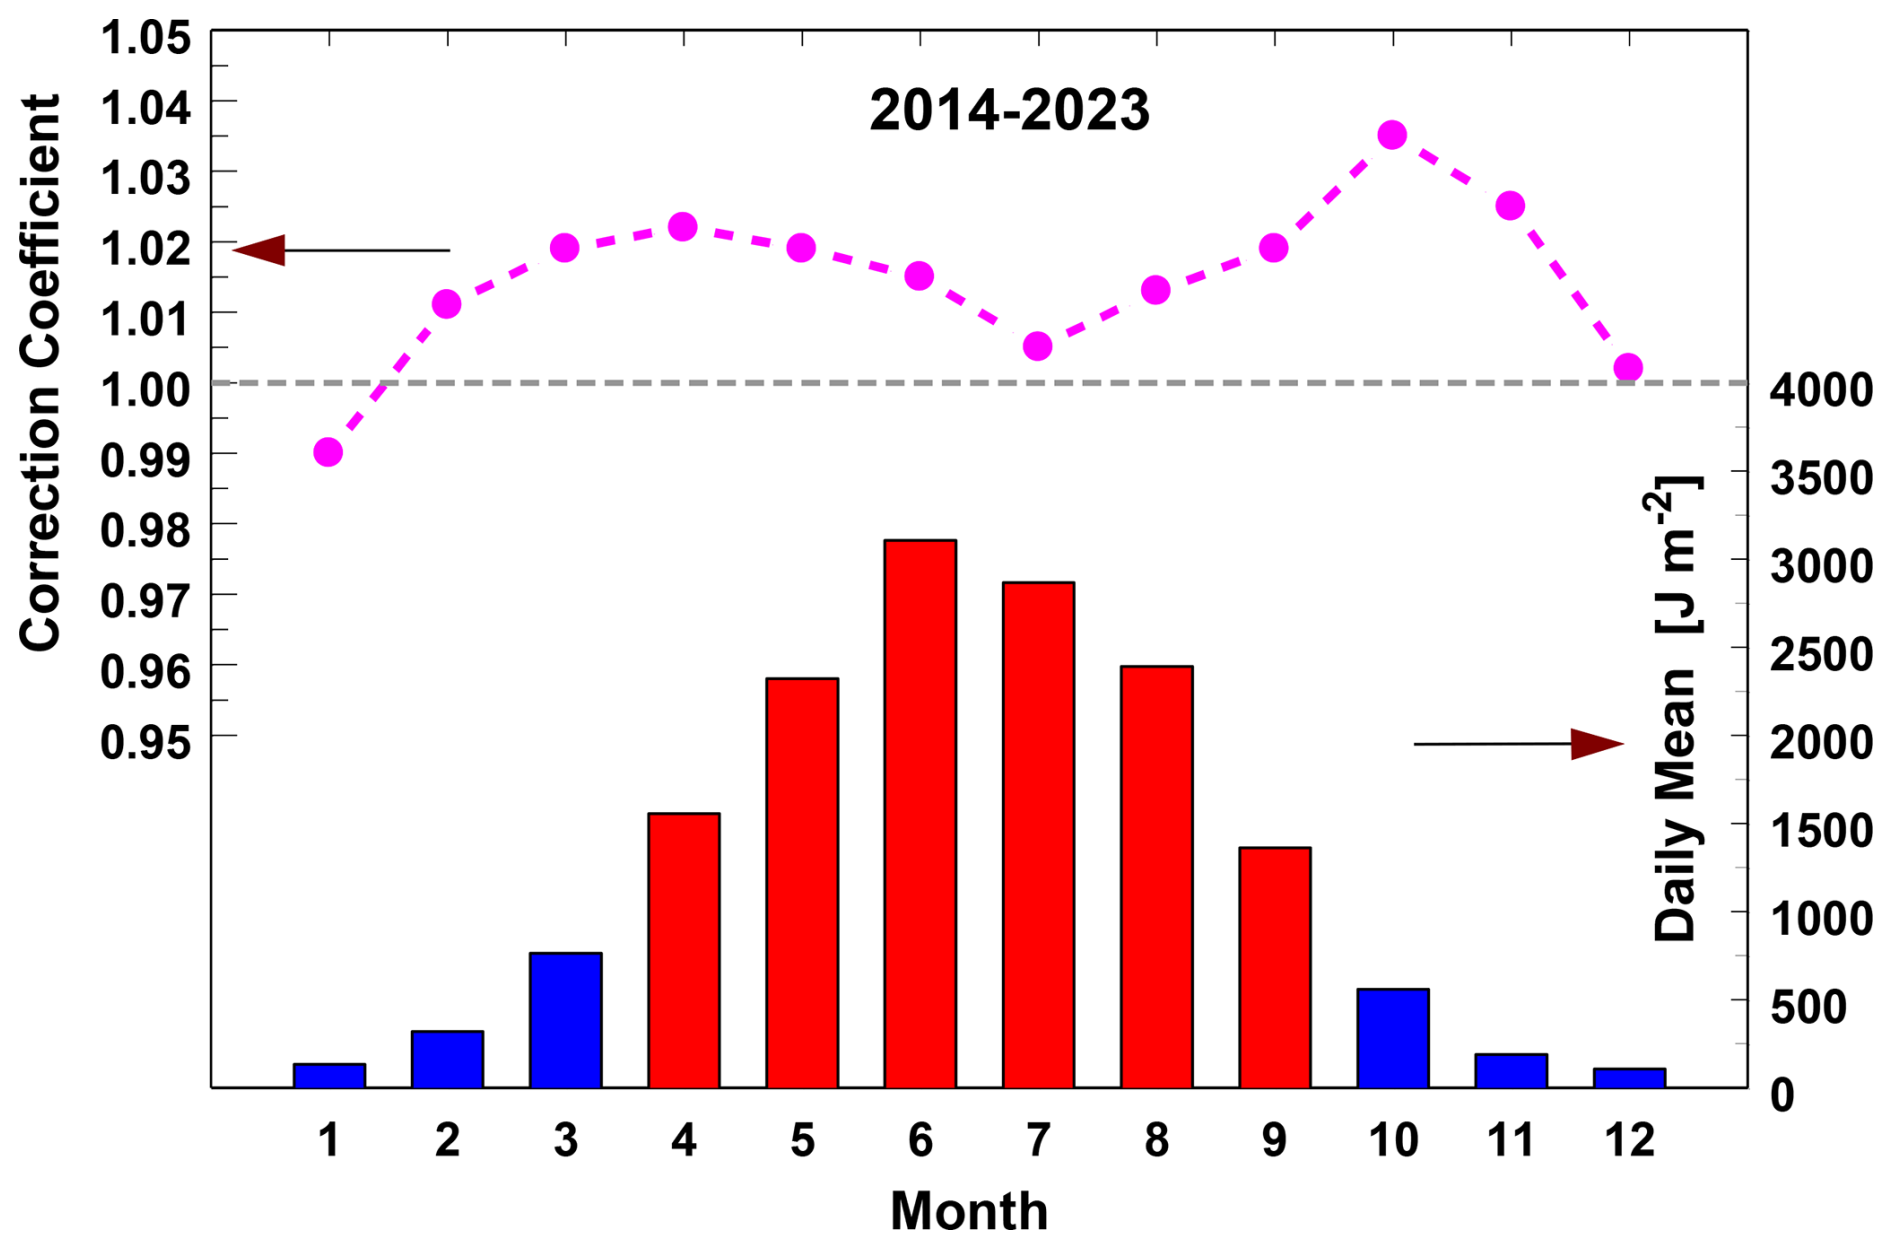
Figure 5Seasonal pattern of the correction coefficient (CC1) and daily mean of erythemal radiant exposures for the period 2014–2023. Red bars denote months contributing mostly to the annual radiant exposure.
Table A1 shows the values of the descriptive statistics for the period 2014–2023 according to the different ranges of SZA values at local solar noon, which confirm the good agreement between the DRE for all considered biological effects from the well-calibrated BS64 and KZ616 measurements used in routine UVR monitoring. For example, regardless of the biological effect, MRD and RMSD are % and ∼9 % for SZAN<45°, which occurs from 8 April to 5 September at Belsk, i.e. during the period with the highest UVR intensity of the year. For SZAN≥60° (from 15 October to 27 February of the following year), MRD and RMSD are only slightly larger ( % and ∼10 %, respectively) for the erythema and antipsoriatic exposures. These values are higher ( % and ∼16 %) for the previtamin D3 exposures, raising questions about the usefulness of the erythema radiometers for measuring vitamin D3 exposure when SZAN≥60°. However, vitamin D3 synthesis in the skin ceases during this period.
3.2 The re-evaluation of the UVR measurements before 5 August 2013
3.2.1 Correction coefficients from the clear-sky model simulations
Analyses of intraday UVR measurements in Belsk from 1 January 1976 to 4 August 2013 have to be divided into two parts, i.e. 1 January 1976–31 December 1992 and 1 January 1993–4 August 2013, due to the different broadband instruments used for UVR monitoring. In the first period, daily erythemal exposures were archived on the basis of manual summation of RB counts per day. For the latter period, 1 min erythemal irradiances were automatically recorded by a logger using SL501A biometers and utilised in the calculation of UVIMAX and daily erythemal RE. Two methods of data correction were proposed (Sect. 2.3.2) using clear-sky data: modelled and measured daily erythemal RE (for the period 1976–2013) and UVIMAX (1993–2013) for the correction method denoted CC1 and CC2, respectively. Figure 6 shows the time series of CC1 and CC2 values together with their smoothed values by the LOWESS smoother, which were used as multipliers of the raw UVR data before 5 August 2013.
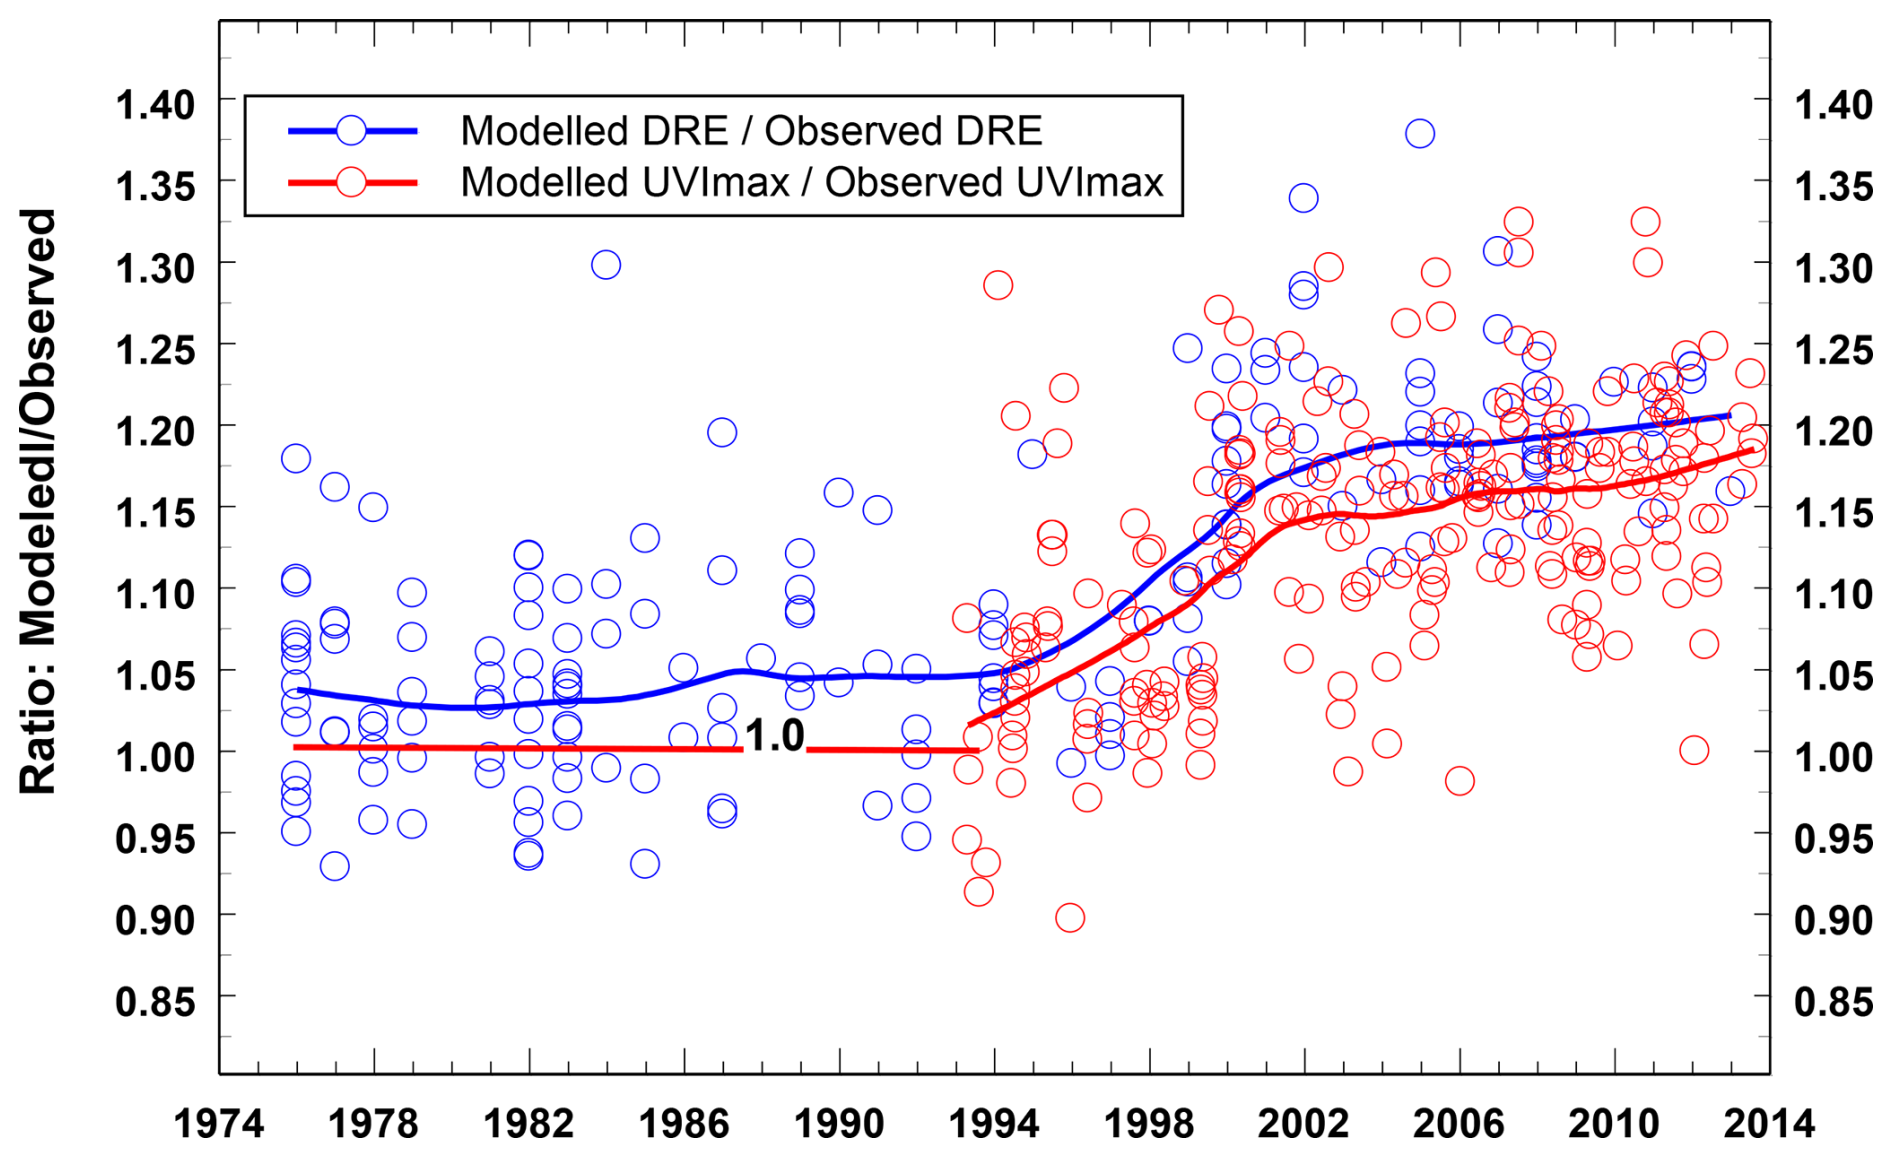
Figure 6TUV model–observation ratios for erythemal daily radiant exposures and UV index at local solar noon obtained for clear-sky days. The solid curves represent smoothed values of the ratios to be used as the correction coefficients, i.e. the multipliers applied to the raw measurements. The multipliers were set equal to 1 for 1976–1992.
UVI values were not archived between 1976 and 1992. This means that CC2 values cannot be calculated directly. However, CC2 values were assumed to be equal to 1 because the RB meter was previously adjusted to the SL501A #927 output using simultaneous measurements taken during the 1992–1994 period (Puchalski, 1995). Prior to 1992, CC2=1 could be inferred from a flat CC1 pattern based on the daily erythemal RE. Using two sets of the re-evaluated 1976–2013 data will allow us to discuss the robustness of trend calculations for the entire 1976–2023 period of the UVR measurements at Belsk (Sect. 3.3).
3.2.2 Performance of the regression models
Erythemal DREs for the period 1 January 1976 to 4 August 2013 were reconstructed with Mod1 defined by Eqs. (5) and (6). The model's constants came from the model training using the KZ data and the explaining variables (TCO3 and DCI) from the 5 August 2013 to 31 December 2023 period. The reconstructed values were compared with two sets of the re-evaluated data obtained before 5 August 2013 after multiplying raw daily erythemal RE with CC1 and CC2, respectively.
Figure 7 shows the scatterplot of the reconstructed (Mod1) versus re-evaluated erythemal DRE with CC1 (Fig. 7a) and CC2 (Fig. 7b) multipliers of the raw data for the three periods corresponding to the RB, SL501A, and KZ616 measurements, respectively. The points in Fig. 7 cluster around a line of perfect 1–1 agreement with only a few outliers. It seems that there is only a small difference between the re-evaluated daily erythemal RE and the corresponding output of Mod1 with the CC1 and CC2 multipliers. This is also supported by similar values of the descriptive statistics for the periods 1976–1992 and 1993–2013 (Table 4). It is worth mentioning that the performance of Mod1 in the period 2014–2023 is similar to that of the Brewer spectrophotometer that was found when compared with the KZ616 data (note the close values of the descriptive statistics for the summer data in column “CC=1” of Tables 4 and A1 for the “SZAN<45°” cell and column “ERYT”; for example, MAD values are equal to 5.2 % and 5.3 %, respectively).
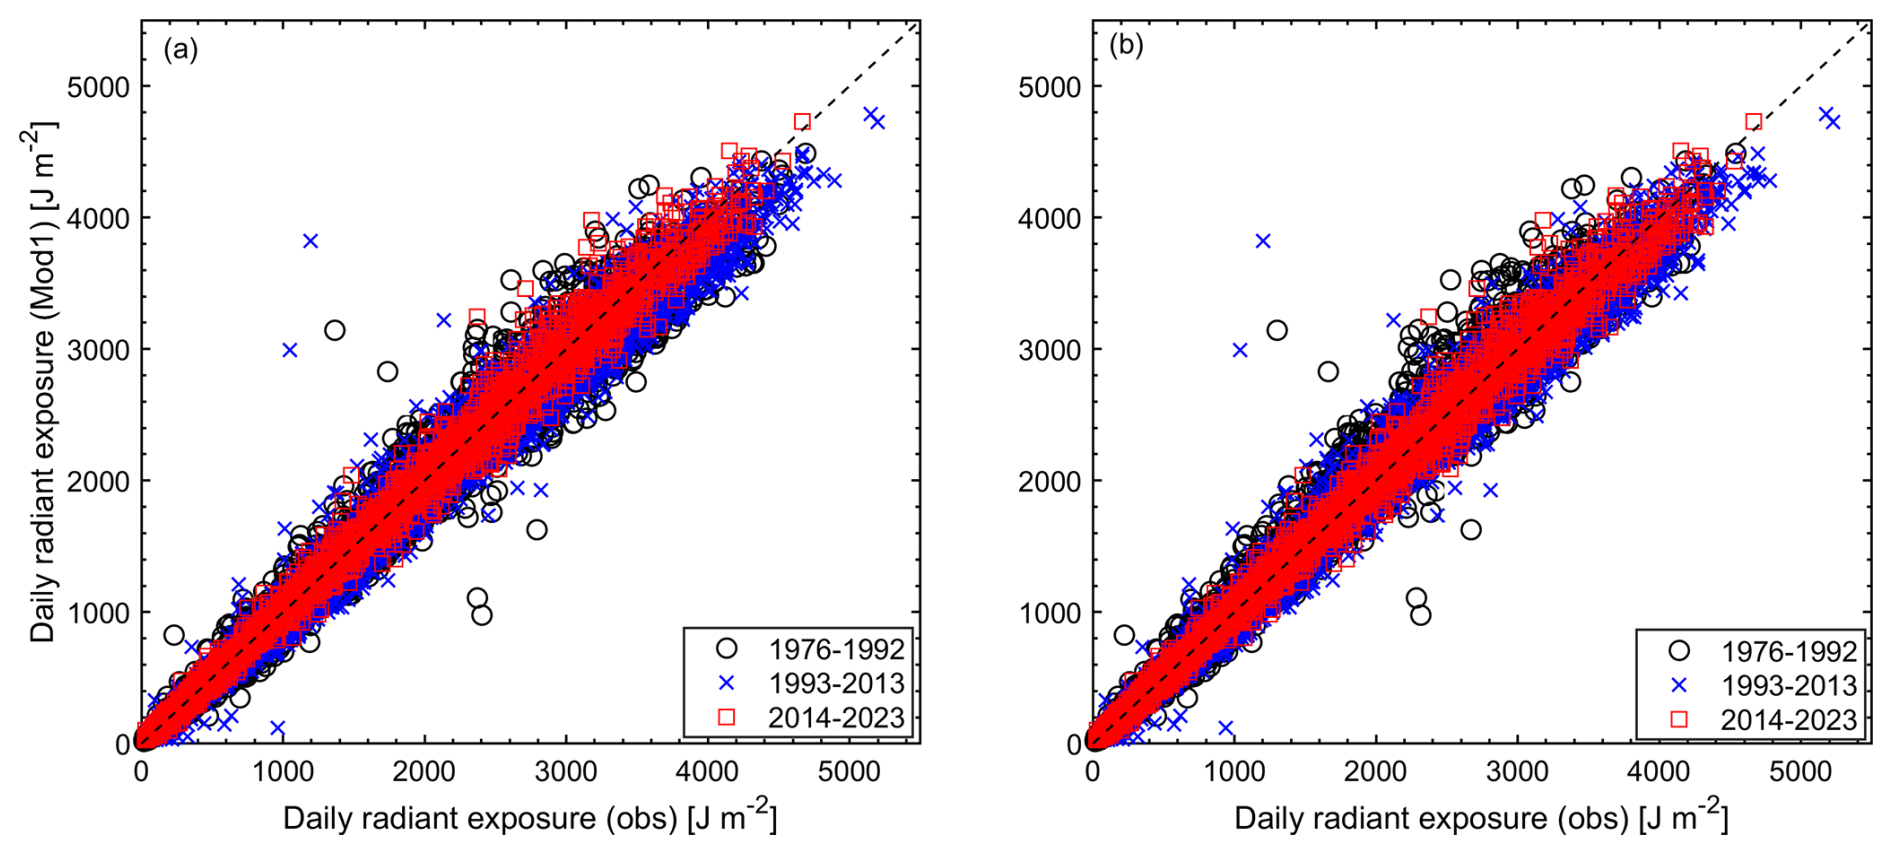
Figure 7Scatterplot of the modelled (Mod1) erythemal daily radiant exposures versus the re-evaluated observed values for 1976–1992, 1993–2013, and 2014–2023: (a) with the CC1 version of the correction coefficients for the period 1976–2013 and (b) with the CC2 version of the correction coefficients for the period 1976–2013. KZ616 measurements (2014–2023) were used without corrections.
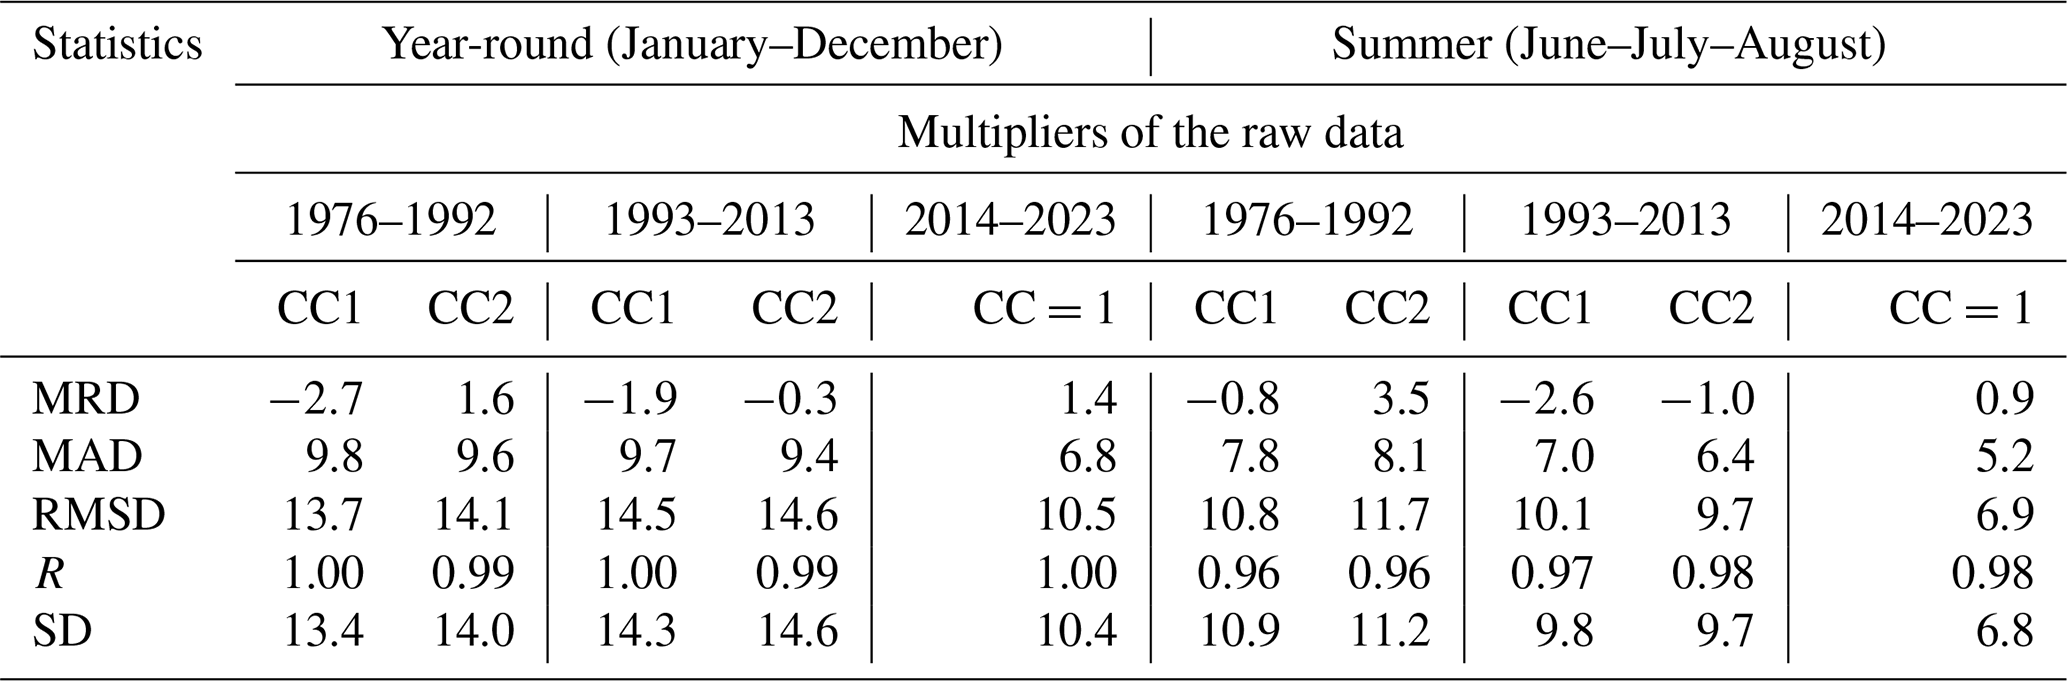
Table 4The descriptive statistics from the relative differences between daily erythemal radiant exposures, 100 % (, for the periods 1976–1992, 1993–2013, and 2014–2023. Two versions of the datasets were considered, using CC1 and CC2 multipliers on the raw measurements. For the period 2014–2023, KZ616 data were used, which did not require adjustment. The results are shown for annual (January–December) and summer (June–July–August) data.
Erythemal DRE by Mod1 can be obtained for days when the explanatory variables, TCO3 and DCI, are available from the collocated measurements at Belsk by the Dobson radiometer and pyranometer, respectively. It is therefore possible to fill gaps in the measured data and obtain a complete (1976–2023) series of erythemal DRE to be used in calculations of erythemal annual and summer (June–July–August) RE. These REs can also be calculated using the erythemal monthly RE based on Mod2 and Mod3. All these series are analysed in Sect. 3.3 for trend calculations to assess the level of uncertainty in the long-term variability of the Belsk UVR data.
Table 5 shows the values of the descriptive statistics for the three models used (Mod1, Mod2, and Mod3) and two versions of the re-evaluated data (using CC1 and CC2 multipliers on the raw data) based on the annual and summer RE. The differences between descriptive statistics (MRD, MAD, RMSD, SD) in CC1 and CC2 columns are within a few percentage points for MRD and about 1–1.5 percentage points for other statistics, indicating that the different correction methods give fairly similar results. In most cases, Mod2 and Mod3 outperform Mod1 (see Table 5), with smaller values of descriptive statistics. This is because these models are based on relative monthly differences from the respective long-term means for the periods 1976–1992, 1993–2013, and 2014–2023. These means were obtained by averaging the re-evaluated RB meter and SL501A, as well as the KZ616 data. Mod1 did not apply a constraint on the average UVR in these sub-periods.
Table 5Same as Table 4, but the descriptive statistics are calculated using time series of erythemal annual and summer radiant exposures.
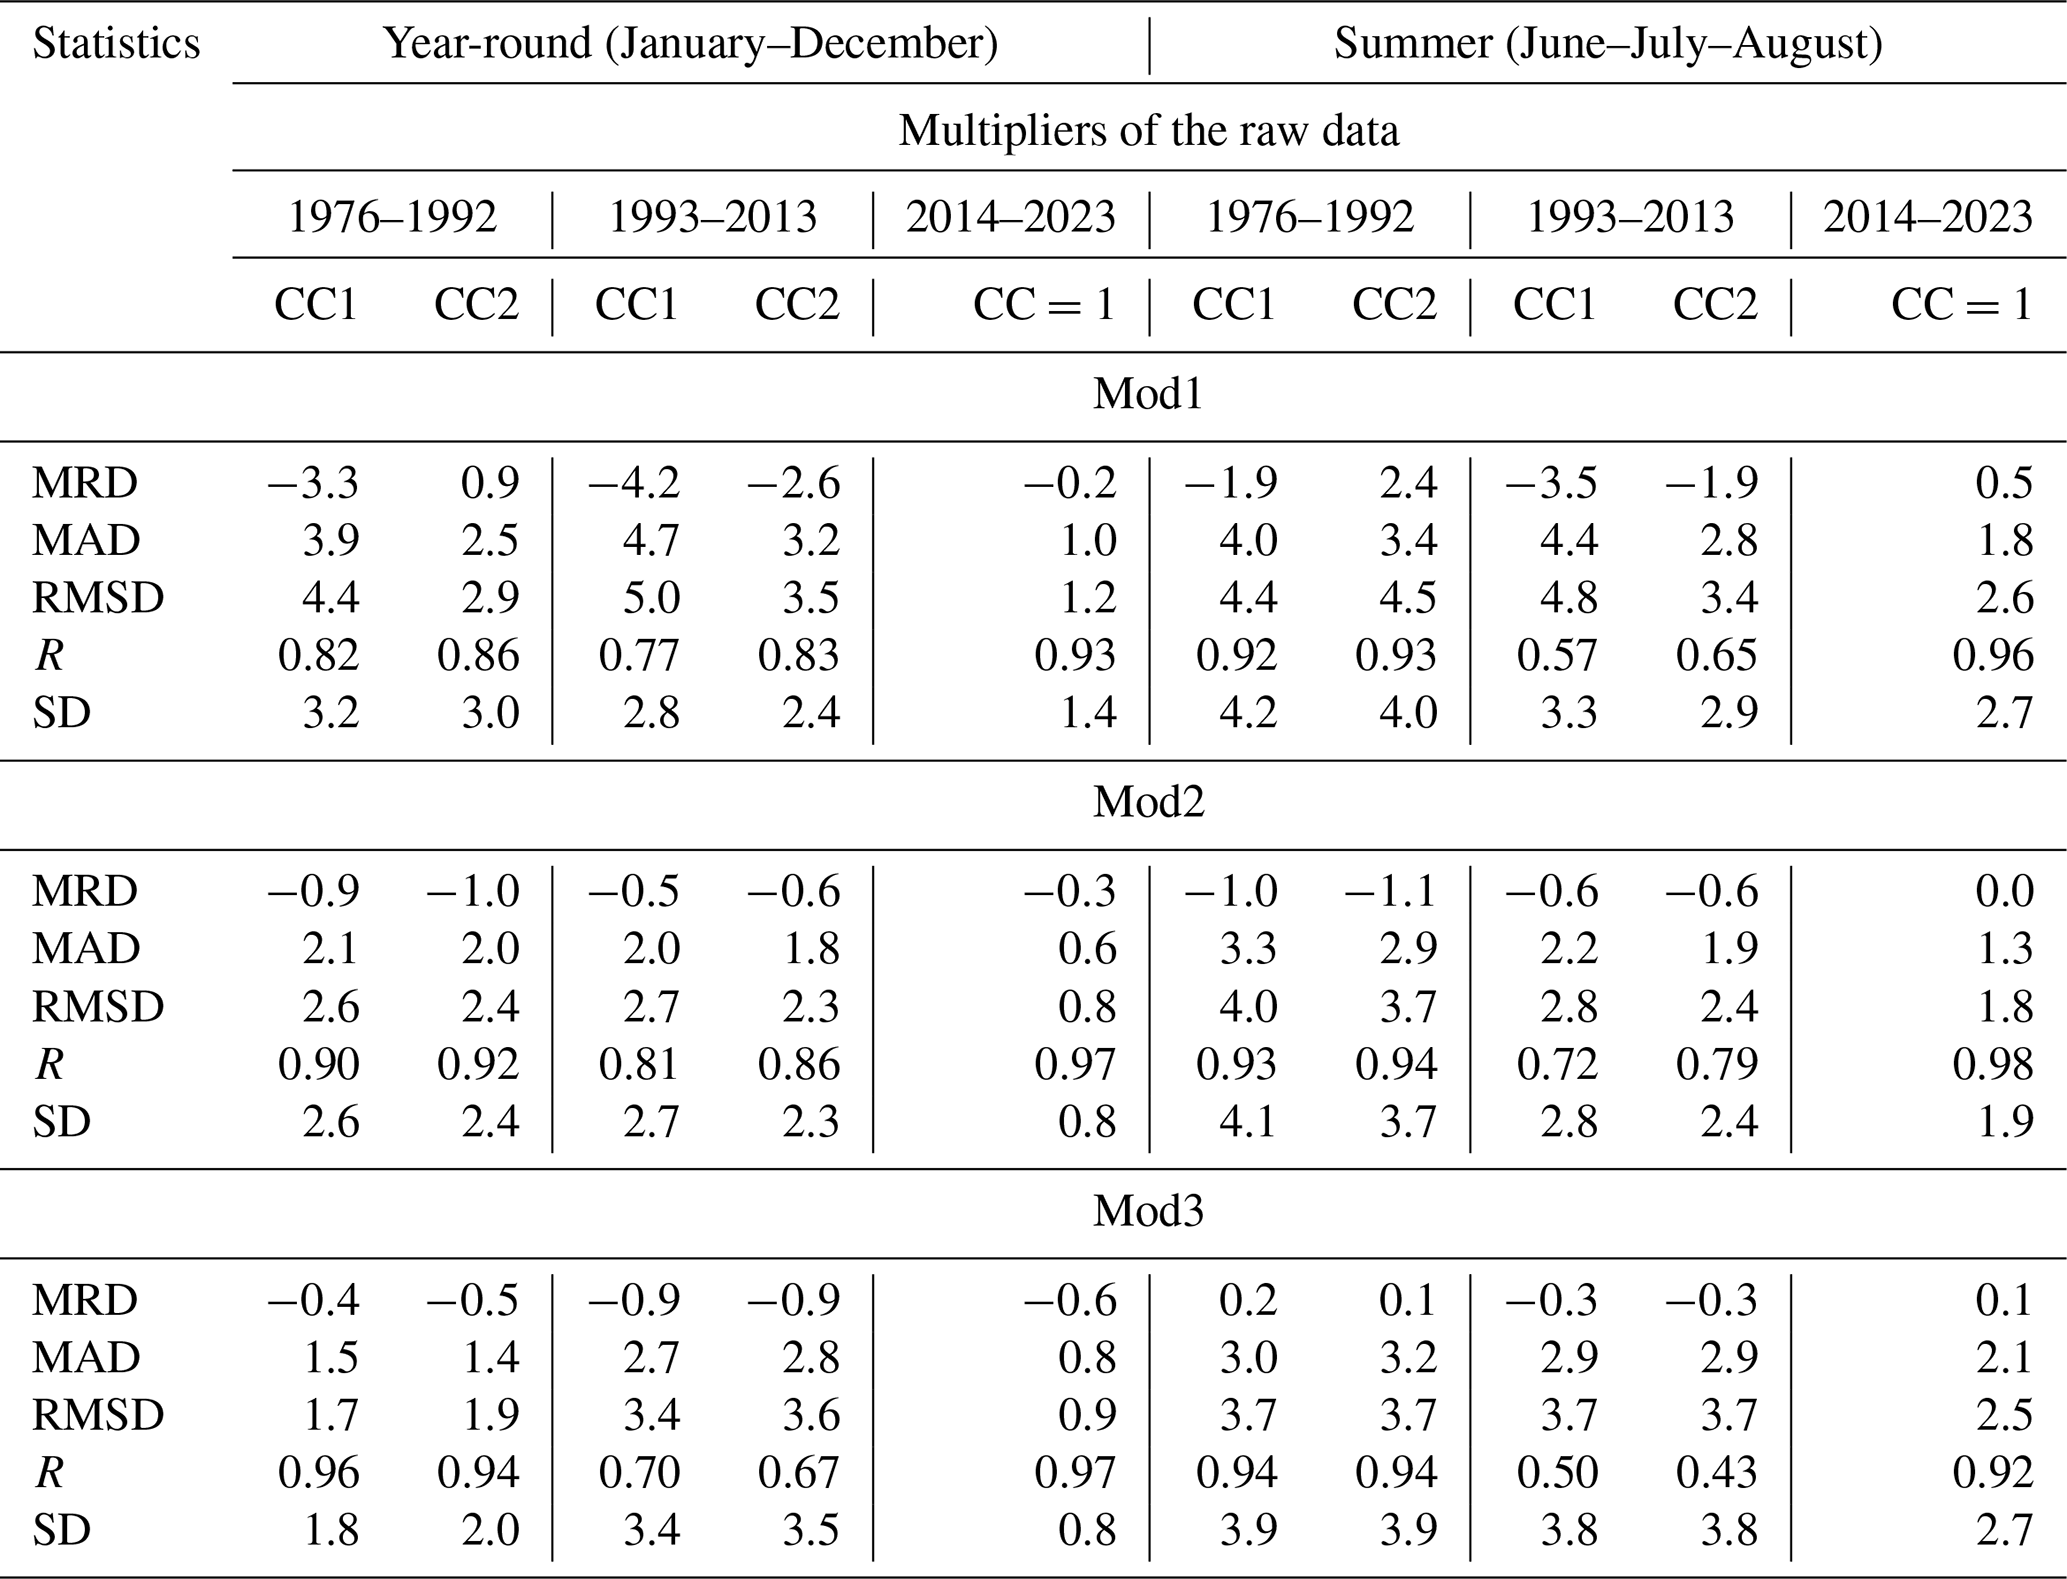
All models considered were designed to test whether changes in the primary UVR drivers, ozone and clouds, explain year-to-year UVR variability. The performance of Mod3 is surprisingly similar to that obtained from Mod2 despite the use of UVR proxies (TCO3 and DGI) from the ERA5 reanalysis.
The smallest correlation coefficients between the re-evaluated measurements and modelled values were found in the period 1993–2013 for the measurement–model pairs with the same version of the CC multipliers (CC1 or CC2). This is particularly pronounced for the summer data (see e.g. Mod3 values of 0.50 and 0.43 for CC1 and CC2 pairs, respectively), suggesting poorer agreement between measurements and the model in the period 1993–2013. This was found for all models. However, other descriptive statistics (MRD, MAD, RMSD, and SD) differed only slightly, i.e. 1.5 percentage points, when values in CC1 and CC2 columns were compared.
3.3 Trend analyses
3.3.1 The erythemal annual and summer radiant exposures in the period 1976–2023
Trend analyses are applied to the erythemal annual and summer RE based on daily RE. There are two series to be considered when dealing with the measured data. The first, labelled OBS, uses only re-evaluated observations and the monthly average is calculated when at least 14 daily ERE values are available. The second one, OBSF, contains all the daily gaps filled by Mod1 simulations. For other models used there are no gaps. In the case of Mod1, the erythemal annual and summer REs are constructed using the results of the TUV model and the CMFs estimated from the DCI values. For Mod2 and Mod3, the monthly reconstructed RE values are summed over the year and summer season.
The 1976–2023 time series for the erythemal annual and summer RE using CC1 and CC2 correction multipliers are shown in Figs. 8 and A1, respectively. Figure 8a and b are for the erythemal annual and summer RE with the use of CC1, but correspondingly Fig. A1a and b are based on CC2 values.
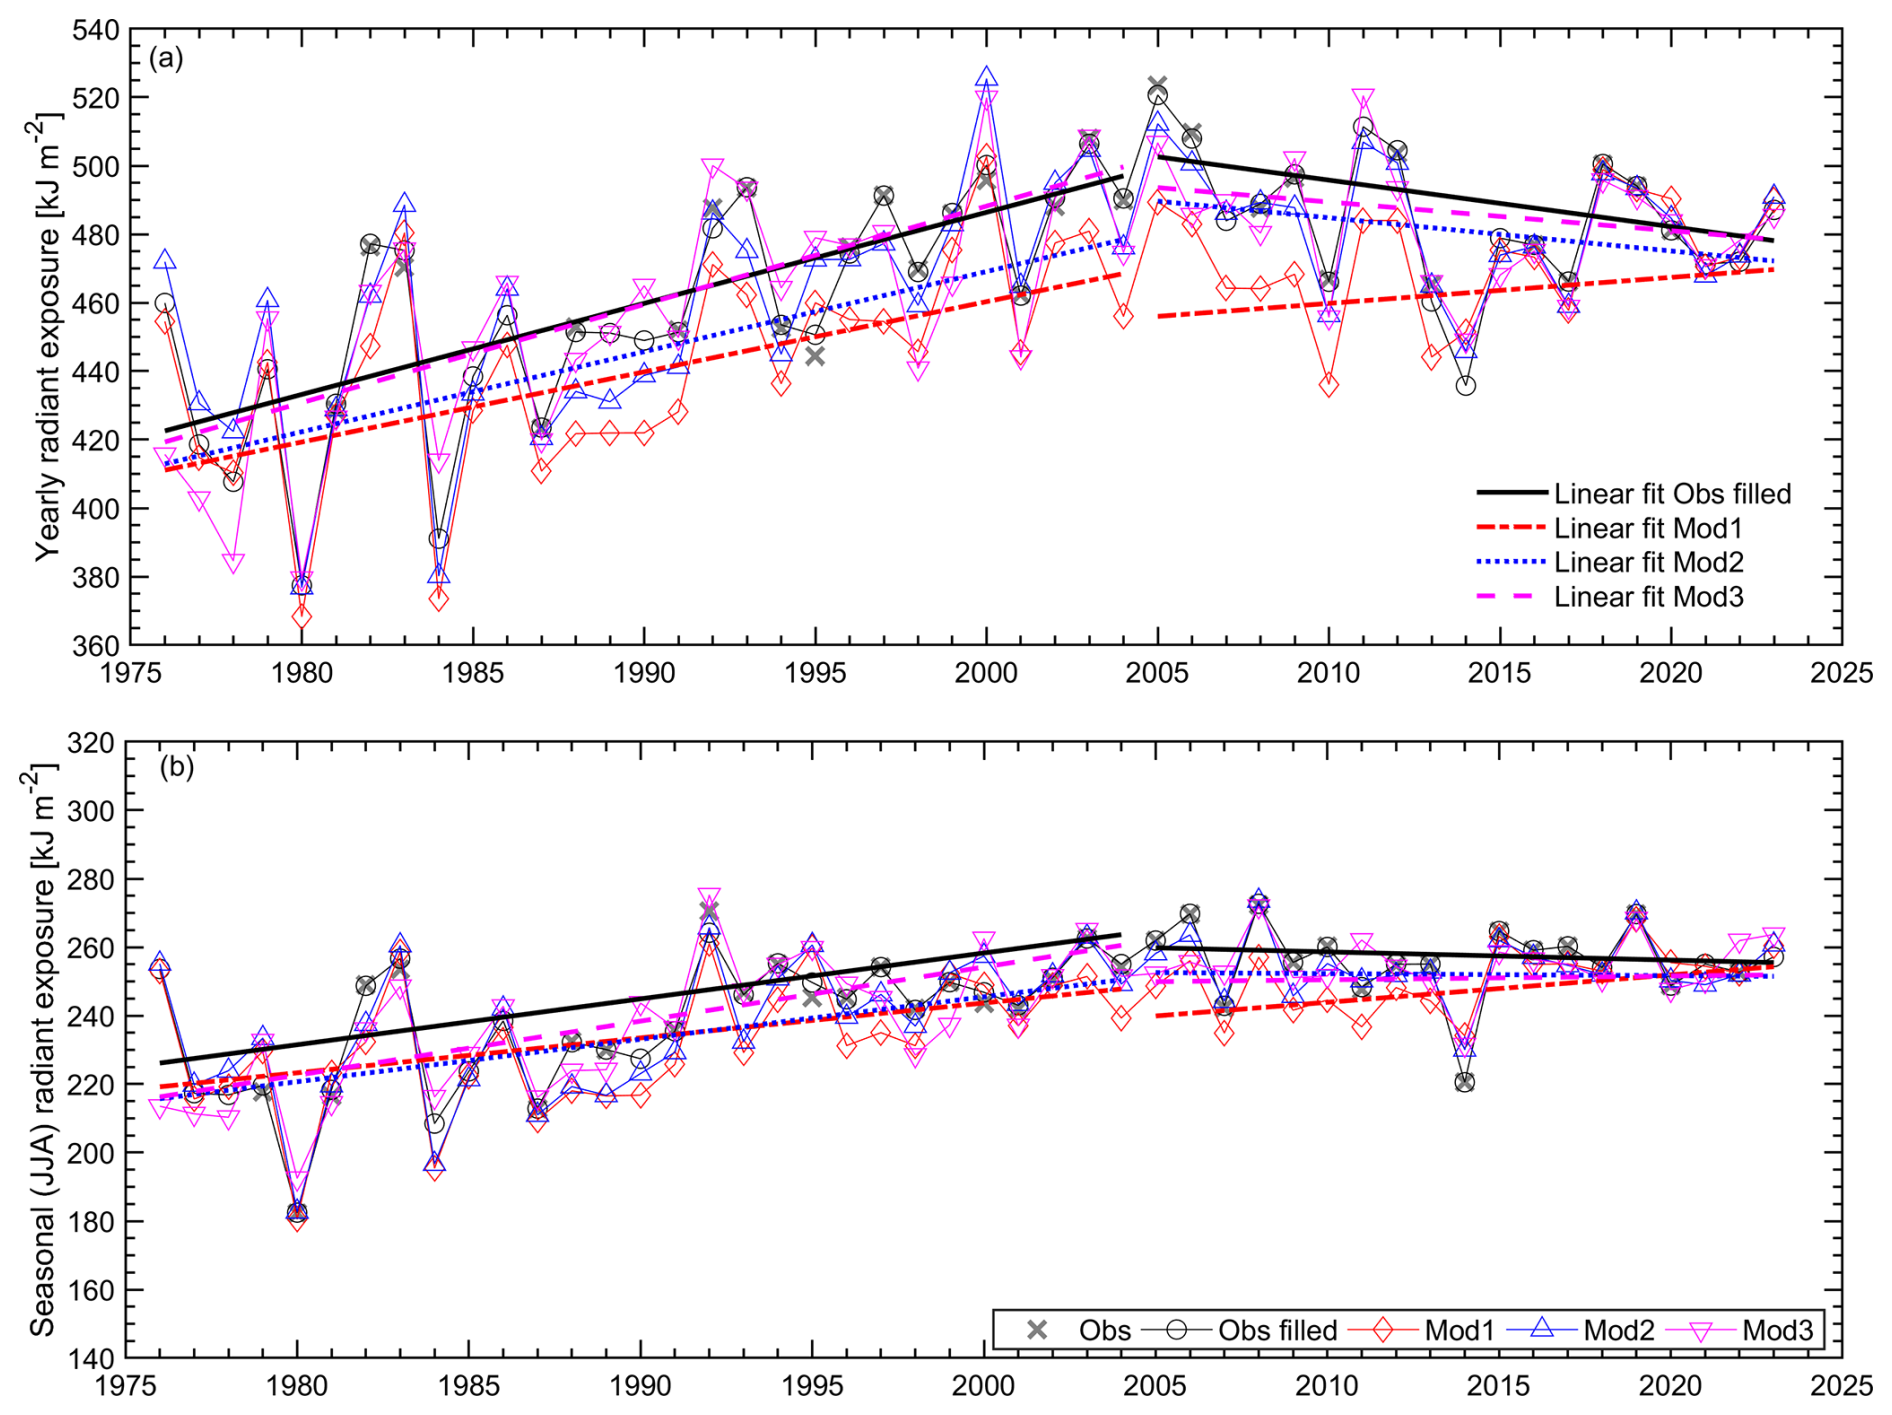
Figure 8Time series (1976–2023) of the erythemal radiant exposures from re-evaluated observations (Obs), re-evaluated observations with filled gaps (Obs filled), and model estimates (Mod1, Mod2, and Mod3) using the CC1 version of the correction coefficients: (a) annual (January–December) radiant exposures and (b) summer (June–July–August) radiant exposures. The linear trends for the periods 1976–2004 and 2005–2023 are superimposed on the respective time series.
Linear regression lines are superimposed on the graphs to illustrate the long-term variability in the time series. Two independent lines are drawn to account for a change in the trend pattern observed in the time series somewhere in the early 2000s. The year of the trend change was calculated by examining the performance of 15 combinations of this two-line pattern, varying the year of the trend change point (from 1995 to 2009). The best fit with maximum coefficients of determination was found for the trend change point in 2005. Therefore, the slopes of the regression lines (in ) and the trend values (in % yr−1) shown in Tables 6 and 7, respectively, are calculated for the 1976–2004 and 2005–2023 periods. Standard errors of the trend estimates are calculated according to Eq. (15), accounting for the correction for the autocorrelation in the trend residuals if the autocorrelation coefficient with a 1-year lag, Rk+1, is positive (also shown in Tables 6–7).
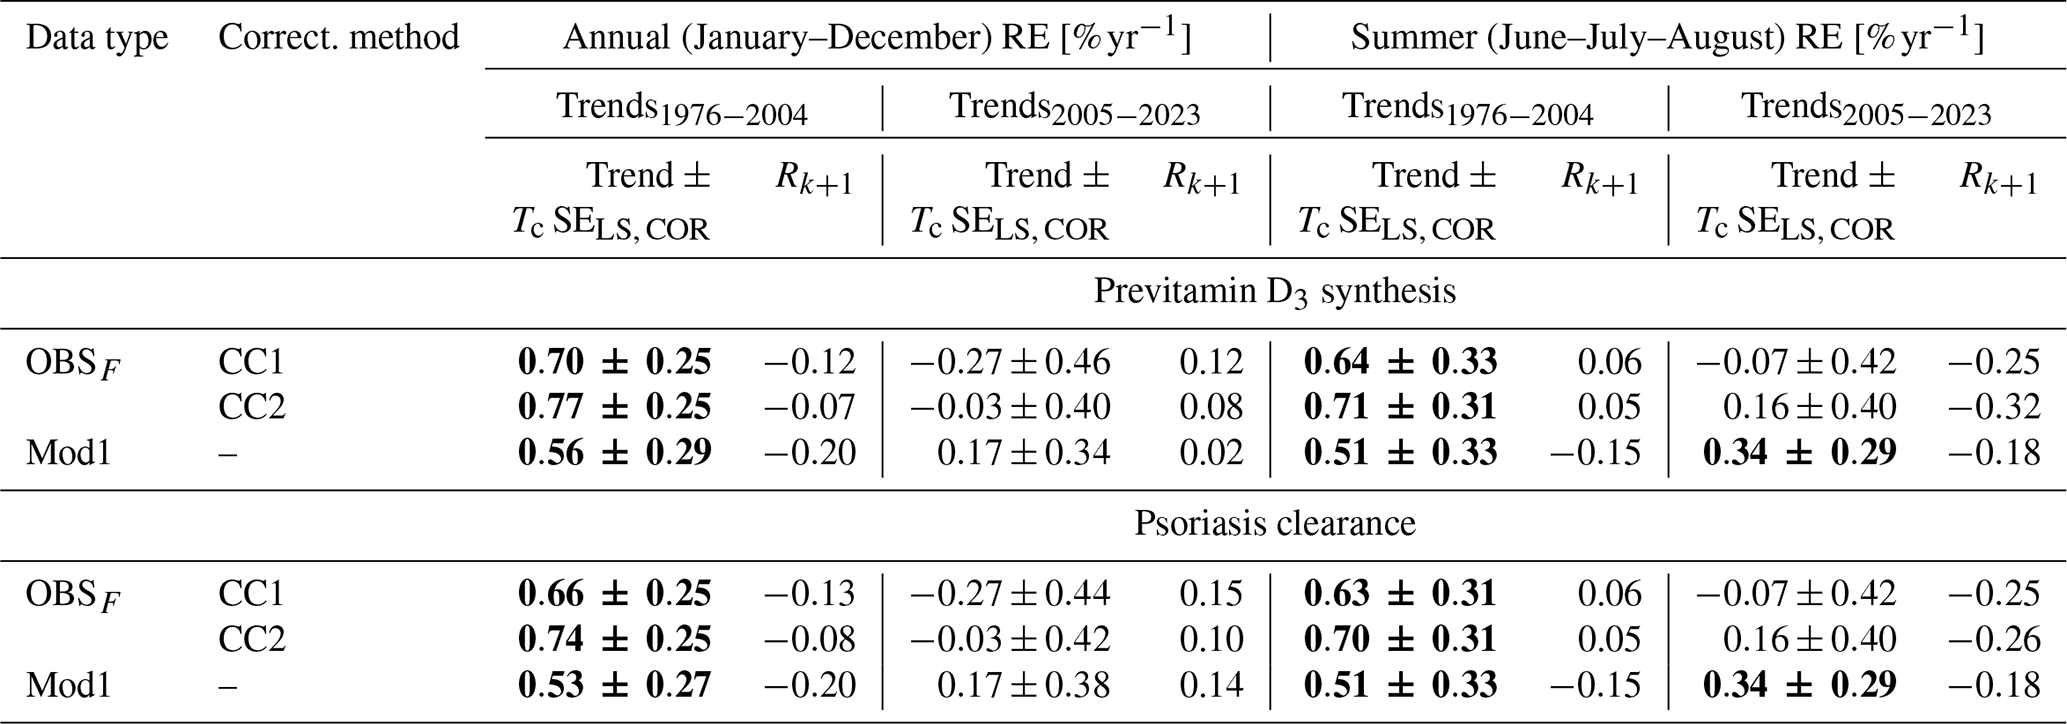
Table 6Trends () by the linear least-squares fit to the time series of erythemal annual and summer radiant exposures shown in Figs. 8 and A1 calculated for the periods 1976–2004 and 2005–2023. SELS, COR denotes the standard error of the trend estimate taking into account the autocorrelation Rk+1 (with a lag of 1 year) in residuals of the trend model. Bold font indicates a statistically significant trend value at the 95 % confidence level based on the standard error of the trend multiplied by the corresponding critical value of the Student's t test (Tc) for a two-sided probability. For the periods 1976–2004 and 2005–2023, Tc is 2.05 and 2.10, with 28 and 18 degrees of freedom, respectively.
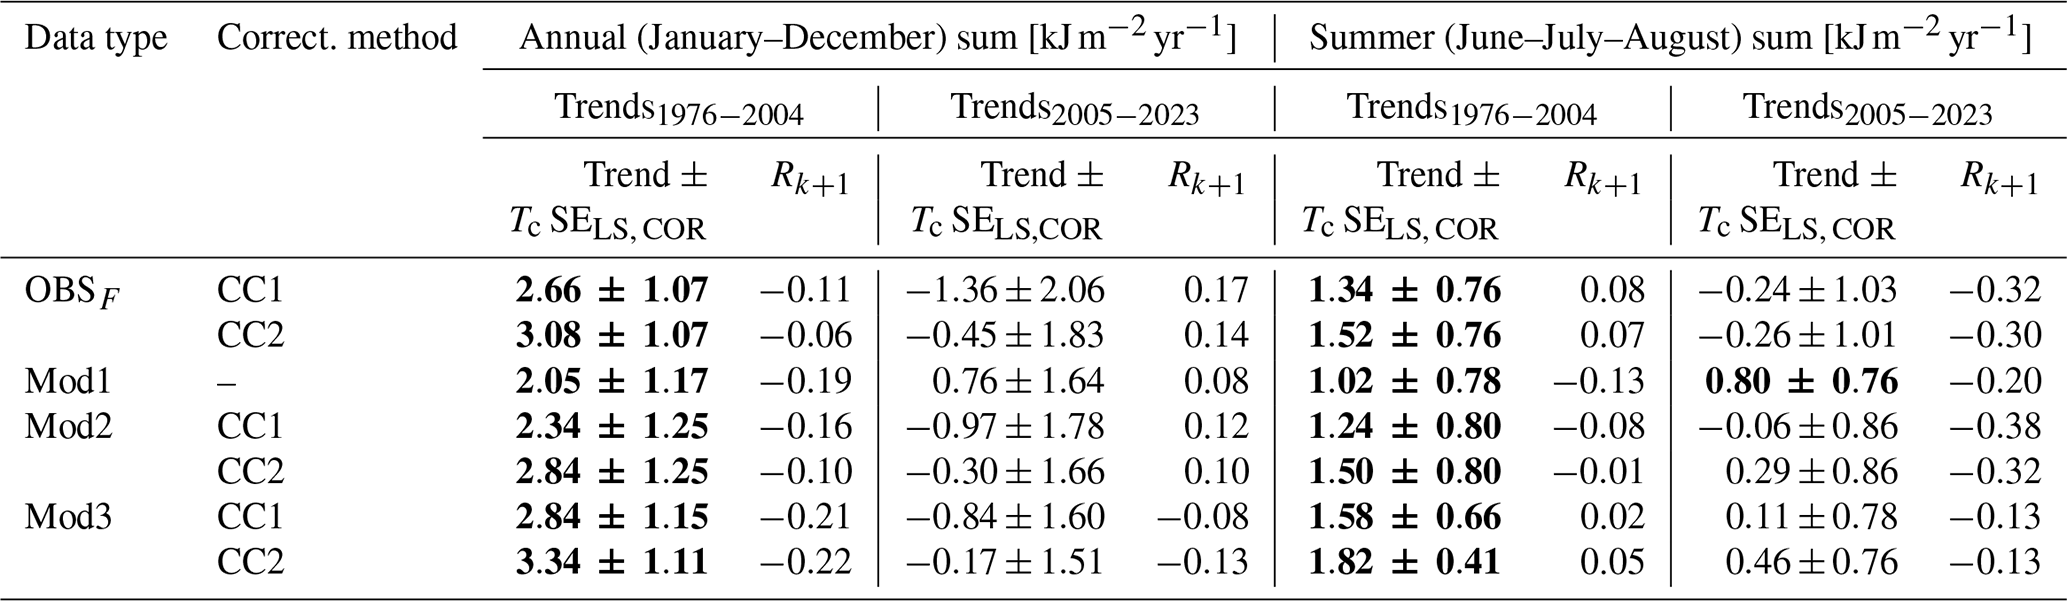
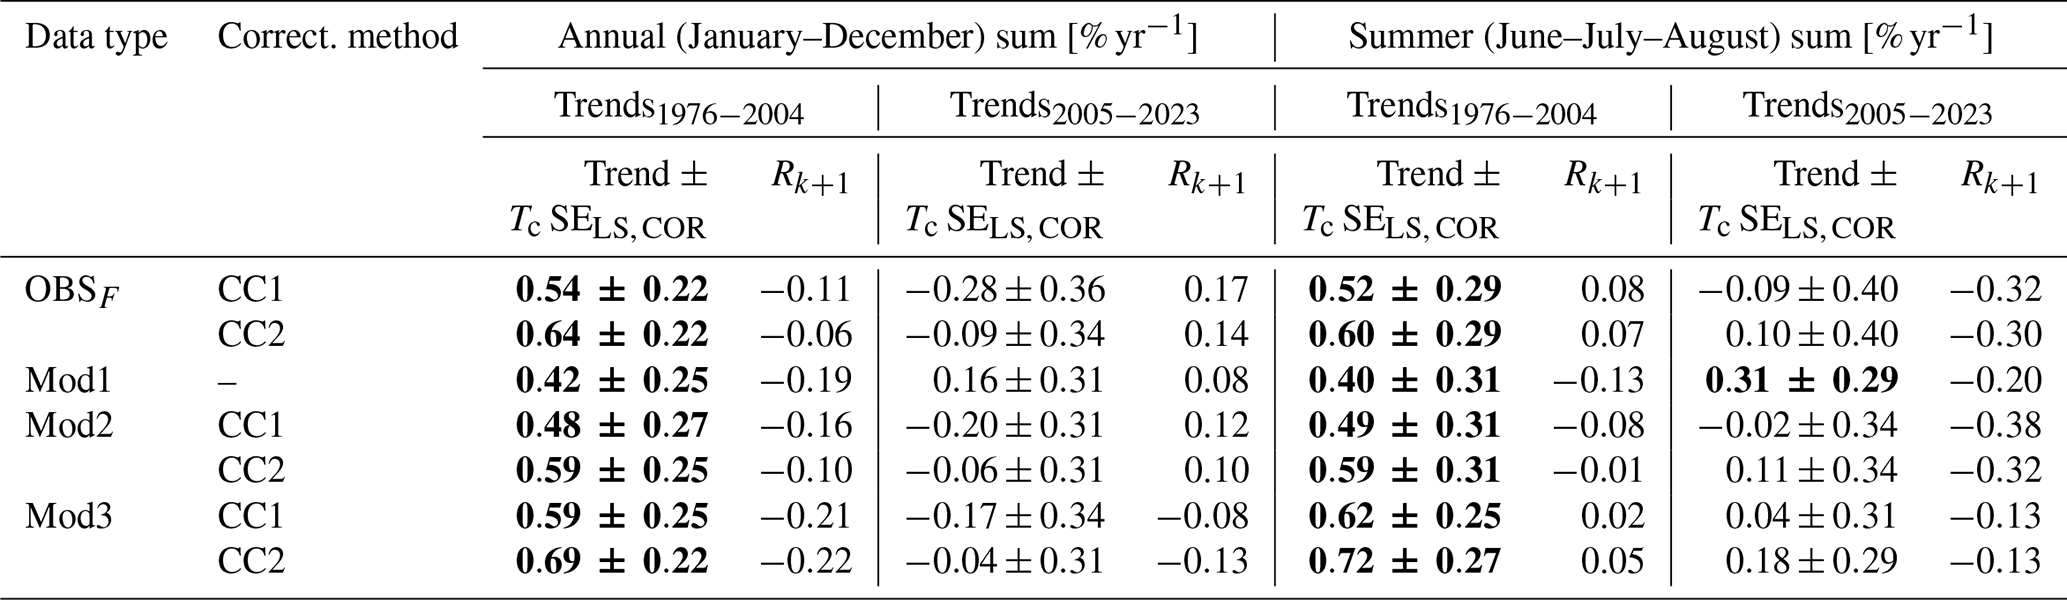
Table 7Same as Table 6, but the results are for the trend values expressed in % yr−1.
The interannual variations and trend lines of erythemal annual RE are close to each other when comparing the upper graphs in Figs. 8 and A1. This can also be observed for the summers when comparing the corresponding lower plots. At the beginning of the RB observations (1976–1986), there were large oscillations from year to year, suggesting an instrumental problem with the data. As TCO3 and cloud transparency data are available, it is important to analyse whether these large fluctuations are due to one or both of these two factors.
The slopes of the linear fit to the analysed time series (Table 6) show a statistically significant positive trend between 1976 and 2004 of around 20–30 kJ m−2 and 10–20 kJ m−2 per decade in the annual and summer data, respectively. The trends are mostly insignificant for the period 2005–2023, with only one exception (for the Mod1 data) with a continued positive trend of ∼10 kJ m−2 per decade. The corresponding trend values expressed in dimensionless units (Table 7) have the same values of about 4 %–7 % per 10 years in the former period for both the annual and summer time series. In the latter period, the positive summer trend from Mod1 is ∼3 % per 10 years. Mod1 and Mod3 (with CC2) gave the lowest and highest trends, respectively. However, the differences between these trends are within the range of the uncertainty of the trend estimates at the 95 % confidence level (as given by Tc SELS, COR values in Table 7).
By averaging all available statistically significant annual and summer trend values shown in the third and seventh columns of Tables 6 and 7, the following trends and standard errors are obtained: for the period 1976–2004, 27.4 ± 4.4 kJ m−2 and 5.64 % ± 0.92 % per decade for the erythemal annual RE; 14.3 ± 4.3 kJ m−2 and 5.63 % ± 1.03 % per decade for the erythemal summer RE. These values correspond to the average trend from the two series based only on the re-evaluated measurements (OBSF values in the tables), i.e. 28.7 kJ m−2 and 5.9 % per decade for the erythemal annual RE and 14.3 kJ m−2 and 5.6 % per decade for the erythemal summer RE.
3.3.2 The vitamin D3 and antipsoriatic annual and summer radiant exposures in the period 1976–2023
The commercial EBRs used to monitor erythemal irradiance can also measure non-erythemal irradiance (Czerwińska and Krzyścin, 2024a). Figure 4 and Table A1 show that the daily vitamin D3 and antipsoriatic RE derived from the KZ616 measurements agree with the directly measured BS64 values, as do the erythemal data obtained with KZ616. This supports the method of the transfer from erythemal irradiance to non-erythemal irradiance proposed by Czerwińska and Krzyścin (2024a).
Figure 9 shows the time series of annual and summer values of previtamin D3 synthesis and psoriasis healing RE from 1976 to 2023. It appears that these time series are very similar. In addition, these time series are similar to the erythemal series shown in Fig. 8. The correlation coefficients between the pairs of time series shown in Figs. 8 and 9, i.e. erythema and vitamin D3, erythema and psoriasis, and vitamin D3 and psoriasis, were in the range with the lowest value for the erythema and vitamin D3 as well as erythema and psoriasis pairs when the summer data from Mod1 simulations were considered.
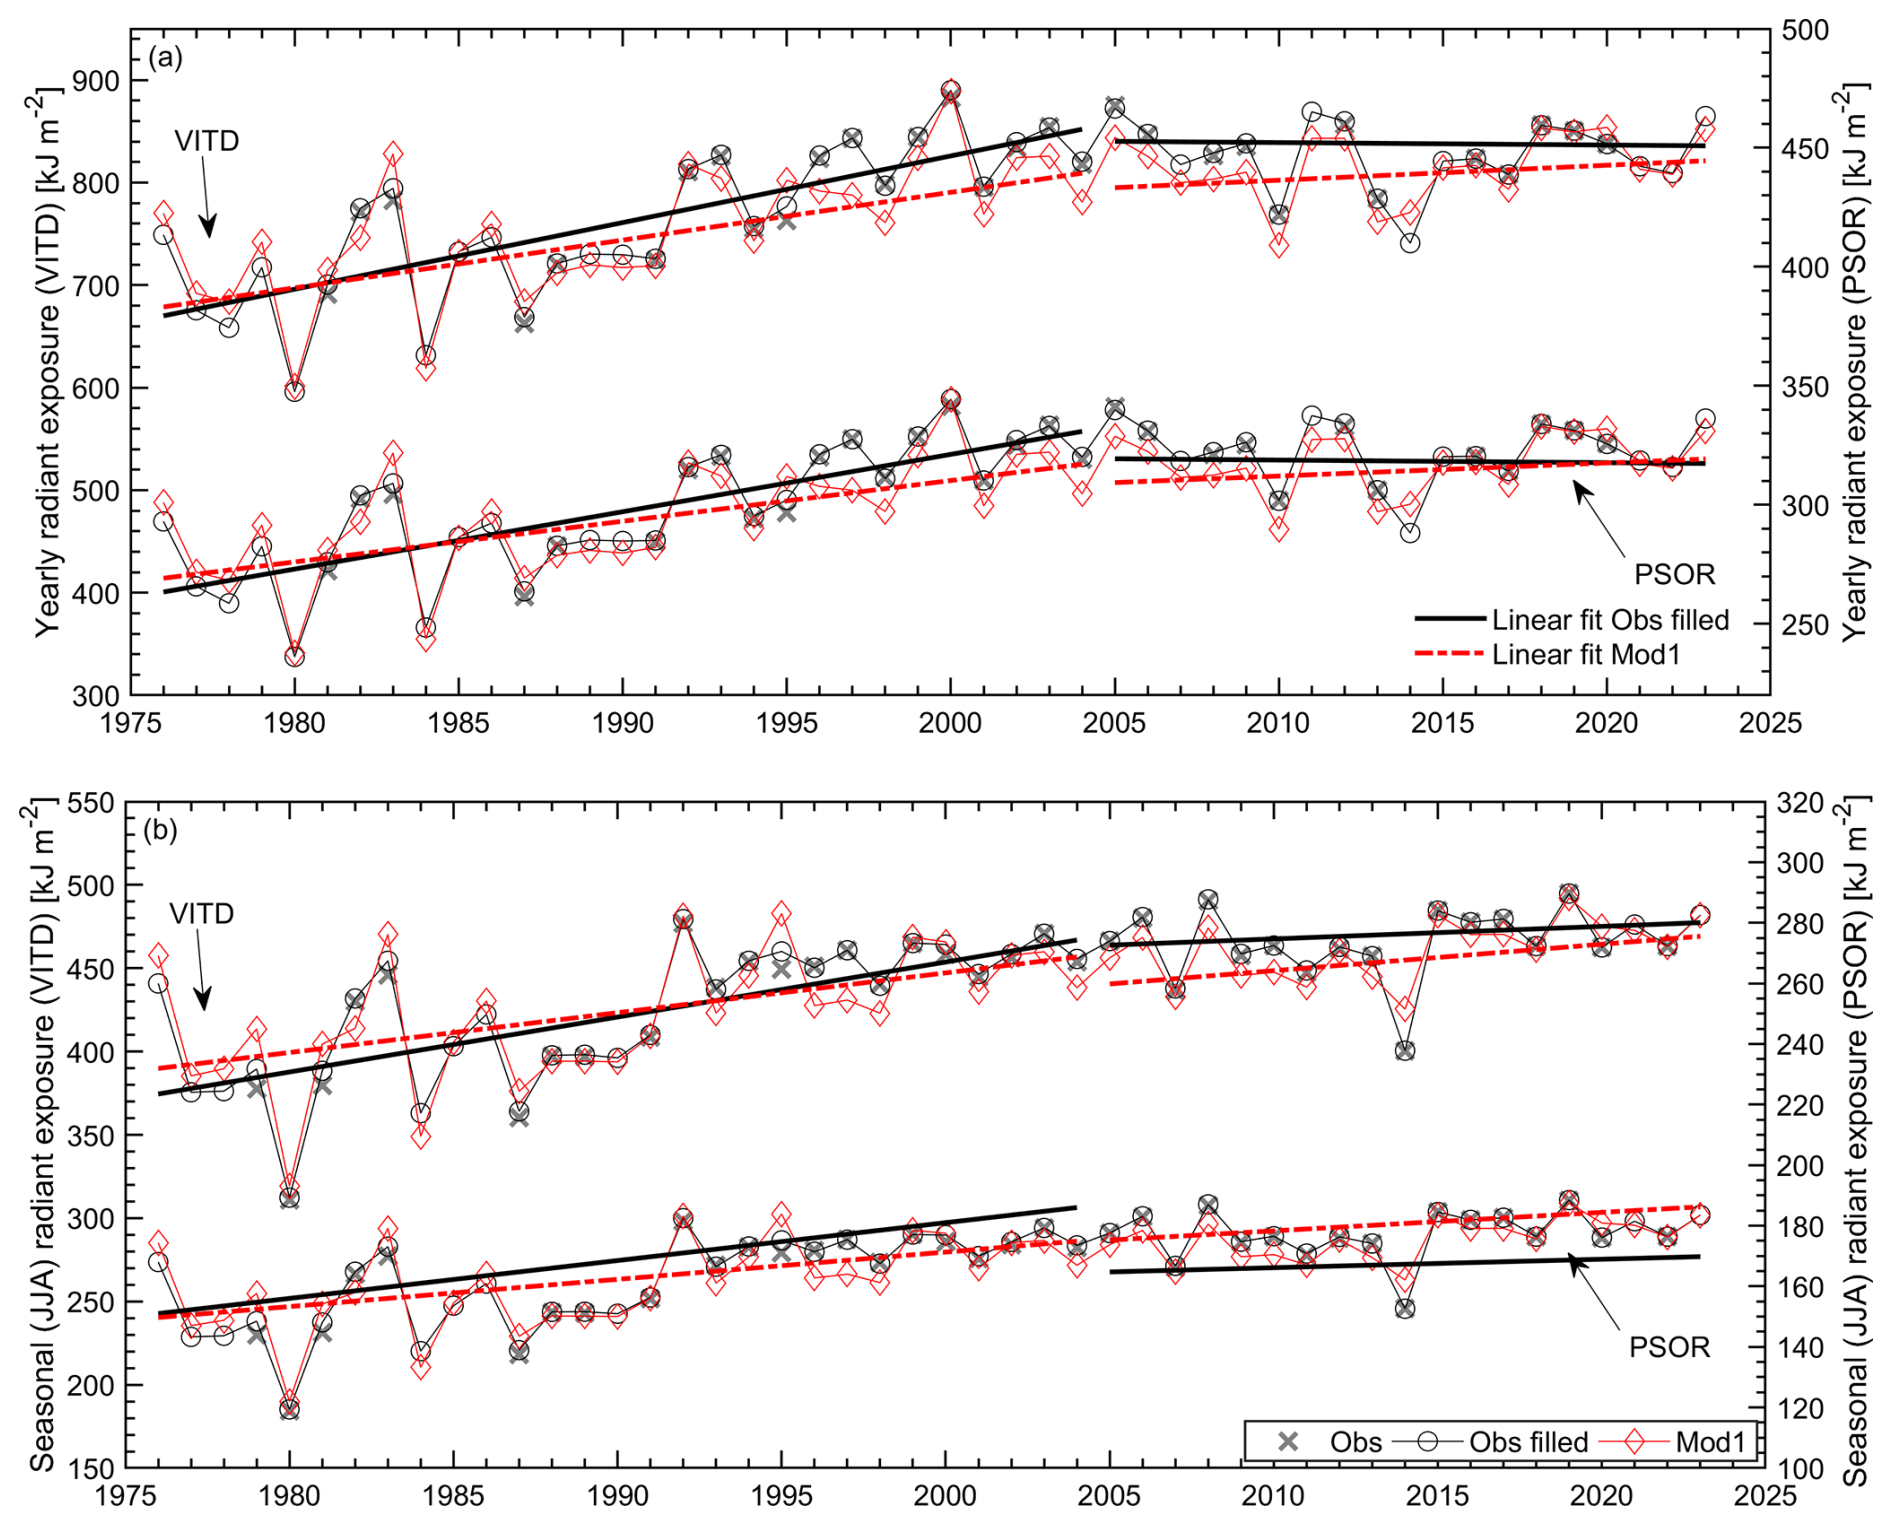
Figure 9Time series (1976–2023) of the previtamin D3 synthesis and psoriasis healing radiant exposures from re-evaluated observations (Obs), re-evaluated observations with filled gaps (Obs filled) using the CC2 version of the correction coefficients, and Mod1 estimates (Mod1): (a) annual (January–December) radiant exposures and (b) summer (June–July–August) radiant exposures. The linear trends for the periods 1976–2004 and 2005–2023 are superimposed on the respective time series.
Table 8 shows the trend values for the period 1976–2004 and 2005–2023 from the time series calculated using the erythemal DRE multiplied by the transfer coefficients defined by Eq. (4). The transfer coefficients depend on only two parameters (TCO3 and SZA), even on cloudy days, as previously shown by Czerwińska and Krzyścin (2024a). The statistically significant trend values for previtamin D3 synthesis and psoriasis clearance are slightly higher, by about 1–1.5 percentage points per decade, than the corresponding trend values for the erythema shown in Table 7. Taking into account the uncertainty of the trend estimate of about 3 % per decade, it cannot be said that the differences between the trends are statistically significant.
Table 8Same as Table 7, but trend values are for previtamin D3 synthesis and psoriasis clearance.
Belsk is a unique observatory where UVR monitoring has been accompanied by monitoring of ozone (TCO3), aerosol optical properties (AOD), and cloud characteristics (sunshine duration, DCI from global solar irradiance measurements), i.e. basic input parameters to a radiative transfer model allowing reconstruction of the erythemal RE. In addition, collocated BS64 measurements of UVR spectra are used in the frequent (every month) checking of actual KZ616 performance. BS64 spectral measurements also allow assessment of the quality of the Czerwińska and Krzyścin (2024a) retrieval to convert standard erythemal measurements to the non-erythemal BE irradiance (see the cases of the vitamin D3 and antipsoriatic DRE in Fig. 4).
Two sets of raw UVR data multipliers (CC1 and CC2 as defined in Sect. 2.3.2) have been proposed to correct and homogenise the time series of erythemal data. The re-evaluated time series appear to be quite similar; i.e. the difference between these series is within a few percentage points (Tables 4 and 5). There was no need to re-evaluate the KS616 data for the period 2014–2023 because they agreed well with the BS64 data (Figs. 3 and 4).
Regression models trained on the KZ616 data for the period 2014–2023 allowed the data to be reconstructed from the beginning of UVR observations at Belsk. These reconstructed series allowed independent examination of the pattern of interannual variability (which was unexpectedly large before 1985) and trends in the erythemal annual and summer RE. The regression models generally mimic the observed long-term variability in the re-evaluated daily erythemal exposures. The statistically significant trend of ∼6 % per decade with the standard error of ∼1 % per decade for the period 1976–2005 is calculated (for both erythemal annual and summer RE) by averaging trends from the sample of seven versions of trend estimates from re-evaluated and reconstructed data (Table 7). All individual trend values in Table 7 are within the range 6 % ± 2 % (i.e. there is no outlier in this trend sample).
The uncertainty (at the 95 % confidence level) of the individual trend estimates for the period 1976–2005 (Table 7) is about 2 %–3 % per decade, i.e. quite close to double the standard error of the mean trend derived from the sample. This supports the robustness of the trend estimates in annual and summer RE for the 1976–2005 parts of the Belsk time series. In addition, it also appears that the correction methods applied to the 1976–2013 raw UVR data, based on the comparisons of clear-sky erythemal DRE (CC1 method) and noon UVI (CC2 method), lead to differences in the individual 1976–2005 trend estimates of only about 1 % per decade (see Table 7 for the trend differences between pairs of OBSF with Mod2 and Mod3 calculated with the CC1 and CC2 correction applied to the raw time series).
We found that our DRE estimates for all biological effects considered (erythema, vitamin D3, and psoriasis) were close to those obtained from the Brewer spectra with a bias of % and a standard deviation of ∼9 % (Table A1) for the part of the year when UVR is of particular interest, when SZA at local solar noon is less than 45° (i.e. below the shadow length), according to the so-called shadow rule for protection against high UVR (Downham, 1998).
Krzyścin et al. (2011) found a trend of 5.6 % ± 0.9 % (1σ) per decade in the erythemal annual RE for the period 1976–2008. This is in good agreement with the present trend estimate, regardless of the very different correction methods used. The correction of the SL501A data carried out in 2011 was based on simultaneous measurements with KZ616 for the period 2008–2009 and further corrections for the instrument ageing using TUV cloudless sky simulations.
Similar trend estimates for erythemal radiation can be inferred from the reconstructed erythemal time series for the Moscow region based on the UVR measurements by the broadband (300–380 nm) radiometer (Chubarova et al., 2018) and the statistically reconstructed erythemal radiation series for Hradec Kralowe (Čížková et al., 2018). For the Moscow region, the authors reported a statistically significant positive trend of more than 5 % per decade for the period 1979–2015. Volpert and Chubarova (2021) revealed a decadal trend in the reconstructed erythemal UV irradiance over the Moscow region for the warm season (May–September) of 5.1 % ± 1.1 % per decade in the period 1979–2016. Estimates from the smoothed pattern of annual erythemal exposures taken from Fig. 2c by Čížková et al. (2018) for 1976 (∼1.20 kJ m−2 for the annual mean of erythemal daily RE) and 2005 (∼1.40 kJ m−2) give a trend of ∼5 % per decade for the period 1976–2004. From around 2005, both time series show a levelling off. Trends calculated here from the RE time series for other biological effects (previtamin D3 synthesis and psoriasis lesion clearance), using an approach analogous to that used for the erythema data, show very similar trends.
All data have been published as free-access TXT files and are made available through the PANGEA repository at https://doi.org/10.1594/PANGAEA.972139 (Krzyścin et al., 2024) and the IG PAS Data Portal repository: https://doi.org/10.25171/InstGeoph_PAS_IGData_ Biologically_Effective_Solar_Radiation_Belsk_1976_2023 (Krzyścin, 2024). ERA5 data are publicly accessible at https://doi.org/10.24381/cds.bd0915c6 (ERA5, 2025). MERRA-2 data are accessible at https://doi.org/10.5067/Q9QMY5PBNV1T (GMAO, 2025). Coefficients of the linear regression are calculated by the fitlm(x, y) function from MATLAB (The MathWorks, Inc.) software version R2018a.
It is generally accepted that the use of a sample of time series containing different possible realisations of a time series increases the reliability of the results compared to the analysis of a single time series. Therefore, this study includes seven time series (refer to the number of analysed time series shown in Table 7) to discuss the reliability of year-to-year variability and trends in annual and summer biologically effective radiant exposures. This is beneficial for evaluating the quality of the data and establishing confidence in the results. Data archived in PANGEA (Krzyścin et al., 2024) and in the IG PAS Data Portal (Krzyścin, 2024), together with the results of three regression models, form the reliable basis for analysing UVR time series at Belsk for the period 1976–2023. The long-term variability of erythemal radiation calculated for Belsk corresponds to that previously recorded at distant stations in central/eastern Europe, making results of these future analyses applicable to wider areas. For example, the daily characteristics of BE radiation at Belsk seem to allow the development of scenarios for outdoor human activities, enabling people to obtain the maximum health benefits from sunbathing while minimising the risk of erythemal overexposure.
Table A1 presents descriptive statistics (defined in Sect. 2.4) of the relative differences between biologically effective DRE measured by the KZ616 and the BS64: 100 % (. The vitamin D3 and antipsoriatic RE were reconstructed from the erythemal RE (Sect. 2.3.3), but the Brewer RE values were calculated using the daily integral of the measured spectral irradiance weighted by the action spectra (Fig. 1). Figure A1 shows the time series (1976–2023) of the re-evaluated and reconstructed Belsk annual and summer radiant exposures, obtained using the CC2 version of the correction coefficients. A comparison of Figs. A1 and 8 (which was obtained using the CC1 version) reveals that the two versions produce very similar time series.
Table A1Descriptive statistics of the 2014–2023 relative differences between the daily biologically effective radiant exposure with the Kipp & Zonen erythema radiometer (UV-S-AE-T #30616) and the Brewer spectrophotometer #064 in percent of the Brewer data for the different SZA ranges at local solar noon.
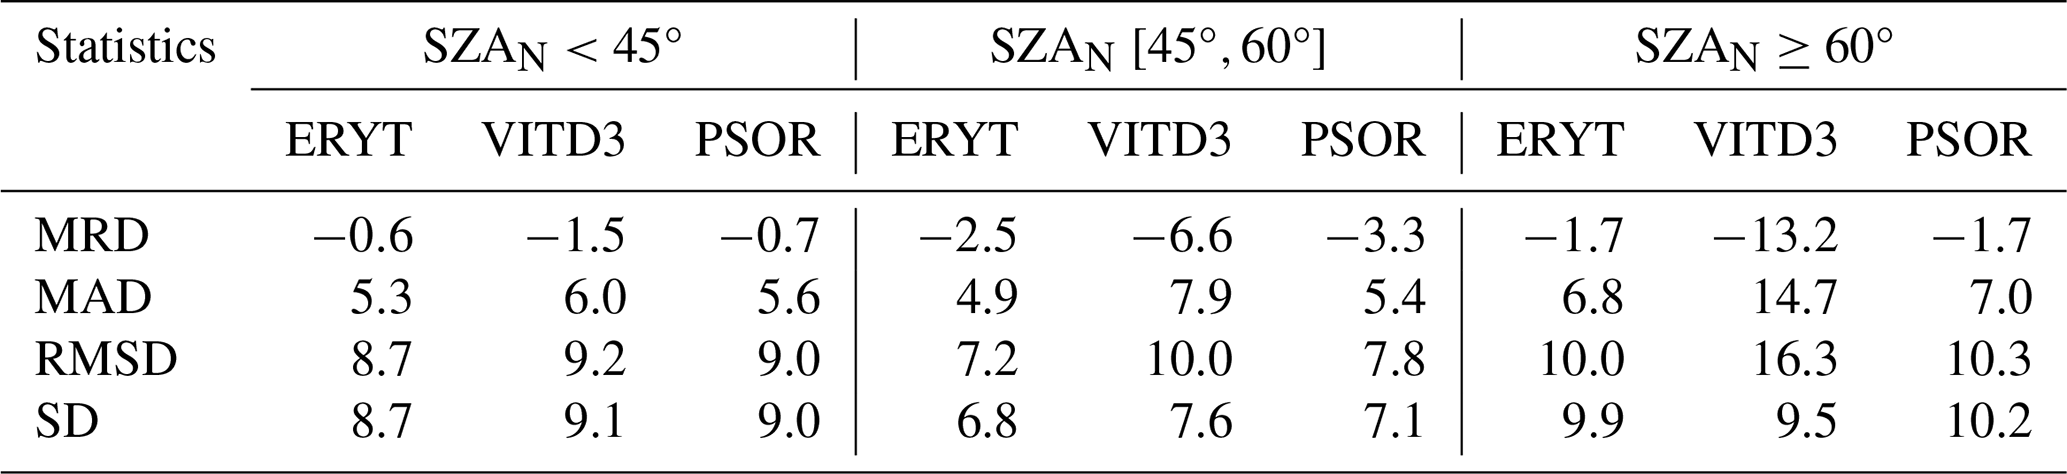
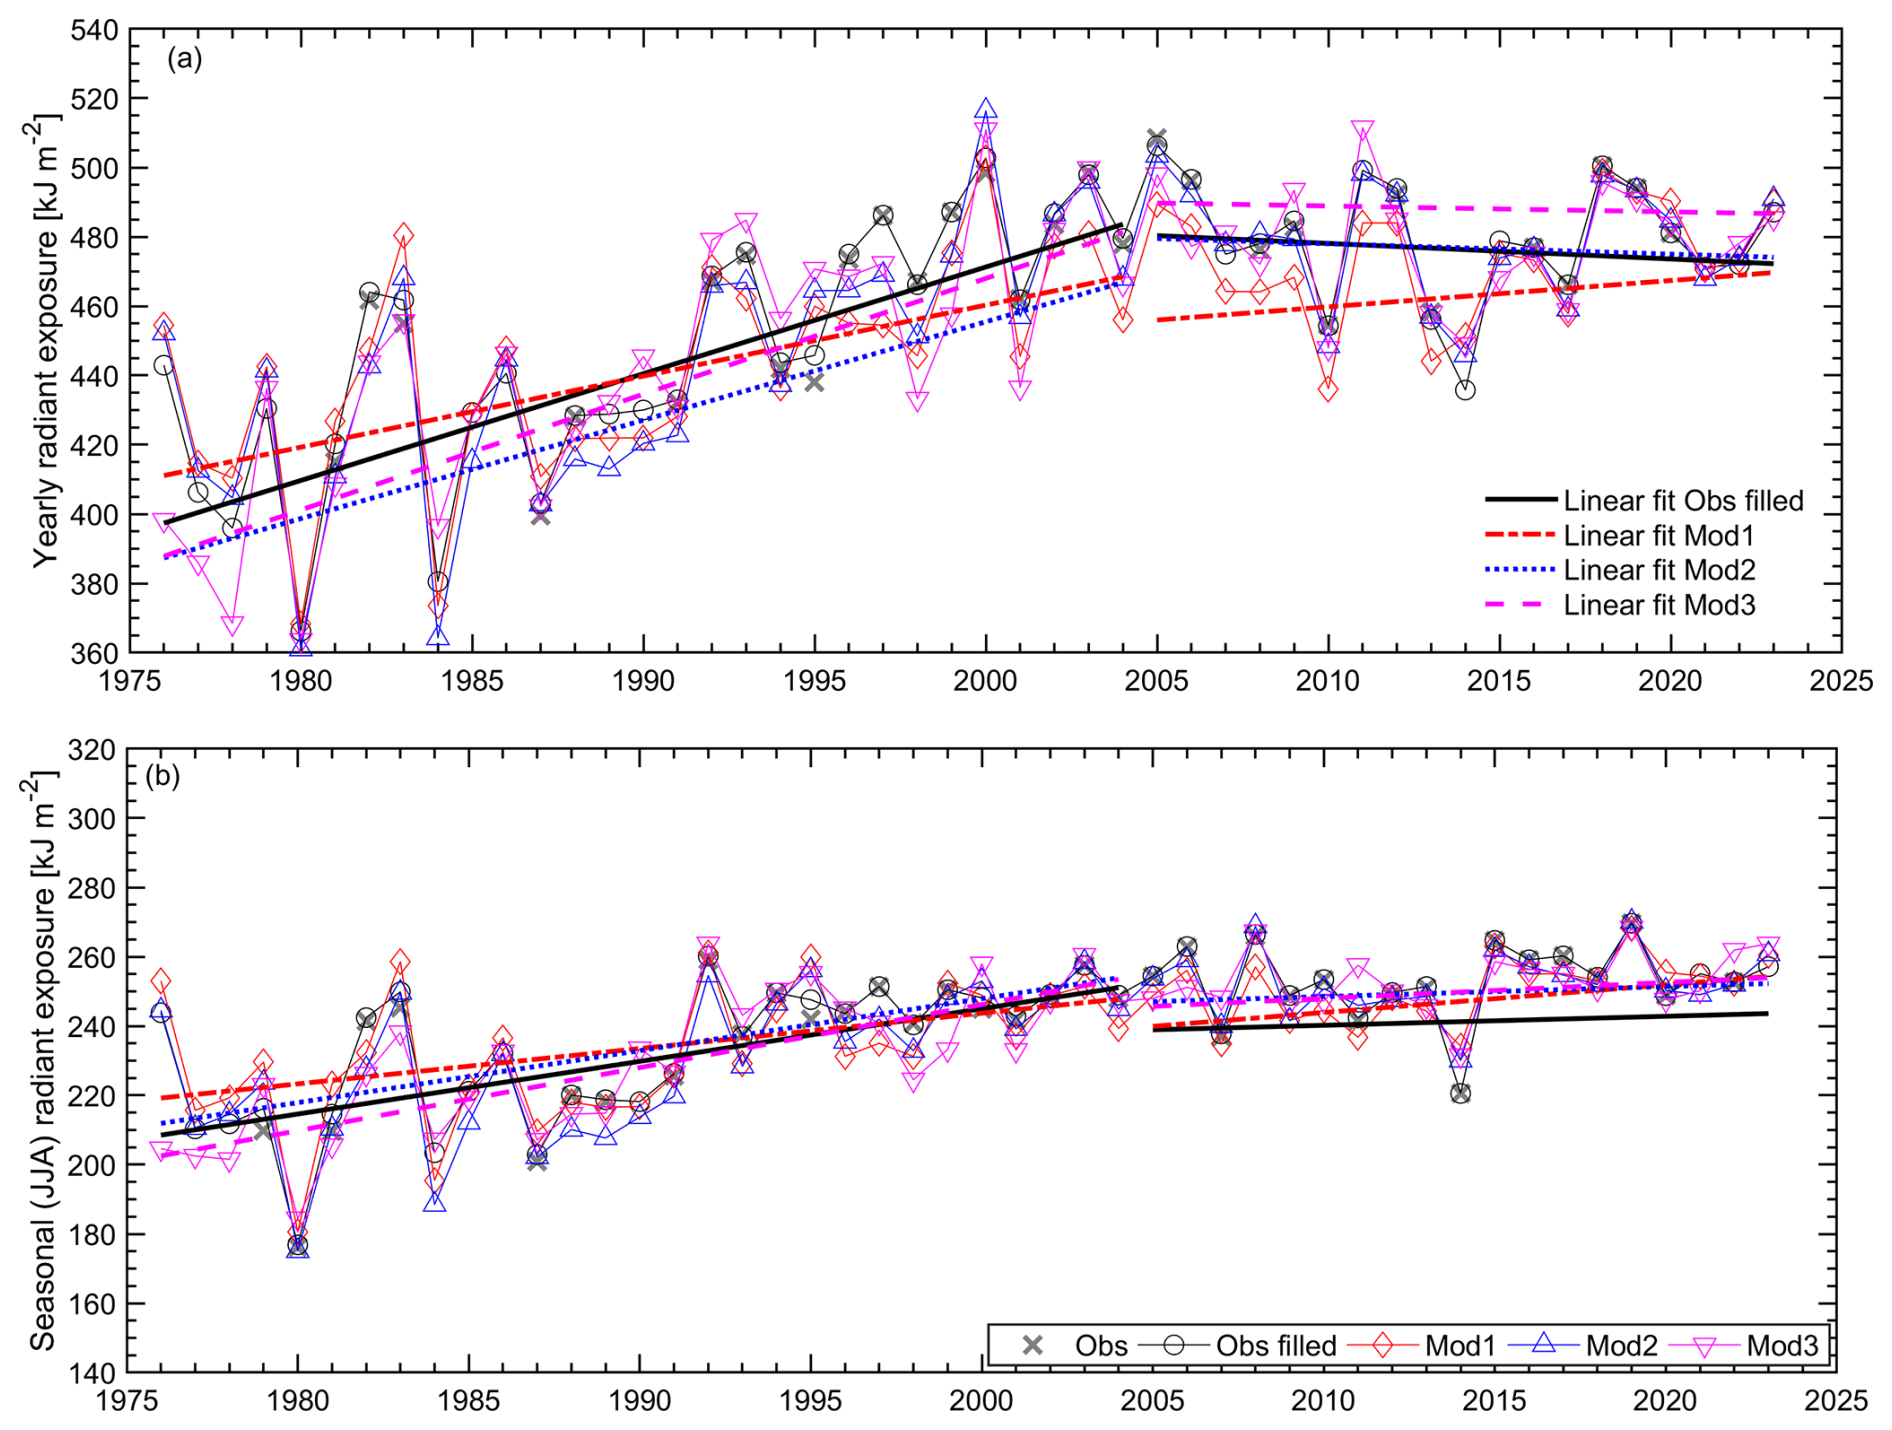
Figure A1Same as Fig. 8, but for the re-evaluated observations with the CC2 correction coefficients.
Conceptualisation: JWK and AC; methodology: JWK, AC, JJ, PSS, and BRW; validation: AC and IP; visualisation: AC; writing (original draft preparation): JWK and AC; writing (review and editing): JWK, AC, PSS, and IP; funding acquisition: JWK and JJ. All authors have read and agreed to the published version of the paper.
The contact author has declared that none of the authors has any competing interests.
Publisher's note: Copernicus Publications remains neutral with regard to jurisdictional claims made in the text, published maps, institutional affiliations, or any other geographical representation in this paper. While Copernicus Publications makes every effort to include appropriate place names, the final responsibility lies with the authors.
We would like to express our gratitude to the Belsk observers for their tremendous efforts in maintaining the high quality of the measurements for such a long time. We would also like to thank the editor and two anonymous reviewers for their valuable comments and suggestions, which helped to significantly improve the quality of our paper.
This research has been supported by the Chief Inspectorate of Environmental Protection (grant no. GIOŚ/31/2023/DMŚ/NFOŚ).
This paper was edited by Montserrat Costa Surós and reviewed by two anonymous referees.
AERONET: Aerosol Robotic Network, https://aeronet.gsfc.nasa.gov/, last access: 15 April 2025.
Berger, D. S.: The sunburning ultraviolet meter: design and performance, Photochem. Photobiol., 24, 587–593, https://doi.org/10.1111/j.1751-1097.1976.tb06877.x, 1976.
Blumthaler, M., Ambach, W., Morys, M., and Slomka, J.: Comparison of Robertson-Berger UV Meters from Innsbruck and Belsk, Publs. Inst. Geophys. Pol. Acad. Sc., D-32, 69–75, 1989.
Borkowski, J. L.: Reevaluation of series of solar UV-B radiation data, Publs. Inst. Geophys. Pol. Acad. Sc., D-48, 81–89, 1998.
Borkowski, J. L.: Homogenization of the Belsk UV-B series (1976–1997) and trend analysis, J. Geophys. Res., 105, 4873–4878, https://doi.org/10.1029/1999JD900500, 2000.
Borkowski, J. L.: Modelling of UV radiation variations at different time scales, Ann. Geophys., 26, 441–446, https://doi.org/10.5194/angeo-26-441-2008, 2008.
Chubachi, S.: Preliminary result of ozone observations at Syowa Station from February, 1982 to January, 1983, Mem. Natl. Inst. Polar Res., Spec. Issue (Jpn), 34, 13–20, 1984.
Chubarova, N. E., Pastukhova, A. S., Galin, V. Y., and Smyshlyaev, S. P.: Long-Term Variability of UV Irradiance in the Moscow Region according to Measurement and Modeling Data, Izv. Atmos. Ocean. Phy.+, 54, 139–146, https://doi.org/10.1134/S0001433818020056, 2018.
Chubarova, N. Y. and Nezval', Y. I.: Thirty year variability of UV irradiance in Moscow, J. Geophys. Res., 105, 12529–12539, https://doi.org/10.1029/1999JD901192, 2000.
CIE (Commission Internationale de l'Eclairage): Action Spectrum for the Production of Previtamin D3 in Human Skin, CIE 174:2006, https://www.normsplash.com/Samples/CIE/121612983/CIE-174-2006-en.pdf (last access: 15 April 2025), 2006.
CIE (Commission Internationale de l'Eclairage): Erythema Reference Action Spectrum and Standard Erythema Dose, CIE 17166:2019, https://www.iso.org/standard/74167.html (last access: 15 April 2025), 2019.
Čížková, K., Láska, K., Metelka, L., and Staněk, M.: Reconstruction and analysis of erythemal UV radiation time series from Hradec Králové (Czech Republic) over the past 50 years, Atmos. Chem. Phys., 18, 1805–1818, https://doi.org/10.5194/acp-18-1805-2018, 2018.
Cleveland, W. S.: Robust Locally Weighted Regression and Smoothing Scatterplots, J. Am. Stat. Assoc., 74, 829–836, https://doi.org/10.1080/01621459.1979.10481038, 1979.
Czerwińska, A. and Krzyścin, J.: Measurements of biologically effective solar radiation using erythemal weighted broadband meters, Photochem. Photobio. S., 23, 479–492, https://doi.org/10.1007/s43630-023-00532-z, 2024a.
Czerwińska, A. and Krzyścin, J.: Modeling of Biologically Effective Daily Radiant Exposures over Europe from Space Using SEVIRI Measurements and MERRA-2 Reanalysis, Remote Sens.-Basel, 16, 3797, https://doi.org/10.3390/rs16203797, 2024b.
Dave, J. V. and Halpern, P.: Effect of changes in ozone amount on the ultraviolet radiation received at sea level of a model atmosphere, Atmos. Environ., 10, 547–555, https://doi.org/10.1016/0004-6981(76)90181-5, 1976.
den Outer, P. N., Slaper, H., Kaurola, J., Lindfors, A., Kazantzidis, A., Bais, A. F., Feister, U., Junk, J., Janouch, M., and Josefsson, W.: Reconstructing of erythemal ultraviolet radiation levels in Europe for the past 4 decades, J. Geophys. Res., 115, D10102, https://doi.org/10.1029/2009JD012827, 2010.
Downham 2nd, T. F.: The shadow rule: a simple method for sun protection, South Med. J., 91, 619–623, 1998.
ERA5: ERA5 hourly data on single levels from 1940 to present, ERA5 [data set], https://doi.org/10.24381/cds.bd0915c6, 2025.
ESRL: The NOAA Earth System Research Laboratories, https://www.esrl.noaa.gov/gmd/grad/neubrew/SatO3DataTimeSeries.jsp, last access: 6 May 2025.
Farman, J., Gardiner, B., and Shanklin, J.: Large losses of total ozone in Antarctica reveal seasonal interaction, Nature, 315, 207–210, https://doi.org/10.1038/315207a0, 1985.
Giovanni: The Bridge Between Data and Science v 4.40, https://giovanni.gsfc.nasa.gov/giovanni/, last access: 15 April 2025.
GMAO: MERRA-2 tavg1_2d_rad_Nx: 2d,1-Hourly,Time-Averaged,Single-Level,Assimilation,Radiation Diagnostics V5.12.4 (M2T1NXRAD) Goddard Earth Sciences Data and Information Services Center (GES DISC) [data set], https://doi.org/10.5067/Q9QMY5PBNV1T, 2025.
Gröbner, J., Hülsen, G., Vuilleumier, L., Blumthaler, M., Vilaplana, J. M., Walker, D., and Gill, J. E.: Report of the PMOD/WRC-COST Calibration and Intercomparison of Erythemal Radiometers, Physical Meteorological Observatory Davos World Radiation Center (PMOD-WRC) Pub., Brussels, Belgium, 109 pp., 2009.
Hülsen, G. and Gröbner, J.: Characterization and calibration of ultraviolet broadband radiometers measuring erythemally weighted irradiance, Appl. Optics, 46, 5877–5886, https://doi.org/10.1364/AO.46.005877, 2007.
Koepke, P., De Backer, H., Bais, A., Curylo, A., Eerme, K., Feister, U., Johnsen, B., Junk, J., Kazantzidis, A., Krzyścin, J., Lindfors, A., Olseth, J. A., den Outer, P., Pribullova, A., Schmalwieser, A. W., Slaper, H., Staiger, H., Verdebout, J., Vuilleumier, L., and Weihs, P.: Modelling solar UV radiation in the past: Comparison of algorithms and input data, Proc. SPIE, 6362, Remote Sensing of Clouds and the Atmosphere XI, 636215, https://doi.org/10.1117/12.687682, 2006.
Koskela, T., Taalas, P., and Leszczynski, K.: Correction method for Robertson Berger type ultraviolet radiometer data, in: Proceedings of the 8th Conference on Atmospheric Radiation, Nashville, Tennessee, USA, 23–28 January 1994, 161–163, 1994.
Krzyścin, J. W.: Biologically effective solar radiation (daily radiant exposure and irradiance at noon) at Belsk from 1 January 1976 to 31 December 2023 based on homogenised measurements with broadband radiometers, IG PAS [data set], https://doi.org/10.25171/InstGeoph_PAS_IGData_Biologically_Effective_Solar_Radiation_Belsk_1976_2023, 2024.
Krzyścin, J. W. and Puchalski, S.: Aerosol impact on the surface UV radiation from the ground-based measurements taken at Belsk, Poland, 1980–1996, J. Geophys. Res., 103, 16175–16181, https://doi.org/10.1029/98JD00899, 1998.
Krzyścin, J. W., Sobolewski, P. S., Jarosławski, J., Podgórski, J., and Rajewska-Więch, B.: Erythemal UV observations at Belsk, Poland, in the period 1976–2008: Data homogenization, climatology, and trends, Acta Geophys., 59, 155–182, https://doi.org/10.2478/s11600-010-0036-3, 2011.
Krzyścin, J. W., Jarosławski, J., Rajewska-Więch, B., Sobolewski, P. S., Narbutt, J., Lesiak, A., and Pawlaczyk, M.: Effectiveness of heliotherapy for psoriasis clearance in low and mid-latitudinal regions: A theoretical approach, J. Photoch. Photobio. B, 115, 35–41, https://doi.org/10.1016/j.jphotobiol.2012.06.008, 2012.
Krzyścin, J. W., Sobolewski, P., Czerwińska, A., Rajewska-Więch, B., and Jarosławski, J.: Biologically weighted daily radiant exposure for erythema appearance, previtamin D3 synthesis and clearing of psoriatic lesions from erythema biometers at Belsk, Poland, for the period 1976–2023, PANGAEA [data set], https://doi.org/10.1594/PANGAEA.972139, 2024.
Leszczynski, K., Jokela, K., Ylianttila, L., Visuri, R., and Blumthaler, M.: Erythemally Weighted Radiometers in Solar UV Monitoring: Results from the WMO/STUK Intercomparison, Photochem. Photobiol., 67, 212–221, https://doi.org/10.1111/j.1751-1097.1998.tb05189.x, 1998.
Madronich, S.: UV radiation in the natural and perturbed atmosphere, in: UV-B Radiation and Ozone Depletion. Effects on Humans, Animals, Plants, Microorganisms, and Materials, edited by: Tevini, M., Lewis, Boca Raton, Ann Arbor, London, UK, Tokyo, Japan, 17–69, ISBN 978-0873719117, 1993.
Molina, M. J. and Rowland, F. S.: Stratospheric sink for chlorofluoromethanes: chlorine atom-catalyzed destruction of ozone, Nature, 249, 810–812, https://doi.org/10.1038/249810a0, 1974.
NDACC: Network for the Detection of Atmospheric Composition Change, https://www-air.larc.nasa.gov/missions/ndacc/, last access: 15 April 2025.
Neale, R. E., Lucas, R. M., Byrne, S. N., Hollestein, L., Rhodes, L. E., Yazar, S., Young, A. R., Berwick, M., Ireland, R. A., and Olsen, C. M.: The effects of exposure to solar radiation on human health, Photochem. Photobio. S., 22, 1011–1047, https://doi.org/10.1007/s43630-023-00375-8, 2023.
Posyniak, M., Szkop, A., Pietruczuk, A., Podgórski, J., and Krzyścin, J.: The long-term (1964–2014) variability of aerosol optical thickness and its impact on solar irradiance based on the data taken at Belsk, Poland, Acta Geophys., 64, 1858–1874, https://doi.org/10.1515/acgeo-2016-0026, 2016.
Puchalski, S.: Preliminary results of the comparison of Robertson-Berger meter with the UV-Biometer MOD 501A, version 3, produced by Solar Light Co., Publs. Inst. Geophys. Pol. Acad. Sc., D-42, 113–115, 1995.
Rieder, H. E., Holawe, F., Simic, S., Blumthaler, M., Krzyścin, J. W., Wagner, J. E., Schmalwieser, A. W., and Weihs, P.: Reconstruction of erythemal UV-doses for two stations in Austria: a comparison between alpine and urban regions, Atmos. Chem. Phys., 8, 6309–6323, https://doi.org/10.5194/acp-8-6309-2008, 2008.
Schmalwieser, A. W., Eschenbacher, S., and Schreder, J.: UV-Biometer – The usage of erythemal weighted broadband meters for other biological effects, J. Photoch. Photobio. B, 230, 112442, https://doi.org/10.1016/j.jphotobiol.2022.112442, 2022.
Scotto, J., Cotton, G., Urbach, F., Berger, D., and Fears, T.: Biologically effective ultraviolet radiation: surface measurements in the United States, 1974 to 1985, Science, 239, 762–764, https://doi.org/10.1126/SCIENCE.3340857, 1988.
Słomka, J. and Słomka, K.: Comparison of Robertson-Berger ultraviolet meter counts with the UVB and UVer radiation inflow determined from Dave-Halpern's model, Publs. Inst. Geophys. Pol. Acad. Sc., D-22, 133–143, 1985.
Słomka, J. and Słomka, K.: Biologically active solar UV radiation at Belsk in the years 1976–1992, Publs. Inst. Geophys. Pol. Acad. Sc., D-40, 71–81, 1993.
TUV: Tropospheric Ultraviolet and Visible (TUV) Radiation Model, https://www2.acom.ucar.edu/modeling/tropospheric-ultraviolet-and-visible-tuv-radiation-model, last access: 15 April 2025.
Volpert, E. V. and Chubarova, N. E.: Long-term changes in solar radiation in Northern Eurasia during the warm season according to measurements and reconstruction model, Russ. Meteorol. Hydro.+, 46, 507–518, https://doi.org/10.3103/S1068373921080021, 2021.
Weatherhead, E. C., Reinsel, G. C., Tiao, G. C., Meng, X., Choi, D., Cheang, W., Keller, T., DeLuisi, J., Wuebbles, D. J., Kerr, J. B., Miller, A. J., Oltmans, S. J., and Frederick, J. E.: Factors affecting the detection of trends: Statistical considerations and applications to environmental data, J. Geophys. Res., 103, 17149–17161, https://doi.org/10.1029/98JD00995, 1998.
WMO (World Meteorological Organization): Report of the Meeting of Experts on UV-B Monitoring and Research (16–20 May 1977), WMO Global Ozone Research and Monitoring Project – Report no.3, WMO, Geneva, Switzerland, 30 pp., 1977.
WOUDC: World Ozone and Ultraviolet Radiation Data Centre, https://woudc.org/data.php, last access: 15 April 2025.