the Creative Commons Attribution 4.0 License.
the Creative Commons Attribution 4.0 License.
 | 14 Jul 2025
Global patterns of soil organic carbon distribution in the 20–100 cm soil profile for different ecosystems: a global meta-analysis
Haiyan Wang
Tingyao Cai
Xingshuai Tian
Zhong Chen
Kai He
Zihan Wang
Haiqing Gong
Qi Miao
Yingcheng Wang
Yiyan Chu
Qingsong Zhang
Minghao Zhuang
Yulong Yin
Zhenling Cui
Determining the distribution of soil organic carbon (SOC) in subsoil (20–100 cm depth) is important with respect to the global C cycle and warming mitigation. However, significant knowledge gaps remain regarding the spatiotemporal dynamics of SOC within this layer. By integrating traditional depth functions with machine learning approaches, we quantified soil β values, which represent the relative rate of decline in SOC density with depth, and provided high-resolution assessments of SOC dynamics across global ecosystems, including cropland, grassland, and forestland. The estimated subsoil SOC densities were 62 Mg ha−1 (95 % CI: 52–73) for cropland, 70 Mg ha−1 (95 % CI: 57–83) for grassland, and 97 Mg ha−1 (95 % CI: 80–117) for forestland. SOC density exhibited a consistent decline with depth, ranging from 30 to 5 Mg ha−1 in cropland, 32 to 7 Mg ha−1 in grassland, and 40 to 13 Mg ha−1 in forestland, across 20 cm depth increments from 20 to 100 cm. The estimated global subsoil SOC stock was 803 Pg C, with cropland, grassland, and forestland contributing 74, 181, and 547 Pg C, respectively. On average, 57 % of this carbon was stored within the top 0–100 cm of the soil profile. This study provides information on the vertical distribution and spatial patterns of SOC density at a 10 km resolution across global ecosystems, providing a scientific basis for future studies pertaining to Earth system models. The dataset is open-access and is available at https://doi.org/10.5281/zenodo.15019078 (Wang et al., 2025).
- Article
(5924 KB) - Full-text XML
-
Supplement
(1571 KB) - BibTeX
- EndNote


Soil organic carbon (SOC) plays a pivotal role in global carbon cycling, climate change mitigation, and reducing greenhouse gas emissions while simultaneously supporting ecosystem health (Bradford et al., 2016; Lal et al., 2021; Griscom et al., 2017). Subsoil, defined here as the soil layer below 20 cm, contains over half of the global SOC stock (Jobbágy and Jackson, 2000; Poffenbarger et al., 2020; Batjes, 1996). However, the extensive loss of SOC through agricultural practices such as crop production and grazing has contributed substantially to rising atmospheric CO2 levels (Beillouin et al., 2023; Lal, 2020; Qin et al., 2023). Complex polymeric carbon in subsoil is vulnerable to decomposition under future warming. Specifically, ecological or trophic limitations of SOC biodegradation in deep-soil layers can lead to sharp declines in the nutrient supply and biodiversity (Chen et al., 2023). Subsoil is better suited to long-term C sequestration than topsoil. The “4 per 1000” initiative aims to boost SOC storage in agricultural soils by 0.4 % annually, offering a potential pathway for mitigating climate change and increasing food security (Chabbi et al., 2017). Promoting subsoil carbon sequestration, particularly in agricultural and managed ecosystems, could facilitate the long-term stabilization of fossil-fuel-derived carbon in soils (Button et al., 2022). Despite the importance of subsoil organic carbon dynamics, these are still poorly understood, especially at the large scale (Padarian et al., 2022). This is primarily due to the challenges associated with measuring SOC at greater depths, which is difficult, time-consuming, and labor-intensive.
Recent studies have focused on SOC allocation and dynamics at varied depths and the subsoil SOC–climate feedback cycle of terrestrial ecosystems (Luo et al., 2019; Jia et al., 2019; Li et al., 2021). The complexity, uncertainty, and large spatial heterogeneity of SOC stock estimation have limited the ability to accurately quantify the SOC stock distribution (Mishra et al., 2021; Wang et al., 2022a). Currently, three primary methods are commonly used to estimate large-scale SOC stocks: (1) area-weighted averaging based on vegetation inventories and soil survey data (Tang et al., 2018); (2) machine learning based on remote sensing, land use, and edaphic data and climatic factors as covariates (Ding et al., 2016); and (3) depth-distribution-function-based empirical analysis (Wang et al., 2023). The first approach provides the most accurate measurement of the SOC stock but is time-consuming and labor-intensive and is not practical at the global scale. The latter two approaches do not fully consider the vertical distribution of the soil profile or the soil properties of various ecosystems. Extrapolating surface SOC measurements from the 0–40 or 0–50 cm layer to predict subsoil SOC at greater depths, such as at 0–100 or 0–200 cm, introduces significant uncertainty, hindering precise estimation of the global subsoil SOC stock (Wang et al., 2023; Ding et al., 2016).
Studies of whole-soil profiles have recorded greater changes in the SOC dynamics of the subsoil under warming (Zosso et al., 2023; Luo et al., 2020; Soong et al., 2021). The amount and quality of C in input soil, such as aboveground litter and root biomass input, could profoundly alter the vertical SOC distribution (Lange et al., 2023; Feng et al., 2022). The β model, in particular, uses simple and flexible functions that capture the relative slope of depth profiles with a single parameter, with the advantage of being able to integrate SOC values from the surface down to a given depth (Jobbágy and Jackson., 2000). The β model was originally applied to vertical root distributions and has been used to fit the steepest reductions with depth (Gale and Grigal, 1987; Jackson et al., 1997). Some researchers have used the global average β of 0.9786 to calculate deep-soil SOC stocks (Yang et al., 2011; Deng et al., 2014). However, the different hydrological conditions, soil types, and ground or underground organic matter have limited the ability to resolve the SOC depth distribution with confidence.
In this study, we produced spatially resolved global estimates of the depth distributions and stocks of subsoil SOC using the β model as a depth-distribution-function-based empirical approach for evaluating cropland, grassland, and forestland ecosystems on a global scale. We collected and analyzed 17 984 observation data from globally distributed soil profiles (0–100 cm) across 14 550 sites to estimate soil β values. We then developed a random forest (RF) model to estimate the spatial variation in grid-level soil β values in the associated ecosystems to resolve the dynamics of the SOC density in different soil layers and the subsoil stocks of the global ecosystems.
2.1 Data collection
We conducted a review of the previously published, peer-reviewed literature on the SOC stocks or SOC content of soil profiles between 1980 and January 2023 to obtain a database. The Web of Science and China National Knowledge Infrastructure (CNKI) databases were searched using the terms “soil organic carbon” and “soil profile” or “subsoil” or “deep soil”. The criteria were as follows: (1) the research scope was worldwide. (2) The study was conducted in the field. (3) The profiles of multiple sites were reported in the same literature, and the profile of each site was considered to be from an independent study. (4) Profiles with three or more suitable measurements of organic carbon in the first meter were collected from the analysis in which there was sufficient detail to characterize the vertical distribution of SOC. (5) The data extracted included basic site information, including location (latitude and longitude); soil organic carbon (SOC); total nitrogen (TN); soil bulk density (BD); soil pH and ratio; microbial biomass carbon and nitrogen (MC); microbial biomass nitrogen (MN); soil clay content; and climate conditions, namely mean annual precipitation (MAP) and mean annual temperature (MAT). If the soil organic matter (SOM) was reported rather than the SOC, the value was converted to SOC by multiplication with a conversion factor of 0.58 (Don et al., 2011). To extract data presented graphically, the digital software GetData Graph Digitizer 2.25 (https://getdata-graph-digitizer.com/, last access: 16 June 2023) was used. A total of 209 peer-reviewed papers comprising 1221 soil profiles were included in this dataset, of which 758 were for cropland, 219 were for forestland, and 244 were for grassland. Additionally, an expanded dataset was sourced from the WoSIS Soil Profile Database, contributing 7636 profiles for cropland, 4534 for forestland, and 4593 for grassland (Fig. 1a). Missing soil and climate factor data from a few sites were either provided by the study authors through direct correspondence or obtained from the spatial datasets (Sect. 2.2) based on latitude and longitude. These completed data were analyzed to determine the impact of the environment on soil β values; to develop a model to predict global grid-level β values; and, subsequently, to estimate the SOC density of soil profiles and to calculate SOC stocks. Additionally, the soil samples were classified into four major types, namely sandy soil, loam, clay loam, and clay soil, according to the international soil texture classification standard (Zhao et al., 2022).
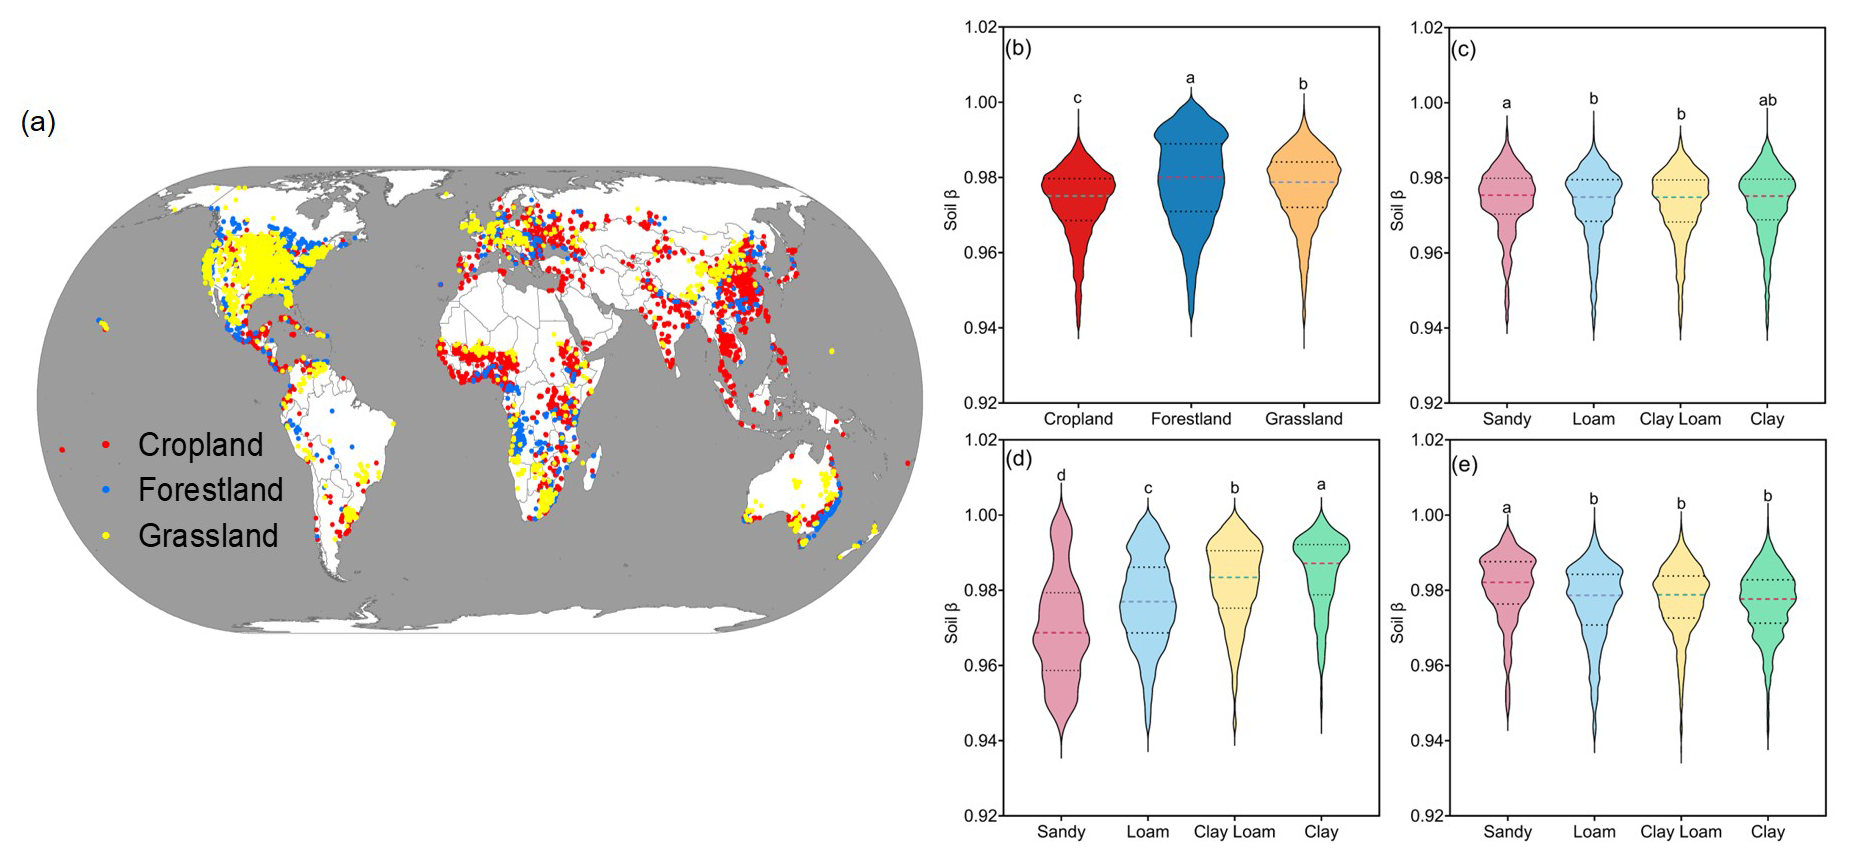
Figure 1Geographic distribution of study sites and variation in soil β values in 0–100 cm soil profiles across different ecosystems and soil textures. (a) Red, yellow, and blue dots represent cropland, grassland, and forestland, respectively. (b) Soil β values of the study sites showing significant differences in different ecosystems with ANOVA analysis and Duncan's new multiple range test. Panels (c)–(e) demonstrate the variations in soil β values across sandy soil, loam, clay loam, and clay for cropland, forestland, and grassland, respectively.
2.2 Calculation of soil attributes from literature-derived database
Since the 0–1 m soil profile has different layers in the raw data, the mass-preserving spline method (R package mpspline2) was used to divide the soil profiles into five layers at 20 cm intervals. This function was implemented for continuous down-profile estimates of soil attributes (SOC, TN, clay, MC, MN, etc.) measured over discrete, often discontinuous depth intervals. In some studies, bulk density data below the 20 cm soil layer were lacking. Notable differences in global SOC stock estimations were attributed to the values used for soil bulk density. Therefore, we used the database issued by predecessors to generate bulk density data within the 0–1 m profile at 20 cm intervals (Shangguan et al., 2014). The equation used to calculate SOC density at each research site was the following:
where SOC is the SOC concentration (g kg−1), BD is the soil bulk density (g cm−3), D is the thickness of the soil layer (at intervals of 20 cm in the first meter), and SOC density (Mg C ha−1). GC (>2 mm) is the gravel content (%).
2.3 Calculation of soil β values from literature-derived database
To enhance the comparability of data from different studies, the corresponding soil β values were calculated using Eq. (2), which follows the methodology adopted by Yang et al. (2011). The SOC density in the top 0–100 cm was calculated from the initial depth's SOC density using Eq. (3), which was developed by Jobbágy and Jackson (2000). The equations are as follows:
where Y represents the cumulative proportion of the SOC density from the soil surface to depth d (cm), and β is the relative rate of decrease in the SOC density with soil depth. A lower β indicates a steeper decline with depth. X100 denotes the SOC density within the upper 100 cm, d0 represents the depth of the 0–20 cm soil layer, and is the SOC density of the top 20 cm soil depth.
2.4 Spatial gridded datasets
The gridded datasets included forestland, grassland, and cropland areas, climate factors, and soil properties. Areas of cropland, forestland, and grassland were obtained from Global Agro-Ecological Zones (GAEZ, https://gaez.fao.org/, last access: 30 June 2023) at a resolution of 0.083°×0.083°. MAP and MAT were acquired from the Climatic Research Unit Time Series (CRU TS version 4.05; https://crudata.uea.ac.uk/cru/data/hrg/cru_ts_4.05/cruts.2103051243.v4.05/, last access: 7 July 2023). The spatial data for SOC, total N, soil clay content, and soil pH and gravel content were acquired from the Harmonized World Soil Database version 1.2 (https://www.fao.org/soils-portal/data-hub/soil-classification/worldreference-base/en/, last access: 28 July 2023). MC and MN data were obtained from this study (Xu et al., 2013). The BD and gravel content (GC) datasets for the entire soil profile were acquired from the Harmonized World Soils Database version 2.0 (HWSD v2.0) (https://gaez.fao.org/pages/hwsd, last access: 5 September 2024), whose resolution is 1 km. The belowground net primary productivity (BNPP) data were sourced from Xiao et al. (2023). All data were resampled to 0.083° resolution using the raster R package (https://rspatial.org/raster, last access: 7 October 2024).
2.5 Application of RF modeling to predict spatial β values
We reconstructed the relationships among multiple factors of cropland, grassland, and forestland soil β values using an RF algorithm. The developed RF models were applied to predict grid-level soil β values for each ecosystem. Prior to constructing the RF model, the optimal parameter values of mtry and ntrees were determined through the bootstrap sampling method, which was performed with the e1071 R package. Predictions of soil β values derived from RF and random-effect regression models were evaluated by means of 10-fold cross-validation. The dataset was divided into 10 subsets of equal size, with 70 % of the data being used for model fitting and RF procedures, and then predictions were made with the fitted models using the remaining 30 % of the data. The performance of the RF models was evaluated based on the coefficient of determination (R2) and the root mean square error (RMSE) according to the following equations:
where yp represents an observed value (p=1, 2, 3, …), represents the corresponding predicted value (p=1, 2, 3, …), represents the mean value of observed values, and q represents the total number of observed values.
2.6 Estimating global SOC density and SOC stock ecosystems across different ecosystems
To reveal the dynamics of SOC with depth, we used the globally predicted β values for cropland, grassland, and forestland ecosystems in Eq. (3) to calculate cumulative SOC density at specific depths (e.g., 40, 60, 80, and 100 cm). Based on these cumulative values, the SOC density for each 20 cm interval was calculated by subtracting the cumulative SOC density of the shallower depth from that of the deeper depth. Subsequently, the total carbon stocks for different ecosystems worldwide were calculated by multiplying the SOC density by the corresponding land area (see Eq. 6).
In the above, Secosystem is the area of cropland, grassland, or forestland (ha). The term “SOC stocks” is in petagram carbon.
2.7 Uncertainty analysis
A Monte Carlo simulation was employed to estimate the overall uncertainty in the estimated spatial SOC density. The uncertainty mainly stemmed from soil β value estimation-related parameters and the RF model. Input parameters in the RF model prediction followed independent normal distributions by assuming the grid value as the mean value and its 10 % value as the standard deviation (Liu et al., 2024; Xu et al., 2023; Vanden et al., 2004). Then 1000 random samplings were used to obtain the interval of each grid via Monte Carlo simulations. The sampling values were then used to run the RF model to predict the grid-level soil β value, with 100 bootstraps to run the RF model. Then we used predicted grid-level soil β to recalculate the distribution of SOC density (SOCD) across different ecosystems. Finally, we calculated the mean along with the 2.5 % and 97.5 % percentiles to establish the 95 % confidence interval for SOC density and SOC stocks.
In the above, xi is the mean of the prediction, CIi is the confidence interval of xi, and Ui is the uncertainty.
2.8 Data management and analyses
One-way analysis of variance (ANOVA) at p<0.05 was applied to identify significant differences in soil β values using SPSS version 20.0 (SPSS Inc., Chicago, IL, USA) software. We created a database of peer-reviewed publications using Excel 2010 software (Microsoft Corp., Redmond, WA, USA). Weather data analysis was performed using MATLAB R2017a software (MathWorks Inc., Natick, MA, USA). Weather data were analyzed using MATLAB R2017a (MathWorks, Natick, MA, USA). R software (version 3.5.1; R Development Core Team, Vienna, Austria) was used to generate graphs. A publicly available map of China was obtained from the Resource and Environment Data Cloud Platform (http://www.resdc.cn, last access: 9 May 2023). All map-related operations were performed using ArcGIS 10.2 software (http://www.esri.com/en-us/arcgis, last access: 20 January 2025). All algorithms were implemented using the randomForest R package in the R software environment (version 3.5.1; R Development Core Team, Vienna, Austria).
3.1 Soil β values of the three global ecosystems based on field measurements
We analyzed 17 984 globally distributed soil β values (calculated based on SOC density and depth) from 14 550 sites, including 5940 cropland sites, 4209 grassland sites, and 4401 forestland sites (Fig. 1a). This included an additional 8394 observations for cropland, 4753 for forestland, and 4837 for grassland, obtained from the literature and the WoSIS Soil Profile Database. The average soil β values across all observations were 0.9731 for cropland, 0.9772 for grassland, and 0.9790 for forestland (Fig. 1b), with significant differences being observed among the ecosystems. Soil β values exhibited significant differences among sandy soil, loam, clay loam, and clay soil. Cropland and grassland ecosystems exhibited the highest β values in sandy soil, while forest ecosystems showed the highest β values in clay soil (Fig. 1c and d).
3.2 Impact of soil and climate variables on soil β values
The soil β value is significantly influenced by the combined effects of various climatic, biological, and edaphic factors. MAT, MAP, and BNPP were the most influential drivers of β values (Fig. S1 in the Supplement). Higher MAT promoted increases in soil β values, and higher MAP promoted decreases. However, when the MAT was about 20 °C and MAP was about 1000 mm, the soil β value growth and decline rates were substantially reduced (Fig. 2a and b). BNPP demonstrated a nonlinear relationship: β values decreased with increasing BNPP levels. When BNPP was below 1.5 Mg ha−1 yr−1 and exceeded 2 Mg ha−1 yr−1, the soil β values decreased sharply (Fig. 2c). The regression between , MC, MN, TN, pH, and soil β values followed a parabolic relationship. When > 10, MC > 100 mg kg−1, MN > 20 mg kg−1, TN > 3 g kg−1, and pH < 6, the soil β values decreased (Fig. 2d–h). β values remained relatively stable across most clay percentages but showed a decrease when clay content exceeded 30 % (Fig. 2i). Through comparison and analysis, we ultimately selected nine significant factors (BNPP, pH, Clay, MAT, MAP, TN, MN, MC, and ) for modeling based on their importance and explanatory power (Fig. S1).
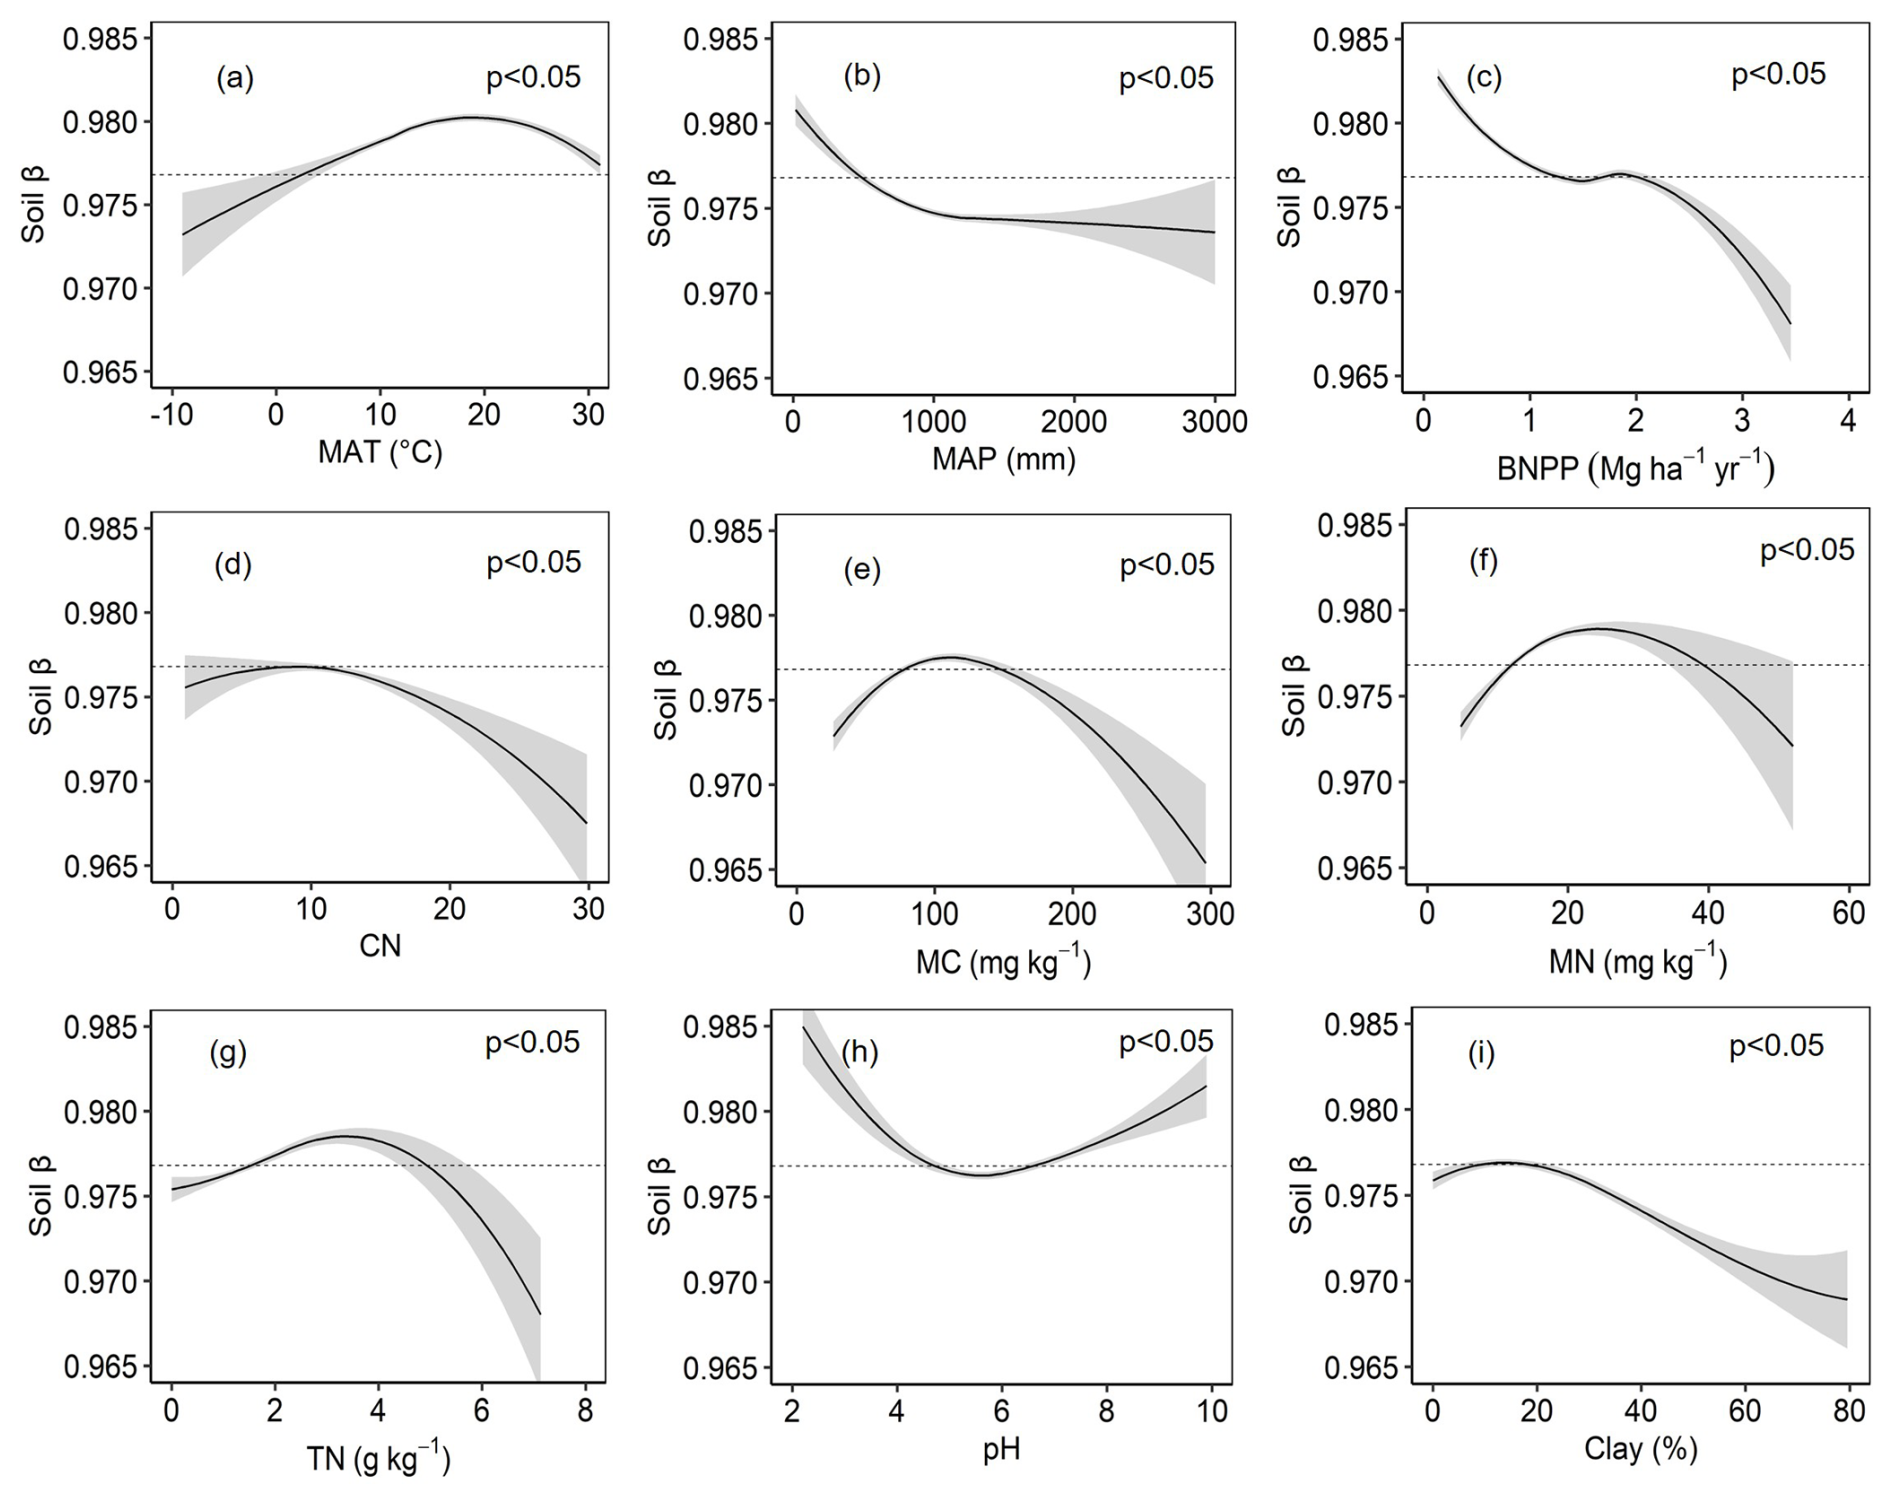
Figure 2Integrated analysis of edaphic and climatic determinants of the soil β values. Panels (a)–(i) show the variables affecting soil β values. MAT denotes mean annual temperature, MAP denotes mean annual precipitation, BNPP denotes belowground net primary productivity, denotes the ratio of SOC to TN, MC denotes microbial biomass carbon, MN denotes microbial biomass nitrogen, TN denotes soil total nitrogen, pH denotes soil pH, and clay denotes clay content. Shaded bands indicate 95 % confidence intervals, and the dashed lines represent the average soil β values.
3.3 Performance of the random forest regression model
We developed an RF regression model using machine learning techniques to determine grid-level soil β values on a global scale. The model included nine significant factors (BNPP, pH, clay, MAT, MAP, TN, MN, MC, and ), as well as the corresponding high-spatial-resolution raster datasets (Figs. S2–S4). The model performed well, with adjusted coefficients of determination (R2) of 0.85, 0.86, and 0.90 for cropland, grassland, and forestland, respectively, and the RMSE values were all less than 0.01 (Fig. 3a–c). The predictions and measurements of all samples were also distributed close to the 1:1 line. These validations suggest that the trained RF model is capable of capturing and predicting the spatial pattern of soil β values on a global scale.
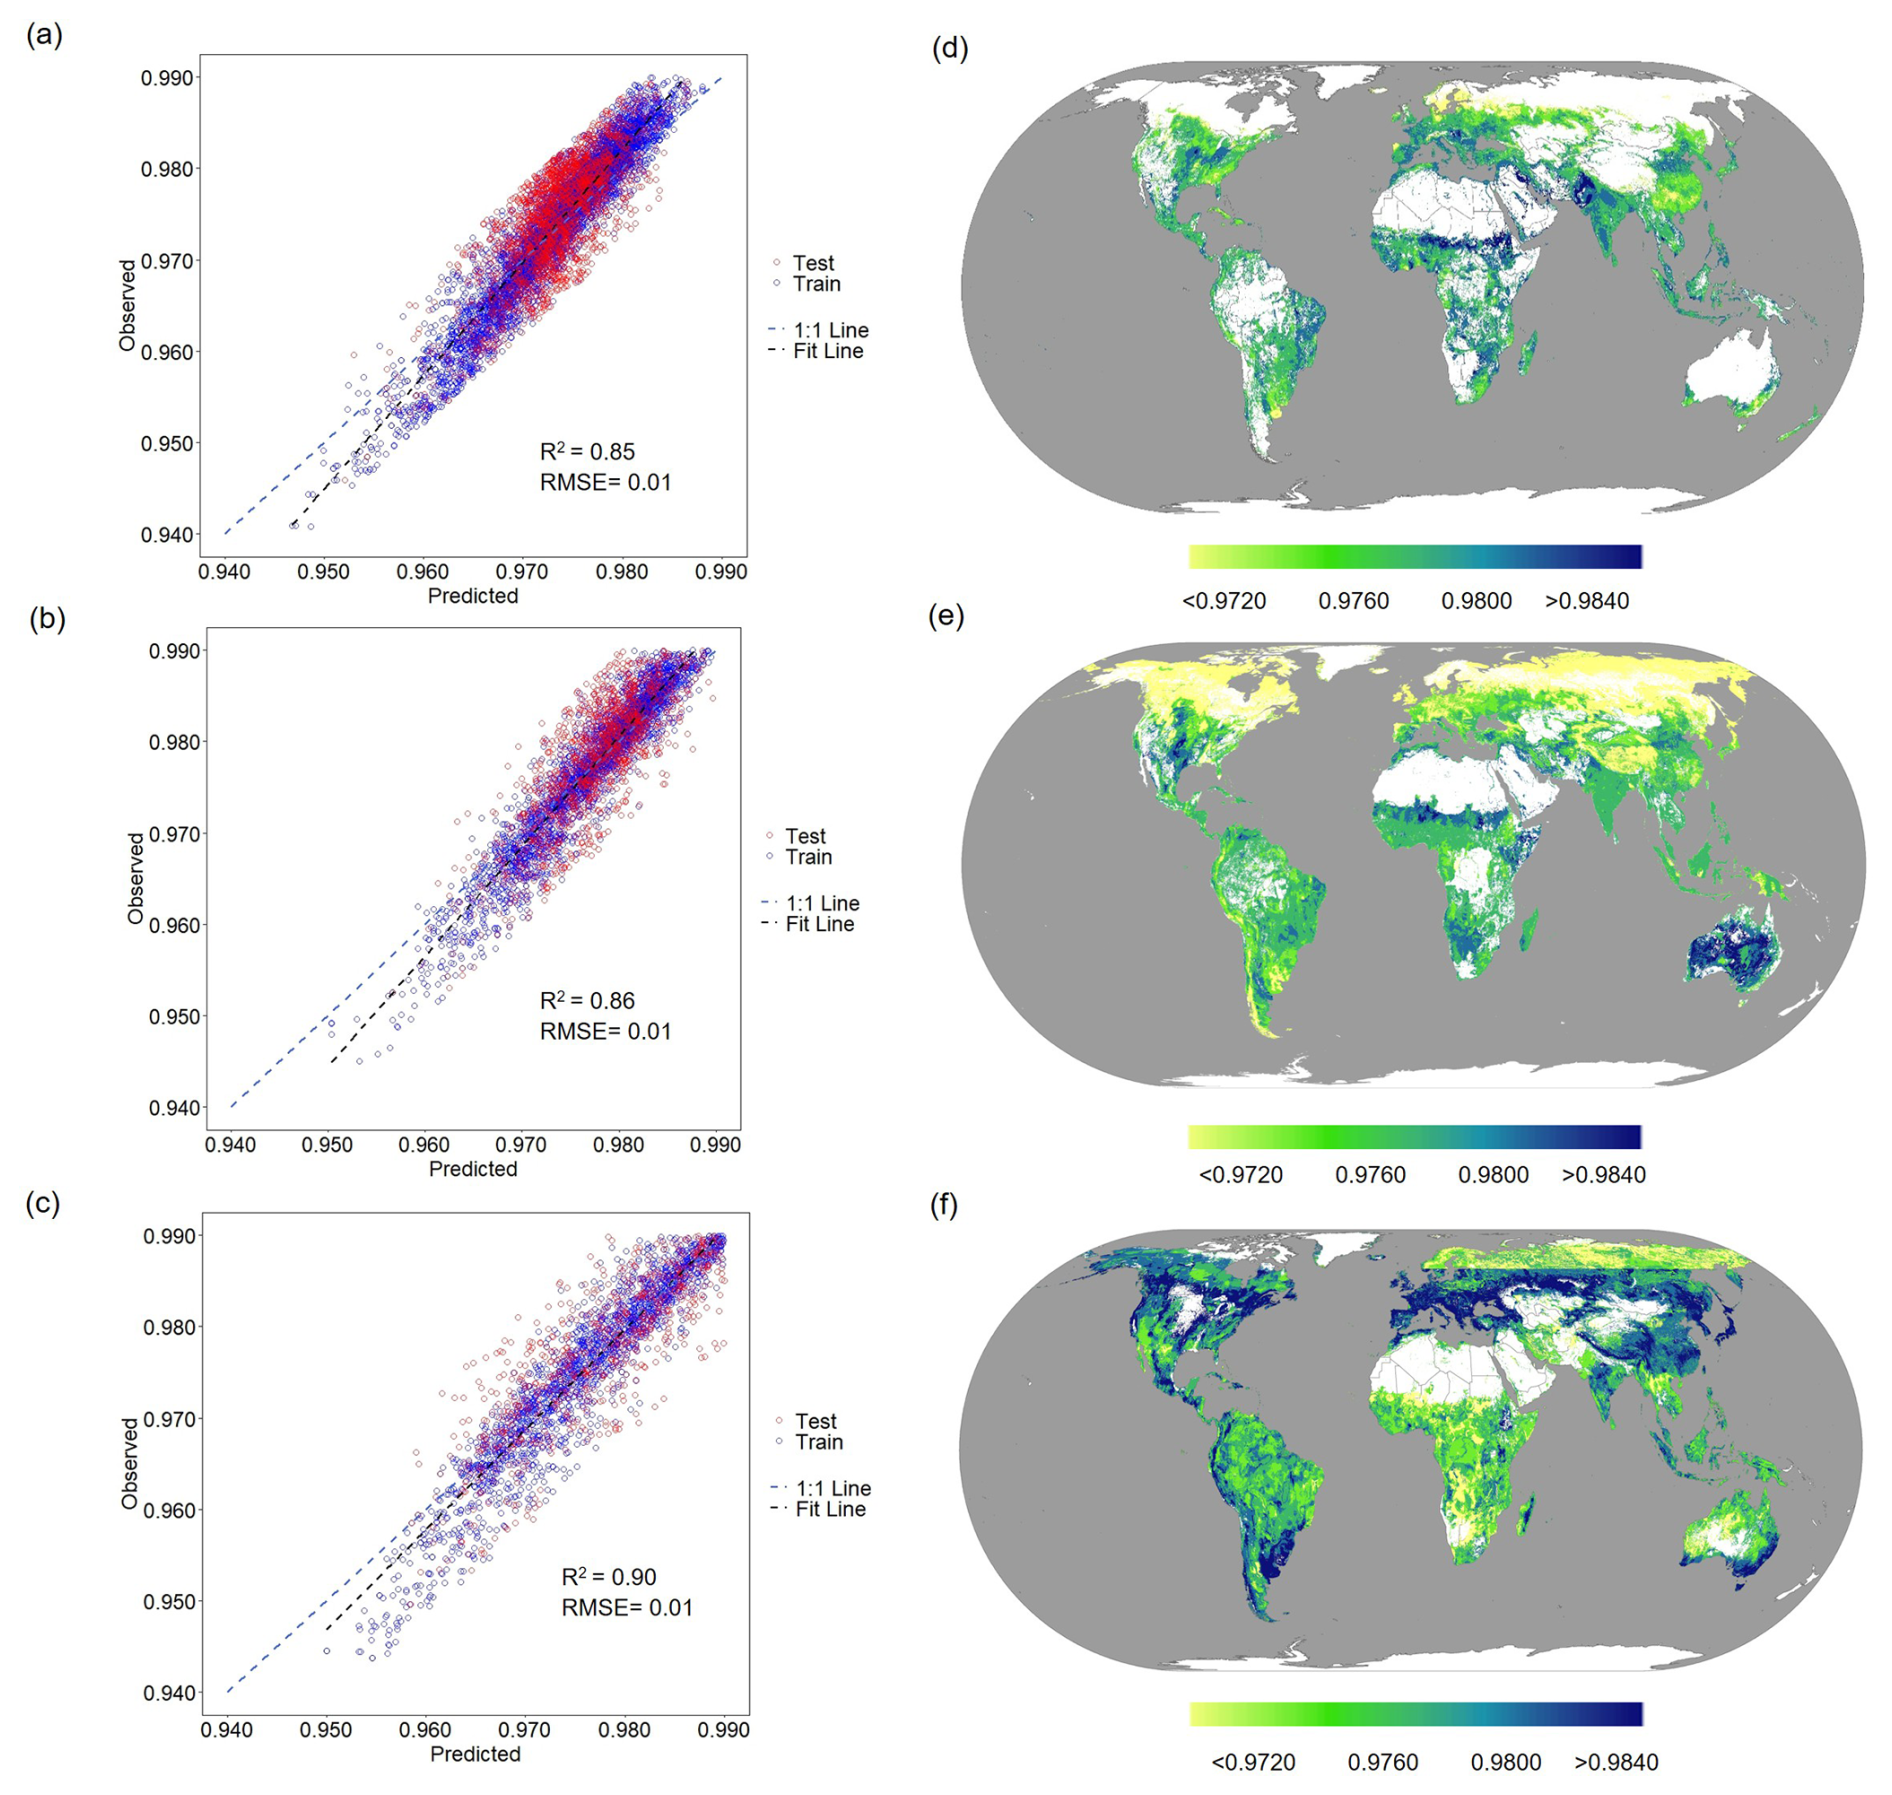
Figure 3Validation of the RF model demonstrated robust performance, with grid-level maps showing the predicted global soil β values. Panels (a)–(c) reflect the performance of the random forest model as evaluated by the correlation between the observed and predicted responses of soil β values. Panels (d)–(f) illustrate the predicted spatial variability in soil β values in cropland, grassland, and forestland, respectively.
3.4 Mapping the global grid-level soil β value
We predicted the global soil β value using the RF model with 4 057 524 integrated grid-level, high-spatial-resolution soil and climate raster datasets (cropland, n=832 827; forestland, n=1 695 053; and grassland, n=1 529 644). The average values were 0.9716 (95 % CI: 0.9692–0.9738), 0.9762 (95 % CI: 0.9656–0.9831), and 0.9792 (95 % CI: 0.9687–0.9877) for cropland, grassland, and forestland, respectively, with coefficients of variation (CVs) of 4.73 %, 1.79 %, and 1.94 % (Fig. 3d–f). The spatial distribution of soil β values across cropland, grassland, and forest ecosystems reveals both commonalities and notable differences. High β values are predominantly distributed in tropical and subtropical regions, including parts of South America, Oceania, and sub-Saharan Africa, whereas low β values are mainly concentrated in temperate regions, particularly in northern and western Europe and eastern and northern North America. Notably, the distribution of high β values varies across ecosystems. High β values are primarily observed in sub-Saharan Africa, central North America, and southern Oceania in cropland (Fig. 3d). For grassland, high β values are mainly concentrated in southeastern South America, southern Africa, and Oceania (Fig. 3e). Forestland exhibited the most extensive distribution of high β values, spanning from southern South America to central and southern Africa and Oceania (excluding the central region) (Fig. 3f). Cropland exhibits a more confined range of low values, mainly in northwestern Europe, while grassland and forestland display broader areas of low values, particularly across eastern and northern North America. These patterns underscore the geographic variability of soil β values, reflecting the complex interplay between environmental and ecological factors shaping these spatial distributions.
3.5 Spatial variability of the SOC density in subsoil
The estimated values for the global average SOC density of cropland, grassland, and forestland were 62 Mg ha−1 (95 % CI: 52–73), 70 Mg ha−1 (95 % CI: 57–83), and 97 Mg ha−1 (95 % CI: 80–117), respectively, for the 20–100 cm layer (Table S1 in the Supplement), with considerable spatial variations at the global scale (Fig. 4). The larger the soil β value, the more rapidly the SOC density decreased with an increase in soil depth. Spatially, there was geographic variability in the SOC density depending on the ecosystem. The higher values exhibited similar spatial patterns across each ecosystem type and were distributed mainly in northern and western Europe and northern and eastern North America.
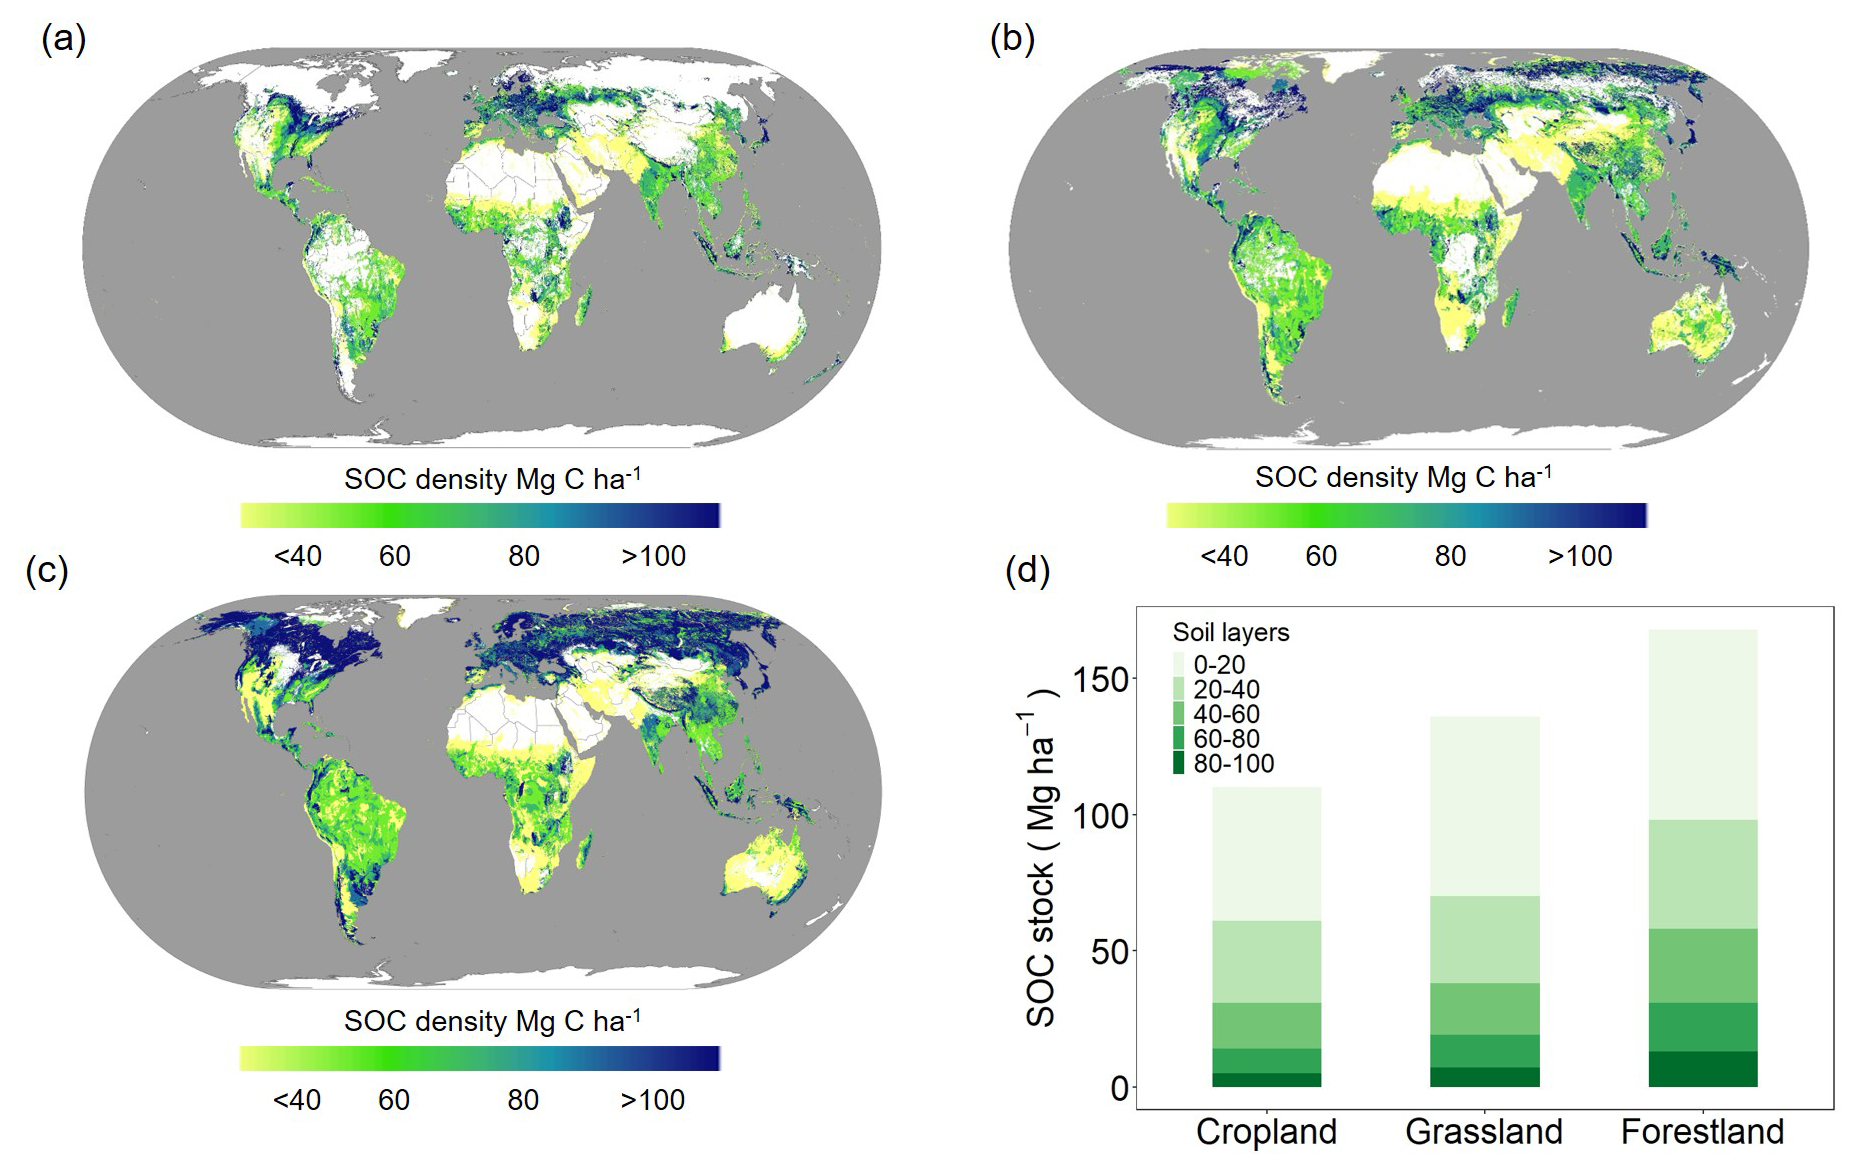
Figure 4Grid-level maps illustrating the predicted global subsoil SOC density for the 20–100 cm soil layer. Panels (a)–(c) represent cropland, grassland, and forestland, respectively. Panel (d) shows the SOC density in soil profiles of cropland, grassland, and forestland.
For cropland, lower SOC density values were predominantly distributed in eastern and southwestern Asia, sub-Saharan Africa, southern Africa, central North America, and southern Oceania. In contrast, higher SOC density values were mainly concentrated in temperate regions, such as parts of Europe, northern North America, and some regions in South America (Fig. 4a). For grassland, SOC density showed significant spatial variation, with lower values primarily distributed in eastern and southwestern Asia, eastern and southern South America, and Oceania. In contrast, higher values were concentrated in temperate regions, such as northern and western Europe and northern North America (Fig. 4b). For forestland, SOC density displayed clear spatial heterogeneity. Lower values were primarily distributed in northern South America, central and southern Africa, northeastern Africa, and the central region of Oceania, areas often characterized by tropical or subtropical climates with rapid organic matter decomposition rates (Fig. 4c). In contrast, higher values were predominantly found in temperate and boreal forest regions, including northern and western Europe, northern North America, and parts of eastern Asia. The spatial variation in SOC density at multiple depths (20–40, 40–60, 60–80, and 80–100 cm) was also estimated (Figs. S5–S7), exhibiting a decreasing trend with increasing depth.
3.6 Uncertainty analysis of subsoil SOC density across ecosystems
Overall, regions with high uncertainty are concentrated in tropical and subtropical areas, such as sub-Saharan Africa, Southeast Asia, the Amazon region of South America, and parts of Oceania. In contrast, regions with low uncertainty are primarily located in temperate and boreal areas, including northern Europe, northern North America, and northern Asia. Among them, forestland exhibits slightly higher SOC density prediction uncertainty (38 %) compared to grassland (37 %) and cropland (34 %) (Fig. 5).
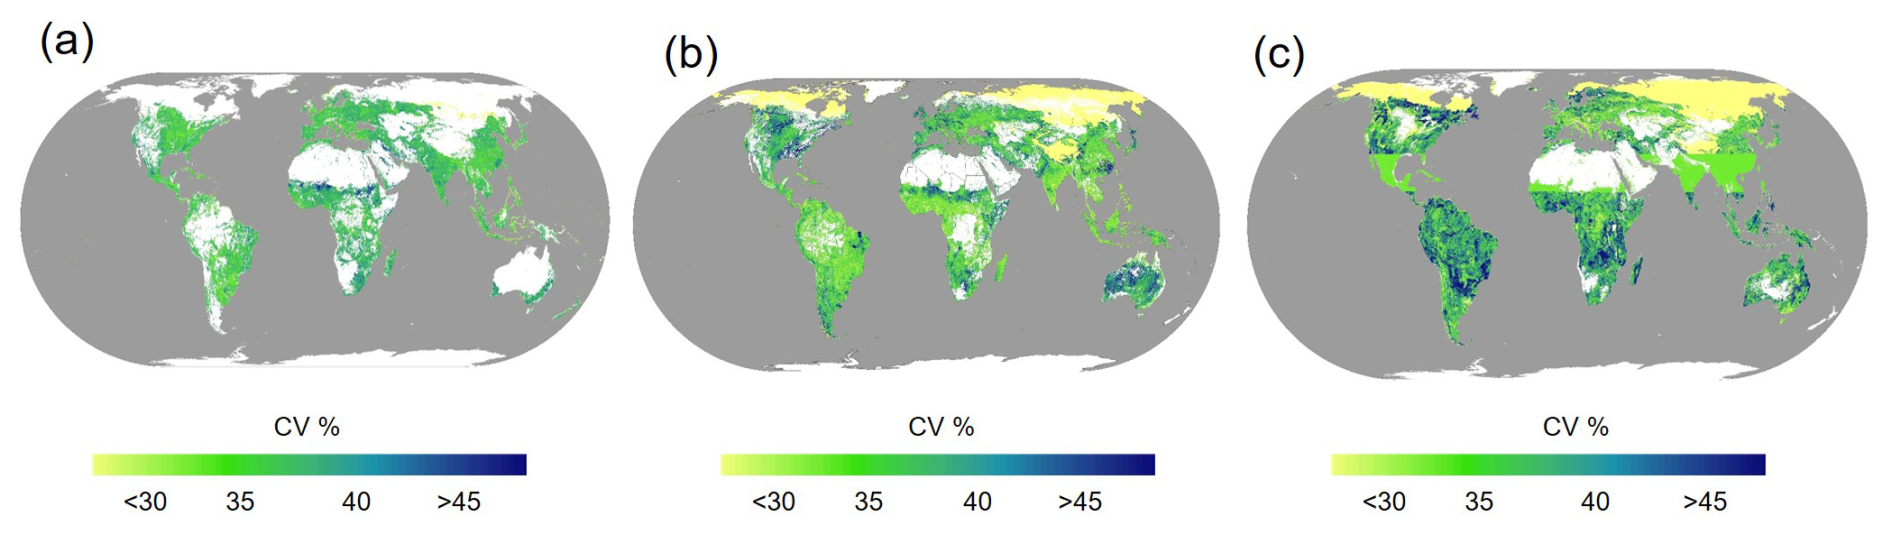
Figure 5Grid-level maps illustrating the uncertainty of predicted global subsoil SOC density. Panels (a)–(c) represent cropland, grassland, and forestland, respectively.
4.1 Comparison of high-resolution SOC dynamics
Global estimations of SOC stocks reported in the literature exhibit considerable variation. The estimated SOC stocks for cropland, grassland, and forestland (Table 1) in our study align closely with those of previous studies (Liu et al., 2021; Conant, 2010; Dixon et al., 1994). The SOC stock of all land in the 0–100 cm soil layer was 1418 Pg (95 % CI: 1276–1577), which was slightly lower than the estimates reported by Sanderman et al. (2017) and Batjes (1996). However, we believe that our estimation was not underestimated. This discrepancy may be due to the overestimation in Sanderman et al. (2017), which could be attributed to the suboptimal quality of the training dataset used in their spatial prediction models (R2=0.54). Earlier assessments (Batjes, 1996) relied on databases that included very few soil profiles from regions such as North America, Oceania, or the northern temperate zones. The subsoil SOC stock of all land was 803 Pg (95 % CI: 661–962), which was consistent with other research results (Scharlemann et al., 2014; Hiederer and Köchy, 2011; Zhou et al., 2024). We found that the subsoil contains 57 % of total SOC stocks in the top 0–1 m soil layer, which is consistent with the percentages cited in previous works (47 %–55 %) (Lal, 2018; Balesdent et al., 2018). Overall, this demonstrates the feasibility and accuracy of our methodology, with the estimations proving to be relatively accurate.
Table 1Comparisons of the estimated SOC stocks with other studies.
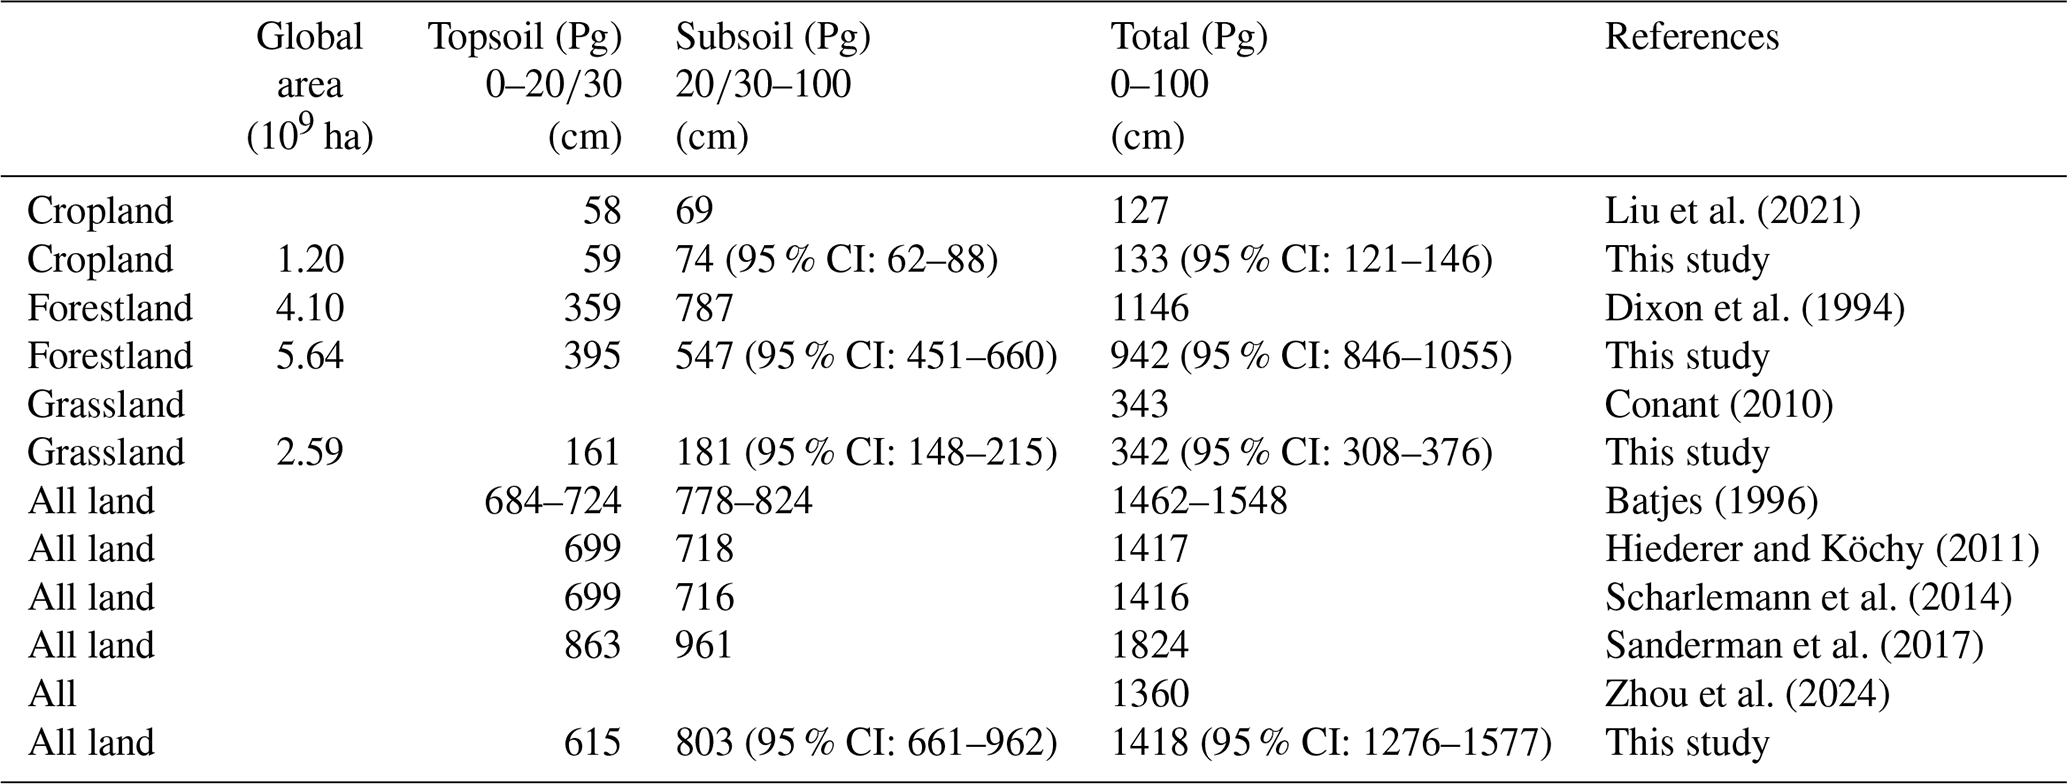
SOC denotes soil organic carbon, and 95 % CI refers to the confidence interval.
Similarly to the findings of Tao et al. (2023), our study reveals a global SOC density pattern with lower values at low latitudes and higher values at high latitudes. The vertical migration of organic matter is notably more pronounced in northern permafrost regions compared to in other areas. For cropland, consistently with the estimates by Wu et al. (2024), the spatial variation in relative SOC density across China shows higher carbon densities in the Northeast Plain, the Yangtze River basin, and the southeastern hills, while lower values are observed in the arid regions of northwestern China (e.g., the Taklamakan Desert) and the North China Plain. This pattern aligns well with the trends identified in our study. The FAO report “Global Assessment of Grassland Soil Carbon: Current Stocks and Sequestration Potential” aligns with our findings, highlighting high grassland carbon stocks in central China, northern Russia, northern Asia, southeastern South America, and central North America. However, our study also identifies Europe as having significant carbon stocks. This is mainly because the temperate climate, particularly in northern and western Europe, is humid and mild, providing favorable conditions for the formation and accumulation of soil organic matter. Unlike croplands and grasslands, forestlands are long-lasting vegetation types, with SOC being strongly shaped by local environmental conditions. Zhang et al. (2024) predicted forest SOC stocks across climatic zones and soil types, showing higher stocks in Europe, Russia, and Canada. Mediterranean and temperate regions also have higher SOC than tropical and subtropical regions, consistently with our findings, though the aforementioned study only considers surface soil.
Additionally, we observed higher SOC density in boreal forests and tundra regions, showing spatial variability consistent with the spatial variation in carbon turnover times reported in other study (Li et al., 2023a), particularly in northern high-latitude permafrost and tundra areas. This suggests that, in low-temperature environments, longer soil carbon turnover times and lower microbial activity reduce the decomposition rate of soil organic matter, allowing more SOC to accumulate. The highest SOC density and microbial ratios were found at high latitudes in tundra and boreal forests, probably due to the higher levels of organic matter in soils, greater fungal abundance, and lower nutrient availability in cold biomes (Gao et al., 2022).
Our estimated SOC density at 111 Mg ha−1 (95 % CI: 101–122) for cropland (Table S1) was higher than that reported in other studies (Liu et al., 2021) and lower than that of tropical cropland (Reichenbach et al., 2023). For forestland, the SOC stock was estimated to be 177 Mg ha−1 (95 % CI: 150–187) for the 0–100 cm soil layer (overall), which is consistent with the estimate reported by Dixon et al. (1994) but significantly lower than those observed in mangroves and tropical forestland (Atwood et al., 2017; Reichenbach et al., 2023). For grassland, it was 132 Mg ha−1 (95 % CI: 119–145) overall, which is much higher than the estimate of Conant et al. (2017). Finally, on a global scale, the SOC density of all land for the 0–100 cm soil layer was estimated to be 136 Mg ha−1 (95 % CI: 123–151), which was significantly higher than the estimate reported by Hiederer and Köchy (2011).
4.2 Factors affecting soil β values and spatial variation
MAT was the primary driver of soil β values, exhibiting a significant positive correlation. Specifically, with the increase in MAT, the β value increases, and the decrease in SOC density with depth becomes smaller (Fig. 2a). This shows that the higher the β value, the relatively lower the proportion of SOC stocks on the soil surface (which was consistent with previous research, e.g., Hartley et al., 2021; Melillo et al., 2017). It is generally accepted that, in cold and wet regions, low soil temperatures and/or anaerobic conditions promote the formation of thick organic horizons and peats, resulting in the storage of large amounts of SOC (García-Palacios et al., 2021). Tropical soils have the lowest SOC persistence, while polar and/or tundra soils and soils dominated by amorphous minerals exhibit the highest SOC abundance and persistence (von Fromm et al., 2024). These differences indicate that soil β values are high in low-latitude regions, such as tropical rainforest areas, and low in high-latitude regions, such as the tundra, showing a spatial distribution pattern. Climate warming may lead to greater SOC losses in surface soils compared to deeper layers, especially in high-latitude SOC-rich systems (Wang et al., 2022a). Experimental results of long-term warming show that soil respiration is sensitive to temperature rise (Xu et al., 2015). It could be driven by the changes in the temperature dependence of microbial process rates (Karhu et al., 2014). As field experiments have shown, warming can modify microbial physiology and resource availability (Poeplau et al., 2017).
We found a significant negative relationship between soil β values and MAP. This suggests that higher precipitation rates are associated with a steeper decrease in SOC density with increasing depth. This is primarily due to the pronounced positive correlation between MAP and the surface SOC density (Liu et al., 2023). In wetter climates where the precipitation exceeds evapotranspiration, there is a strong relationship between mineral-associated SOC concentration and persistence due to the humid soil environments that favor greater root growth and abundance (Heckman et al., 2023). The higher the intensity of precipitation, the more susceptible deep-soil carbon is to loss (Sun et al., 2024).
Additionally, BNPP plays a crucial role in the global land carbon cycle and carbon balance as it is a major source of SOC. The increase in BNPP, along with greater root exudates and changes in microbial activity, may lead to new carbon accumulation (Xiao et al., 2023), resulting in a decreasing trend in soil β values.
Our results emphasize that not only climate and biological factors but also edaphic properties play a critical role in explaining variations in β values (Fig. S1). The soil ratio and soil clay content both exhibited a similar negative correlation with the β value. A higher soil ratio may decelerate the decomposition rate of organic matter, thereby facilitating an increase in SOC content in warm and arid regions (Spohn et al., 2023), such that the soil β values would trend downward. Under a soil ratio > 15, warming significantly enhances the development of root biomass (Bai et al., 2023). This could induce a corresponding SOC accumulation. The clay fraction of the soil can absorb litter-derived C and microbial-derived C, promoting the accumulation of organic carbon (Hicks Pries et al., 2023).
Our results showed that, for near-neutral pH soils, the β values tend to be stable. In acidic soils, significant losses of SOC occur because microbial growth is more severely constrained, leading to a reduced efficiency in the decomposition and utilization of organic matter by microorganisms (Malik et al., 2018). Salinization and alkalization impede plant growth, leading to reduced biomass and lower organic matter input into the soil, causing the soil organic carbon content and organic carbon pool to remain very low (Li et al., 2023b). The harsh conditions of saline–alkaline soils hinder microbial survival and activity, reducing their efficiency in decomposing and utilizing organic matter. Soil pH had a nonlinear relationships with microorganisms: pH values tend to be neutral, and the abundance of microorganisms is higher (Patoine et al., 2022). The combination of these factors explains the higher β values observed under extreme acidic or alkaline conditions. Thus, near-neutral pH soils may enhance their carbon storage potential by improving microbial growth efficiency and facilitating the channeling of matrix components into biomass synthesis.
The effects of TN, MC, and MN on soil β values exhibited the same trend, which initially increased and then decreased. The TN stock in the soil exhibits a significant positive correlation with the SOC stock (Feng et al., 2018), leading to a reduction in the β value in nitrogen-enriched soils. MC had positive relationships with the SOC content across a large spatial scale because microbes should be considered to be not only a controlling factor in the consumption of SOC but also an influencing factor in the production of SOC (Tao et al., 2023). Microbial necromass has been identified as a major contributor to SOC formation across global ecosystems (Wang et al., 2021a). Evidence from China shows that microbial residues contribute a larger proportion of SOC in subsoils than in topsoil (Wen et al., 2023). Therefore, in soil profiles with high microbial carbon and nitrogen, the soil β value is smaller, indicating a steeper decrease in SOC density with increasing depth.
4.3 Challenges and opportunities: deep-soil SOC sequestration
More and more studies have highlighted the necessity of better understanding subsoil SOC dynamics. Biotic controls on SOC cycling become weaker as mineral controls predominate with depth (Hicks Pries et al., 2023). The topsoil is rich in carbohydrates and lignin, while the subsoil is rich in protein and lipids. Furthermore, the decrease rate of the ratio of the microbially derived carbon to plant-derived carbon with SOM content was 23 %–30 % slower in the subsoil than in the topsoil (Huang et al., 2023). Warming stimulates microbial metabolic activity in structurally complex organic carbon, resulting in a larger loss of subsoil polymeric SOC compared to in topsoil (Zosso et al., 2023). However, long-term experiments may not be long enough to quantify SOC dynamics in subsoil; large-scale research methods and machine learning are particularly important and necessary. Based on measured soil profile data and environmental variables, Wang et al. (2021b) employed machine learning methods to assess the SOC stocks and spatial distributions of subsoil in frozen-soil areas in the third pole region. The investigation of deep-soil organic carbon is inherently complex and involves intricate and time-intensive methodologies. This complexity results in a paucity of research data, which consequently introduces considerable uncertainties into model-derived predictions. To avoid underestimation or overestimation of the SOC stocks of an ecosystem, it is important to consider the subsoil when formulating sequestration policies for the whole soil profile (Button et al., 2022) as the “4 per 1000” approach for the top 30 to 40 cm soil layer provides an incomplete representation of the soil profile (Rumpel et al., 2018). It may be essential to sample the soil to deeper levels (e.g., 0–100 cm) and to incorporate deep soils into future manipulations, measurements, and models.
In addition, researchers have quantified the contributions of optimizing crop redistribution, improved management, and topsoil carbon sequestration to offsetting anthropogenic greenhouse gas emissions and climate change (Wang et al., 2022b; Rodrigues et al., 2021; Yin et al., 2023). Agricultural interventions such as super absorbent polymer application have been shown to directly enhance soil SOM (+7.5 %) and total nitrogen (+8.73 %), alongside improvements in water-stable aggregates (+18.9 %) (Zheng et al., 2023), which are critical soil properties governing subsoil carbon retention. However, the ability and consequence of subsoil SOC sequestration of crop management remain to be further studied. Conducting global-scale subsoil SOC dynamics studies will fill the knowledge gap in order to develop appropriate soil C sequestration strategies and policies to help the world cope with climate change and to ensure food security (Amelung et al., 2020; Bossio et al., 2020). As such, it is crucial that future research efforts focus on SOC sequestration efficiency in the context of climate change, considering the entire soil profile.
4.4 Strengths and limitations
Our research establishes a scientific foundation for further study of SOC dynamics, sequestration, and emissions reduction across soil profiles, offering significant insights into the matter of achieving Sustainable Development Goals (SDGs), notably SDG2 (Zero Hunger), SDG13 (Climate Action), and SDG15 (Life on Land) (https://www.undp.org/sustainable-development-goals, last access: 30 September 2023). To our knowledge, this is the first study to present global high-resolution maps illustrating the spatial distribution of SOC density within soil profiles as derived from soil β values informed by soil properties and climatic conditions. We observed pronounced variations in SOC density across ecosystems, with forestland demonstrating the highest densities, followed by grassland and cropland. However, the observed differences in SOC dynamics across these ecosystems were primarily attributed to the dominant biogeochemical properties of the soils (Reichenbach et al., 2023).
In our analysis, we incorporated a broad spectrum of environmental variables, including climatic factors and soil physicochemical properties, to examine subsoil SOC dynamics across different ecosystems. The variability decline in SOC density across soil profiles with depth in most areas underscores the imperative for refined soil management practices. Enhancing carbon sequestration in deeper soil horizons constitutes a promising avenue for future research. For example, increasing plant diversity and crop diversification have reinforced SOC stocks in subsoil, with this benefit amplifying over time (Lange et al., 2023; Xu et al., 2024). Current research has shed light on certain aspects of subsoil SOC sequestration mechanisms and turnover dynamics (Luo et al., 2019; Li et al., 2022). However, implementing targeted policies, such as incorporating organic materials and biochar, remains essential for enhancing the SOC sequestration potential of deeper soils (Button et al., 2022). These strategies could play a critical role in synergistically enhancing soil fertility and mitigating greenhouse gas emissions.
Some important aspects of SOC stocks were not included in this study. For instance, microbial necromass is a key contributor to SOC accumulation (Zhou et al., 2024). Due to difficulties in obtaining management data for grasslands and forestlands, we did not account for potential management-specific factors in soil β value estimations. For example, N fertilizer application, irrigation amount, soil tillage practices, and organic carbon inputs (straw return, crop residues, and litterfall) may influence the vertical movement of SOC. Moreover, organic carbon inputs can alter SOC decomposition rates, particularly in deeper soil layers (Cardinael et al., 2018).
We also acknowledge that soil layers may not always reach 1 m, especially in mountainous areas. Due to the lack of global soil thickness data, this limitation may lead to overestimation or underestimation of soil carbon storage in some regions. Focusing on 1 m profiles provides a reasonable approximation of SOC storage across different ecosystems. Although this approach may not fully capture the variation in soil thickness in high mountain areas, it enables us to gain valuable insights into SOC dynamics within the global carbon cycle. Future studies will incorporate more detailed soil thickness data to improve our understanding of SOC distribution.
The data of “global patterns of soil organic carbon distribution in the 20–100 cm soil profile for different ecosystems: a global meta-analysis” are available at https://doi.org/10.5281/zenodo.15019078 (Wang et al., 2025). The file named “Rawdata.xlsx” contains data sourced from the literature. The file name is “GE_β.tif”, with GE representing global ecosystems, including cropland (CL), grassland (GL), and forestland (FL). “FL_β.tif” represents the spatial distribution of β for forestland at 20–100 cm depth. The file name is “GE_d_SOCD.tif”, where SOCD represents soil organic carbon density, and d represents soil depth – for example, “FL_20–100_SOCD.tif” represents the spatial distribution of SOCD for forestland at 20–100 cm depth.
Accurately quantifying the distribution of soil profile SOC stocks is crucial for carbon sequestration and mitigation. Herein, machine learning was applied to the β model to estimate SOC stocks in soil profiles at depths of 20–100 cm. The subsoil SOC density values of cropland, grassland, and forestland were estimated to be 62 Mg ha−1 (95 % CI: 52–73), 70 Mg ha−1 (95 % CI: 57–83), and 97 Mg ha−1 (95 % CI: 80–117), respectively, with significant geographic variability across different ecosystems. Additionally, the global subsoil SOC stock was 803 Pg C (95 % CI: 661–962) (cropland, grassland, and forestland were 74 Pg C (95 % CI: 62–88), 181 Pg C (95 % CI: 148–215), and 547 Pg C (95 % CI: 451–660)), in which an average of 57 % resided in the top 0–100 cm of the soil profile. This dataset provides a valuable resource for refining existing Earth system models and enhancing prediction accuracy. Furthermore, it offers critical insights into global SOC dynamics and the spatial variability of SOC within entire soil profiles. Our findings also serve as a valuable reference for decision-makers in developing more effective carbon budget management strategies.
The supplement related to this article is available online at https://doi.org/10.5194/essd-17-3375-2025-supplement.
The study was completed with the cooperation of all of the authors. ZC and YY conceived and designed the research. HW contributed to the conceptualization, investigation, methodology, data curation, and visualization; conducted the data analysis; and wrote the original draft. TC contributed to the investigation, data curation, and conceptualization. XT contributed to the methodology, data curation, and visualization. ZC, KH, ZW, HG, QM, YW, YC, and MZ contributed to the scientific discussions. ZC was responsible for the conceptualization, supervision, and funding acquisition.
The contact author has declared that none of the authors has any competing interests.
Publisher's note: Copernicus Publications remains neutral with regard to jurisdictional claims made in the text, published maps, institutional affiliations, or any other geographical representation in this paper. While Copernicus Publications makes every effort to include appropriate place names, the final responsibility lies with the authors.
The authors would like to express their sincere gratitude to all of the data contributors whose valuable inputs made this research successful.
This work was financially supported by the National Key Research and Development Program of China (grant no. 2022FYD2300500), the National Natural Science Foundation of China (grant no. 4220012126), the PhD Scientific Research and Innovation Foundation of Sanya Yazhou Bay Science and Technology City (grant no. HSPHDSRF-2022-05-013), the Hainan Provincial Joint Project of Sanya Yazhou Bay Science and Technology City (grant no. 2021JJLH0015), and the National Key Research and Development Program of China (grant no. 2021YFD1900901).
This paper was edited by Zhen Yu and reviewed by Peiyu Cao and two anonymous referees.
Amelung, W., Bossio, D., de Vries, W., Kögel-Knabner, I., Lehmann, J., Amundson, R., Bol, R., Collins, C., Lal, R., Leifeld, J., Minasny, B., Pan, G., Paustian, K., Rumpel, C., Sanderman, J., van Groenigen, J. W., Mooney, S., van Wesemael, B., Wander, M., and Chabbi, A.: Towards a global-scale soil climate mitigation strategy, Nat. Commun., 11, 5427, https://doi.org/10.1038/s41467-020-18887-7, 2020.
Atwood, T. B., Connolly, R. M., Almahasheer, H., Carnell, P. E., Duarte, C. M., Ewers Lewis, C. J., Irigoien, X., Kelleway, J. J., Lavery, P. S., Macreadie, P. I., Serrano, O., Sanders, C. J., Santos, I., Steven, A. D. L., and Lovelock, C. E.: Global patterns in mangrove soil carbon stocks and losses, Nat. Clim. Change, 7, 523–528, https://doi.org/10.1038/nclimate3326, 2017.
Bai, T., Wang, P., Qiu, Y., Zhang, Y., and Hu, S.: Nitrogen availability mediates soil carbon cycling response to climate warming: A meta-analysis, Global Change Biol., 29, 2608–2626, https://doi.org/10.1111/gcb.16627, 2023.
Balesdent, J., Basile-Doelsch, I., Chadoeuf, J., Cornu, S., Derrien, D., Fekiacova, Z., and Hatté, C.: Atmosphere–soil carbon transfer as a function of soil depth, Nature, 559, 599–602, https://doi.org/10.1038/s41586-018-0328-3, 2018.
Batjes, N. H.: Total carbon and nitrogen in the soils of the world, Eur. J. Soil Sci., 47, 151–163, https://doi.org/10.1111/j.1365-2389.1996.tb01386.x, 1996.
Beillouin, D., Corbeels, M., Demenois, J., Berre, D., Boyer, A., Fallot, A., Feder, F., and Cardinael, R.: A global meta-analysis of soil organic carbon in the Anthropocene, Nat. Commun., 14, 3700, https://doi.org/10.1038/s41467-023-39338-z, 2023.
Bossio, D. A., Cook-Patton, S. C., Ellis, P. W., Fargione, J., Sanderman, J., Smith, P., Wood, S., Zomer, R. J., von Unger, M., Emmer, I. M., and Griscom, B. W.: The role of soil carbon in natural climate solutions, Nat. Sustainabil., 3, 391–398, https://doi.org/10.1038/s41893-020-0491-z, 2020.
Bradford, M. A., Wieder, W. R., Bonan, G. B., Fierer, N., Raymond, P. A., and Crowther, T. W.: Managing uncertainty in soil carbon feedbacks to climate change, Nat. Clim. Change, 6, 751–758, https://doi.org/10.1038/nclimate3071, 2016.
Button, E. S., Pett-Ridge, J., Murphy, D. V., Kuzyakov, Y., Chadwick, D. R., and Jones, D. L.: Deep-C storage: Biological, chemical and physical strategies to enhance carbon stocks in agricultural subsoils, Soil Biol. Biochem., 170, 108697, https://doi.org/10.1016/j.soilbio.2022.108697, 2022.
Cardinael, R., Guenet, B., Chevallier, T., Dupraz, C., Cozzi, T., and Chenu, C.: High organic inputs explain shallow and deep SOC storage in a long-term agroforestry system – combining experimental and modeling approaches, Biogeosciences, 15, 297–317, https://doi.org/10.5194/bg-15-297-2018, 2018.
Chabbi, A., Lehmann, J., Ciais, P., Loescher, H. W., Cotrufo, M. F., Don, A., SanClements, M., Schipper, L., Six, J., Smith, P., and Rumpel, C.: Aligning agriculture and climate policy, Nat. Clim. Change, 7, 307–309, https://doi.org/10.1038/nclimate3286, 2017.
Chen, J., Luo, Y., and Sinsabaugh, R. L.: Subsoil carbon loss, Nat. Geosci., 16, 284–285, https://doi.org/10.1038/s41561-023-01164-9, 2023.
Conant, R. T.: Challenges and opportunities for carbon sequestration in grassland systems: a technical report on grassland management and climate change mitigation, J. Agric. Sci., 148, 735–736, https://doi.org/10.1017/S0021859610000468, 2010.
Conant, R. T., Cerri, C. E. P., Osborne, B. B., and Paustian, K.: Grassland management impacts on soil carbon stocks: a new synthesis, Ecol. Appl., 27, 662–668, https://doi.org/10.1002/eap.1473, 2017.
Deng, L., Liu, G. B., and Shangguan, Z. P.: Land-use conversion and changing soil carbon stocks in China's `Grain-for-Green' Program: a synthesis, Global Change Biol., 20, 3544–3556, https://doi.org/10.1111/gcb.12508, 2014.
Ding, J., Li, F., Yang, G., Chen, L., Zhang, B., Liu, L., Fang, K., Qin, S., Chen, Y., Peng, Y., Ji, C., He, H., Smith, P., and Yang, Y.: The permafrost carbon inventory on the Tibetan Plateau: a new evaluation using deep sediment cores, Global Change Biol., 22, 2688–2701, https://doi.org/10.1111/gcb.13257, 2016.
Dixon, R. K., Solomon, A. M., Brown, S., Houghton, R. A., Trexier, M. C., and Wisniewski, J.: Carbon pools and flux of global forest ecosystems, Science, 263, 185–190, https://doi.org/10.1126/science.263.5144.185, 1994.
Don, A., Schumacher, J., and Freibauer, A.: Impact of tropical land-use change on soil organic carbon stocks – a meta-analysis, Global Change Biol., Global Change Biol., 17, 1658–1670, https://doi.org/10.1111/j.1365-2486.2010.02336.x, 2011.
Feng, J., Wu, J., Zhang, Q., Zhang, D., Li, Q., Long, C., Yang, F., Chen, Q., and Cheng, X.: Stimulation of nitrogen-hydrolyzing enzymes in soil aggregates mitigates nitrogen constraint for carbon sequestration following afforestation in subtropical China, Soil Biol. Biochem., 123, 136–144, https://doi.org/10.1016/j.soilbio.2018.05.013, 2018.
Feng, J., He, K., Zhang, Q., Han, M., and Zhu, B.: Changes in plant inputs alter soil carbon and microbial communities in forest ecosystems, Global Change Biol., 28, 3426–3440, https://doi.org/10.1111/gcb.16107, 2022.
Gale, M. R. and Grigal, D. F.: Vertical root distributions of northern tree species in relation to successional status, Can. J. Forest Res., 17, 829–834, https://doi.org/10.1139/x87-131, 1987.
Gao, D., Bai, E., Wang, S., Zong, S., Liu, Z., Fan, X., Zhao, C., and Hagedorn, F.: Three-dimensional mapping of carbon, nitrogen, and phosphorus in soil microbial biomass and their stoichiometry at the global scale, Global Change Biol., 28, 6728–6740, https://doi.org/10.1111/gcb.16374, 2022.
García-Palacios, P., Crowther, T. W., Dacal, M., Hartley, I. P., Reinsch, S., Rinnan, R., Rousk, J., Hoogen, J., Ye, J. S., and Bradford, M. A.: Evidence for large microbial-mediated losses of soil carbon under anthropogenic warming, Nat. Rev. Earth Environ., 2, 507–517, https://doi.org/10.1038/s43017-021-00178-4, 2021.
Griscom, B. W., Adams, J., Ellis, P. W., Houghton, R. A., Lomax, G., Miteva, D. A., Schlesinger, W. H., Shoch, D., Siikamaki, J. V., Smith, P., Woodbury, P., Zganjar, C., Blackman, A., Campari, J., Conant, R. T., Delgado, C., Elias, P., Gopalakrishna, T., Hamsik, M. R., Herrero, M., Kiesecker, J., Landis, E., Laestadius, L., Leavitt, S. M., Minnemeyer, S., Polasky, S., Potapov, P., Putz, F. E., Sanderman, J., Silvius, M., Wollenberg, E., and Fargione, J.: Natural climate solutions, P. Natl. Acad. Sci. USA, 114, 11645–11650, https://doi.org/10.1073/pnas.1710465114, 2017.
Hartley, I. P., Hill, T. C., Chadburn, S. E., and Hugelius, G.: Temperature effects on carbon storage are controlled by soil stabilisation capacities, Nat. Commun., 12, 6713, https://doi.org/10.1038/s41467-021-27101-1, 2021.
Heckman, K. A., Possinger, A. R., Badgley, B. D., Bowman, M. M., Gallo, A. C., Hatten, J. A., Nave, L. E., SanClements, M. D., Swanston, C. W., Weiglein, T. L., Wieder, W. R., and Strahm, B. D.: Moisture-driven divergence in mineral-associated soil carbon persistence, P. Natl. Acad. Sci. USA, 120, e2210044120, https://doi.org/10.1073/pnas.2210044120, 2023.
Hicks Pries, C. E., Ryals, R., Zhu, B., Min, K., Cooper, A., Goldsmith, S., Pett-Ridge, J., Torn, M., and Berhe, A. A.: The deep soil organic carbon response to global change, Annu. Rev. Ecol. Evol. Syst., 54, 375–401, https://doi.org/10.1146/annurev-ecolsys-102320-085332, 2023.
Hiederer, R. and Köchy, M.: Global Soil Organic Carbon Estimates and the Harmonized World Soil Database, European Union, https://doi.org/10.2788/13267, 2011.
Huang, W., Kuzyakov, Y., Niu, S., Luo, Y., Sun, B., Zhang, J., and Liang, Y.: Drivers of microbially and plant-derived carbon in topsoil and subsoil, Global Change Biol., 29, 6188–6200, https://doi.org/10.1111/gcb.16951, 2023.
Jackson, R. B., Mooney, H. A., and Schulze, E. D.: A global budget for fine root biomass, surface area, and nutrient contents, P. Natl. Acad. Sci. USA, 94, 7362–7366, https://doi.org/10.1073/pnas.94.14.7362, 1997.
Jia, J., Cao, Z., Liu, C., Zhang, Z., Lin, L., Wang, Y., Haghipour, N., Wacker, L., Bao, H., Dittmar, T., Simpson, M. J., Yang, H., Crowther, T. W., Eglinton, T. I., He, J. S., and Feng, X.: Climate warming alters subsoil but not topsoil carbon dynamics in alpine grassland, Global Change Biol., 25, 4383–4393, https://doi.org/10.1111/gcb.14823, 2019.
Jobbágy, E. and Jackson, R. B.: The vertical distribution of soil organic carbon and its relation to climate and vegetation, Ecol. Appl., 10, 423–436, https://doi.org/10.1890/1051-0761(2000)010[0423:TVDOSO]2.0.CO;2, 2000.
Karhu, K., Auffret, M. D., Dungait, J. A., Hopkins, D. W., Prosser, J. I., Singh, B. K., Subke, J. A., Wookey, P. A., Ågren, G. I., Sebastia, M. T., Gouriveau. F., Bergkvist, G., Meir, P., Nottingham, A. T., Salinas, N., and Hartley, I. P.: Temperature sensitivity of soil respiration rates enhanced by microbial community response, Nature, 513, 81–84, https://doi.org/10.1038/nature13604, 2014.
Lal, R.: Digging deeper: A holistic perspective of factors affecting soil organic carbon sequestration in agroecosystems, Global Change Biol., 24, 3285–3301, https://doi.org/10.1111/gcb.14054, 2018.
Lal, R.: Managing soils for negative feedback to climate change and positive impact on food and nutritional security, Soil Sci. Plant Nutr., 66, 1–9, https://doi.org/10.1080/00380768.2020.1718548, 2020.
Lal, R., Monger, C., Nave, L., and Smith, P.: The role of soil in regulation of climate, Philos. T. Roy. Soc. Lond. B, 376, 20210084, https://doi.org/10.1098/rstb.2021.0084, 2021.
Lange, M., Eisenhauer, N., Chen, H., and Gleixner, G.: Increased soil carbon storage through plant diversity strengthens with time and extends into the subsoil, Global Change Biol., 29, 2627–2639, https://doi.org/10.1111/gcb.16641, 2023.
Li, H., Wu, Y., Liu, S., Xiao, J., Zhao, W., Chen, J., Alexandrov, G., and Cao, Y.: Decipher soil organic carbon dynamics and driving forces across China using machine learning, Global Change Biol., 28, 3394–3410, https://doi.org/10.1111/gcb.1615, 2022.
Li, J., Ding, J., Yang, S., Zhao, L., Li, J., Huo, H., Wang, M., Tan, J., Cao, Y., Ren, S., Liu, Y., and Wang, T.: Depth-dependent driver of global soil carbon turnover times, Soil Biol. Biochem., 185, 109149, https://doi.org/10.1016/j.soilbio.2023.109149, 2023a.
Li, J. Q., Pei, J. M., Pendall, E., Reich, P. B., Noh, N. J., Li, B., Fang, C. M., and Nie, M.: Spatial heterogeneity and environmental predictors of permafrost region soil organic carbon stocks, Sci. Adv., 7, eaaz5326, https://doi.org/10.1002/advs.202001242, 2021.
Li, S., Zhao, L., Wang, C., Huang, H., and Zhuang, M.: Synergistic improvement of carbon sequestration and crop yield by organic material addition in saline soil: A global meta-analysis, Sci. Total Environ., 891, 164530, https://doi.org/10.1016/j.scitotenv.2023.164530, 2023b.
Liu, Y., Ge, T., van Groenigen, K. J., Yang, Y., Wang, P., Cheng, K., Zhu, Z., Wang, J., Li, Y., Guggenberger, G., Sardans, J., Penuelas, J., Wu, J., and Kuzyakov, Y.: Rice paddy soils are a quantitatively important carbon store according to a global synthesis, Commun. Earth Environ., 2, 154, https://doi.org/10.1038/s43247-021-00229-0, 2021.
Liu, Y., Zhuang, M., Liang, X., Lam, S. K., Chen, D., Malik, A., Li, M., Lenzen, M., Zhang, L., Zhang, R., Zhang, L., and Hao, Y.: Localized nitrogen management strategies can halve fertilizer use in Chinese staple crop production, Nat. Food, 5, 825–835, https://doi.org/10.1038/s43016-024-01057-z, 2024.
Liu, Z., Zhou, Q., Ma, Q., Kuang, W., Daryanto, S., Wang, L., Wu, J., Liu, B., Zhu, J., Cao, C., Li, X., Kou, Z., Shou, W., Qian, J., Liu, M., Xin, Z., Cui, X., and Liang, W.: Scale effect of climate factors on soil organic carbon stock in natural grasslands of northern China, Ecol. Indic., 146, 109757, https://doi.org/10.1016/j.ecolind.2022.109757, 2023.
Luo, Z., Wang, G., and Wang, E.: Global subsoil organic carbon turnover times dominantly controlled by soil properties rather than climate, Nat. Commun., 10, 3688, https://doi.org/10.1038/s41467-019-11597-9, 2019.
Luo, Z., Luo, Y., Wang, G., Xia, J., and Peng, C.: Warming-induced global soil carbon loss attenuated by downward carbon movement, Global Change Biol., 26, 7242–7254, https://doi.org/10.1111/gcb.15370, 2020.
Malik, A. A., Puissant, J., Buckeridge, K. M., Goodall, T., Jehmlich, N., Chowdhury, S., Gweon, H. S., Peyton, J. M., Mason, K. E., van Agtmaal, M., Blaud, A., Clark, I. M., Whitaker, J., Pywell, R. F., Ostle, N., Gleixner, G., and Griffiths, R. I.: Land use driven change in soil pH affects microbial carbon cycling processes, Nat. Commun., 9, 3591, https://doi.org/10.1038/s41467-018-05980-1, 2018.
Melillo, J. M., Frey, S. D., DeAngelis, K. M., Werner, W. J., Bernard, M. J., Bowles, F. P., Pold, G., Knorr, M. A., and Grandy, A. S.: Long-term pattern and magnitude of soil carbon feedback to the climate system in a warming world, Science, 358, 101–105, https://doi.org/10.1126/science.aan2874, 2017.
Mishra, U., Hugelius, G., Shelef, E., Yang, Y. H., Strauss, J., Lupachev, A., Harden, J. W., Jastrow, J. D., L., P. C., Riley, W. J., Schuur, E. A. G., Matamala, R., Siewert, M., Nave, L. E., Koven, C. D., Fuchs, M., Palmtag, J., Kuhry, P., Treat, C. C., and Zubrzycki, S.: Spatial heterogeneity and environmental predictors of permafrost region soil organic carbon stocks, Sci. Adv., 7, 1–12, https://doi.org/10.1126/sciadv.aaz5236, 2021.
Padarian, J., Minasny, B., McBratney, A., and Smith, P.: Soil carbon sequestration potential in global croplands, Peer J., 10, e13740, https://doi.org/10.7717/peerj.13740, 2022.
Patoine, G., Eisenhauer, N., Cesarz, S., Phillips, H. R. P., Xu, X., Zhang, L., and Guerra, C. A.: Drivers and trends of global soil microbial carbon over two decades, Nat. Commun., 13, 4195, https://doi.org/10.1038/s41467-022-31833-z, 2022.
Poeplau, C., Kätterer, T., Leblans, N. I., and Sigurdsson, B. D.: Sensitivity of soil carbon fractions and their specific stabilization mechanisms to extreme soil warming in a subarctic grassland, Global Change Biol., 23, 1316–1327, https://doi.org/10.1111/gcb.13491, 2017.
Poffenbarger, H. J., Olk, D. C., Cambardella, C., Kersey, J., Liebman, M., Mallarino, A., Six, J., and Castellano, M. J.: Whole-profile soil organic matter content, composition, and stability under cropping systems that differ in belowground inputs, Agr. Ecosyst. Environ., 291 106810, https://doi.org/10.1016/j.agee.2019.106810, 2020.
Qin, S., Yuan, H., Hu, C., Li, X., Wang, Y., Zhang, Y., Dong, W., Clough, T., Luo, J., Zhou, S., Wrage-Mönnig, N., Ma, L., and Oenema, O.: Anthropogenic N input increases global warming potential by awakening the “sleeping” ancient C in deep critical zones, Sci. Adv., 9, 1–8, https://doi.org/10.1126/sciadv.add0041, 2023.
Reichenbach, M., Fiener, P., Hoyt, A., Trumbore, S., Six, J., and Doetterl, S.: Soil carbon stocks in stable tropical landforms are dominated by geochemical controls and not by land use, Global Change Biol., 29, 2591–2607, https://doi.org/10.1111/gcb.16622, 2023.
Rodrigues, L., Hardy, B., Huyghebeart, B., Fohrafellner, J., Fornara, D., Barančíková, G., Bárcena, T. G., De Boever, M., Di Bene, C., Feizienė, D., Kätterer, T., Laszlo, P., O'Sullivan, L., Seitz, D., and Leifeld, J.: Achievable agricultural soil carbon sequestration across Europe from country-specific estimates, Global Change Biol., 27, 6363–6380, https://doi.org/10.1111/gcb.15897, 2021.
Rumpel, C., Lehmann, J., and Chabbi, A.: `4 per 1,000' initiative will boost soil carbon for climate and food security, Nature, 553, 27, https://doi.org/10.1038/d41586-017-09010-w, 2018.
Sanderman, J., Hengl, T., and Fiske, G. J.: Soil carbon debt of 12,000 years of human land use, P. Natl. Acad. Sci. USA, 114, 9575–9580, https://doi.org/10.1073/pnas.1706103114, 2017.
Scharlemann, J. P. W., Tanner, E. V. J., Hiederer, R., and Kapos, V.: Global soil carbon: understanding and managing the largest terrestrial carbon pool, Carbon Manage., 5, 81–91, https://doi.org/10.4155/cmt.13.77, 2014.
Shangguan, W., Dai, Y., Duan, Q., Liu, B., and Yuan, H.: A global soil data set for earth system modeling, J. Adv. Model. Earth Syst., 6, 249–263, https://doi.org/10.1002/2013ms000293, 2014.
Soong, J. L., Castanha, C., Hicks Pries, C. E., Ofiti, N., Porras, R. C., Riley, W. J., Schmidt, M. W. I., and Torn, M. S.: Five years of whole-soil warming led to loss of subsoil carbon stocks and increased CO2 efflux, Sci. Adv., 7, 21, https://doi.org/10.1126/sciadv.abd1343, 2021.
Spohn, M., Bagchi, S., Biederman, L. A., Borer, E. T., Bråthen, K. A., Bugalho, M. N., Caldeira, M. C., Catford, J. A., Collins, S. L., Eisenhauer, N., Hagenah, N., Haider, S., Hautier, Y., Knops, J. M. H., Koerner, S. E., Laanisto, L., Lekberg, Y., Martina, J. P., Martinson, H., McCulley, R. L., Peri, P. L., Macek, P., Power, S. A., Risch, A. C., Roscher, C., Seabloom, E. W., Stevens, C., Veen, G. F., Virtanen, R., and Yahdjian, L.: The positive effect of plant diversity on soil carbon depends on climate, Nat. Commun.,14, 6624, https://doi.org/10.1038/s41467-023-42340-0, 2023.
Sun, F., Fan, L., Deng, G., Kuzyakov, Y., Zhang, Y., Wang, J., Li, Y., Wang, F., Li, Z., Tariq, A., Sardans, J., Penuelas, J., Wang, and M., Peng, C.: Responses of tropical forest soil organic matter pools to shifts in precipitation patterns, Soil Biol. Biochem., 197, 109530, https://doi.org/10.1016/j.soilbio.2024.109530, 2024.
Tang, X., Zhao, X., Bai, Y., Tang, Z., Wang, W., Zhao, Y., Wan, H., Xie, Z., Shi, X., Wu, B., Wang, G., Yan, J., Ma, K., Du, S., Li, S., Han, S., Ma, Y., Hu, H., He, N., Yang, Y., Han, W., He, H., Yu, G., Fang, J., and Zhou, G.: Carbon pools in China's terrestrial ecosystems: New estimates based on an intensive field survey, P. Natl. Acad. Sci. USA, 115, 4021–4026, https://doi.org/10.1073/pnas.1700291115, 2018.
Tao, F., Huang, Y., Hungate, B. A., Manzoni, S., Frey, S. D., Schmidt, M. W. I., Reichstein, M., Carvalhais, N., Ciais, P., Jiang, L., Lehmann, J., Wang, Y. P., Houlton, B. Z., Ahrens, B., Mishra, U., Hugelius, G., Hocking, T. D., Lu, X., Shi, Z., Viatkin, K., Vargas, R., Yigini, Y., Omuto, C., Malik, A. A., Peralta, G., Cuevas-Corona, R., Di Paolo, L. E., Luotto, I., Liao, C., Liang, Y. S., Saynes, V. S., Huang, X., and Luo, Y.: Microbial carbon use efficiency promotes global soil carbon storage, Nature, 618, 981–985, https://doi.org/10.1038/s41586-023-06042-3, 2023.
Vanden B., A. J., Gregorich, E. G., Angers, D. A., and Stoklas, U. F.: Uncertainty analysis of soil organic carbon stock change in Canadian cropland from 1991 to 2001, Global Change Biol., 10, 983–994, https://doi.org/10.1111/j.1365-2486.2004.00780.x, 2004.
von Fromm, S. F., Hoyt, A. M., Sierra, C. A., Georgiou, K., Doetterl, S., and Trumbore, S. E.: Controls and relationships of soil organic carbon abundance and persistence vary across pedo-climatic regions, Global Change Biol., 30, e17320, https://doi.org/10.1111/gcb.17320, 2024.
Wang, C., Qu, L., Yang, L., Liu, D., Morrissey, E., Miao, R., Liu, Z., Wang, Q., Fang, Y., and Bai, E.: Large-scale importance of microbial carbon use efficiency and necromass to soil organic carbon, Global Change Biol., 27, 2039–2048, https://doi.org/10.1111/gcb.15550, 2021a.
Wang, D., Wu, T., Zhao, L., Mu, C., Li, R., Wei, X., Hu, G., Zou, D., Zhu, X., Chen, J., Hao, J., Ni, J., Li, X., Ma, W., Wen, A., Shang, C., La, Y., Ma, X., and Wu, X.: A 1 km resolution soil organic carbon dataset for frozen ground in the Third Pole, Earth Syst. Sci. Data., 13, 3453–3465, https://doi.org/10.5194/essd-13-3453-2021, 2021b.
Wang, H., Cai, T., Tian, X., Chen, Z., He, K., Wang, Z., Gong, H., Miao, Q., Wang, Y., Chu, Y., Zhang, Q., Zhuang, M., Yin, Y., and Cui, Z.: Global patterns of soil organic carbon distribution in the 20–100 cm soil profile for different ecosystems: A global meta-analysis [Dataset], Zenodo [data set], https://doi.org/10.5281/zenodo.15019078, 2025.
Wang, J., Wei, X., Jia, X., Huang, M., Liu, Z., Yao, Y., and Shao, M.: An empirical approach to predict regional organic carbon in deep soils, Sci. China Earth Sci., 66, 583–593, https://doi.org/10.1007/s11430-022-1032-2, 2023.
Wang, M., Guo, X., Zhang, S., Xiao, L., Mishra, U., Yang, Y., Zhu, B., Wang, G., Mao, X., Qian, T., Jiang, T., Shi, Z., and Luo, Z.: Global soil profiles indicate depth-dependent soil carbon losses under a warmer climate, Nat. Commun., 13, 5514, https://doi.org/10.1038/s41467-022-33278-w, 2022a.
Wang, Z., Yin, Y., Wang, Y., Tian, X., Ying, H., Zhang, Q., Xue, Y., Oenema, O., Li, S., Zhou, F., Du, M., Ma, L., Batchelor, W. D., Zhang, F., and Cui, Z.: Integrating crop redistribution and improved management towards meeting China's food demand with lower environmental costs, Nat. Food, 3, 1031–1039, https://doi.org/10.1038/s43016-022-00646-0, 2022b.
Wen, S., Chen, J., Yang, Z., Deng, L., Feng, J., Zhang, W., Zeng, X., Huang, Q., Delgado-Baquerizo, M., and Liu, Y.: Climatic seasonality challenges the stability of microbial-driven deep soil carbon accumulation across China, Global Change Biol., 29, 4430–4439, https://doi.org/10.1111/gcb.16760, 2023.
Wu, J., Liu, S., Peng, C., Luo, Y., Terrer, C., Yue, C., Peng, S., Li, J., Wang, B., Shangguan, Z., and Deng, L.: Future soil organic carbon stocks in China under climate change, Cell Rep. Sustainabil., 1, 100179. https://doi.org/10.1016/j.crsus.2024.100179, 2024.
Xiao, L., Wang, G., Chang, J., Chen, Y., Guo, X., Mao, X., Wang, M., Zhang, S., Shi, Z., Luo, Y., Cheng, L., Yu, K., Mo, F., and Luo, Z.: Global depth distribution of belowground net primary productivity and its drivers, Global Ecol. Biogeogr., 32, 1435–1451, https://doi.org/10.1111/geb.13705, 2023.
Xu, X., Thornton, P. E., and Post, W. M.: A global analysis of soil microbial biomass carbon, nitrogen and phosphorus in terrestrial ecosystems, Global Ecol. Biogeogr., 22, 737–749, https://doi.org/10.1111/geb.12029, 2013.
Xu, X., Shi, Z., Li, D., Zhou, X., Sherry, R. A., and Luo, Y.: Plant community structure regulates responses of prairie soil respiration to decadal experimental warming, Global Change Biol., 21, 3846–3853, https://doi.org/10.1111/gcb.12940, 2015.
Xu, Y., Zhou, J., Liu, C., Jia, R., Ji, H., Dippold, M. A., Zhao, T., Pavinato, P. S., Peixoxo, L., Yang, Y., Sui, P., Zeng, Z., and Zang, H.: Long-term rotational and perennial cropping benefit soil organic carbon stocks and ecosystem multifunctionality, Ind. Crop. Prod., 209, 117980, https://doi.org/10.1016/j.indcrop.2023.117980, 2024.
Xu, Y., Xu, X., Li, J., Guo, X., Gong, H., Ouyang, Z., Zhang, L., and Mathijs, E.: Excessive synthetic fertilizers elevate greenhouse gas emissions of smallholder-scale staple grain production in China, J. Clean. Product., 430, 139720, https://doi.org/10.1016/j.jclepro.2023.139720, 2023.
Yang, Y., Luo, Y., and Finzi, A. C.: Carbon and nitrogen dynamics during forest stand development: a global synthesis, New Phytol., 190, 977–989, https://doi.org/10.1111/j.1469-8137.2011.03645.x, 2011.
Yin, Y., He, K., Chen, Z., Li, Y., Ren, F., Wang, Z., Wang, Y., Gong, H., Zhu, Q., Shen, J., Liu, X., and Cui, Z.: Agricultural green development to coordinate food security and carbon reduction in the context of China's dual carbon goals, Front. Agric. Sci. Eng., 10, 262–267, https://doi.org/10.15302/j-fase-2023496, 2023.
Zhang, Y., Guo, X., Chen, L., Kuzyakov, Y., Wang, R., Zhang, H., Han, X., Jiang, Y., and Sun, O.: Global pattern of organic carbon in forest soils, Global Change Biol., 30, e17386, https://doi.org/10.1111/gcb.17386, 2024.
Zhao, S., Schmidt, S., Gao, H., Li, T., Chen, X., Hou, Y., Chadwick, D., Tian, J., Dou, Z., Zhang, W., and Zhang, F.: A precision compost strategy aligning composts and application methods with target crops and growth environments can increase global food production, Nat. Food, 3, 741–752, https://doi.org/10.1038/s43016-022-00584-x, 2022.
Zheng, H. F., Mei, P. P., Wang, W. D., Yin, Y. L., Li, H. J., Zheng, M. Y., Ou, X. Q., and Cui, Z. L.: Effects of super absorbent polymer on crop yield, water productivity and soil properties: A global meta-analysis, Agr. Water Manage., 282, 108290, https://doi.org/10.1016/j.agwat.2023.108290, 2023.
Zhou, Z., Ren, C., Wang, C., Delgado-Baquerizo, M., Luo, Y., Luo, Z., Du, Z., Zhu, B., Yang, Y., Jiao, S., Zhao, F., Cai, A., Yang, G., and Wei, G.: Global turnover of soil mineral-associated and particulate organic carbon, Nat. Commun., 15, 5329, https://doi.org/10.1038/s41467-024-49743-7, 2024.
Zosso, C. U., Ofiti, N. O. E., Torn, M. S., Wiesenberg, G. L. B., and Schmidt, M. W. I.: Rapid loss of complex polymers and pyrogenic carbon in subsoils under whole-soil warming, Nat. Geosci., 16, 344–348, https://doi.org/10.1038/s41561-023-01142-1, 2023.