the Creative Commons Attribution 4.0 License.
the Creative Commons Attribution 4.0 License.
 | 11 Jul 2025
Comprehensive inventory of large hydropower systems in the Italian Alpine Region
Andrea Galletti
Soroush Zarghami Dastjerdi
Bruno Majone
Climate change raises the critical need to understand its impact on water resources, particularly as hydropower's role as a flexible, renewable energy source becomes more vital in planning for the energy system's decarbonization. While hydrological modeling represents an established tool for assessing the future evolution of water resources, a key challenge lies in its reliance on data describing the geometry and operation of hydropower systems interacting with the natural stream network. The Italian Alpine Region (IAR) is home to over 300 large hydropower systems (LHSs), and its hydrological cycle is expected to suffer major alterations due to climate change. However, detailed and reliable hydrological studies in this region face hindrances due to the absence of a consistent, comprehensive, and openly available LHS source.
We present IAR-HP (Italian Alpine Region HydroPower), a comprehensive inventory specifically designed for the inclusion in hydrological modeling of LHSs located in the Italian Alpine Region, to overcome this obstacle. This dataset aims to support modelers in the water–energy nexus by providing crucial information for accurately informing their models. Compiled from various online sources, IAR-HP is openly accessible and reproducible, offering a solution to the scarcity of data hindering effective storage-hydropower-related simulations. The dataset includes detailed information about 338 LHSs, with a collective installed power of 14.3 GW and an average production of 32.1 TW h yr−1; these LHSs contribute 11.8 % of the electricity generated in Italy, corresponding to roughly 80 % of the national hydropower generation. The dataset was validated through a hydropower production modeling exercise, and was able to reconstruct 96.2 % of the observed hydropower production across the Italian Alpine Region. By presenting this dataset, we contribute a practical tool for scientists to reduce the inherent uncertainty of hydrological models, improving their ability to represent large hydropower systems accurately. IAR-HP holds potential for numerous applications to inform decision-making in the dynamic context of climate change. The IAR-HP dataset presented in this paper are available through Zenodo at https://doi.org/10.5281/zenodo.14040971 (Galletti et al., 2024).
- Article
(5354 KB) - Full-text XML
- BibTeX
- EndNote


Hydropower stands as a cornerstone of Italy's renewable energy context, harnessing the power of its rivers and mountainous terrain, and has consistently contributed around 15 %–20 % to Italy's total electricity generation since the 1980s (Ember, 2024). More than 80 % of it is produced within river catchments originated in the Alps (Terna, 2024), which are home to more than 200 large dams with the main or sole purpose of hydropower production, developed from the early 1900s up to the 1980s (MIT, 2022). Notwithstanding the increasing integration of solar and wind renewable power started in the early 2010s (Ember, 2024), and without significantly increasing its installed capacity since the late 1980s, hydropower has remained vital due to the power generation and storage capabilities that make it a reliable backbone in an increasingly renewable energy mix that leverages a growing share of intermittent power sources.
Hydropower systems in the Alpine Region are expected to face significant impacts due to climate change, primarily from alterations in precipitation patterns, snowmelt timing (Gaudard et al., 2013, 2014; Maran et al., 2014), and the frequency of extreme weather events. In the Italian Alps, these changes could lead to significant changes in the seasonality of water inflows to storage reservoirs, thus affecting the predictability and reliability of hydropower generation (Majone et al., 2016). A continuous reduction of Alpine glaciers is projected to affect hydropower production negatively (Patro et al., 2018), while earlier snowmelt caused by rising temperatures is expected to increase spring runoff (Wagner et al., 2016), while at the same time causing lower water availability during the critical summer months when the conflicts among different water uses are more pronounced (Maran et al., 2014; La Jeunesse et al., 2016). Indeed, several sectors throughout the Alps rely on timely water availability: agriculture, hydropower production, industrial cooling, and drinking water supply are the most prominent examples. Integrated modeling perspectives have become a customary approach among hydrologists (Falloon and Betts, 2010), to cope with the complex interaction among different sectors and come up with sound adaptation strategies in face of the hydro-climatic uncertainty anticipated from climate change (Howells et al., 2013). The WEFE (water–energy–food–ecosystems) nexus has catalyzed a wealth of attention: a clear majority of the research conducted over Mediterranean case studies involves assessments regarding the water–energy side of the nexus, followed by the water–energy–food triangle (Lucca et al., 2023), highlighting the societal importance of these sectors and their intertwined dynamics. On the other hand, hydropower development is known to have adverse environmental impacts – such as hydropeaking (Bruno et al., 2023), altered sediment transport (Dethier et al., 2022), disrupted fish migration (Anderson et al., 2015), and river network disconnectivity (Carolli et al., 2023) – which integrated models should adequately capture. In light of these considerations, it is clear that any underlying assumption will have cascading effects on the results of any modeling endeavor. Concerning modeling the water–energy nexus over large-scale domains, the largest share of uncertainty can be attributed to two key factors: (i) characterization of the existing hydraulic infrastructure, and (ii) its management by the operating companies. As per the latter, it is no secret that actual management strategies (for reservoir- and pumped-storage hydropower) are kept confidential by companies (Schaefli, 2015). Hence this variable is often reconstructed based on different proxies, or assumed by resorting to generalized approaches (see e.g., Finger et al., 2012; Shrestha et al., 2014; Fatichi et al., 2015; Turner et al., 2017; Galletti et al., 2021; Vu et al., 2023). The characterization of existing hydraulic infrastructures has originated many notable endeavors: GRanDD (Lehner et al., 2011), GOODD (Mulligan et al., 2020), and GDAT (Tianbo Zhang and Gu, 2023) are among the most valuable global-scale georeferenced datasets of large dams, and contain information such as dam location, and geometric and hydraulic properties. These datasets contain plentiful information for global-scale assessments; however, they might not fully suit the goal of WEFE nexus assessments, as these often require detailed information on the location, timing, and amount of water diversions. With particular reference to the case study of the Italian Alpine Region, global-scale dam datasets encounter some limitations: firstly, run-of-the-river (RoR) plants (which by definition are not connected to large storage dams) are not included in these datasets; secondly, large hydropower systems (LHSs; by Italian regulation, those plants with an installed capacity greater than 3 MW) can be fed by relatively small dams with high hydraulic heads, once again being uncharted within global large-dam datasets; thirdly, knowing the location and hydraulic properties of additional water intakes is of utmost importance to correctly model the spatial availability of water resources, as well as the river discontinuity caused by hydropower-related water abstractions. Data concerning hydropower plants over Europe are available through the Energy and Industry Geography Lab portal (https://energy-industry-geolab.jrc.ec.europa.eu/, last access: 18 October 2024), mostly solving the issue of “invisible” run-of-the-river plants mentioned earlier. However, the dataset does not record the location of their water intakes.
Motivated by the need for a comprehensive dataset for modeling hydropower (HP) production and its hydrological/environmental implications over the Italian Alpine Region (IAR), we propose IAR-HP, a dataset specifically aimed at providing a comprehensive anagraphic of the existing large hydropower systems, complete with as much geometric, hydraulic, and management information as possible, to enable thorough assessments over such a complex and relevant domain. The dataset was compiled in order to comply with the information requirements (geometric, geospatial, and operational attributes of all LHS-related infrastructures) of the modeling approach described in Galletti et al. (2021), but its content can be easily adapted to any modeling framework. In the absence of official open-source information, we also provide validation of IAR-HP in terms of hydropower production modeling, conducting a modeling exercise over the entire IAR domain with the HYPERstreamHS hydrological model (Avesani et al., 2021). The paper is structured as follows. Firstly, we give a comprehensive description of IAR-HP, starting from the definitions and assumptions that were made to complete the data collection and concluding with the presentation and discussion of some of the key statistics concerning the information gathered in IAR-HP. Secondly, we present a hydrologically based exercise of hydropower production modeling that we conducted to validate the dataset. We close the paper with some remarks on the strengths and limitations of our dataset, hoping to boost its accessibility and interoperability in other water–energy nexus assessments.
This section is divided into two main parts. The first part outlines the data collection procedure and details how the information was sorted and filtered to characterize large hydropower systems across the Italian Alpine Region. This includes a comprehensive explanation of the dataset framework structure, specifying the data types collected, the sources from which the data were obtained, and the criteria for sorting and filtering the information. It further explains how these datasets interact with each other to provide a coherent and detailed characterization of the hydropower systems.
The second part focuses on the validation of the resulting dataset using a hydrological model. This exercise involves two main steps: firstly, we calibrate the model's hydrological kernel in several representative watersheds; secondly, we execute the model and compute time series of daily hydropower production at each LHS through dedicated routines. The validation objective is to reproduce historical provincial hydropower production monthly time series within the IAR domain.
2.1 Database description
2.1.1 Database design
According to the data reported by the Italian electrical grid manager (TERNA; Terna, 2024), more than 90 % of the energy produced in the IAR is derived from large hydropower systems. Based on Italian legal standards, hydropower systems are classified as “small” or “large”, with the threshold for large hydropower systems set at 3 MW installed capacity. Therefore, the IAR-HP dataset focuses specifically on hydropower facilities with an installed capacity exceeding 3 MW. This dataset provides comprehensive information on key factors such as identification characteristics, structural connections, and operational constraints for each large hydropower system.
The IAR-HP design and definition build on its initial implementation for the HYPERstreamHS hydrological model (Avesani et al., 2021) applied to the Adige catchment (Galletti et al., 2021), the third largest catchment in Italy, consisting of several complex hydroelectric systems. Following the satisfactory outcomes of this modeling endeavor, we attempted to expand IAR-HP following the same approach for the whole IAR domain to alleviate the lack of a homogeneous, comprehensive, and freely accessible source of information concerning large hydropower systems.
The simulation of hydropower systems in HYPERstreamHS follows a nodes–links framework. In this framework, all hydropower-related infrastructures are represented as nodes, allowing them to be grouped based on their type: power plants, reservoirs, and water intakes. Each node type applies different constraints to water mass balance, reflecting the operational behavior of each structure, as extensively detailed in Avesani et al. (2021) and Galletti et al. (2021).
2.1.2 Database collection
As IAR-HP was initially designed for large-scale hydroelectric facilities modeling, this approach embeds the phenomenal challenge of achieving a consistent level of detail throughout the database. The challenges involve gathering information from extremely inhomogeneous data sources such as regional or provincial webGIS, catchment authority reports, leaflets, construction plans, and web news, to name the most common. Table 1 summarizes the key geolocation, topologic, and qualitative attributes common to each node in IAR-HP, while the type-specific characteristics recorded for each infrastructure element are summarized in Table 2. In the upcoming paragraphs we will discuss how data collection issues were tackled and how the key features of different infrastructures were harmonized into IAR-HP.
Table 1IAR-HP geolocation and topological characteristics for each node.
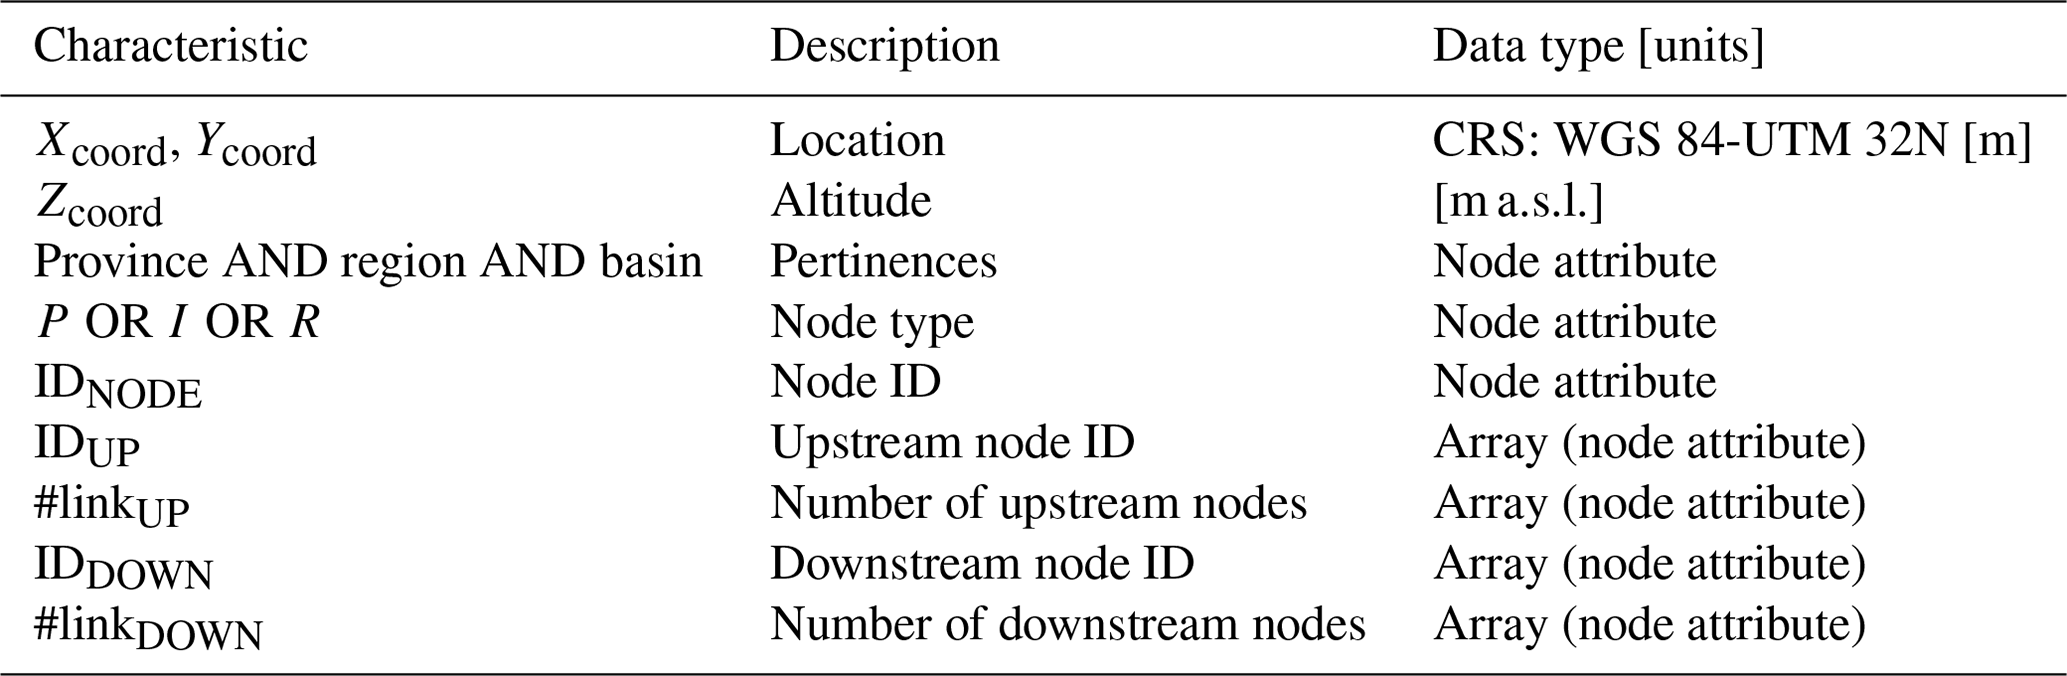
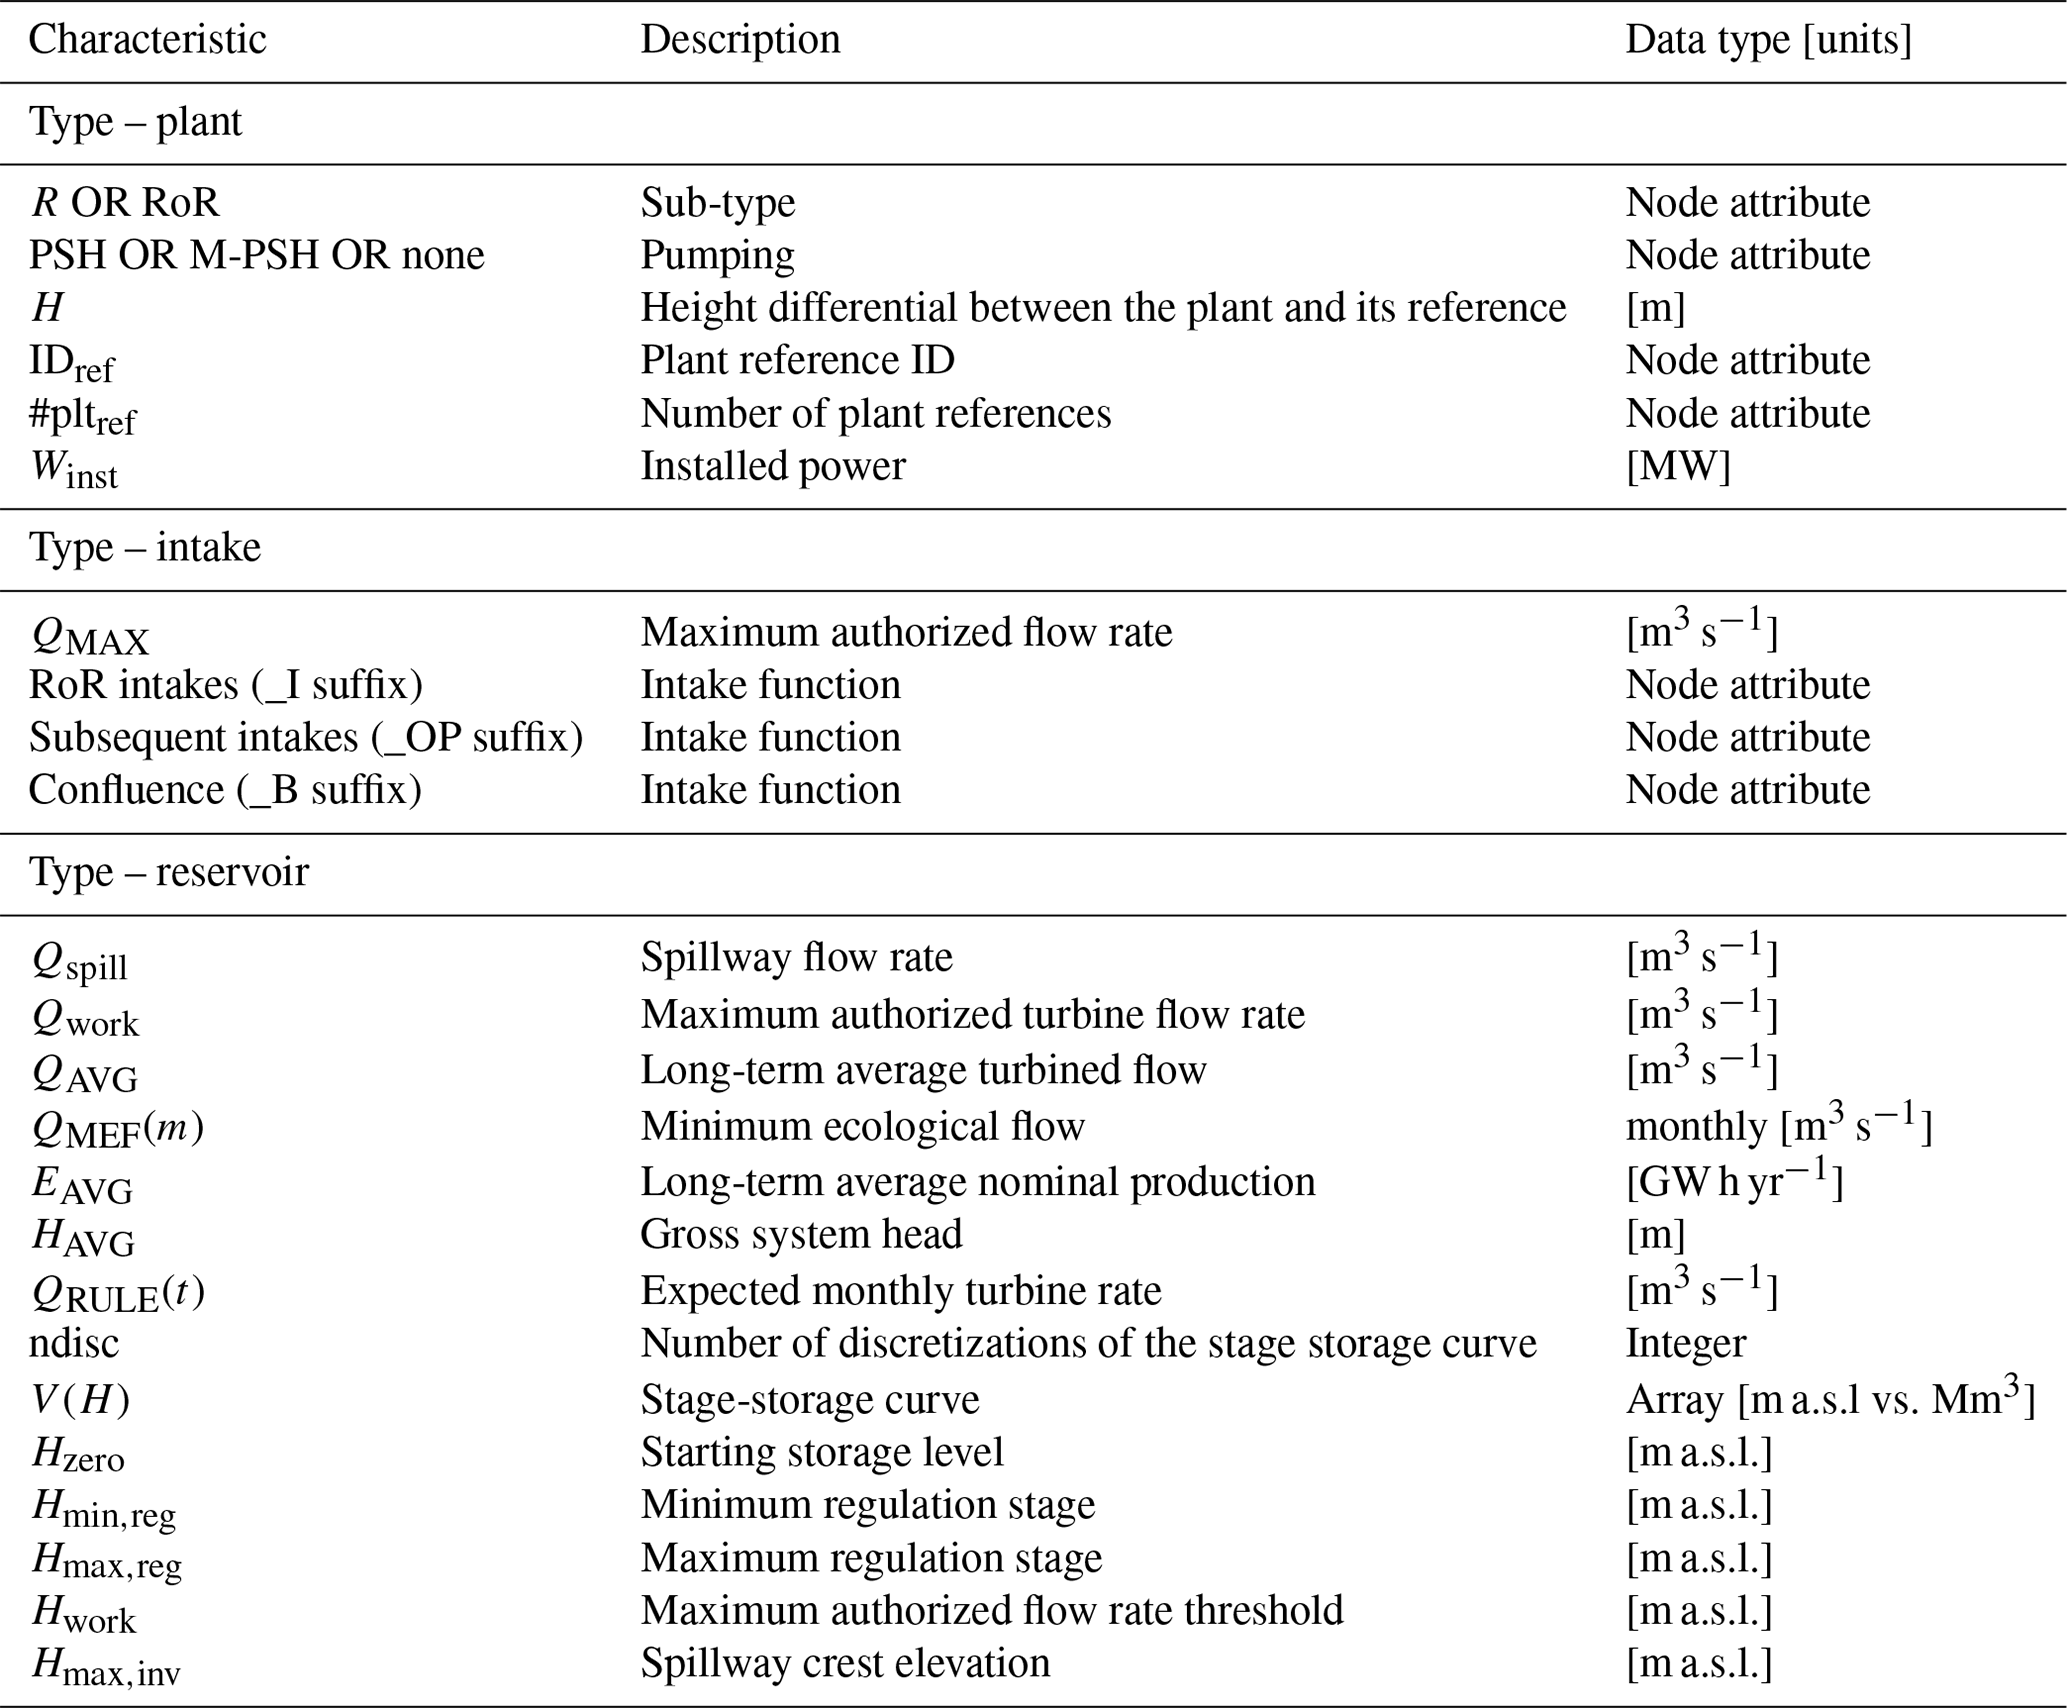
Table 2IAR-HP characteristics for each node type, adapted from Galletti et al. (2021).
X and Y coordination attributes of hydropower systems are the basic needs for providing a baseline of where these systems interact with water bodies. To this end, the main references were regional/provincial webGIS's and construction architectural plans, with the former providing most of the geolocation of all systems and the latter completing the information about the topological layout (i.e., connections).
Most of the topological information is stored in the node ID's. Each node is provided with a unique numeric identifier, IDNODE. Connections are achieved by referring to upstream and/or downstream node IDs (IDUP and IDDOWN). In general, one node can have any number of upstream nodes and only one downstream node; this was chosen because, in the rare occurrence where flow is diverted to more than one source, this involves complex and subjective maneuvering, a level of detail which is impossible to reliably reconstruct at the scale of IAR-HP. Finally, each node is assigned a type (Reservoir, Intake, or Plant) and three pertinence attributes (Province, Region, Basin) for easier filtering or analytical purposes. A detailed exemplification of how to reconstruct system topology is provided in Sect. 3 of the dataset documentation (dataset available at https://doi.org/10.5281/zenodo.14040971, Galletti et al., 2024).
The geo-topologic information, however, was either not up to date or not present at all for many regions: the initial analysis was refined by visually investigating the locations of all systems through third-party resources such as OpenStreetMap and Google Earth.
The Z coordinate plays a key role in our dataset, as it single-handedly defines the hydraulic head available to each LHS, directly correlating to its ability to produce energy. As a preliminary step, the Z coordinate was inferred by matching the X–Y coordinates and a high-resolution digital elevation model (DEM) with a horizontal resolution of 30 m. This first estimation was then refined, comparing the nominal head for all LHSs with the head difference originated by the nodes in question. In the case of minimal differences, the initial estimation was not modified for consistency. In contrast, for larger differences the relevant Z coordinates were modified to match the nominal head declared for the LHSs. This operation was mostly necessary in low-head, high-flow, run-of-the-river plants, where a few meters can significantly impact the overall production. The resulting X–Y locations of reservoirs and hydropower plants present in IAR-HP, as well as the diversion channels and penstocks connecting them, are displayed in Fig. 1. In the same figure, the inset highlights the level of detail generally captured in IAR-HP with a specific focus on the Aosta province: this province hosts the largest number of RoR systems, and exhibits a complex network of diversion channels; the accuracy of their depiction is one of the most valuable features of IAR-HP.
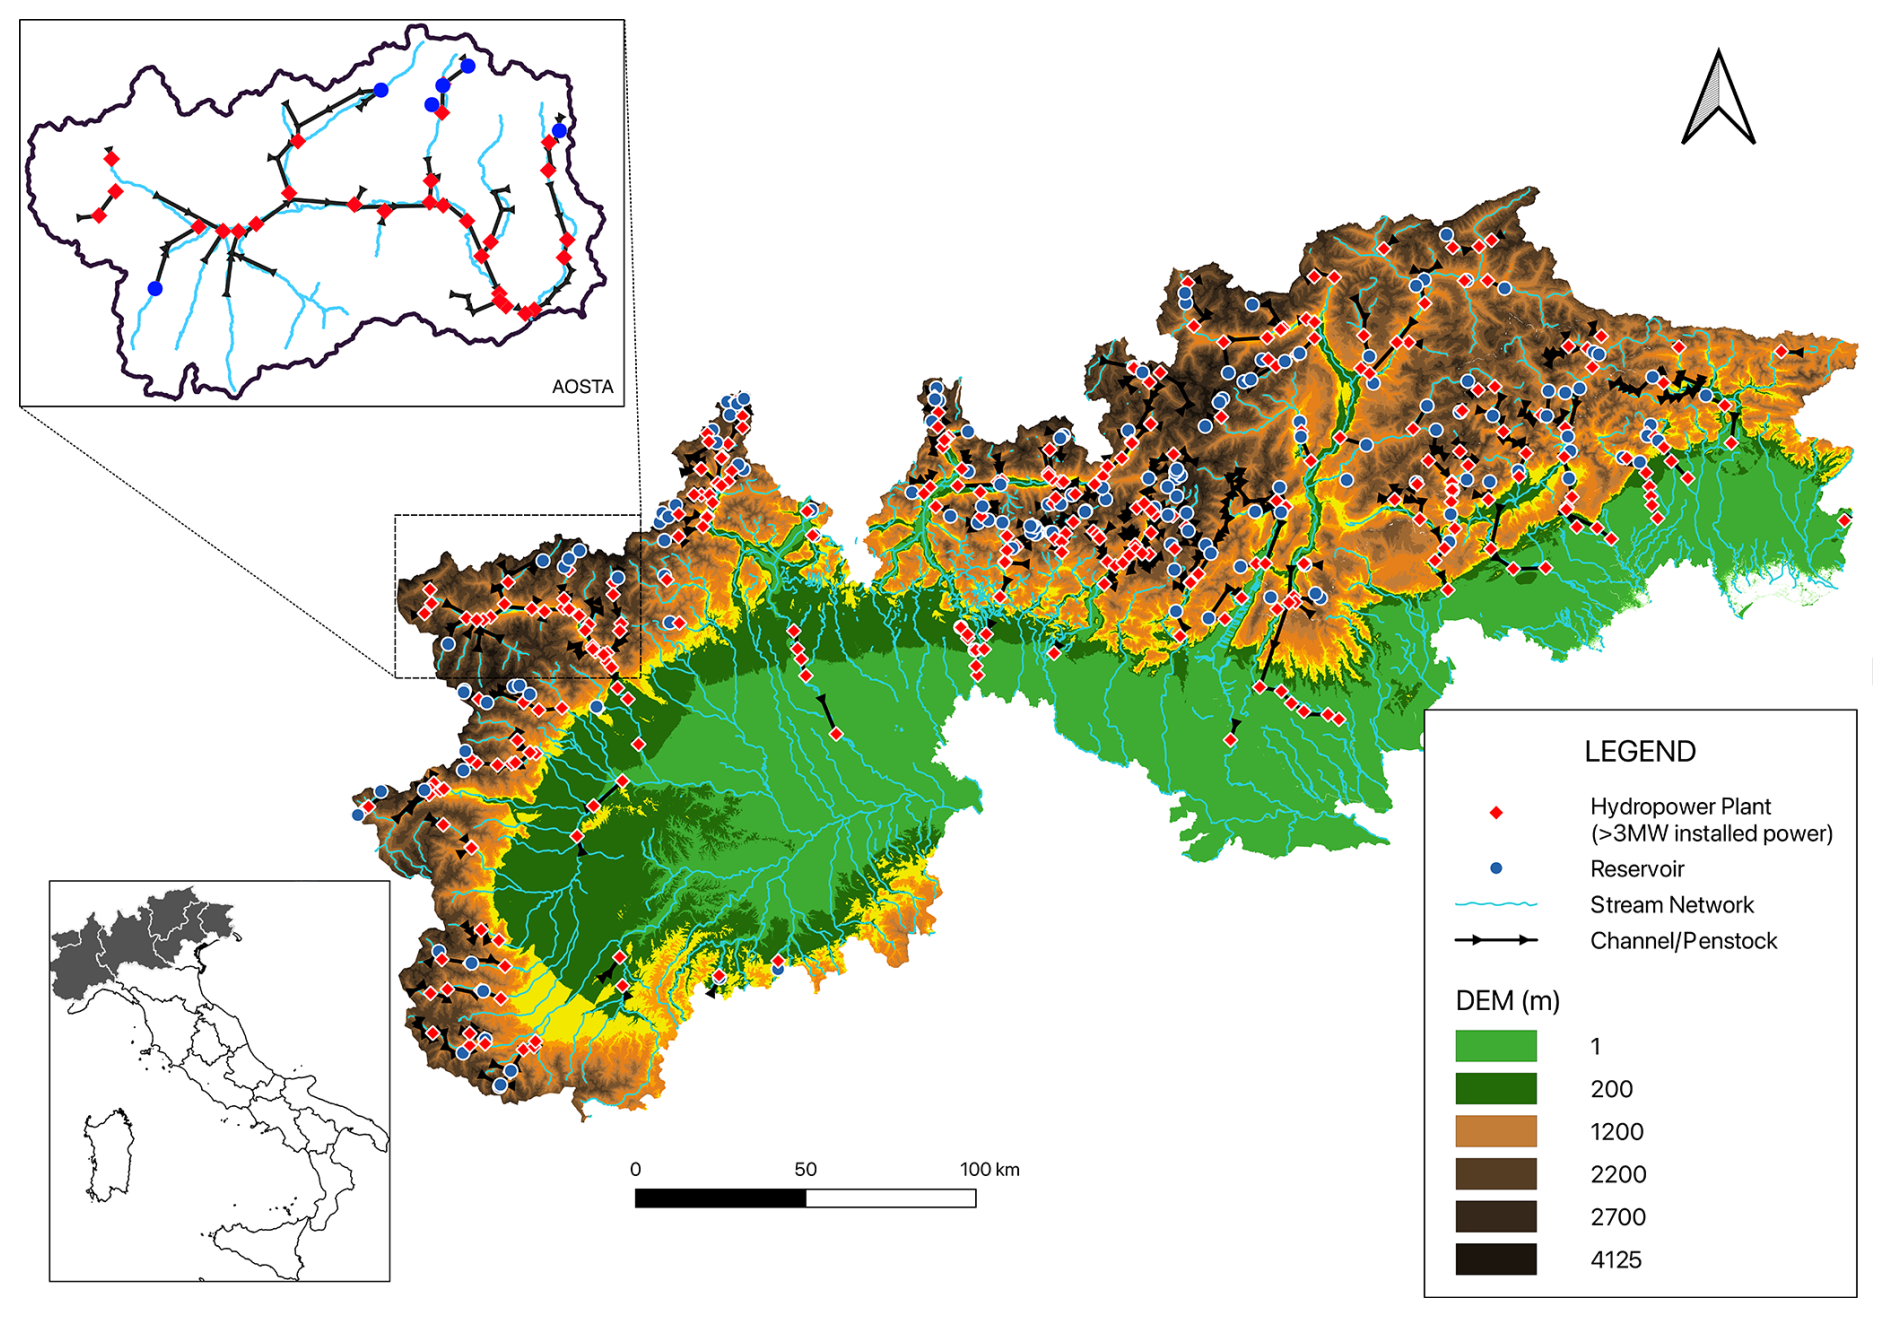
Figure 1Distribution map of hydropower plants identified in the IAR-HP database, including relevant reservoirs for storage-based plants and diversion channels linking these systems. The top-left inset shows the Aosta province, highlighting the level of detail captured in IAR-HP. The bottom-left inset shows the covered area of IAR-HP in Italy.
The specific characteristics gathered in IAR-HP for different node types are listed in Table 2. Hydropower plant entries (type – plant) represent plants with an installed power larger than 3 MW. Plants are differentiated into two main operational categories: storage hydropower (R) and run-of-the-river (RoR) systems. Plants are further characterized by whether they involve either pumped (PSH) or mixed-pumped storage hydropower (M-PSH); the difference between these two types lies in how often the turbined water is pumped back to the upstream reservoir: if this happens on an almost daily basis, the plant is labeled as PSH, otherwise it is labeled M-PSH. Each plant is characterized by its installed power, Winst, and a reference node (IDref): reference nodes represent the node governing the water inflow to the plant, which is usually a reservoir in the case of reservoir hydropower systems, and the loading chamber (modeled as an intake) in the case of run-of-the-river systems. The gross hydraulic head is also computed as the difference between the two Z coordinates of plant and reference nodes. Penstock capacity information is likewise stored at the reference nodes for modeling purposes.
Intake entries represent points at which water abstraction from the natural network is performed by means of different structures, varying from pipelines to channels and tunnels, that serve various purposes, such as restitution and diversion. Moreover, as detailed in Avesani et al. (2021), these nodes are also used to model confluences between two or more channels, where these only “merge” without accepting further external water abstraction.
Characterizing intakes embeds two significant challenges. First, technical plans often declare only the capacity of the final segment of the intake system, representing the maximum capacity at that point. This might not, however, be representative of the actual maximum abstraction capacity at the initial (more upstream) intake points, where pipe dimensions are likely smaller. Furthermore, when two pipes merge into a single final segment, the aggregated capacity does not clarify the relative contributions of each individual intake. Second, the intake installation point might not exactly match its corresponding water body when compared to the river network extracted by the DEM (this second issue caused inconsistencies during modeling, with ambiguous flow attribution to intakes).
To address these characteristic deficiencies, we aggregate these intakes to the first location where the total channel capacity and the abstracted water body are known, maintaining their total pipe capacity to ensure consistent detail across the dataset; this operation was performed in an attempt to preserve the maximum level of detail (i.e., not aggregating intakes if possible) while achieving unambiguous definition of both abstraction capacity and abstracted water body. The IAR-HP dataset provides attributes concerning the maximum authorized water abstraction at each intake point QMAX. If the intakes serve as a reference node for a downstream plant, QMAX often coincides with the design flow of that plant. Intakes are also characterized by the minimum ecological flow constraint, QMEF(m), defining the minimum amount of water that must be present in the body before water can be abstracted.
Reservoir nodes are where water storage occurs, generally due to an impoundment allowed by a dam or natural lake. Each reservoir has its detailed operational regulations respecting three volume pool zones: flood control zone, active volume zone, and inactive volume zone. Each dam description contains zonal elevation thresholds that mark the boundary of each zone in the reservoir (Hmax,inv, Hmax,reg, Hmin,reg). An additional stage, Hwork, is provided for modeling purposes, and is set at 90 % of the available stage range within the reservoir: above this threshold, the reservoir module makes an exception to the expected turbine rate QRULE(t) and instead turbines at the maximum authorized flow rate of the penstock, Qwork. The structure of each reservoir is further characterized by the spillway capacity Qspill and by stage-storage curves (V(H)), characterizing its shape. Finally, each reservoir is constrained by the minimum ecological flow constraint, QMEF(m), and provided with an expected turbine discharge rate QRULE(t), whose development is extensively covered in Galletti et al. (2021). This discharge rate follows a monthly fluctuation pattern, inferred from provincial production time series, capturing seasonal variations in hydropower utilization. This pattern is then applied to scale an average discharge rate for each reservoir, QAVG, calculated based on the long-term mean production values declared for each corresponding hydropower system, EAVG. This approximation of the reservoir operation scheme assumes that hydropower production occurs during all available hours of the year (i.e., no capacity factor is involved in the definition of QRULE(t), as this would require more specific knowledge about operation patterns). This approach allows for a realistic, seasonally adjusted representation of turbine discharge rates across reservoirs, aligning modeled outputs with observed regional production dynamics with the overall long-term production of each reservoir hydropower system. In Appendix A we provide further clarification on the physical and operational meaning of parameters such as QAVG and Qwork. We also show how their ratio, ranging from 10 % to 90 %, provides a rough indication of the typical operation regime of reservoir hydropower systems, with large reservoirs being operated in peaking mode (i.e., they accumulate water during off-peak periods and then discharge at full capacity and high hydraulic head to meet peak electricity demand, leveraging their large storage flexibility), and small reservoirs that continuously operate close to their maximum capacity. Furthermore, a clustering analysis conducted on the main operational characteristics of reservoirs, such as head, active volume, and regulation capacity, shows how the reservoir's regulation capacity (i.e., time to fill the reservoir assuming its average inflow) is inversely proportional to the aforementioned ratio.
Finally, a monthly minimum ecological flow requirement QMEF(m) is defined for both reservoir- and intake-type nodes. According to the current legislation requirements (https://pianoacque.adbpo.it/deflusso-ecologico/, last access: 10 March 2025, in Italian), MEF should be constructed as a combination of hydrological characteristics, eco-environmental state, and the level of exploitation at each site. As detailed in Moccia et al. (2020), regional administrations are currently implementing several formulations based on this general concept; however, they have not yet developed a thorough classification of their territories with respect to each required parameter, which makes it impossible to compute the MEF consistently. Consequently, even regional administrations often resort to a simplified estimation of MEF, fixing it at 5 %–10 % of the long-term average flow of each month. For consistency, we defined QMEF,i(m) as
with i representing each specific water withdrawal location (water intake or reservoir), m representing each month, and Qnat,i(m) being the long-term monthly average flow at each water withdrawal location. Qnat,i(m) is obtained by executing HYPERstreamHS under natural conditions (i.e., without modeling hydropower water uses).
2.1.3 Database statistics
The information gathered and the extensive dataset for large hydropower systems customized for the IAR resulted in an inventory covering 25 northern Italian provinces.
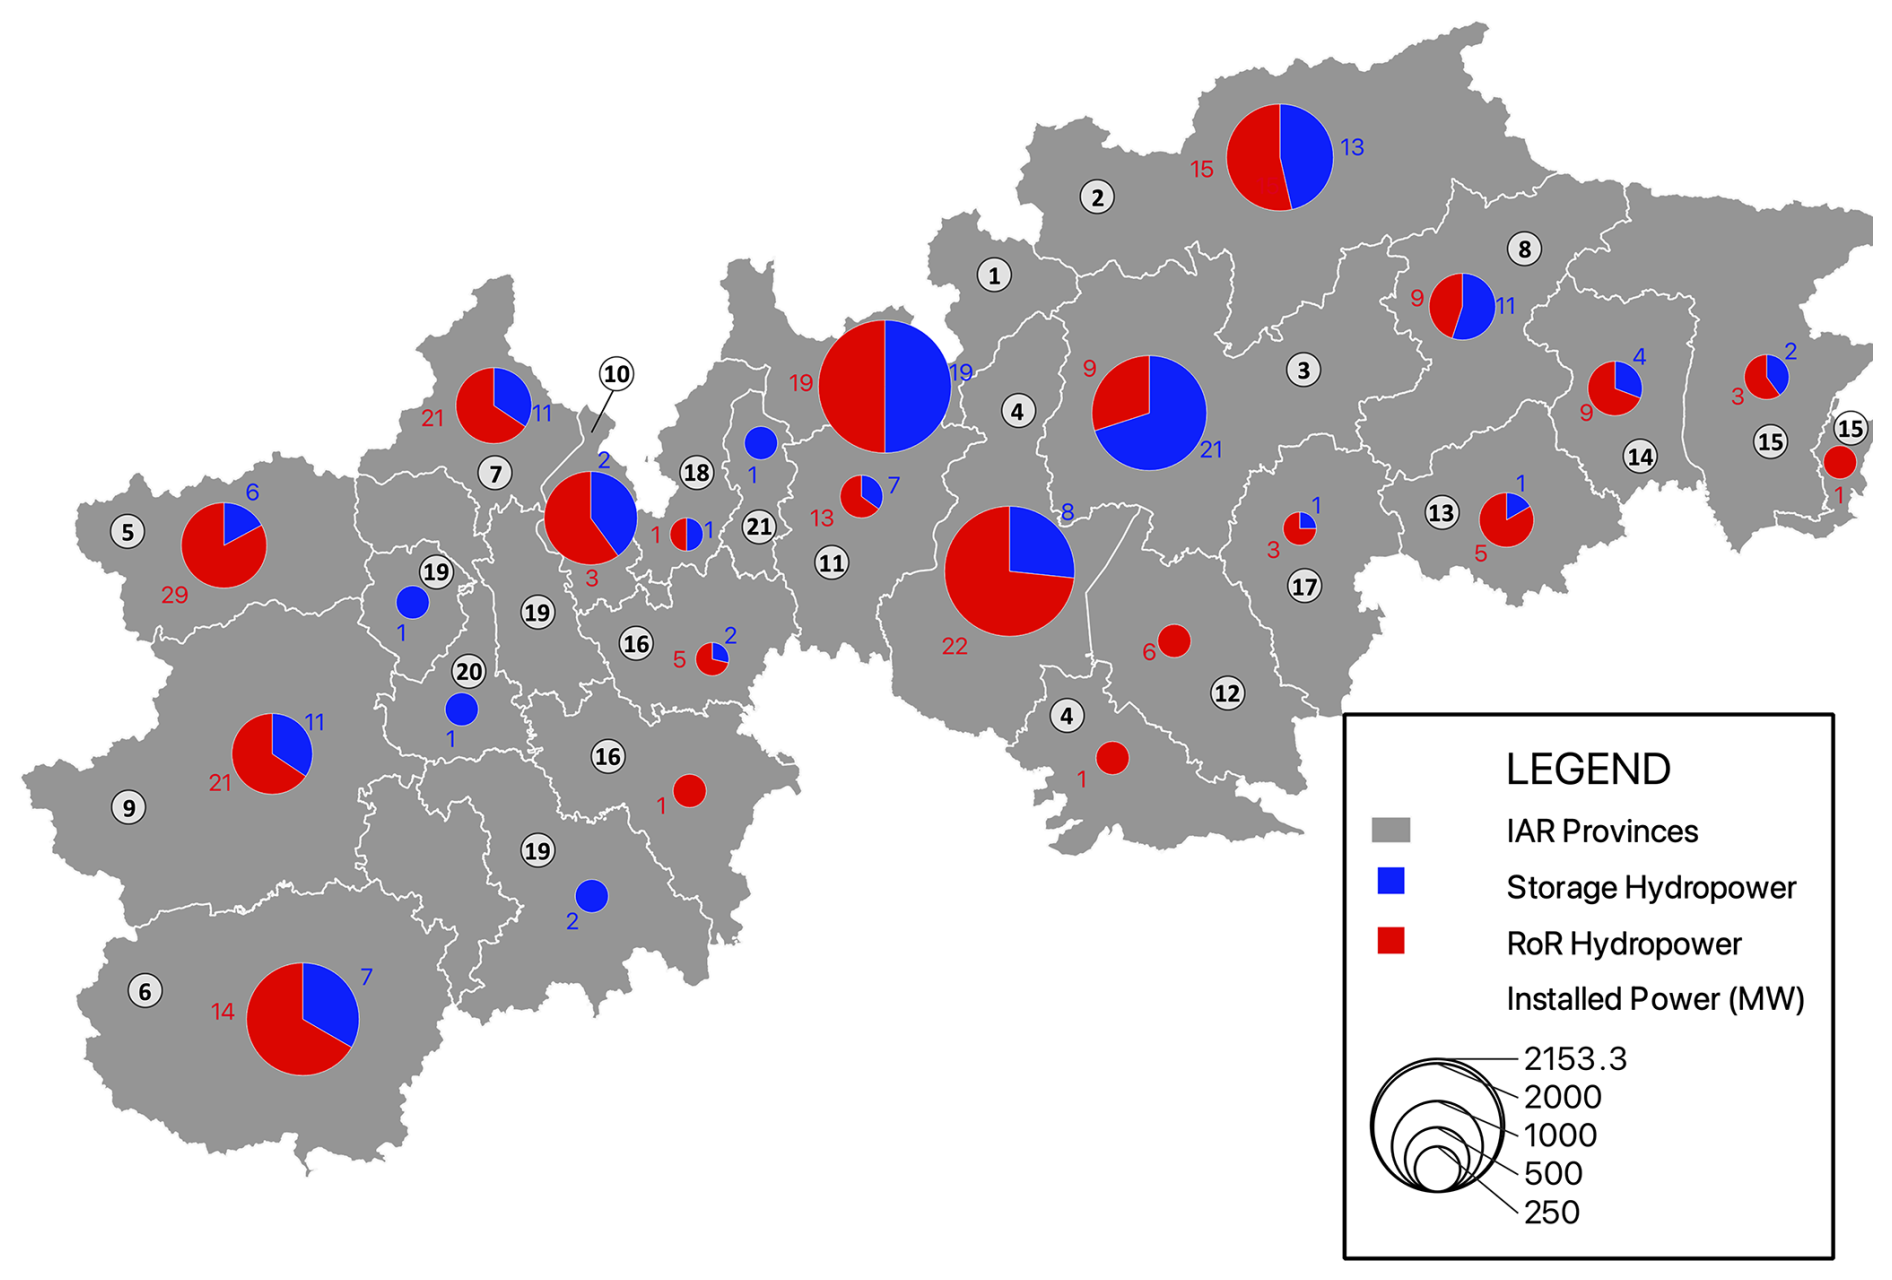
Figure 2Statistics of the hydropower plants present in IAR-HP. The pie charts represent the number of run-of-the-river (red) and storage (blue) hydropower systems within each province. The size of the pie chart is proportional to the total installed power in each province. Each province is numbered according to the ID's listed in Table 4.
The IAR-HP database provides detailed and comprehensive information on 338 hydropower facilities, comprising 129 storage and 209 run-of-the-river hydroelectric systems, totaling an installed power of 14.3 GW. Figure 2 depicts the number of LHSs in the available provinces of IAR; the size of each pie chart is proportional to the total installed power in each province, while each pie itself represents the numbers of reservoir and run-of-the-river systems in each province. The distribution of LHSs highlights a notable concentration in certain provinces, particularly Sondrio, Aosta, and Torino (English variant: Turin) tied with Verbano-Cusio-Ossola, with 38, 35, and 32 LHSs installed, respectively. Sondrio also leads in terms of installed capacity across the entire IAR, followed by Brescia and Trento. Additionally, Trento stands out with the highest number of storage hydropower facilities, totaling 21, while Aosta ranks first in the number of RoR systems, with 29. Moving towards flatter areas, the number of LHSs generally decreases, although this might be offset by a few significant run-of-the-river plants handling large streamflows.
IAR-HP also includes specific structural and operational information for 156 reservoirs (most of which serve the primary purpose of hydropower production), ensuring high accuracy and reliability in the data. These reservoirs directly or indirectly impact the operation of the hydroelectric plants. Figure 3 summarizes the main statistics for reservoir active volume and hydropower plant capacity in IAR-HP. A total active storage volume of 2312.2 million cubic meters is composed of a large fraction of very small reservoirs (more than 80 with a volume lower than 5 Mm3), realizing slightly more than 5 % of the total volume; these reservoirs usually exploit high heads to achieve good power outputs, and most of them handle relatively low flows, performing daily regulation activities. Many medium-sized reservoirs perform daily-to-monthly regulation, depending on their regulation capacity (the ratio between average inflow and active storage). Finally, four very large reservoirs make up around 25 % of the total active storage. Given the average inflows that usually fill alpine catchments (often not exceeding 10 m3 s−1), most reservoirs with more than 20 Mm3 active storage can perform seasonal regulation activities. In some peculiar/drought situations, reservoir water resources can also be used for irrigation purposes, conflicting with hydropower production. However, since this occurrence is very minor within the domain of IAR-HP and often limited to medium-large reservoirs, collecting information on agricultural water usage was deemed beyond the scope of IAR-HP. The installed power of the 338 LHSs present in IAR-HP amounts to 14.3 GW; of these, five major systems constitute 25 % of the total, four of them are either pumping- or mixed-pumping hydropower systems, exploiting large heads (200–900 m) and handling substantial flows, and one is a reservoir hydropower system. Conversely, a large portion of smaller systems (80 % of the total number of LHSs) contributes to little more than 20 % of the total installed capacity.
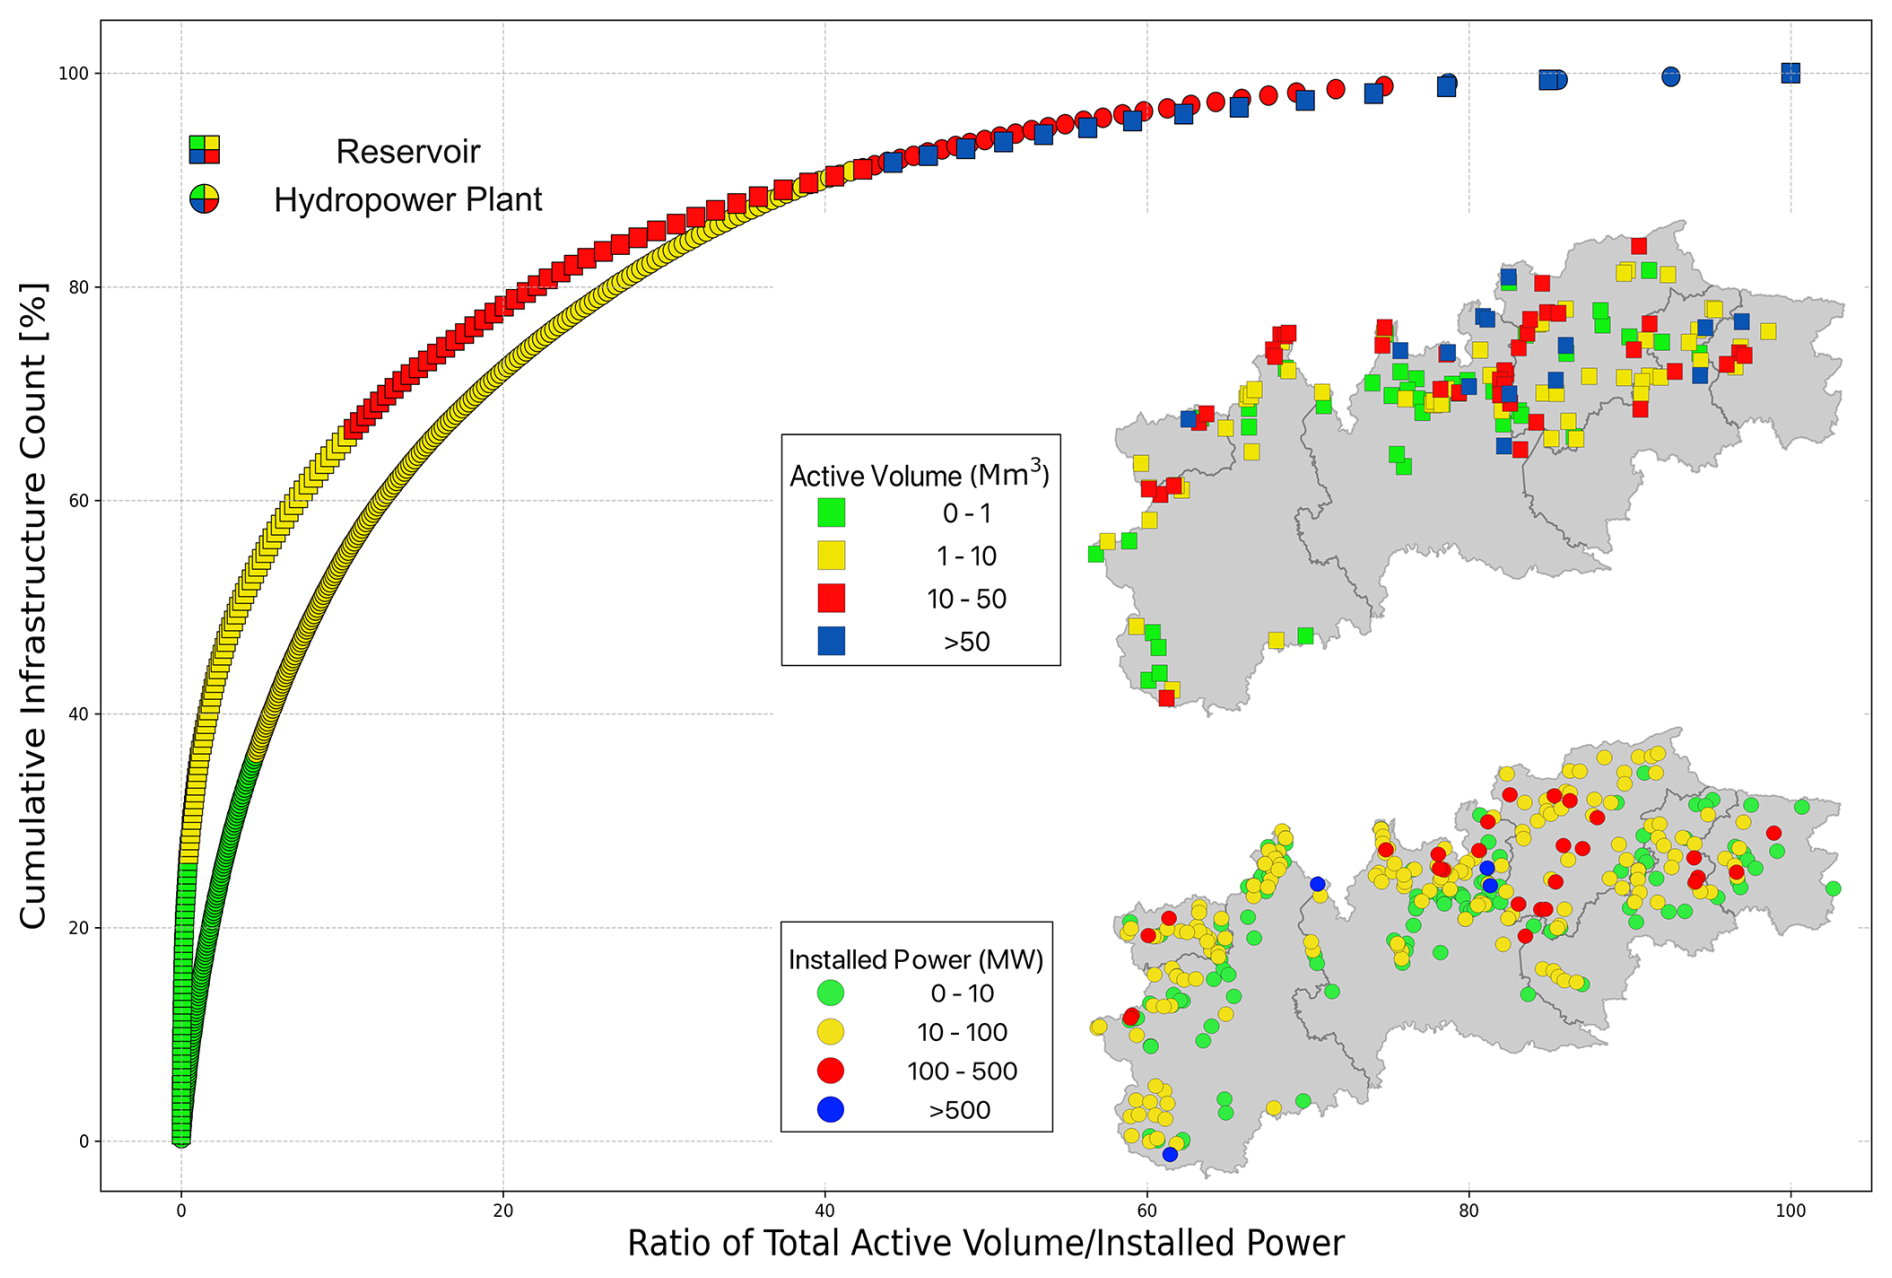
Figure 3Empirical cumulative distribution functions of reservoirs (square markers) and hydropower plants (round markers) against their contribution to the total active volume and installed power, respectively. The insets show the locations of the reservoirs (upper) and hydropower plants (lower); a color scale based on the reservoir active volume and plant installed power is provided to facilitate locating the most relevant structures.
2.2 Dataset validation
Our contribution aims to provide a valuable and reliable source of information for hydrological modeling endeavors. This, of course, entails validating the information provided herein. The scarcity of homogeneous and openly accessible sources of information, however, makes the validation of the dataset in its strict sense unfeasible. Hence, an alternate approach was adopted: the validation goal is to reproduce the observed hydropower production, resorting to a hydrological modeling exercise that includes the entire spatial extent of IAR-HP. This section will highlight the setup and key characteristics of the modeling framework.
2.2.1 Hydrological model
As previously described, IAR-HP was initially designed to comply with the data requirements of HYPERstreamHS (Avesani et al., 2021), a holistic, distributed hydrological model that includes routines for explicitly simulating the alterations in streamflow related to the functioning of man-made hydraulic facilities. HYPERstreamHS thus represents the most consistent model choice for validating IAR-HP. A similar validation exercise restricted to the Adige catchment was performed in Galletti et al. (2021), showcasing the benefits of including thorough hydraulic and management information in large-scale hydrologic assessments. The model first performs vertical water mass balance (i.e., precipitation, snow accumulation/melt dynamics, evaporation, and partitioning into infiltrated water and surface runoff) at the level of discrete spatial units named macrocells. Surface runoff is then routed to the hydrologically nearest downstream node by means of a width-function-based instantaneous unit hydrograph scheme (Piccolroaz et al., 2016). After reaching the first downstream node, runoff enters the network of modeled nodes and links, where it undergoes different streamflow partitioning and routing routines (i.e., natural in-stream routing or flow partitioning to model the effect of hydropower infrastructures). HYPERstreamHS embeds a dual-layer MPI parallel computing scheme that allows it to undertake challenging computational endeavors, such as calibrating the 12 hydrological parameters of the model (Avesani et al., 2021).
2.2.2 Data sources
The hydrological model relies on spatialized input information: DEM, land cover, daily gridded precipitation, and temperature.
The DEM is used to compute the hydrologic drainage network and to attribute average height to each discrete macrocell (the computational unit of the model). For this case study, we adopted the 30 m resolution EU Digital Elevation Model (EUDEM, https://www.eea.europa.eu/data-and-maps/data, last access: 30 October 2016). Land cover information comes into play for computing potential evapotranspiration (PET) according to Hargreaves and Samani (1982). The land cover classification was extracted from the CORINE 2006 database (https://www.eea.europa.eu/publications/COR0-landcover, last access: 30 October 2016).
The Alpine precipitation gridded dataset (APGD; Isotta et al., 2014) was adopted as the precipitation input dataset: APGD is a spatial analysis of precipitation events over the European Alps. It is available as a 5×5 km horizontal resolution dataset and contains daily precipitation from 1971 to 2008. The estimations are sourced from more than 8500 gauge stations across the region, providing dense observational data (Isotta et al., 2014), making APGD one of the most accurate gridded products available over the Alpine domain. Daily mean, minimum, and maximum temperatures were retrieved from COSMO-REA6, a reanalysis dataset containing hourly temperature time series from 1995 to 2019 (Bollmeyer et al., 2015), which was shown to have superior performance compared to other datasets in the Alpine region (Scherrer, 2020). Consequently, the modeling time window was limited to the overlapping portion of the two datasets, from 1995 to 2008, for a total of 13 years.
HYPERstreamHS hydrological parameters are often calibrated in an attempt to optimize the reproduction of observed flows. The stream gauging stations' daily streamflow time series were obtained using the free-to-use Italy Central Hydrological Information System portal (http://www.hiscentral.isprambiente.gov.it/hiscentral/default.aspx, last access: 30 June 2020). The database was updated with data collected from individual regional environmental agencies. This endeavor resulted in a daily observational streamflow dataset covering from 1845 to 2019 and totaling 486 stream gauges throughout the Italian Alpine Region. It should, however, be noted that the data quality, albeit generally good, is not checked, and time series need to be manually inspected to ensure their reliability.
Hydropower production data were supplied by TERNA, the Italian electrical grid manager (Terna, 2024), upon request. Data are organized into monthly production time series and aggregated at the province level. The dataset provided belongs to a period of 15 years, starting from 2000 without any gaps. It is separated into two information categories based on the 3 MW installed power classification threshold explained earlier.
The TERNA report covers the period from 2000 to 2015, extending beyond our modeling duration of 1995 to 2008. Hence, the validation of hydropower production was only related to production in the overlapping window of 2000–2008. Following the approach detailed in Galletti et al. (2021), hydropower production data is also used to derive reservoir operation rules for each province. Even in this case, only the pattern derived from the 2000–2008 monthly averages was considered.
Meteorological, land cover, and streamflow data are used to set up, calibrate, run, and validate the hydrological model, ensuring that the modeled streamflows are accurate at the watershed scale. Hydropower production data are employed in Sect. 3 to thoroughly validate the outcomes of the hydropower production simulation.
2.2.3 Hydrological model calibration
Before running the hydrological simulation, the model parameters were calibrated to optimize hydrological modeling throughout the domain (the model parameters are detailed in Piccolroaz et al., 2016; Avesani et al., 2021). Given the size of the domain, we reckon that a single set of parameters cannot realistically represent the entire area, therefore we subdivided the domain into several mesoscale watersheds, depicted in Fig. 4. The watershed boundaries were defined to balance the need for a manageable number of watersheds (hence limiting the computational burden of the calibration) with the need to support each of them with observed streamflow records meeting reasonable quality standards (e.g., continuous data, minimal impacts from nearby power plants, realistic low-flow records). This led us to define a final set of nine watersheds, eight of which were calibrated relying on a single gauge station located in the downstream region of the catchment. For the rightmost area, we ran into the issue that no reliable streamflow record is available for the region of Friuli-Venezia Giulia (the region is well known for river braiding, see, e.g. Bertoldi et al., 2010). In this case, we resorted to a multi-site calibration of the closest catchment, Piave, located in the neighboring region of Veneto, considering three headwater stream gauges that presented good streamflow records to improve the spatial representativeness of the parameters. The stations used for the multi-site calibration of this watershed (Piave river + Friuli-Venezia Giulia region) are located in the dark-green shaded area in Fig. 4.
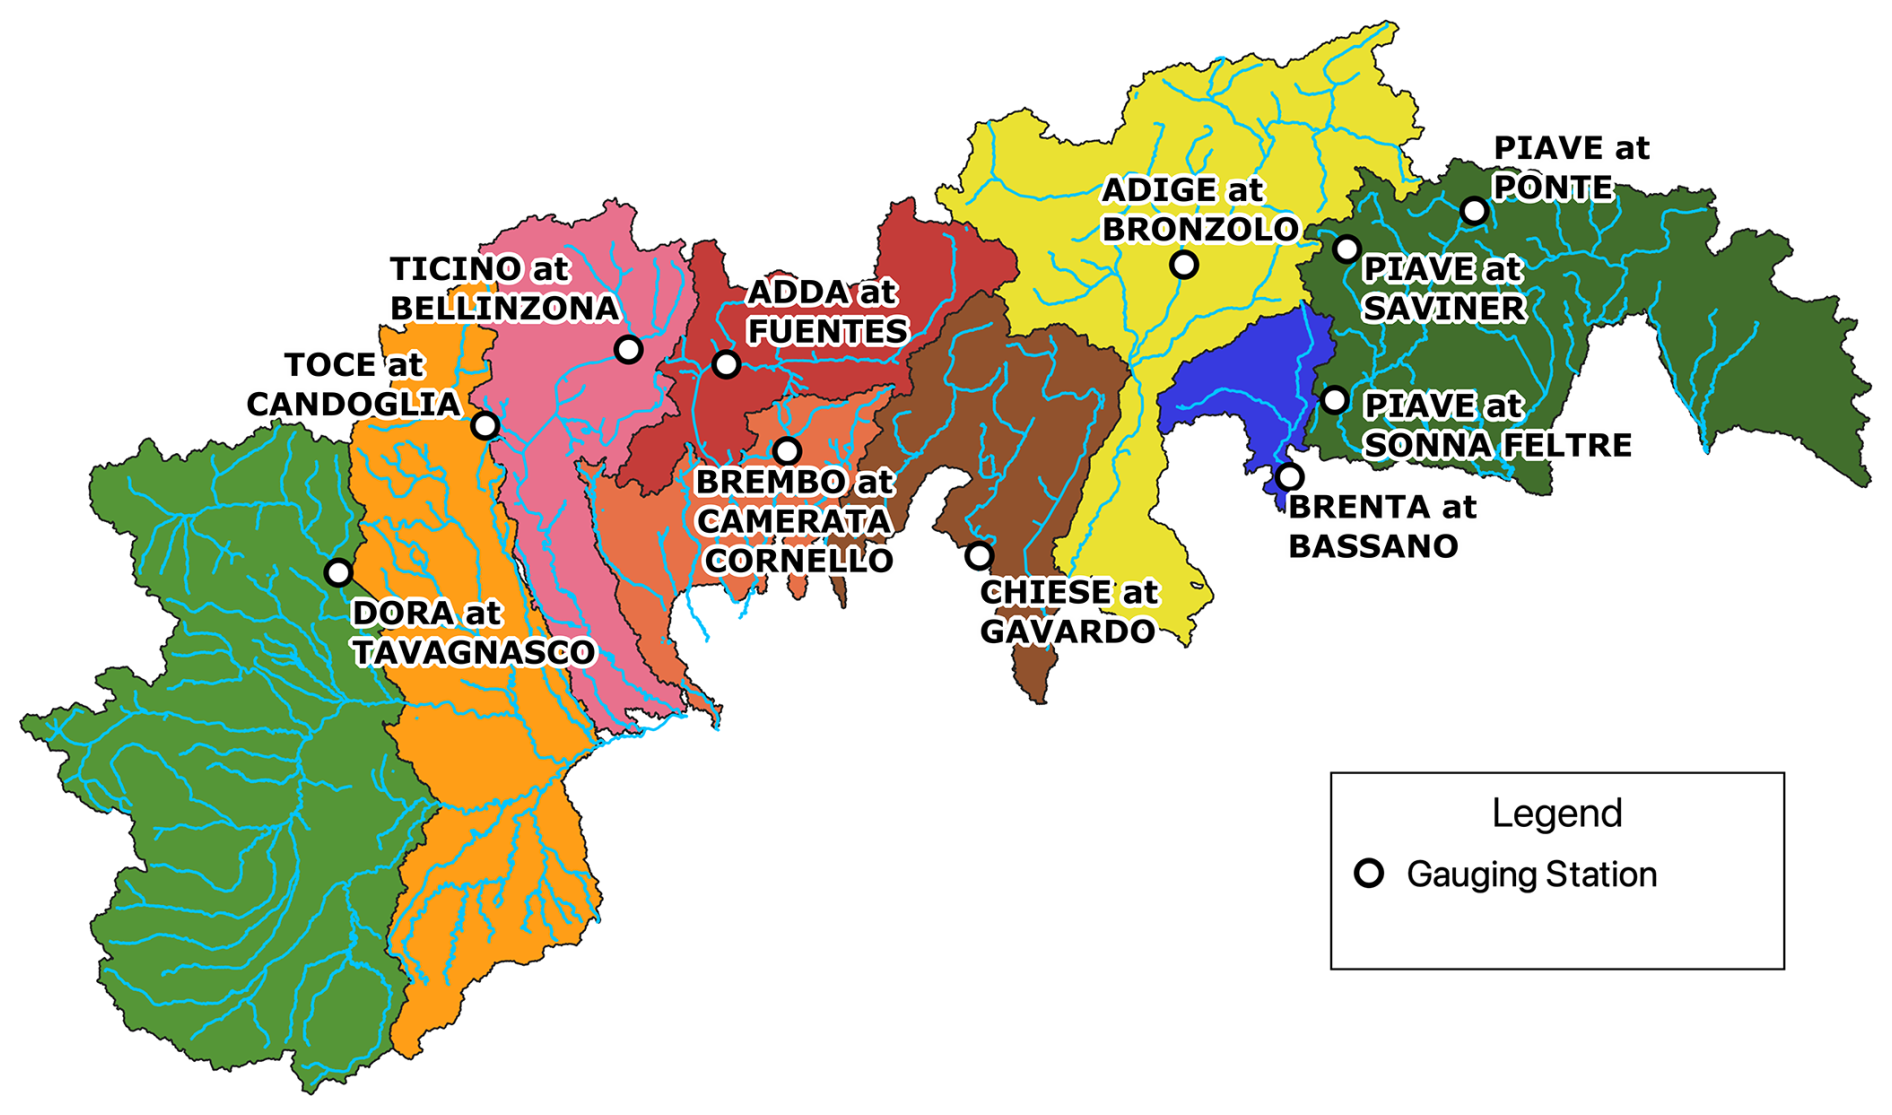
Figure 4Study area watersheds with their representative gauging stations.
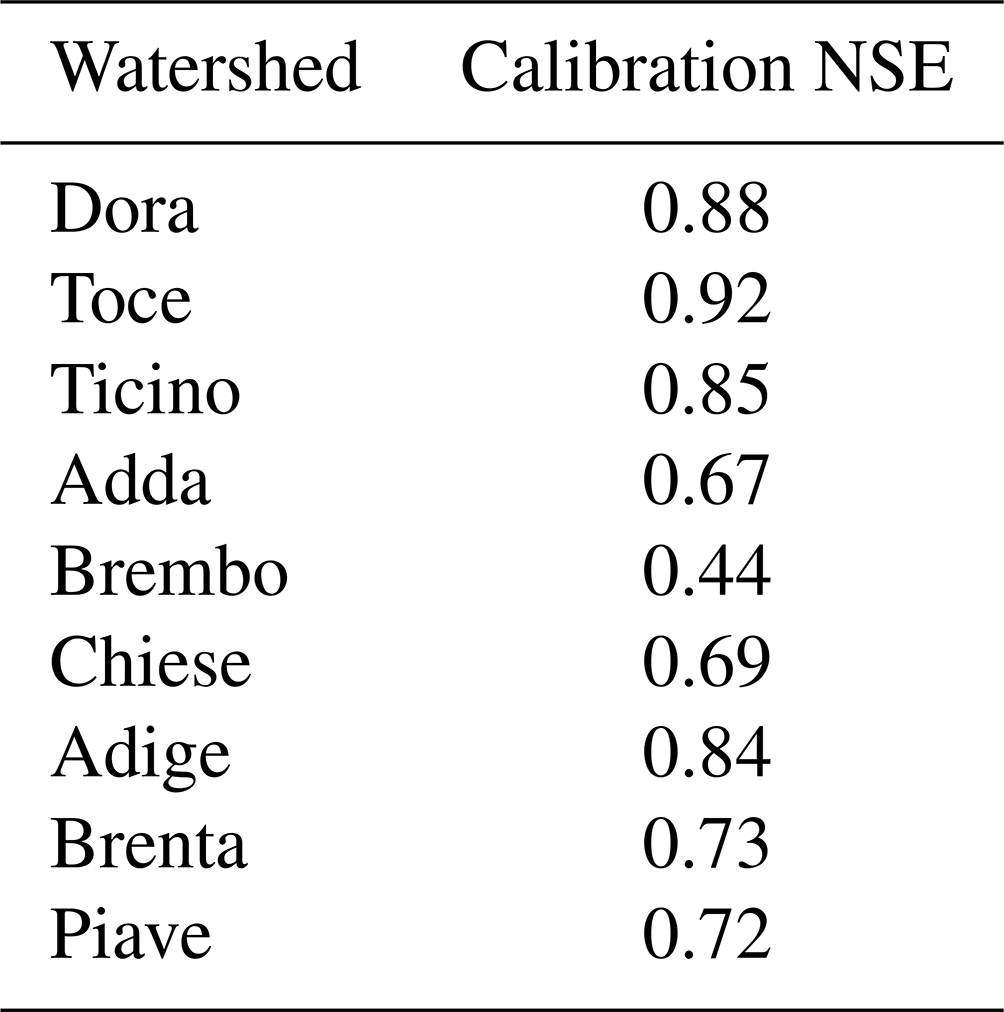
The result of the calibration in terms of the Nash–Sutcliffe efficiency (NSE) is summarized in Table 3. The calibration performance is excellent over almost the entire domain, achieving very good performances in reproducing daily flows in six watersheds out of nine (NSE > 0.7, according to the classification introduced by Moriasi et al., 2007), and satisfactory performance in two of them, with NSE above 0.5. The Brembo basin exhibits the worst performance with an NSE of 0.44, which we attribute to the small size of the watershed (around 200 km2), whose actual precipitation patterns are harder to accurately capture, subsequently affecting streamflow reconstruction.
Table 3Calibration efficiency in the nine watersheds considered in this study. Watershed name refers to gauged rivers mentioned in Fig. 4.
HYPERstreamHS embeds several calibration algorithms that have been refactored for parallel computing: we adopted particle swarm optimization (PSO; Kennedy and Eberhart, 1995) for its ability to handle both single- and multi-site calibration. The optimal parameter sets were computed by iteratively maximizing the resulting NSE index (Nash and Sutcliffe, 1970) at the selected gauge stations for each individual watershed; in the case of the multi-site calibration, the average of the three NSEs was maximized. The PSO approach was executed for each area using 100 runs and 100 particles, following the procedure extensively detailed in Avesani et al. (2021); this setup ensures a thorough exploration of the parameter space. The calibration was performed from 1996 to 2008, excluding the first year as a spin-off.
2.2.4 Assumptions for the validation of hydropower production
The simulated plant production was validated by comparing the simulated total annual energy production with historical recorded values of hydropower production.
In particular, within TERNA's report, the average production of some provinces is aggregated and provided as a single record. To ensure a proper comparison with TERNA's report and to validate our modeled hydropower production, we thus performed the same aggregation on the following provinces:
-
Gorizia-Udine (GU). These two provinces are reported jointly in TERNA's report.
-
Milano-Pavia (MP). The Pavia record includes data from the Monza province, established in 2009 and previously belonging to the Milano (English variant: Milan) province. For consistent comparison, since there is no trace of this shift in TERNA's report, we merged these two provincial records and validated them as a single one.
-
Alessandria-Biella-Novara (ABN). These three provinces are reported jointly in TERNA's report. No LHSs are reported for the Novara province in IAR-HP but we kept this aggregation for consistency with the observations.
-
Verbano-Cusio-Ossola (VCO). This is actually one province named after three cities it contains, therefore no actual aggregation is performed here. We will, however, shorten its name to VCO for brevity.
-
Brescia-Mantova (BM). The province of Mantova is not reported in the TERNA report, therefore we credit the production of its single plant to the neighboring province of Brescia.
This aggregation procedure reduces the initial 25 provinces for which IAR-HP lists at least one LHS to a new total of 21, for which results will be presented. It is worth mentioning that the Trento province represented the only peculiar case of a province crossing several watersheds, namely the Chiese, Adige, and Brenta (see Figs. 3 and 4). Therefore, the hydropower production of plants pertaining to said watersheds was computed by adopting their respective hydrological parametrization.
Furthermore, the current version of HYPERstreamHS (Avesani et al., 2021) is not equipped to explicitly simulate water being pumped back upstream in PSH and M-PSH systems. Since pumping constitutes a major component of the available volumes for PSH, the inability to model this mechanic would affect modeled production significantly. This effect is proportionally lower in the case of M-PSH, where water is pumped back less often. To avoid this bias and for the sake of consistency, we chose to consider the long-term average hydropower production of both PSH and M-PSH as declared by each plant's owner (https://www.enel.com, last access: 18 October 2024) in place of their simulated counterparts when validating our results. This assumption was applied to a total of 13 LHSs.
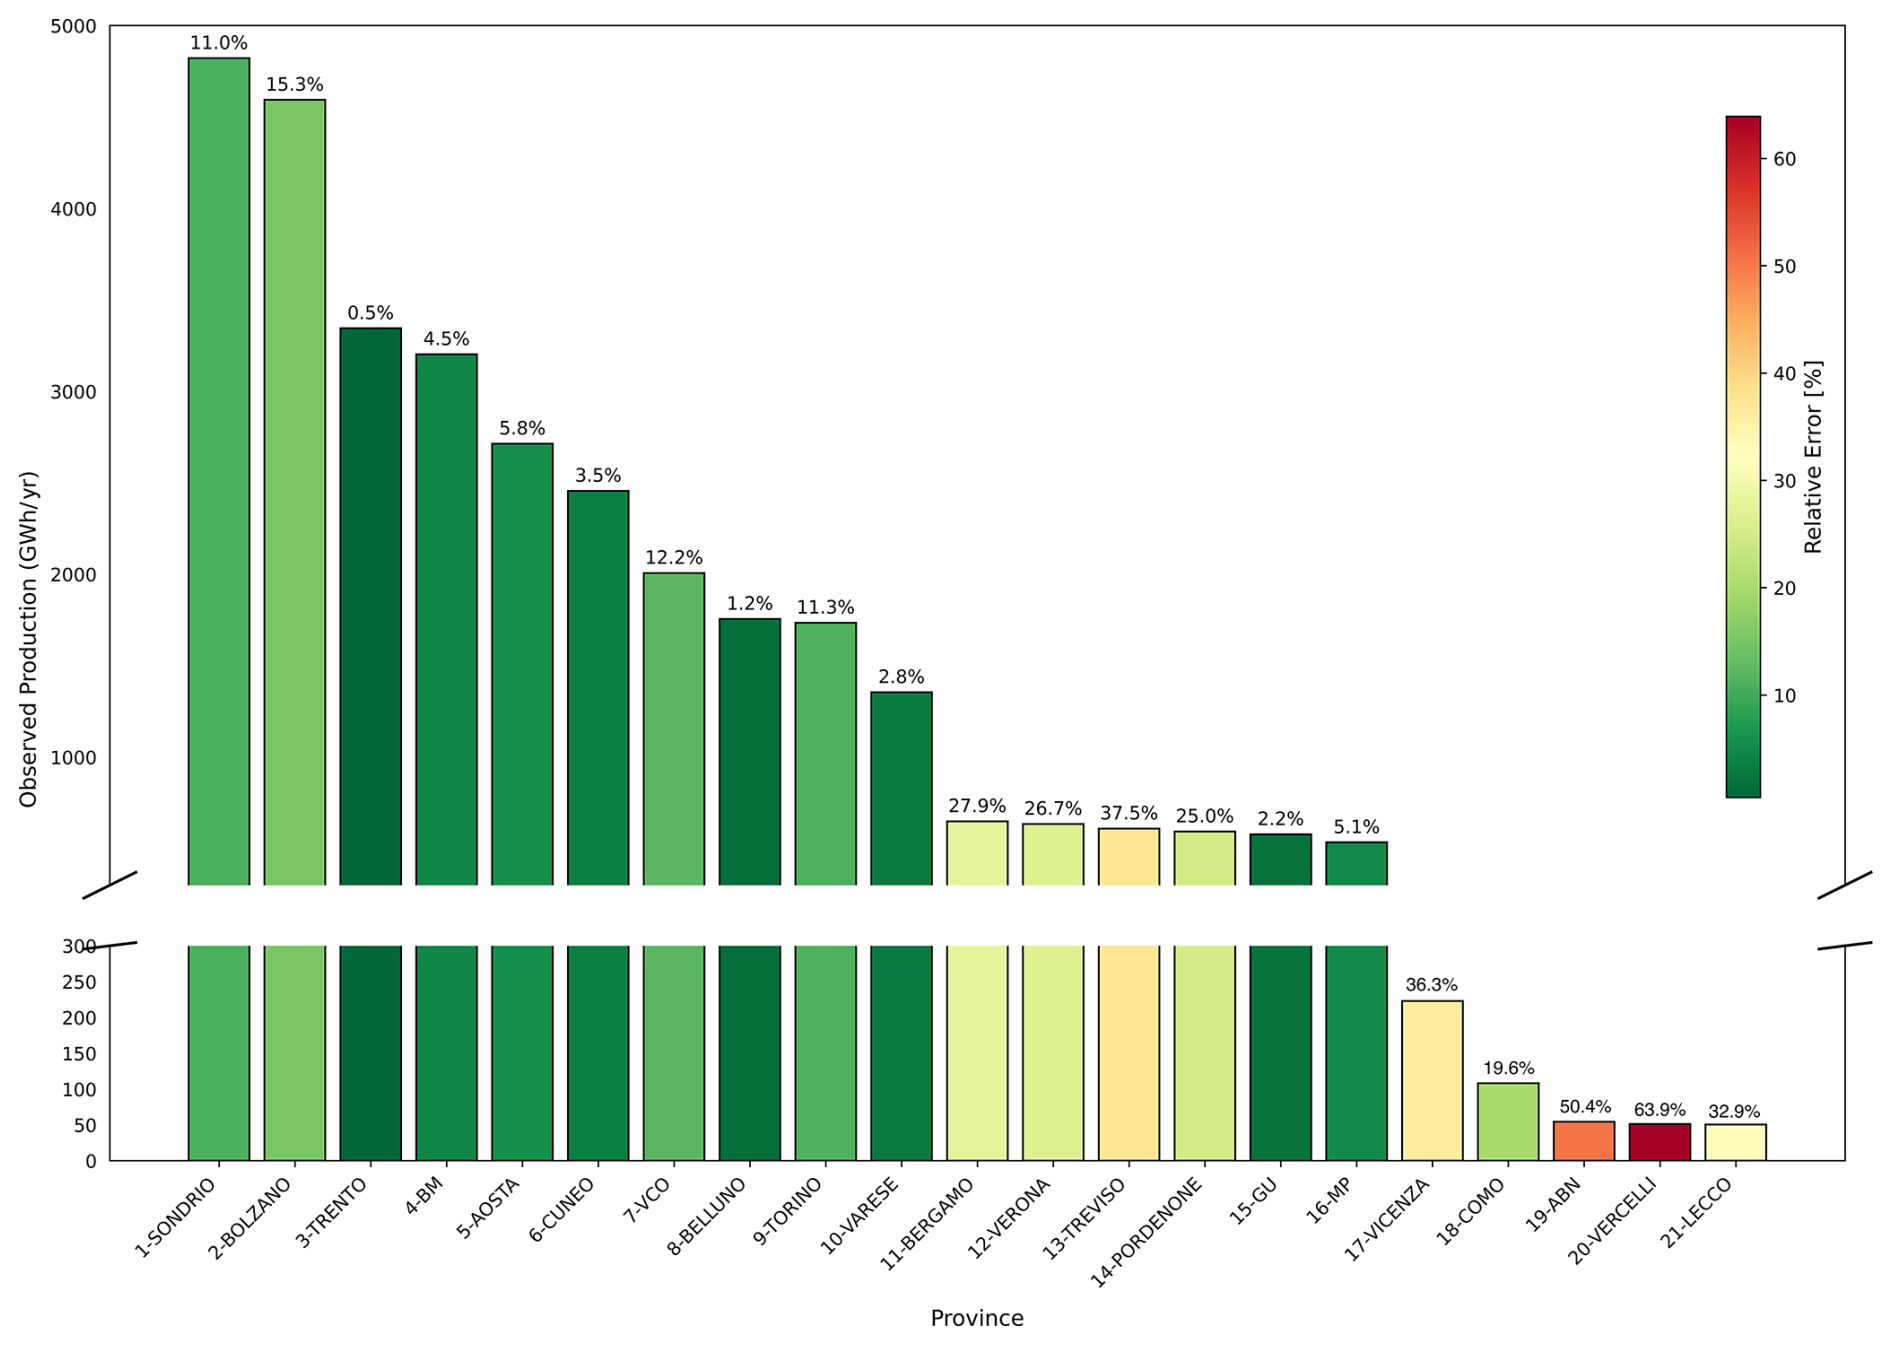
Figure 5Model performance in simulating provincial hydropower production. Bar height (left axis) represents observed annual average hydropower (2000–2008) for each province; bar colors (right color scale) and numbers above bars indicate the absolute relative error computed as . Abbreviations refer to the assumptions detailed in Sect. 2.2.4.
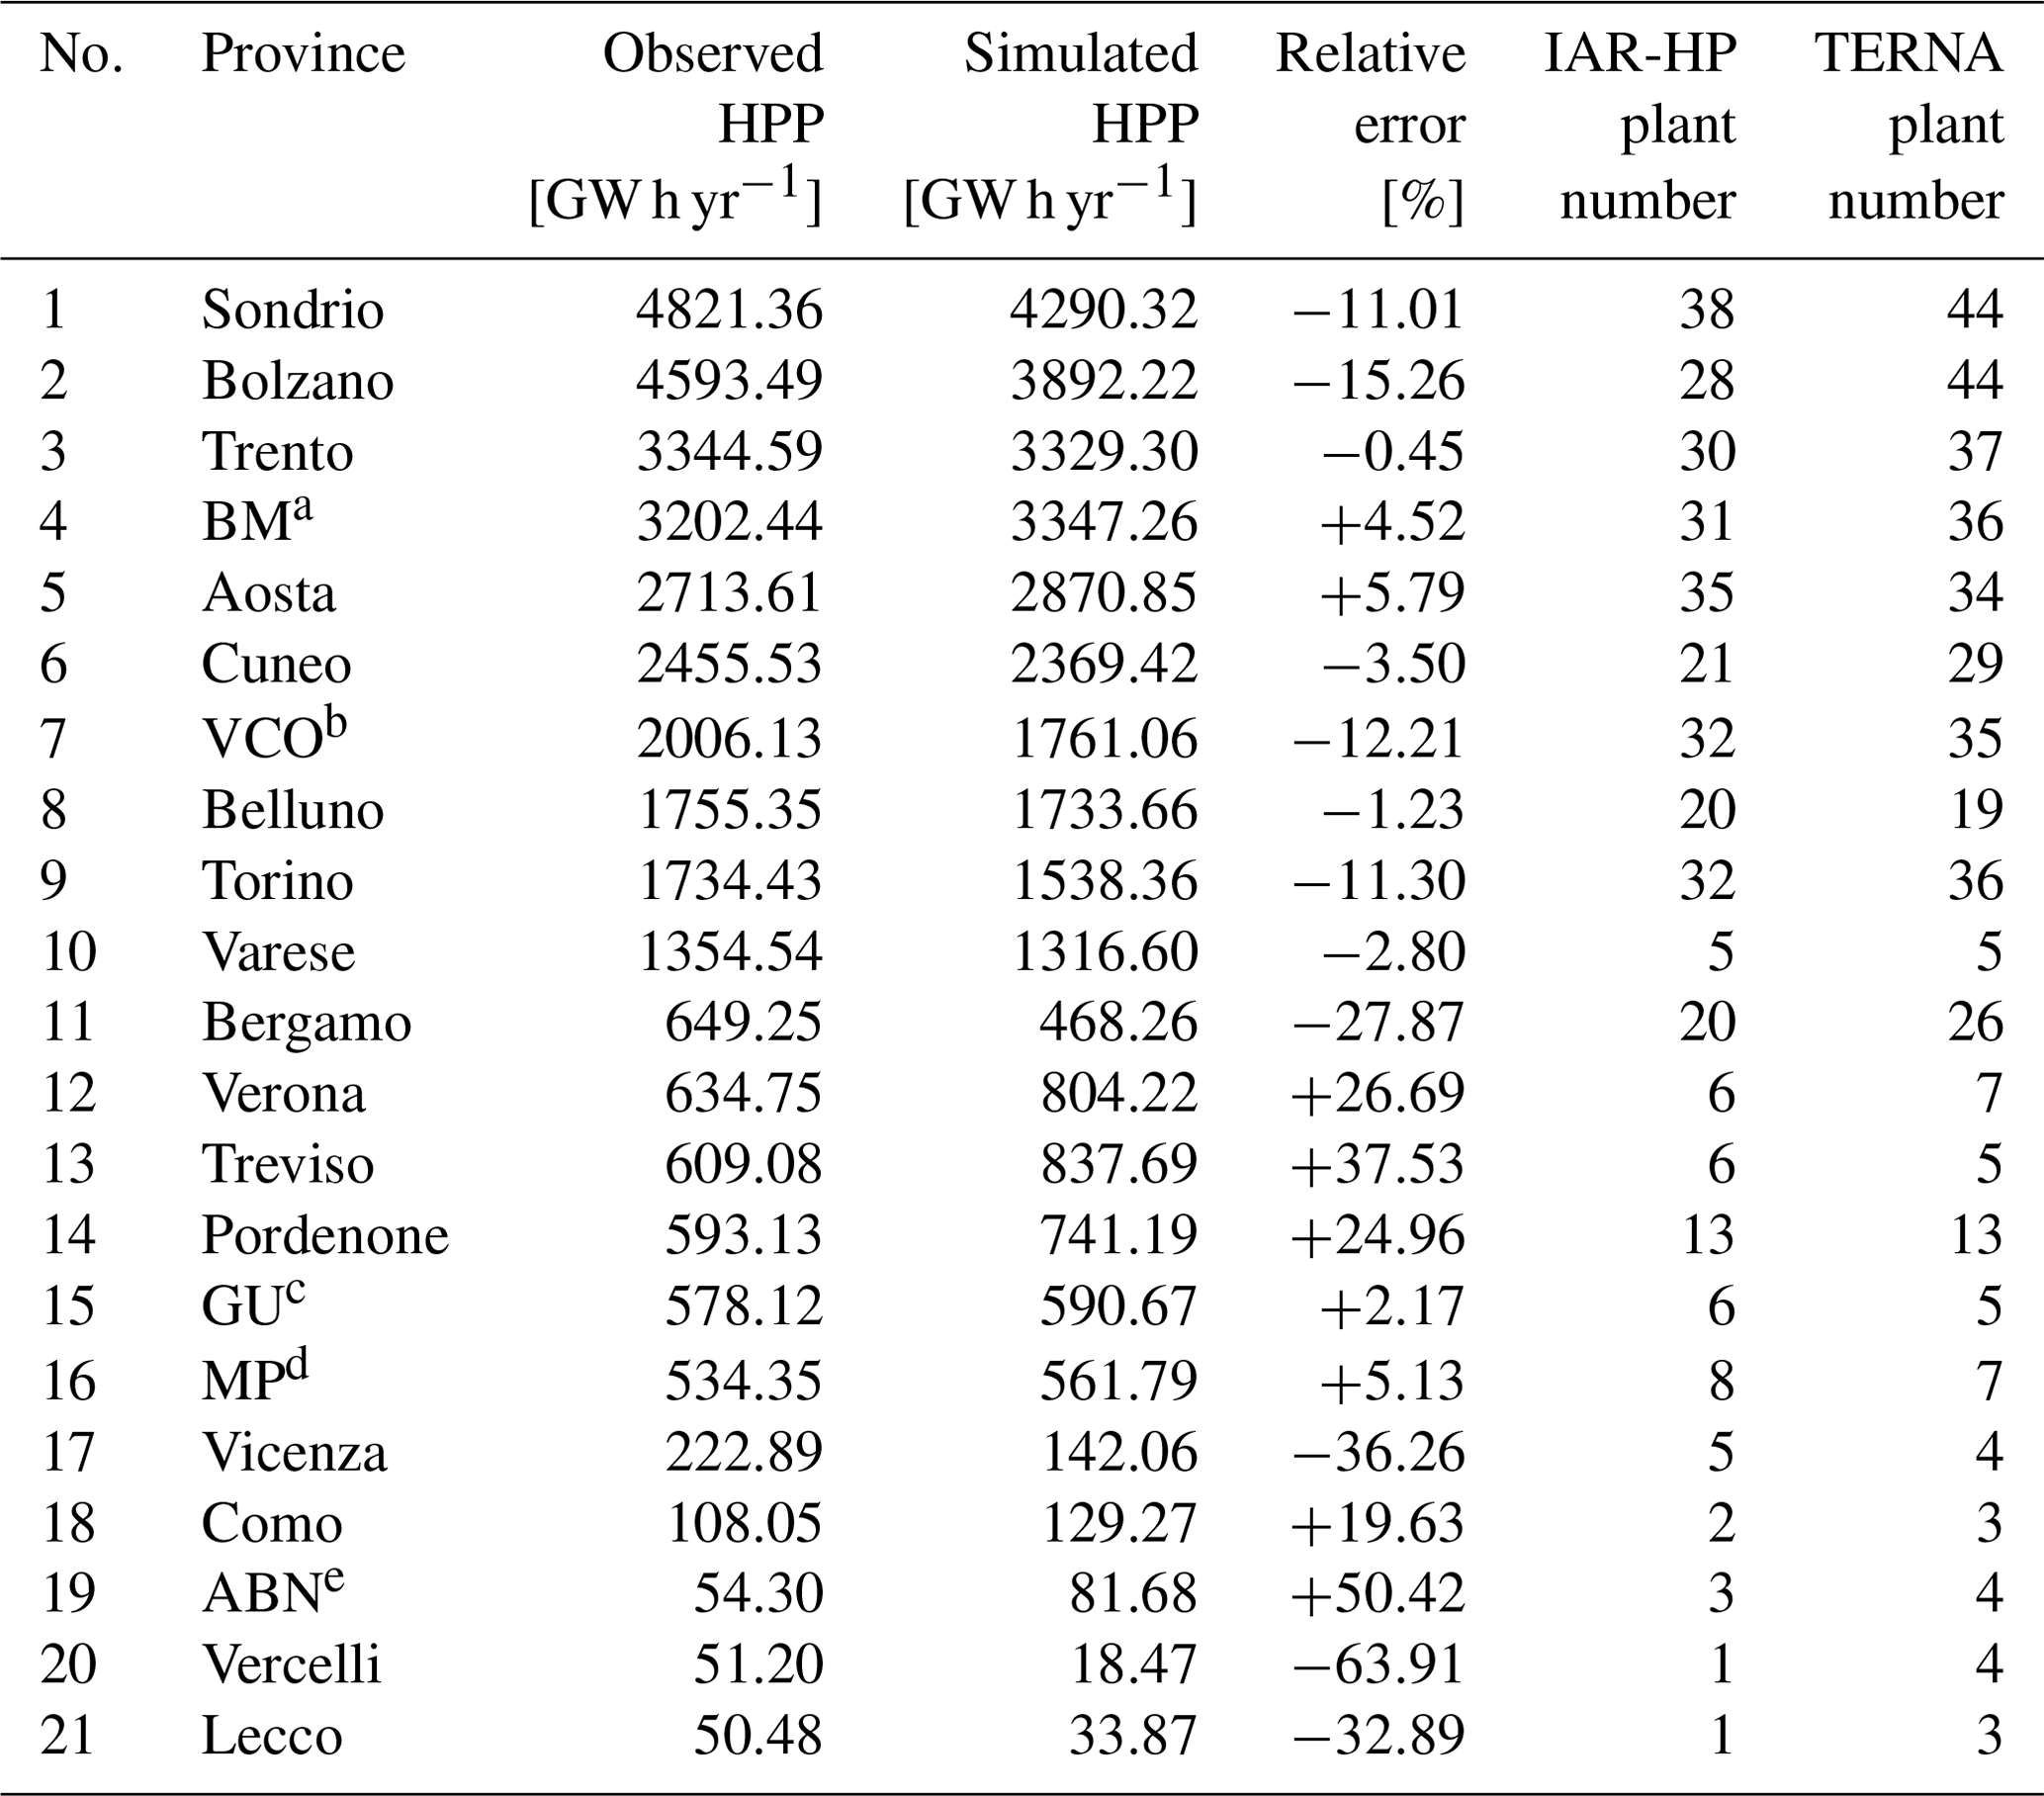
We validated the contents of IAR-HP by modeling hydropower production over the IAR domain, as detailed in Sect. 2.2.4. At the aggregate level, our results show high accuracy in reproducing observed hydropower production. The inclusion of IAR-HP data in HYPERstreamHS allowed us to reconstruct 96.2 % of the average annual production, 30.9 TW h yr−1, against a recorded value of 32.1 TW h yr−1. Results were very satisfactory in all the highest-producing provinces, for all of which the relative error in terms of average annual production was within 15 %. The influence of compensating errors (overestimation vs. underestimation) was limited, with an average relative root mean square error of 14.8 % across all provinces. The following paragraphs describe the hydropower production modeling outcomes in each province, comparing them to historical data and detailing peculiar situations that might have been relevant to the final outcome. The results are summarized in Fig. 5, and additional information regarding the detailed breakdown of the final provincial grouping can also be found in Table 4.
Table 4Comparison of average observed and simulated hydropower production (HPP) in each province during the period 2000–2008. Plants count as of 31 December 2015 provided by TERNA compared to the plants in IAR-HP. Superscript letters near abbreviations refer to the grouping assumptions detailed in the previous section: a Brescia-Mantova, b Verbano-Cusio-Ossola, c Gorizia-Udine, d Milano-Pavia, e Alessandria-Biella-Novara.
The Aosta province accounts for 35 LHSs, comprising 6 storage and 29 run-of-the-river plants. The total installed capacity in the province is approximately 890 MW, ranking it as the fifth-highest province within IAR-HP in terms of hydropower production. The two largest installed plants in the province are Avise and Valpelline, with installed capacities of 126 and 130 MW, respectively. From 2000 to 2008, the province has a historical production of nearly 2700 GW h yr−1. Notably, there are no pumped-storage plants in the province, and the simulated production of this province was about 2870 GW h yr−1, matching the observed value very closely.
Torino is home to 11 storage and 21 run-of-the-river plants, totaling 795 MW in installed power. The two largest plants, Venaus and Pont Ventoux, have installed powers of 240 and 150 MW, respectively. Pont Ventoux and Telessio are M-PSH systems; following Sect. 2.2.4, their simulated production was replaced by their nominal declared production (350 and 40 GW h yr−1, respectively). Historical production in Torino is approximately 1730 GW h yr−1, with a simulated production of about 1540 GW h yr−1. The missing production (about 11 % with respect to observations) in this province is likely due to an imperfect representation of the flows feeding the hydropower plants, as the Dora river is almost completely located in the Aosta province. Moreover, four stations are missing in this province compared to TERNA's report (see Table 4), which might have contributed to this deficit. Cuneo is home to 21 LHSs, consisting of 7 storage and 14 run-of-the-river facilities, with a combined installed power of approximately 1547 MW. Notably, the province houses the largest pumped storage hydropower system in the IAR-HP (Entracque). The system consists of two separate PSH groups (named Chiotas and Rovina), with a combined installed power of nearly 1200 MW, representing 78 % of the province's total capacity and totaling an average annual production of 1460 GW h yr−1; being a pure pumping system, the historical production for this system was considered in place of its simulated counterpart, as explained in Sect. 2.2.4. Cuneo's average annual production is around 2455 GW h yr−1, and its simulated value is very close, about 2370 GW h yr−1.
VCO is home to 32 large hydropower systems with 11 storage and 21 run-of-the-river plants, most of which have relatively low installed power. This province's average installed power per system is approximately 22 MW; the biggest plant is located in Caderese and has 70 MW installed power. Overall, VCO's total installed power stands at approximately 700 MW. The long-term average production of the province is about 2006 GW h yr−1. Also, the simulated value for this province is about 1750 GW h yr−1. The 12.2 % deficit in simulated production is likely due to a combination of a few missing plants (three) and a suboptimal representation of reservoir operation, given the very good hydrological calibration results for this area (Toce basin, see Table 3).
ABN has three LHSs, all of which are of the storage type, with a total installed power of 28 MW and historical production of approximately 54 GW h yr−1. The simulated value for this province was about 80 GW h yr−1.
Vercelli hosts one storage LHS with an installed power of about 4.25 MW, contributing to the province's average annual production of approximately 51 GW h. At the same time, this province's simulated value was 19 GW h yr−1, with significant underestimation.
We attribute the differences for both ABN and Vercelli to an incorrect representation of streamflows; however, it should be noted that the high relative errors (+50 % and −64 %, respectively) are associated with small differences in absolute terms of the hydropower productions, respectively 27 and 32 GW h yr−1 for ABN and Vercelli. These mismatches are minimal compared to the total production in IAR-HP.
Varese province is home to two storage and three run-of-the-river plants, accounting for an installed power of approximately 1050 MW. Among these, the Roncovalgrande plant stands out, with an installed power of 1000 MW. As per the other PSH, the long-term average production of Roncovalgrande (1000 GW h yr−1) was considered in place of the simulated one. During the period 2000–2008, the Varese province produced about 1350 GW h yr−1, while the simulated output is 1300 GW h yr−1. The results over this region were highly satisfactory, with the model output achieving a 97 % match with historical values.
Following the aggregation explained in Sect. 2.2.4, MP results in six run-of-the-river and two storage plants, with a total installed power of 95 MW. Historical production is approximately 530 GW h yr−1, with simulated production reaching 560 GW h yr−1. Despite its relatively small installed power, Milano's production is notable due to the sustained high flow rates feeding its LHS, with an average capacity of 105 m3 s−1.
Bergamo hosts 20 large hydropower systems, including 7 storage and 13 run-of-the-river plants, with an installed capacity of over 220 MW. Three major plants of this province, namely Carona, Bordogna, and Dossi, with an average installed power of 46 MW, play an important role in the overall average annual production in Bergamo, which is about 650 GW h yr−1. At the same time, the simulated yearly output is almost 470 GW h yr−1. It is worth mentioning that IAR-HP is missing six LHSs compared to TERNA's report, likely contributing to the 28 % deficit achieved by our simulation.
Como has one storage and one run-of-the-river plant, with an installed power of 28 MW and a historical production of 100 GW h yr−1, while the simulated value is 129 GW h yr−1.
Lecco has a single storage plant with an installed capacity of 15 MW and an annual production of 50 GW h yr−1, while the simulated counterpart amounted to 34 GW h yr−1.
The poor results in these provinces are, once again, probably influenced by a combination of a reduced plant count and imperfect representation of streamflow feeding the reservoirs.
With 38 LHS plants, Sondrio has the highest number of installed hydroelectric plants in the IAR-HP. This includes 19 storage plants and 19 run-of-the-river plants, with a total installed capacity of 2150 MW. Sondrio is also home to four of the largest installed LHSs in IAR-HP, namely Grosio, Premadio, Lanzada, and Mese, with installed powers of 431, 245, 188, and 173 MW, respectively. There are also two M-PSH systems installed in this province, namely, Campo Moro and Zappello, for which the nominal declared production was considered (29.88 and 18.36 GW h yr−1, respectively). This province's average production is about 4800 GW h yr−1, making it the highest producer among all the provinces. The simulated production value of this province is around 4290 GW h yr−1. We notice that IAR-HP is missing six LHSs compared to TERNA's report; furthermore, this might be compounded by precipitation undercatch issues in the highest reaches of this watershed, likely influencing the final output of our simulation.
BM houses 31 LHSs consisting of 8 storage and 23 run-of-the-river systems. Most of the installed power comes from three PSHs with an installed power of 1680 MW, notably the Edolo hydroelectric plant with an installed power of 977 MW. The total installed power in the region is around 2060 MW. The average annual production is 3200 GW h yr−1, whereas the simulated production is about 3340 GW h yr−1, a very satisfactory outcome given the productivity of this province. For three M-PSHs, namely Edolo, Gargnano, and San Fiorano, the long-term average yearly production values of 1075, 198.5, and 559.7 GW h yr−1, respectively, were considered for validation instead of their simulated counterparts, as described in Sect. 2.2.4.
The province of Bolzano has 28 LHSs, comprising 13 storage and 15 run-of-the-river plants. The total installed capacity is nearly 1400 MW, with individual plant capacities ranging from 6.4 to 230 MW. Following Sect. 2.2.4, the simulated value for the PSH plant of Pracomune was considered equal to its declared nominal production (15 GW h yr−1). The province's average annual historical production is about 4600 GW h, while the simulated production rate shows a satisfactory similarity of 3900 GW h yr−1. We notice that IAR-HP is missing 16 LHSs compared to TERNA's report, the largest deviation from TERNA's report for a single province (see Table 4), which is accompanied by a relevant impact on the accuracy of the simulations (−15.2 % from the observed value).
Trento has 30 LHSs, with 9 run-of-the-river plants and 21 storage types, totaling 1610 MW installed power, of which 1500 MW are contributed by storage type hydropower. Plants in Trento have capacities ranging from 5 to 350 MW. Santa Massenza-Molveno is a pure PSH, while Riva del Garda 1 is an M-PSH; for both of them the long-term average production of 600 and 124.8 GW h yr−1, respectively, were considered. This province's long-term historical production is approximately 3340 GW h yr−1, and its simulated production is about 3330 GW h yr−1, with a remarkable similarity of 99 % compared to historical production.
Verona province has no storage hydropower systems – all six LHSs in the dataset are run-of-the-river systems exploiting the lowland high flows of the Adige river. The diversion channel systems installed for this province have large capacities, averaging 130 m3 s−1. This high average flow rate allows the province to have a long-term average production of 635 GW h yr−1, while the simulated results indicate a production rate of 800 GW h yr−1. In this case, the overestimation is likely due to agricultural withdrawals not being modeled, which are non-negligible in this area, leaving more water available for production.
Vicenza has three run-of-the-river plants and a single storage plant, with a total installed power of 44 MW. The historical production rate for this province is reported at 220 GW h yr−1, with the storage plant contributing nearly half of the total power generation. The simulated production value for Vicenza is 140 GW h yr−1, a deficit that is chiefly attributable to one missing plant, possibly compounded with a lack of representation of available flows.
In the province of Belluno there are 11 storage and 9 run-of-the-river plants, fed by the upper portion of the Piave river catchment. The average installed power in this province is around 17 MW, with the exception of the Soverzene plant, which has an installed power of 210 MW. The total installed power in Belluno is 540 MW. The long-term average annual production is 1755 GW h, while the simulated production rate for this province is 1730 GW h yr−1, benefiting from both an accurate representation of LHSs in the area and of the available flows, improved by the multi-site calibration framework, as highlighted in Galletti et al. (2021).
In Treviso province, there is one storage and five run-of-the-river plants, with a total installed power of 360 MW. Fadalto Nuova and Nove, with a combined installed power of 320 MW, are the leading plant producers in the province. Since Fadalto Nuova is an M-PSH, its production was accounted equal to the declared nominal production of the system (344.8 GW h yr−1). The capacity of the diversion channels for RoR plants in Treviso ranges from 14 to 135 m3 s−1, allowing for a long-term average production of 610 GW h yr−1. The simulated results overestimate the production, yielding about 837 GW h yr−1. We attribute the poor performance to a weak representation of the flows, and notice that IAR-HP contains one more LHS than those reported from TERNA for this province.
There are six power plants in GU, comprising four run-of-the-river plants and two storage plants. Approximately 70 % of the installed power in this area comes from the Somplago plant, with an installed power capacity of about 173 MW. These provinces' combined installed power capacity is 250 MW, leading to an annual production of 580 GW h, with a simulated value of 590 GW h.
Pordenone features 13 LHSs, 4 storage, 9 run-of-the-river plants, and 360 MW installed power. The intake capacity of the RoR plants averages 25 m3 s−1, ranging from 7 to 30 m3 s−1. Pordenone has an average historical annual production of 590 GW h yr−1, and the simulated value of this province is about 740 GW h yr−1, likely because this area is not hydrologically similar to the Piave catchment, from which it borrowed its hydrological parametrization.
The level of accuracy achieved in the validation of IAR-HP indicates that the dataset effectively captures the spatial distribution and operational characteristics of LHSs and is well suited to use in hydrological modeling endeavors in the study region. Such precision facilitates reliable modeling outcomes, thereby supporting water resource planners and policymakers in decision-making processes related to energy production and distribution in the Italian Alpine region. Despite these positive aspects, several challenges have been identified. We notice (see Table 4) that our simulated production is usually negatively biased, especially in the provinces with the largest production and plant count, often characterized by high-head LHSs located in upstream catchments. We attribute this to a combination of (i) IAR-HP not reporting some smaller LHSs as opposed to those reported officially by TERNA; (ii) hydrological calibration and undercatch affecting the amount of water available in the upper portions of these catchments, often contributing to the largest share of hydropower production; and (iii) simplified reservoir operation schemes, leading to sub-optimal production performance. Conversely, positive bias (less relevant in absolute terms) emerged mainly in provinces with abundant low-head, high-flow LHSs. in this case, we attribute the bias to (i) slight head differences between our reported head (computed according to the DEM) and the real one, combined with (ii) bias in the large flows handled by these plants.
We group the aforementioned issues into two categories, namely reporting issues and hydropower modeling challenges, on which we now focus. Finally, we would like to compare IAR-HP with two recent contributions.
4.1 Reporting issues
The first item concerns reporting issues resulting in the small mismatch between the number of facilities reported in the TERNA database and those collected in IAR-HP (see Table 4). We identified a few main causes for this. A notable issue is the attribution of hydropower plants located near administrative borders to the correct province. Indeed, ambiguities often arise regarding the jurisdiction these plants belong to, which in turn opens up potential misallocation of production data across provinces. In addition, reporting discrepancies are also present: official reports may list multiple production groups within a single facility separately (e.g., due to different units being built at different times), whereas our dataset considers these groups as a single entity. On the one hand, we cannot reconstruct exactly which productive units are counted as multiple, but on the other hand, this counting convention is only relevant in terms of plant numbers. At the same time, the installed power for each plant is reported correctly and confirmed by our validation exercise. Finally, we acknowledge that some plants, likely smaller ones close to the LHS power threshold of 3 MW, might be missing from our dataset, although the results presented in the validation exercise make us confident that the major ones are correctly reported. This is somewhat confirmed by the fact that the plant count gap between TERNA and IAR-HP is largest in the highest-producing provinces (where it is common to have several productive units in the same building, usually originating from incremental development of the facilities).
4.2 Hydropower modeling challenges
The second challenge concerns the uncertainty associated with hydropower production modeling. Management practices, particularly those concerning storage and pumped storage hydropower systems, introduce significant uncertainties that can lead to differences in the exact timing of water usage, in turn affecting the hydraulic head and cascading into energy production. Furthermore, the structural geometry of these systems, including the precise location of generators, can impact the head and, consequently, power generation efficiency. For instance, generators located below the surface might result in an increased effective head compared to that obtained through DEM differences, altering expected outputs. These structural uncertainties affected the output of our modeling activity to some extent, although once again we are reassured by the quality of our results. It is also worth noticing that agricultural water withdrawals are not modeled in HYPERstreamHS, effectively granting more water during the irrigation season, especially in lowland catchments where this kind of water use is more prominent. Finally, the accuracy of hydropower modeling is strongly related to the input data, chiefly precipitation but also temperature and evapotranspiration. These variables all exert macroscopic effects on the water balance, defining the volume of water available to hydropower systems and thus affecting hydropower production. Moreover, hydrological parametrization is critical in determining the timing and quantity of water available for hydropower generation. Variability in these parameters can lead to deviations in model predictions, underscoring the importance of precise data collection and parameter estimation in enhancing model reliability. We do however believe that the very good hydrological calibration results ensured a realistic water balance throughout our calibration exercise.
4.3 Similar contributions
In this section, we put IAR-HP in relationship with two very valuable contributions that were recently published, from Evangelista et al. (2024, preprint) and Catania et al. (2024). Evangelista et al. (2024) gathers information about the attributes of 528 large dams in Italy, including dam characteristics, geographic coordinates, structural features, and upstream catchment data. The study also integrates climatological data, land cover, and normalized difference vegetation index values, allowing for a comprehensive hydrological and environmental assessment of each dam's catchment area. Evangelista et al. (2024) reports 184 hydropower dams in the IAR-HP domain, while 156 are recorded in IAR-HP. This difference arises from two factors. Firstly, Evangelista et al. (2024) reports the presence of multiple dams where they are present, although no information on their stage–storage relationship is provided. Conversely, IAR-HP only adopts the main dam, for which MIT (2022) provided a stage–storage relationship. Indeed, the availability of a stage–storage curve at each dammed location is an essential prerequisite for correctly modeling dam storage dynamics in HYPERstreamHS, hence our recording choice.
Catania et al. (2024) compiled a database of the programmable (reservoir and pumped storage) LHSs in the Italian Alps. They recorded information on power capacity (for pumped storage plants, both charging and discharging), energy capacity, head, volume of the basin, and geographical coordinates. In the area of IAR-HP, Catania et al. (2024) reports 128 programmable LHSs, as opposed to the 129 reported in IAR-HP; furthermore, upon deeper examination, some of the plants reported in Catania et al. (2024) seem not to exceed the 3 MW threshold set by Italian legislation for LHSs. Finally, neither of the two aforementioned contributions includes (due to their scope) information about
-
run-of-the-river LHSs in general,
-
diversion channel location and abstraction capacity,
-
ecological flow requirements for both reservoirs and diversion channels, or
-
reservoir operating rules.
This information is, in our opinion, crucial for performing thorough assessments of the water–energy nexus and is all included in IAR-HP (see as an example the inset in Fig. 1). Furthermore, IAR-HP information was explicitly validated through a hydropower production modeling exercise. We stress that a direct comparison among these three datasets is not possible, nor would it appropriately credit the value each of them brings. Rather, we see IAR-HP as a very valid addition to a widely acknowledged gap in the (Italian) water–energy modeling community, able to effectively complement information from other sources. IAR-HP holds significant potential for supporting broad water–energy nexus studies, making it a valuable asset for integrated resource planning and sustainable development efforts. It can serve as a pivotal component in scenario analyses that range from simulating the impacts of climate change on hydropower production to evaluating the effects of varying water management strategies and/or environmental policies, and to assessing the resilience of energy systems under different hydro-meteorologic conditions.
4.4 Potential applications of IAR-HP
Hydrologically based hydropower assessments in Italy have historically been limited to specific regions due to difficulties in retrieving consistent and sufficiently wide data sources (e.g., Bombelli et al., 2019; Majone et al., 2016; Ravazzani et al., 2016; Maran et al., 2014). IAR-HP (together with the valuable contributions mentioned in the previous subsection) provides an open, geographically wide, and spatially consistent source of information. Its strong hydrological focus, coupled with a detailed description of large hydropower systems (LHSs), provides an improved information basis for assessing hydropower potential at both national and continental scales (e.g., Wechsler et al., 2023; Quaranta et al., 2022, 2021; Patro et al., 2018). For instance, detailed storage discretization and hydraulic head information allow for site-by-site assessments of reservoir hydropower potential, while the precise geolocation of the infrastructures may enhance the estimation of available heads in run-of-the-river hydropower systems. Furthermore, integrating this information into a hydrological modeling framework enables more reliable estimation of both inflows and minimum ecological flow requirements, which play a crucial role when assessing adaptation policies (Wechsler et al., 2023). Additionally, the high spatial resolution of IAR-HP can support environmental studies by facilitating the correlation of hydropower-induced streamflow alterations with regional-to-local ecological assessments of some known adverse effects, such as hydropeaking (Bruno et al., 2023), altered sediment transport (Dethier et al., 2022), and river network fragmentation (Carolli et al., 2023; Anderson et al., 2015), aiding the development of adequate mitigation strategies.
The IAR-HP dataset is shared freely on Zenodo, and data are available for download at https://doi.org/10.5281/zenodo.14040971 (Galletti et al., 2024). Data include LHS characteristics, as well as (simulated) minimum ecological flow requirements and turbine discharge scheme adopted for reservoir hydropower plants. Data are stored in the form of Excel (.xlsx) tables, and separate shapefiles (.shp) for each node type (Plant, Intake, Reservoir) are provided; R and Python scripts that were used to preprocess data into inputs for HYPERstreamHS, as well as the model itself, are available upon request to the authors. The dataset is released under the Creative Commons Attribution 4.0 International license.
We believe that IAR-HP represents a very valuable contribution to the water–energy modeling community, especially that working on the Italian Alpine Region; the pressing need for this kind of information is confirmed by a similar openly available dataset being completed and published recently. Nevertheless, fully understanding the limitations, as well as the assumptions that were made in compiling IAR-HP, can help to maximize the outcomes of its adoption in further research, as well as directly improving the dataset.
While IAR-HP has demonstrated robust performance in hydropower modeling, coherently reconstructing 96.2 % of observed hydropower across 21 provinces in the Italian Alps, we underscore the necessity for continual refinement and validation of its contents. Addressing geographic, reporting, and structural uncertainties will help increase the quality of the dataset per se, while enhancing the accuracy of input data and parametrization is equally essential for achieving reliable modeling outcomes and ensuring their applicability across diverse regions. The dataset's potential for facilitating comprehensive water–energy nexus assessments further highlights its value as a tool for advancing integrated resource management and planning.
In this appendix, we provide additional insights into the definition of key hydropower variables, specifically QAVG, QDES, and QMAX, and discuss their mutual relationships. The flow variables are defined as
all terms are defined in Table 2. QAVG thus represents the average turbined flow assuming the plant is functioning all hours throughout the year, to reconstruct the observed long-term average production EAVG, so it is representative in terms of aggregated turbined volumes, less in terms of daily turbine operation (i.e., it does not represent the value at which the plant usually operates, but rather the average of the functioning and non-functioning hours throughout the year). QDES represents the design flow rate of a given hydropower system and is computed based on its installed capacity; it therefore represents the flow rate at which the plant achieves its optimal power output, Winst. Finally, QMAX represents the maximum authorized discharge rate for both water intakes and reservoirs (named Qwork for the latter, see Table 2). This means that it represents a regulatory constraint, rather than a hydraulic characteristic of the system.
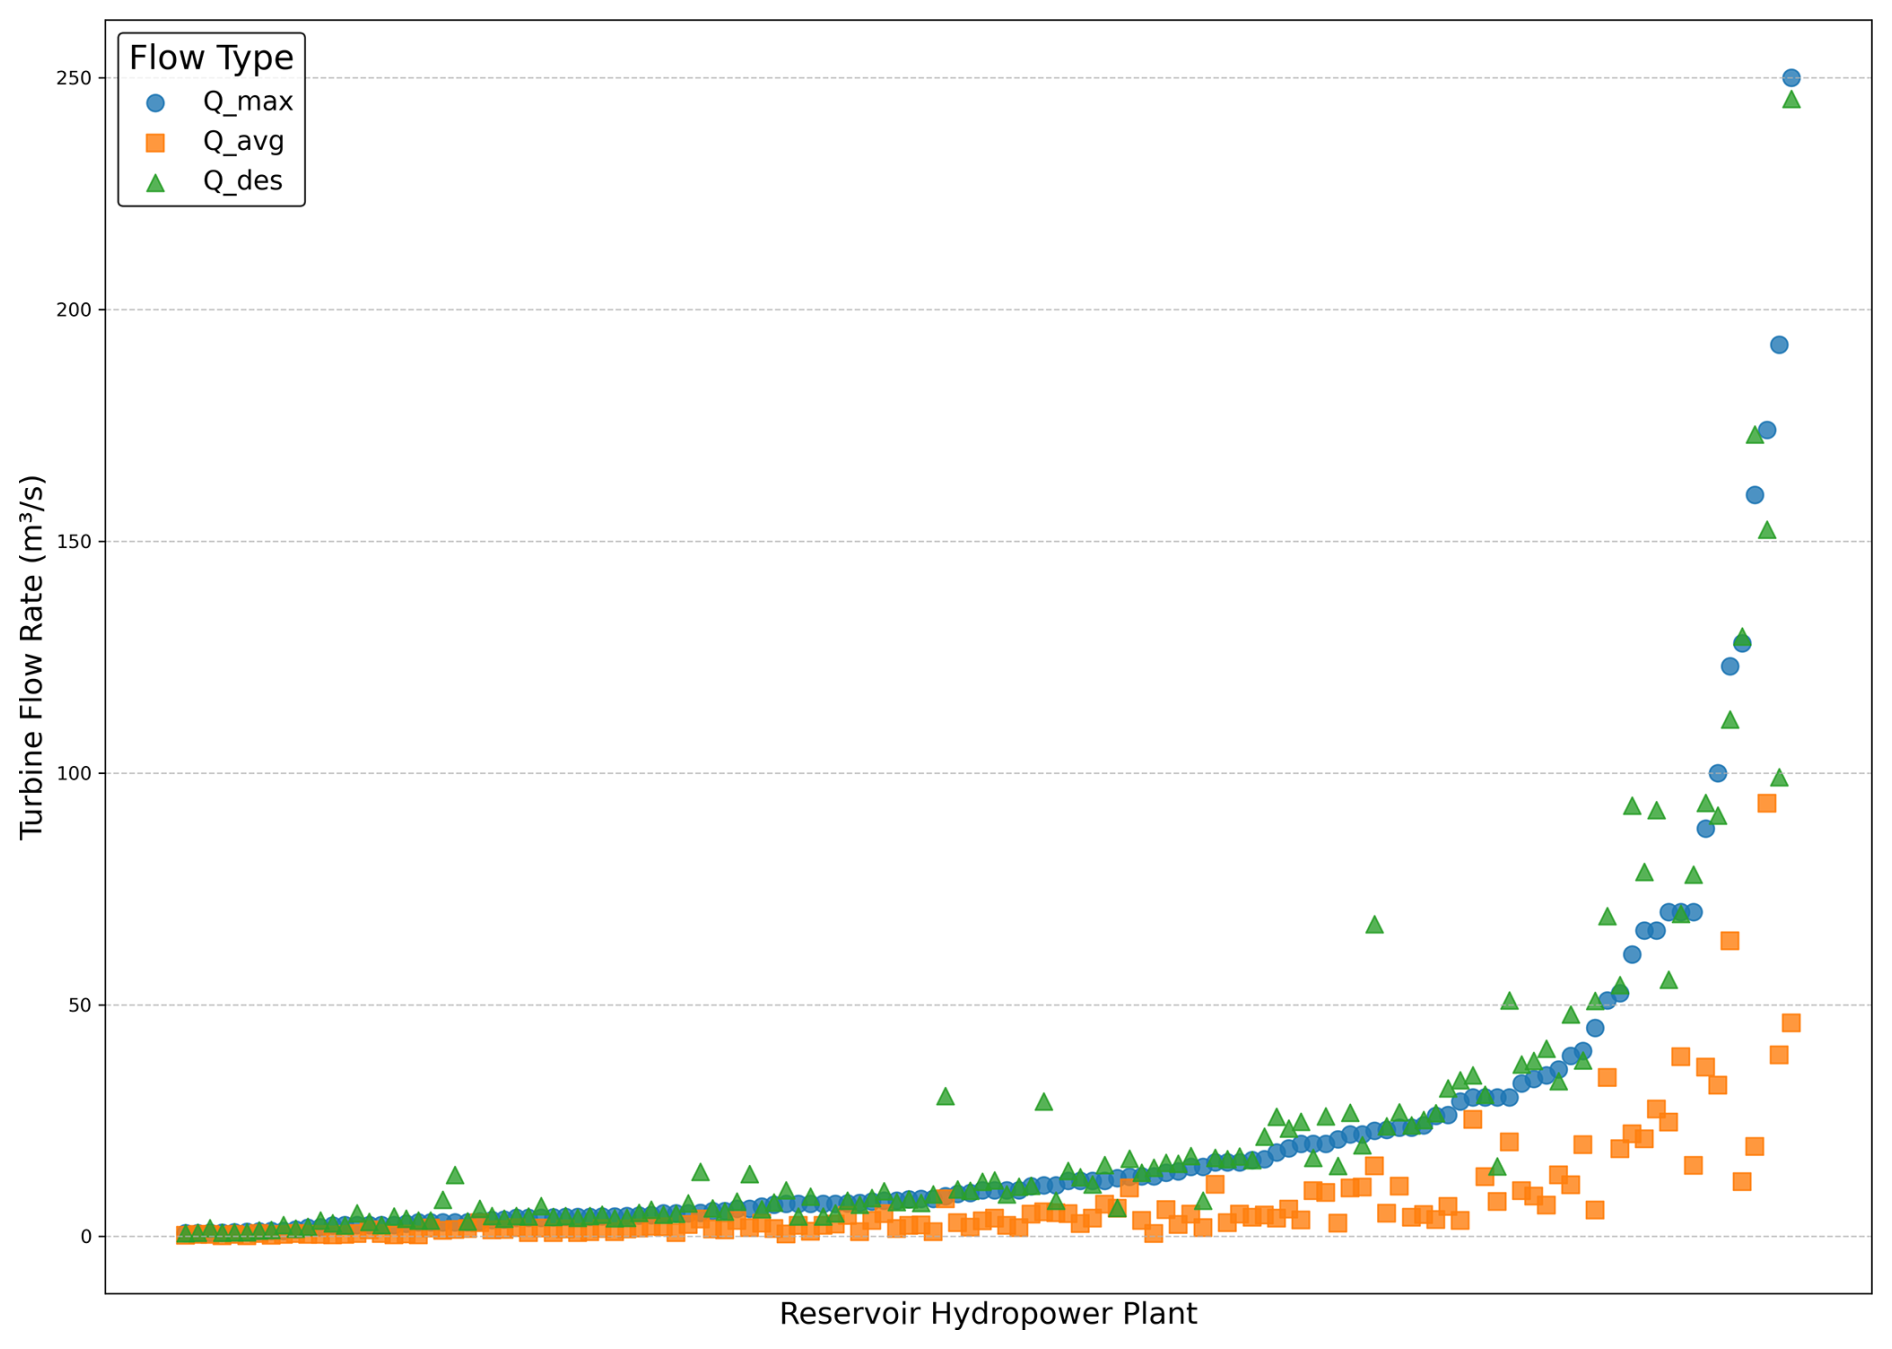
Figure A1Characteristic discharge values for each reservoir hydropower system. Systems are sorted along the x axis in order of increasing QMAX, for readability.
Figure A1 depicts the mutual relationship between QAVG, QDES, and QMAX for all reservoir hydropower systems, sorted according to QMAX. As can be expected, QAVG is consistently lower, at varying rates, than the other two: the average ratio (hereafter referred to as the ratio) is about 0.33. Interestingly, QDES and QMAX appear very similar across all systems, while one might expect QDES to be somewhat lower. The explanation lies in the fact that QMAX is not a hydraulic capacity value, but rather a regulatory one. Indeed, hydropower systems are often designed according to their respective maximum authorized flow rate, for the sake of cost efficiency. This tells us that the recorded value of QMAX can reasonably be assumed as the design flow rate for each hydropower system.
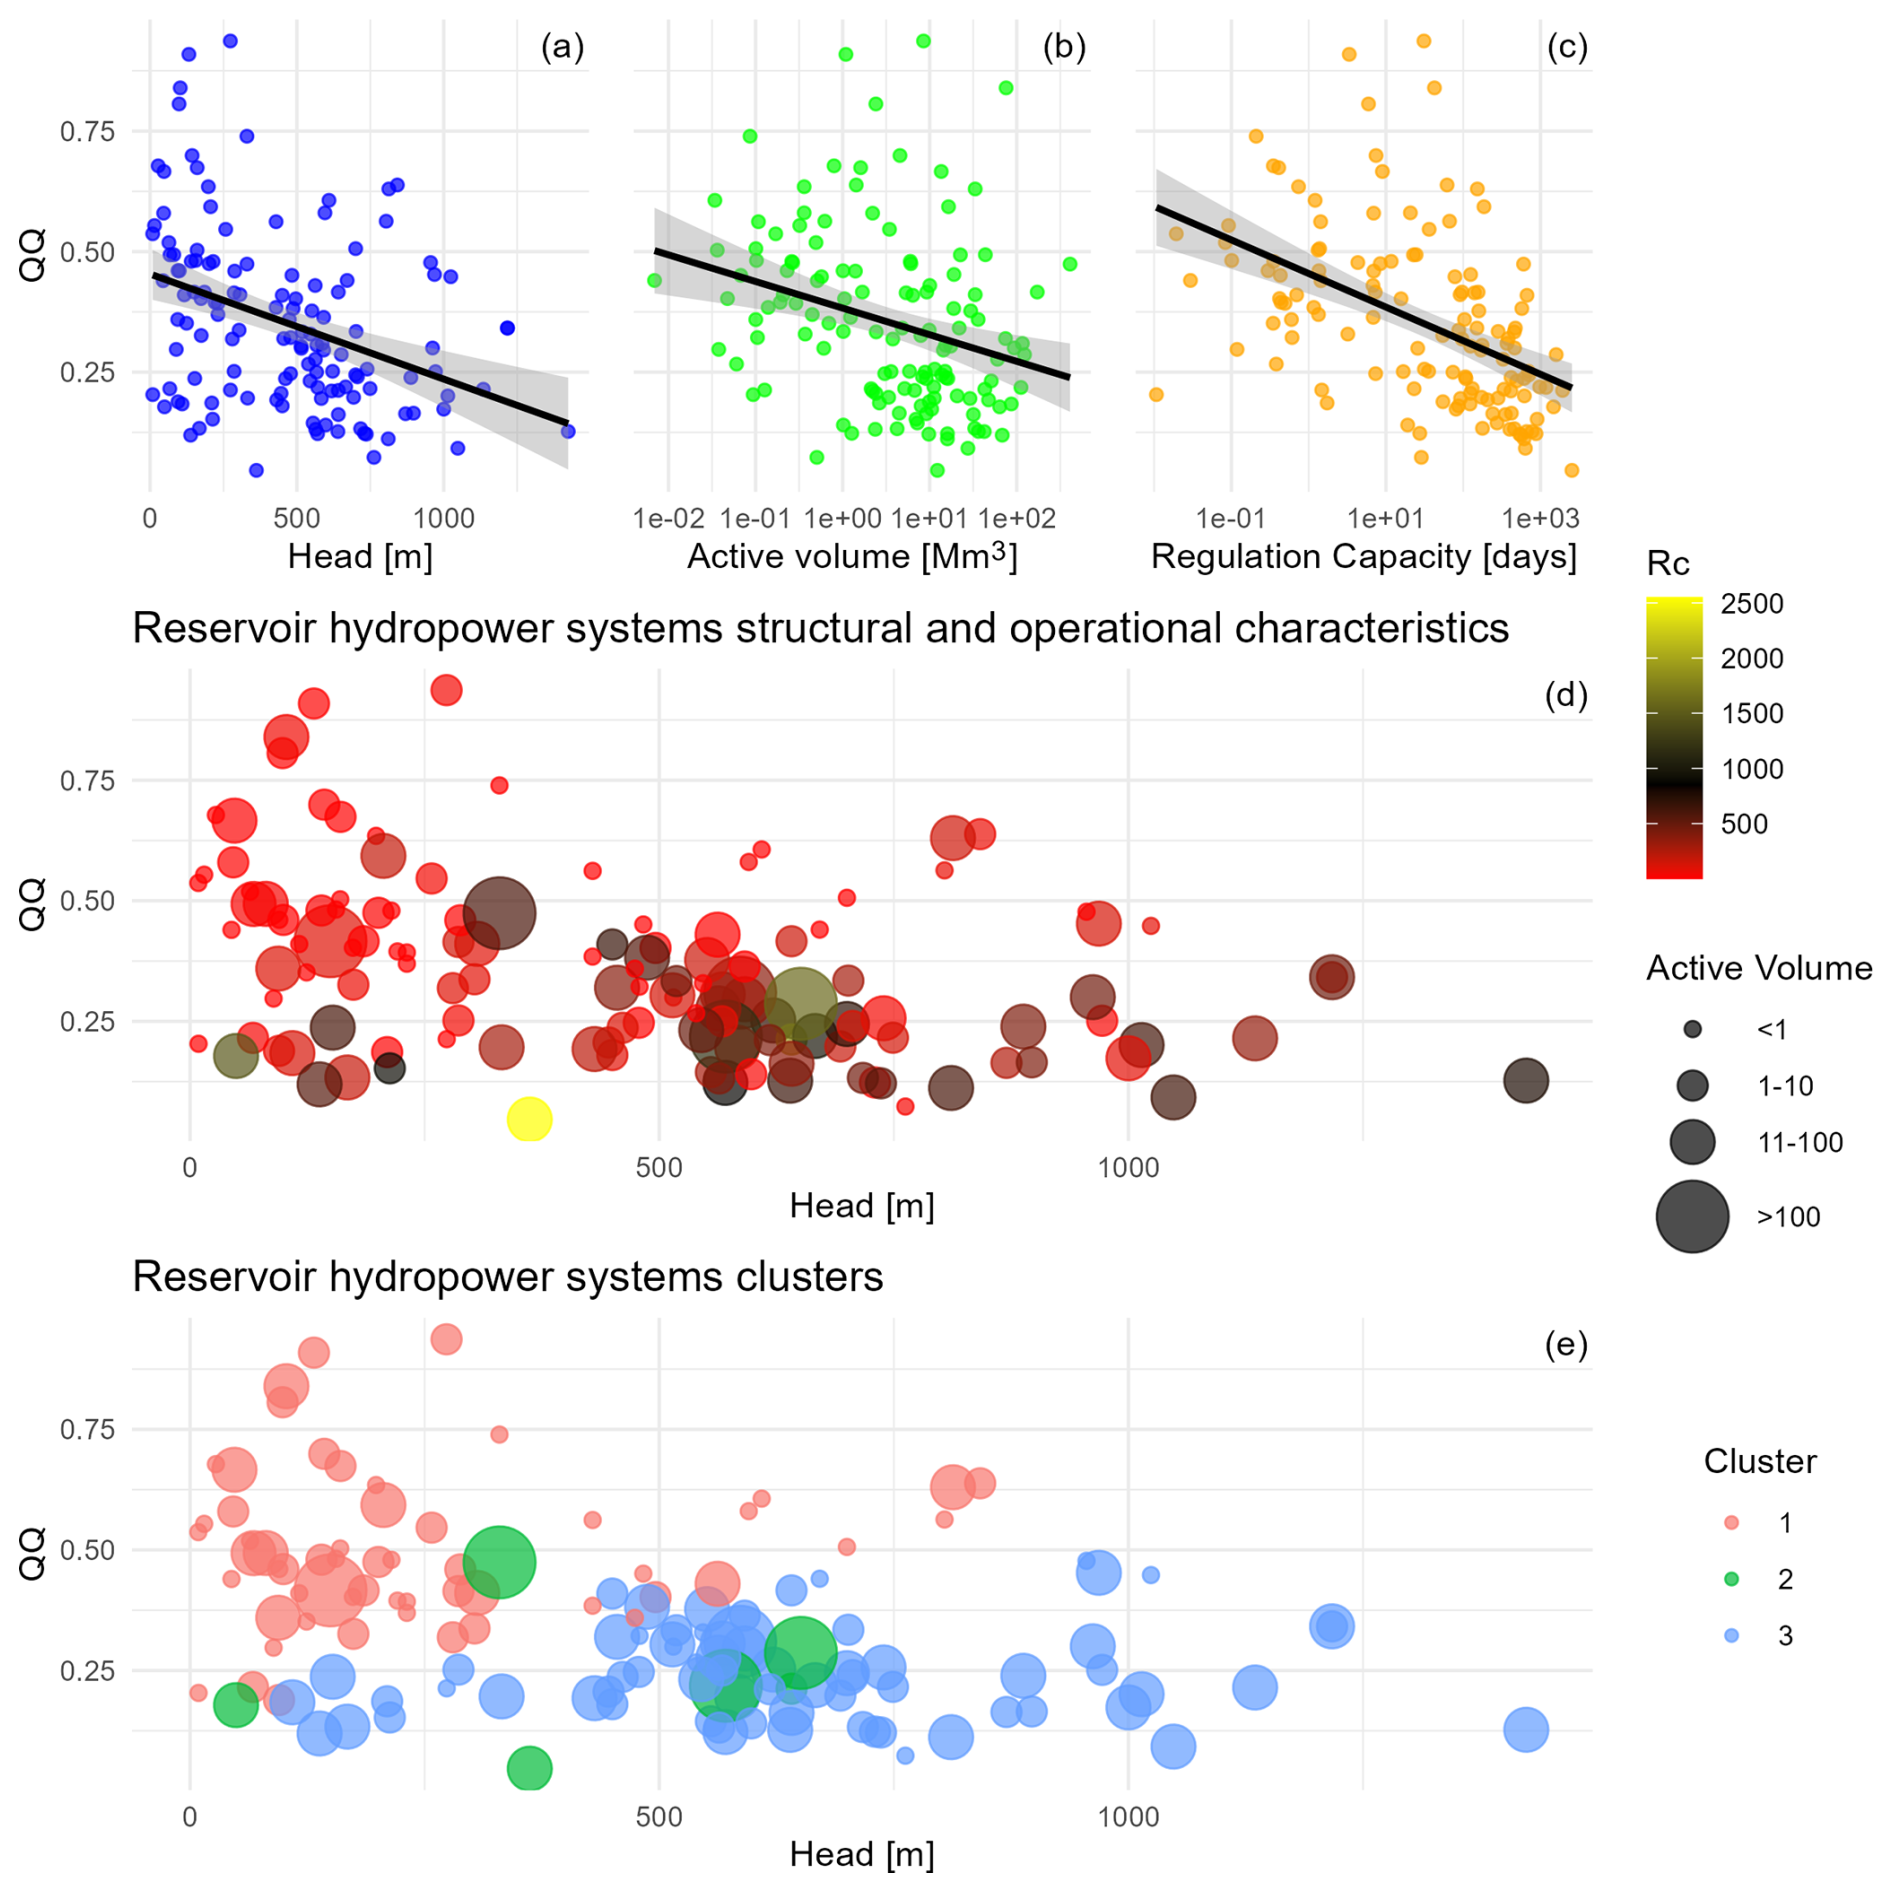
Figure A2Relationship of ratio with structural characteristics of the related hydropower system. Panels (a)–(c) show the univariate relationship with system head, reservoir active volume, and regulation capacity, respectively, together with a linear regression model (black line) and the corresponding 95 % confidence interval (gray shading). Panel (d) shows the mutual relationship of all four variables, using color and bubble size to track their regulation capacity and active volume, respectively, while head was assigned to the x axis to improve readability. Panel (e) shows the clusters resulting from the k-means clustering analysis, using three clusters. The bubble sizing was left unchanged from the previous panel, to allow easier identification of the individual systems.
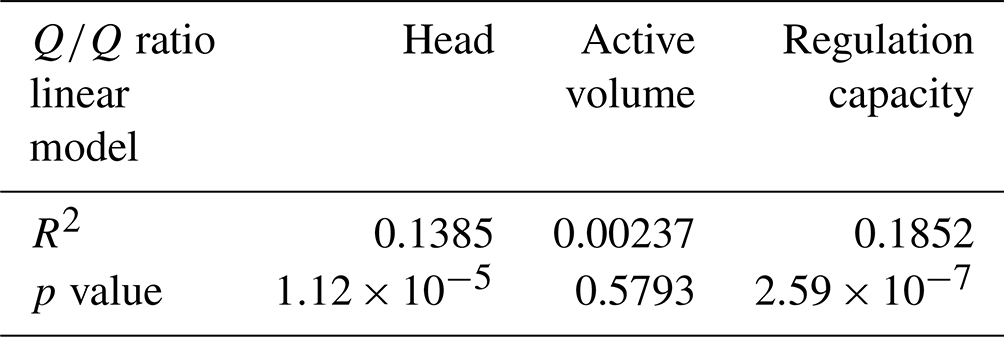
Table A1Goodness-of-fit statistics for the linear regression models fitted between ratio and the reservoir systems' head, active volume, and regulation capacity.
The relationship between the ratio and other system properties such as head, active volume, and regulation capacity (Rc) is investigated in the following. The active volume is defined as the volume available for regulation activities between Hmin,reg and Hmax,reg, and is obtained by interpolating the respective stage–storage curve for each reservoir. Rc is defined as the time (in days) needed to fill the active volume with the average inflow. In the absence of official information, the average inflow to reservoirs was modeled under natural conditions for the 1995–2008 time window, following the same setup described in Sect. 2.2.
The relationship between the ratio and the other system characteristics is summarized in Fig. A2. The upper three panels (a–c) show the univariate correlation between and system head, active volume, and regulation capacity, respectively. A linear regression analysis highlights that both head and regulation capacity have a significant inverse proportionality with (see the statistics in Table A1). On the other hand, the active volume exhibits no significant correlation. The interplay between these variables in shaping the ratio for each hydropower system is depicted in Fig. A2d, where a clear trend emerges: hydropower systems with low regulation capacity (red bubbles) often present a higher ratio, meaning they most times turbine close to their design capacity. This is reasonable, as reservoirs with low regulation capacity tend to fill up more quickly, in contrast to those with high regulation capacity, which are often operated in peaking mode to exploit the maximum available head and flow rate, typically during periods of high power demand. This peaking operation leverages their regulation capacity but results in significant downtime. Similarly, hydropower systems characterized by both low head and low regulation capacity display the highest ratios. However, no clear operational mechanism explains the relationship between system head and the ratio. One possibility is that low head is a common characteristic of reservoir systems designed to operate nearly continuously (i.e., run-of-the-river-like, hence with low regulation capacity). Finally, volume alone appears to bear no relevance to the resulting ratio, as also highlighted by the univariate linear regression: volume shows no correlation with system head (with hydropower systems of differing storage capacities having varied heads), or with regulation capacity (which depends on inflow, not directly on reservoir volume).
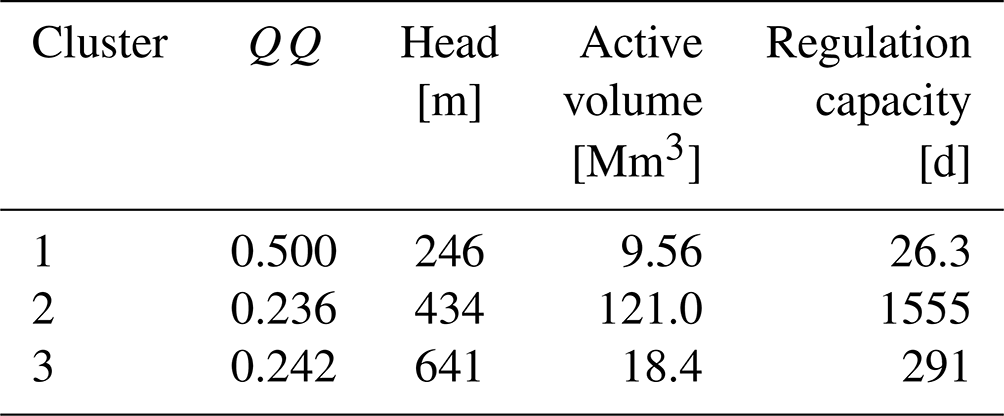
Finally, we conducted a k-means clustering analysis to verify our hypotheses on the relationship between ratio and system characteristics. There were no clear (analytical) indications of an optimal number of clusters: our attempts highlighted n=3 clusters as a good candidate, while the Bayesian information criterion indicates n=6 as optimal. Hence, we performed the clustering for both values of n, but noticed that n=6 produced unstable results due to the heterogeneity of the systems' characteristics (clusters with one and five members, and no additional information compared to n=3). Thus, we opted for using n=3. Centroid coordinates are presented in Table A2. It is possible to recognize two clear, opposite clusters: systems with medium-high regulation capacity (cluster 3, gathering most black bubbles from Fig. A2d) and low ratio, and systems with low regulation capacity and correspondingly higher ratio (cluster 1, gathering red bubbles from the previous panel). Finally, a cluster emerges for a few systems with very high regulation capacity (>800 d, see cluster 2 and corresponding yellow bubbles in the previous panel): these are characterized by medium-sized reservoirs, of which the larger tend to also have higher ratio, possibly because they were designed to accommodate large incoming flows and are operated accordingly.
All things considered, this analysis showed that regulation capacity is a good, yet not exhaustive, proxy of the typical reservoir operation regime of each system, here synthesized by the ratio. The exact relationship between the operation of individual systems and their structural characteristics is far more complex, and accounts for environmental and managerial aspects that are impossible to capture at this scale. Finally, we would like to remark that the regulation capacity is computed based on modeled inflows and, as such, is prone to local errors (for instance, we do believe that the bright yellow bubble in Fig. A2d originates from an unreasonably low modeled inflow). Thus, we conclude by stressing the importance of thoroughly assessing the hydrological characteristics of each catchment to better understand how they influence the operation of the hydropower systems therein.
| DEM | Digital elevation model |
| HP | Hydropower |
| IAR | Italian Alpine Region |
| IAR-HP | Italian Alpine Region HydroPower |
| LHS | Large hydropower system |
| M-PSH | Mixed pumped storage hydropower |
| MEF | Minimum ecological flow |
| PSH | Pumped storage hydropower |
| TERNA | Italian electricity grid manager |
AG: writing – original draft, conceptualization, methodology, data collection, software development, writing – review and editing; SZD: writing – original draft, data curation, formal validation analysis, visualization, writing – review and editing; BM: conceptualization, writing – review and editing, funding acquisition, supervision, resources.
The contact author has declared that none of the authors has any competing interests.
Publisher's note: Copernicus Publications remains neutral with regard to jurisdictional claims made in the text, published maps, institutional affiliations, or any other geographical representation in this paper. While Copernicus Publications makes every effort to include appropriate place names, the final responsibility lies with the authors.
This research received financial support from the Energy oriented Centre of Excellence (EoCoE-III), GA number 101144014, funded within the EuroHPC JU framework of the European Union. This research was also supported by the Italian Ministry of Education, Universities and Research (MUR), in the framework of the project DICAM-EXC (Departments of Excellence 2023–2027, grant L232/2016). Andrea Galletti was supported by the RETURN Extended Partnership, which received funding from the European Union NextGenerationEU (National Recovery and Resilience Plan – NRRP, Mission 4, Component 2, Investment 1.3 – D.D. 1243 2/8/2022, PE0000005). This paper was produced while Soroush Zarghami Dastjerdi is attending the PhD program in Sustainable Development And Climate Change at the University School for Advanced Studies IUSS Pavia, Cycle XXXVIII, with the support of a scholarship financed by the Ministerial Decree no. 351 of 9 April 2022, based on the NRRP – funded by the European Union – NextGenerationEU – Mission 4 “Education and Research”, Component 1, Investment 4.1. Bruno Majone was supported by the “iNEST (Interconnected Nord-Est Innovation Ecosystem)” project, funded by the European Union under NextGenerationEU (PNRR, Mission 4.2, Investment 1.5, Project ID: ECS 00000043).
This paper was edited by Giulio G. R. Iovine and reviewed by two anonymous referees.
Anderson, D., Moggridge, H., Warren, P., and Shucksmith, J.: The impacts of “run‐of‐river” hydropower on the physical and ecological condition of rivers, Water Environ. J., 29, 268–276, https://doi.org/10.1111/wej.12101, 2015. a, b
Avesani, D., Galletti, A., Piccolroaz, S., Bellin, A., and Majone, B.: A dual-layer MPI continuous large-scale hydrological model including Human Systems, Environ. Model. Softw., 139, 105003, https://doi.org/10.1016/j.envsoft.2021.105003, 2021. a, b, c, d, e, f, g, h, i
Bertoldi, W., Zanoni, L., and Tubino, M.: Assessment of morphological changes induced by flow and flood pulses in a gravel bed braided river: The Tagliamento River (Italy), Geomorphology, 114, 348–360, https://doi.org/10.1016/j.geomorph.2009.07.017, 2010. a
Bollmeyer, C., Keller, J., Ohlwein, C., Wahl, S., Crewell, S., Friederichs, P., Hense, A., Keune, J., Kneifel, S., Pscheidt, I., et al.: Towards a high-resolution regional reanalysis for the European CORDEX domain, Q. J. Roy. Meteorol. Soc., 141, 1–15, 2015. a
Bombelli, G. M., Soncini, A., Bianchi, A., and Bocchiola, D.: Potentially modified hydropower production under climate change in the Italian Alps, Hydrol. Process., 33, 2355–2372, https://doi.org/10.1002/hyp.13473, 2019. a
Bruno, M. C., Vallefuoco, F., Casari, A., Larsen, S., Dallafior, V., and Zolezzi, G.: Moving waters to mitigate hydropeaking: A case study from the Italian Alps, River Res. Appl., 39, 570–587, https://doi.org/10.1002/rra.4086, 2023. a, b
Carolli, M., de Leaniz, C. G., Jones, J., Belletti, B., Huđek, H., Pusch, M., Pandakov, P., Börger, L., and van de Bund, W.: Impacts of existing and planned hydropower dams on river fragmentation in the Balkan Region, Sci. Total Environ., 871, 161940, https://doi.org/10.1016/j.scitotenv.2023.161940, 2023. a, b
Catania, M., Parolin, F., Fattori, F., and Colbertaldo, P.: The role of hydropower in decarbonisation scenarios, Renew. Energy, 236, 121411, https://doi.org/10.1016/j.renene.2024.121411, 2024. a, b, c, d
Dethier, E. N., Renshaw, C. E., and Magilligan, F. J.: Rapid changes to global river suspended sediment flux by humans, Science, 376, 1447–1452, https://doi.org/10.1126/science.abn7980, 2022. a, b
Ember, E. I.: Statistical Review of World Energy (2024), Energy Institute, https://ourworldindata.org/energy/country/italy (last access: 18 October 2024), 2024. a, b
Evangelista, G., Mazzoglio, P., Ganora, D., Pianigiani, F., and Claps, P.: Features of Italian large dams and their upstream catchments, Earth Syst. Sci. Data, 17, 1407–1426, https://doi.org/10.5194/essd-17-1407-2025, 2025. a, b, c, d
Falloon, P. and Betts, R.: Climate impacts on European agriculture and water management in the context of adaptation and mitigation – The importance of an integrated approach, Sci. Total Environ., 408, 5667–5687, https://doi.org/10.1016/j.scitotenv.2009.05.002, 2010. a
Fatichi, S., Rimkus, S., Burlando, P., Bordoy, R., and Molnar, P.: High-resolution distributed analysis of climate and anthropogenic changes on the hydrology of an Alpine catchment, J. Hydrol., 525, 362–382, https://doi.org/10.1016/j.jhydrol.2015.03.036, 2015. a
Finger, D., Heinrich, G., Gobiet, A., and Bauder, A.: Projections of future water resources and their uncertainty in a glacierized catchment in the Swiss Alps and the subsequent effects on hydropower production during the 21st century, Water Resour. Res., 48, W02521, https://doi.org/10.1029/2011WR010733, 2012. a
Galletti, A., Avesani, D., Bellin, A., and Majone, B.: Detailed simulation of storage hydropower systems in large Alpine watersheds, J. Hydrol., 603, 127125, https://doi.org/10.1016/j.jhydrol.2021.127125, 2021. a, b, c, d, e, f, g, h, i
Galletti, A., Zarghami Dastjerdi, S., and Majone, B.: IAR-HP, Zenodo [data set], https://doi.org/10.5281/zenodo.14040971, 2024. a, b, c
Gaudard, L., Gilli, M., and Romerio, F.: Climate Change Impacts on Hydropower Management, Water Resour. Manage., 27, 5143–5156, https://doi.org/10.1007/s11269-013-0458-1, 2013. a
Gaudard, L., Romerio, F., Dalla Valle, F., Gorret, R., Maran, S., Ravazzani, G., Stoffel, M., and Volonterio, M.: Climate change impacts on hydropower in the Swiss and Italian Alps, Sci. Total Environ., 493, 1211–1221, https://doi.org/10.1016/j.scitotenv.2013.10.012, 2014. a
Hargreaves, G. H. and Samani, Z. A.: Estimating potential evapotranspiration, J. Irrig. Drain. Div., 108, 225–230, 1982. a
Howells, M., Hermann, S., Welsch, M., Bazilian, M., Engström, R., Alfstad, T., Gielen, D., Rogner, H., Fischer, G., Velthuizen, H., Wiberg, D., Young, C., Roehrl, R., Müller, A., Steduto, P., and Ramma, I.: Integrated analysis of climate change, land-use, energy and water strategies, Nat. Clim. Change, 3, 621–626, https://doi.org/10.1038/NCLIMATE1789, 2013. a
Isotta, F. A., Frei, C., Weilguni, V., Perčec Tadić, M., Lassegues, P., Rudolf, B., Pavan, V., Cacciamani, C., Antolini, G., Ratto, S. M., and Munari, M.: The climate of daily precipitation in the Alps: development and analysis of a high-resolution grid dataset from pan-Alpine rain-gauge data, Int. J. Climatol., 34, 1657–1675, https://doi.org/10.1002/joc.3794, 2014. a, b
Kennedy, J. and Eberhart, R.: Particle swarm optimization, in: vol. 4, IEEE Proceedings of ICNN 95 International conference on neural networks, Australia, 1942–1948, https://doi.org/10.1109/ICNN.1995.488968, 1995. a
La Jeunesse, I., Cirelli, C., Aubin, D., Larrue, C., Sellami, H., Afifi, S., Bellin, A., Benabdallah, S., Bird, D., Deidda, R., Dettori, M., Engin, G., Herrmann, F., Ludwig, R., Mabrouk, B., Majone, B., Paniconi, C., and Soddu, A.: Is climate change a threat for water uses in the Mediterranean region? Results from a survey at local scale, Sci. Total Environ. 543, 981–996, https://doi.org/10.1016/j.scitotenv.2015.04.062, 2016. a
Lehner, B., Liermann, C. R., Revenga, C., Vör[̈smarty, C., Fekete, B., Crouzet, P., Döll, P., Endejan, M., Frenken, K., Magome, J., Nilsson, C., Robertson, J. C., Rödel, R., Sindorf, N., and Wisser, D.: High-resolution mapping of the world's reservoirs and dams for sustainable river-flow management, Front. Ecol. Environ., 9, 494–502, https://doi.org/10.1890/100125, 2011. a
Lucca, E., Jeitany, J., Castelli, G., Pacetti, T., Bresci, E., Nardi, F., and Caporali, E.: A review of Water-Energy-Food-Ecosystems Nexus research in the Mediterranean: evolution, gaps and applications, Environ. Res. Lett., 18, 083001, https://doi.org/10.1088/1748-9326/ace375, 2023. a
Majone, B., Villa, F., Deidda, R., and Bellin, A.: Impact of climate change and water use policies on hydropower potential in the south-eastern Alpine region, Sci. Total Environ., 543, 965–980, https://doi.org/10.1016/j.scitotenv.2015.05.009, 2016. a, b
Maran, S., Volonterio, M., and Gaudard, L.: Climate change impacts on hydropower in an alpine catchment, Environ.Sci. Policy, 43, 15–25, https://doi.org/10.1016/j.envsci.2013.12.001, 2014. a, b, c
MIT: Cartografia delle grandi dighe, https://dgdighe.mit.gov.it/categoria/articolo/_cartografie_e_dati/_cartografie/cartografia_dighe (last access: 18 October 2024), 2022. a, b
Moccia, D., Salvadori, L., Ferrari, S., Carucci, A., and Pusceddu, A.: Implementation of the EU ecological flow policy in Italy with a focus on Sardinia, Adv. Oceanogr. Limnol., 11, 8781, https://doi.org/10.4081/aiol.2020.8781, 2020. a
Moriasi, D., Arnold, J., Van Liew, M., Bingner, R., Harmel, R., and Veith, T.: Model Evaluation Guidelines for Systematic Quantification of Accuracy in Watershed Simulations, T. ASABE, 50, 885–900, https://doi.org/10.13031/2013.23153, 2007. a
Mulligan, M., van Soesbergen, A., and Sáenz, L.: GOODD, a global dataset of more than 38,000 georeferenced dams, Sci. Data, 7, 31, https://doi.org/10.1038/s41597-020-0362-5, 2020. a
Nash, J. E. and Sutcliffe, J. V.: River flow forecasting through conceptual models part I – A discussion of principles, J. Hydrol., 10, 282–290, 1970. a
Patro, E. R., De Michele, C., and Avanzi, F.: Future perspectives of run-of-the-river hydropower and the impact of glaciers' shrinkage: The case of Italian Alps, Appl. Energy, 231, 699–713, https://doi.org/10.1016/j.apenergy.2018.09.063, 2018. a, b
Piccolroaz, S., Di Lazzaro, M., Zarlenga, A., Majone, B., Bellin, A., and Fiori, A.: HYPERstream: a multi-scale framework for streamflow routing in large-scale hydrological model, Hydrol. Earth Syst. Sci., 20, 2047–2061, https://doi.org/10.5194/hess-20-2047-2016, 2016. a, b
Quaranta, E., Aggidis, G., Boes, R. M., Comoglio, C., Michele, C. D., Patro, E. R., Georgievskaia, E., Harby, A., Kougias, I., Muntean, S., Pérez-Díaz, J., Romero-Gomez, P., Rosa-Clot, M., Schleiss, A. J., Vagnoni, E., Wirth, M., and Pistocchi, A.: Assessing the energy potential of modernizing the European hydropower fleet, Energ. Convers. Manage., 246, 114655, https://doi.org/10.1016/j.enconman.2021.114655, 2021. a
Quaranta, E., Bódis, K., Kasiulis, E., McNabola, A., and Pistocchi, A.: Is There a Residual and Hidden Potential for Small and Micro Hydropower in Europe? A Screening-Level Regional Assessment, Water Resour. Manage., 36, 1745–1762, https://doi.org/10.1007/s11269-022-03084-6, 2022. a
Ravazzani, G., Valle, F. D., Gaudard, L., Mendlik, T., Gobiet, A., and Mancini, M.: Assessing Climate Impacts on Hydropower Production: The Case of the Toce River Basin, Climate, 4, 1–16, https://doi.org/10.3390/cli4020016, 2016. a
Schaefli, B.: Projecting hydropower production under future climates: a guide for decision-makers and modelers to interpret and design climate change impact assessments, WIREs Water, 2, 271–289, https://doi.org/10.1002/wat2.1083, 2015. a
Scherrer, S. C.: Temperature monitoring in mountain regions using reanalyses: lessons from the Alps, Environ. Res. Lett., 15, 044005, https://doi.org/10.1088/1748-9326/ab702d, 2020. a
Shrestha, S., Khatiwada, M., Babel, M., and Parajuli, K.: Impact of Climate Change on River Flow and Hydropower Production in Kulekhani Hydropower Project of Nepal, Environ. Process., 1, 230–250, https://doi.org/10.1007/s40710-014-0020-z, 2014. a
Terna: Evoluzione Mercato Elettrico, Tech. rep., Terna S.P.A. (Italian Electricity Grid Manager), https://www.terna.it/it/sistema-elettrico/statistiche/evoluzione-mercato-elettrico/download-center (last access: 18 October 2024), 2024. a, b, c
Tianbo Zhang, A. and Gu, V.: Global Dam Tracker: A database of more than 35,000 dams with location, catchment, and attribute information, Sci. Data, 10, 111, https://doi.org/10.1038/s41597-023-02008-2, 2023. a
Turner, S. W., Hejazi, M., Kim, S. H., Clarke, L., and Edmonds, J.: Climate impacts on hydropower and consequences for global electricity supply investment needs, Energy, 141, 2081–2090, https://doi.org/10.1016/j.energy.2017.11.089, 2017. a
Vu, D. T., Dang, T. D., Pianosi, F., and Galelli, S.: Calibrating macroscale hydrological models in poorly gauged and heavily regulated basins, Hydrol. Earth Syst. Sci., 27, 3485–3504, https://doi.org/10.5194/hess-27-3485-2023, 2023. a
Wagner, T., Themeßl, M., Schüppel, A., Gobiet, A., Stigler, H., and Birk, S.: Impacts of climate change on stream flow and hydro power generation in the Alpine region, Environ. Earth Sci., 76, 4, https://doi.org/10.1007/s12665-016-6318-6, 2016. a
Wechsler, T., Stähli, M., Jorde, K., Zappa, M., and Schaefli, B.: The future of Alpine Run-of-River hydropower production: Climate change, environmental flow requirements, and technical production potential, Sci. Total Environ., 890, 163934, https://doi.org/10.1016/j.scitotenv.2023.163934, 2023. a, b
- Abstract
- Introduction
- Materials and methods
- Simulation of hydropower production
- Discussion
- Data availability
- Conclusion
- Appendix A: Further considerations on the definition of hydropower variables
- Appendix B: List of abbreviations
- Author contributions
- Competing interests
- Disclaimer
- Financial support
- Review statement
- References