the Creative Commons Attribution 4.0 License.
the Creative Commons Attribution 4.0 License.
 | 10 Jul 2025
Remote sensing of young leaf photosynthetic capacity in tropical and subtropical evergreen broadleaved forests
Xueqin Yang
Qingling Sun
Liusheng Han
Jie Tian
Wenping Yuan
Liyang Liu
Wei Zheng
Mei Wang
Yunpeng Wang
Xiuzhi Chen
Determining the large-scale RuBisCO carboxylation maximum rate (Vc,max25) in relation to leaf age is essential for evaluating the photosynthetic capacity of canopy leaves in global forests. Young leaves (≤ 180 d), which exhibit higher Vc,max25 compared to old leaves (> 180 d), are key to controlling the seasonality of leaf photosynthetic capacity in tropical and subtropical evergreen broadleaved forests (TEFs). Nevertheless, quantifying the leaf photosynthetic capacities of different ages across TEFs remains challenging, especially when considering continuous temporal variations at continental scales. In this study, we propose a novel methodology that leverages neighborhood pixel analysis with nonlinear least-squares optimization to derive the Vc,max25 of young leaves at 0.25° spatial resolution. This approach utilizes satellite-based solar-induced chlorophyll fluorescence (SIF) products spanning the period from 2001 to 2018, which were reconstructed using both TROPOMI (Tropospheric Monitoring Instrument) SIF and MODIS reflectance data (RTSIF). Validations against in situ observations demonstrate that the newly developed Vc,max25 products accurately capture the seasonality of young leaves in South America and subtropical Asia, with correlation coefficients of 0.84, 0.66, and 0.95, respectively. The Vc,max25 of the young leaves simulated from the RTSIF-derived gross primary production (GPP) is effectively correlated (R > 0.51) with that dissolved from the global Orbiting Carbon Observatory-2 (OCO-2)-based SIF (GOSIF) GPP. Furthermore, the gridded Vc,max25 dataset for young leaves successfully detects the green-up regions during the dry seasons in the tropics. Overall, this study presents the first satellite-based Vc,max25 dataset specifically targeting photosynthetically efficient young leaves, providing valuable insights for modeling large-scale photosynthetic dynamics and carbon cycles in TEFs. Herein, we provide the Vc,max25 time series derived from RTSIF GPP as the primary dataset, supplemented by GOSIF-derived and FLUXCOM products. These Vc,max25 products are available at https://doi.org/10.5281/zenodo.14807414 (Yang et al., 2025).
- Article
(12327 KB) - Full-text XML
-
Supplement
(2112 KB) - BibTeX
- EndNote


The maximum carboxylation rate (Vc,max) is a critical leaf trait that strongly influences seasonal variations in canopy photosynthesis across tropical and subtropical evergreen broadleaved forests (TEFs; Chen et al., 2022a; Wu et al., 2018). This relationship stems from the high correlation between Vc,max and nitrogen-related plant functional traits (Lu et al., 2020; Dechant et al., 2020), including leaf nitrogen and chlorophyll content (Lu et al., 2020). However, leaf nitrogen content varies substantially at a large scale due to the influence of multiple biotic and abiotic factors (Quebbeman and Ramirez, 2016), such as leaf lifespan (Onoda et al., 2017), leaf temperature (Verheijen et al., 2013), light intensity (Hikosaka, 2014), and species (Evans, 1989). Leaf nitrogen content inversion from remote sensing data at a large scale remains challenging (Knyazikhin et al., 2013), hindering accurate mapping of Vc,max at regional to global scales.
The Vc,max at 25° (hereafter denoted as Vc,max25) serves as a benchmark in most ecosystem models for simulating various Vc,max values at different temperatures. For instance, the Farquhar–von Caemmerer–Berry (FvCB) leaf photosynthetic model, widely adopted for simulating plant photosynthesis across ecosystems (Farquhar et al., 1980; Sun et al., 2015), relies on Vc,max25 as a key parameter in determining leaf photosynthetic capacity. However, Vc,max25 varies considerably among tree species, with even 2-fold to 3-fold differences observed within the same species (Orndahl et al., 2022). Research on this issue remains limited and inconclusive, largely due to the complex interplay of seasonal constraints such as water availability and light, which affect leaf flushing and shedding processes across different climatic zones (Brando et al., 2010; Yang et al., 2021). Recent advances have led to the development of two independent satellite remote sensing approaches for estimating Vc,max25 at a global scale. The first approach to deriving Vc,max25 is via leaf chlorophyll content (LCC) (Luo et al., 2019; Lu et al., 2020), as chlorophyll harvests light and provides energy for reactions in the Calvin–Benson–Bassham (CBB) cycle of photosynthesis (Luo et al., 2019). Moreover, chlorophyll harvests light energy and powers reactions in the CBB cycle (Luo et al., 2019), and Vc,max25 exhibits strong coordination with LCC as plants optimize their photosynthetic nitrogen resources (Croft et al., 2020; Xu et al., 2022a, b). This LCC-based method enables reliable Vc,max25 estimation across various spatiotemporal scales. The second approach estimates Vc,max25 using solar-induced chlorophyll fluorescence (SIF) (Mohammed et al., 2019), which serves as a robust proxy for global gross primary production (GPP) mapping (Mohammed et al., 2019; Frankenberg et al., 2011). Both LCC-derived and SIF-derived Vc,max25 products present distinct advantages and limitations. Notably, multispectral satellite data can retrieve LCC at significantly higher spatial and temporal resolutions than SIF measurements (Chen et al., 2022a). Nevertheless, LCC retrieval from remote sensing data is susceptible to uncertainty in the vegetation structural parameters employed in the derivation (Luo et al., 2019). Converting LCC into Vc,max25 relies on empirical relationships for different plant functional types (PFTs), introducing substantial uncertainties (Chou et al., 2020; Croft et al., 2017; Houborg et al., 2013; Houborg et al., 2015). In comparison, while SIF directly correlates with photosynthetic rates, most satellite-based SIF products suffer from relatively coarse spatial and temporal resolutions (Liu et al., 2024; Chen et al., 2022a). A recent study demonstrated that TROPOMI (Tropospheric Monitoring Instrument) SIF data, characterized by high spatial and temporal resolutions, exhibit a linear relationship with GPP and contain robust signals for Vc,max25 (Chen et al., 2022a). Consequently, TROPOMI SIF has been employed extensively for modeling photosynthesis across various ecosystems (Yang et al., 2023).
TEFs account for 40 %–50 % of the carbon sinks in global forest ecosystems, playing a vital role in the global carbon cycle (Yang et al., 2023; Lu et al., 2021). Despite TEFs maintaining a perennial canopy cover, they exhibit pronounced seasonal variability in photosynthetic activity (Wu et al., 2016). This seasonality is primarily attributed to shifts in canopy leaf age structure (Chen et al., 2021; Chen et al., 2022a), which are predominantly driven by climatic seasonality (Li et al., 2021b; Yang et al., 2021). Recent studies have revealed that young leaves (≤ 180 d) generally exhibit higher Vc,max25 than old ones (> 180 d), thereby dominating the seasonal dynamics of leaf photosynthetic capacity in TEFs (Locke and Ort, 2014; Wu et al., 2016). Consequently, accurately mapping the seasonality of Vc,max25 in young leaves is essential for modeling tropical and subtropical photosynthesis at continental scales. However, current satellite-based approaches face challenges in distinguishing Vc,max25 across leaf age cohorts, which is primarily due to the complex interactions between climate drivers and leaf phenology (Jensen et al., 2015; Song et al., 2020). These limitations hinder the seasonal characterization of the Vc,max25 of young leaves. Additionally, Earth system models (ESMs) often struggle to capture the seasonal variations in Vc,max25 across different leaf age categories (Atkin et al., 2014; Ali et al., 2016). A key unresolved challenge remains the insufficient understanding of how seasonal changes in water and light availability regulate leaf emergence and shedding patterns.
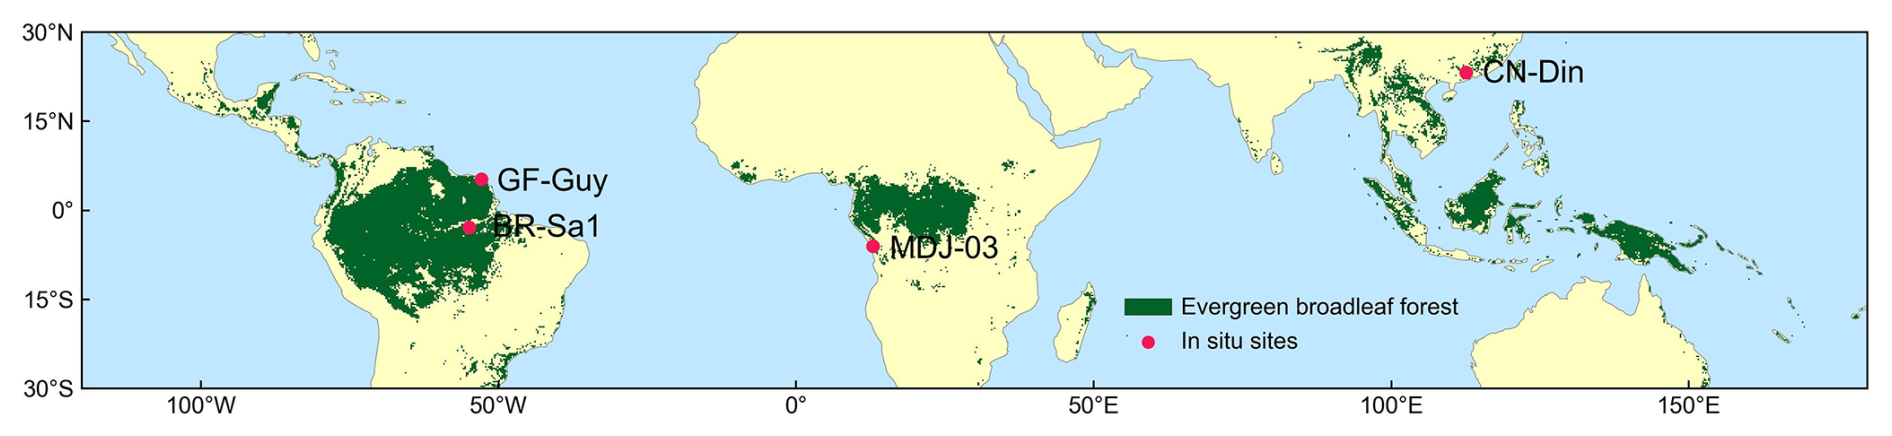
Figure 1Tropical and subtropical evergreen broadleaved forests (TEFs) and in situ observation sites. The TEFs are determined as those labeled as evergreen broadleaf forest (EBF) from the MODIS land cover maps at a 0.05° spatial resolution. The red dots are in situ observation sites of Vc,max25.
To address the aforementioned gaps in mapping the Vc,max25 of young leaves, we categorized the canopy foliage of TEFs into two distinct leaf age groups: young (≤ 180 d) and old (> 180 d) leaves. We then proposed a novel neighbor-based approach to estimate the maximum carboxylation rate (Vc,max25) for a young leaf cohort by assuming a constant for the older cohort (Yang et al., 2023). This assumption is supported by previous research indicating that Vc,max25 in old leaves exhibits minimal variation over time (Chen et al., 2019; Albert et al., 2018). This study aims to achieve three key objectives: (1) develop a global gridded dataset capturing the seasonal variability of Vc,max25 in young leaves across TEFs from 2001 to 2018, (2) validate the dataset against ground-based measurements and dissolved Vc,max25 data from GOSIF-derived GPP datasets, and (3) analyze the spatiotemporal patterns of Vc,max25 in young leaves across TEFs. The resulting Vc,max25 dataset enhances our understanding of tropical and subtropical phenology by quantifying the photosynthetic seasonality of young leaves. Furthermore, it provides valuable insights for refining tropical phenological models within ESMs.
2.1 Study area
The studied TEFs were identified by selecting pixels marked as EBF (evergreen broadleaf forest; Sulla-Menashe et al., 2018) on MODIS MCD12C1 land cover maps at 0.05° spatial resolution (see Fig. 1). TEFs in South America are the largest tropical rainforests in the world and are mainly located at 18° N–22° S and 40–90° W, followed by TEFs in tropical Africa (12° N–12° S, 2.5–37.5° E). TEFs in tropical Asia are mainly located in the Malay Archipelago, the Asian Peninsula, and northern Australia (30° N–14° S, 85–155° E).
Table 1Data sources for mapping the Vc,max25 of young leaves across tropical and subtropical evergreen broadleaved forests.
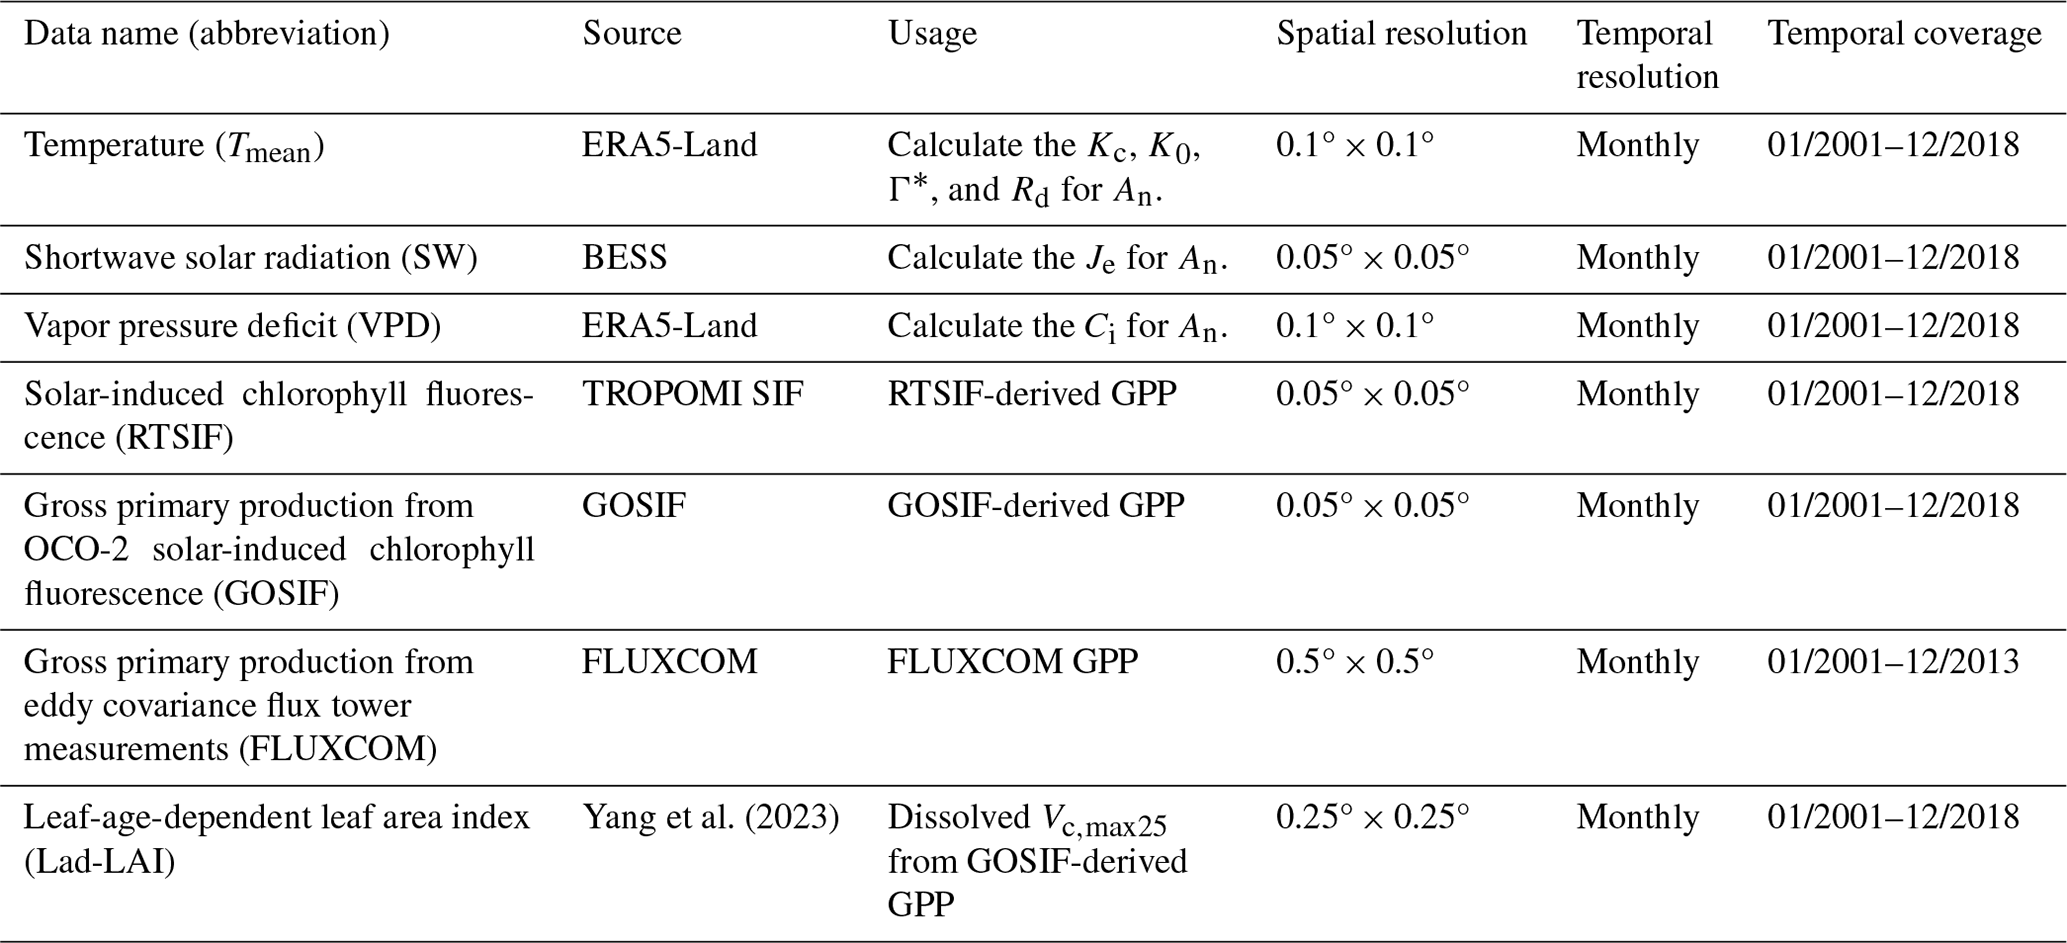
2.2 Data sources for mapping the Vc,max25 of young leaves
The continental-scale GPP (referred to as RTSIF-derived GPP) at a resolution of 0.125° and spanning the period from 2001 to 2018 was derived from TROPOMI SIF data according to the relationships between SIF and GPP delineated by Chen et al. (2021), which used a constant value of 15.343 to transform the SIF into the GPP (see Sect. 2.4.1). Monthly meteorological data, including the air temperature (Tmean) from the ERA5-Land dataset (Zhao et al., 2020), the vapor pressure deficit (VPD) from ERA5-Land (Yuan et al., 2019), and downward shortwave solar radiation (SW) provided by the Breathing Earth System Simulator (BESS; Ryu et al., 2018), were used to calculate the Michaelis–Menton constant for carboxylase (Kc), the Michaelis–Menton constant for oxygenase (K0), the CO2 compensation point (Γ∗), dark respiration (Rd), and thus the An parameter according to the equations in Table S1 in the Supplement. All of the datasets were collected and harmonized to a spatial resolution of 0.125°. Further details regarding the satellite and input data are provided in Table 1.
2.3 Data for validating the Vc,max25 of young leaves
The Vc,max25 of young leaves and canopy-averaged leaves from in situ observations was collected to validate the Vc,max25 seasonality simulated from RTSIF-derived GPP using the proposed model (Table S2). Field measurements of monthly Vc,max25 for young leaves and canopy-averaged leaves were conducted at the Santarem Primary Forest Ecosystem Research Station (BR-Sa1) during August and December 2012 (Albert et al., 2018). Annual Vc,max25 observations for canopy-averaged leaves were acquired over a 12-month period from 2004 to 2016 at the Guyaflux Forest Ecosystem Research Station (GF-Guy) (Wang et al., 2022), from 2003 to 2009 at the Dinghushan Forest Ecosystem Research Station (CN-Din) (https://fluxnet.org/data/fluxnet2015-dataset/, last access: 1 July 2025), and in November 2012 at the Mbam–Djerem National Park 3 (MDJ-03) (Ferreira Domingues et al., 2015). The Vc,max25 of young leaves and canopy-averaged leaves for the BR-Sa1 site was obtained directly from the literature, whereas for the three remaining sites only the existing literature was available, which reported only the Vc,max25 of canopy-averaged leaves. To evaluate the simulated Vc,max25 of young leaves, the dissolved method (see Sect. 2.5.1) was used to derive the true values of Vc,max25 for young leaves, based on a monthly leaf-age-dependent leaf area index (Lad-LAI) product (Yang et al., 2023). Furthermore, gross primary production retrieved from Orbiting Carbon Observatory-2 (OCO-2) solar-induced chlorophyll fluorescence data (referred to as GOSIF-derived GPP) at a spatial resolution of 0.05° for the period 2001–2018 and gross primary production data retrieved from eddy covariance flux tower measurements (referred to as FLUXCOM GPP) at a spatial resolution of 0.5° for the period 2001–2013 were used to evaluate the uncertainty of the proposed model in simulating the monthly gridded Vc,max25 of young leaves (Table 1).
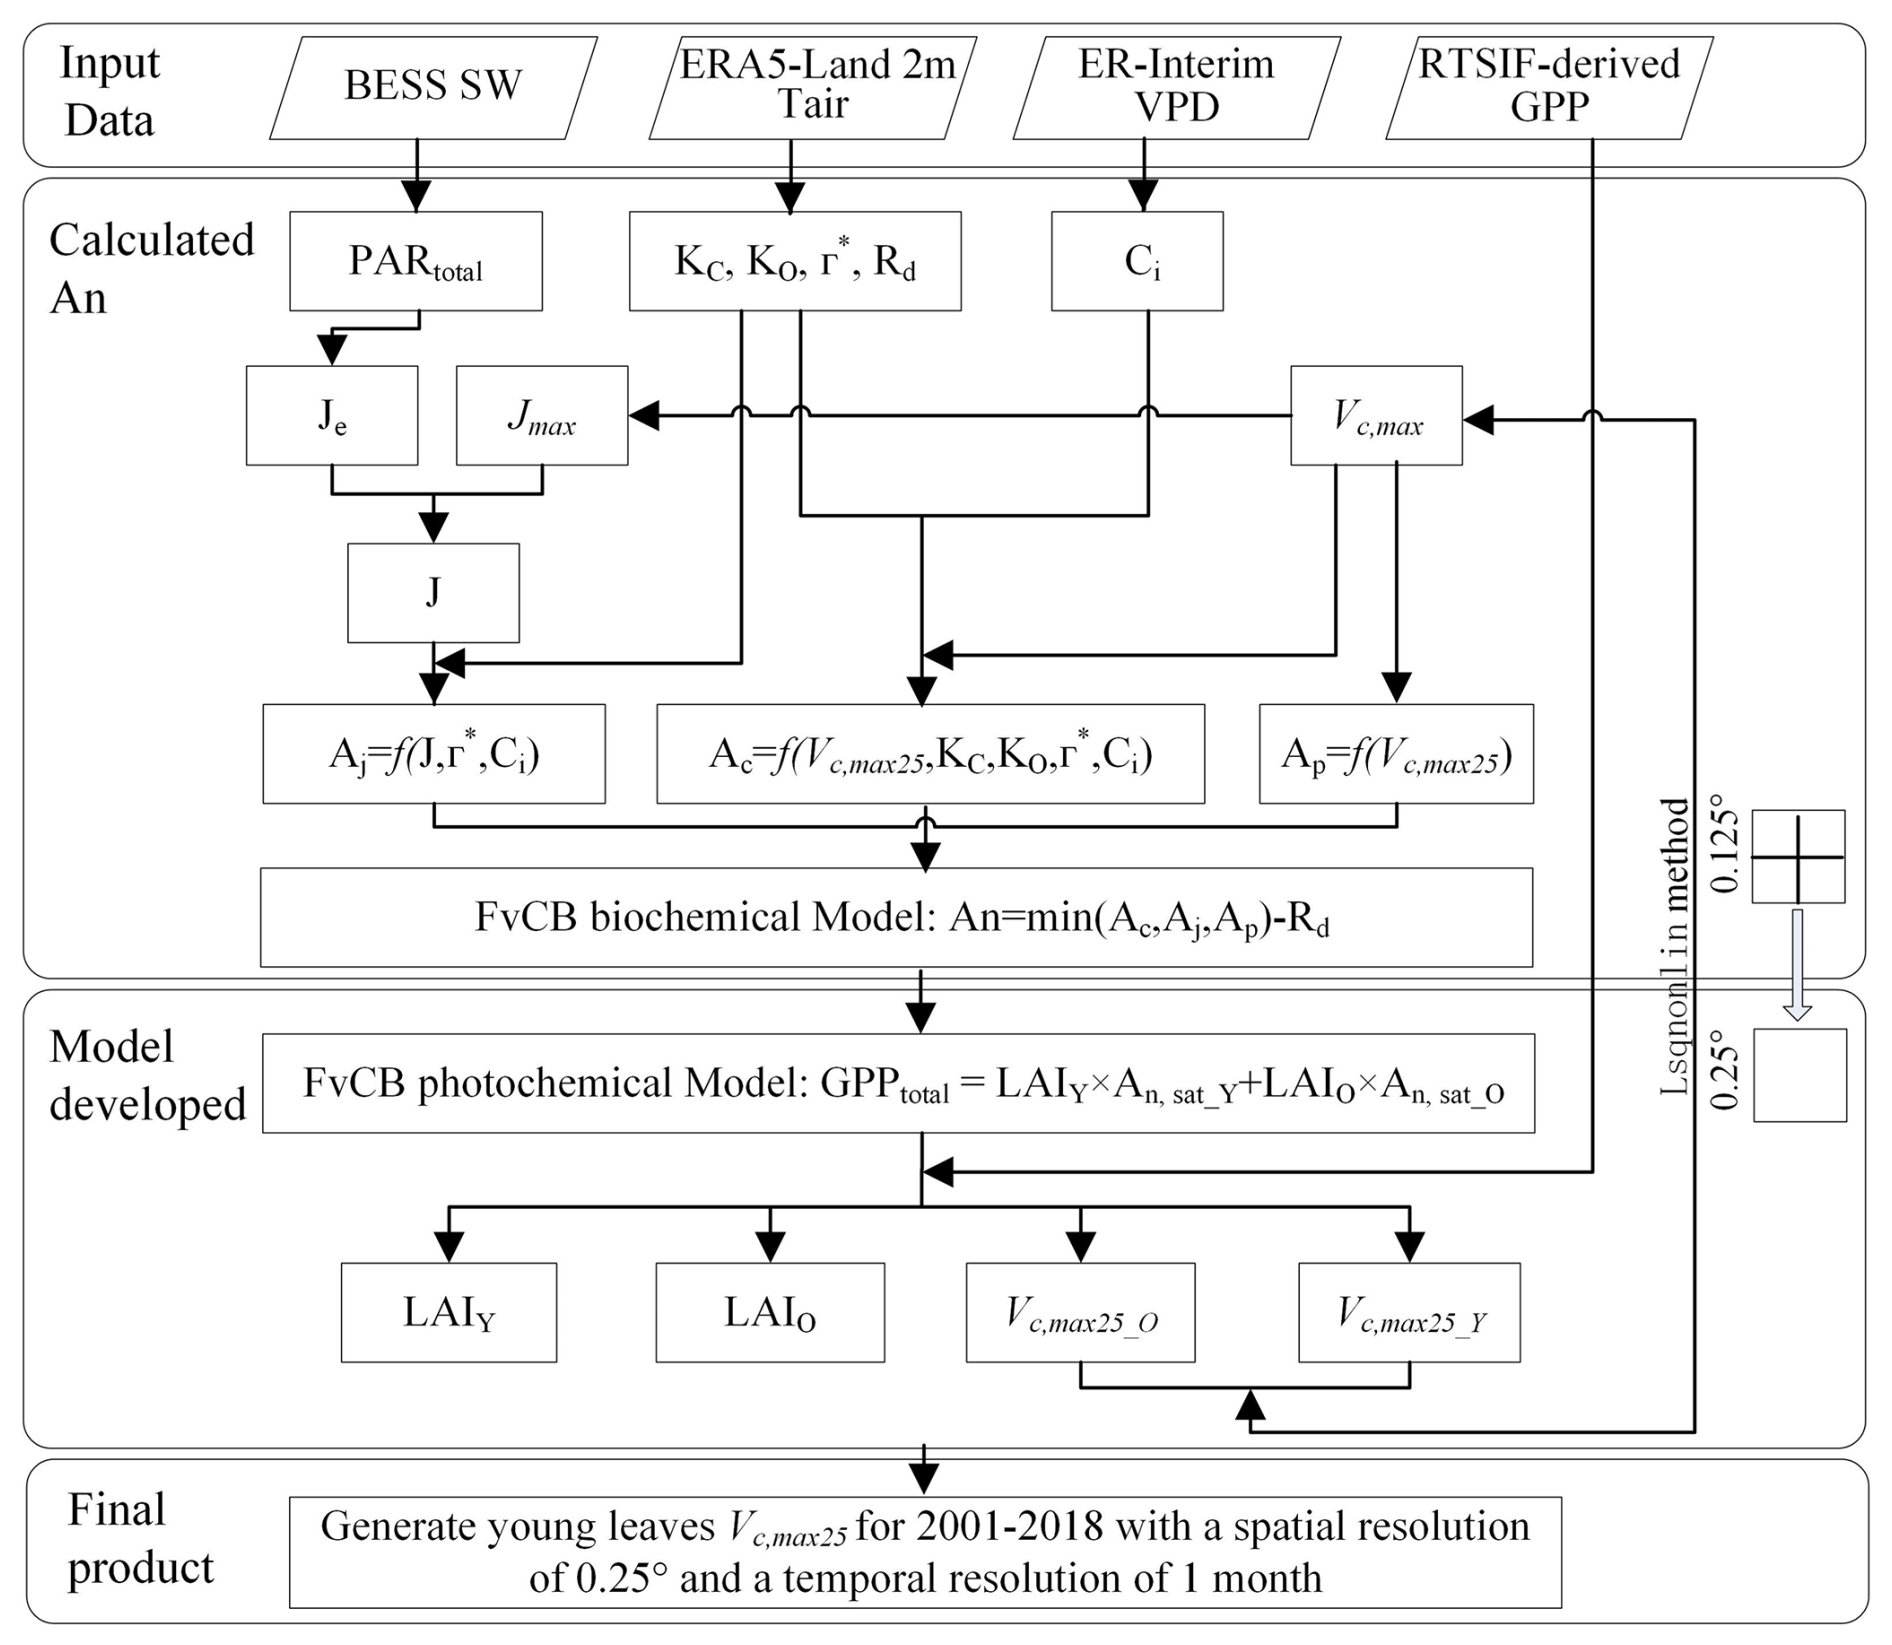
Figure 2Procedures for mapping the Vc,max25 of young leaves using a neighbor-based approach.
2.4 Methods for simulating the Vc,max25 of young leaves
Figure 2 shows the practical procedures applied to produce the seasonal dynamic product of the Vc,max25 of young leaves. The leaf demographic-identical (LDO) hypothesis proposes that the leaf cohorts can be classified into three categories on the basis of their growth, development, and lifespan: young leaf (less than 60 d), mature leaf (between 60 and 180 d), and old leaf (more than 180 d) (Wu et al., 2017b). To ensure comparability between the observations and simulations and to simplify the calculations, we categorized the leaf area index and the corresponding net CO2 assimilation rate (An) into two groups based on leaf age: those with a leaf age of more than 180 d were considered “old”, and those with a leaf age of less than 180 d were considered “young” (Chen et al., 2020). Since the total GPP of the leaf cohorts remained constant and the leaf cohorts were composed of leaves of different ages, we calculated the total GPP as the sum of the GPPs of each leaf age cohort. The total GPP was simulated using the FvCB photochemical model by combining the LAI groups (young leaf LAIY and old leaf LAIO; Eq. 1) and the corresponding net assimilation rates of CO2 (young leaf An,sat_Y and old leaf An,sat_O; Eq. 1) (Farquhar et al., 1980):
where LAIY represents the LAI of young leaves (≤ 180 d) and LAIO represents the LAI of old leaves (> 180 d). An,sat_Y and An,sat_O represent the net CO2 assimilation rates of young and old leaves, respectively. The sum of LAIY and LAIO was set as the total canopy LAI. GPPtotal refers to the total gross primary production of the canopy.
The gridded GPP data over all of the TEFs were derived from SIF (denoted as RTSIF-derived GPP) using a linear SIF–GPP regression model (see Sect. 2.4.1), which was established based on in situ GPP from 76 eddy covariance (EC) sites (Chen et al., 2022b). The majority of the TEFs retain leaves year-round, and their total LAI shows marginally small spatial and seasonal changes (Wu et al., 2016; Fig. S1). Therefore, previous modeling studies have assumed a constant value for the total LAI in TEFs (Cramer et al., 2001; Arora and Boer, 2005; De Weirdt et al., 2012). Based on this, we collected observed seasonal LAI dynamics in TEFs from the previously published literature, which showed a constant value of LAI at around 6.0 (Fig. S1; Table S3). Consequently, we streamlined the data to assume that the seasonal LAI was broadly equivalent to 6.0 in TEFs. This assumption was also found by Yang et al. (2023) to be reasonable in the region of the TEFs. The Vc,max25 values for old leaves were set to 20 µ mol m−2 s−1 according to previous ground-based observations (Chen et al., 2020; Zhou et al., 2015) in our method. The An,sat_O can be calculated according to the FvCB biochemical model (Farquhar et al., 1980; Bernacchi et al., 2003; see Sect. 2.4.2). An,sat_Y can be expressed as a function of Vc,max25 for young leaves (see Sect. 2.4.2). Consequently, only the LAIY and Vc,max25 of young leaves remain as the final parameters to be solved in Eq. (1).
The complexity of the model is evident due to the two parameters that needed to be solved. To overcome the challenge of the calculation, we assumed that the four adjacent pixel points had homogeneous PFTs and consistent leaf age cohorts. The LAI and Vc,max25 of young leaves were estimated using nonlinear least squares and constraints on the basis of the GPP values with the 4 neighboring pixels according to Eq. (1). The optimal Vc,max25 was determined by minimizing the residual while satisfying the positivity constraint (i.e., Vc,max25 > 0). The input gridded dataset consisted of the GPP obtained from the RTSIF and climatic data such as Tmean, VPD, and SW. The spatial resolution of these data was homogeneously resampled to 0.125°, resulting in a spatial resolution of 0.25° for the map of the output Vc,max25 of young leaves. To further validate the robustness and reliability of our neighborhood pixel method, we conducted a sensitivity analysis by systematically varying the number of neighborhood pixels, ultimately generating the Vc,max25 product with 0.5° spatial resolution. In the optimization process, a mean Vc,max25 value was determined by assuming that the leaf cohort was completely young. A reasonable adjustment for the Vc,max25 of the young leaf value was then determined based on the previously published literature (Chen et al., 2021; Yang et al., 2023) and the initial value. Importantly, the difference between the finely optimized Vc,max25 of young leaves and the initial value could often be significant and outside the margin of error. Therefore, an appropriate adjustment for the Vc,max25 of the young leaf value needs to be determined carefully (He et al., 2019). All of the analyses were performed using MATLAB (R2 version).
2.4.1 Calculating the GPP (RTSIF-derived GPP) from TROPOMI SIF
SIF is a widely used proxy for canopy photosynthesis (Yang et al., 2015; Dechant et al., 2020). Here, we used a long-term reconstructed TROPOMI SIF dataset (RTSIF; Chen et al., 2022b) to estimate GPP seasonality. Previous analyses showed that RTSIF was strongly linearly correlated with EC GPP and used 15.343 as a transformation coefficient to convert RTSIF into GPP (Chen et al., 2022b). We collected seasonal GPP data observed at four EC sites from the FLUXNET2015 tier-1 dataset (Table S4; Pastorello et al., 2020) and validated the Chen et al. (2022b) simple SIF–GPP relationship (Fig. S2). The results confirmed the robustness of the Chen et al. (2022b) simple SIF–GPP relationship for estimating the GPP seasonality in TEFs (R > 0.49). Despite the potential overestimation (Fig. S2a) or underestimation (Fig. S2d) of the magnitudes, the RTSIF-derived GPP mostly captured the seasonality of the EC GPP at all four sites (dphase < 0.29).
2.4.2 Calculating the net CO2 assimilation rate
The net CO2 assimilation rate is a significant parameter characterizing the photosynthetic rate. According to the FvCB biochemical model, the net CO2 assimilation rate (An) depends on the most limiting conditions for photosynthesis (RuBisCO saturation Ac, RuBP saturation Aj, or TPU saturation Ap) and the intensity of dark respiration (Rd) (Bernacchi et al., 2013). The net CO2 assimilation rate (either An,sat_Y or An,sat_O) can be expressed by the following equation:
(1) Calculation of Ac
When the CO2 pressure is low (Ci < 300 µmol mol−1), the net photosynthesis rate is mainly constrained by the activity and quantity of the carboxylase RuBisCO. The RuBisCO-limited photosynthetic rate Ac can be calculated using the following equation at a limited carboxylation rate:
where Γ∗ represents the CO2 compensation point and Ci is the intercellular CO2 pressure. Kc, K0, O, and Γ∗ are estimated based on the leaf temperature using Eq. (4) to calculate their values at the given temperature, which is used for conversion from their values at 25°:
where P is the parameter at each temperature that varies with temperature, including the Michaelis constant for O2 (K0), the Michaelis constant for CO2 (K0), the intercellular concentration (O), and the CO2 compensation point (Γ∗). P25 denotes the constant temperature dependence parameter at 25 °C (Bernacchi et al., 2001); specifically, Kc, K0, Γ∗, and O at 25 °C are equal to 404.9 µmol mol−1, 278.4 mmol mol−1, 42.75 µmol mol−1, and 210 mmol mol−1, respectively. ΔHp is the activation energy and varies with the temperature and parameters. r is the standard gas constant (8.314 ). Tk is the leaf temperature (K).
Using the stomatal conductance model, the internal CO2 concentration (Ci, Eq. 5) was estimated to depend on the atmospheric CO2 concentration instead of the ambient relative moisture (Xu et al., 2017; Lin et al., 2015; Medlyn et al., 2011):
where Ci represents the internal CO2 concentration.
(2) Calculation of Aj
When the concentration of CO2 is high, leaf photosynthesis is constrained by RuBP regeneration. The photosynthetic rate (Aj) is then limited by electron transport and calculated using the following equation:
where J is the electron transport rate for leaf photosynthesis. It is a quadratic function of the full electron transfer rate (Je) and the maximum electron transfer rate (Jmax) (Luo et al., 2001; Bernacchi et al., 2013). The maximum electron transport rate (Jmax), the maximum carboxylation rate (Vc,max25), and the CO2 compensation point in the absence of mitochondrial respiration (Γ∗) were used to determine the Michaelis–Menten constants for oxygenation and carboxylase. For the detailed calculation process, please refer to Eqs. (7–(9):
where Jmax denotes the maximum electron transfer rate at a given temperature and varies with temperature. Jmax,25 is the maximum electron transfer rate at 25°C and is usually 1.67 × Vc,max25 in TEFs. Topt is the optimum temperature for electron transfer. Je is a function of canopy photosynthetically active radiation (PARtotal) and can be calculated by inputting SW and LAI. For details, please refer to Weiss and Norman (1985) and Ryu et al. (2018). θ, ∂, φ, and Φ are constants and equal to 0.7, 0.85, 0.5, and 0.85, respectively (Xu et al., 2017; Yang et al., 2023). κ is a function of the optimal temperature, which represents the maximum quantum efficiency of Photosystem II (PSII) photochemistry.
(3) Calculation of Ap
The rate of photosynthesis is limited by the export of triose phosphate. Ap represents the photosynthetic capacity to export or utilize the photosynthetic products for the different LAI cohorts, as determined by multiple field observations:
The ratio of the interior foliar CO2 concentration to the environmental CO2 concentration was fixed at 0.5 for C3 species and 0.7 for C4 species based on previous investigations (Fabre et al., 2019; Mcclain and Sharkey, 2019; Yang et al., 2016).
2.5 Methods for evaluating the simulated Vc,max25 of young leaves
This study assessed the proposed algorithms in three ways: (1) monthly in situ Vc,max25 observations obtained from the literature, (2) annually dissolved Vc,max25 from the GOSIF-derived GPP, and (3) a monthly Lad-LAI product covering the entire TEF region, derived from the RTSIF product of Yang et al. (2023). However, in situ Vc,max25 observations of young leaves remain scarce, with only one site (BR-Sa1; see Sect. 2.3) providing monthly Vc,max25 data. To compensate for the lack of ground-based validation, a seasonal Vc,max25 of canopy-averaged leaves was collected from three additional sites (GF-Guy, MDJ-03, and CN-Din), and the Vc,max25 of young leaves at these sites was estimated using the dissolved method (see Sect. 2.5.1) based on the Lad-LAI product (Yang et al., 2023). To evaluate the efficiency and reliability of the newly proposed methodology, we compared the gridded Vc,max25 of young leaves simulated from RTSIF-derived GPP using the proposed method with that estimated from GOSIF-derived GPP and the Lad-LAI product using the dissolved method. To investigate the reliability of the neighborhood-based subdivision technique, we conducted a comparative analysis for the Vc,max25 of young leaves derived from RTSIF-derived GPP using 2 × 2 (0.25° resolution) and 4 × 4 (0.5° resolution) neighboring pixels. To assess the uncertainties stemming from the estimation of gross primary production, we incorporated two additional GPP products, GOSIF-derived and FLUXCOM GPP (Jung et al., 2019; Yang et al., 2023), along with the original RTSIF-derived GPP, resulting in three distinct versions of the Vc,max25 of young leaf products.
2.5.1 Dissolved method for evaluating the Vc,max25 of young leaves
The total GPP can be expressed as the sum of the GPPs of the young and old cohorts. The GPP of each leaf age cohort is a function of the corresponding LAI cohort and the net CO2 assimilation rate. In accordance with related studies, the Vc,max25 of old leaves is presumed to be a constant value (Chen et al., 2020). When the LAI of different leaf ages is known, only the Vc,max25 of the young leaves remains unknown in Eq. (1). The value of the Vc,max25 of the young leaves can be determined by solving the aforementioned Eq. (1). This method involves dividing GPP into young and old cohorts according to leaf age, with the Vc,max25 of young leaves being solved directly using the Lad-LAI product, hence the term “dissolved method”. At present, there is a lack of available data on the ground Vc,max25 of different leaf ages. The dissolved method is employed to validate the reasonableness of the proposed algorithm.
2.5.2 K-means method for classification
We analyzed the spatial patterns of Vc,max25 across TEFs using the K-means clustering analysis. The K-means algorithm is an iterative algorithm that tries to partition the dataset into K predefined distinct non-overlapping subgroups (clusters) where each data point belongs to only one group (Ikotun et al., 2023). It tries to make the intra-cluster data points as similar as possible while also keeping the clusters as different as possible. It assigns data points to a cluster such that the sum of the squared distance between the data points and the cluster's centroid (the arithmetic mean of all data points that belong to that cluster) is at the minimum. Intra-cluster homogeneity increases as variation decreases, indicating greater similarity between the constituent data points. The way the K-means algorithm works is as follows:
-
Specify the number of clusters K.
-
Initialize centroids by first shuffling the dataset and then randomly selecting K data points for the centroids without replacement.
-
Iterate until convergence (i.e., cluster assignments remain unchanged between iterations).
-
Compute the sum of the squared distance between the data points and all centroids.
-
Assign each data point to the closest cluster (centroid).
-
Compute the centroids for the clusters by taking the average of all points that belong to each cluster.
2.5.3 Random forest regression
Random forest (RF) is a widely used ensemble learning method that constructs multiple decision trees through bootstrapped sampling of the training data and aggregates their predictions to enhance model robustness in regression tasks (Yang et al., 2022). This method is particularly effective in capturing nonlinear relationships and interactions among predictor variables, making it well-suited to complex ecological datasets. In this study, we employed RF regression to identify the dominant climatic drivers of tropical forest dynamics across the entire tropical region as well as within three major tropical forest regions. The model was trained using climate variables as predictors and Vc,max25 of young leaves as dependent variables. We utilized the feature importance scores derived from RF to rank the influence of three climatic variables on forest dynamics across different regions, providing insights into the spatial heterogeneity of climate–forest interactions.
2.5.4 Precision evaluation index
Both the root mean square error (RMSE, Eq. 11) and Pearson's correlation coefficient (R, Eq. 12) were employed to evaluate the model capabilities:
where N is the total number of points extracted from the Vc,max25 products simulated from RTSIF-derived GPP, Vi and Ui represent the monthly simulated and observed Vc,max25 in situ measurements, and and are the mean values of the simulated and observed Vc,max25 in situ measurements. Moreover, the continental Vc,max25 simulated from the proposed model was compared with that dissolved from the GOSIF-derived GPP and Lad-LAI in TEFs. SDS, SDm, and LCS represent the standard deviation of the simulation, the standard deviation of the measurement, and the lack of correlation weighted by the standard deviations (phase-related difference dphase), respectively.
2.6 Quality control (QC) for the young leaf Vc,max25 product
We provided information on data QC along with the Vc,max25 of a young leaf product (Fig. S3). In the QC system (Table S5), data quality was divided into four levels: Level 1 represents the highest quality; Level 2 and Level 3 represent good and acceptable quality, respectively; and Level 4 should be used with caution. This QC product was generated based on Pearson's R and the RMSE, which were obtained by comparing the seasonal Vc,max25 estimated from RTSIF-derived and GOSIF-derived GPP.
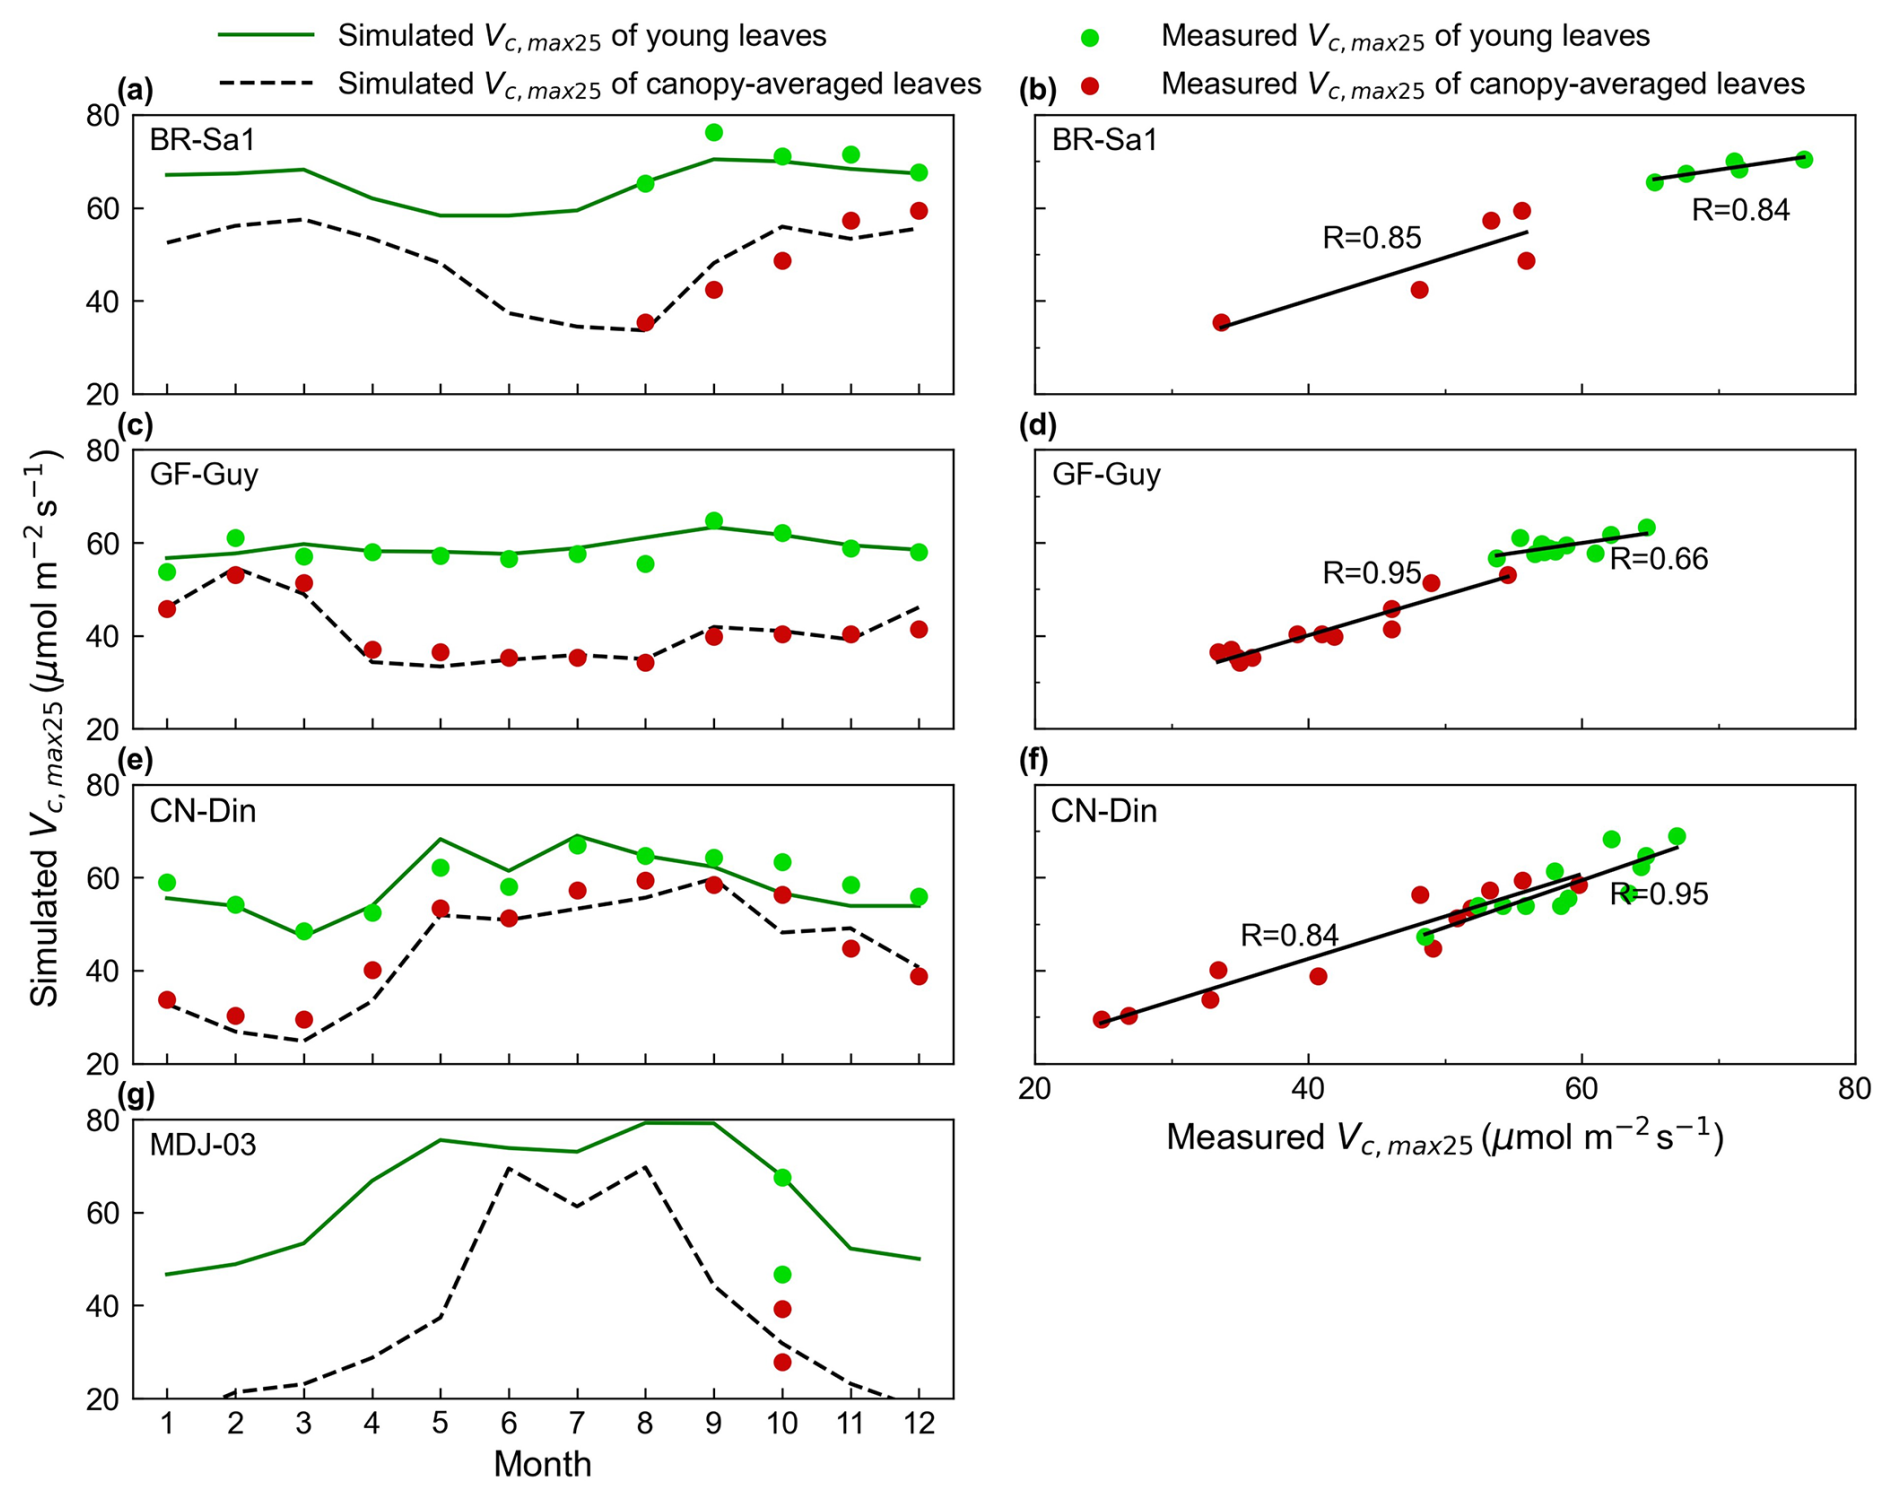
Figure 3Validations of simulated seasonal Vc,max25 for all canopy leaves and young leaves with in situ observations. The green lines and green dots are the seasonal Vc,max25 of young leaves simulated from RTSIF-derived GPP and in situ observations, respectively. The black dotted line and red dots are the Vc,max25 of canopy-averaged leaves from the simulations and in situ observations, respectively. Simulated Vc,max25 was denoted as the Vc,max25 of young leaves simulated from RTSIF-derived GPP using the new proposed method.
3.1 Validation of the gridded Vc,max25 seasonality of young leaves using in situ observations
The seasonality of the simulated mean Vc,max25 for both canopy leaves and young leaves was evaluated with in situ measurements at four sites: the CN-Din site in southern China (23.17° N, 112.54° E), the MDJ-03 site in Congo (5.98° S, 12.87° E), and the BR-Sa1 (2.86° S, 54.96° W) and GF-Guy (5.28° N, 52.93° W) sites in South America. Overall, the estimated mean Vc,max25 of canopy-averaged leaves (black line) ranged from 20 to 60 , and their seasonal fluctuations agreed well with the in situ mean Vc,max25 (red dots) (Fig. 3). In contrast, the Vc,max25 of young leaves (green line) exhibited higher values compared with that of canopy-averaged leaves, ranging from 40 to 80 . This finding is consistent with previous studies where young leaves were more photosynthetically effective than old leaves (Urban et al., 2008; Albert et al., 2018; Menezes et al., 2022). Specifically, our simulations can capture the seasonal patterns of Vc,max25 across different sites well. At the BR-Sa1 site, the estimates were correlated well with the observed mean Vc,max25 for all leaves (R = 0.85) and young leaves (R = 0.84), both of which increased during the dry season (between approximately June and December) (Fig. 3a and b). At the GF-Guy site, the in situ mean Vc,max25 of all canopy leaves showed considerable seasonality, while the Vc,max25 of young leaves remained more stable (Fig. 3c). Our estimations also performed well in simulating the Vc,max25 of all canopy leaves (R = 0.95) and that of young leaves (R = 0.66) (Fig. 3d). In contrast, at the CN-Din site in subtropical Asia, Vc,max25 for canopy-averaged leaves and young leaves increased during the wet season period, with the highest precipitation occurring in June or July (Fig. 3e). This is similar to the MDJ-03 site, where Vc,max25 for all canopy leaves and young leaves also increased during the wet season period but with larger seasonal variations. Our model showed the best simulations of Vc,max25 of young leaves at the CN-Din site (canopy-averaged leaves: R = 0.84; young leaves: R = 0.95). Nevertheless, many more long-term in situ measurements are needed to determine the reliability of these time series fluctuations.
Then, we analyzed the spatial patterns of Vc,max25 across TEFs using the K-means clustering analysis. Results showed that Vc,max25 for young leaf cohorts had evident seasonal dynamics, bringing influences on canopy photosynthesis. Figure S4 shows the time series fluctuations in Vc,max25 for the young leaves in 10 individual regions, as clustered using K-means analysis. Results show that the amplitude of Vc,max25 for young leaves is smaller in regions closer to the Equator and larger in regions farther away from the Equator.
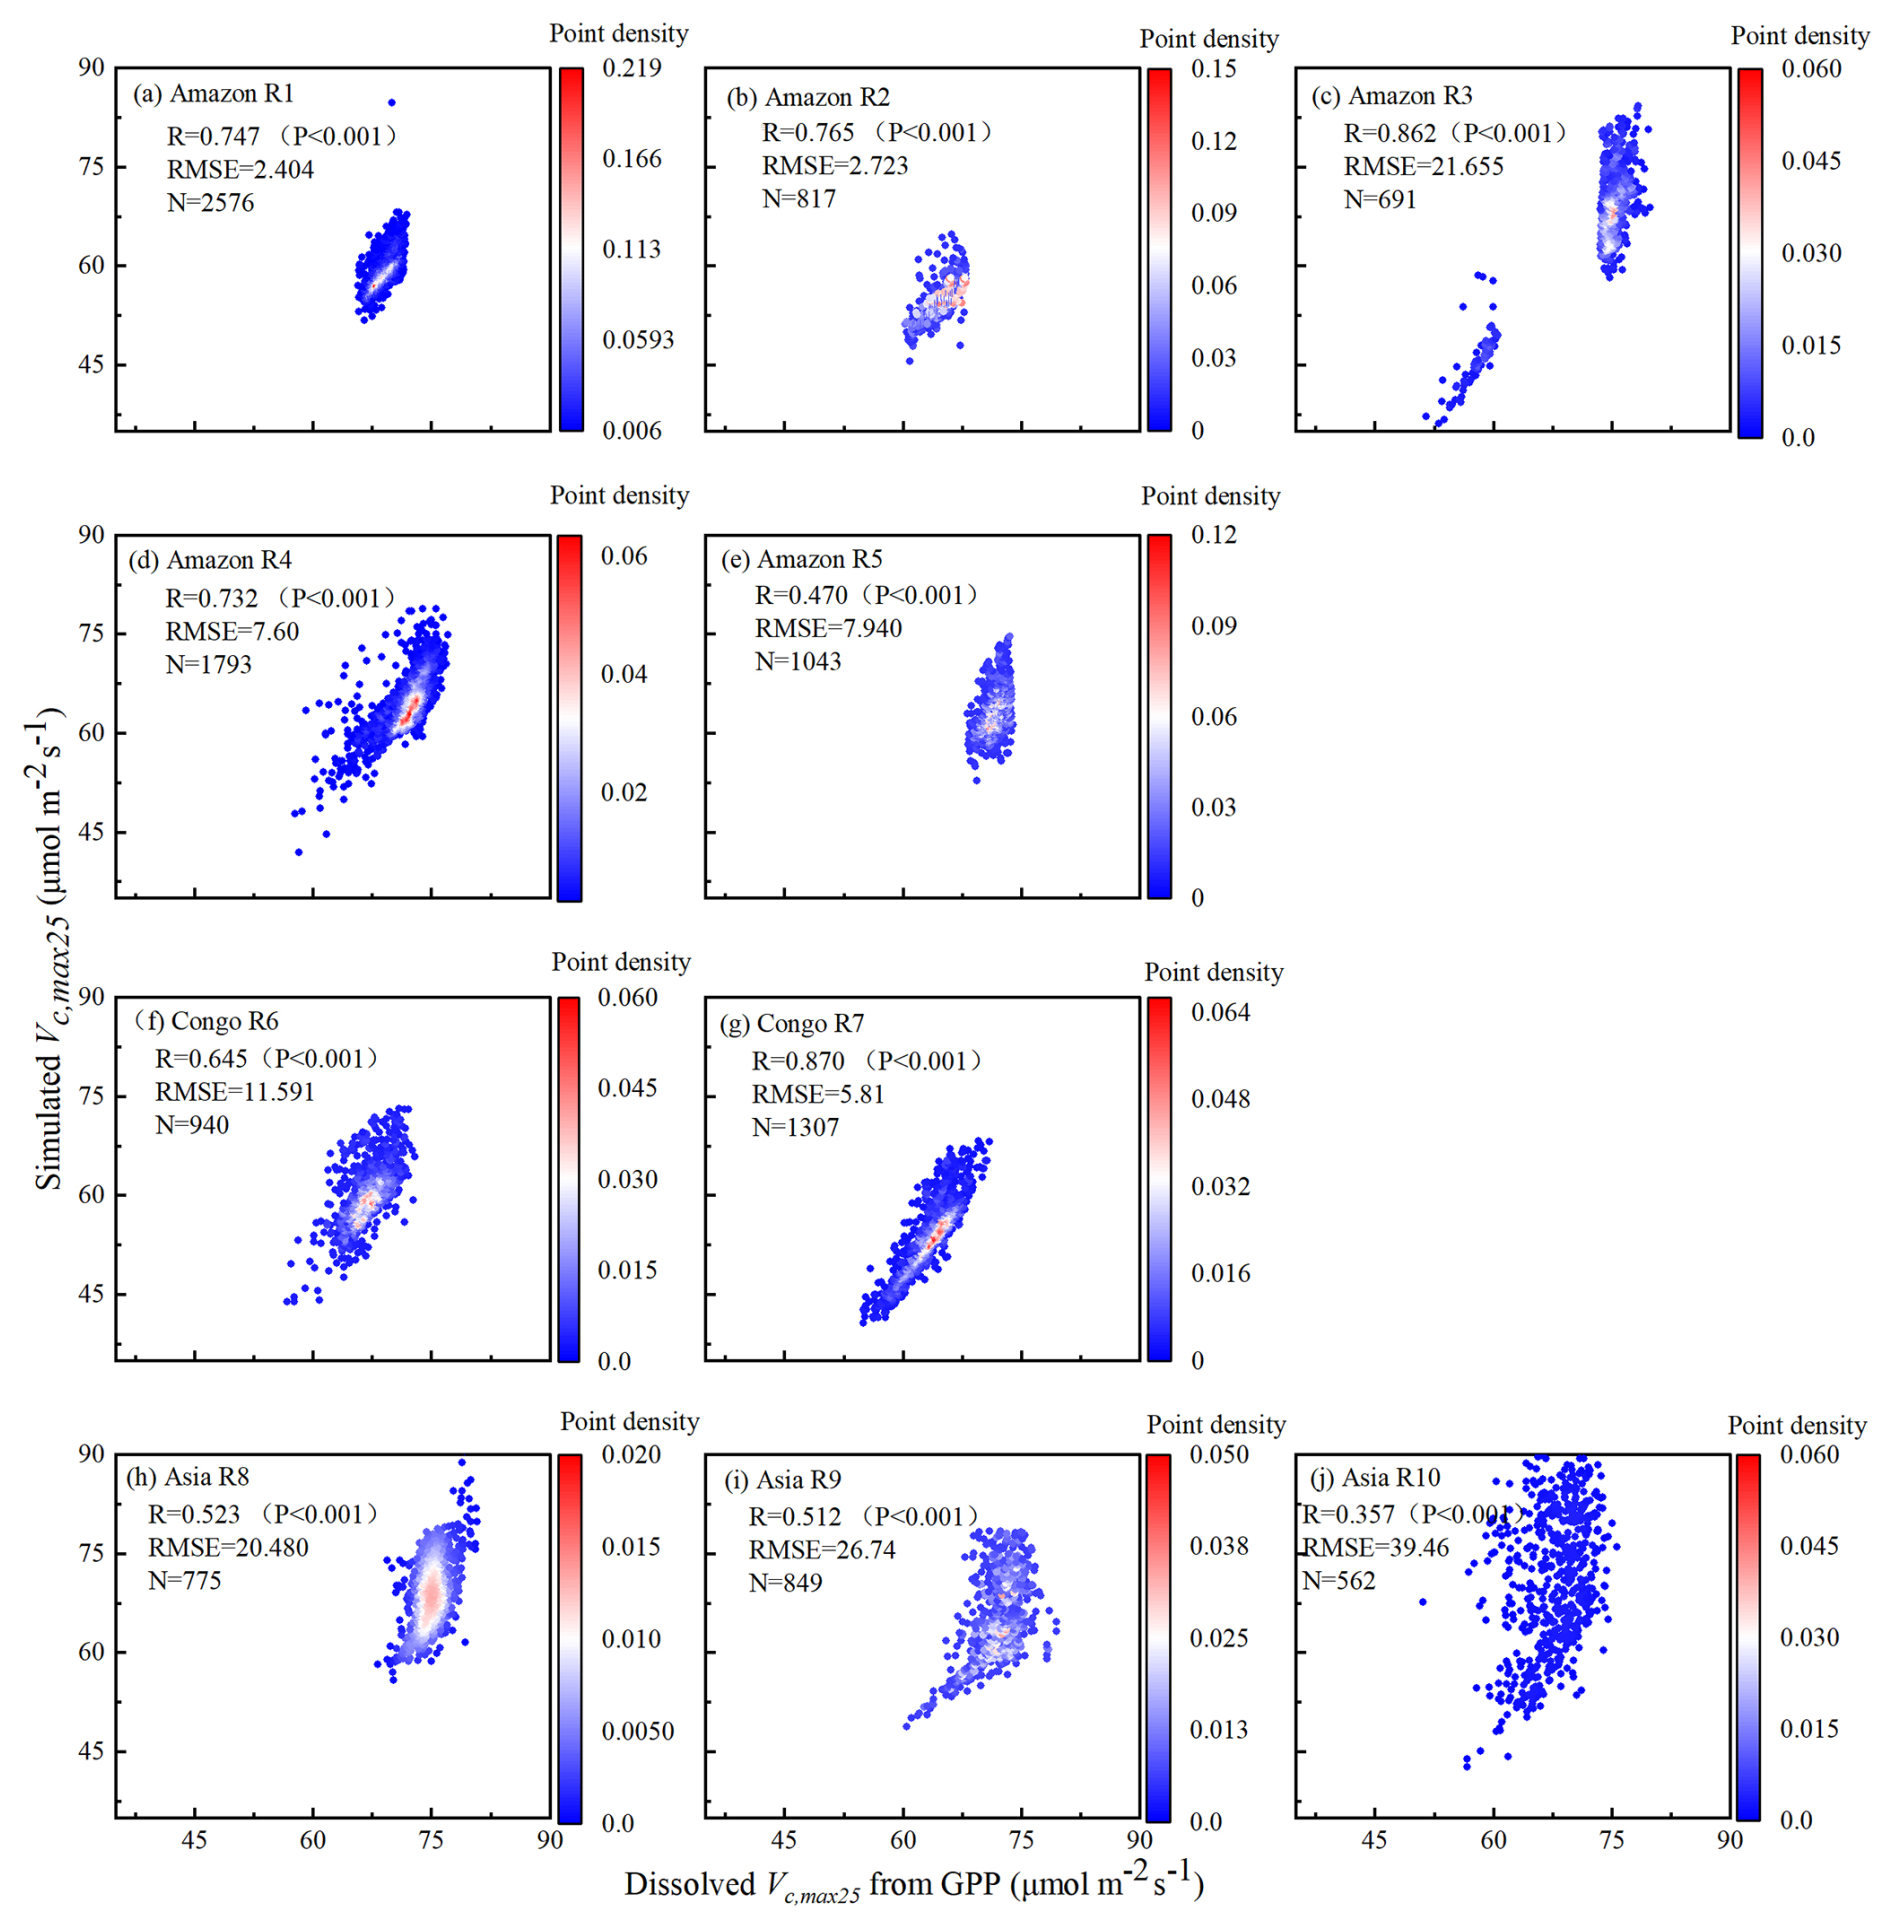
Figure 4Comparisons of the Vc,max25 of young leaves simulated from RTSIF-derived GPP against that dissolved from GOSIF-derived GPP.
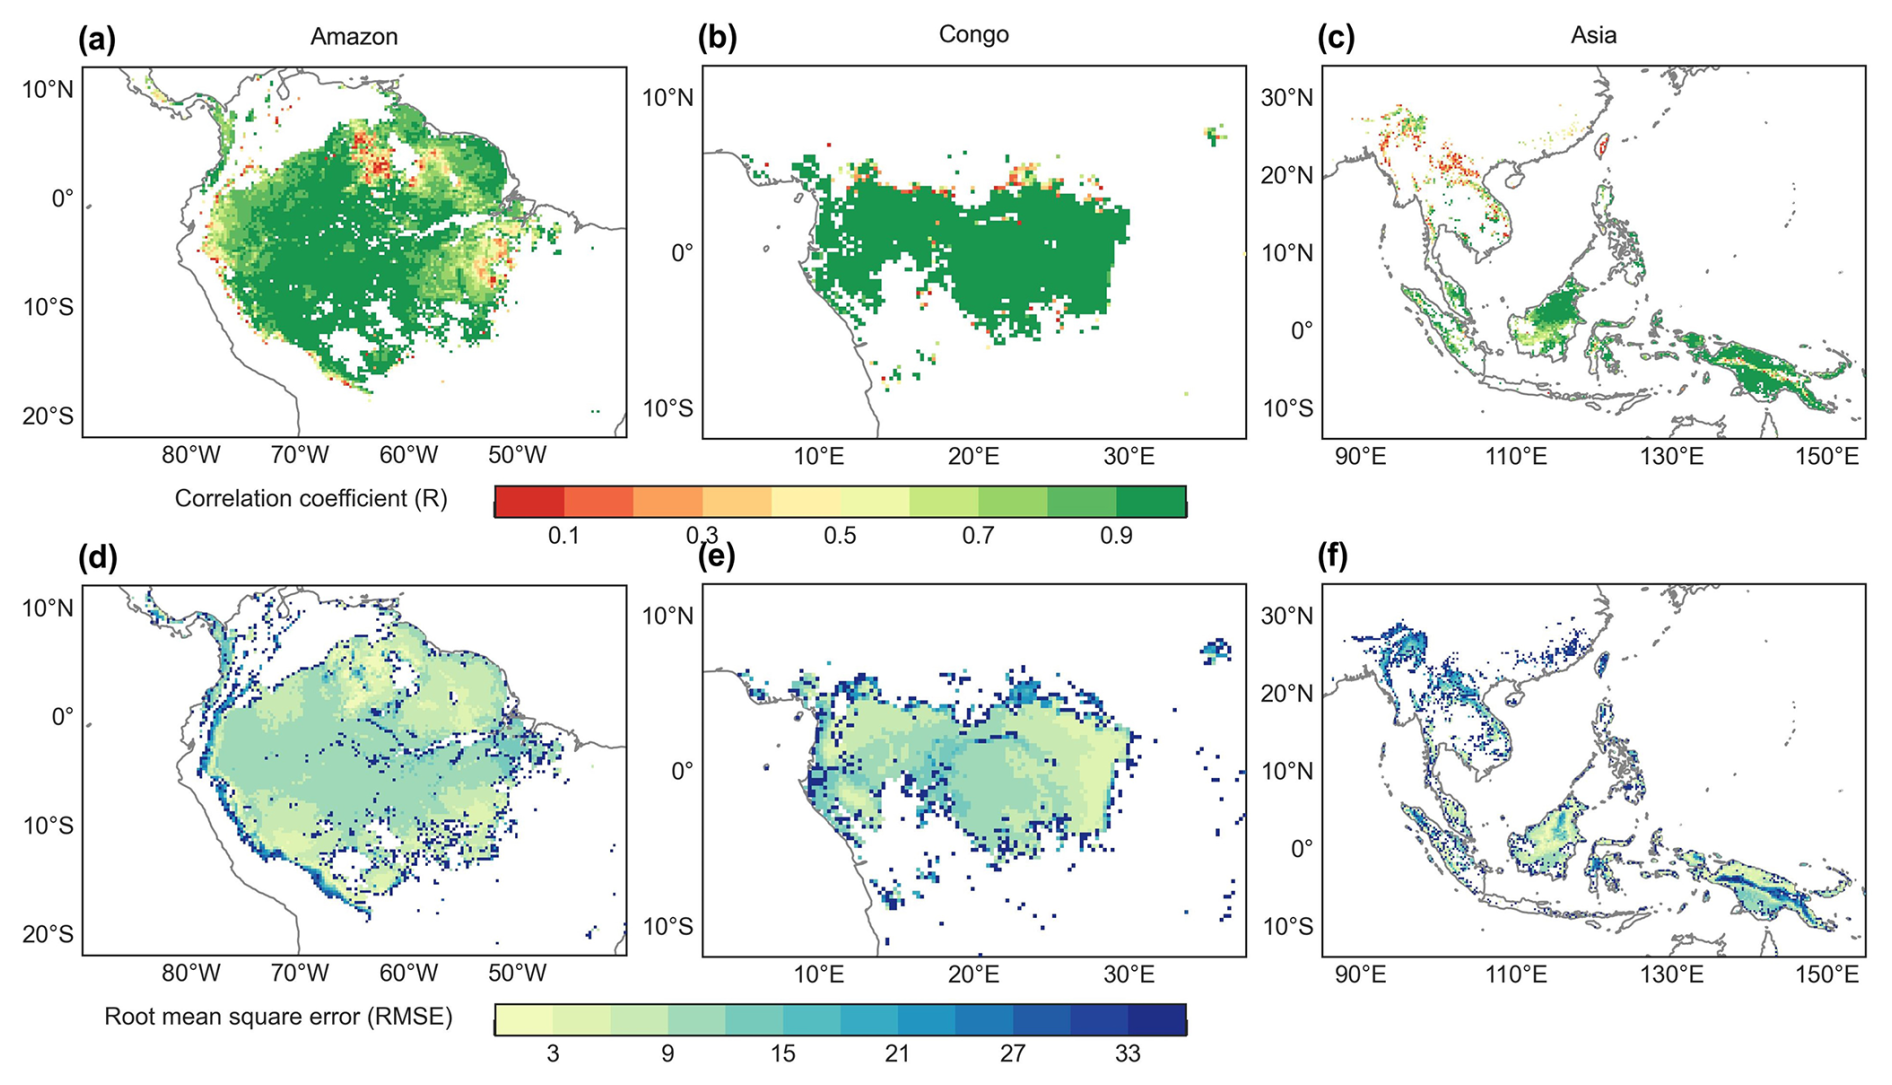
Figure 5The root mean square error (RMSE) and correlation coefficient (R) between the Vc,max25 of young leaves derived from RTSIF-derived GPP and that dissolved from GOSIF-derived GPP.
3.2 Validation of the Vc,max25 of young leaves simulated from RTSIF-derived GPP against that dissolved from GOSIF-derived GPP
The Vc,max25 of young leaves simulated from RTSIF-derived GPP demonstrated significant correlations (R ranges from 0.51 to 0.87) with those dissolved from GOSIF-derived GPP (Fig. 4). Across the Amazon, more than 69.78 % of the pixels have a high EBF fraction (> 90 %). The spatial clustering pattern aligns with the onset of the dry season (Tang and Dubayah, 2017), suggesting that the clustering analysis effectively differentiates between climate regions within the Amazon. The relatively homogeneous environmental conditions across these subregions create similar plant growth environments, leading to a more constrained range of Vc,max25 values and pronounced clustering effects in subregions A1–A5. Notably, subregion A3, located in the northwestern Amazon near coastal and mountainous areas, forms two distinct clustering zones. Statistical analysis revealed strong seasonal correlations between the Vc,max25 values of young leaves simulated from RTSIF-derived and GOSIF-derived GPP, with R > 0.80 occupying 91.68 % (Fig. 5a–c) and RMSE < 11.59 occupying 91.68 % (Fig. 5d–f) of the TEFs. The K-means spatial clustering analysis revealed strong agreement between the Vc,max25 of young leaves simulated by RTSIF-derived and GOSIF-derived GPP at the low latitudes (Amazon R1: R = 0.90; Amazon R2: R = 0.94; Amazon R4: R = 0.87; Amazon R5: R = 0.77; Congo R6: R = 0.91; Congo R7: R = 0.97; Asia R8: R = 0.86; Asia R9: R = 0.84; Fig. S5) compared to higher-latitude areas (Amazon R3: R = 0.60; Amazon R10: R = 0.50; Fig. S5). This latitudinal gradient was similarly reflected in RMSE values, with lower errors in equatorial regions (Amazon R1: RMSE = 1.78; Amazon R2: RMSE = 2.17; Amazon R4: RMSE = 4.67; Congo R6: RMSE = 3. 26; Congo R7: RMSE = 4.73; Asia R8: RMSE = 3.38; Asia R9: RMSE = 5.86; Fig. S6) than in higher-latitude zones (Amazon R5: RMSE = 14.85; Amazon R10: RMSE = 6.92; Fig. S6).
3.3 Comparison of the seasonal Vc,max25 of young leaves with the leaf age product
While field measurements have identified distinct seasonal patterns in the Vc,max25 of young leaves across TEFs, the sparse distribution of observation sites hinders comprehensive assessment of these variations. To address this issue, we conducted K-means clustering analysis of simulated Vc,max25 maps to evaluate their spatial coherence relative to the leaf age product developed by Yang et al. (2023).
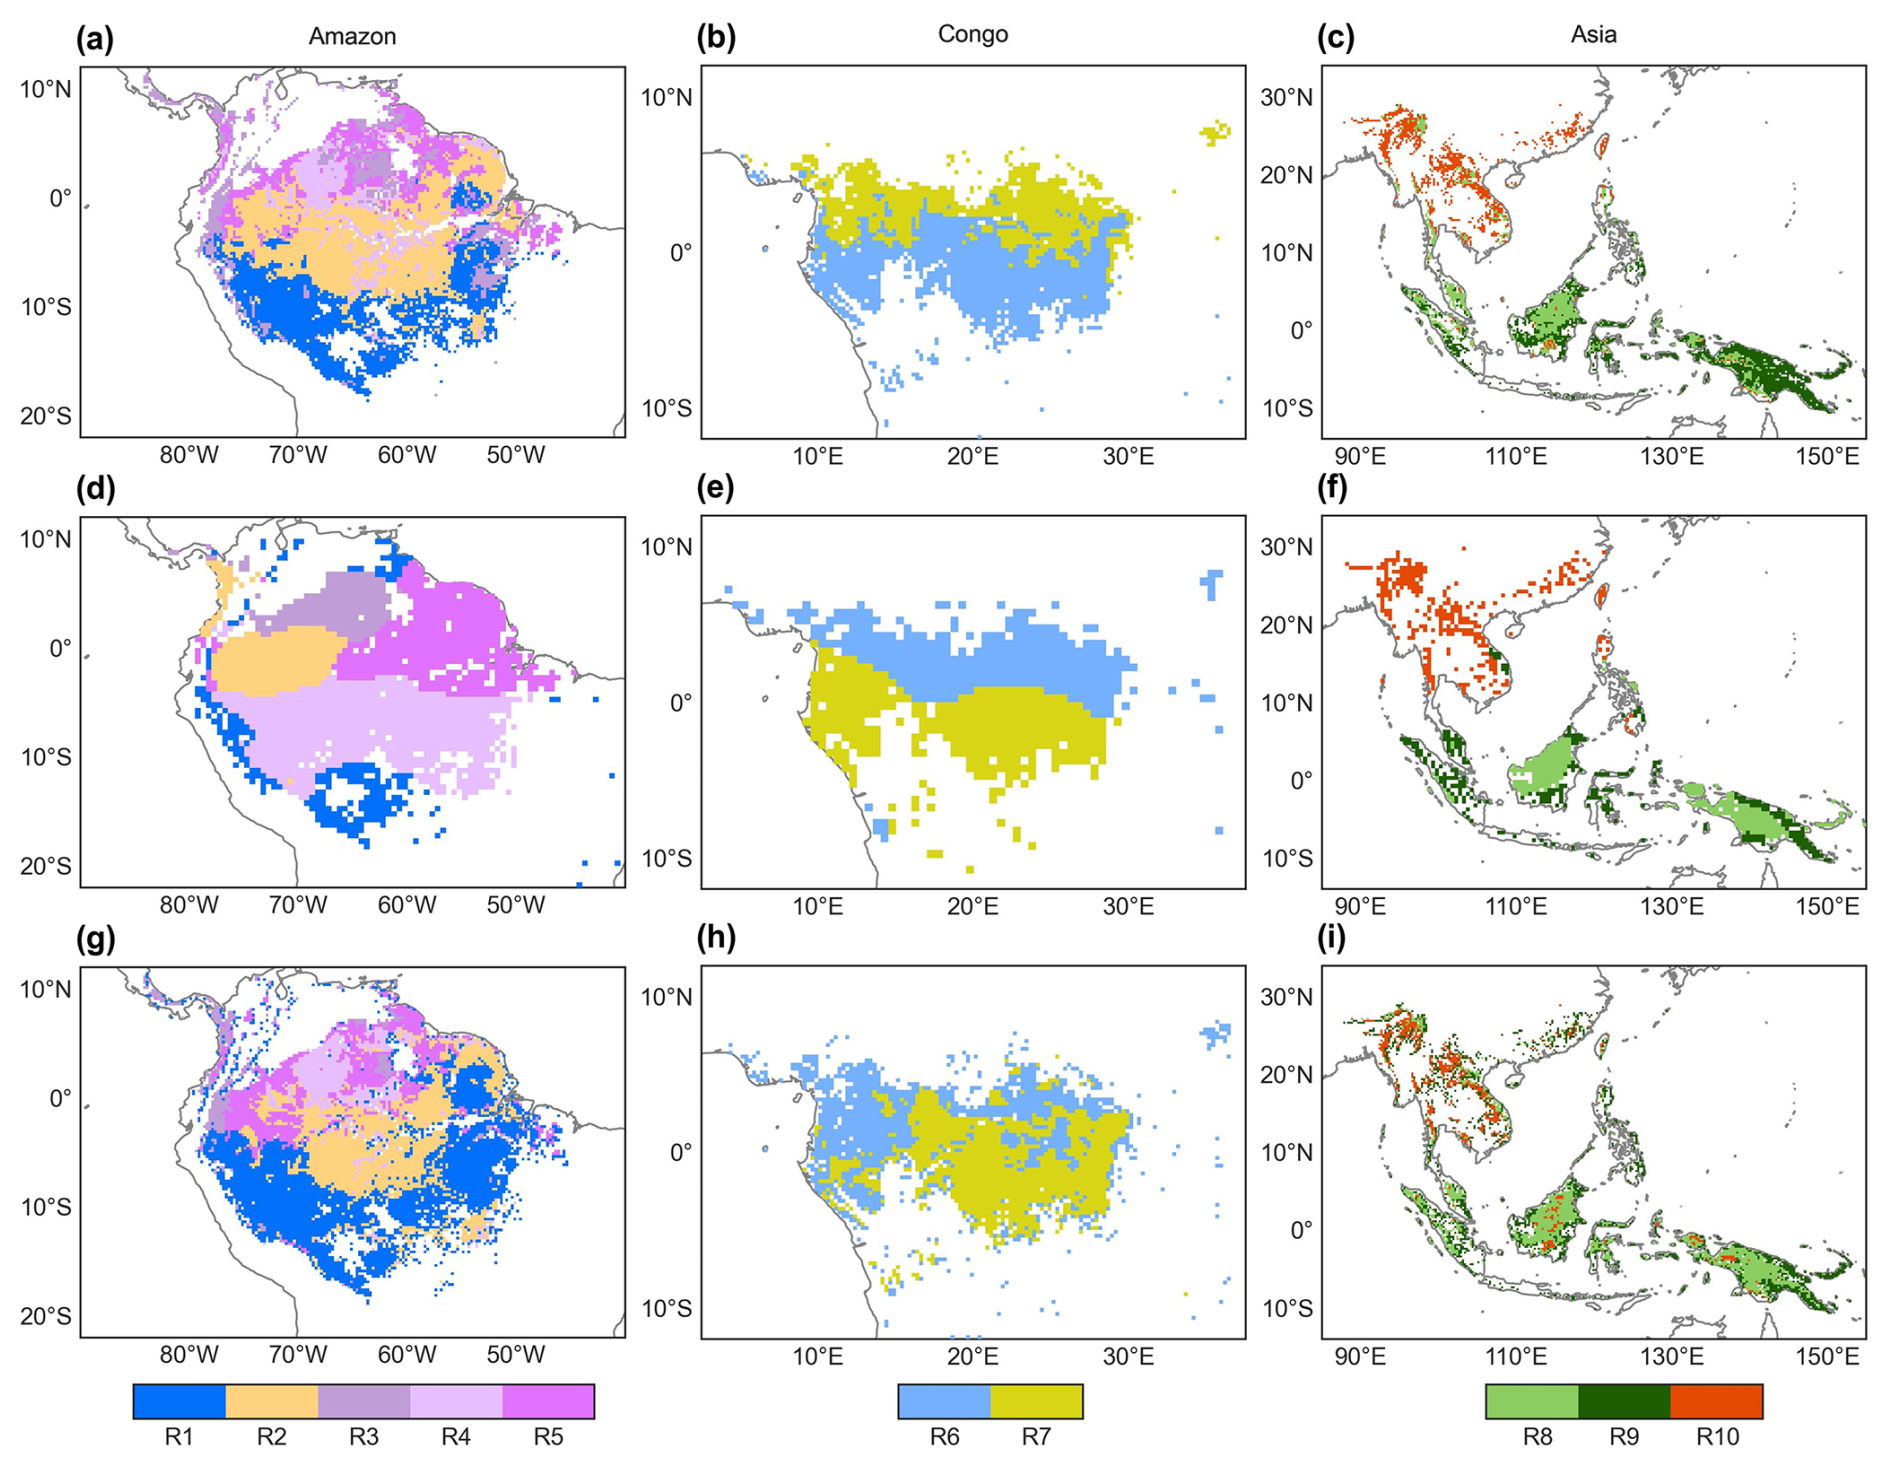
Figure 6Comparison of the subregions of the Vc,max25 of young leaves (a–c) with that of climatic factors classified by the K-means clustering analysis (d–f) of Chen et al. (2021) and that of the leaf-age-dependent leaf area index product (Lad-LAI) (g–i) developed by Yang et al. (2023).
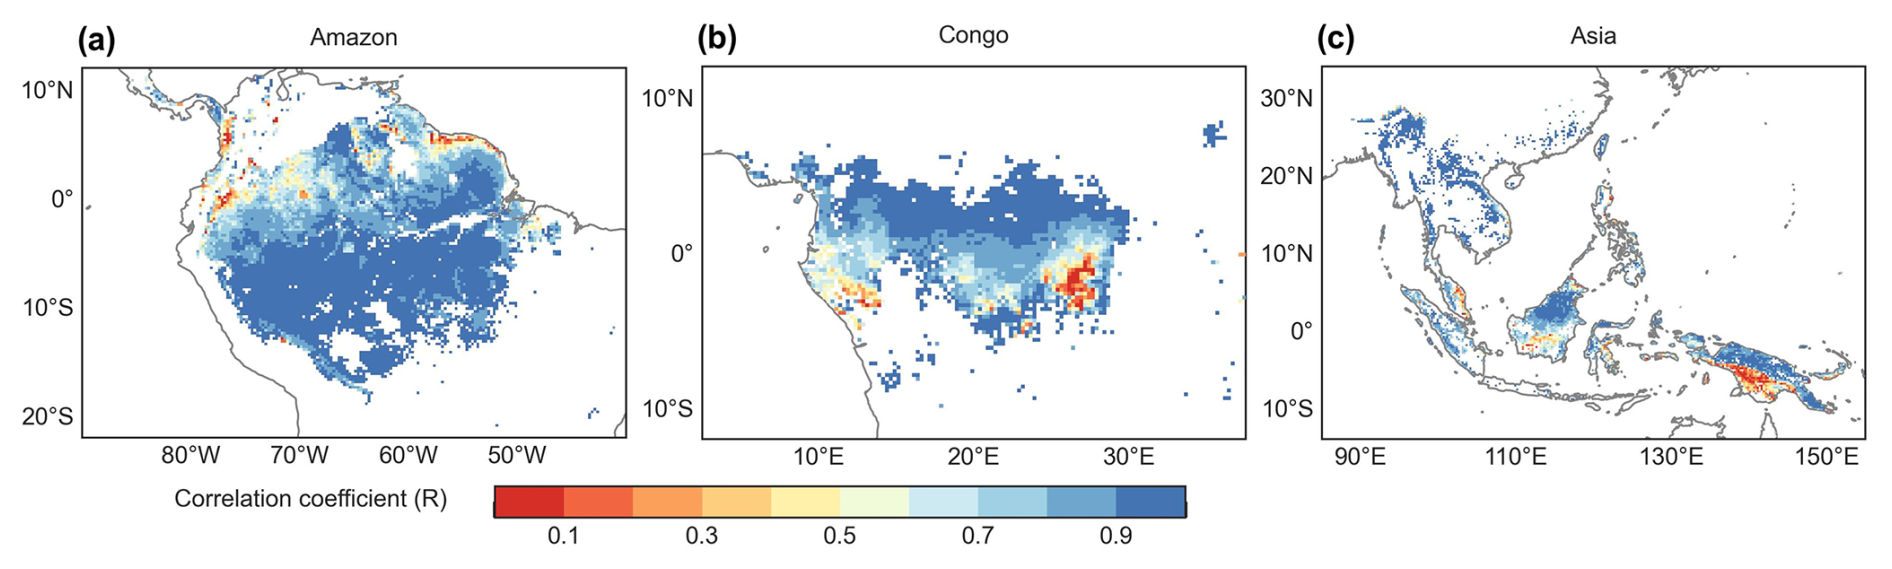
Figure 7Spatial maps of R between the monthly simulated Vc,max25 and the Lad-LAI developed by Yang et al. (2023).
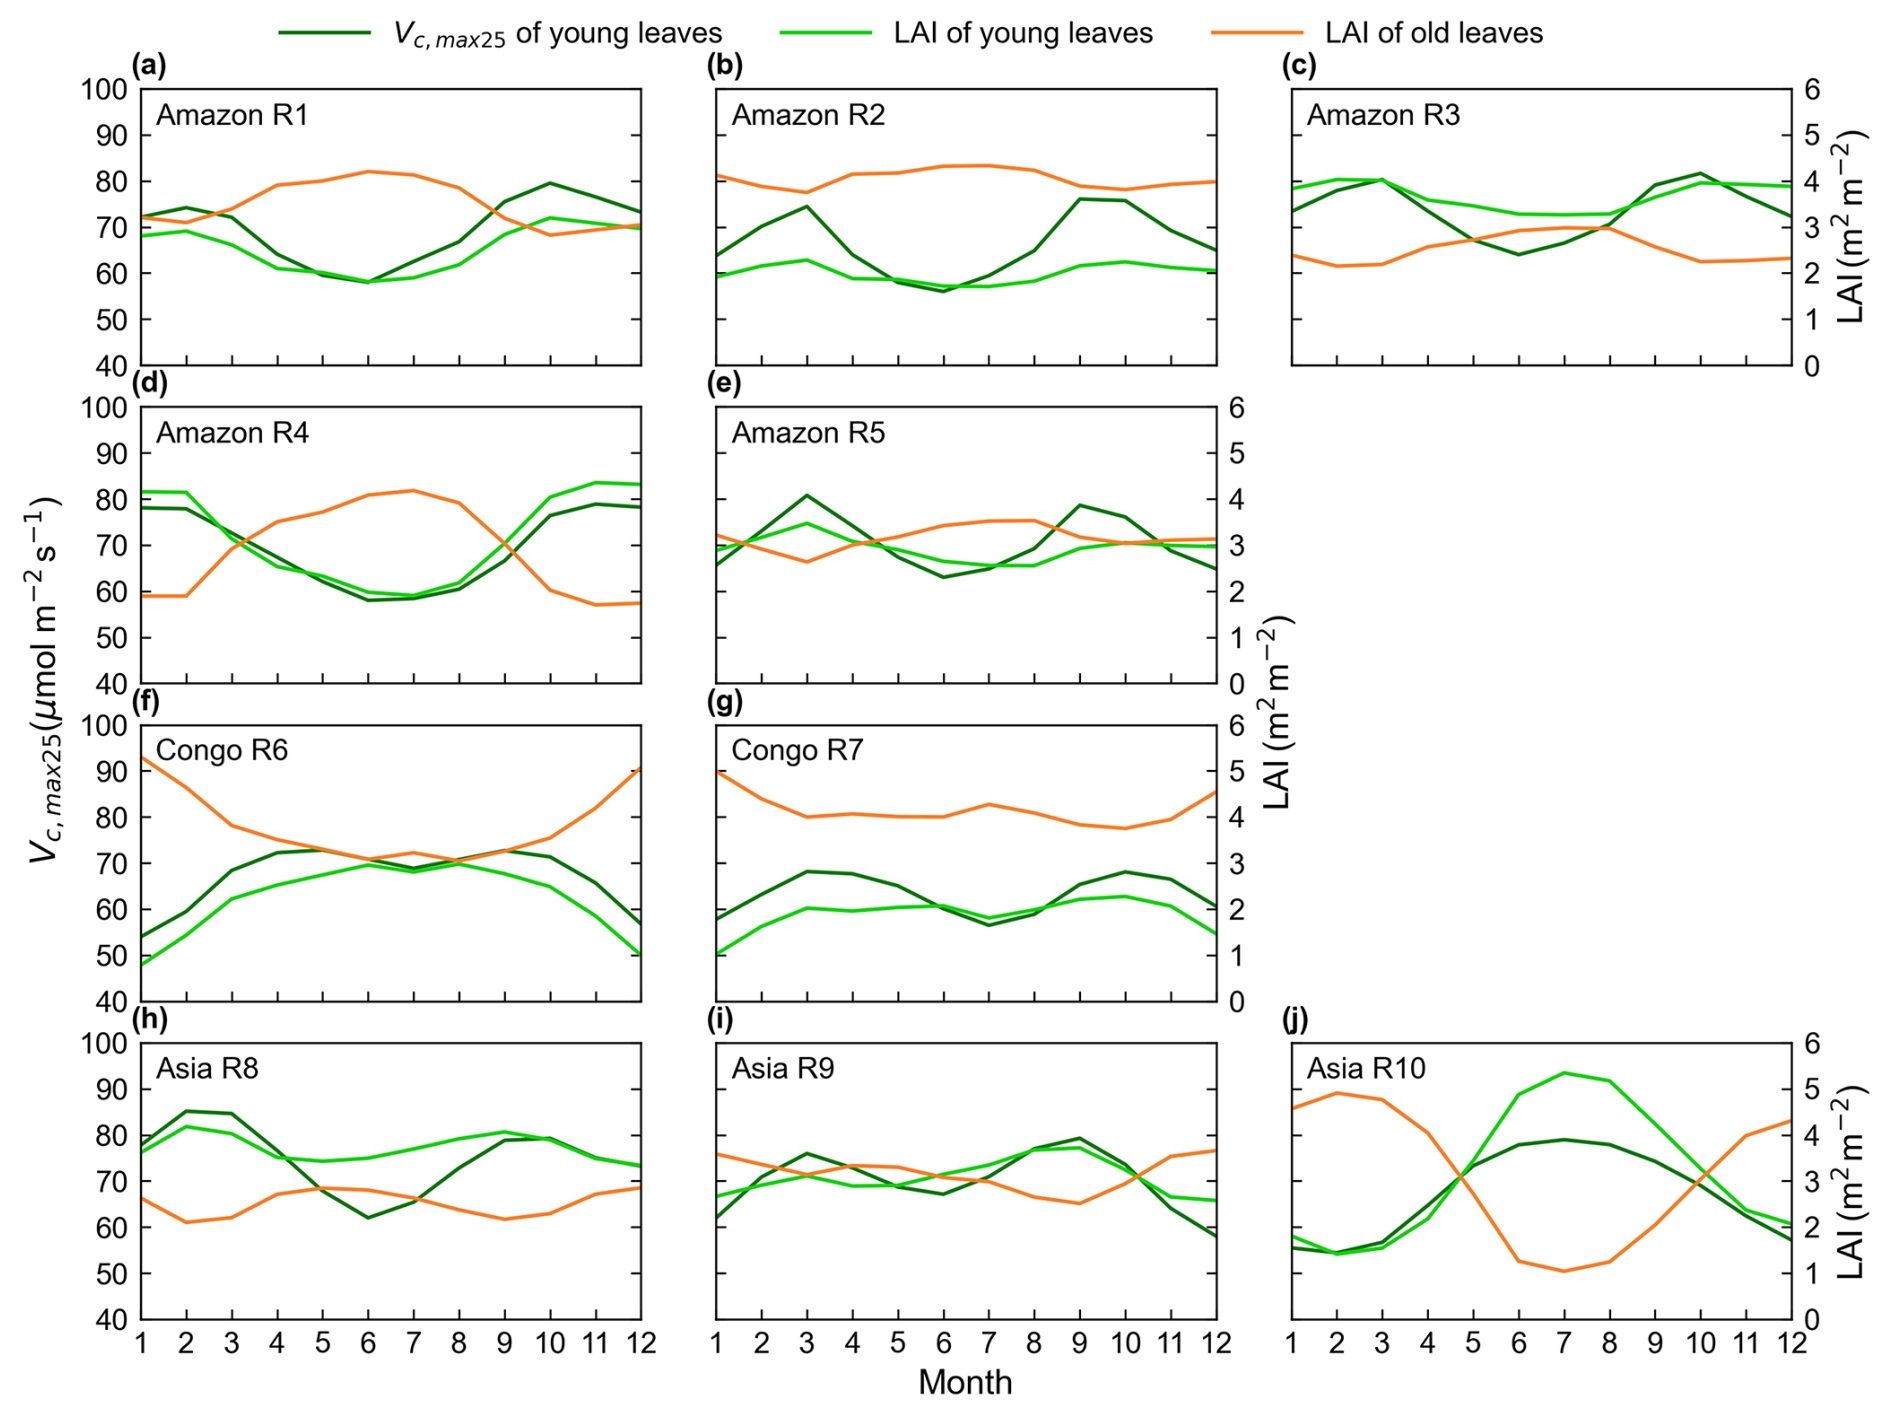
Figure 8Seasonality of the simulated Vc,max25 of young leaves in comparison with the Lad-LAI developed by Yang et al. (2023).
The spatial distribution of the clustered Vc,max25 of young leaves, derived from satellite vegetation signals (Fig. 6a–c), closely aligned with the climate-based classifications of Chen et al. (2021) (Fig. 6d–f). These patterns showed strong correspondence to the Lad-LAI clusters based on endogenous climate variables reported by Yang et al. (2023) (Fig. 6g–i). Collectively, these results demonstrate similar spatial clustering patterns. In the middle (R2) and northern (R3) Amazon (Fig. 7a), the seasonal variation in the Vc,max25 of young leaves (Fig. 8b and c) was consistent with that of the BR-Sa1 and GF-Guy sites, where young leaves increase during the dry seasons. Moreover, the seasonality of the Vc,max25 of young leaves in subtropical Asia (Fig. 8f) mirrored patterns observed at the CN-Din site, where young leaves conversely increase during the wet seasons. The Vc,max25 of young leaves peaked in July in subregion R10, which was located between subregions R8 and R9, where the Vc,max25 of young leaves exhibited a bidirectional phenology (Fig. 8j). The four equatorial subregions (R1, R2, R7, and R8) exhibited distinct phenological patterns compared to areas near the tropics of Capricorn and Cancer. These equatorial regions demonstrated significantly dampened seasonal variation in the Vc,max25 of young leaves, with characteristic bidirectional peaks occurring in March and August (Fig. 8a, d, e, and g). This bimodal pattern contrasts sharply with the unimodal seasonality observed in regions far from the Equator, which is consistent with previous findings by Li et al. (2021a).
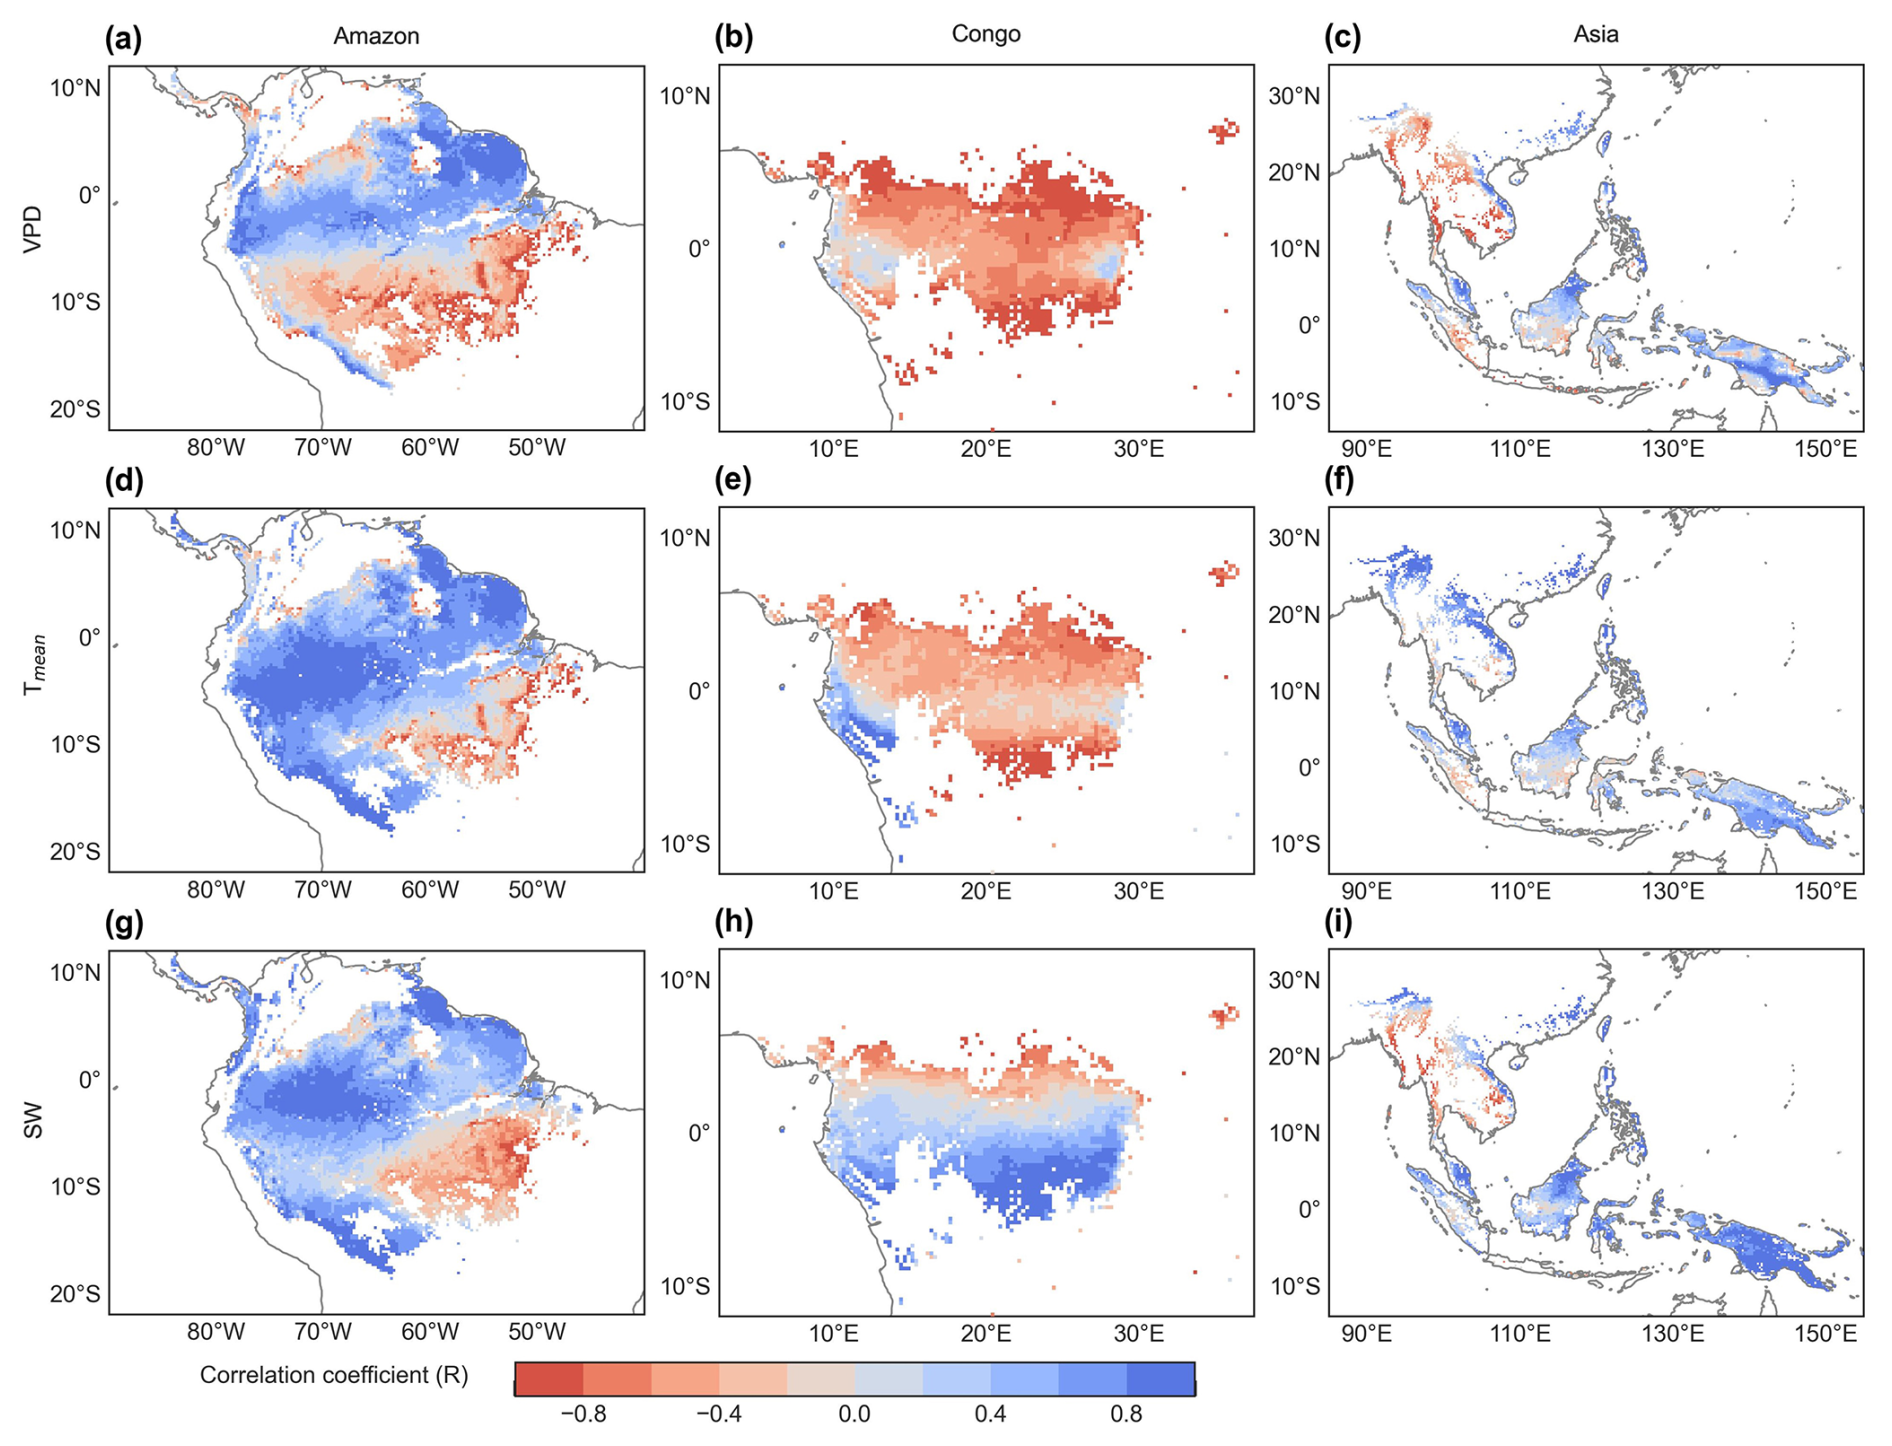
Figure 9Spatial maps of R between the SIF-simulated monthly Vc,max25 and vapor pressure deficit (VPD, a–c), air temperature (Tmean, d–f), and downward shortwave solar radiation (SW, g–i).
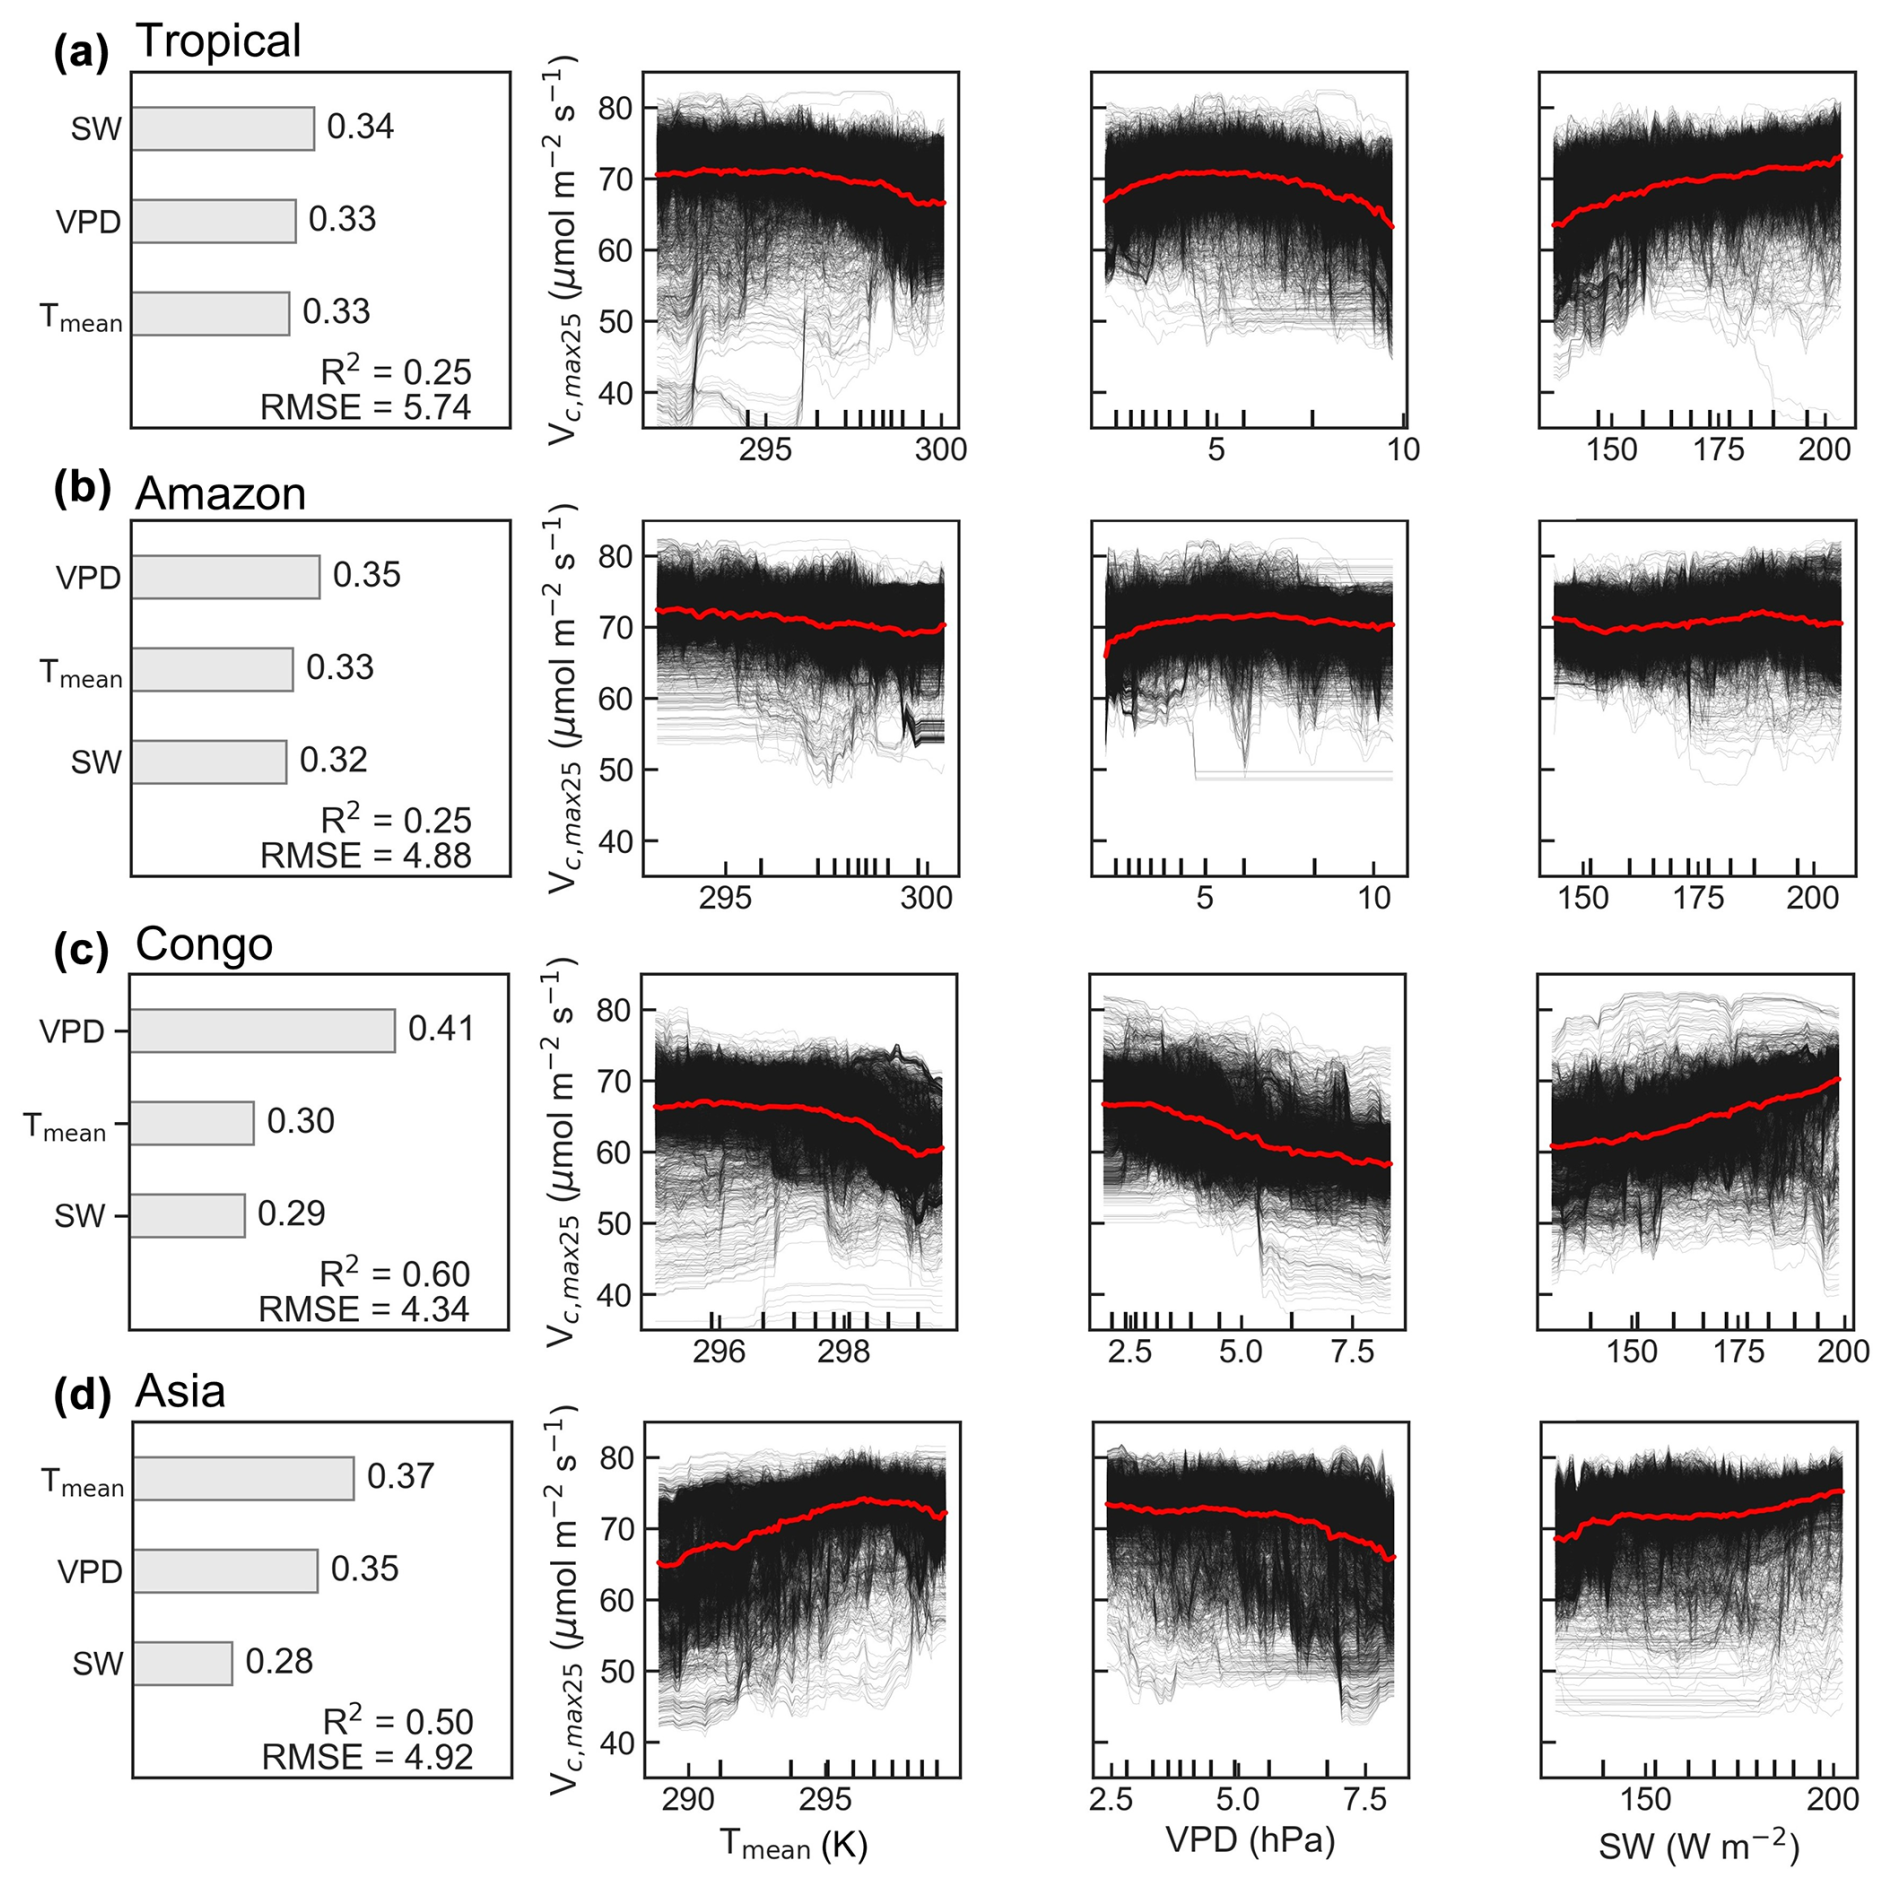
Figure 10Climatic drivers of spatial variations in the average Vc,max25 of young leaves across the TEFs (a) and three major tropical forest regions (b–d). Contributions (∅) of three climate factors to the multiyear average Vc,max25 used the random forest (RF) algorithm. R2 represents the coefficient of determination between the simulated and observed Vc,max25. RMSE indicates the root mean standard error. Partial dependence plots (PDPs) show the relationships between three climate drivers (Tmean, K; SW, W m−2; VPD, hPa) and Vc,max25. Relations for each pixel are displayed in black lines, and relations on the regional average are shown in red lines.
3.4 Partial correlations between the seasonal Vc,max25 of young leaves and individual climatic factors
To assess the climatic controls on Vc,max25 of young leaves, we performed spatial partial correlation analyses of climate drivers such as VPD, Tmean, and SW (Fig. 9), previously established as critical determinants of leaf phenology in TEFs (Yang et al., 2023, 2021; Li et al., 2021a). The Vc,max25 of young leaves exhibited a strong correlation with the three climate drivers (Fig. 9). We then analyzed the relative importance of the three climate drivers in influencing Vc,max25 using the machine learning model of the RF method (Fig. 10 and Sect. 2.5.3). Shortwave radiation exhibited particularly notable positive correlations (R > 0.34) with Vc,max25 across almost all of the regions, with the exception of subregion Amazon R4 (R = 0.17) (Fig. S8), and the shortwave radiation was also the most contributing factor (Fig. 10a). This underscores the dominant role of radiation in regulating canopy photosynthesis in TEFs. Although seasonal temperature fluctuations were modest (Fig. S7), likely due to minor temperature gradients, Tmean still exhibited a positive correlation with the Vc,max25 of young leaves. However, at the global scale, Tmean had the least influence compared to VPD and SW (Fig. 10a). Notably, in the Asia region, Tmean emerged as the primary driver of Vc,max25 variability and showed a strong positive correlation in subregion Asia R10 (R = 0.88, Fig. S8). Notably, VPD and Tmean exhibited negative correlations with Vc,max25 across Congo, with VPD showing a strong negative relationship in subregion Congo R7 (R = −0.70) and with Tmean in subregion Congo R6 (R = −0.64) (Fig. S8). These two factors primarily governed the spatial variability of Vc,max25 across Congo (Fig. 10c). This variability stems primarily from the canopy turnover patterns, where leaf aging during rainy seasons reverses during dry periods (Li et al., 2021a; Yang et al., 2023, 2021). As a result, the seasonality of leaf photosynthetic capacity tended to show an inverse trend in the seasonality of leaf age, as expected by Chen et al. (2020).
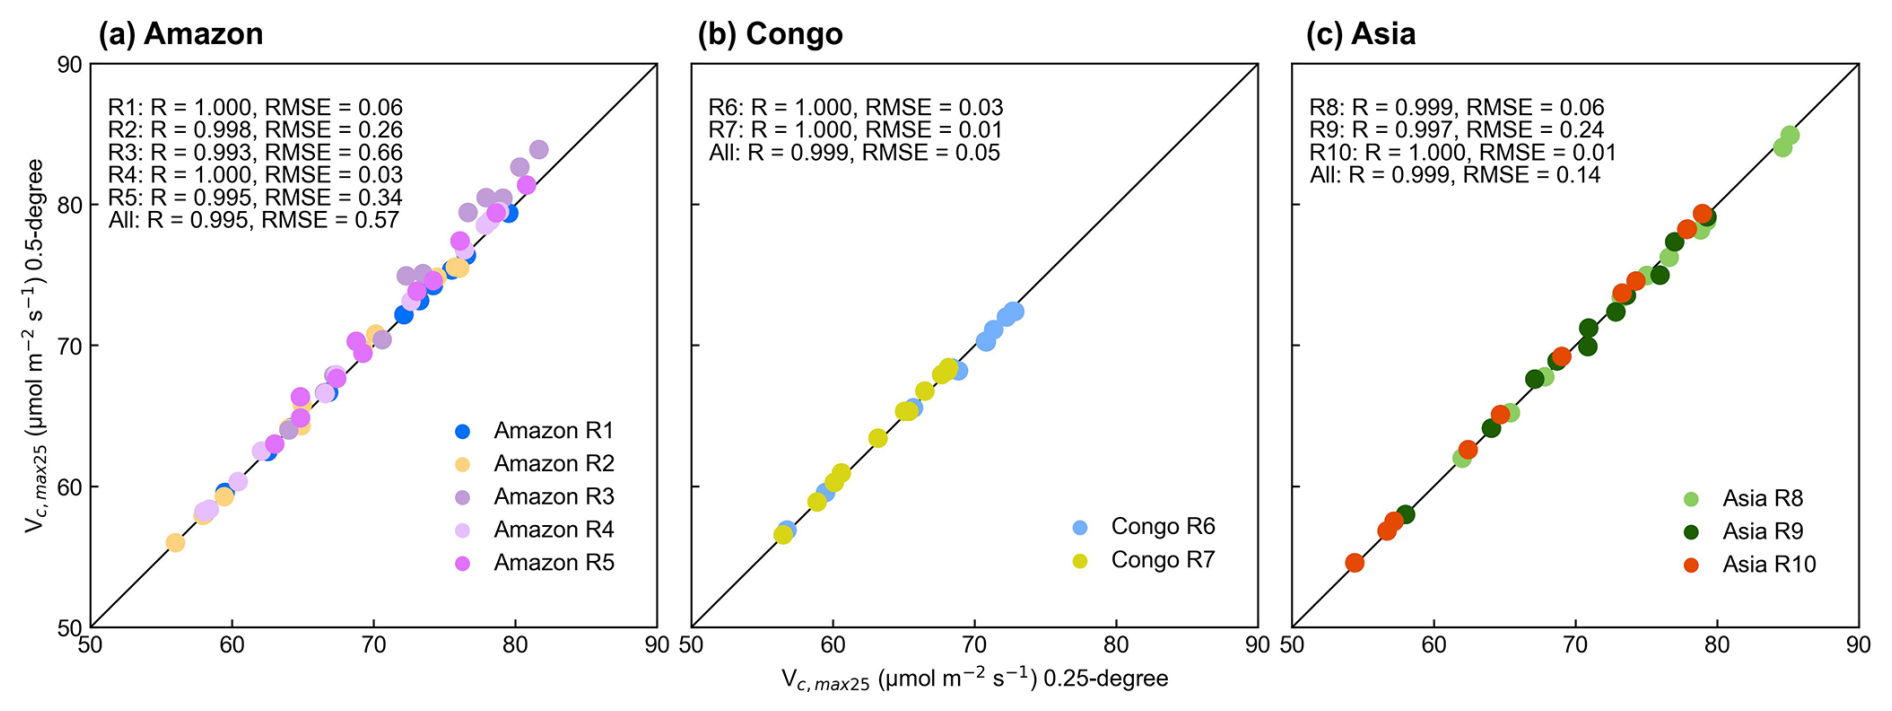
Figure 11Scatterplots between the simulated Vc,max25 of young leaves using the 2 × 2 (0.25° resolution) and 4 × 4 (0.5° resolution) neighboring pixels in the abovementioned 10 clustered subregions.
3.5 Evaluating potential uncertainties in the Vc,max25 of young leaves
The seasonal variations in the Vc,max25 of young leaves using 4 × 4 neighboring pixels were closely aligned with those observed in the 0.25° products utilizing a grid of 2 pixels by 2 pixels (Fig. S9). Results showed a highly linear correlation between the simulated 0.25° resolution and 0.5° resolution (R > 0.99), which was consistent with the RMSE being maintained below 0.66 (Fig. 11). This evidence demonstrates that the neighbor-based decomposition approach reliably generates consistent Vc,max25 products across different spatial scales.
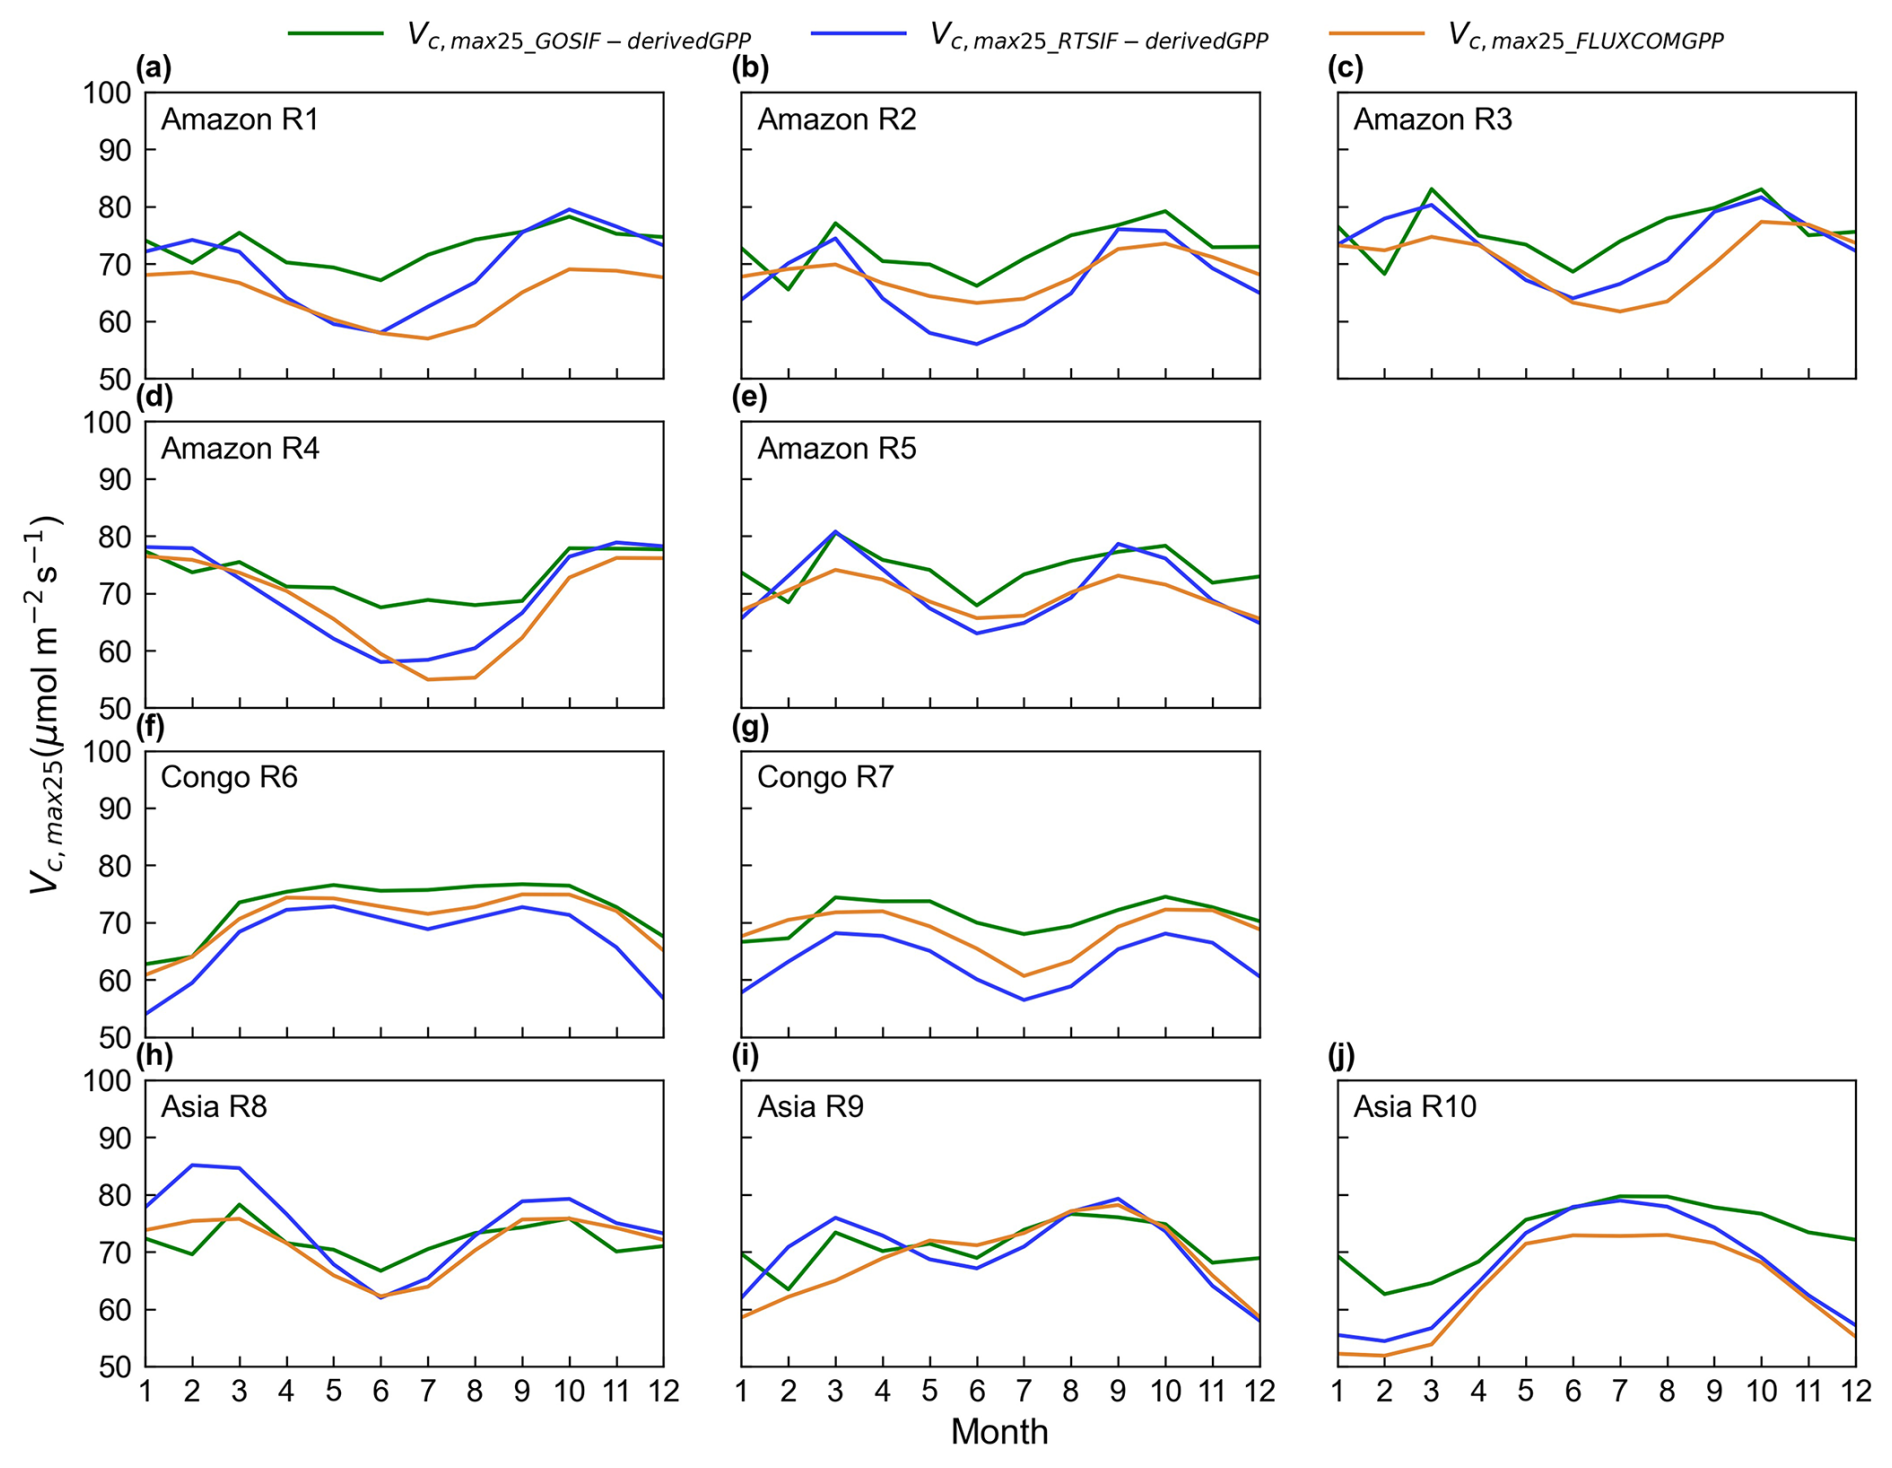
Figure 12Seasonality of the simulated Vc,max25 of young leaves derived from RTSIF, GOSIF, and FLUXCOM GPP in the 10 clustered subregions.
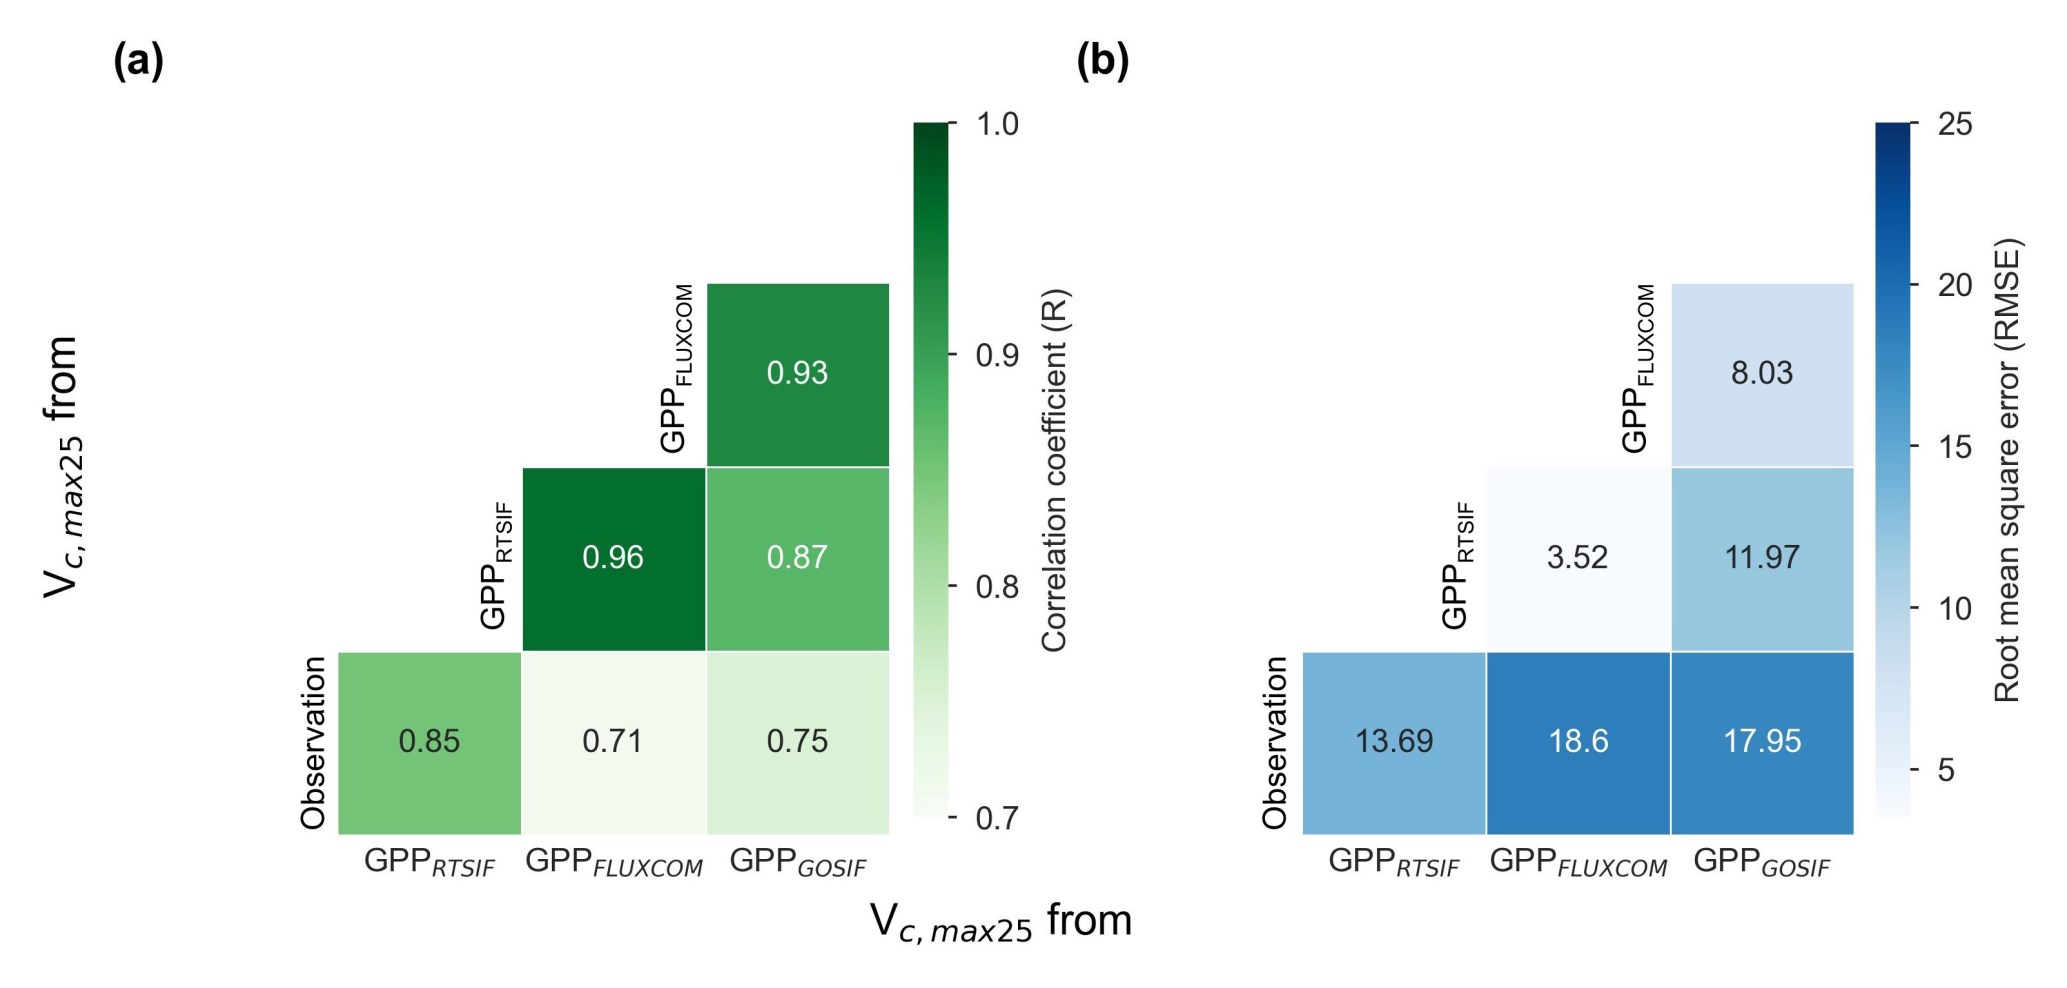
Figure 13Comparison of Vc,max25 values derived from three GPP products (i.e., GPPRTSIF, GPPGOSIF, and GPPFLUXCOM) and in situ observations. (a) R. (b) RMSE.
Three distinct versions for the gridded Vc,max25 of young leaf products from RTSIF-derived and GOSIF-derived GPP and FLUXCOM GPP at various spatial resolutions (Figs. S10–S12) were produced in this study. While minor differences existed among these products, they showed strong spatial consistency (Fig. 12) and high similarity in geographic distribution patterns (R: 0.87–0.96, P < 0.001; Fig. 13). All three GPP-derived Vc,max25 products exhibited consistent seasonal patterns across the 10 subregions (Fig. 12). Validation against in situ measurements demonstrated that the RTSIF-derived product achieved optimal performance, showing both the highest correlation with (R = 0.85) and minimal deviation from (RMSE = 13.69) ground observations (Fig. 13). These results collectively indicate that the Vc,max25 of young leaf products reliably captures photosynthetic seasonality across the 10 subregions.
Tropical forests, marked by no obvious seasonal shifts in greenness but distant variations in leaf age cohorts (Wu et al., 2016; Chen et al., 2020; Chavana-Bryant et al., 2017), show a distinct leaf phenology compared with temperate and boreal forests. Young leaves are the main leaf cohort for influencing photosynthesis (Oliveira et al., 2023; Sharma et al., 2017; Menezes et al., 2022), as photosynthetic capacity declines with leaf aging (Menezes et al., 2022; Wang et al., 2020). Understanding the leaf age–photosynthesis relationships is therefore critical for assessing plant growth, ecosystem productivity, and carbon cycling in evergreen forests (Albert et al., 2018). The leaf maximum carboxylation capacity (Vc,max25) serves as a key parameter for modeling photosynthetic CO2 absorption in ESMs. However, most ESMs typically employ static or annual mean Vc,max25 values for each plant functional type (Stocker et al., 2020; Atkin et al., 2015). This empirical practice causes uncertainties in tropical forest biomes, which are characterized by their extensive plant functional diversity (Echeverría-Londoño et al., 2018; Spicer et al., 2022) and variable photosynthetic capacity (Piao et al., 2019; Wu et al., 2017a). Furthermore, the Vc,max25 varies substantially within species due to leaf age, ambient growth temperatures, and the availability of water and nutrients (Stefanski et al., 2020; Lu et al., 2022; Crous et al., 2022). Photosynthesis seasonality in tropical evergreen forests is thus impacted by the replacement of old leaves with younger and more photosynthetically active foliage (Wu et al., 2016; Chen et al., 2020; Chavana-Bryant et al., 2017). These findings underscore the importance of accurately quantifying the leaf age and integrating the leaf age information into Vc,max25 estimation to enhance simulation of the leaf CO2 assimilation in tropical forests. Currently, there are no comprehensive continental-scale data available on the leaf-age-dependent Vc,max25 variations throughout tropical evergreen forests. This data gap remains because of the insufficient field observations for adequate mapping (Hakala et al., 2019) and limitations in ESMs that rely on uncertain climatic parameters (Brunner et al., 2021). These challenges hinder the application of remote sensing and land surface models (LSMs) for accurately modeling the seasonality of large-scale photosynthesis (Krause et al., 2022).
This study presents a novel continental-scale monthly gridded Vc,max25 of young leaves. The newly developed dataset was validated at four sites (CN-Din in southern China, MDJ-03 in Congo, and BR-Sa1 and GF-Guy in South America) using the field measurements of Vc,max25. We assessed the reliability of the gridded Vc,max25 of young leaves across all of the TEFs through pixel-by-pixel validation against GPP-derived estimates using the dissolved method and leaf age data from Yang et al. (2023). The results reveal substantial age-dependent variation in Vc,max25 (40–90 ), consistent with the ranges reported for tropical and subtropical regions in current ESMs (Rogers, 2014). These findings highlight the necessity of incorporating leaf age information into future ESM designs. Moreover, the Vc,max25 estimates successfully captured the dry season canopy greening patterns to the north of the Equator, demonstrating prominent advances in our ability to promptly monitor the photosynthetic capacity in tropical forests. Both direct and indirect evaluations confirm the robustness of these new photosynthetic products. In equatorial regions with high annual rainfall and minimal dry seasons, canopy phenology exhibits subtler variations compared to forests near the tropics of Capricorn and Cancer (Yang et al., 2021). The new photosynthetic product successfully captures the characteristic bimodal patterns of Vc,max25 with limited seasonal amplitude in these areas. To convert the SIF data into GPP, a constant coefficient was used, and Vc,max25 was assumed to be uniformly distributed across all tropical evergreen forests, potentially introducing further uncertainties. This assumption was reflected in the mean squared deviation (MSD) assessment, where the bias component was predominant, especially near the Equator. Nevertheless, the impact of this on the seasonality of photosynthesis was minimal because the phase-dependent component of the RMSE remained relatively insignificant.
The LDO hypothesis categorizes the leaf cohorts into three distinct age classes: new leaves (from 1 to 60 d), mature leaves (from 60 to 180 d), and old leaves (more than 180 d), with corresponding mean Vc,max25 values as reported by Wu et al. (2016). To enhance comparability between observations and models, we further grouped leaves into two age classes. Leaf ages of more than 6 months are classified as a distinct old leaf class, while leaf ages of less than 6 months are combined into a single young leaf class. Menezes et al. (2022) reported that mature leaves (60–180 d) exhibited the highest average Vc,max25, whereas older leaves (234–612 d) showed lower values (30.4 ± 1.2). Young leaves displayed a 23 % higher Vc,max25 than old leaves, with minimal variation in the latter. Notably, the link between the older leaves and Vc,max25 remains poorly understood in TEFs due to limited field data (Chen et al., 2020). To address these simulation challenges, we treated the Vc,max25 of old leaves as a static value, potentially introducing errors into photosynthetic performance predictions. This simplification may also affect the accuracy of Vc,max25 and GPP seasonality in ESMs (De Weirdt et al., 2012). Moreover, additional uncertainties stem from assumptions that neglect the spatial and temporal variations driven by the plant functional type diversity, which shifts with seasonal climate anomalies and high heterogeneity in diverse forest ecosystems. These generalizations could also introduce inaccuracies when simulating seasonal variations in Vc,max25. Reflecting the inherent variability in photosynthetic behavior across leaf ages, the data revealed two distinct responses: (1) certain species, such as P. tomentosa and P. caimito, exhibited marked reductions in Vc,max25 with age, whereas (2) others, such as M. angularis and V. parviflora, maintained consistent Vc,max25 values after reaching their peak. Menezes et al. (2022) identified a modest but significant correlation between the Vc,max25 and leaf age due to these divergent patterns. Variations in the photosynthetic capacity at the ecosystem level could be influenced by species composition and the distribution of plant functional groups within forests. Furthermore, the seasonal fluctuations in Vc,max25 of young leaves are closely associated with both plant growth strategies and environmental factors. Higher Vc,max25 values in young leaves during the early growing season may reflect an adaptive strategy for quickly establishing photosynthetic capacity, which is especially beneficial in competitive environments like tropical and subtropical forests. These seasonal variations directly impact a plant's carbon uptake capacity, potentially leading to increased carbon sequestration within plant biomass and influencing atmospheric CO2 concentrations, which could create feedback loops within the climate system.
In summary, we present a novel approach to developing a gridded dataset that incorporates leaf age sensitivity into the photosynthesis parameters for TEFs at a continental scale. While some uncertainties persist, we provide a monthly gridded Vc,max25 of a young leaf dataset. This innovation facilitates comprehensive phenological modeling in ESMs, which typically operate at coarser resolutions. These improvements substantially enhance our ability to monitor and mechanistically interpret the spatiotemporal variations in the Vc,max25 of young leaves, providing essential data for the parameterization and assessment in ESMs. Furthermore, as remote sensing technologies advance, we anticipate that the enhanced temporal and spatial resolutions of RTSIF-derived GPP will facilitate more accurate mapping of photosynthesis products in future studies.
The 0.25° time series Vc,max25 data from 2001 to 2018 are presented in this paper as the main dataset. We also provided another two versions of Vc,max25 generated from the GOSIF-derived GPP and FLUXCOM GPP, respectively. The three datasets are available at https://doi.org/10.5281/zenodo.14807414 (Yang et al., 2025). These datasets are compressed in GeoTiff format, with a spatial reference of WGS84. Each file in these datasets is named as follows: “Vcmax25_{GPP source} derived_{YYYYMM}.tif”.
This study developed a novel monthly gridded dataset of Vc,max25 in combination with ontogeny-dependent leaf age changes. The new Vc,max25 of young leaves performs reasonably well in validation against three independent datasets, i.e., (1) in situ observations of the monthly Vc,max25 records, (2) the Vc,max25 product dissolved from the GOSIF-derived GPP, and (3) the leaf-age-dependent leaf area index product. Our results demonstrate that the seasonal dynamics in Vc,max25 of young leaves are governed by distinct climate phenology regimes across tropical and subtropical evergreen broadleaved forests. Specifically, in the central and southern Amazon, the Vc,max25 of young leaves decreased during dry season onset (approximately February) but increased during wet season onset (approximately June). Conversely, the Vc,max25 of young leaves in subtropical Asia exhibited a peak during the wet season (June or July), coinciding with maximum rainfall. Near the Equator, the Vc,max25 of young leaves showed a bimodal seasonality with very slight variations. The Vc,max25 of young leaf products offers valuable insights into the adaptations of tropical and subtropical forests to the ongoing climate change while also serving to improve phenology parameterization in land surface models (LSMs).
The supplement related to this article is available online at https://doi.org/10.5194/essd-17-3293-2025-supplement.
XC designed the research and wrote the paper. XY and QS wrote the draft, debugged the algorithms, and processed the data. LH debugged the algorithms and reviewed the paper. All of the authors edited and revised the paper.
The contact author has declared that none of the authors has any competing interests.
Publisher's note: Copernicus Publications remains neutral with regard to jurisdictional claims made in the text, published maps, institutional affiliations, or any other geographical representation in this paper. While Copernicus Publications makes every effort to include appropriate place names, the final responsibility lies with the authors.
We would like to thank the editor and reviewers for their valuable time in reviewing the manuscript.
This study was supported by the National Natural Science Foundation of China (grant nos. 42471326, 31971458, and U21A6001), the National Key R&D Program of China (grant no. 2024YFF1306600), and the Science and Technology Program of Guangdong (grant no. 2024B1212070012).
This paper was edited by Peng Zhu and reviewed by two anonymous referees.
Albert, L. P., Wu, J., Prohaska, N., de Camargo, P. B., Huxman, T. E., Tribuzy, E. S., Ivanov, V. Y., Oliveira, R. S., Garcia, S., Smith, M. N., Oliveira Junior, R. C., Restrepo-Coupe, N., da Silva, R., Stark, S. C., Martins, G. A., Penha, D. V., and Saleska, S. R.: Age-dependent leaf physiology and consequences for crown-scale carbon uptake during the dry season in an Amazon evergreen forest, New Phytol., 219, 870–884, https://doi.org/10.1111/nph.15056, 2018.
Ali, A. A., Xu, C., Rogers, A., Fisher, R. A., Wullschleger, S. D., Massoud, E. C., Vrugt, J. A., Muss, J. D., McDowell, N. G., Fisher, J. B., Reich, P. B., and Wilson, C. J.: A global scale mechanistic model of photosynthetic capacity (LUNA V1.0), Geosci. Model Dev., 9, 587–606, https://doi.org/10.5194/gmd-9-587-2016, 2016.
Arora, V. K. and Boer, G. J.: Fire as an interactive component of dynamic vegetation models, J. Geophys. Res.-Biogeo., 110, G02008, https://doi.org/10.1029/2005jg000042, 2005.
Atkin, O. K., Meir, P., and Turnbull, M. H.: Improving representation of leaf respiration in large-scale predictive climate–vegetation models, New Phytol., 202, 743–748, https://doi.org/10.1111/nph.12686, 2014.
Atkin, O. K., Bloomfield, K. J., Reich, P. B., Tjoelker, M. G., Asner, G. P., Bonal, D., Boenisch, G., Bradford, M. G., Cernusak, L. A., Cosio, E. G., Creek, D., Crous, K. Y., Domingues, T. F., Dukes, J. S., Egerton, J. J. G., Evans, J. R., Farquhar, G. D., Fyllas, N. M., Gauthier, P. P. G., Gloor, E., Gimeno, T. E., Griffin, K. L., Guerrieri, R., Heskel, M. A., Huntingford, C., Ishida, F. Y., Kattge, J., Lambers, H., Liddell, M. J., Lloyd, J., Lusk, C. H., Martin, R. E., Maksimov, A. P., Maximov, T. C., Malhi, Y., Medlyn, B. E., Meir, P., Mercado, L. M., Mirotchnick, N., Ng, D., Niinemets, U., O'Sullivan, O. S., Phillips, O. L., Poorter, L., Poot, P., Prentice, I. C., Salinas, N., Rowland, L. M., Ryan, M. G., Sitch, S., Slot, M., Smith, N. G., Turnbull, M. H., VanderWel, M. C., Valladares, F., Veneklaas, E. J., Weerasinghe, L. K., Wirth, C., Wright, I. J., Wythers, K. R., Xiang, J., Xiang, S., and Zaragoza-Castells, J.: Global variability in leaf respiration in relation to climate, plant functional types and leaf traits, New Phytol., 206, 614–636, https://doi.org/10.1111/nph.13253, 2015.
Bernacchi, C. J., Singsaas, E. L., Pimentel, C., Portis, A. R., and Long, S. P.: Improved temperature response functions for models of Rubisco-limited photosynthesis, Plant Cell Environ., 24, 253–259, https://doi.org/10.1046/j.1365-3040.2001.00668.x, 2001.
Bernacchi, C. J., Pimentel, C., and Long, S. P.: In vivo temperature response functions of parameters required to model RuBP-limited photosynthesis, Plant Cell Environ., 26, 1419–1430, https://doi.org/10.1046/j.0016-8025.2003.01050.x, 2003.
Bernacchi, C. J., Bagley, J. E., Serbin, S. P., Ruiz-Vera, U. M., Rosenthal, D. M., and Vanloocke, A.: Modelling C3 photosynthesis from the chloroplast to the ecosystem, Plant Cell Environ., 36, 1641–1657, https://doi.org/10.1111/pce.12118, 2013.
Brando, P. M., Goetz, S. J., Baccini, A., Nepstad, D. C., Beck, P. S. A., and Christman, M. C.: Seasonal and interannual variability of climate and vegetation indices across the Amazon, P. Natl. Acad. Sci. USA, 107, 14685–14690, https://doi.org/10.1073/pnas.0908741107, 2010.
Brunner, M. I., Slater, L., Tallaksen, L. M., and Clark, M.: Challenges in modeling and predicting floods and droughts: A review, WIREs Water, 8, e1520, https://doi.org/10.1002/wat2.1520, 2021.
Chavana-Bryant, C., Malhi, Y., Wu, J., Asner, G. P., Anastasiou, A., Enquist, B. J., Cosio Caravasi, E. G., Doughty, C. E., Saleska, S. R., Martin, R. E., and Gerard, F. F.: Leaf aging of Amazonian canopy trees as revealed by spectral and physiochemical measurements, New Phytol., 214, 1049–1063, https://doi.org/10.1111/nph.13853, 2017.
Chen, J. M., Ju, W., Ciais, P., Viovy, N., Liu, R., Liu, Y., and Lu, X.: Vegetation structural change since 1981 significantly enhanced the terrestrial carbon sink, Nat. Commun., 10, 4259, https://doi.org/10.1038/s41467-019-12257-8, 2019.
Chen, J. M., Wang, R., Liu, Y., He, L., Croft, H., Luo, X., Wang, H., Smith, N. G., Keenan, T. F., Prentice, I. C., Zhang, Y., Ju, W., and Dong, N.: Global datasets of leaf photosynthetic capacity for ecological and earth system research, Earth Syst. Sci. Data, 14, 4077–4093, https://doi.org/10.5194/essd-14-4077-2022, 2022a.
Chen, X., Maignan, F., Viovy, N., Bastos, A., Goll, D., Wu, J., Liu, L. Y., Yue, C., Peng, S. S., Yuan, W. P., da Conceicao, A. C., O'Sullivan, M., and Ciais, P.: Novel Representation of Leaf Phenology Improves Simulation of Amazonian Evergreen Forest Photosynthesis in a Land Surface Model, J. Adv. Model. Earth Sy., 12, e2018MS001565, https://doi.org/10.1029/2018ms001565, 2020.
Chen, X., Ciais, P., Maignan, F., Zhang, Y., Bastos, A., Liu, L. Y., Bacour, C., Fan, L., Gentine, P., Goll, D., Green, J., Kim, H., Li, L., Liu, Y., Peng, S. S., Tang, H., Viovy, N., Wigneron, J. P., Wu, J., Yuan, W. P., and Zhang, H. C.: Vapor Pressure Deficit and Sunlight Explain Seasonality of Leaf Phenology and Photosynthesis Across Amazonian Evergreen Broadleaved Forest, Global Biogeochem. Cy., 35, e2018MS001565, https://doi.org/10.1029/2020gb006893, 2021.
Chen, X., Huang, Y., Nie, C., Zhang, S., Wang, G., Chen, S., and Chen, Z.: A long-term reconstructed TROPOMI solar-induced fluorescence dataset using machine learning algorithms, Sci. Data, 9, 427, https://doi.org/10.1038/s41597-022-01520-1, 2022b.
Chou, S., Chen, B., Chen, J., Wang, M., Wang, S., Croft, H., and Shi, Q.: Estimation of leaf photosynthetic capacity from the photochemical reflectance index and leaf pigments, Ecol. Indic., 110, 105867, https://doi.org/10.1016/j.ecolind.2019.105867, 2020.
Cramer, W., Bondeau, A., Woodward, F. I., Prentice, I. C., Betts, R. A., Brovkin, V., Cox, P. M., Fisher, V., Foley, J. A., Friend, A. D., Kucharik, C., Lomas, M. R., Ramankutty, N., Sitch, S., Smith, B., White, A., and Young-Molling, C.: Global response of terrestrial ecosystem structure and function to CO2 and climate change:: results from six dynamic global vegetation models, Glob. Change Biol., 7, 357–373, https://doi.org/10.1046/j.1365-2486.2001.00383.x, 2001.
Croft, H., Chen, J. M., Luo, X., Bartlett, P., Chen, B., and Staebler, R. M.: Leaf chlorophyll content as a proxy for leaf photosynthetic capacity, Glob. Change Biol., 23, 3513–3524, https://doi.org/10.1111/gcb.13599, 2017.
Croft, H., Chen, J., Wang, R., Mo, G., Luo, S., Luo, X., He, L., Gonsamo, A., Arabian, J., and Zhang, Y.: The global distribution of leaf chlorophyll content, Remote Sens. Environ., 236, 111479, https://doi.org/10.1016/j.rse.2019.111479, 2020.
Crous, K. Y., Uddling, J., and De Kauwe, M. G.: Temperature responses of photosynthesis and respiration in evergreen trees from boreal to tropical latitudes, New Phytol., 234, 353–374, https://doi.org/10.1111/nph.17951, 2022.
De Weirdt, M., Verbeeck, H., Maignan, F., Peylin, P., Poulter, B., Bonal, D., Ciais, P., and Steppe, K.: Seasonal leaf dynamics for tropical evergreen forests in a process-based global ecosystem model, Geosci. Model Dev., 5, 1091–1108, https://doi.org/10.5194/gmd-5-1091-2012, 2012.
Dechant, B., Ryu, Y., Badgley, G., Zeng, Y., Berry, J. A., Zhang, Y., Goulas, Y., Li, Z., Zhang, Q., Kang, M., Li, J., and Moya, I.: Canopy structure explains the relationship between photosynthesis and sun-induced chlorophyll fluorescence in crops, Remote Sens. Environ., 241, 111733, https://doi.org/10.1016/j.rse.2020.111733, 2020.
Echeverría-Londoño, S., Enquist, B. J., Neves, D. M., Violle, C., Boyle, B., Kraft, N. J., Maitner, B. S., McGill, B., Peet, R. K., and Sandel, B.: Plant functional diversity and the biogeography of biomes in North and South America, Front. Ecol. Evol., 6, 219, https://doi.org/10.3389/fevo.2018.00219, 2018.
Evans, J. R.: Photosynthesis and Nitrogen Relationships in Leaves of C3 Plants, Oecologia, 78, 9–19, https://doi.org/10.1007/BF00377192, 1989.
Fabre, D., Yin, X., Dingkuhn, M., Clément-Vidal, A., Roques, S., Rouan, L., Soutiras, A., and Luquet, D.: Is triose phosphate utilization involved in the feedback inhibition of photosynthesis in rice under conditions of sink limitation?, J. Exp. Bot., 70, 5773–5785, https://doi.org/10.1093/jxb/erz318, 2019.
Farquhar, G. D., Caemmerer, S. V., and Berry, J. A.: A biochemical-model of photosynthetic CO2 assimilation in leaves of C3 specials, Planta, 149, 78–90, https://doi.org/10.1007/bf00386231, 1980.
Ferreira Domingues, T., Ishida, F. Y., Feldpausch, T. R., Grace, J., Meir, P., Saiz, G., Sene, O., Schrodt, F., Sonké, B., and Taedoumg, H.: Biome-specific effects of nitrogen and phosphorus on the photosynthetic characteristics of trees at a forest-savanna boundary in Cameroon, Oecologia, 178, 659–672, https://doi.org/10.1007/s00442-015-3250-5, 2015.
Frankenberg, C., Fisher, J. B., Worden, J., Badgley, G., Saatchi, S. S., Lee, J. E., Toon, G. C., Butz, A., Jung, M., and Kuze, A.: New global observations of the terrestrial carbon cycle from GOSAT: Patterns of plant fluorescence with gross primary productivity, Geophys. Res. Lett., 38, L17706, https://doi.org/10.1029/2011GL048738, 2011.
Hakala, K., Addor, N., Teutschbein, C., Vis, M., Dakhlaoui, H., and Seibert, J.: Hydrological modeling of climate change impacts, Encyclopedia of water: Science, technology, and society, edited by: Maurice, P., John Wiley & Sons, Ltd., https://doi.org/10.1002/9781119300762.wsts0062, 1–20, 2019.
He, L., Chen, J. M., Liu, J., Zheng, T., Wang, R., Joiner, J., Chou, S., Chen, B., Liu, Y., and Liu, R.: Diverse photosynthetic capacity of global ecosystems mapped by satellite chlorophyll fluorescence measurements, Remote Sens. Environ., 232, 111344, https://doi.org/10.1016/j.rse.2019.111344, 2019.
Hikosaka, K.: Optimal nitrogen distribution within a leaf canopy under direct and diffuse light, Plant Cell Environ., 37, 2077–2085, https://doi.org/10.1111/pce.12291, 2014.
Houborg, R., Cescatti, A., Migliavacca, M., and Kustas, W.: Satellite retrievals of leaf chlorophyll and photosynthetic capacity for improved modeling of GPP, Agr. Forest Meteorol., 177, 10–23, https://doi.org/10.1016/j.agrformet.2013.04.006, 2013.
Houborg, R., McCabe, M. F., Cescatti, A., and Gitelson, A. A.: Leaf chlorophyll constraint on model simulated gross primary productivity in agricultural systems, Int. J. Appl. Earth Obs., 43, 160–176, https://doi.org/10.1016/j.jag.2015.03.016, 2015.
Ikotun, A. M., Ezugwu, A. E., Abualigah, L., Abuhaija, B., and Heming, J.: K-means clustering algorithms: A comprehensive review, variants analysis, and advances in the era of big data, Inform. Sciences, 622, 178–210, https://doi.org/10.1016/j.ins.2022.11.139, 2023.
Jensen, A. M., Warren, J. M., Hanson, P. J., Childs, J., and Wullschleger, S. D.: Needle age and season influence photosynthetic temperature response and total annual carbon uptake in mature Picea mariana trees, Ann. Bot., 116, 821–832, https://doi.org/10.1093/aob/mcv115, 2015.
Jung, M., Koirala, S., Weber, U., Ichii, K., Gans, F., Camps-Valls, G., Papale, D., Schwalm, C., Tramontana, G., and Reichstein, M.: The FLUXCOM ensemble of global land-atmosphere energy fluxes, Sci. Data, 6, 74, https://doi.org/10.1038/s41597-019-0076-8, 2019.
Knyazikhin, Y., Schull, M. A., Stenberg, P., Mõttus, M., Rautiainen, M., Yang, Y., Marshak, A., Latorre Carmona, P., Kaufmann, R. K., and Lewis, P.: Hyperspectral remote sensing of foliar nitrogen content, P. Natl. Acad. Sci. USA, 110, E185–E192, https://doi.org/10.1073/pnas.1210196109, 2013.
Krause, A., Papastefanou, P., Gregor, K., Layritz, L. S., Zang, C. S., Buras, A., Li, X., Xiao, J., and Rammig, A.: Quantifying the impacts of land cover change on gross primary productivity globally, Sci. Rep.-, 12, 18398, https://doi.org/10.1038/s41598-022-23120-0, 2022.
Li, Q., Chen, X., Yuan, W., Lu, H., Shen, R., Wu, S., Gong, F., Dai, Y., Liu, L., Sun, Q., Zhang, C., and Su, Y.: Remote Sensing of Seasonal Climatic Constraints on Leaf Phenology Across Pantropical Evergreen Forest Biome, Earths Future, 9, e2021EF002160, https://doi.org/10.1029/2021ef002160, 2021a.
Li, X., Du, H., Zhou, G., Mao, F., Zhang, M., Han, N., Fan, W., Liu, H., Huang, Z., and He, S.: Phenology estimation of subtropical bamboo forests based on assimilated MODIS LAI time series data, ISPRS J. Photogramm., 173, 262–277, https://doi.org/10.1016/j.isprsjprs.2021.01.018, 2021b.
Lin, Y.-S., Medlyn, B. E., Duursma, R. A., Prentice, I. C., Wang, H., Baig, S., Eamus, D., de Dios, Victor R., Mitchell, P., Ellsworth, D. S., de Beeck, M. O., Wallin, G., Uddling, J., Tarvainen, L., Linderson, M.-L., Cernusak, L. A., Nippert, J. B., Ocheltree, T. W., Tissue, D. T., Martin-StPaul, N. K., Rogers, A., Warren, J. M., De Angelis, P., Hikosaka, K., Han, Q., Onoda, Y., Gimeno, T. E., Barton, C. V. M., Bennie, J., Bonal, D., Bosc, A., Löw, M., Macinins-Ng, C., Rey, A., Rowland, L., Setterfield, S. A., Tausz-Posch, S., Zaragoza-Castells, J., Broadmeadow, M. S. J., Drake, J. E., Freeman, M., Ghannoum, O., Hutley, Lindsay B., Kelly, J. W., Kikuzawa, K., Kolari, P., Koyama, K., Limousin, J.-M., Meir, P., Lola da Costa, A. C., Mikkelsen, T. N., Salinas, N., Sun, W., and Wingate, L.: Optimal stomatal behaviour around the world, Nat. Clim. Change, 5, 459–464, https://doi.org/10.1038/nclimate2550, 2015.
Liu, Y., Chen, J. M., Xu, M., Wang, R., Fan, W., Li, W., Kammer, L., Prentice, C., Keenan, T. F., and Smith, N. G.: Improved global estimation of seasonal variations in C3 photosynthetic capacity based on eco-evolutionary optimality hypotheses and remote sensing, Remote Sens. Environ., 313, 114338, https://doi.org/10.1016/j.rse.2024.114338, 2024.
Locke, A. M. and Ort, D. R.: Leaf hydraulic conductance declines in coordination with photosynthesis, transpiration and leaf water status as soybean leaves age regardless of soil moisture, J. Exp. Bot., 65, 6617–6627, https://doi.org/10.1093/jxb/eru380, 2014.
Lu, X., Ju, W., Li, J., Croft, H., Chen, J. M., Luo, Y., Yu, H., and Hu, H.: Maximum Carboxylation Rate Estimation With Chlorophyll Content as a Proxy of Rubisco Content, J. Geophys. Res.-Biogeo., 125, e2020JG005748, https://doi.org/10.1029/2020jg005748, 2020.
Lu, X., Vitousek, P. M., Mao, Q., Gilliam, F. S., Luo, Y., Turner, B. L., Zhou, G., and Mo, J.: Nitrogen deposition accelerates soil carbon sequestration in tropical forests, P. Natl. Acad. Sci. USA, 118, e2020790118, https://doi.org/10.1073/pnas.2020790118, 2021.
Lu, X., Croft, H., Chen, J. M., Luo, Y., and Ju, W.: Estimating photosynthetic capacity from optimized Rubisco–chlorophyll relationships among vegetation types and under global change, Environ. Res. Lett., 17, 014028, https://doi.org/10.1088/1748-9326/ac444d, 2022.
Luo, X., Croft, H., Chen, J. M., He, L., and Keenan, T. F.: Improved estimates of global terrestrial photosynthesis using information on leaf chlorophyll content, Glob. Change Biol., 25, 2499–2514, https://doi.org/10.1111/gcb.14624, 2019.
Luo, Y., Medlyn, B., Hui, D., Ellsworth, D., Reynolds, J., and Katul, G.: Gross primary productivity in duke forest: modeling synthesis of CO2 experiment and eddy–flux data, Ecol. Appl., 11, 239–252, https://doi.org/10.2307/3061070, 2001.
McClain, A. M. and Sharkey, T. D.: Triose phosphate utilization and beyond: from photosynthesis to end product synthesis, J. Exp. Bot., 70, 1755–1766, https://doi.org/10.1093/jxb/erz058, 2019.
Medlyn, B. E., Duursma, R. A., Eamus, D., Ellsworth, D. S., Prentice, I. C., Barton, C. V. M., Crous, K. Y., de Angelis, P., Freeman, M., and Wingate, L.: Reconciling the optimal and empirical approaches to modelling stomatal conductance, Glob. Change Biol., 17, 2134–2144, https://doi.org/10.1111/j.1365-2486.2010.02375.x, 2011.
Menezes, J., Garcia, S., Grandis, A., Nascimento, H., Domingues, T. F., Guedes, A. V., Aleixo, I., Camargo, P., Campos, J., Damasceno, A., Dias-Silva, R., Fleischer, K., Kruijt, B., Cordeiro, A. L., Martins, N. P., Meir, P., Norby, R. J., Pereira, I., Portela, B., Rammig, A., Ribeiro, A. G., Lapola, D. M., and Quesada, C. A.: Changes in leaf functional traits with leaf age: when do leaves decrease their photosynthetic capacity in Amazonian trees?, Tree Physiol., 42, 922–938, https://doi.org/10.1093/treephys/tpab042, 2022.
Mohammed, G. H., Colombo, R., Middleton, E. M., Rascher, U., Van Der Tol, C., Nedbal, L., Goulas, Y., Pérez-Priego, O., Damm, A., and Meroni, M.: Remote sensing of solar-induced chlorophyll fluorescence (SIF) in vegetation: 50 years of progress, Remote Sens. Environ., 231, 111177, https://doi.org/10.1016/j.rse.2019.04.030, 2019.
Oliveira, F. M., Knoechelmann, C. M., Wirth, R., Tabarelli, M., and Leal, I. R.: Leaf-cutting ant nests support less dense and impoverished seed assemblages in a human-modified Caatinga dry forest, Biotropica, 55, 444–453, https://doi.org/10.1111/btp.13198, 2023.
Onoda, Y., Wright, I. J., Evans, J. R., Hikosaka, K., Kitajima, K., Niinemets, Ü., Poorter, H., Tosens, T., and Westoby, M.: Physiological and structural tradeoffs underlying the leaf economics spectrum, New Phytol., 214, 1447–1463, https://doi.org/10.1111/nph.14496, 2017.
Orndahl, K. M., Ehlers, L. P., Herriges, J. D., Pernick, R. E., Hebblewhite, M., and Goetz, S. J.: Mapping tundra ecosystem plant functional type cover, height, and aboveground biomass in Alaska and northwest Canada using unmanned aerial vehicles, Arctic Science, 8, 1165–1180, https://doi.org/10.1139/as-2021-0044, 2022.
Pastorello, G., Trotta, C., Canfora, E., Chu, H., Christianson, D., Cheah, Y.-W., Poindexter, C., Chen, J., Elbashandy, A., Humphrey, M., Isaac, P., Polidori, D., Ribeca, A., van Ingen, C., Zhang, L., Amiro, B., Ammann, C., Arain, M. A., Ardo, J., Arkebauer, T., Arndt, S. K., Arriga, N., Aubinet, M., Aurela, M., Baldocchi, D., Barr, A., Beamesderfer, E., Marchesini, L. B., Bergeron, O., Beringer, J., Bernhofer, C., Berveiller, D., Billesbach, D., Black, T. A., Blanken, P. D., Bohrer, G., Boike, J., Bolstad, P. V., Bonal, D., Bonnefond, J.-M., Bowling, D. R., Bracho, R., Brodeur, J., Bruemmer, C., Buchmann, N., Burban, B., Burns, S. P., Buysse, P., Cale, P., Cavagna, M., Cellier, P., Chen, S., Chini, I., Christensen, T. R., Cleverly, J., Collalti, A., Consalvo, C., Cook, B. D., Cook, D., Coursolle, C., Cremonese, E., Curtis, P. S., D'Andrea, E., da Rocha, H., Dai, X., Davis, K. J., De Cinti, B., de Grandcourt, A., De Ligne, A., De Oliveira, R. C., Delpierre, N., Desai, A. R., Di Bella, C. M., di Tommasi, P., Dolman, H., Domingo, F., Dong, G., Dore, S., Duce, P., Dufrene, E., Dunn, A., Dusek, J., Eamus, D., Eichelmann, U., ElKhidir, H. A. M., Eugster, W., Ewenz, C. M., Ewers, B., Famulari, D., Fares, S., Feigenwinter, I., Feitz, A., Fensholt, R., Filippa, G., Fischer, M., Frank, J., Galvagno, M., Gharun, M., Gianelle, D., Gielen, B., Gioli, B., Gitelson, A., Goded, I., Goeckede, M., Goldstein, A. H., Gough, C. M., Goulden, M. L., Graf, A., Griebel, A., Gruening, C., Gruenwald, T., Hammerle, A., Han, S., Han, X., Hansen, B. U., Hanson, C., Hatakka, J., He, Y., Hehn, M., Heinesch, B., Hinko-Najera, N., Hoertnagl, L., Hutley, L., Ibrom, A., Ikawa, H., Jackowicz-Korczynski, M., Janous, D., Jans, W., Jassal, R., Jiang, S., Kato, T., Khomik, M., Klatt, J., Knohl, A., Knox, S., Kobayashi, H., Koerber, G., Kolle, O., Kosugi, Y., Kotani, A., Kowalski, A., Kruijt, B., Kurbatova, J., Kutsch, W. L., Kwon, H., Launiainen, S., Laurila, T., Law, B., Leuning, R., Li, Y., Liddell, M., Limousin, J.-M., Lion, M., Liska, A. J., Lohila, A., Lopez-Ballesteros, A., Lopez-Blanco, E., Loubet, B., Loustau, D., Lucas-Moffat, A., Lueers, J., Ma, S., Macfarlane, C., Magliulo, V., Maier, R., Mammarella, I., Manca, G., Marcolla, B., Margolis, H. A., Marras, S., Massman, W., Mastepanov, M., Matamala, R., Matthes, J. H., Mazzenga, F., McCaughey, H., McHugh, I., McMillan, A. M. S., Merbold, L., Meyer, W., Meyers, T., Miller, S. D., Minerbi, S., Moderow, U., Monson, R. K., Montagnani, L., Moore, C. E., Moors, E., Moreaux, V., Moureaux, C., Munger, J. W., Nakai, T., Neirynck, J., Nesic, Z., Nicolini, G., Noormets, A., Northwood, M., Nosetto, M., Nouvellon, Y., Novick, K., Oechel, W., Olesen, J. E., Ourcival, J.-M., Papuga, S. A., Parmentier, F.-J., Paul-Limoges, E., Pavelka, M., Peichl, M., Pendall, E., Phillips, R. P., Pilegaard, K., Pirk, N., Posse, G., Powell, T., Prasse, H., Prober, S. M., Rambal, S., Rannik, U., Raz-Yaseef, N., Reed, D., de Dios, V. R., Restrepo-Coupe, N., Reverter, B. R., Roland, M., Sabbatini, S., Sachs, T., Saleska, S. R., Sanchez-Canete, E. P., Sanchez-Mejia, Z. M., Schmid, H. P., Schmidt, M., Schneider, K., Schrader, F., Schroder, I., Scott, R. L., Sedlak, P., Serrano-Ortiz, P., Shao, C., Shi, P., Shironya, I., Siebicke, L., Sigut, L., Silberstein, R., Sirca, C., Spano, D., Steinbrecher, R., Stevens, R. M., Sturtevant, C., Suyker, A., Tagesson, T., Takanashi, S., Tang, Y., Tapper, N., Thom, J., Tiedemann, F., Tomassucci, M., Tuovinen, J.-P., Urbanski, S., Valentini, R., van der Molen, M., van Gorsel, E., van Huissteden, K., Varlagin, A., Verfaillie, J., Vesala, T., Vincke, C., Vitale, D., Vygodskaya, N., Walker, J. P., Walter-Shea, E., Wang, H., Weber, R., Westermann, S., Wille, C., Wofsy, S., Wohlfahrt, G., Wolf, S., Woodgate, W., Li, Y., Zampedri, R., Zhang, J., Zhou, G., Zona, D., Agarwal, D., Biraud, S., Torn, M., and Papale, D.: The FLUXNET2015 dataset and the ONEFlux processing pipeline for eddy covariance data, Sci. Data, 7, 225, https://doi.org/10.1038/s41597-020-0534-3, 2020.
Piao, S., Liu, Q., Chen, A., Janssens, I. A., Fu, Y., Dai, J., Liu, L., Lian, X., Shen, M., and Zhu, X.: Plant phenology and global climate change: Current progresses and challenges, Glob. Change Biol., 25, 1922–1940, https://doi.org/10.1111/gcb.14619, 2019.
Quebbeman, J. and Ramirez, J.: Optimal allocation of leaf-level nitrogen: Implications for covariation of Vcmax and Jmax and photosynthetic downregulation, J. Geophys. Res.-Biogeo., 121, 2464–2475, https://doi.org/10.1002/2016JG003473, 2016.
Rogers, A.: The use and misuse of Vc,max in Earth System Models, Photosynth. Res., 119, 15–29, https://doi.org/10.1007/s11120-013-9818-1, 2014.
Ryu, Y., Jiang, C., Kobayashi, H., and Detto, M.: MODIS-derived global land products of shortwave radiation and diffuse and total photosynthetically active radiation at 5 km resolution from 2000, Remote Sens. Environ., 204, 812–825, https://doi.org/10.1016/j.rse.2017.09.021, 2018.
Sharma, U., Kataria, V., and Shekhawat, N.: In vitro propagation, ex vitro rooting and leaf micromorphology of Bauhinia racemosa Lam.: a leguminous tree with medicinal values, Physiol. Mol. Biol. Pl., 23, 969–977, https://doi.org/10.1007/s12298-017-0459-2, 2017.
Song, G., Wang, Q., and Jin, J.: Leaf photosynthetic capacity of sunlit and shaded mature leaves in a deciduous forest, Forests, 11, 318, https://doi.org/10.3390/f11030318, 2020.
Spicer, M. E., Radhamoni, H. V. N., Duguid, M. C., Queenborough, S. A., and Comita, L. S.: Herbaceous plant diversity in forest ecosystems: patterns, mechanisms, and threats, Plant Ecolog., 223, 117–129, https://doi.org/10.1007/s11258-021-01202-9, 2022.
Stefanski, A., Bermudez, R., Sendall, K. M., Montgomery, R. A., and Reich, P. B.: Surprising lack of sensitivity of biochemical limitation of photosynthesis of nine tree species to open-air experimental warming and reduced rainfall in a southern boreal forest, Glob. Change Biol., 26, 746–759, https://doi.org/10.1111/gcb.14805, 2020.
Stocker, B. D., Wang, H., Smith, N. G., Harrison, S. P., Keenan, T. F., Sandoval, D., Davis, T., and Prentice, I. C.: P-model v1.0: an optimality-based light use efficiency model for simulating ecosystem gross primary production, Geosci. Model Dev., 13, 1545–1581, https://doi.org/10.5194/gmd-13-1545-2020, 2020.
Sulla-Menashe, D., Woodcock, C. E., and Friedl, M. A.: Canadian boreal forest greening and browning trends: an analysis of biogeographic patterns and the relative roles of disturbance versus climate drivers, Environ. Res. Lett., 13, 014007, https://doi.org/10.1088/1748-9326/aa9b88, 2018.
Sun, J., Sun, J., and Feng, Z.: Modelling photosynthesis in flag leaves of winter wheat (Triticum aestivum) considering the variation in photosynthesis parameters during development, Funct. Plant Biol., 42, 1036–1044, https://doi.org/10.1071/FP15140, 2015.
Tang, H., and Dubayah, R.: Light-driven growth in Amazon evergreen forests explained by seasonal variations of vertical canopy structure. P. Natl. Acad. Sci. USA, 114, 2640-2644. 2017.
Urban, O., Šprtová, M., Košvancová, M., Tomášková, I., Lichtenthaler, H. K., and Marek, M. V.: Comparison of photosynthetic induction and transient limitations during the induction phase in young and mature leaves from three poplar clones, Tree Physiol., 28, 1189–1197, https://doi.org/10.1093/treephys/28.8.1189, 2008.
Verheijen, L. M., Brovkin, V., Aerts, R., Bönisch, G., Cornelissen, J. H. C., Kattge, J., Reich, P. B., Wright, I. J., and van Bodegom, P. M.: Impacts of trait variation through observed trait–climate relationships on performance of an Earth system model: a conceptual analysis, Biogeosciences, 10, 5497–5515, https://doi.org/10.5194/bg-10-5497-2013, 2013.
Wang, S., Li, Y., Ju, W., Chen, B., Chen, J., Croft, H., Mickler, R. A., and Yang, F.: Estimation of Leaf Photosynthetic Capacity From Leaf Chlorophyll Content and Leaf Age in a Subtropical Evergreen Coniferous Plantation, J. Geophys. Res.-Biogeo., 125, e2019JG005020, https://doi.org/10.1029/2019jg005020, 2020.
Wang, X., Chen, J. M., Ju, W., and Zhang, Y.: Seasonal variations in leaf maximum photosynthetic capacity and its dependence on climate factors across global FLUXNET sites, J. Geophys. Res.-Biogeo., 127, e2021JG006709, https://doi.org/10.1029/2021JG006709, 2022.
Weiss, A. and Norman, J. M.: Partitioning solar radiation into direct and diffuse, visible and near-infrared components, Agr. Forest Meteorol., 34, 205–213, https://doi.org/10.1016/0168-1923(85)90020-6, 1985.
Wu, J., Albert, L. P., Lopes, A. P., Restrepo-Coupe, N., Hayek, M., Wiedemann, K. T., Guan, K., Stark, S. C., Christoffersen, B., Prohaska, N., Tavares, J. V., Marostica, S., Kobayashi, H., Ferreira, M. L., Campos, K. S., da Silva, R., Brando, P. M., Dye, D. G., Huxman, T. E., Huete, A. R., Nelson, B. W., and Saleska, S. R.: Leaf development and demography explain photosynthetic seasonality in Amazon evergreen forests, Science, 351, 972–976, https://doi.org/10.1126/science.aad5068, 2016.
Wu, J., Serbin, S. P., Xu, X., Albert, L. P., Chen, M., Meng, R., Saleska, S. R., and Rogers, A.: The phenology of leaf quality and its within-canopy variation is essential for accurate modeling of photosynthesis in tropical evergreen forests, Glob. Change Biol., 23, 4814–4827, https://doi.org/10.1111/gcb.13725, 2017a.
Wu, J., Guan, K., Hayek, M., Restrepo-Coupe, N., Wiedemann, K. T., Xu, X., Wehr, R., Christoffersen, B. O., Miao, G., da Silva, R., de Araujo, A. C., Oliviera, R. C., Camargo, P. B., Monson, R. K., Huete, A. R., and Saleska, S. R.: Partitioning controls on Amazon forest photosynthesis between environmental and biotic factors at hourly to interannual timescales, Glob. Change Biol., 23, 1240–1257, https://doi.org/10.1111/gcb.13509, 2017b.
Wu, J., Kobayashi, H., Stark, S. C., Meng, R., Guan, K., Tran, N. N., Gao, S., Yang, W., Restrepo-Coupe, N., Miura, T., Oliviera, R. C., Rogers, A., Dye, D. G., Nelson, B. W., Serbin, S. P., Huete, A. R., and Saleska, S. R.: Biological processes dominate seasonality of remotely sensed canopy greenness in an Amazon evergreen forest, New Phytol., 217, 1507–1520, https://doi.org/10.1111/nph.14939, 2018.
Xu, M., Liu, R., Chen, J. M., Liu, Y., Wolanin, A., Croft, H., He, L., Shang, R., Ju, W., and Zhang, Y.: A 21-year time series of global leaf chlorophyll content maps from MODIS imagery, IEEE T. Geosci. Remote, 60, 1–13, https://doi.org/10.1109/TGRS.2022.3204185, 2022a.
Xu, M., Liu, R., Chen, J. M., Shang, R., Liu, Y., Qi, L., Croft, H., Ju, W., Zhang, Y., and He, Y.: Retrieving global leaf chlorophyll content from MERIS data using a neural network method, ISPRS J. Photogramm., 192, 66–82, https://doi.org/10.1016/j.isprsjprs.2022.08.003, 2022b.
Xu, X., Medvigy, D., Joseph Wright, S., Kitajima, K., Wu, J., Albert, L. P., Martins, G. A., Saleska, S. R., and Pacala, S. W.: Variations of leaf longevity in tropical moist forests predicted by a trait-driven carbon optimality model, Ecol. Lett., 20, 1097–1106, https://doi.org/10.1111/ele.12804, 2017.
Yang, H., Ciais, P., Wigneron, J.-P., Chave, J., Cartus, O., Chen, X., Fan, L., Green, J. K., Huang, Y., Joetzjer, E., Kay, H., Makowski, D., Maignan, F., Santoro, M., Tao, S., Liu, L., and Yao, Y.: Climatic and biotic factors influencing regional declines and recovery of tropical forest biomass from the 2015/16 El Niño. P. Natl. Acad. Sci. USA, 119, e2101388119, https://doi.org/10.1073/pnas.2101388119, 2022.
Yang, J. T., Preiser, A. L., Li, Z., Weise, S. E., and Sharkey, T. D.: Triose phosphate use limitation of photosynthesis: short-term and long-term effects, Planta, 243, 687–698, https://doi.org/10.1007/s00425-015-2436-8, 2016.
Yang, X., Tang, J., Mustard, J. F., Lee, J.-E., Rossini, M., Joiner, J., Munger, J. W., Kornfeld, A., and Richardson, A. D.: Solar-induced chlorophyll fluorescence that correlates with canopy photosynthesis on diurnal and seasonal scales in a temperate deciduous forest, Geophys. Res. Lett., 42, 2977–2987, https://doi.org/10.1002/2015gl063201, 2015.
Yang, X., Wu, J., Chen, X., Ciais, P., Maignan, F., Yuan, W., Piao, S., Yang, S., Gong, F., Su, Y., Dai, Y., Liu, L., Zhang, H., Bonal, D., Liu, H., Chen, G., Lu, H., Wu, S., Fan, L., Gentine, P., and Wright, S. J.: A comprehensive framework for seasonal controls of leaf abscission and productivity in evergreen broadleaved tropical and subtropical forests, Innovation, 2, 100154, https://doi.org/10.1016/j.xinn.2021.100154, 2021.
Yang, X., Chen, X., Ren, J., Yuan, W., Liu, L., Liu, J., Chen, D., Xiao, Y., Song, Q., Du, Y., Wu, S., Fan, L., Dai, X., Wang, Y., and Su, Y.: A gridded dataset of a leaf-age-dependent leaf area index seasonality product over tropical and subtropical evergreen broadleaved forests, Earth Syst. Sci. Data, 15, 2601–2622, https://doi.org/10.5194/essd-15-2601-2023, 2023.
Yang, X., Sun, Q., Han, L., and Chen, X.: A gridded dataset of young leaf photosynthetic capacity product over tropical and subtropical evergreen broadleaved forests Creators, Zenodo [data set], https://doi.org/10.5281/zenodo.14807414, 2025.
Yuan, W., Zheng, Y., Piao, S., Ciais, P., Lombardozzi, D., Wang, Y., Ryu, Y., Chen, G., Dong, W., Hu, Z., Jain, A. K., Jiang, C., Kato, E., Li, S., Lienert, S., Liu, S., Nabel, J. E. M. S., Qin, Z., Quine, T., Sitch, S., Smith, W. K., Wang, F., Wu, C., Xiao, Z., and Yang, S.: Increased atmospheric vapor pressure deficit reduces global vegetation growth, Sci. Adv., 5, eaax1396, https://doi.org/10.1126/sciadv.aax1396, 2019.
Zhao, Y., Chen, X., Smallman, T. L., Flack-Prain, S., Milodowski, D. T., and Williams, M.: Characterizing the error and bias of remotely sensed LAI Products: An Example for Tropical and Subtropical Evergreen Forests in South China, Remote Sens.-Basel, 12, 3122, https://doi.org/10.3390/rs12193122, 2020.
Zhou, H., Xu, M., Pan, H., and Yu, X.: Leaf-age effects on temperature responses of photosynthesis and respiration of an alpine oak, Quercus aquifolioides, in southwestern China, Tree Physiol., 35, 1236–1248, https://doi.org/10.1093/treephys/tpv101, 2015.