the Creative Commons Attribution 4.0 License.
the Creative Commons Attribution 4.0 License.
 | 08 Jul 2025
Residential heating emissions for the Western Balkans
Eef van Dongen
Olivier Tasse
Air pollution adversely affects health, ecosystems, and infrastructure. In the Western Balkans (Albania, Bosnia and Herzegovina, Kosovo1, Montenegro, the Republic of North Macedonia, and Serbia), the air pollution situation is more adverse than in the European Union in general. Understanding the air quality situation requires high-quality emission data with a high-resolution spatial distribution, especially for enabling remediation efforts, which is lacking in the Western Balkan region.
In this work, we have calculated air pollution emissions from the heating of individual housing units in the Western Balkan region. The basis for the dataset is a geographical dataset of buildings detected from satellite imagery by artificial intelligence (AI) methods. The building data have been combined with geospatial land-use datasets and statistical data for heating needs for residential buildings in the countries included and finally with emission factors to calculate the heating emissions.
Using this novel approach, the resulting datasets provide high-resolution heating emission data for common pollutants and are published as open data (https://doi.org/10.5281/zenodo.13906810, Asker, 2024). When comparing national totals for emissions, the datasets in this work are comparable to other, spatially coarser datasets, though the agreement strongly depends on the fuel usage data for each country/region.
- Article
(13448 KB) - Full-text XML
- BibTeX
- EndNote


The Western Balkans (denoted WB in this work) region has long-standing issues with poor air quality (UNEP, 2024; European Environment Agency, 2024), especially during the winter season. The region has a population of 17 million (World Bank, 2024). While traffic, industries, power production, and residential heating are all considered important sources of air pollution in the region, there is a lack of detailed emission data for all these sectors. Detailed emission data for the most important sectors are vital in order to understand the air pollution situation and to be able to improve the situation. High spatial resolution provides not only a more detailed picture of the sources of air pollution but may improve the quality of atmospheric dispersion modeling and help reveal emission hotspots, which in turn can facilitate effective remediation efforts. Currently, such datasets are lacking for the region (Belis et al., 2019).
Emission data from district heating facilities are available for at least some of the cities in the WB. Data for heating emissions from individual housing units (one- to three-family houses) are very limited, however, even though they are expected to have an important contribution to the total emissions.
The emissions from individual housing units are typically released at a fairly low height (around roof height) and are therefore not dispersed effectively, especially during cold weather and temperature inversions, leading to a high contribution to the concentration of pollutants locally. This makes a detailed description of these emissions even more important.
In this work, we present a novel methodology and resulting dataset for emissions from the heating of individual housing units in the WB, based on building data obtained from artificial intelligence (AI) trained to detect buildings from satellite imagery. The emission dataset has high spatial resolution and covers both urban and rural areas. The dataset is compared with datasets at the regional (European) scale, and suggestions for improving the methodology are discussed. The basic steps to calculate the emissions for residential heating in this work are:
-
Create/obtain dataset of building polygons.
-
Filter out only one- to three-family housing units from the building dataset.
-
Add fuel usage data to each building.
-
Calculate emissions for each building, using data for heating appliance composition and emission factors.
-
Rasterize the emission into a suitable grid.
Section 2 describes the input data that have been used, Sect. 3 describes the methodology and workflow, and Sect. 4 presents the results and discussion.
2.1 Buildings
The starting point is a building dataset for the WB, from the Global ML Building Footprints project (Microsoft, 2024), denoted MLBuildings onwards in this report. For the WB region, the dataset contains about 30 million building polygons. For parts of the Republic of North Macedonia and southeastern Serbia, there are gaps in the MLBuildings dataset. The gaps were replaced by building polygons from the OpenStreetMap project (Open Street Map, 2024). It is worth noting that for those areas, the OpenStreetMap has a fairly low level of coverage of buildings and therefore does not compensate fully for the lack of data in the MLBuildings dataset. An example of building polygons for Novi Travnik (Bosnia and Herzegovina) can be seen in Figs. 1–2.
2.2 Land-use data
CORINE land cover (CLC) (European Environment Agency, 2020a) is a geographic land-use dataset covering Europe, in vector format, with a minimal mapping unit (MMU) of 25 ha. Urban Atlas (UA) (European Environment Agency, 2020b) is a detailed land-use dataset covering European municipalities having at least 100 000 residents, with an MMU of 0.25 ha. The CLC dataset was cut out for the WB region, and the attributes for land-use classes were adjusted to match those of the UA dataset. Further, cutouts were made in the CLC datasets for all cities where UA data were available. Finally, the CLC and UA datasets were merged into a single land-use dataset.
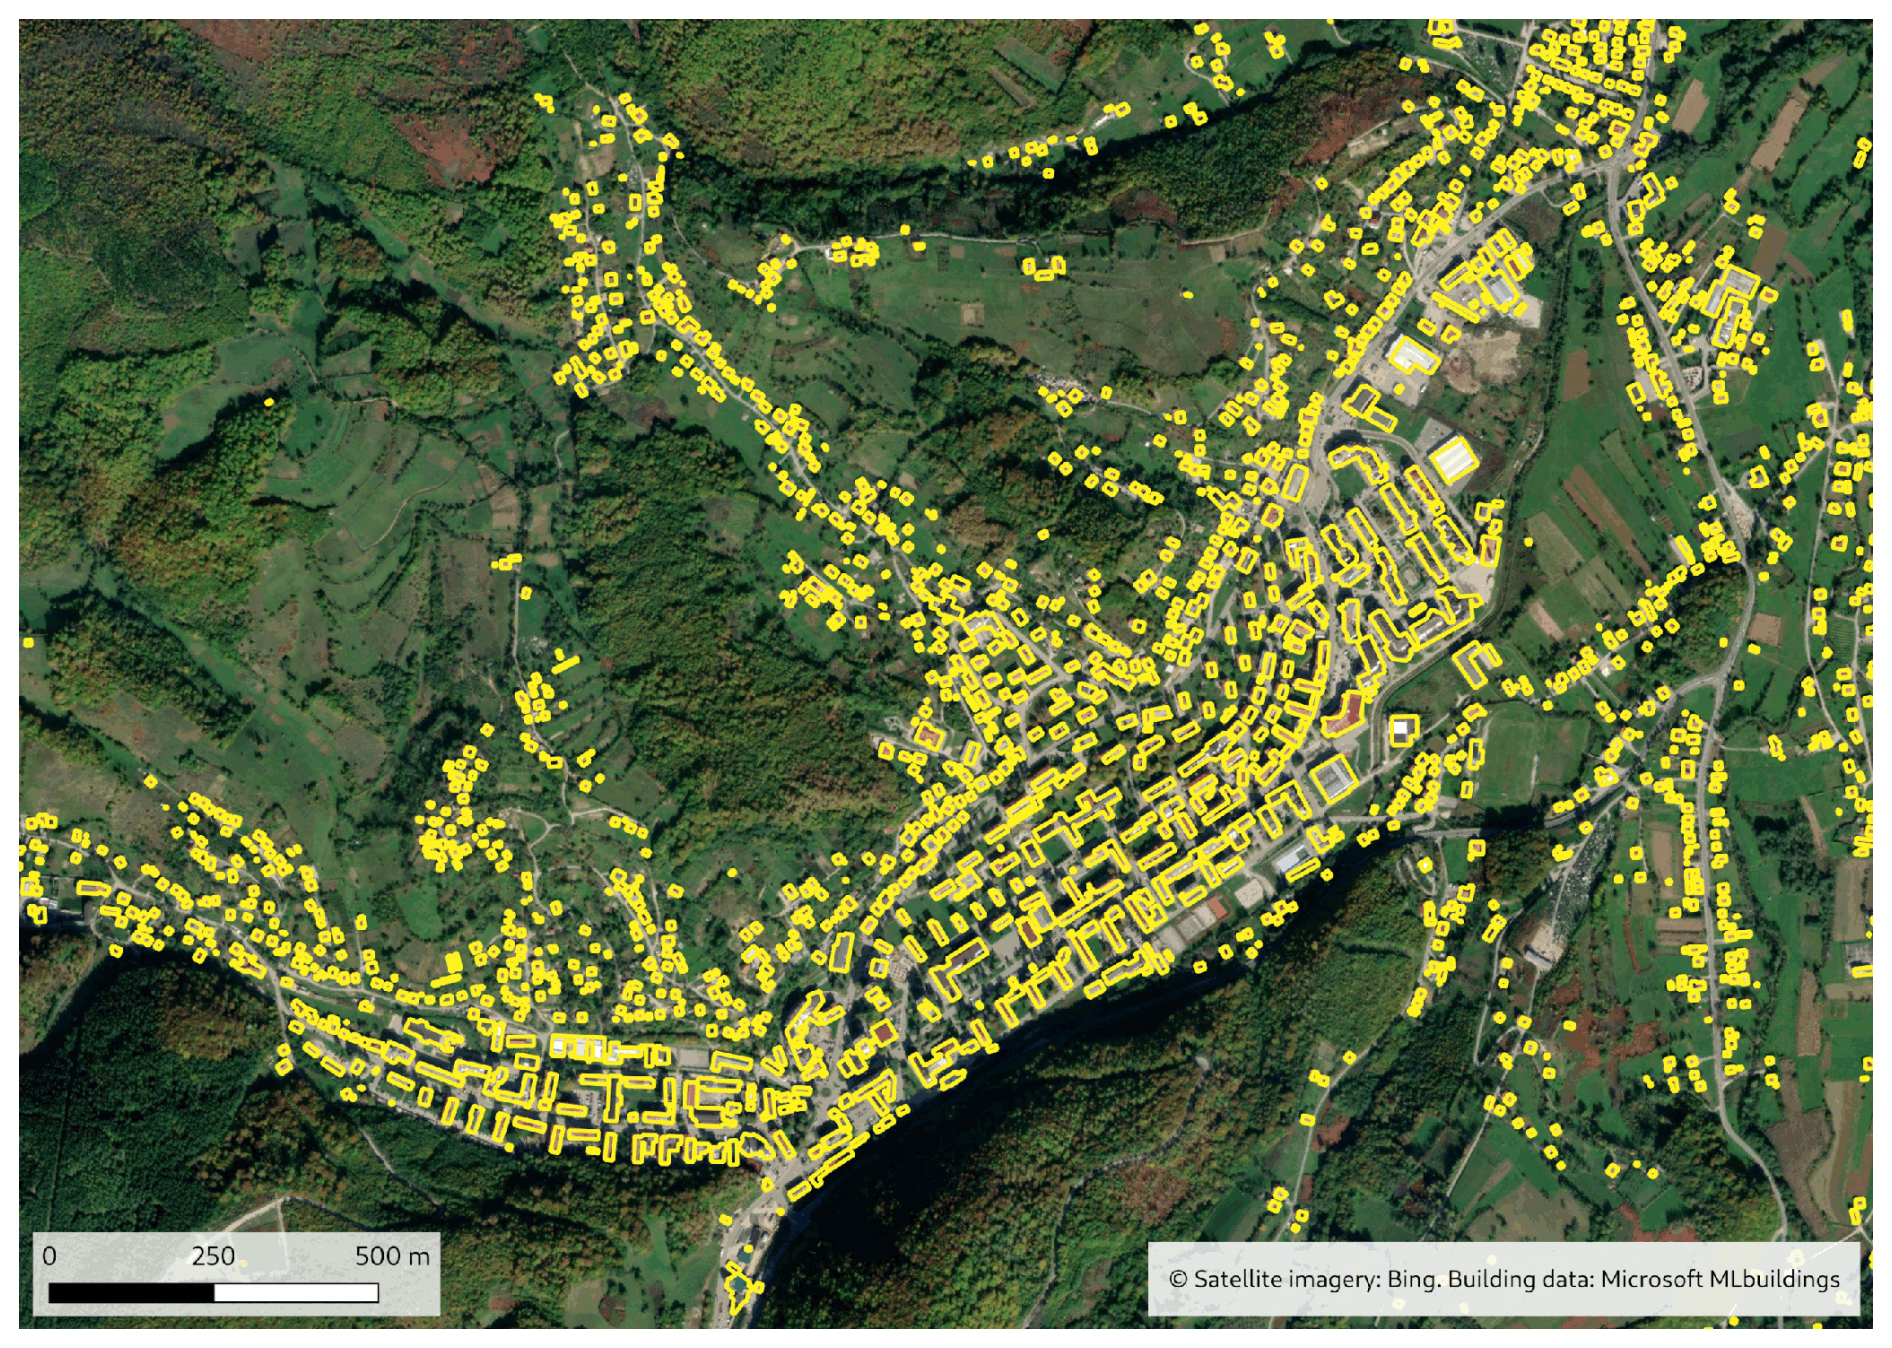
Figure 1Example of the MLBuildings dataset for Novi Travnik (Bosnia and Herzegovina).
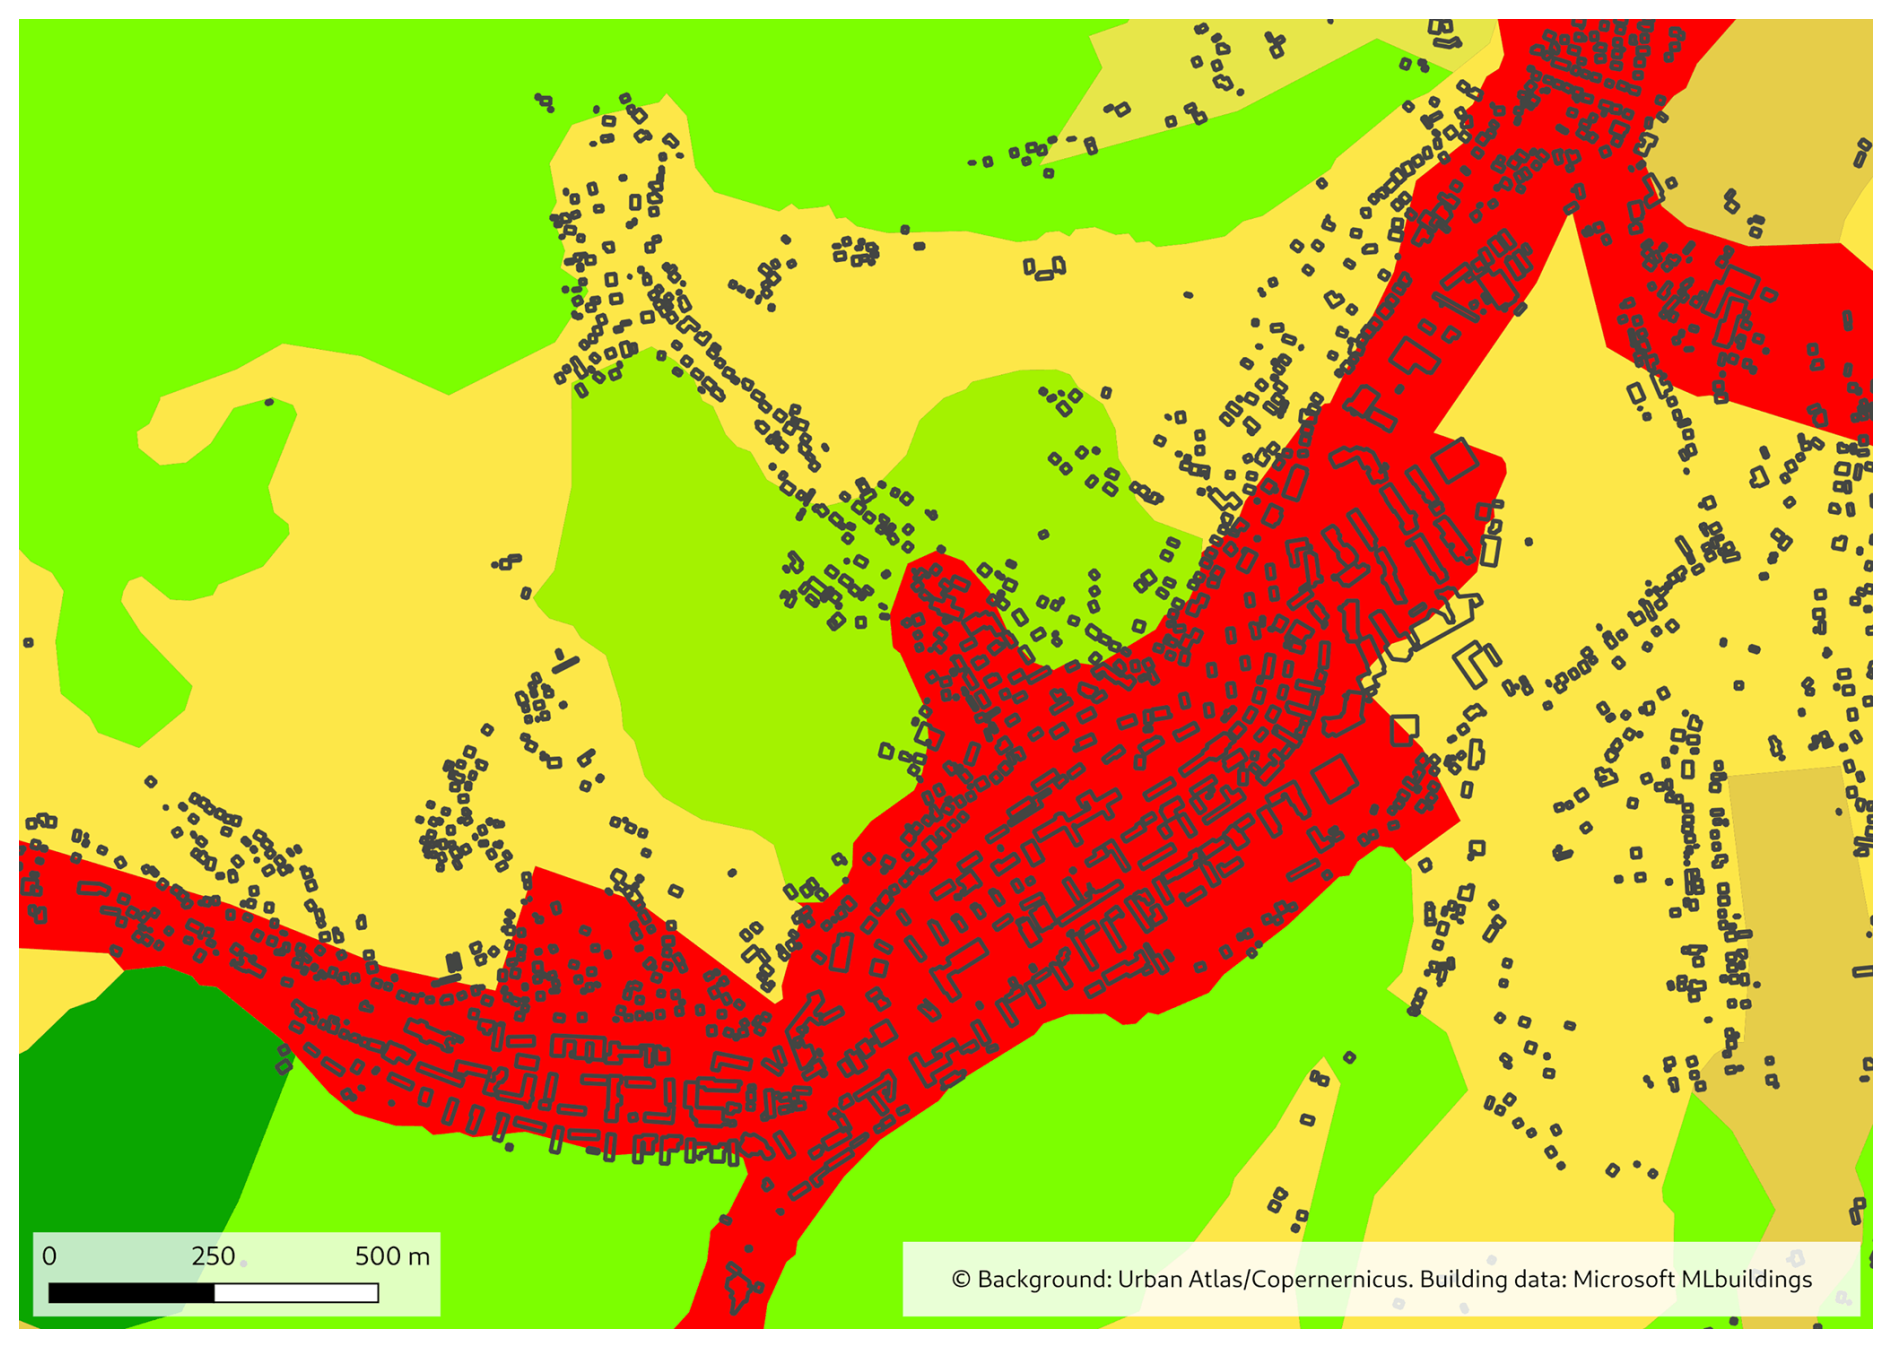
Figure 2Example of the MLBuildings dataset for Novi Travnik (Bosnia and Herzegovina). The map shows the same area as in Fig. 1 but with Urban Atlas and CORINE land cover merged as the background.
2.3 Energy data
The following fuels have been included:
-
wood
-
wood residue
-
pellets
-
coal
-
lpg (liquefied petroleum gas)
-
natural gas
-
oil
For some regions, only a subset of these fuels have been used because the energy usage data available do not contain all fuels for all regions, nor are all fuels used in all regions. See Sect. 3.2 for more details.
In this section, we describe the methodology following the five steps outlined in the introduction. The GIS operations described below used the following software: QGIS (QGIS Development Team, 2021), Python + GeoPandas (Jordahl et al., 2020), and GDAL (GDAL/OGR contributors, 2024).
3.1 Filtering buildings
Starting from the MLBuildings + OpenStreetMap dataset, described in Sect. 2.1, the first step was to remove all buildings that are not one- to three-family housing units. The buildings are all polygons, allowing for calculation of the building footprint area for every building. Incorrect and duplicate geometries were detected and corrected. Then, all buildings having a footprint area less than 50 m2 or more than 200 m2 were removed.
The next step was to determine which of the remaining buildings are located on land that can have housing. The land-use dataset (CLC and UA combined, as described above) was combined with the buildings dataset so that each building polygon also had attributes for land use. This means that each building has a land-use category associated with it, such as “Industrial or commercial units” or “Continuous urban fabric”. Using this information (combined with the filtering of the footprint area described above) for each building, it was then possible to filter out buildings unlikely to be one- to three-family housing units.
The following land-use classes2 were assumed to possibly contain some degree of one- to three-family housing units:
-
11100 Continuous urban fabric
-
11200 Discontinuous urban fabric
-
11210 Discontinuous dense urban fabric (S.L.: 50 %–80 %)
-
11220 Discontinuous medium-density urban fabric (S.L.: 30 %–50 %)
-
11230 Discontinuous low-density urban fabric (S.L.: 10 %–30 %)
-
11240 Discontinuous very-low-density urban fabric (S.L. < 10 %)
-
11300 Isolated structures
-
21000 Arable land (annual crops)
-
21100 Non-irrigated arable land
-
21200 Permanently irrigated land
-
21300 Rice fields
-
22000 Permanent crops
-
22100 Vineyards
-
22200 Fruit trees and berry plantations
-
22300 Olive groves
-
23000 Pastures
-
23100 Pastures
-
24000 Complex and mixed cultivation patterns
-
24100 Annual crops associated with permanent crops
-
24200 Complex cultivation patterns
-
24300 Land principally occupied by agriculture with significant areas of natural vegetation
All buildings belonging to land-use classes other than the above were removed from the dataset. While some of the above land-use classes are mainly agricultural lands, it can be seen, from random sampling of the dataset, that those land-use classes may contain housing, in particular for areas close to smaller settlements, though the extent of this is different in different subregions of the WB region. An example image of the buildings dataset after filtering is shown in Fig. 3.
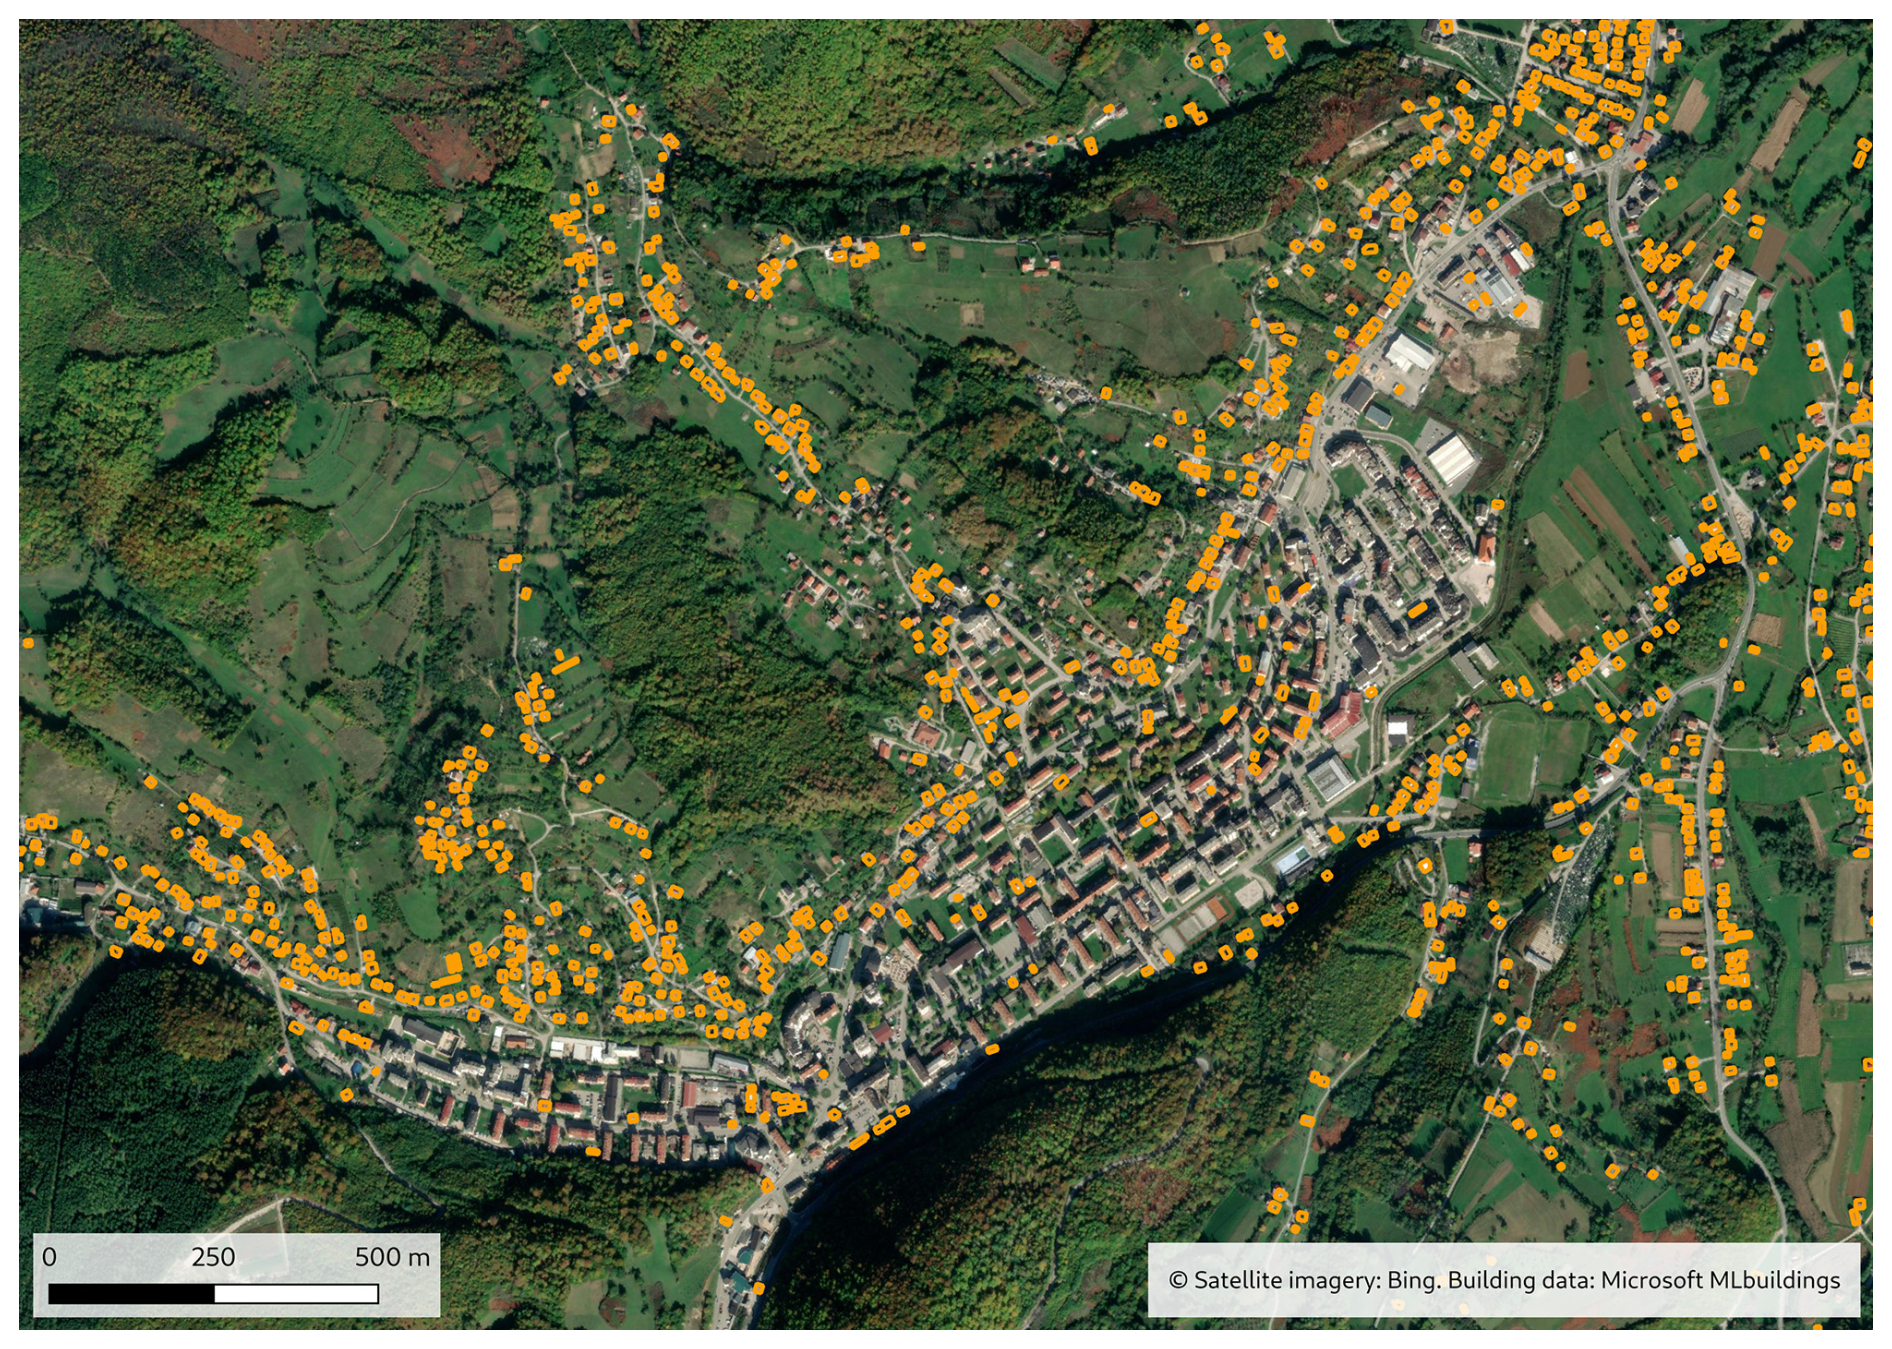
Finally, because the area of each individual house is hard to estimate correctly from the MLBuildings dataset, the polygon geometries are not needed, and therefore we convert the polygon layer into centroid points. The outline area size of each individual building is not used to calculate the heating energy needs.
3.1.1 Additional filtering for Bosnia and Herzegovina and Serbia
Comparing the resulting dataset with statistics in the Typology of Residential Buildings in Bosnia and Herzegovina (Arnautović-Aksić et al., 2016) and National Typology of Residential Buildings in Serbia (Jovanović Popović and Ignjatović, 2013) showed that the number of buildings in the dataset was still quite large. Especially for land-use categories where there is a considerable mix of housing and smaller farm buildings, this is likely to be a problem, leading to a possible overestimation of energy usage for such areas.
For such areas in Bosnia-Herzegovina and Serbia, by using nearest-neighbor analysis, all buildings that were within 20 m from another building were selected for the land-use categories 23100, 24200, and 24300. Of these selected buildings, half were randomly removed. Though these operations reduced the number of buildings for Bosnia-Herzegovina and Serbia, the dataset still contained more buildings than the Typology of Residential Buildings in Bosnia and Herzegovina, which may lead to an overestimation of energy usage and therefore emissions there. This is further discussed in the results section.
3.1.2 Removing erroneous building detections in North Macedonia
For the region surrounding Strumica in North Macedonia, an issue was discovered during the building analysis. In this area, the MLBuildings AI software detected a large number of large buildings outside urban areas. Most of these were, in fact, greenhouses and agricultural lands that had been covered with semi-transparent cloth, leading to the erroneously detected buildings. An example of this is shown in Fig. 4.
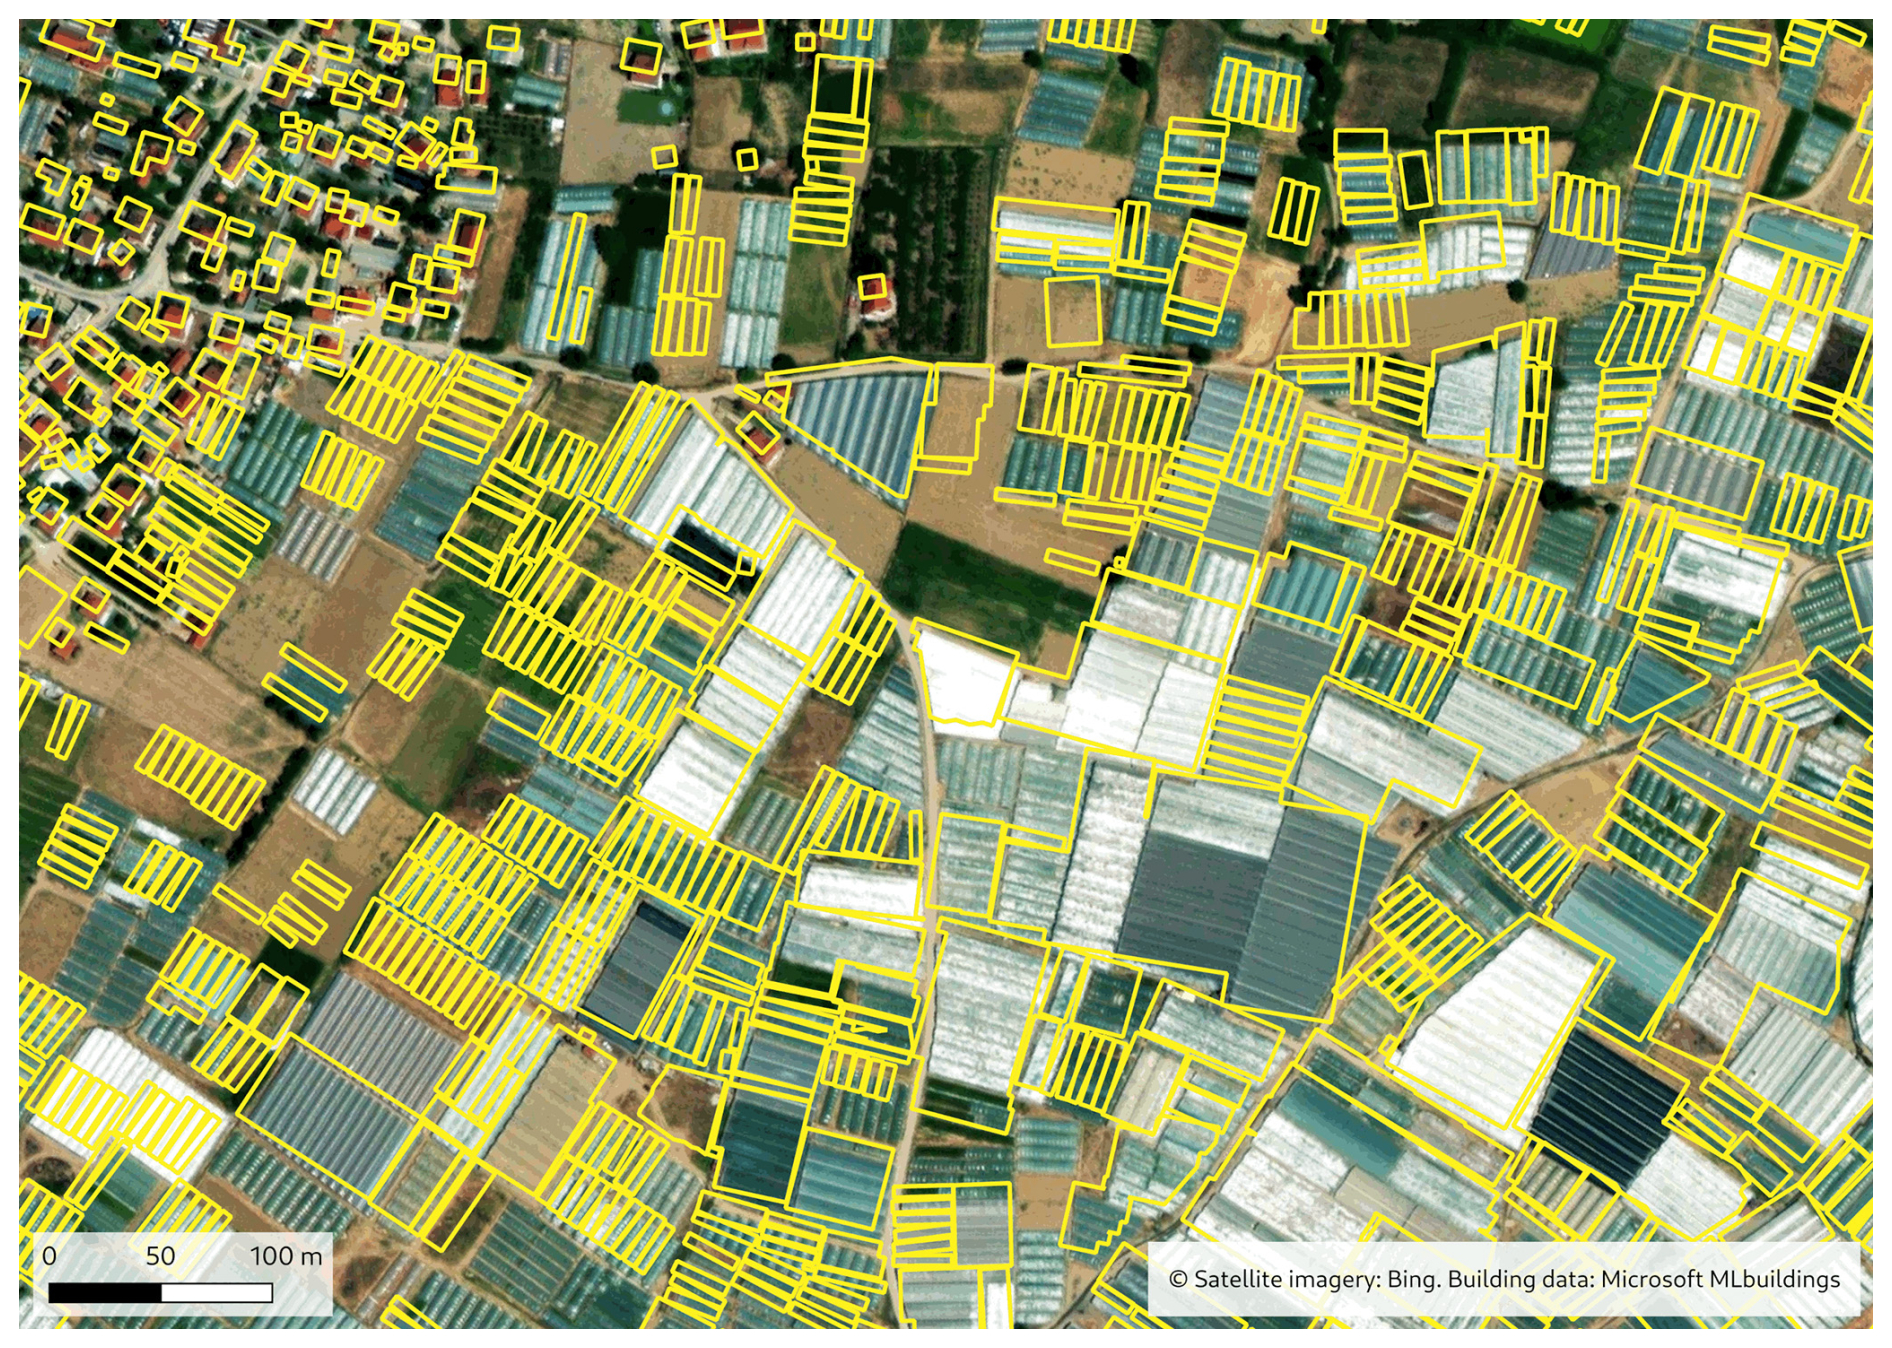
Figure 4False positive building detection on agricultural lands surrounding Strumica, before filtering of such features.
In order to solve this issue, the bounding boxes (width, length, and angle) of each building polygon were calculated. Then, all buildings having very long, narrow shapes (width length <0.3) were removed, which removed these structures without removing buildings that should be kept in the dataset. This filtering step was verified by visual inspection of the dataset to make sure that only the right objects were removed.
3.2 Energy estimation
At each building point, energy consumption for the different fuels was assigned based on available statistical data. The data provide the energy usage per fuel per one- to three-family housing unit. The level of detail, in terms of geographical regions and fuels, varies between the different data sources. Each building point in the dataset was processed to calculate the energy usage.
-
Albania. Region-wise energy usage data (three climate zones), from Novikova et al. (2015b).
-
Bosnia-Herzegovina. Entity-based energy usage statistics used, from Arnautović-Aksić et al. (2016) and Korajčević (2015).
-
Kosovo. The same data as for Serbia.
-
Montenegro. National totals from Eurostat. We assume that all biomass fuels are used for individual housing. The resulting fuel-usage per housing unit is then adjusted for different regions based on degree-days from Novikova et al. (2018).
-
North Macedonia. Statistics for each administrative region (Simovski, 2019).
-
Serbia. The same data for the whole country, based on Jovanović Popović and Ignjatović (2013).
The full table of energy data used is shown in Table A1 in the Appendix. It is worth noting that, for regions that do not list any usage of wood residues, wood residues may be included in the fuel category wood. This uncertainty stems from the different sources of fuel data, which are based on surveys that use varying fuel categories and varying methodologies.
3.3 Emissions to air
Once the energy use for each fuel has been assigned to all building points, the resulting emissions for the relevant pollutants may be calculated. The methodology follows the EEA guidebook (European Environment Agency, 2023) for emission factors as well as the composition of heating appliances. For each building point, emissions were calculated for each fuel, based on the composition of heating appliances and the emission factors for each appliance. The following pollutants were included in the dataset: PM10, PM2.5, NOx, and SOx.
As an example to illustrate the emission calculations, we consider wood fuel in Serbia. The EEA guidebook lists the appliance composition as 94 % stove, 5 % single house boiler, automatic feed (denoted shba below), and 1 % single house boiler, manual feed (denoted shbm below). For each substance, the effective emission factor for a single house is then the weighted average of the emission factors for the three appliances:
For each combination of fuel and appliance type, the EEA guidebook contains a suggested emission factor for each substance, which was used in this work.
The MLBuildings dataset contains data based on satellite imagery captured during multiple years, from 2014 and onwards. Therefore, the buildings dataset in itself does not correspond to a single, well-defined year. Similarly, the energy usage data represent multiple years, i.e., 2015–2020, while the appliance composition data in the EEA guidebook are for the year 2010. The yearly change in heating emissions from one- to three-family housing units is not expected to vary considerably between the years in the period 2010–2020. We therefore set the year to be 2019, as it is the most recent year in the period that was not affected by the COVID pandemic.
Finally, the point-wise emissions were rasterized into grids for each substance, with 500×500 m horizontal resolution, in the ETRS89-extended/LAEA Europe projection (EPSG:3035). While the calculations of energy and subsequently emissions were done for centroid points for all buildings, the data were rasterized into cells because they might otherwise seem to be more detailed and accurate than they actually are. Further, when using the resulting dataset for atmospheric dispersion modeling or similar, it is computationally more efficient to treat the data as rasters.
4.1 Buildings per country
Table 1 list the number of buildings together with estimates from other sources. Also listed is the percentage of urban buildings, calculated from the number of buildings in all urban land-use categories (land-use code ≤11240 in Sect. 2.2). The other sources (references are listed in the table) are different statistical reports and not from national databases of building permits or similar. It is also worth noting that in the different references, the categorization of buildings may differ. As far as possible, we have compared the number of buildings in this work to one- to three-family housing units in the references.
For several countries, the agreement is fairly good, especially for Albania, the Republic of North Macedonia, and Serbia. For Kosovo and especially for Bosnia and Herzegovina, the methodology used in this work leads to considerably more buildings, 9 % and 30 % more, respectively. The resulting number of buildings for Bosnia and Herzegovina may be overestimated, though this is uncertain because there is a lack of independent housing data. It is also uncertain what could cause such overestimation.
Inspection of a random selection of locations suggests that the high number of buildings for Bosnia and Herzegovina is due to the dataset having too many buildings in rural areas where there are smaller farms. This consideration is also supported by the percentage of urban buildings in the dataset, which is considerably lower for Bosnia and Herzegovina (and Montenegro) than for the other countries. This may have a larger effect in Bosnia and Herzegovina than in the other countries. However, the percentage of urban buildings may very well be different in the different WB countries. There are also uncertainties in the references for the number of residential buildings. In order to determine the accuracy of the number of buildings, more independent datasets are required.
Novikova et al. (2015b)Arnautović-Aksić et al. (2016)Kosovo agency of statistics (2022)Novikova et al. (2015a)Gjorgjievska (2021)Mkl (2021)Jovanović Popović and Ignjatović (2013)Table 1Total number of one- to three-family houses for the WB countries, obtained from the methodology in this work, compared to other statistical sources.
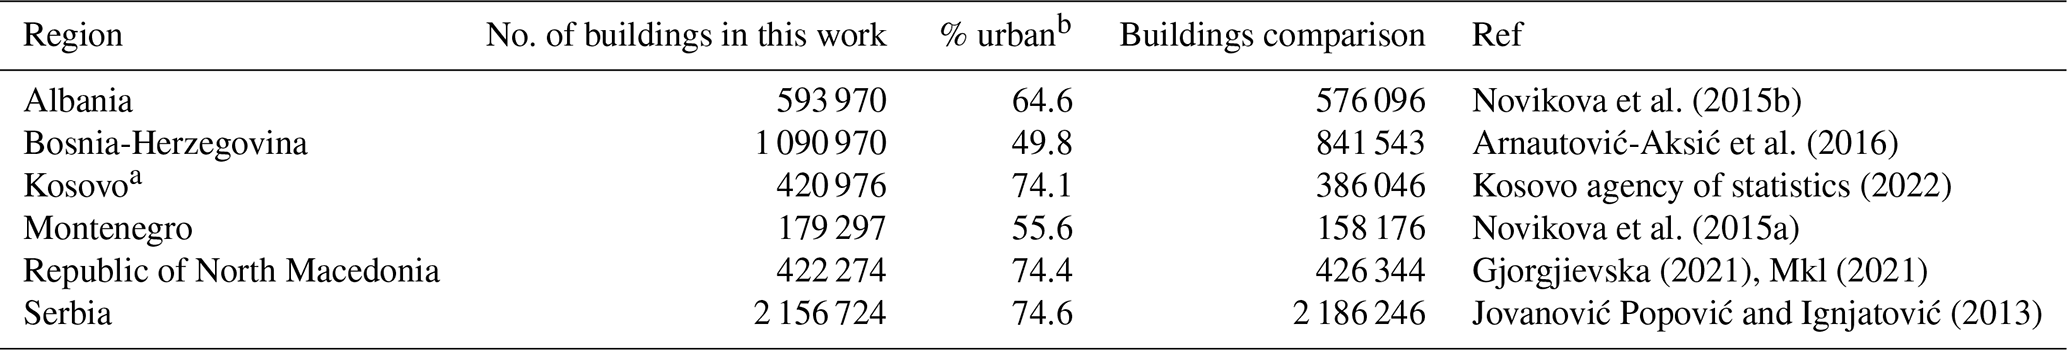
a All references to Kosovo in this document shall be understood to be in the context of the United Nations Security Council resolution 1244 (1999). b Percentage of buildings in this work that are in urban land-use categories. See text for more details.
4.2 Energy
In Fig. 5, the total energy is shown. All building points have been rasterized to a 500×500 m grid. It is worth noting some of the different patterns that can be seen in this image, particularly one in Serbia in which the northern part lies on a plateau and has large agricultural areas with settlements in fairly concentrated villages, leading to a “dotted” pattern in the image. The southwestern part of Serbia, on the other hand, is more mountainous and has smaller agricultural areas scattered between the mountains; the settlements are also more scattered into smaller pieces. This leads to a more continuous pattern in the image.
When comparing the countries in the Western Balkans in this image, it is worth noting that the calculated result in Fig. 5 depends on both the number of buildings and the statistical data for heating energy needs.
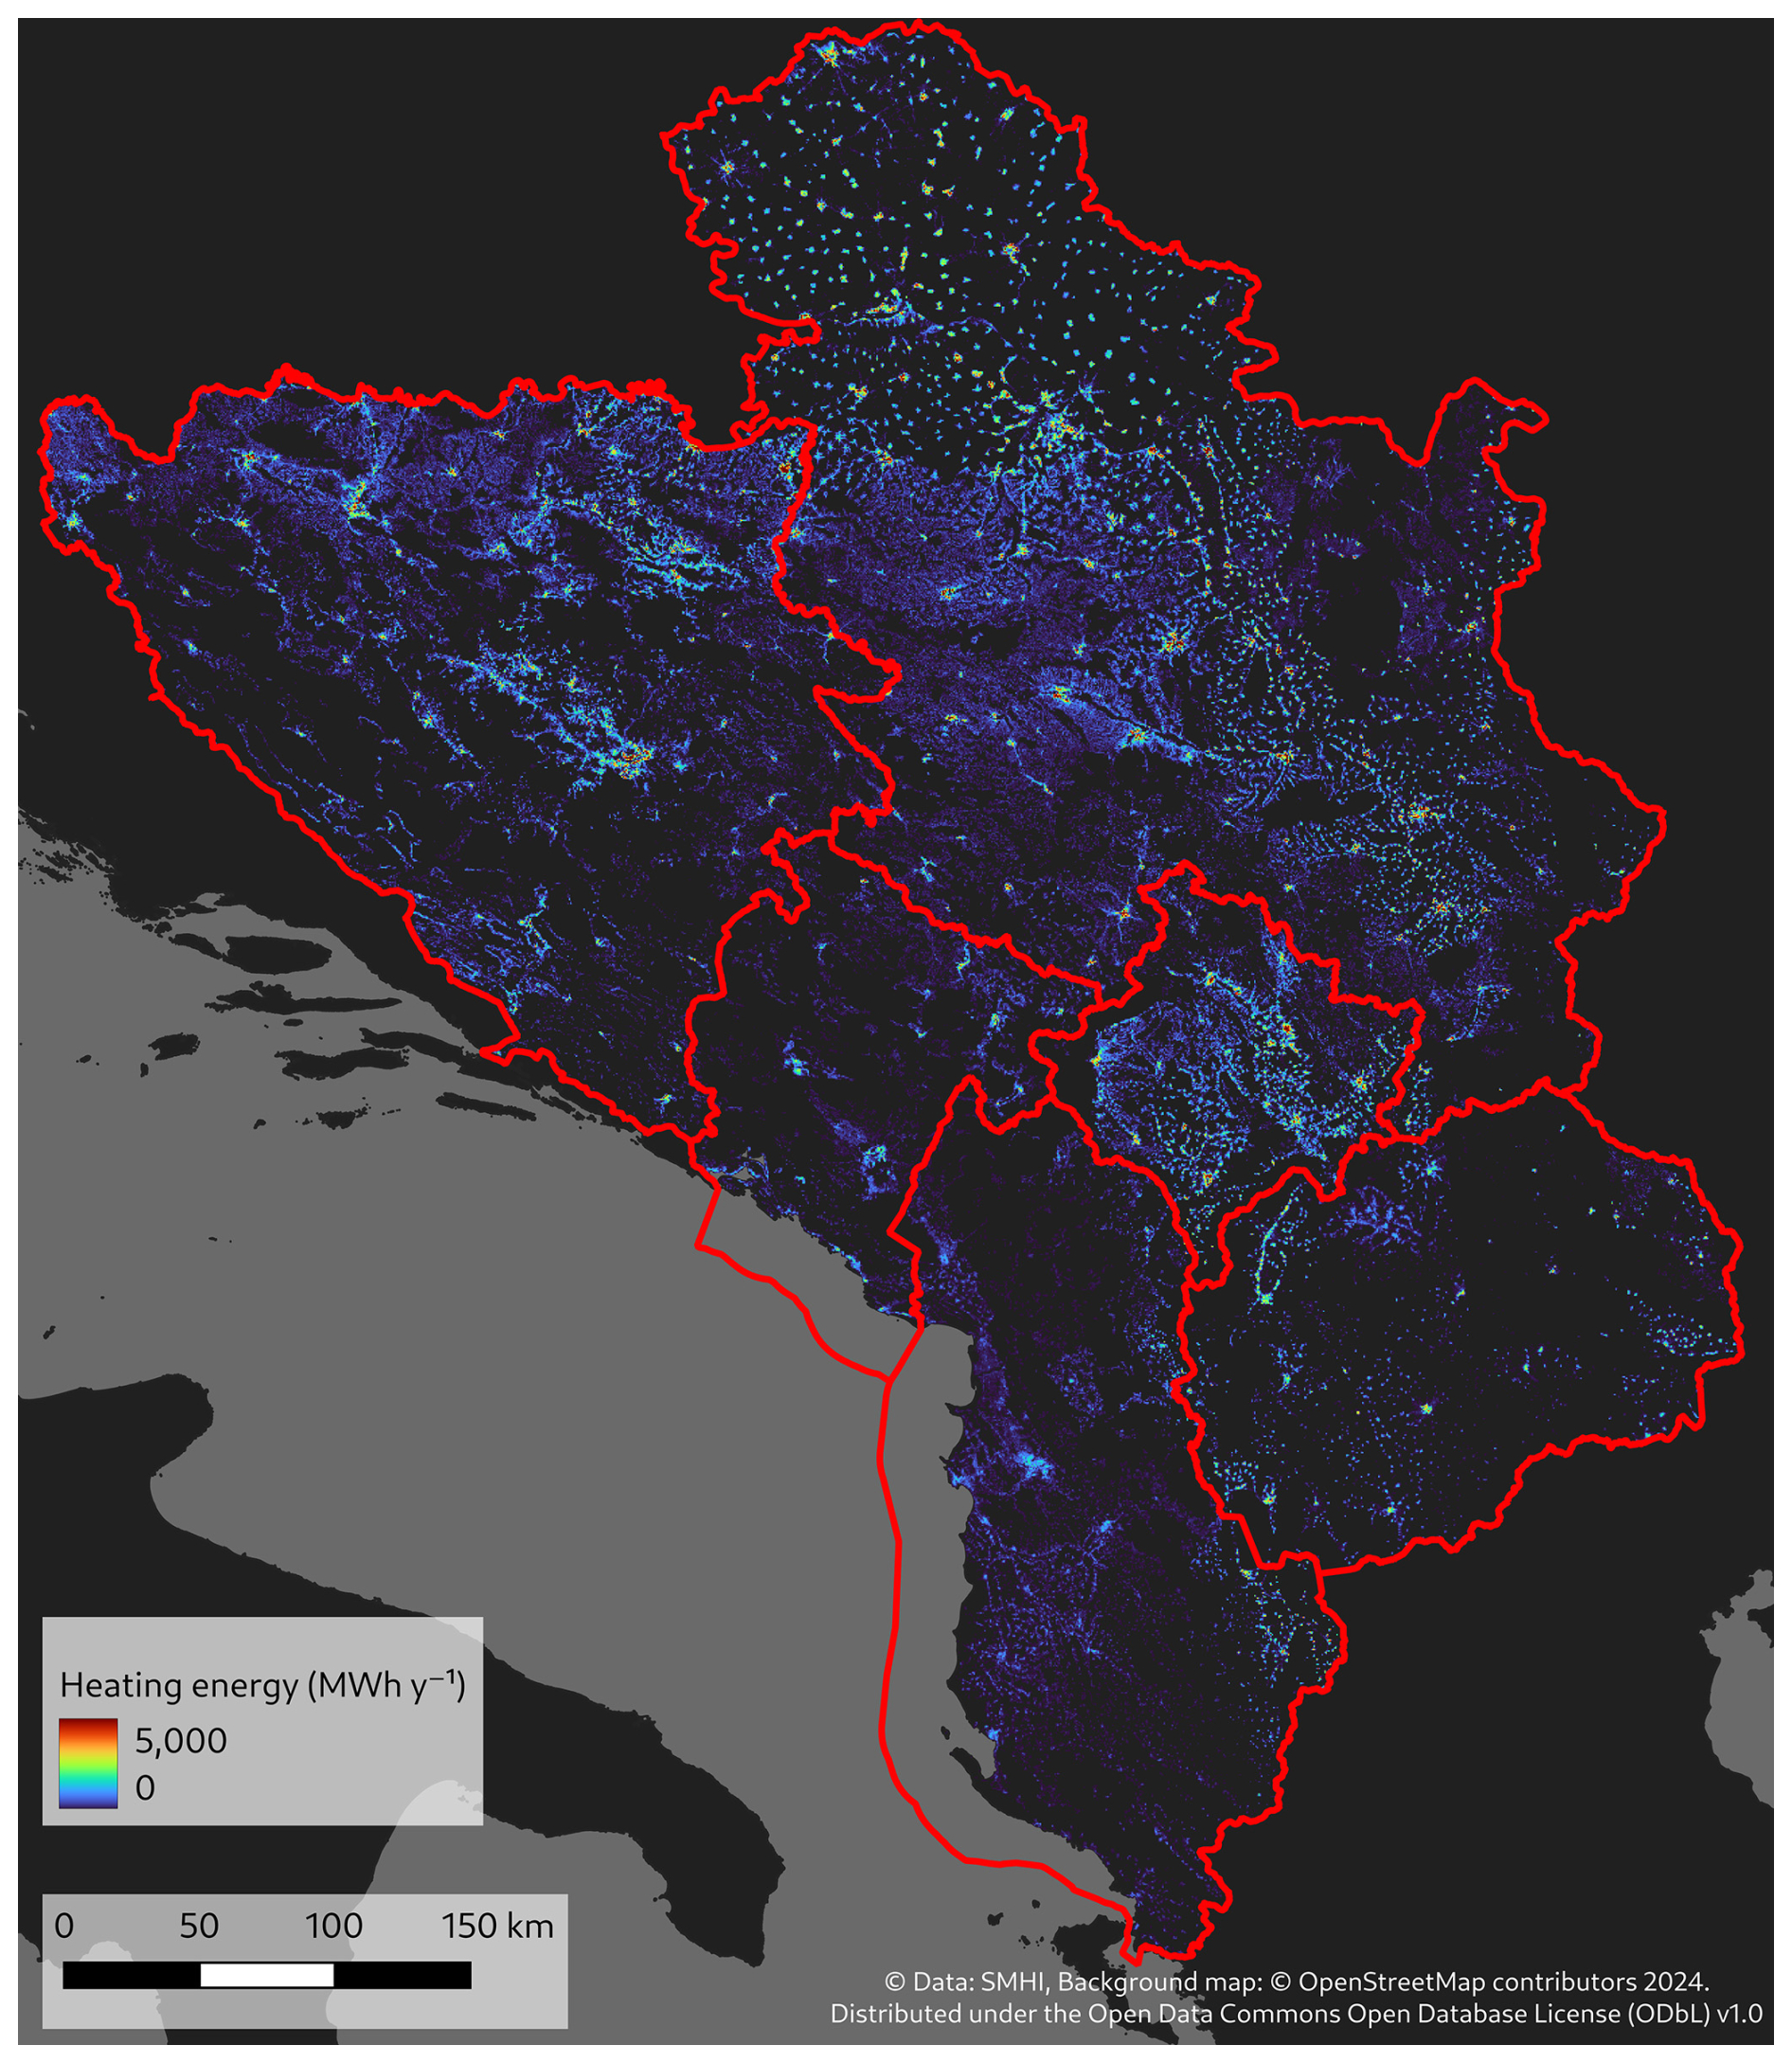
Figure 5Estimated total energy use for heating in individual houses, rasterized to 500×500 m. All references to Kosovo in this document shall be understood to be in the context of the United Nations Security Council resolution 1244 (1999). The red line shows country borders, including territorial waters for countries having coastlines.
An uncertainty not included in this study is the fraction of residential buildings that are not in use. This has not been included due to a lack of available data.
4.3 Emission data
Maps of emission data for PM2.5, NOx, and SOx are shown in Figs. 6, 7, and 8. Note that the scales in the figures are different. PM10 is not shown, as it is very similar to PM2.5, which is expected for heating emissions due to the fact that most of the particles from combustion in PM10 are fine particles (PM2.5). Both PM2.5 and NOx show similar patterns, while for SOx, the emissions in Montenegro, Albania, and the Republic of Northern Macedonia are much lower compared to the other countries. This is an effect of the heating energy data for different fuels, which are very low or zero for coal in these three countries, leading to very low SOx emissions.
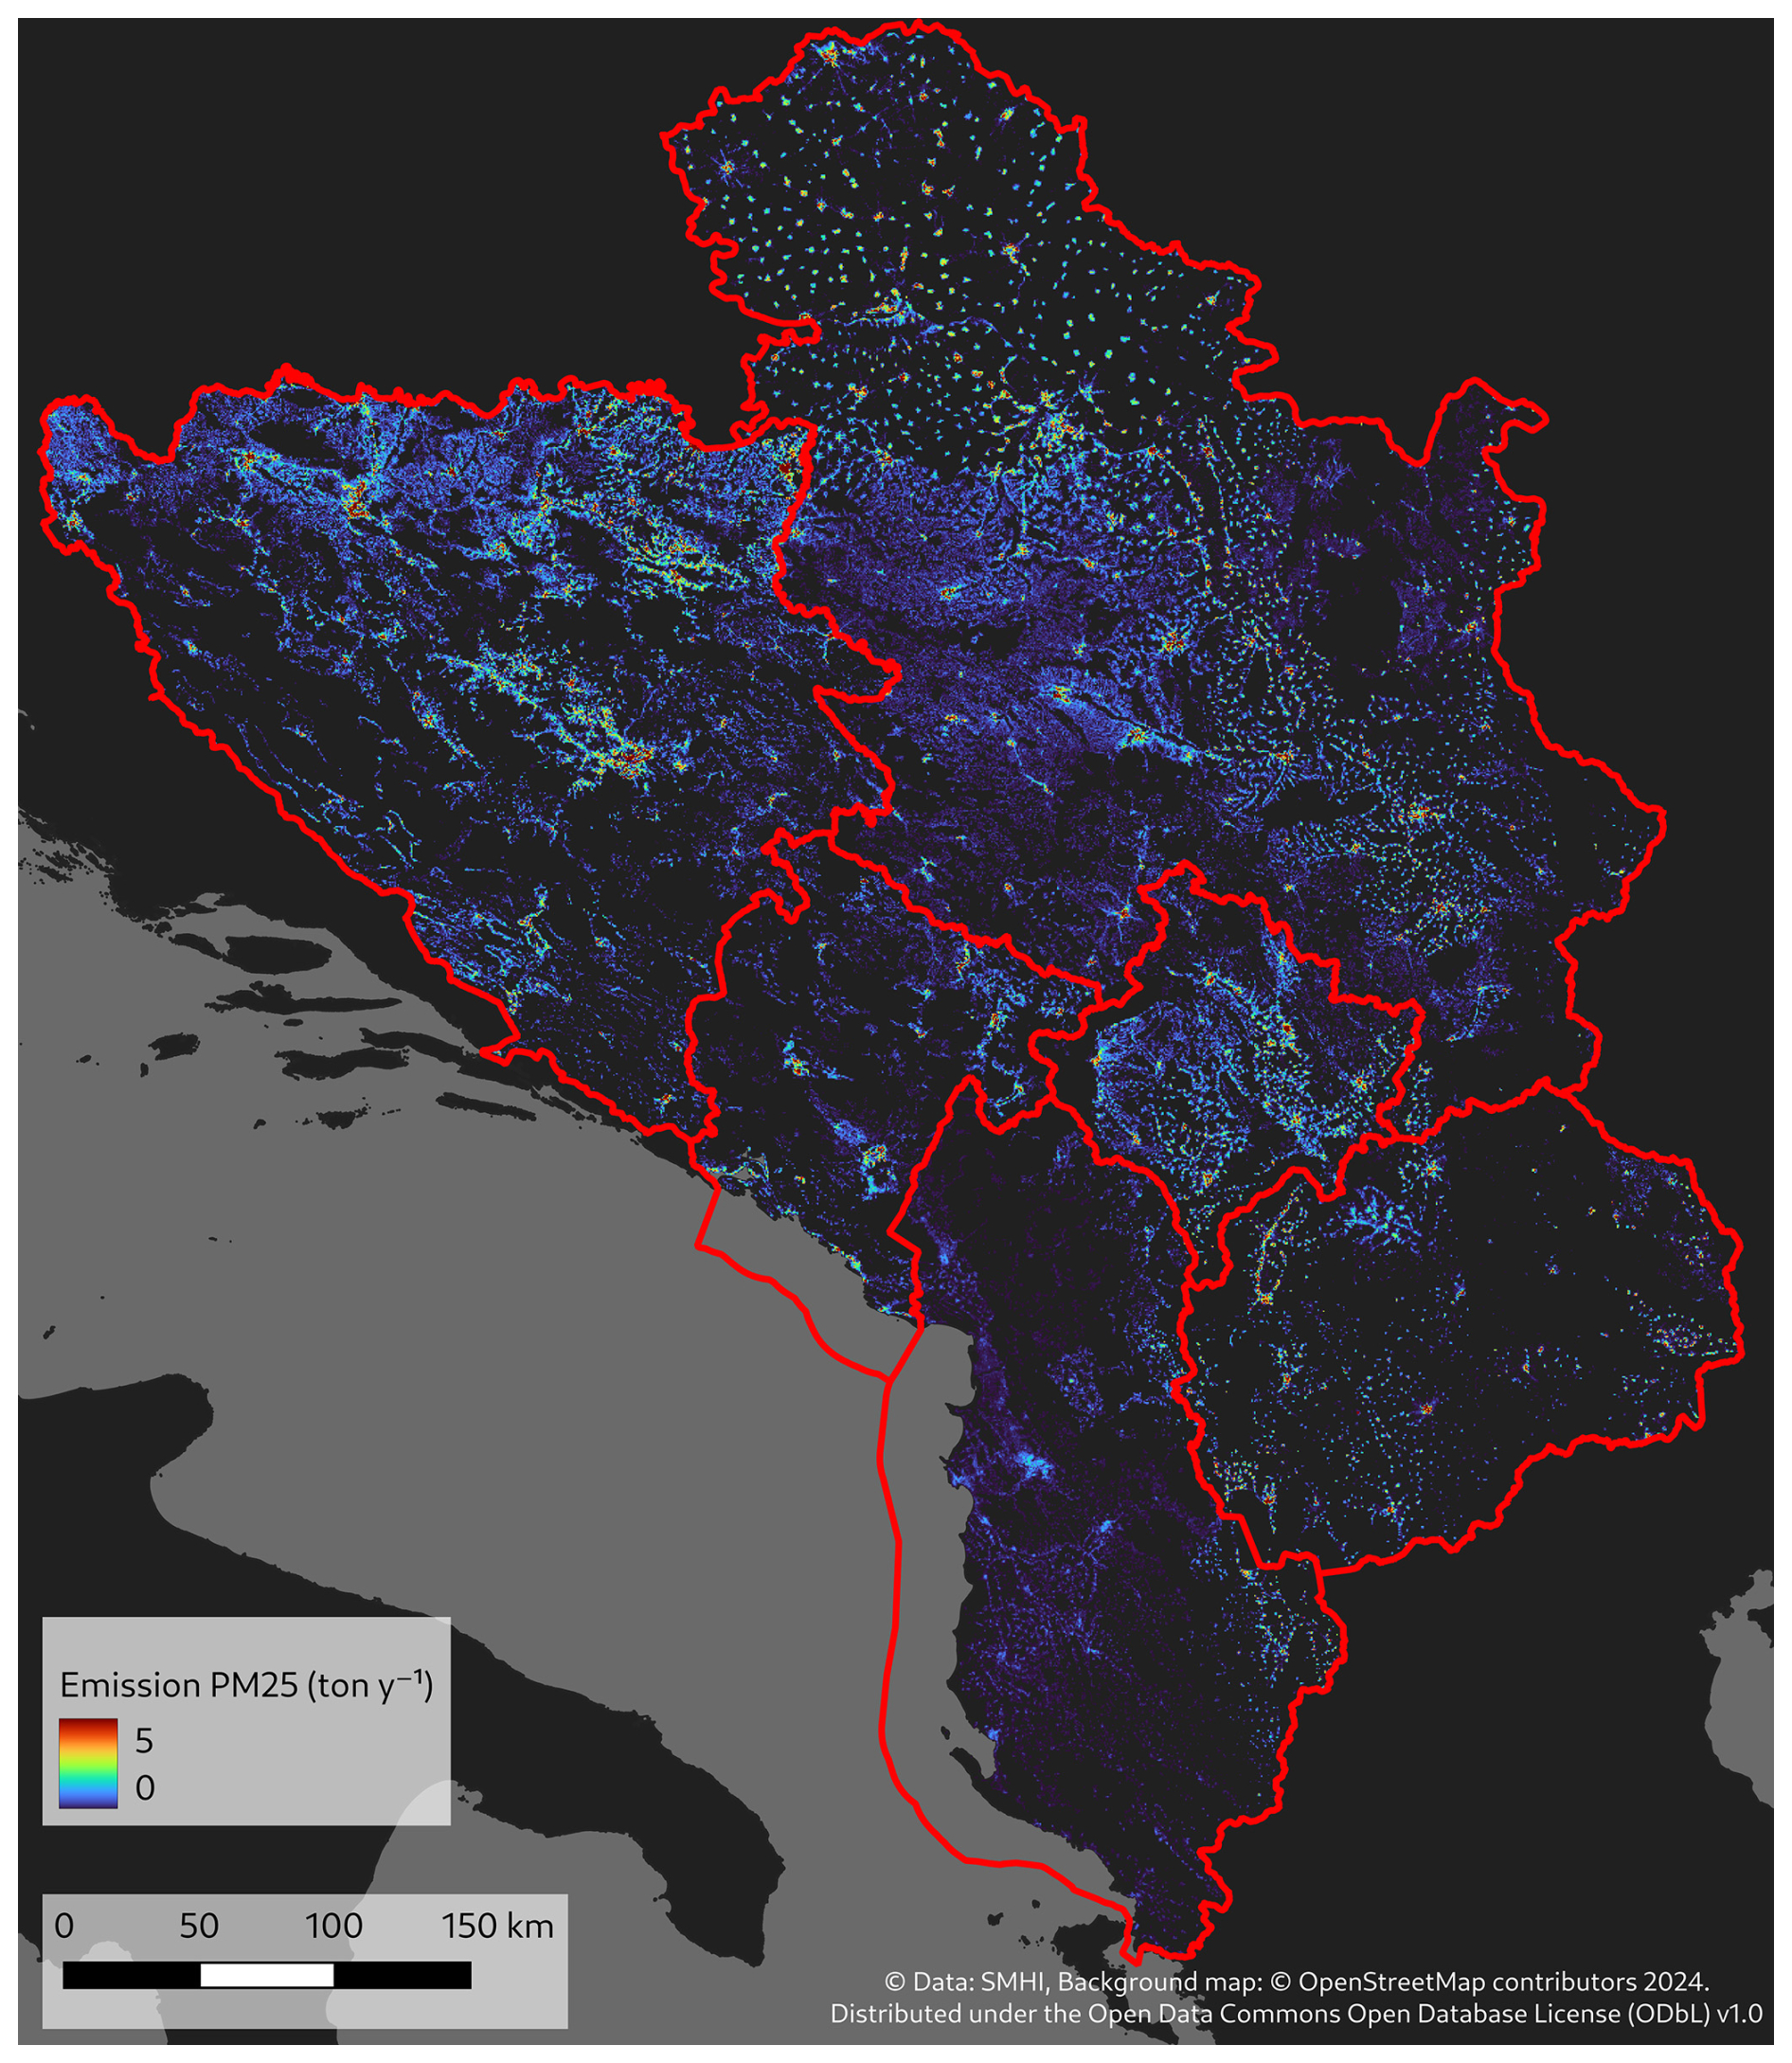
Figure 6Calculated emissions for the Western Balkans for PM2.5, rasterized to 500×500 m. All references to Kosovo in this document shall be understood to be in the context of the United Nations Security Council resolution 1244 (1999). The red line shows country borders, including territorial waters for countries having coastlines.
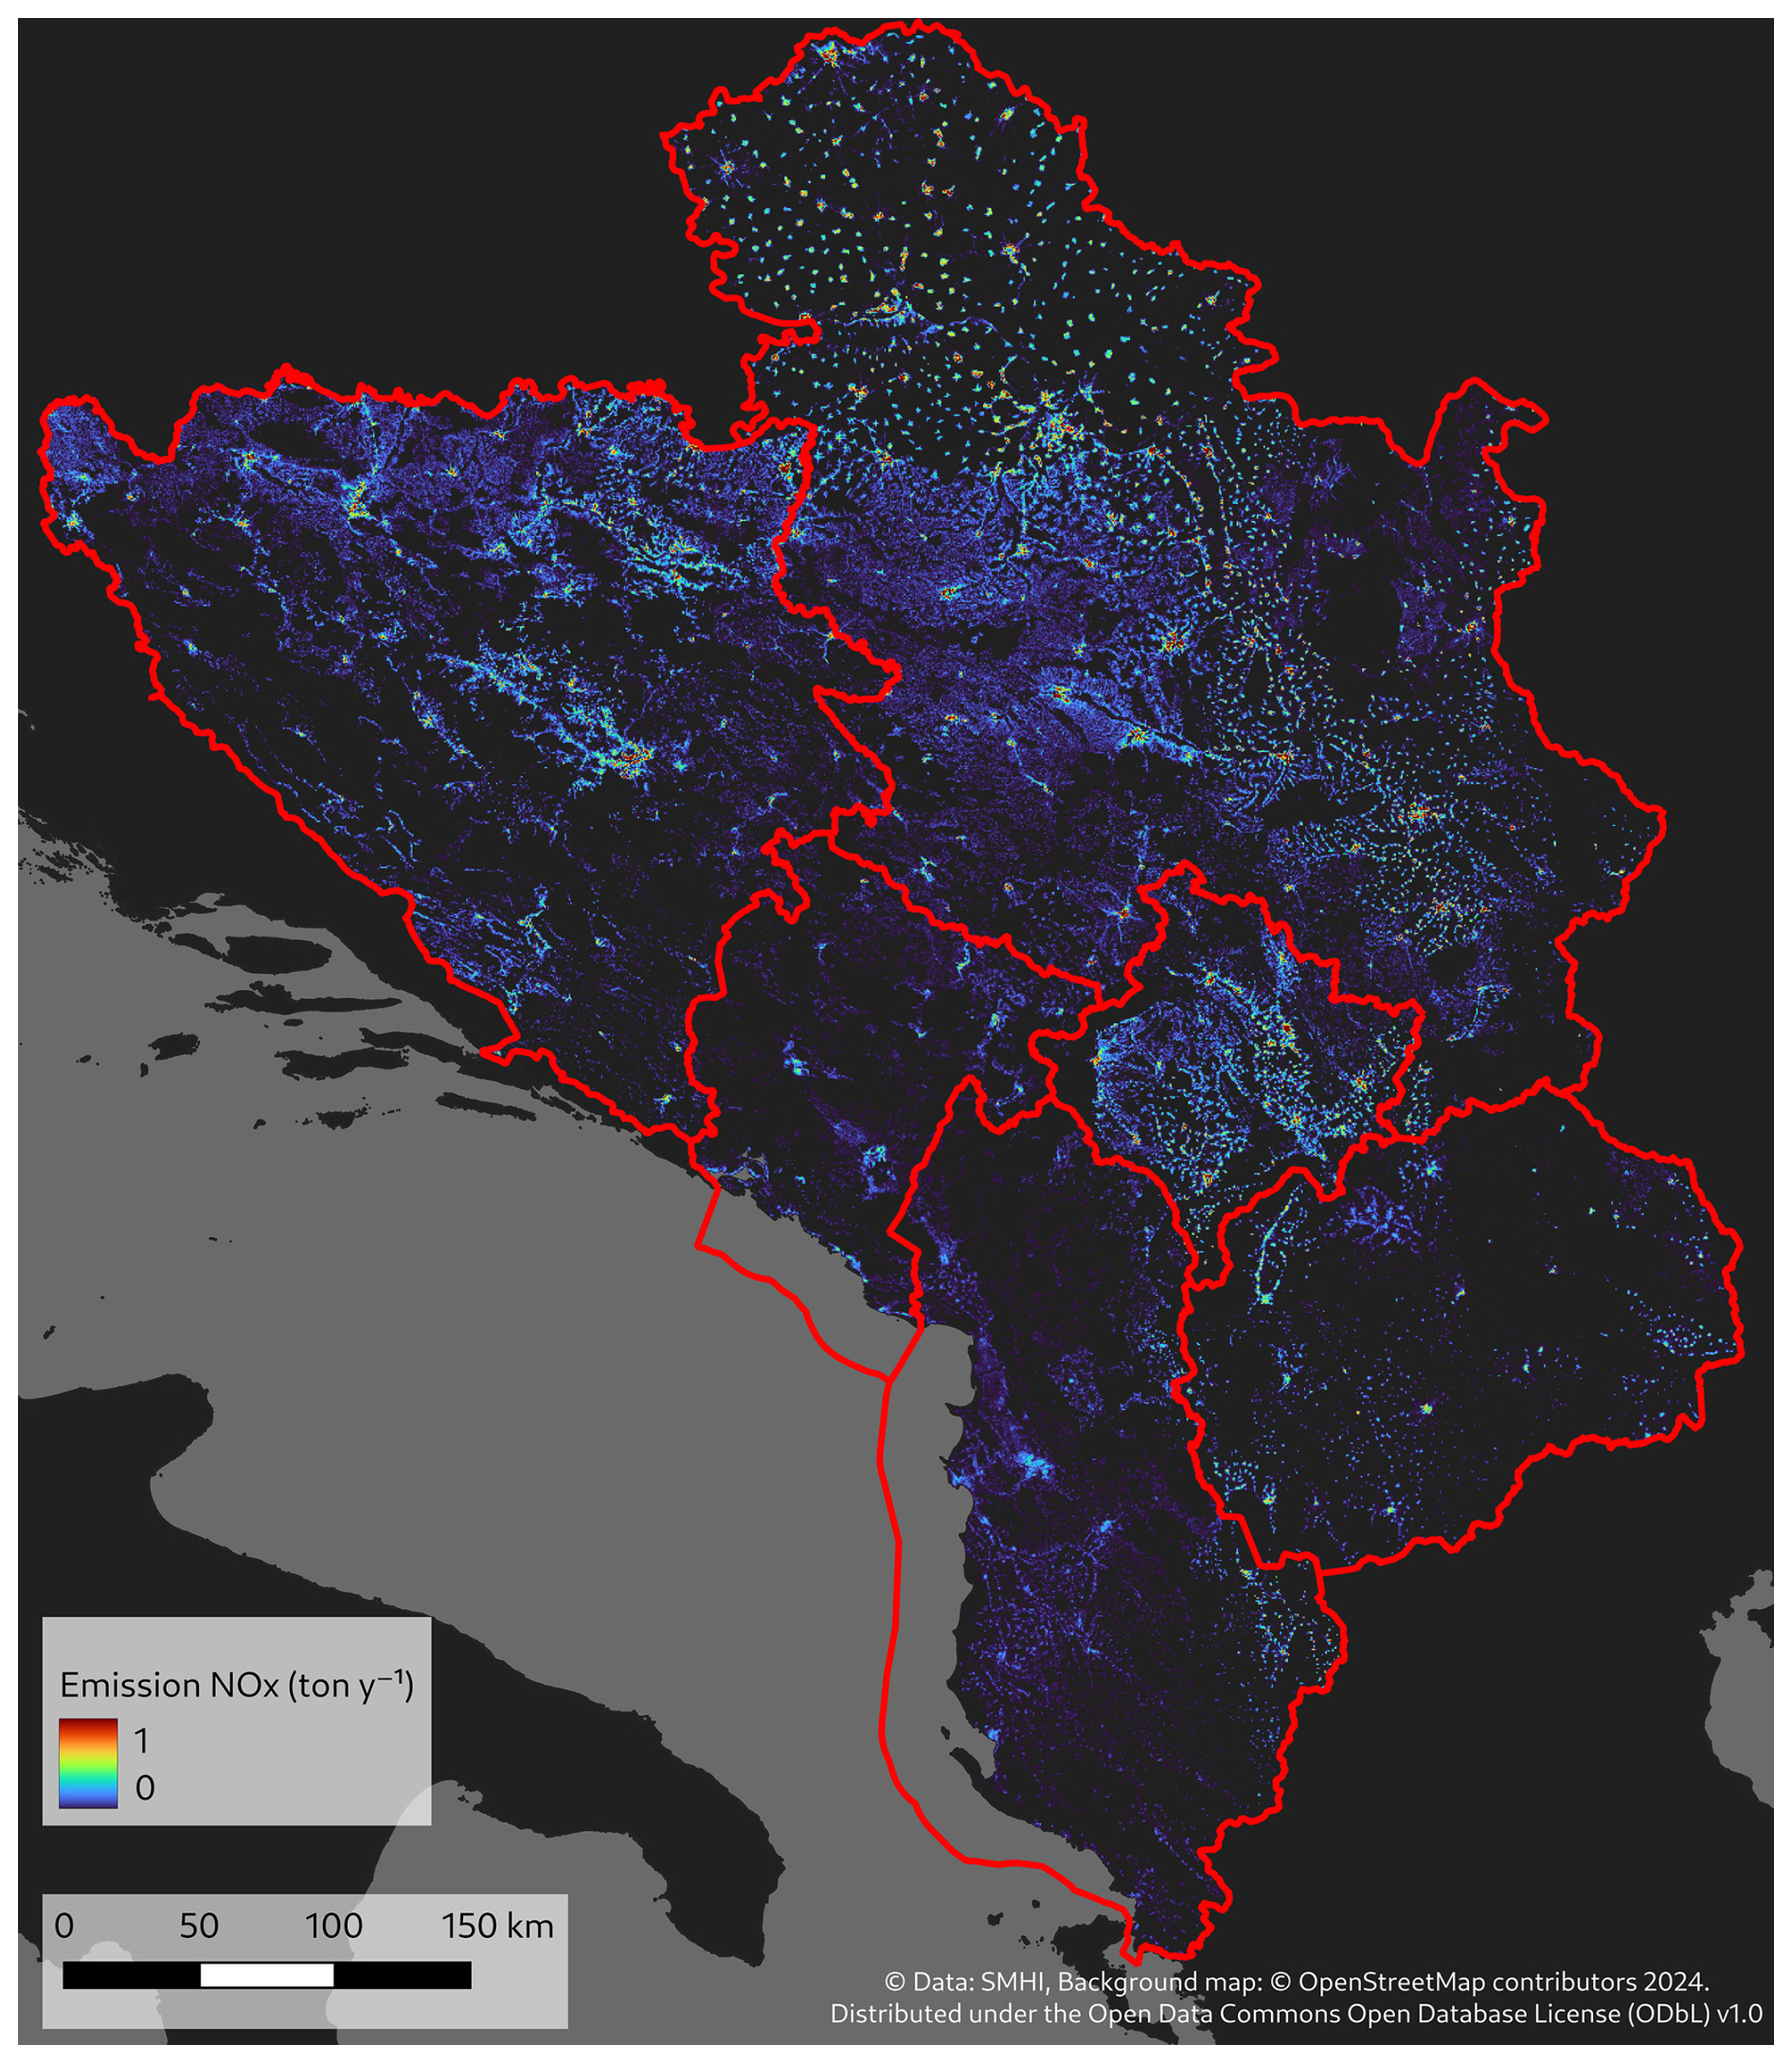
Figure 7Calculated emissions for the Western Balkans for NOx, rasterized to 500×500 m. All references to Kosovo in this document shall be understood to be in the context of the United Nations Security Council resolution 1244 (1999). The red line shows country borders, including territorial waters for countries having coastlines.
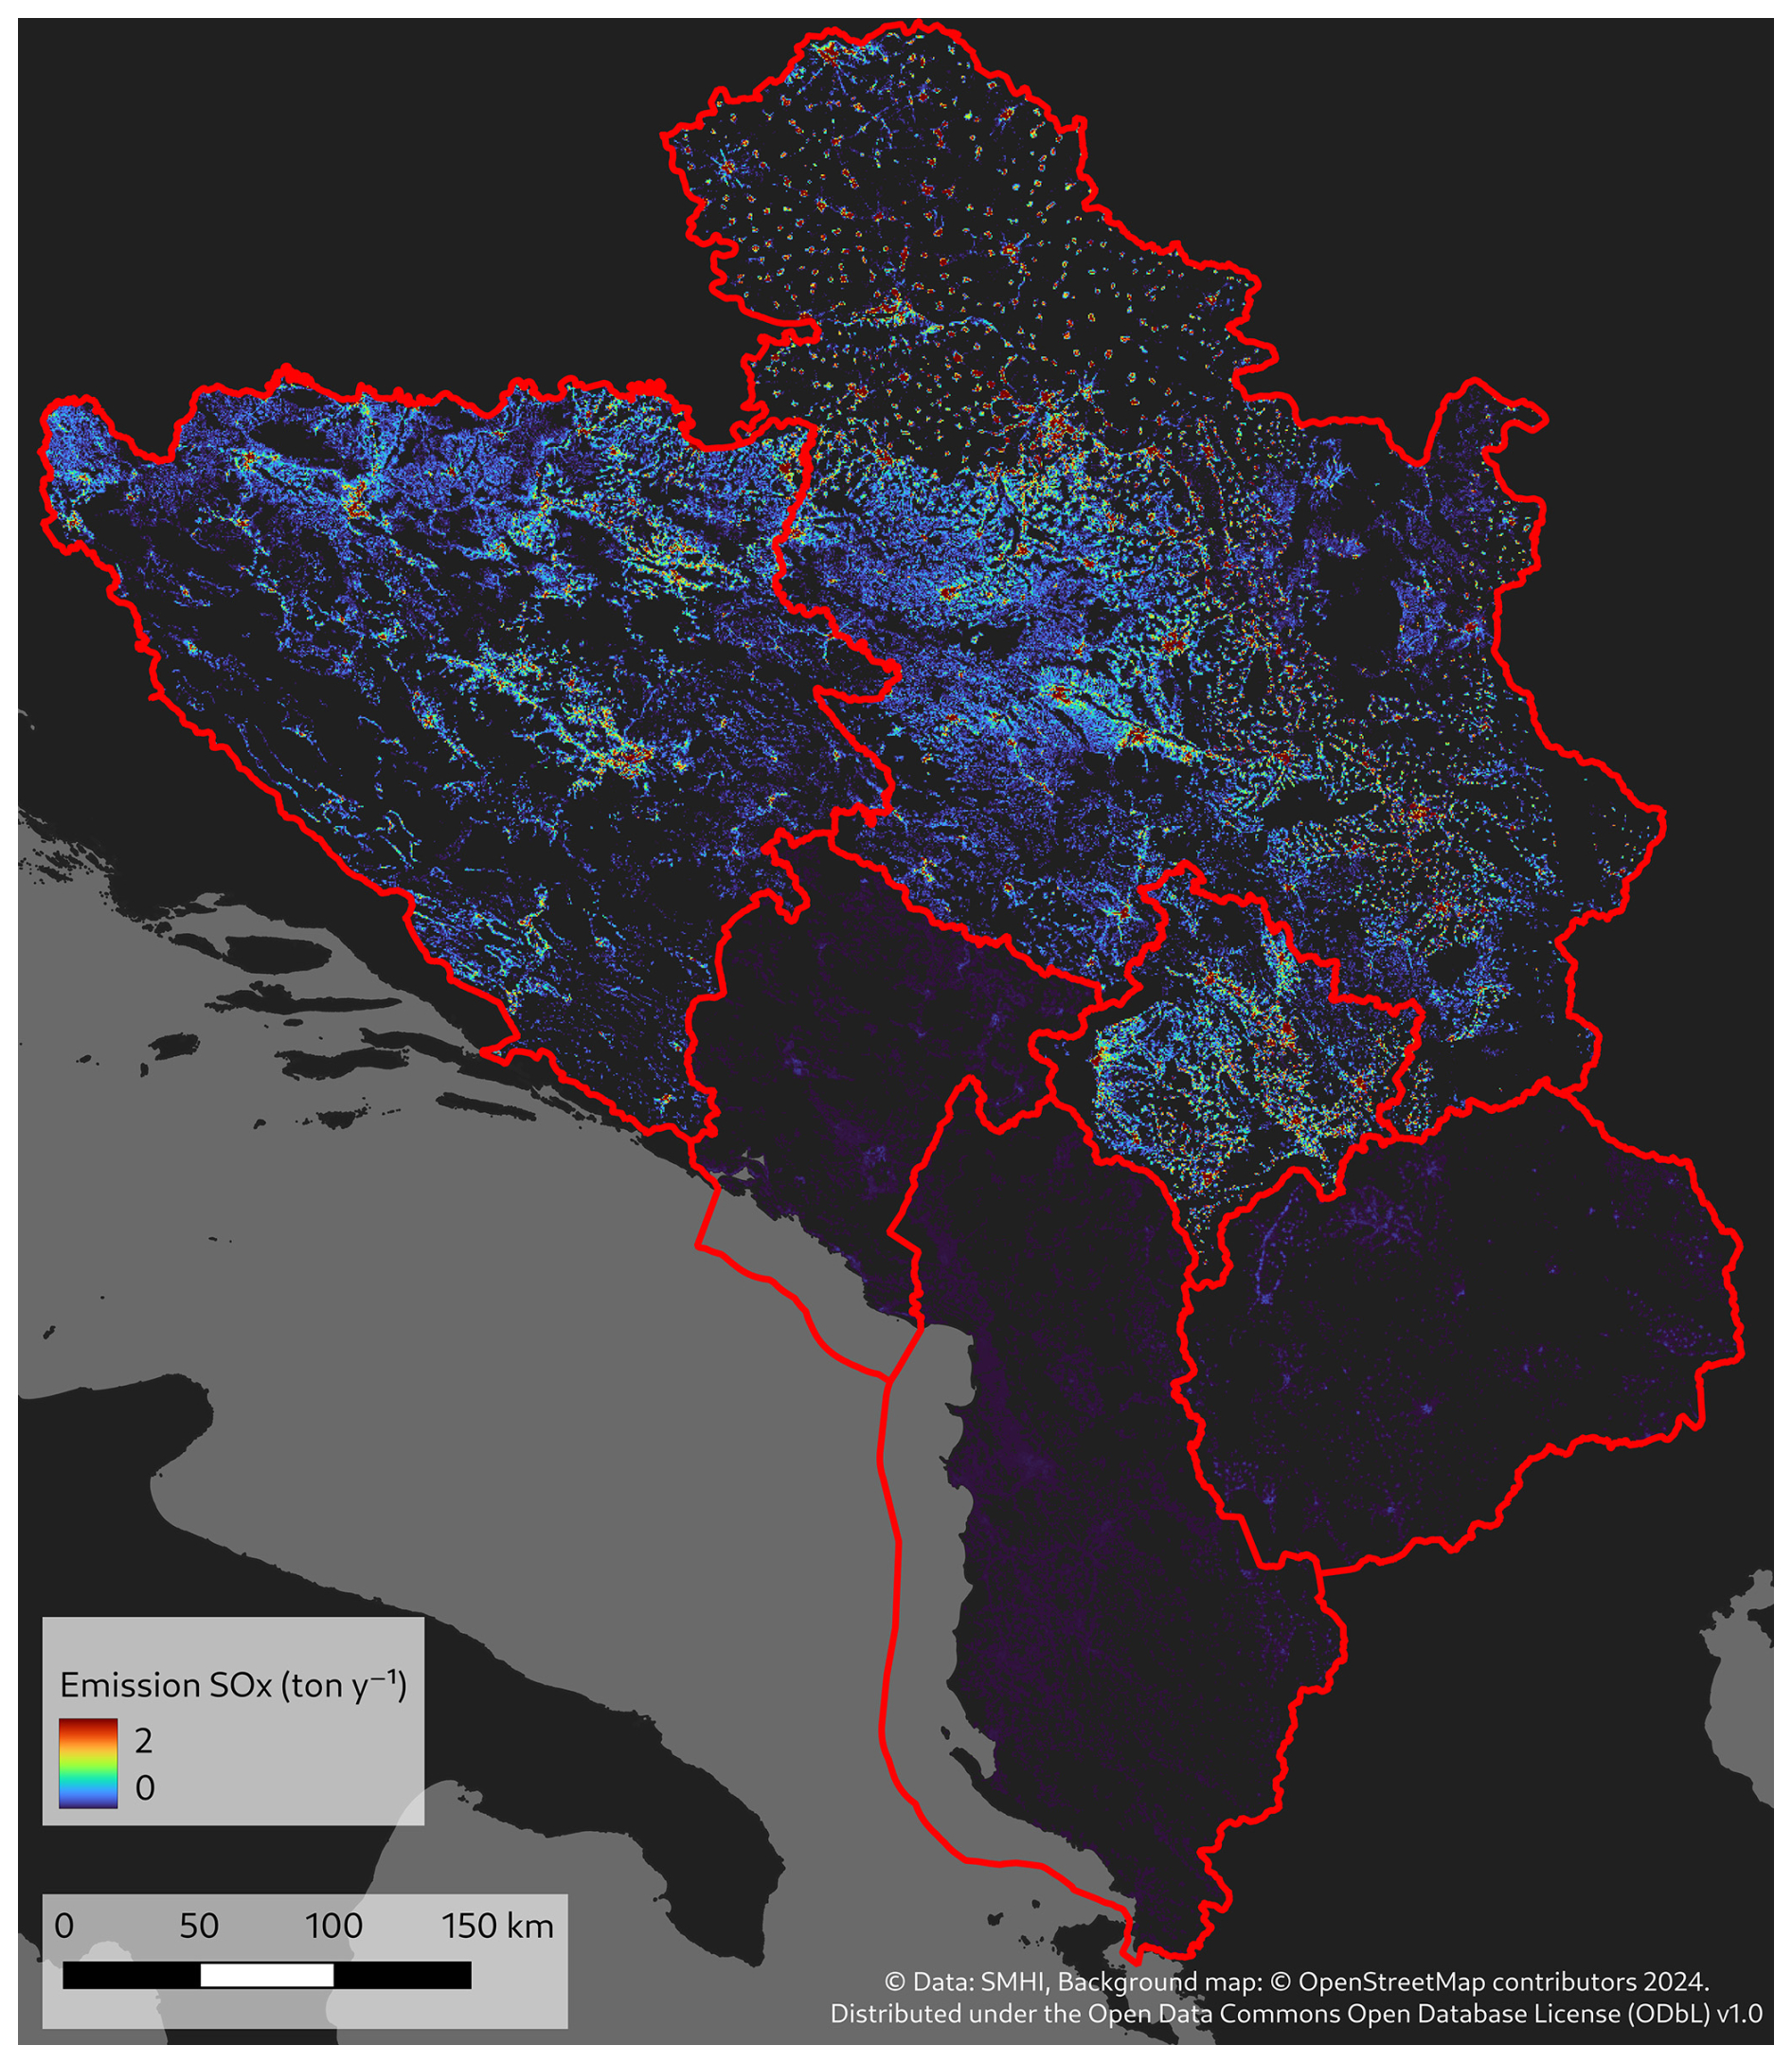
Figure 8Calculated emissions for the Western Balkans for SOx, rasterized to 500×500 m. All references to Kosovo in this document shall be understood to be in the context of the United Nations Security Council resolution 1244 (1999). The red line shows country borders, including territorial waters for countries having coastlines.
4.4 Comparison to other emission datasets
The resulting emission data for NOx and PM2.5 were compared to CAMS-reg 4.2, sector C (Kuenen et al., 2021, 2022), as well as EDGAR, sector buildings (Muntean et al., 2018) (accessed through https://edgar.jrc.ec.europa.eu/country_profile/, on 10 September 2024). The CAMS and EDGAR datasets are regional and therefore have a coarser resolution (0.05×0.1 and 0.1×0.1°3, respectively) than the dataset in this work, which is gridded to 500×500 m.
The CAMS emissions were reprojected to the ETRS89-extended/LAEA Europe projection (EPSG:3035) and resampled to a 1×1 km grid size. Then, the total emissions for the different regions were calculated using the zonal statistics in QGIS. The resulting national statistics are shown in Table 2.
Table 2Comparison of emission totals for different regions in the Western Balkans with CAMS-regional 4.2 (Kuenen et al., 2021, 2022) and EDGAR (Muntean et al., 2018). Note: For EDGAR, the region Serbia and Montenegro is still used, which also contains Kosovo∗. The equivalent has also been calculated for CAMS and this work to facilitate comparison.
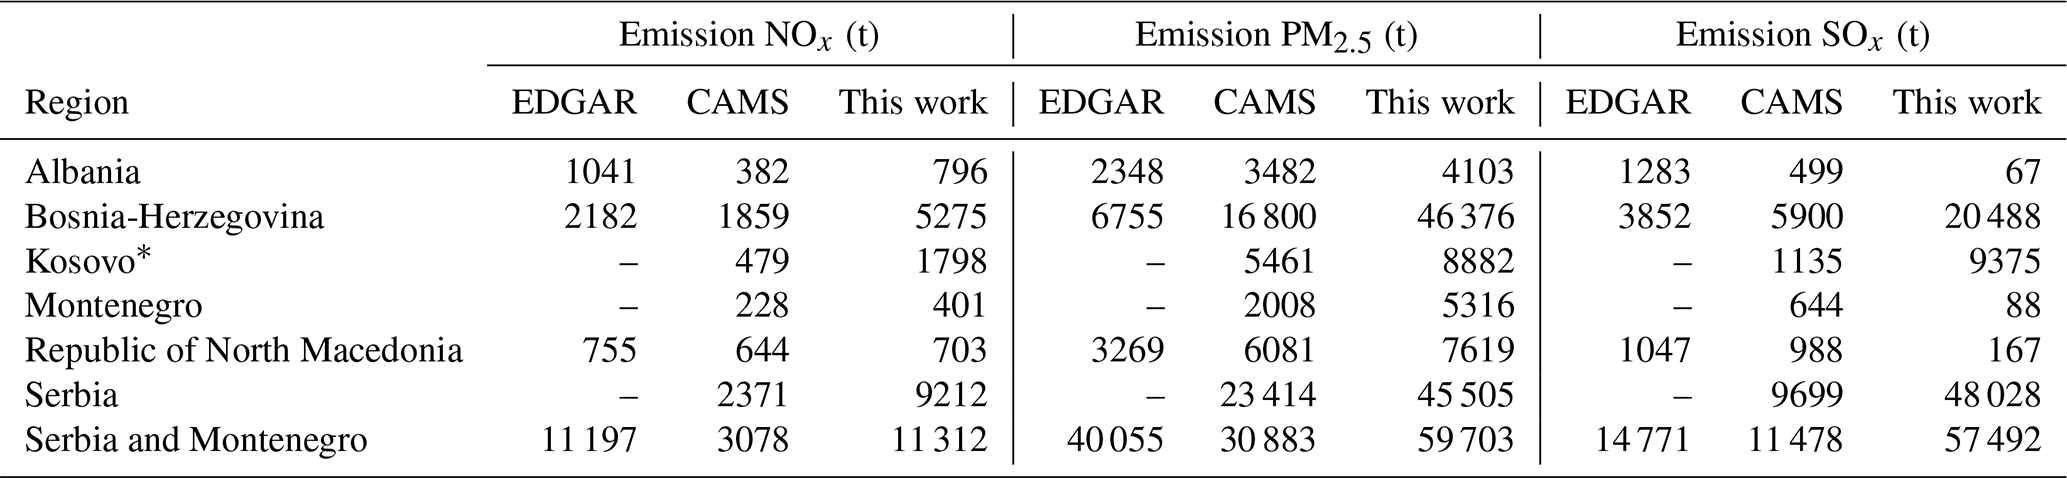
∗ All references to Kosovo in this document shall be understood to be in the context of the United Nations Security Council resolution 1244 (1999).
For NOx, the overall agreement between the two regional datasets and that between this work and the regional datasets are similar, though the results in this work are closer to the EDGAR dataset than to CAMS-reg. The largest difference is found for Bosnia and Herzegovina, where this work has more than twice the emissions compared to CAMS-reg and EDGAR.
While the EDGAR dataset has higher emissions than CAMS-reg for NOx, the case is the opposite for PM2.5, except for Serbia and Montenegro, where EDGAR is about a third higher. For PM2.5, the emissions in this work are considerably higher than both regional datasets. Because this was not the case for NOx, the discrepancy is not only a result of the number of buildings but must also be due to different fuel usage and/or emission factors.
Finally, for SOx, the data in this work are rather non-consistent when compared to the regional datasets. While this is much lower for some countries, it is considerably higher for other countries. This is a direct effect of the fuel data, as mentioned above. For Albania, Montenegro, and the Republic of North Macedonia, there is no coal usage reported (see Sect. 2.3), which leads to very low SOx emissions, while for Bosnia and Herzegovina and for Serbia, the coal usage leads to high emissions of SOx, in this case much higher than for the regional datasets.
The emission GIS-files (rasters) created in this work are publicly available at https://doi.org/10.5281/zenodo.13906810 (Asker, 2024).
A complete picture of the air quality situation in a country, region, or city requires not only monitoring data but also an accurate description of the emission sources. Atmospheric dispersion modeling may provide maps of the concentrations for different pollutants and also validate the emission data. In this work, we have developed a dataset for emissions from the heating of one- to three-family housing for the entire Western Balkans region at high spatial resolution.
While there are multiple sources of uncertainties in the dataset, the basic methodology is as follows:
-
Obtaining building data, in this case from the MLBuildings dataset
-
Filtering of the buildings data to obtain only the relevant housing units
-
Calculating the heating energy based on available data for energy usage
-
Calculating resulting emissions using the EEA emission database
-
Gridding the point emission data to a grid suitable for the application
This methodology may be applied wherever the above data sources are available.
Possible improvements to the methodology include better filtering of the buildings dataset and, importantly, reliable energy usage data for each region. While the methodology is tailor-made for heating from one- to three-family housing units, other residential housing (apartment buildings) is not included. There are also errors in the MLBuildings dataset, which may be reduced in the future as higher-quality satellite imagery and even better building detection AI methods emerge.
Comparing the national totals from the dataset developed in this work with regional emission datasets suggests that the results have acceptable quality and may be used as a basis for emissions analysis, for the development of air quality action plans, and as input for atmospheric dispersion modeling, which in turn may validate the emission data or lead to improvements in the methodology. It is the hope of the authors that the dataset may help in improving the air pollution situation in the Western Balkans.
Table A1Energy usage (MW h yr−1) per residential building for each country and region. For Albania, the regions follow Novikova et al. (2015b), while for Montenegro, Novikova et al. (2015a).
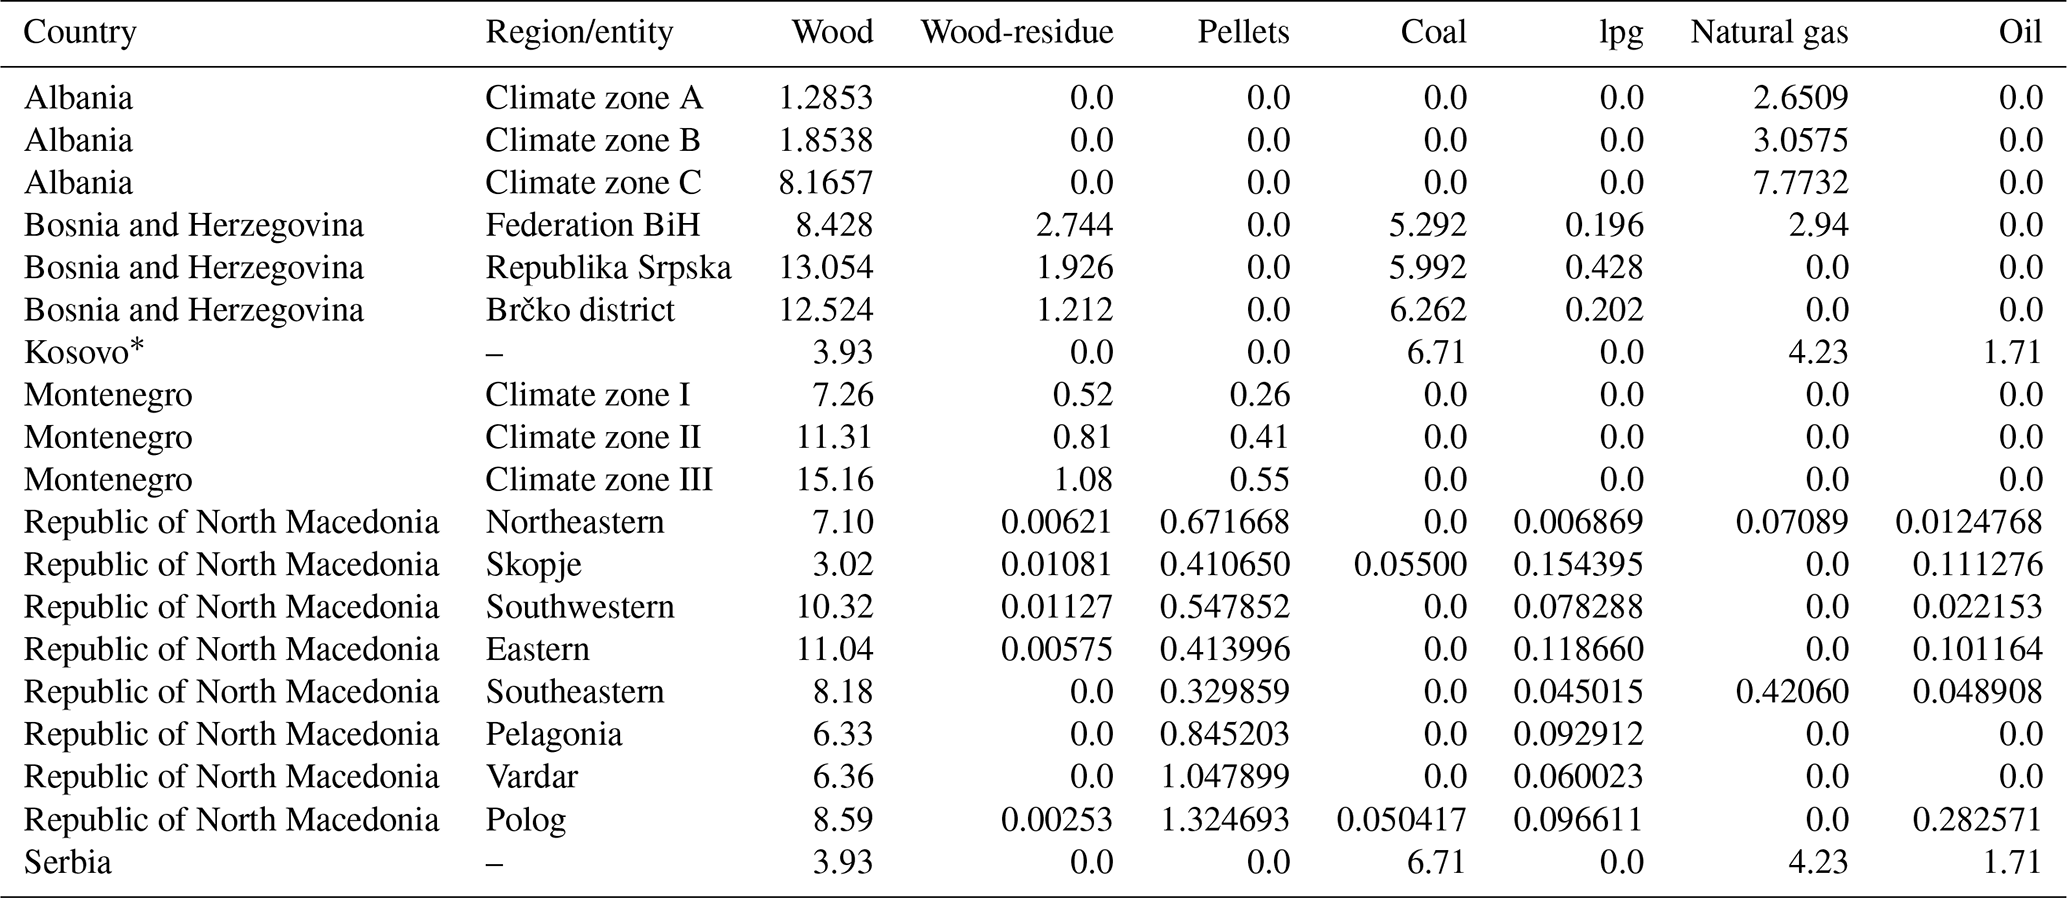
∗ All references to Kosovo in this document shall be understood to be in the context of the United Nations Security Council resolution 1244 (1999)
CA: conceptualization, methodology, data processing, analysis, visualization, writing. EvD: methodology, verification of emission calculations, writing. OT: project management, writing.
The contact author has declared that none of the authors has any competing interests.
Publisher’s note: Copernicus Publications remains neutral with regard to jurisdictional claims made in the text, published maps, institutional affiliations, or any other geographical representation in this paper. While Copernicus Publications makes every effort to include appropriate place names, the final responsibility lies with the authors. Regarding the maps used in this paper, please note that Figs. 5–8 contain disputed territories.
The authors would like to thank the Swedish Environmental Protection Agency (SEPA) and environmental agencies in the Western Balkan countries for their collaboration.
The publication of this article was funded by the Swedish Research Council, Forte, Formas, and Vinnova.
This paper was edited by Francesco N. Tubiello and reviewed by Djordje Djatkov and one anonymous referee.
Arnautović-Aksić, D., Burazor, M., Delalić, N., Gajić, D., Gvero, P., Kadrić, D., Kotur, M., Salihović, E., Todorović, D., and Zagora, N.: Typology of residential buildings in Bosnia and Herzegovina, Tech. rep., Arhitektonski fakultet Univerziteta u Sarajevu, Isbn: 978-9958-691-51-5, 2016. a, b, c
Asker, C.: Emissions for individual housing in the Western Balkans, Zenodo [data set], https://doi.org/10.5281/zenodo.13906810, 2024. a, b
Belis, C. A., Pisoni, E., Degraeuwe, B., Peduzzi, E., Thunis, P., Monforti-Ferrario, F., and Guizzardi, D.: Urban pollution in the Danube and Western Balkans regions: The impact of major PM2.5 sources, Environ. Int., 133, 105158, https://doi.org/10.1016/j.envint.2019.105158, 2019. a
European Environment Agency: Corine Land Cover (CLC) 2018, EEA geospatial data catalogue [data set], https://doi.org/10.2909/71c95a07-e296-44fc-b22b-415f42acfdf0, 2020a. a
European Environment Agency: Urban Atlas 2018, EEA geospatial data catalogue [data set], https://doi.org/10.2909/fb4dffa1-6ceb-4cc0-8372-1ed354c285e6, 2020b. a
European Environment Agency: EMEP/EEA air pollutant emission inventory guidebook 2023 – Technical guidance to prepare national emission inventories, Publications Office of the European Union, https://doi.org/10.2800/795737, 2023. a
European Environment Agency: Europe’s air quality status 2024, Tech. rep., European Environment Agency, https://doi.org/10.2800/5970, 2024. a
GDAL/OGR contributors: GDAL/OGR Geospatial Data Abstraction software Library, Zenodo [code], https://doi.org/10.5281/zenodo.5884351, 2024. a
Gjorgjievska, T.: Total resident population, households and dwellings in the Republic of North Macedonia, Census 2021, Tech. rep., State Statistical Office, Republic of North Macedonia, ISBN 978-608-227-344-0, 2021. a
Jordahl, K., den Bossche, J. V., Fleischmann, M., Wasserman, J., McBride, J., Gerard, J., Tratner, J., Perry, M., Badaracco, A. G., Farmer, C., Hjelle, G. A., Snow, A. D., Cochran, M., Gillies, S., Culbertson, L., Bartos, M., Eubank, N., maxalbert, Bilogur, A., Rey, S., Ren, C., Arribas-Bel, D., Wasser, L., Wolf, L. J., Journois, M., Wilson, J., Greenhall, A., Holdgraf, C., Filipe, and Leblanc, F.: geopandas/geopandas: v0.8.1, Zenodo [code], https://doi.org/10.5281/zenodo.3946761, 2020. a
Jovanović Popović, M. and Ignjatović, D.: National Typology of Residential Buildings in Serbia, Tech. rep., Faculty of Architecture, University of Belgrade, ISBN 978-86-7924-102-3, 2013. a, b, c
Korajčević, S.: Survey on household energy consumption in BiH, Tech. rep., Agency for Statistics of Bosnia and Herzegovina, 2015. a
Kosovo agency of statistics: Results of the Survey on Income and Living Conditions (SILC), 2022, Tech. rep., Kosovo agency of statistics, 2022. a
Kuenen, J., Dellaert, S., Visschedijk, A., Jalkanen, J.-P., Super, I., and Denier van der Gon, H.: Copernicus Atmosphere Monitoring Service regional emissions version 4.2 (CAMS-REG-v4.2), Tech. rep., Copernicus Atmosphere Monitoring Service [data set], https://doi.org/10.24380/0vzb-a387, 2021. a, b
Kuenen, J., Dellaert, S., Visschedijk, A., Jalkanen, J.-P., Super, I., and Denier van der Gon, H.: CAMS-REG-v4: a state-of-the-art high-resolution European emission inventory for air quality modelling, Earth Syst. Sci. Data, 14, 491–515, https://doi.org/10.5194/essd-14-491-2022, 2022. a, b
Microsoft: Global ML Building Footprints, https://github.com/microsoft/GlobalMLBuildingFootprints, last access: 16 April 2024. a
Mkl: Summary of the research on heating practices in the residential sector of North Macedonia, Tech. rep., RES Foundation, 2021. a
Muntean, M., Janssens-Maenhout, G., Song, S., Giang, A., Selin, N. E., Zhong, H., Zhao, Y., Olivier, J. G., Guizzardi, D., Crippa, M., Schaaf, E., and Dentener, F.: Evaluating EDGARv4.tox2 speciated mercury emissions ex-post scenarios and their impacts on modelled global and regional wet deposition patterns, Atmos. Environ., 184, 56–68, https://doi.org/10.1016/j.atmosenv.2018.04.017, 2018. a, b
Novikova, A., Csoknyai, T., Miljanic, Z., Gligorić, B., Vušanović, I., and Szalay, Z.: Tipologija fonda stambenih zgrada Crne Gore – modeliranje njihove transformacije u budućnosti sa niskim nivoom ugljenika, Tech. rep., Regional Environmental Center, 2015a. a, b
Novikova, A., Szalay, Z., Simaku, G., Thimjo, T., Plaku, T., and Csoknyai, T.: The typology of the residential building stock in Albania and the modelling of its low-carbon transformation, Tech. rep., Regional Environmental Center for Central and Eastern Europe (REC), 2015b. a, b, c
Novikova, A., Csoknyai, T., and Szalay, Z.: Low carbon scenarios for higher thermal comfort in the residential building sector of South Eastern Europe, Energ. Effic., 11, 845–872, 2018. a
Open Street Map: Open Street Map, http://www.openstreetmap.org, last access: 10 September 2024. a
QGIS Development Team: QGIS Geographic Information System, https://www.qgis.org (last access: 31 July 2024), 2021. a
Simovski, A.: Energy consumption in households, 2019, Tech. rep., State Statistical Office, ISBN 978-608-227-337-2, 2019. a
UNEP: Air pollution is responsible for up to one in five premature deaths in 19 Western Balkan cities, https://www.unep.org/news-and-stories/press-release/air-pollution-responsible-one-five-premature-deaths-19-western, last access: 31 July 2024. a
World Bank: World Bank population total, https://data.worldbank.org/indicator/SP.POP.TOTL, last access: 31 July 2024. a