the Creative Commons Attribution 4.0 License.
the Creative Commons Attribution 4.0 License.
 | 04 Jul 2025
China's annual forest age dataset at a 30 m spatial resolution from 1986 to 2022
Rong Shang
Xudong Lin
Jing M. Chen
Yunjian Liang
Keyan Fang
Mingzhu Xu
Yulin Yan
Weimin Ju
Guirui Yu
Nianpeng He
Li Xu
Liangyun Liu
Jing Li
Wang Li
Jun Zhai
Zhongmin Hu
Forest age is crucial for both carbon cycle modeling and effective forest management. Remote sensing provides crucial data for large-scale forest age mapping, but existing products often suffer from a low spatial resolution (typically 1000 m), making them unsuitable for most forest stands in China, which are generally smaller than this threshold. Recent studies have generated static forest age products for 2019 (CAFA V1.0) (Shang et al., 2023a) and 2020 (Cheng et al., 2024) at a 30 m spatial resolution. However, their low temporal resolution limits their applicability to track multiyear forest carbon changes. This study aims to generate China's annual forest age dataset (CAFA V2.0) at a 30 m resolution from 1986 to 2022, utilizing forest disturbance monitoring and machine learning techniques. Forest disturbance monitoring, which typically has lower uncertainty compared to machine learning approaches, is primarily employed to update annual forest age. The modified COLD (mCOLD) algorithm, which incorporates spatial information and bidirectional monitoring, was used for forest disturbance monitoring. For undisturbed forests, forest age was estimated using machine learning models trained separately for different regions and forest cover types, with inputs including forest height, vegetation indices, climate, terrain, and soil data. Additionally, adjustments were made for underestimations in the Northeastern and Southwestern regions of China identified in CAFA V1.0 using additional reference age samples and region-specific and forest-type-specific models. Validation, using a randomly selected 30 % of two reference datasets, indicated that the mapped age of disturbed forest exhibited a small error of ±2.48 years, while the mapped age of undisturbed forest from 1986 to 2022 had a larger error of ±7.91 years. The generated 30 m annual forest age dataset can facilitate forest carbon cycle modeling in China, offering valuable insights for national forest management practices. The CAFA V2.0 dataset is publicly available at https://doi.org/10.6084/m9.figshare.24464170 (Shang et al., 2023b).
- Article
(11841 KB) - Full-text XML
- BibTeX
- EndNote


Forest age, defined as the average age within a forest pixel (Shang et al., 2023a), is a key factor influencing both carbon sequestration and emission (Zhang et al., 2015) and determining long-term trends in forest carbon balance (Chen et al., 2000, 2003; He et al., 2012; Kurz and Apps, 1999; Zhang et al., 2013, 2014). Ignoring the influence of forest age on carbon sequestration can result in a 13 %–20 % error in simulated forest carbon sinks, a discrepancy closely approximating the impact of climate change (Bellassen et al., 2011). Hence, accurately delineating forest age is essential for both effective forest management and precise carbon cycle modeling (Lin et al., 2023; Shang et al., 2023a).
Field measurements and surveys can accurately obtain forest age by extracting tree cores or utilizing records of the planting year. However, this method is time-consuming, labor-intensive, and costly when applied to large-scale forest age mapping (Lin et al., 2023). Moreover, the age measured for individual trees may not represent the average age of the entire stand, limiting its applicability for comprehensive forest age mapping (Besnard et al., 2021; Racine et al., 2014; Véga and St-Onge, 2008). In contrast, remote sensing provides continuous and repetitive observations of the Earth's surface, enabling large-scale forest age mapping (Vastaranta et al., 2016; Yang et al., 2020).
Many studies have utilized remote sensing for forest age mapping, and the methods that they have used can be categorized into two types (Shang et al., 2023a): forest-height-based methods (hereafter “height-based methods”) and forest-disturbance-monitoring-based methods (hereafter “disturbance-based methods”). Height-based methods begin by establishing a relationship between tree height and forest age using ground sample data, and they then use lidar tree height data to estimate forest age (Zhang et al., 2014, 2017). This relationship is often modeled using stand growth equations (Lin et al., 2023). Considering that forest growth is also influenced by environmental factors such as climate and terrain (Li et al., 2023; Lin et al., 2023), some studies employ machine learning techniques to construct intricate models using tree height, climate, and terrain data for forest age mapping (Besnard et al., 2021; Diao et al., 2020; Shang et al., 2023a; Zhao et al., 2021). However, current methods still exhibit significant uncertainties ranging from 12 to 48 years (Shang et al., 2023a). This is primarily due to the variability in the relationship between tree height and forest age, which not only correlates with climate and terrain factors but also varies with forest cover types (Lin et al., 2023). Therefore, incorporating forest cover type, alongside tree height, climate, and terrain considerations, may be an effective approach to improving the accuracy of forest age mapping.
Disturbance-based methods primarily utilize forest disturbance monitoring algorithms to identify the years when forests regrow after disturbances, estimating forest age accordingly (Xiao et al., 2023). Compared to height-based methods, disturbance-based methods typically result in lower uncertainties when estimating forest age (Shang et al., 2023a), but this method type is limited to estimating age within forest disturbance areas only. Commonly used forest disturbance monitoring algorithms include LandTrendr (Kennedy et al., 2010), CCDC (Zhu and Woodcock, 2014), and COLD (Zhu et al., 2020). Among these, the CCDC and COLD algorithms detect forest disturbances using all available time-series data, showing superior performance over LandTrendr, which relies on annual composite data for disturbance monitoring (Qiu et al., 2023). COLD, as an improved version of CCDC, enhances the accuracy of forest disturbance monitoring (Zhu et al., 2020). However, as a single-pixel time-series forest disturbance monitoring algorithm, COLD may omit forest disturbances within specific areas (Ye et al., 2023), potentially leading to significant biases in forest age estimation. Therefore, to improve the accuracy of forest age mapping, it is urgent to integrate spatial information into forest disturbance monitoring.
Several forest age products have been developed for China (Zhang et al., 2017, 2014; Xiao et al., 2023; Shang et al., 2023a; Cheng et al., 2024; Besnard et al., 2021). Early studies produced three sets of forest age products with a spatial resolution of 1000 m for the years 2005 and 2010 using a height-based method (Zhang et al., 2014, 2017; Besnard et al., 2021). However, the 1000 m resolution averages forest stands within each pixel, leading to overestimations of young forests and underestimations of old forests. In recent years, driven by the demand for precise simulation of forest carbon dynamics and the availability of high-resolution remote-sensing data, several high-resolution forest age products have been successfully generated. For example, Xiao et al. (2023) estimated the forest age in disturbance areas across China at a 30 m resolution in 2020 using the CCDC disturbance monitoring algorithm. Cheng et al. (2024) combined machine learning algorithms based on tree height, climate, and terrain with the LandTrendr disturbance monitoring algorithm to obtain forest age data for China in 2020. Our previous work (Shang et al., 2023a) utilized machine learning algorithms and the COLD disturbance monitoring algorithm to estimate the nationwide forest age at a 30 m resolution in 2019 (CAFA V1.0). Compared to earlier products that used a height-based method alone, integrating a height-based method to estimate forest age with a disturbance-based method for updating forest age significantly enhances reliability. However, significant discrepancies still exist among current forest age products, which provide data for single years only, thus overlooking substantial changes in forest age before and after disturbances. These omitted changes can have a large impact on forest carbon modeling. When using single-year forest age data, process-based ecosystem models often underestimate the forest carbon uptake prior to the most recent forest disturbance and fail to account for the carbon release from multiple forest disturbances, leading to substantial uncertainties in forest carbon modeling (Zhang et al., 2025; Yu et al., 2020). In contrast, long-term forest age products can capture these carbon dynamics, making them more valuable for forest carbon modeling and forest management (Zhang et al., 2025; Chorshanbiyev et al., 2024). Therefore, it is urgent to generate long-term, high-resolution forest age products to support research on China's carbon neutrality (Besnard et al., 2021; Schumacher et al., 2020; Yu et al., 2020).
This study aims to generate an annual forest age dataset for China (CAFA V2.0) from 1986 to 2022 at a 30 m resolution using the modified COLD (mCOLD) forest disturbance monitoring algorithm and a machine learning method. The forest age in 2019 was regarded as the baseline to update the annual forest age, which was derived using forest-cover-type-specific machine learning models trained with inputs derived from forest height, vegetation indices, climate, terrain, and soil data. The mCOLD algorithm, which incorporates spatial information and bidirectional monitoring, was employed for forest disturbance monitoring from 1986 to 2022. The age of disturbed forests was updated by the years since the disturbance. The mapped forest age was validated using two reference datasets: one comprising 12 328 interpreted reference forest disturbance datasets in China and another consisting of 5304 forest field survey samples in China. The generated 30 m annual forest age dataset can facilitate forest carbon cycle modeling in China, offering valuable insights for national forest management practices.
2.1 Study area
The study area is China's forest region (Fig. 1), which has the largest afforested area globally. From 2000 to 2017, China accounted for 25 % of the global net increase in leaf area, with forestation contributing 42 % of this increase (Chen et al., 2019). China is typically divided into six regions (Shang et al., 2023a): North China (N), which has a forest coverage of 21.09 %; Northwestern China (NW), which has a forest coverage of 8.21 %; Northeastern China (NE), which has a forest coverage of 41.59 %; South China (S), which has a forest coverage of 44.63 %; East China (E), which has a forest coverage of 40.64 %; and Southwestern China (SW), which has a forest coverage of 25.75 %. The forest cover in China can be broadly classified into five types: evergreen broad-leaved forest (EBF), deciduous broad-leaved forest (DBF), evergreen coniferous forest (ENF), deciduous coniferous forest (DNF), and mixed forest (MF). Deciduous forests dominate in the northern regions of China, whereas evergreen forests dominate in the southern regions of China. DBF dominates in the N and NE regions, particularly in the provinces of Liaoning, Jilin, Heilongjiang, Hebei, and Shanxi (Zhang et al., 2021a). These areas have a climate characterized by cold winters and warm summers, creating favorable conditions for the growth of DBFs. EBF is primarily distributed in the E and S regions, including the provinces of Zhejiang, Fujian, Jiangxi, Guangdong, Guangxi, and Hainan, where a warm, humid climate with abundant rainfall supports the growth of evergreen species. ENF is concentrated in the SW region, including parts of Sichuan, Yunnan, and Tibet, where mountainous terrain, high elevations, and a cool and moist climate favor evergreen conifer species. DNF is less common, primarily found in the NE region, particularly in the Greater Khingan and the Lesser Khingan mountains. MF is also sparsely distributed, typically occurring in transitional zones or areas with complex ecological conditions, such as the Changbai Mountains in the NE region and the Hengduan Mountains in the SW region. These MFs, containing both coniferous and broad-leaved species, play a crucial role in maintaining ecosystem balance and supporting biodiversity.
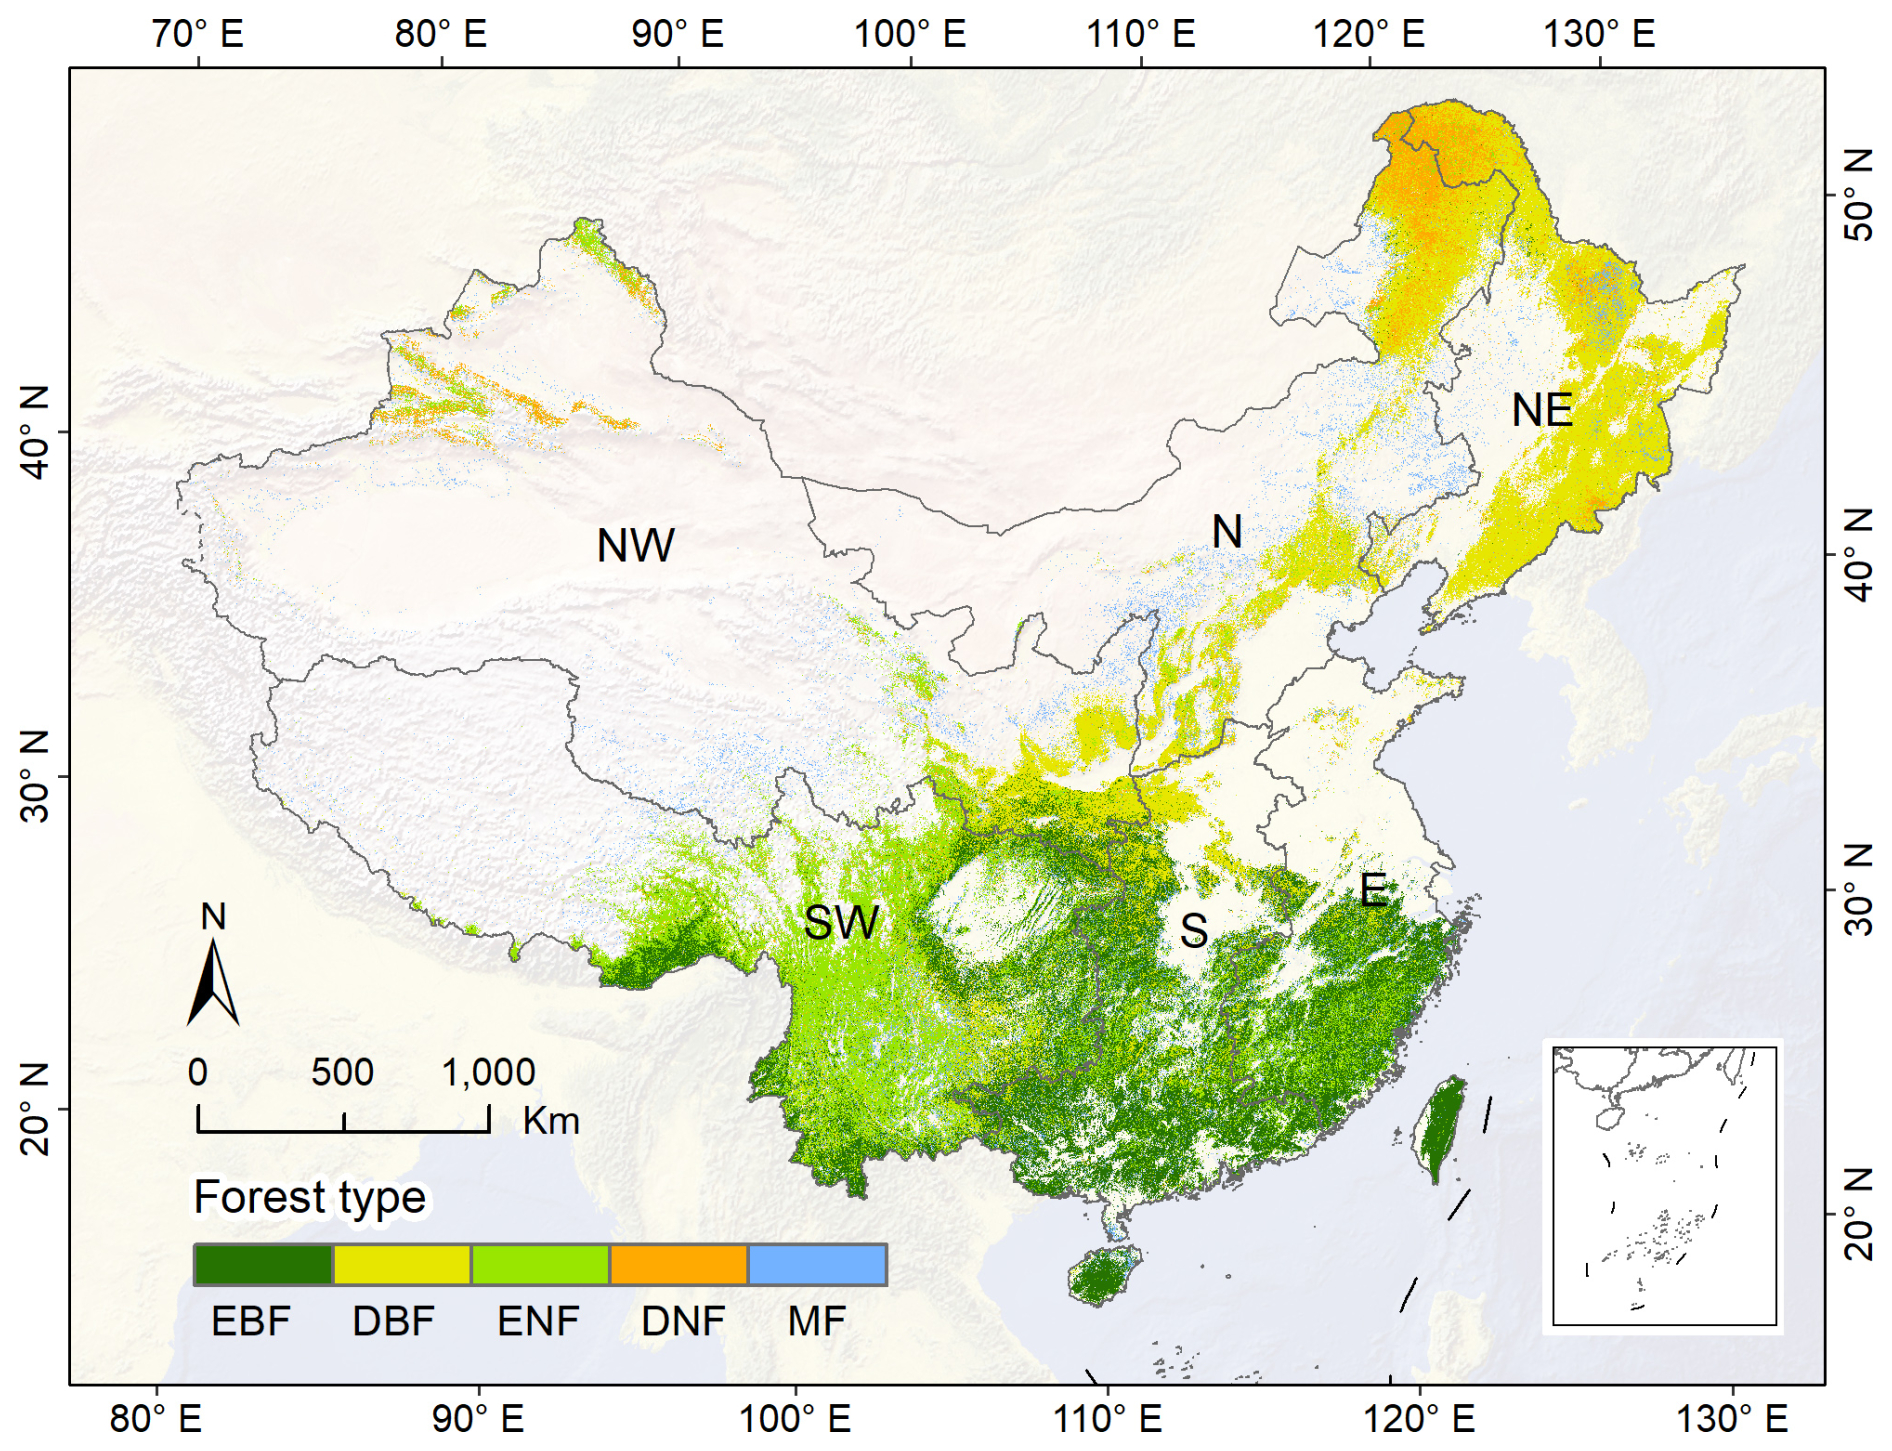
Figure 1Spatial distribution of China's forest cover types in 2019 over six defined regions. The forest cover types were merged from three forest cover type products (Shang et al., 2023a): GLC_FCS30 (Zhang et al., 2021c) at a 30 m resolution, GLASS-GLC (Liu et al., 2021) at a 30 m resolution, and ESA CCI LC (ESA, 2017) resampled to a 30 m resolution from a 300 m resolution. The abbreviations used in the figure are as follows: EBF – evergreen broad-leaved forest; DBF – deciduous broad-leaved forest; ENF – evergreen coniferous forest; DNF – deciduous coniferous forest; MF – mixed forest; N – North China; NE – Northeastern China; E – East China; S – South China; SW – Southwestern China; NW – Northwestern China.
2.2 Data
2.2.1 Landsat data
Landsat Collection 2 Tier 1 surface reflectance data were used for forest age mapping via two processes: (1) estimating the age of disturbed forests through forest disturbance monitoring and (2) modeling the age of undisturbed forests using machine learning methods combined with forest height data. For mapping the age of undisturbed forests or forests before disturbance, forest height data may not be available from China's existing forest height products (see Sect. 2.2.3 for details). In such cases, Landsat data should be used to retrieve forest height.
This version of Landsat data includes all available images from Landsat 5–8 for the period from 1986 to 2022, featuring multi-spectral bands, such as blue (B), green (G), red (R), near-infrared (NIR), shortwave infrared 1 (SWIR1), and shortwave infrared 2 (SWIR2), and quality assessment (QA) bands. These bands are essential for forest disturbance monitoring, forest height mapping, and age mapping. Preprocessing was conducted using the QA band (QA_PIXEL) by applying bitwise operations to identify clouds and shadows in the image according to the QA descriptions (Zhu et al., 2015) and then filtering out pixels affected by clouds and shadows (Zhang et al., 2024). A time-series filter (Shang et al., 2022) was also used for screening the outliers in the Landsat time-series data. For forest disturbance monitoring, the surface reflectance of the six spectral bands was employed using the mCOLD algorithm (Shang et al., 2025). In addition to surface reflectance, two vegetation indices, the normalized difference vegetation index (NDVI) and the near-infrared reflectance of vegetation (NIRv), were utilized for forest height and age mapping. NDVI is an approximate indicator of vegetation greenness (Zeng et al., 2022; Zhu et al., 2016), while NIRv serves as an approximate indicator of vegetation productivity (Badgley et al., 2017; Shang et al., 2023a).
2.2.2 Reference samples
The reference forest age samples (Fig. 2a) were utilized for forest age mapping and validation of undisturbed forests from 1986 to 2022. This dataset comprises two components: (1) 3121 samples obtained from field surveys conducted within the framework of the “Strategic Priority Project of Carbon Budget” (SPPCB) project (Fang et al., 2018) and (2) 2183 samples derived from literature reviews (Luo et al., 2014; Cook-Patton et al., 2020). Each forest survey plot within SPPCB provides key attributes relevant to age mapping, such as the forest age, forest cover type, survey locations, and survey dates. For each region and forest type, 70 % of the reference forest age samples were randomly chosen for model training, whereas the remaining 30 % of samples were reserved for validation.
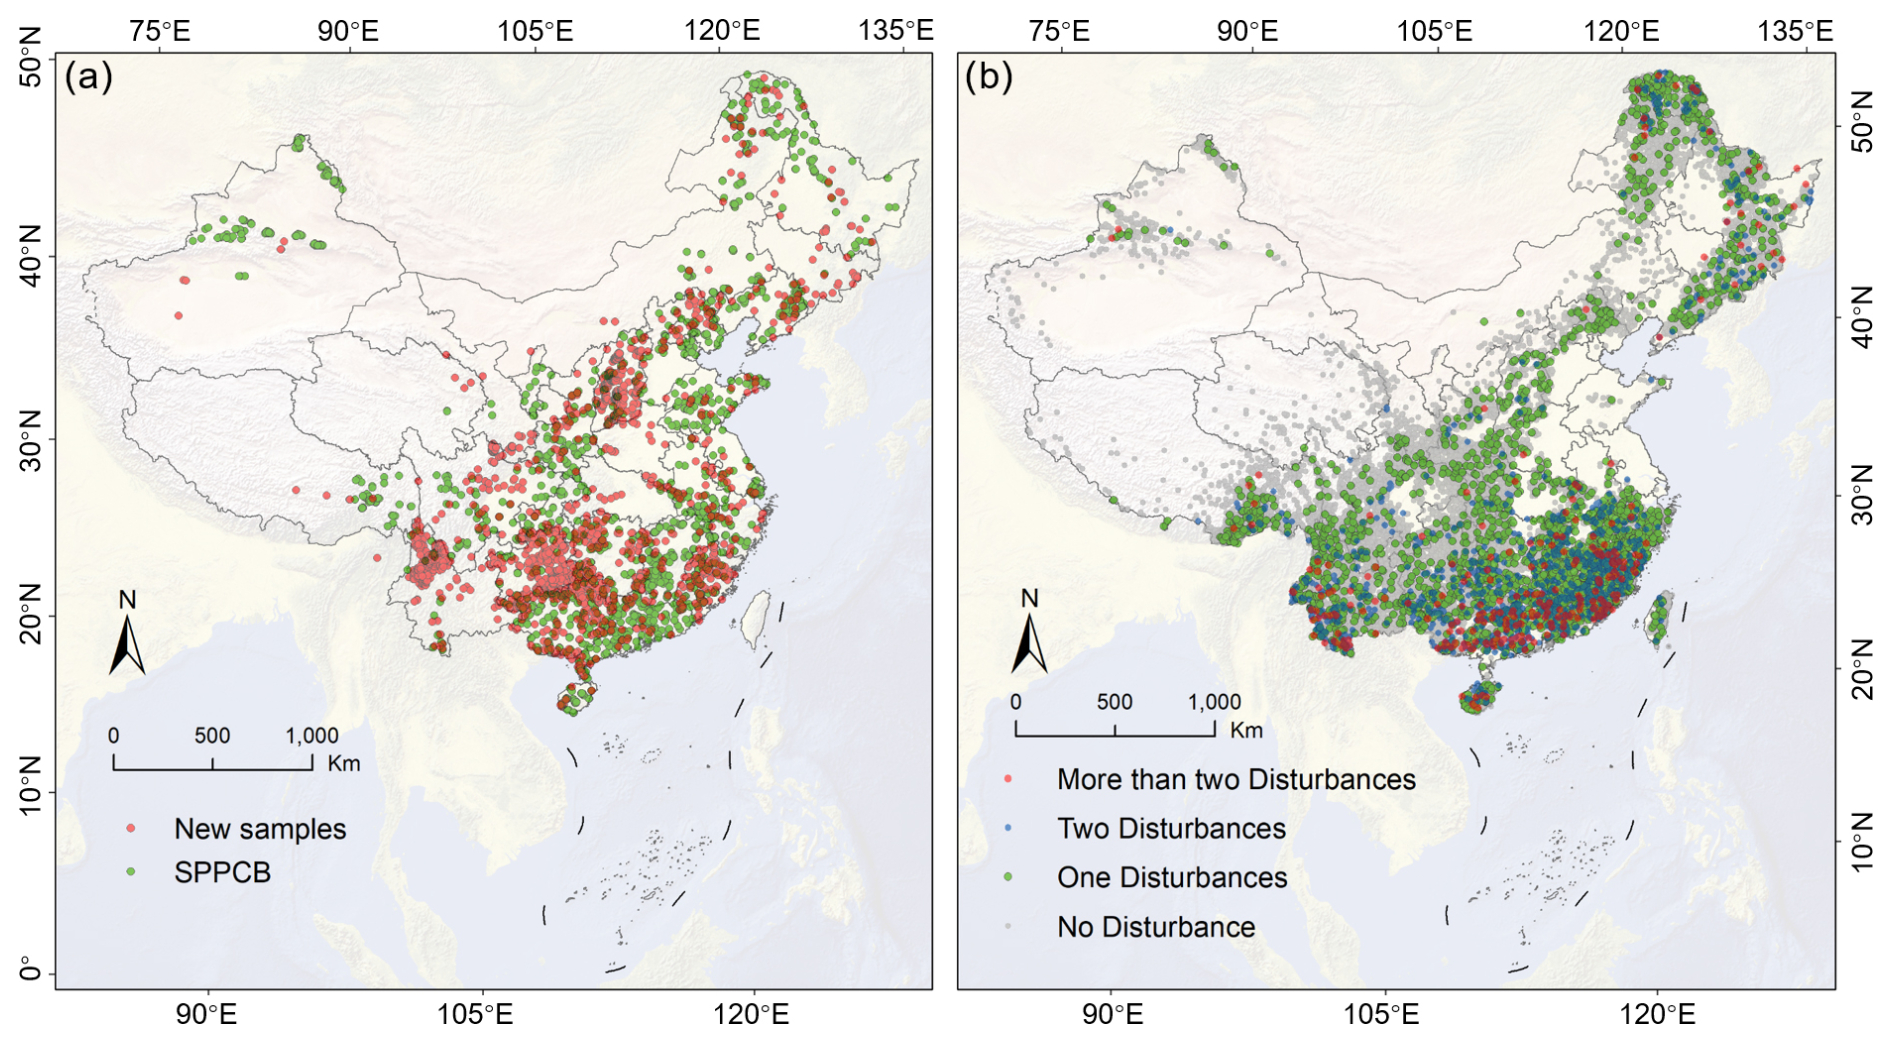
Figure 2Spatial distribution of reference samples for forest age mapping and validation. Panel (a) shows the reference forest age samples, while panel (b) displays the reference forest disturbance samples.
The reference forest disturbance samples (Fig. 2b) were used to validate the ages of forests disturbed at least once between 1986 and 2022. The age of these samples was derived from the number of years since the disturbance event. The reference forest disturbance samples were interpreted through analysis of time-series images from Google Earth, PlanetScope, Sentinel-2, or Landsat 5/7/8, with each event confirmed by at least two clear-sky images taken before and after the disturbance (Qiu et al., 2023; Shang et al., 2025). The interpretation of reference forest disturbance samples was performed in three stages. Initially, samples were divided into sets of 1000 samples, with each of the 13 experts independently interpreting three sets. This ensured that each set was reviewed by at least three experts. For each set, samples unanimously identified by three experts (consistency rate 43 %–81 %) were accepted as final. In the second stage, samples identified by two experts were reviewed by a fourth expert, while those with no consensus were reviewed by both a fourth and fifth expert. Samples confirmed by at least three experts were accepted as final. In the final stage, remaining unconfirmed samples were voted on by all experts, with those receiving over 50 % of the votes being accepted as final. A total of 12 328 forest disturbance samples were interpreted, with 4168 samples having at least one forest disturbance. Of these, 2157 samples experienced a single disturbance event between 1986 and 2022, 1274 points had two disturbances, and 737 points were disturbed more than twice.
2.2.3 Forest extent and forest cover type data
The China Land Cover Dataset (CLCD; Yang and Huang, 2021) was used to indicate the dynamic forest extent of the forest age product. This dataset provides annual land cover information, including forest cover extent, for China from 1985 to 2022 at a 30 m spatial resolution, generated using Landsat imagery and random forest (RF) classifiers. It also has a comparable reliability to the Global Forest Change (GFC) dataset of Hansen et al. (2013) in terms of indicating forest changes (Yang and Huang, 2021). Moreover, several studies have demonstrated that the CLCD offers higher accuracy than other land cover products across China (Zhang et al., 2022; Ji et al., 2024).
A merged forest cover type dataset (Fig. 1) was used for forest age mapping, as forest age mapping requires forest cover types as inputs, which were not provided by the CLCD product. This dataset was merged from three forest cover type products (Shang et al., 2023a): GLC_FCS30 from 1985 to 2022 (Zhang et al., 2021c) at a 30 m resolution, GLASS-GLC from 1985 to 2020 (Liu et al., 2021) at a 30 m resolution, and ESA CCI LC from 1992 to 2019 (ESA, 2017) resampled to a 30 m resolution from a 300 m resolution. There were four merging rules: first, a forest type was designated if at least two products identified the same forest cover type; second, if all three products had different types, the type from GLC_FCS30 was used, as it closely matched China's ninth forest resource report; third, if GLC_FCS30 indicated non-forest, the type from GLASS-GLC was used due to its higher spatial resolution compared with ESA CCI; finally, if both GLC_FCS30 and GLASS-GLC indicated non-forest, the type from ESA CCI was utilized. The merged dataset and the three forest cover type datasets were validated against the field forest cover type data from the SPPCB project (Fang et al., 2018), and the accuracy of the merge dataset improved significantly. Specifically, the kappa coefficient (κ) of the merged dataset was 3.2 % higher than that of GLC_FCS30, 6.31 % higher than that of GLASS-GLC, and 8.4 % higher than that of ESA CCI LC.
2.2.4 Forest height data
Two forest height products with the same forest definition at a 30 m spatial resolution for the year 2019 (Potapov et al., 2021; Liu et al., 2022) were employed to map the age of undisturbed forests. Potapov et al. (2021) utilized machine learning methods with Landsat data and Global Ecosystem Dynamics Investigation (GEDI) footprint forest height data to generate a global forest canopy height map at a 30 m spatial resolution for the year 2019 (shortened to “Potapov's forest height product”), while Liu et al. (2022) developed a neural-network-guided interpolation (NNGI) method to derive China's forest height map at a 30 m spatial resolution for 2019 (shortened to “Liu's forest height product”), using Landsat data along with GEDI and ICESat-2 footprint forest height data. Due to consideration of topographic influences and high-quality control standards, Liu's forest height product exhibited higher accuracy but had a smaller forest extent in China than Potapov's forest height product (Liu et al., 2022). Therefore, this study primarily used Liu's forest height product. When Liu's forest height product was missing compared with the forest extent identified in CLCD, Potapov's forest height product was used as a substitute.
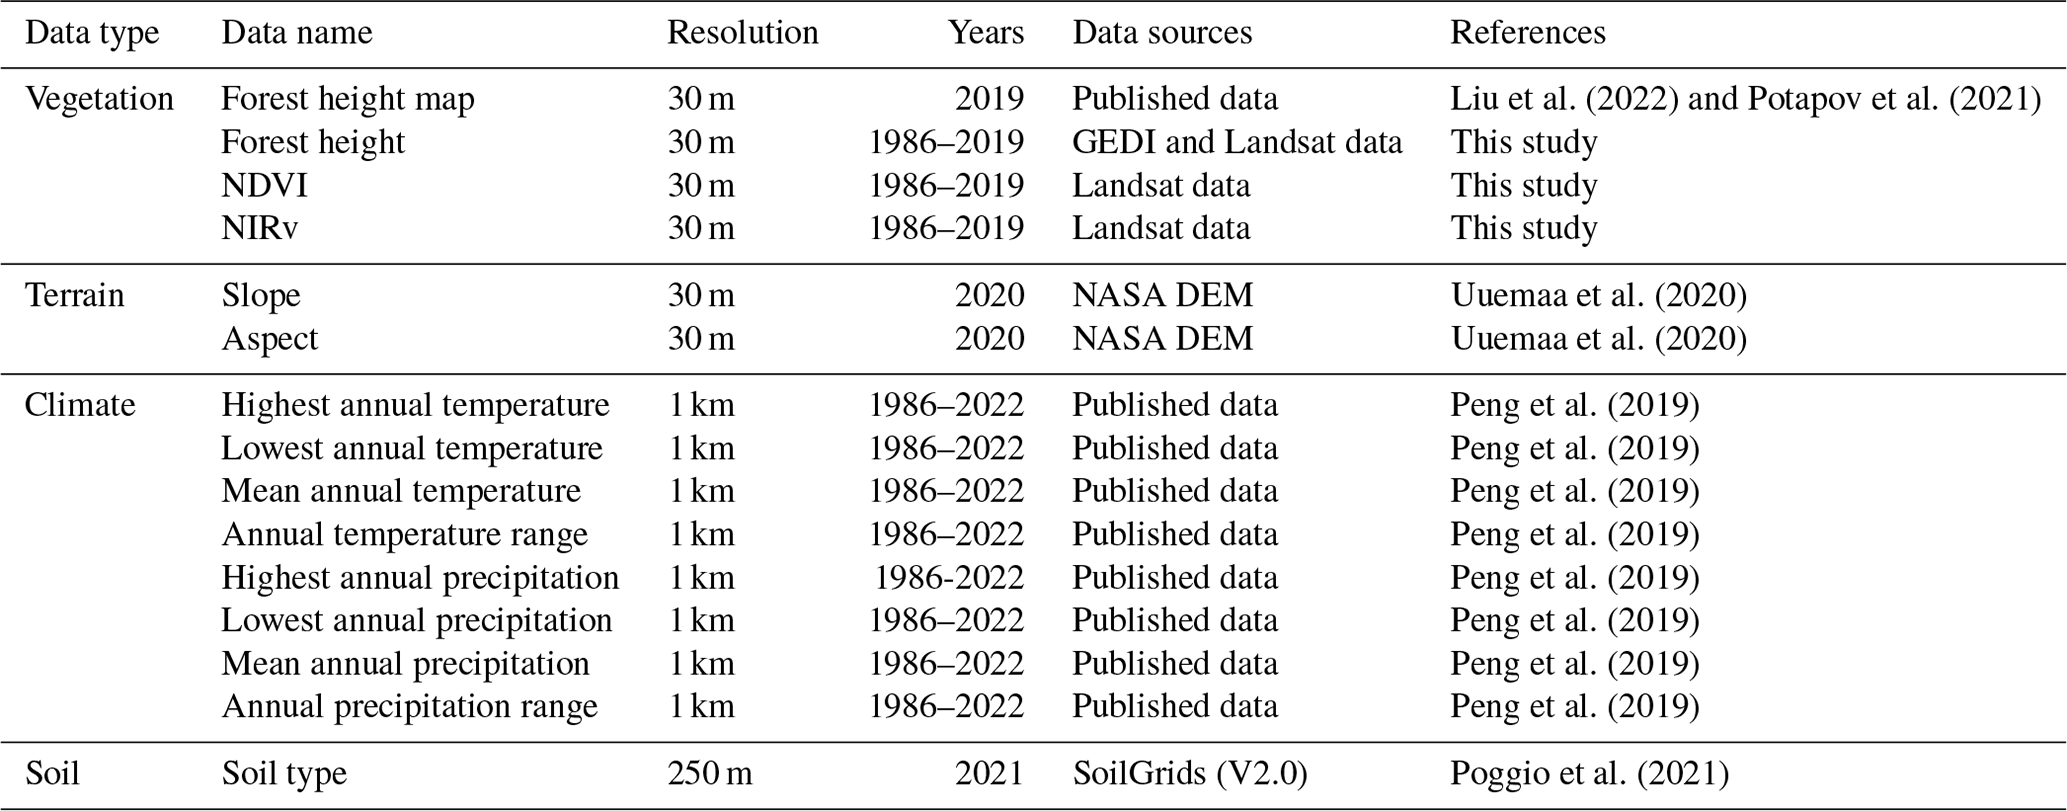
Table 1Descriptions of the vegetation, terrain, climate, and soil data used for forest age mapping.
For forest pixels with missing forest heights from both the Liu and Potapov forest height products (0.32 % of pixels, based on the forest extent in CLCD), forest height was estimated using a machine learning method (detailed in Sect. 3.2.2) that integrates Landsat data, climate data, terrain data, and GEDI footprint forest height data. The input Landsat data consist of surface reflectance from Landsat 5, 7, and 8 and two calculated vegetation indices (NDVI and NIRv). The input data from GEDI, launched by NASA in December 2018 and covering the Earth's land surface from 51.6° N to 51.6° S (Dubayah et al., 2020), primarily include the L2A relative height data, which have demonstrated the best performance with respect to global forest height mapping (Potapov et al., 2021).
2.2.5 Other data
The vegetation, terrain, climate, and soil data used for mapping forest age are summarized in Table 1. Aside from forest height and cover type data, vegetation data also include two vegetation indices, NDVI and NIRv, calculated from Landsat data. Terrain data mainly include the slope and aspect calculated from 30 m resolution NASA DEM data, chosen due to their extensive use and the fact that they comprise one of the most prevalent global DEM products across diverse applications (Su et al., 2015). Climate data include temperature and precipitation, which are further divided into the following eight variables: highest annual temperature (HAT), lowest annual temperature (LAT), mean annual temperature (MAT), annual temperature range (ATR), highest annual precipitation (HAP), lowest annual precipitation (LAP), mean annual precipitation (MAP), and annual precipitation range (APR). These variables are all relevant to forest growth, as they influence various aspects of forest health and development, such as tree physiology, species distribution, and overall ecosystem productivity (Leuschner and Ellenberg, 2017; Chapin et al., 2011). These climate variables were extracted from a dataset of monthly precipitation and temperature at a 1 km resolution for China spanning the period from 1901 to 2023 (Peng et al., 2019). This dataset was derived from global Climatic Research Unit (CRU) and WorldClim climate datasets and data from 496 observation stations using the delta-space downscaling method (Peng et al., 2019). Soil type data were obtained from the SoilGrids 2.0 product, which applies machine learning to soil observations from approximately 240 000 global locations, using over 400 environmental covariates related to vegetation, terrain, climate, geology, and hydrology to map global soil properties at a 250 m resolution (Poggio et al., 2021).
3.1 Forest age mapping
Forest age mapping was divided into two parts: disturbed forests and undisturbed forests. For disturbed forests, age was primarily determined based on forest disturbance monitoring. For undisturbed forests, random forests were used to map forest age based on vegetation, terrain, climate, and soil data. Figure 3 shows the flowchart of forest age mapping, and this process comprised three steps: mapping the age of disturbed forests through forest disturbance monitoring (Sect. 3.2.1), retrieving the forest height for undisturbed forests (Sect. 3.2.2), and mapping the age of undisturbed forests using random forests (Sect. 3.2.3).
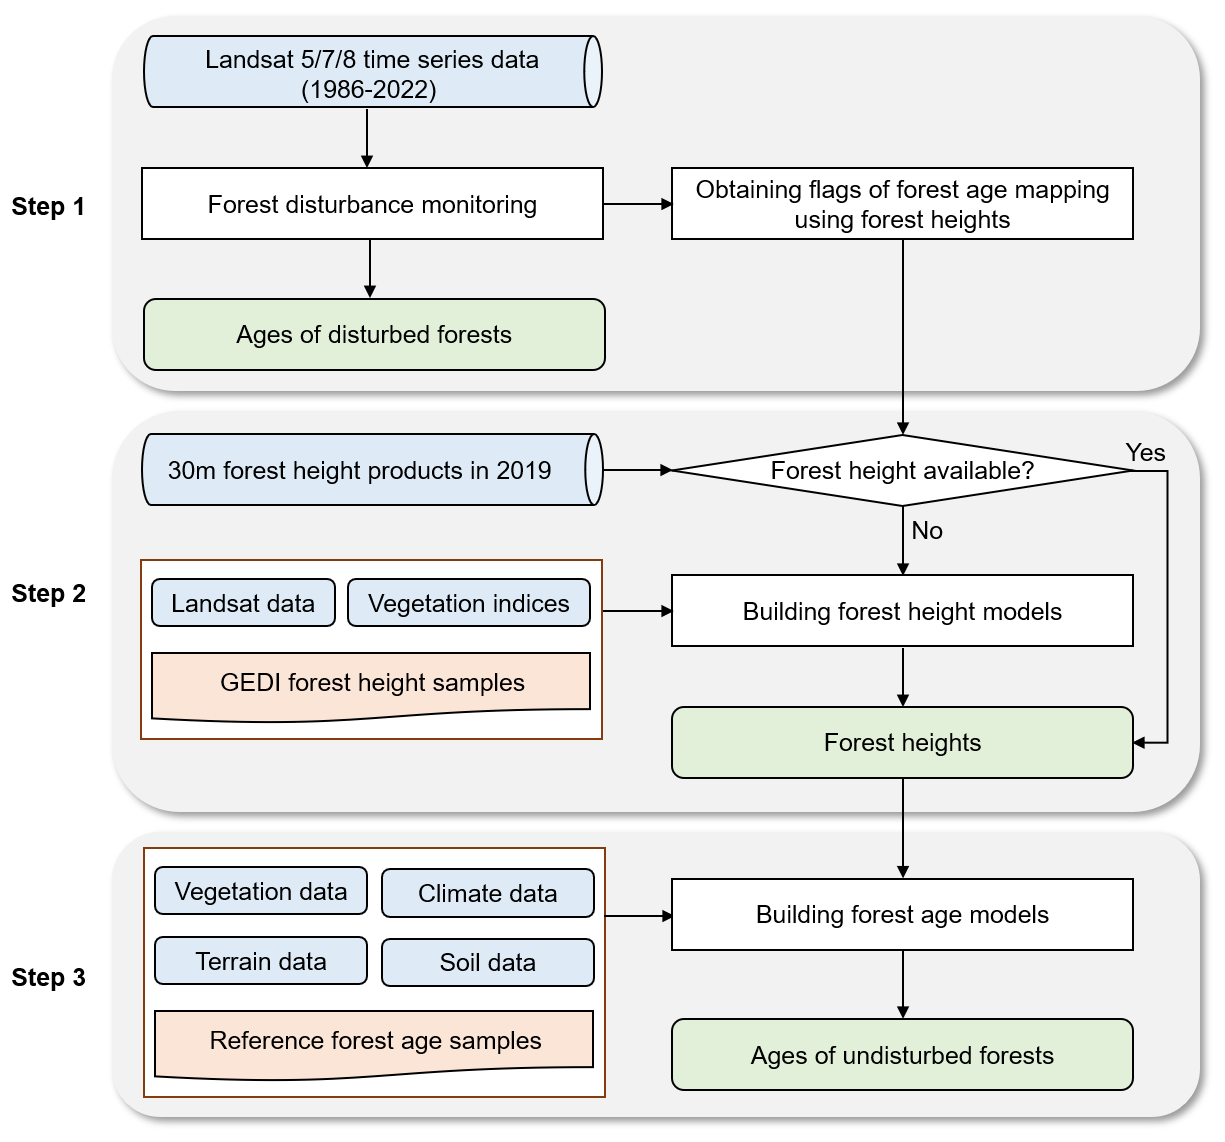
Figure 3The flowchart of China's annual forest age mapping from 1986 to 2022. There process was comprised of three steps: mapping the age of disturbed forests using forest disturbance monitoring (Step 1), retrieving the forest height for undisturbed forests (Step 2), and mapping the age of undisturbed forests using random forests (Step 3).
Annual updates of forest age were based on the forest age in 2019 and the dates of detected forest disturbance (Fig. 4), with the age resetting to 0 in the disturbance year. For areas with no forest disturbance between 1986 and 2022 (Fig. 4a), the age for each year can be updated based on the number of years since 2019. For areas with a forest disturbance after 2019 (Fig. 4b), the age for years before 2019 can be updated based on the number of years since 2019, while the age for years after disturbance can be updated based on the number of years since the disturbance year. For areas with one (Fig. 4c) or more than one (Fig. 4d) occurrence of forest disturbance before 2019, the age for years before the first forest disturbance should be mapped based on the retrieved forest height and other data using random forests, while the age for years after each disturbance can be updated based on the number of years since the disturbance year.
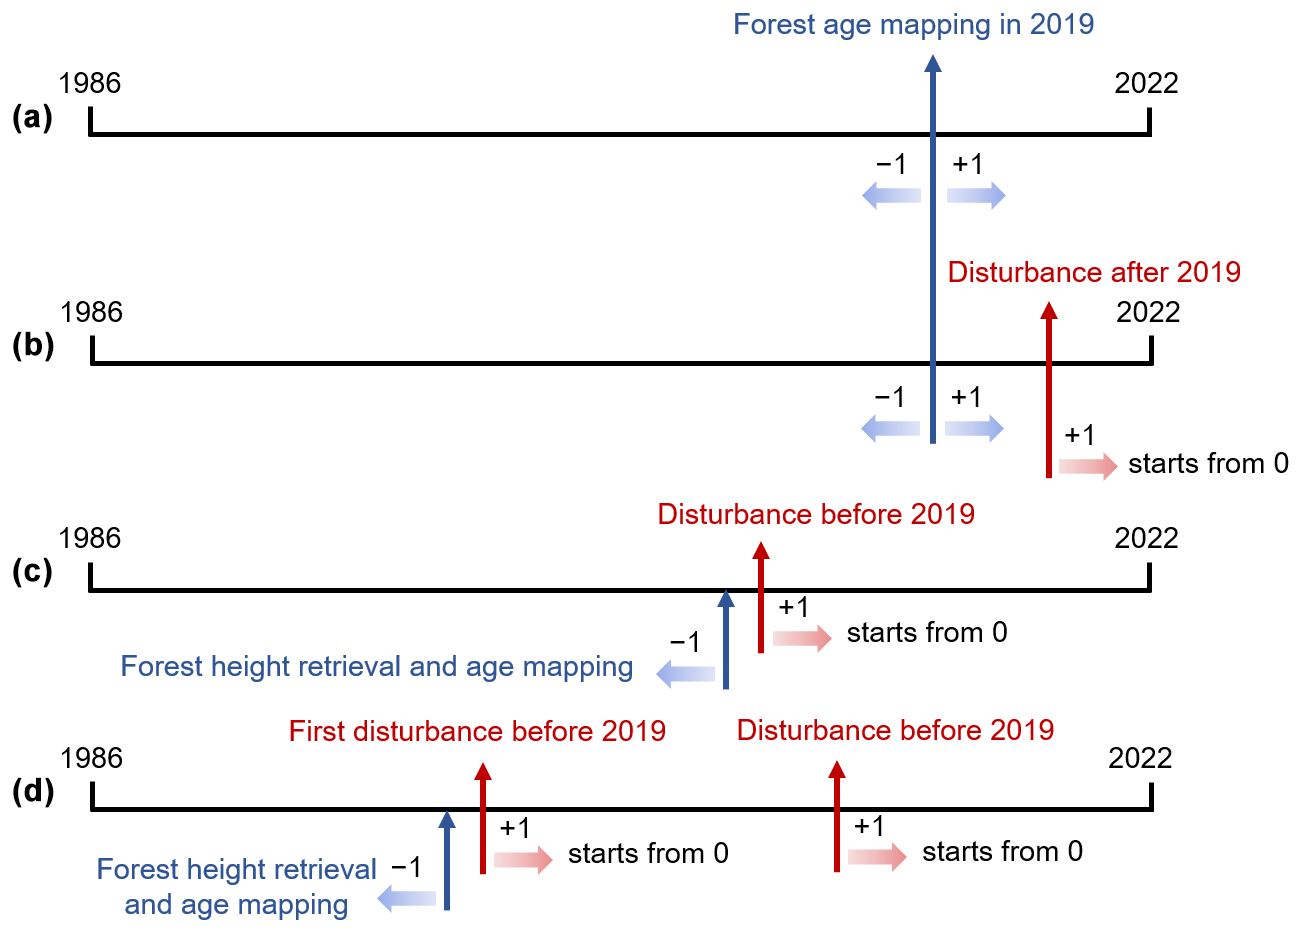
Figure 4Conceptual diagram of annual forest age updates. Panel (a) shows the situation with no forest disturbance between 1986 and 2022, panel (b) shows the situation with a forest disturbance after 2019, panel (c) shows the situation with one forest disturbance before 2019, and panel (d) shows the situation with more than one forest disturbance before 2019. If there is at least one disturbance before 2019, the forest height before the first disturbance should be retrieved to map forest age.
3.1.1 Mapping the age of disturbed forests through forest disturbance monitoring
Forest disturbances were detected using the mCOLD algorithm (Shang et al., 2025). The original COLD algorithm employs a time-series model to predict multi-band surface reflectance (Zhu et al., 2020). It then uses the χ2 distribution to quantify the differences between the multi-band predictions and observations, referred to as the change magnitude. Forest disturbances are confirmed based on two criteria (Zhu et al., 2020): a change magnitude criterion (a change magnitude calculated from the χ2 distribution corresponding to 0.99) and a timing criterion (at least six observations).
There were three modifications in mCOLD. First, spatial information was incorporated into forest disturbance monitoring. Due to differences in forest types and locations, adjacent pixels may exhibit varying change magnitudes from the same disturbance, and an algorithm with a uniform standard for disturbance confirmation may result in omissions. To avoid omissions, the data-adapted iterative steering kernel regression (DISKR) algorithm (Takeda et al., 2007) was used to incorporate spatial information from adjacent pixels within a window to enhance forest disturbance monitoring (Shang et al., 2025).
Second, the timing criterion for confirming a forest disturbance was revised from requiring at least six observations to meeting both a minimum of six observations and a minimum disturbance duration. This adjustment was made to account for the varying density of valid Landsat time-series observations across different locations, as data density can be twice as high in overlapping areas compared to non-overlapping areas (Zhang et al., 2021b). Relying solely on the number of observations could lead to inconsistencies in the timing of detected disturbances. By incorporating the duration criterion, this modification could address potential discrepancies and improve the temporal consistency of detected forest disturbances (Shang et al., 2022).
Last, forest disturbance monitoring was revised from a unidirectional approach (tracking from past to present) to a bidirectional approach (incorporating both past-to-present and present-to-past tracking). In unidirectional tracking, detecting early forest disturbances was often less accurate than detecting later ones due to the typically fewer observations available for building a reliable time-series model to detect the early disturbance (Zheng et al., 2022). Bidirectional monitoring addresses this issue by transforming early disturbances in the past-to-present tracking into later disturbances in the present-to-past tracking. This method ensured sufficient data for developing a more accurate time-series model for both early and late disturbances, thereby enhancing the overall accuracy of disturbance monitoring (Shang et al., 2025).
3.1.2 Forest height retrieval for undisturbed forests
Random forests with boosting trees, which can minimize biases and improve overall model performance (Jahan et al., 2021), were employed to estimate forest height in areas where forest height data were unavailable. The GEDI footprint forest height served as the training dataset for the forest height models, with the screening process following the methodology outlined by Liu et al. (2022). Specifically, for each GEDI footprint, six relative heights including RH75, RH80, RH85, RH90, RH95, and RH100 were selected. To reduce the influence of outliers, the maximum and minimum values were excluded, and the average of the remaining four relative height values was used to represent the relative height for each footprint. Furthermore, the quality of the samples was further ensured by filtering them using elevation data. TanDEM-X and SRTM elevation values recorded in the GEDI dataset were compared, and any samples with an elevation difference greater than 10 m were discarded.
To reduce the discrepancy between the retrieved forest height and the 2019 forest height products, the input factors for the tree height model were based on the study by Liu et al. (2022), incorporating DEM, slope, aspect, temperature, precipitation, and NDVI data. Additionally, this study expanded the input factors by incorporating Landsat 8 surface reflectance and the calculated NIRv vegetation index, which approximates forest productivity (Badgley et al., 2019). This resulted in a total of 13 input factors used in the tree height model. The models were constructed separately for different environmental conditions and forest types across China. Specifically, six regions (East, South, North, Northeastern, Northwestern, and Southwestern China) and five forest types (EBF, ENF, DBF, DNF, and MF) were considered. Each model was trained using 70 % of the filtered GEDI footprint forest height samples, with the remaining 30 % used for validation. As no GEDI footprint forest height samples were available prior to 2019, the forest height retrieval for years before 2019 at a specific forest type and region utilized the same model as 2019 but with varied inputs corresponding to their respective years. These forests, which required height retrieval, covered only a small portion of the total forest pixels, with an average of 0.42 % (see details in Sect. 5.2).
In addition to estimating forest height in areas where forest height data were unavailable, forest height was also estimated for randomly selected samples in regions where the 2019 forest height product was available. This allowed for an evaluation of the differences between the estimated and product-based forest heights and their impact on forest age mapping (see details in Sect. 5.2).
3.1.3 Mapping the age of undisturbed forests using random forests
Random forests with boosting trees (Jahan et al., 2021) were also selected to map the age of undisturbed forests. This machine learning method showed the highest overall accuracy in forest age mapping at a 30 m spatial resolution among 5 stand growth equations and 12 machine learning methods (Lin et al., 2023). The model used 15 inputs (Table 1): vegetation factors (forest height, NDVI, and NIRv), terrain factors (slope and aspect), climate factors (HAT, LAT, MAT, ATR, HAP, LAP, and MAP), and one soil factor (soil type). Tree height was selected due to its dominant role in forest age mapping (Lin et al., 2023), while the NDVI and NIRv (Eqs. 1 and 2) could reflect forest greenness and productivity. Terrain factors such as slope and aspect also affected forest growth (Lang et al., 2010). Temperature and precipitation were included, as forest growth is sensitive to climatic conditions (Besnard et al., 2021). Soil type was also considered for its effect on vegetation growth. The NDVI and NIRv were calculated as follows:
Here, NIRRef represents the surface reflectance at the near-infrared band, while REDRef represents the surface reflectance at the red band.
Given the regional and forest cover type heterogeneity across China, this study divided the model construction into six regions and five forest cover types. An RF model was developed for each forest cover type within each region. In regions where certain forest cover types had fewer than 30 sample points, those regions were merged, resulting in a total of 22 forest age models. This stratified approach aims to enhance the accuracy of forest age mapping, as forest types can also influence the accuracy of forest age mapping (Lin et al., 2023). For each forest cover type within a region, 70 % of the randomly selected reference forest age samples were used for model training, while the remaining 30 % were used for validation. To mitigate the effects of autocorrelation between the input factors, this study proposed an automatic iterative selection mechanism, aimed at reducing autocorrelation by minimizing the number of input factors. The process began by using all input factors to estimate forest age, followed by extracting the contribution weights of each factor. Factors with a contribution weight of less than 0.5 % were removed. The remaining factors were then used to re-estimate forest age. This iterative process was repeated three times, with factors contributing less than 0.5 % being excluded in each iteration, and the final model after three iterations was used for forest age estimation. In addition to input feature screening, we also performed sensitivity analysis to determine the optimal thresholds for the minimum leaf size and number of trees for each model. The minimum leaf size was varied from 5 to 30, with an interval of 5, while the number of trees was adjusted from 50 to 300, with an interval of 50. The optimal thresholds were identified as those corresponding to the minimum root-mean-square error (RMSE) of the mapped forest age (Table 2).
Table 2Parameters of the forest age mapping models for different regions and forest cover types. The abbreviations used in the table are as follows: EBF – evergreen broad-leaved forest; DBF – deciduous broad-leaved forest; ENF – evergreen coniferous forest; DNF – deciduous coniferous forest; MF – mixed forest; N – North China; NE – Northeastern China; E – East China; S – South China; SW – Southwestern China; NW – Northwestern China.

The absolute mean SHapley Additive exPlanations (SHAP) values were calculated to indicate the importance of each input factor, as SHAP values have been widely used to explain the significance of various inputs in machine learning models (Lundberg and Lee, 2017; Lundberg et al., 2018). By evaluating the contribution of each input factor to the model, SHAP values can rank the importance of these factors: the higher the SHAP value, the greater the contribution of the factor to the model (Sun et al., 2023). The importance of each input factor for forest age mapping is discussed in Sect. 5.1.
3.2 Validation methods
This study used the coefficient of determination (R2) and RMSE as two validation metrics (Lin et al., 2023) to reflect the accuracy of the mapped forest age. These metrics were calculated as follows:
where N represents the number of reference samples, i represents the ith sample, Xi represents the forest age of the reference sample, represents the mapped forest age, and represents the average value of the reference forest age. Higher R2 values and lower RMSE values indicate better accuracy of forest age mapping. The RMSE was considered a more indicative measure than the R2 value because, while the R2 value shows the degree of data dispersion and can be high even with large deviations, the RMSE directly measures the deviation between mapped and reference forest ages, providing a clearer indication of the accuracy (Lin et al., 2023).
The mapped forest ages were validated in two parts: disturbed forests and undisturbed forests. For disturbed forests, the validation was performed using a 30 % subset of randomly selected reference forest disturbance samples (Fig. 2a); for undisturbed forests, validation was based on a 30 % subset of randomly selected reference forest age samples (Fig. 2b). In addition to nationwide validation, we specifically assessed the mapped forest ages in the NE and SW regions, where significant improvements were made in forest age mapping in the CAFA V2.0 product. Furthermore, as the age of undisturbed forests was mapped using separate RF models for different forest types, Sect. 5.3 discusses the accuracy differences in forest age mapping among different forest cover types.
3.3 Uncertainty analysis
The uncertainty analysis primarily focused on the mapped ages of undisturbed forests in 2019 using a height-based method, as a disturbance-based method generally has lower uncertainties in mapping forest ages compared to a height-based method (Shang et al., 2023a). The uncertainties of the mapped forest ages mainly stem from the models and their inputs. Among the model inputs, forest height has the most significant impact on forest age mapping (see Sect. 5.1 for details). Therefore, we concentrated solely on the uncertainty of input forest height in forest age mapping. The evaluation of the differences between the estimated and product-based forest heights and their impact on forest age mapping is discussed in Sect. 5.2. To assess the uncertainties of the age mapping models, we kept the inputs constant while varying the forest heights estimated by forest stand growth equations. Based on Zhang's forest stand growth equations in China (Zhang et al., 2014), we calculated the relative forest heights for the years 2017, 2018, 2020, and 2021, according to the region and forest types. These forest heights were then used as inputs to map forest ages, and their standard deviation was calculated to represent the uncertainties.
4.1 China's annual forest age at a 30 m resolution from 1986 to 2022
A dynamic forest age dataset (CAFA V2.0) covering the whole of China from 1986 to 2022 (Shang et al., 2023b), with a spatial resolution of 30 m, was generated by integrating forest disturbance mapping and random forests methods. Figure 5 illustrates the distribution of forest ages for the year 2019, alongside comparisons with data from 1986, 2000, 2010, and 2022. This forest age dataset indicates that China's forest age structure predominantly consists of young and middle-aged forests, with an average forest age of 58.1±7.3 years in 2019. Old forests were predominantly found in the Northeastern, Northwestern, and Southwestern regions of China. These areas, characterized by high mountains and minimal human interference, were largely comprised of natural and secondary forests. In contrast, forests disturbed at least once during the period from 1986 to 2022 exhibited younger ages, generally below 37 years. Such forests were mainly concentrated in the southeastern and central southern regions, where human disturbances were more prevalent. Furthermore, in the northeast, there were also young forests that had regenerated after extensive forest fires, such as the devastating forest fire that occurred on 6 May 1987 (Cahoon et al., 1991). This fire caused varying degrees of damage across a vast area of China, impacting more than 1×10⁶ ha of forests.
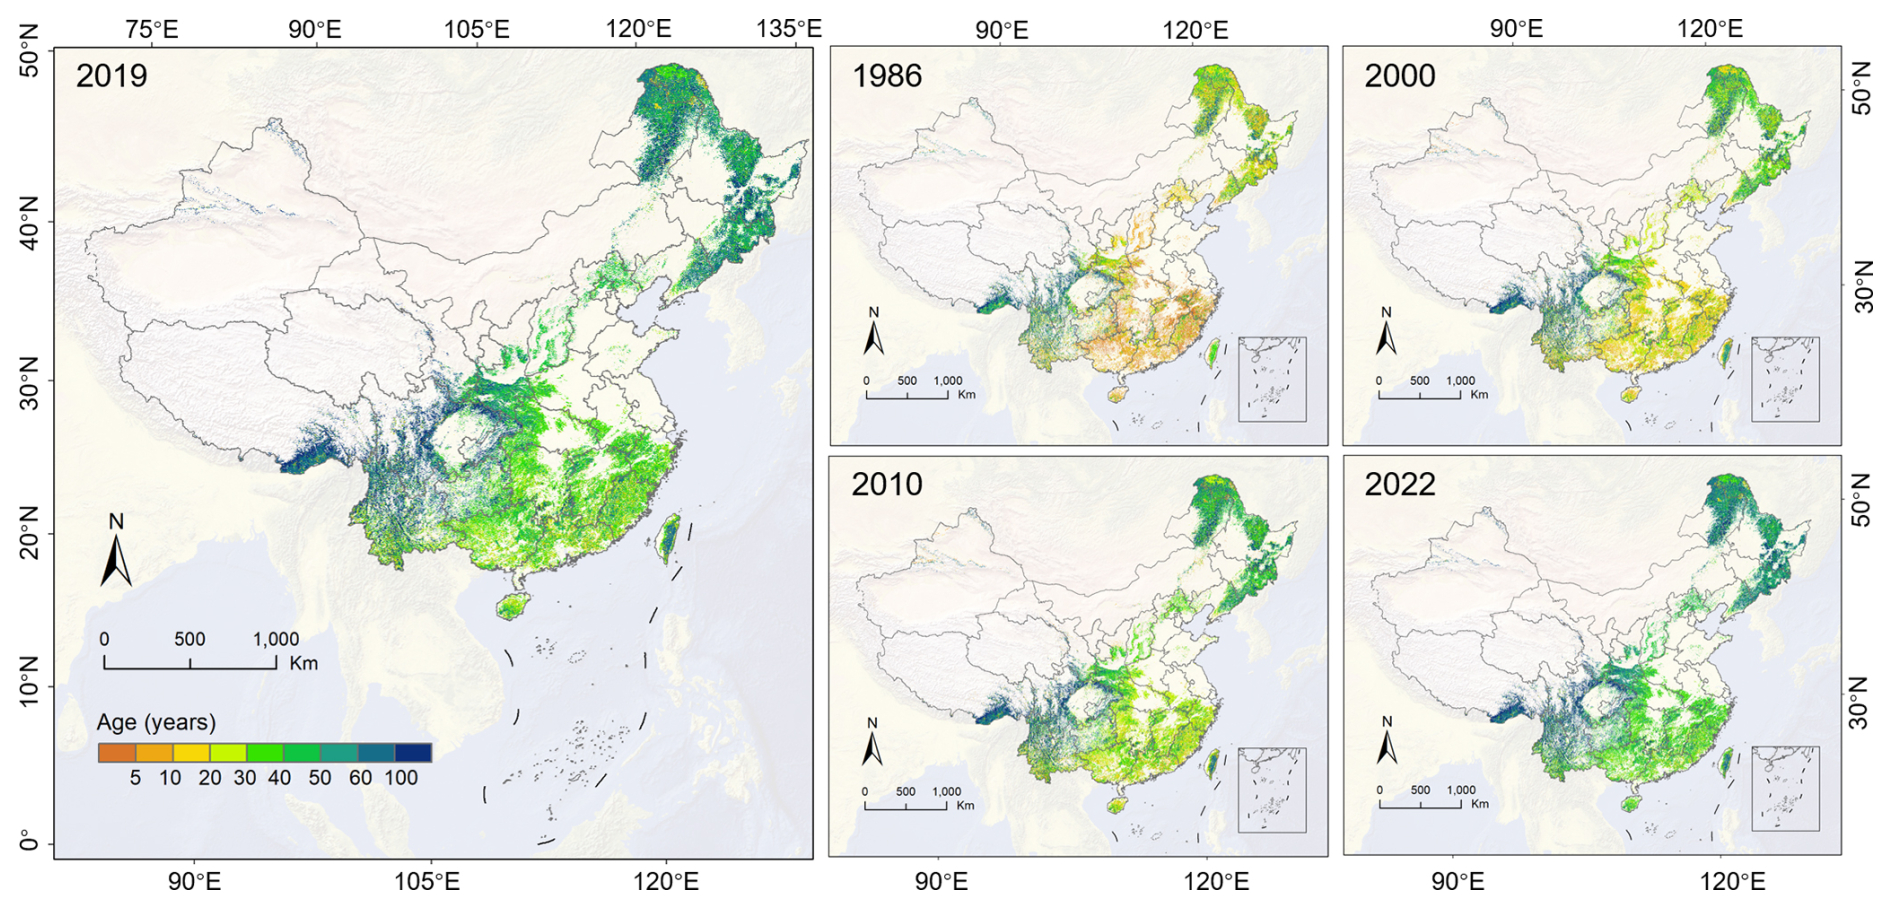
Figure 5Spatial distribution of China's forest age in 2019 and other selected years (1986, 2000, 2010, and 2022) in the CAFA V2.0 dataset.
According to the 2020 map of China's planted and natural forests (Cheng et al., 2024), natural forests were older than planted forests, with average ages of 69.9±12.8 and 48.4±6.9 years, respectively. Regional variations were evident, with the age gap between natural and planted forests ranging from 3.5 to 20.2 years. Southwestern China had the oldest natural forests (91.1±21.6 years) and planted forests (74.8±18.1 years), while East and South China showed lower average ages due to higher disturbance frequencies.
The temporal dynamics of China's forest ages were primarily influenced by both forest loss disturbances (such as forest fire, harvest, and other disturbances) and forest gain disturbances (such as afforestation and reforestation), which mainly led to a reduction in China's average forest age. From 1987 to 2022, the age reduction caused by forest disturbances showed a decreasing trend, with an average age reduction of years. However, in 1987, 2008, and 2021, the forest age reduction caused by disturbances was significant, indicating that there were more forest disturbances in these 3 years.
The uncertainty analysis was performed on the mapped ages of undisturbed forests in 2019 (Fig. 6). In most regions, the mapped forest age in 2019 exhibited relatively low uncertainty, with an average uncertainty of 8.7 years across China. However, the Southwestern region displayed higher uncertainty, exceeding 40 years in Tibet and certain mountainous areas of Sichuan Province. This elevated uncertainty may be attributed to the heightened sensitivity of age mapping models to forest height in the Southwestern region (see Sect. 5.1 for details). Additionally, the significant increase in forest height with age, as described by the forest stand growth equations in these areas (Zhang et al., 2014), further contributed to the increased uncertainty. Despite these regional variations, the mapped forest age in 2019 was generally stable and characterized by small uncertainties.
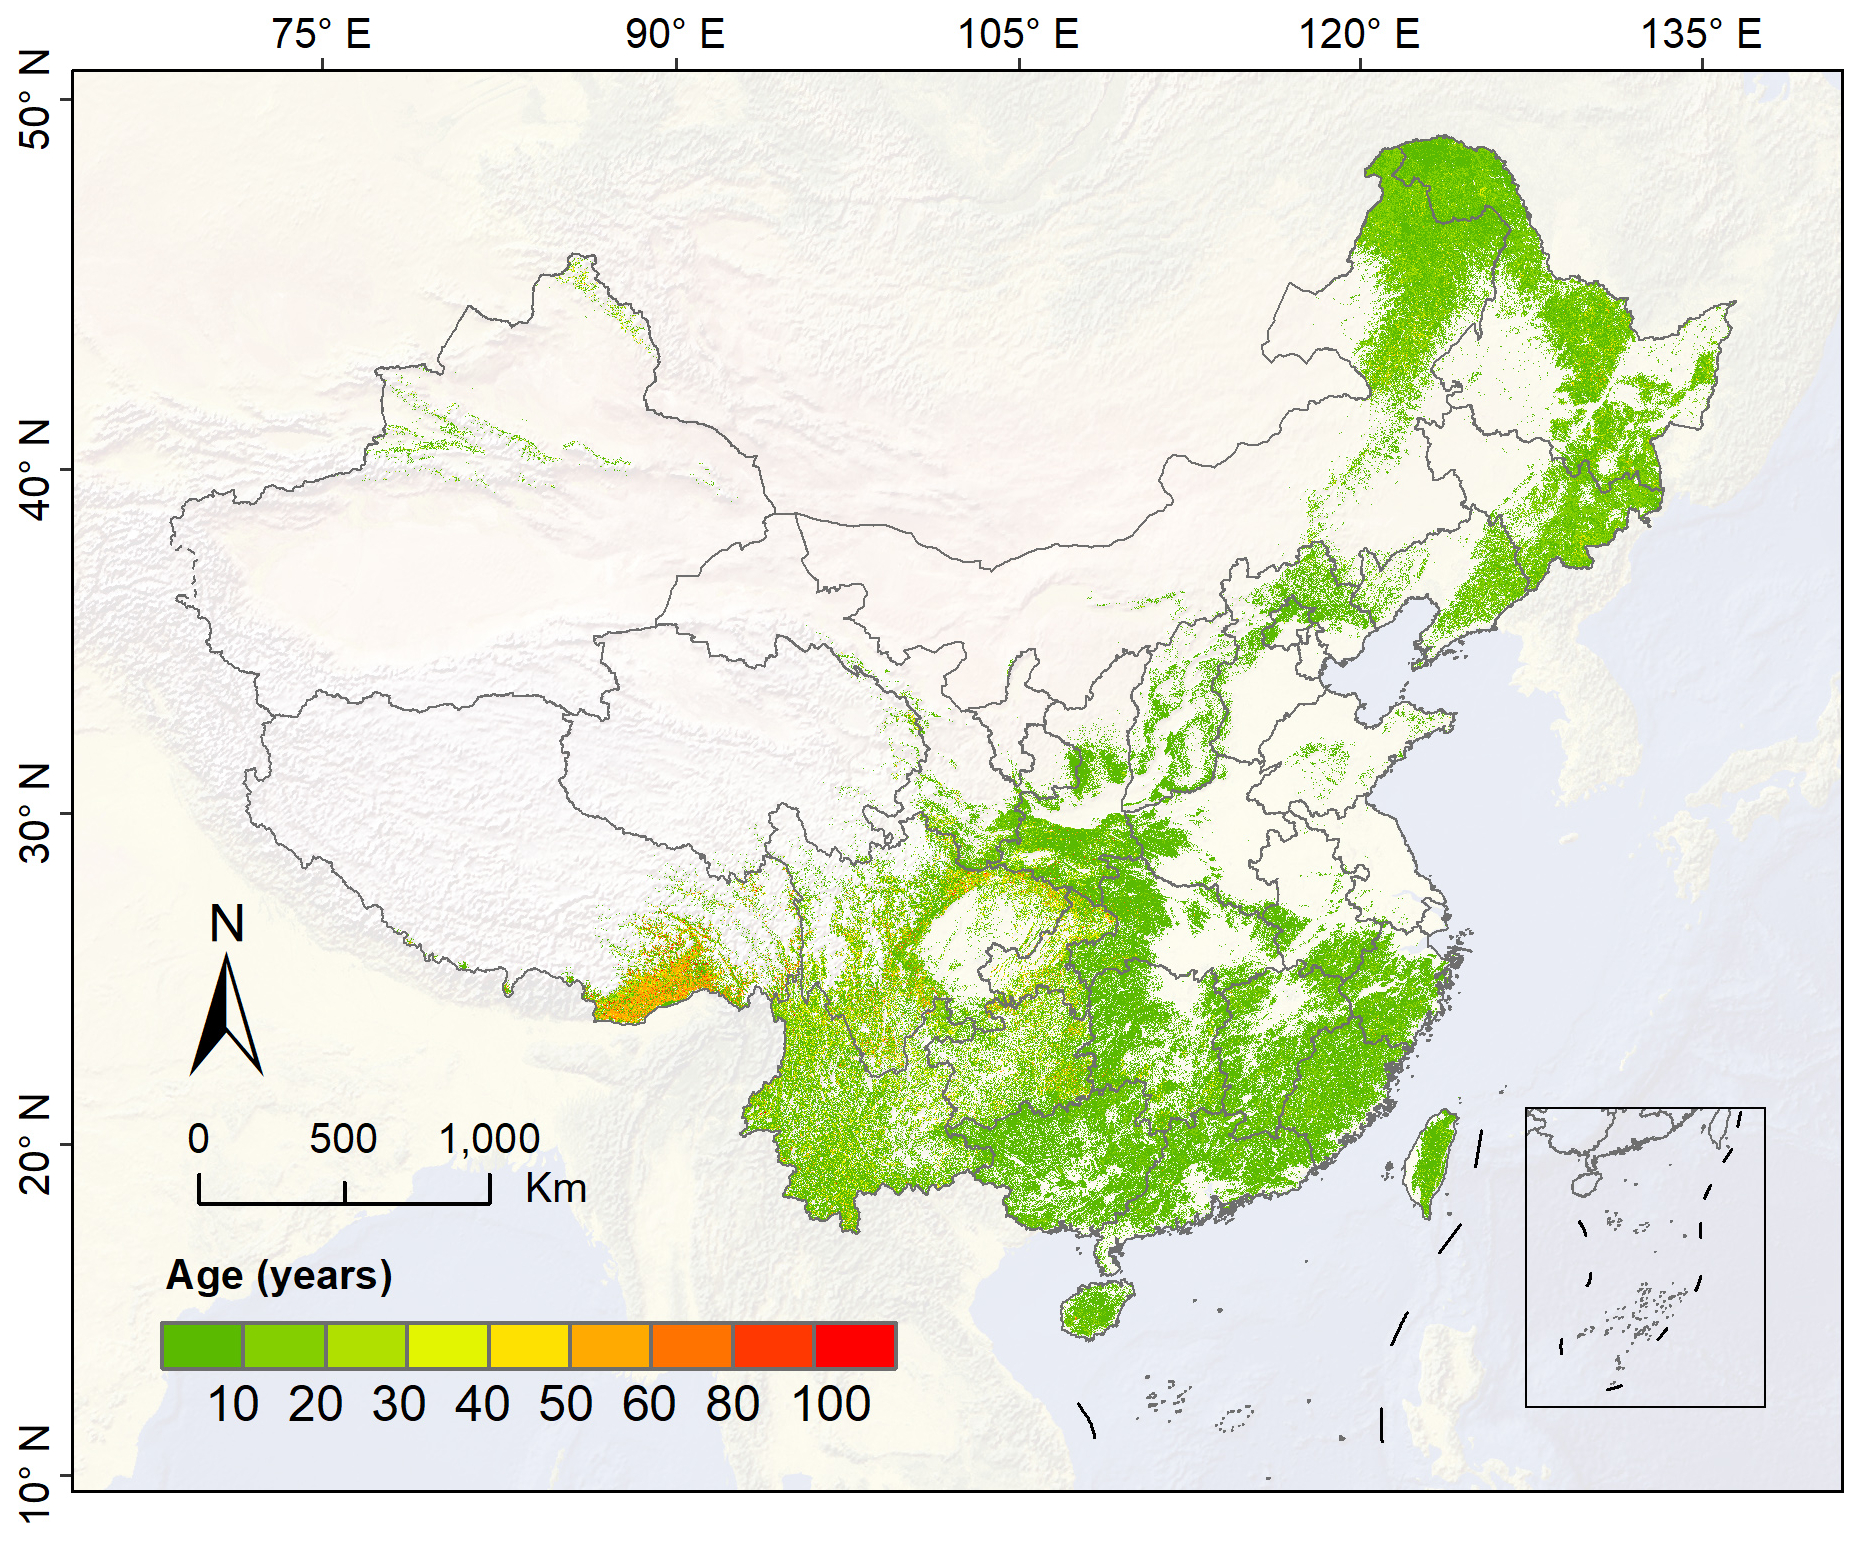
Figure 6Spatial distributions of the uncertainty of mapped forest age in 2019.
4.2 Validation of the forest age maps
The mapped forest age in 2019 was validated using a 30 % subset of two separate reference datasets (Fig. 7): one comprising 12 328 interpreted reference forest disturbance datasets and the other consisting of 5304 forest field survey samples in China. For undisturbed forests, the field-surveyed age was transformed from the survey year to 2019 by adding the difference in years. For disturbed forests, the reference age in 2019 was determined by calculating the number of years since the last disturbance. Validation results indicated that the mapped age of disturbed forest exhibited a small error of ±2.48 years, while the mapped age of undisturbed forest from 1986 to 2022 had a relatively large error of ±7.91 years. Compared to version 1.0, the RMSE of CAFA V2.0 forest age for disturbed forests decreased by 1.15, whereas for undisturbed forests, the RMSE decreased by 0.49.
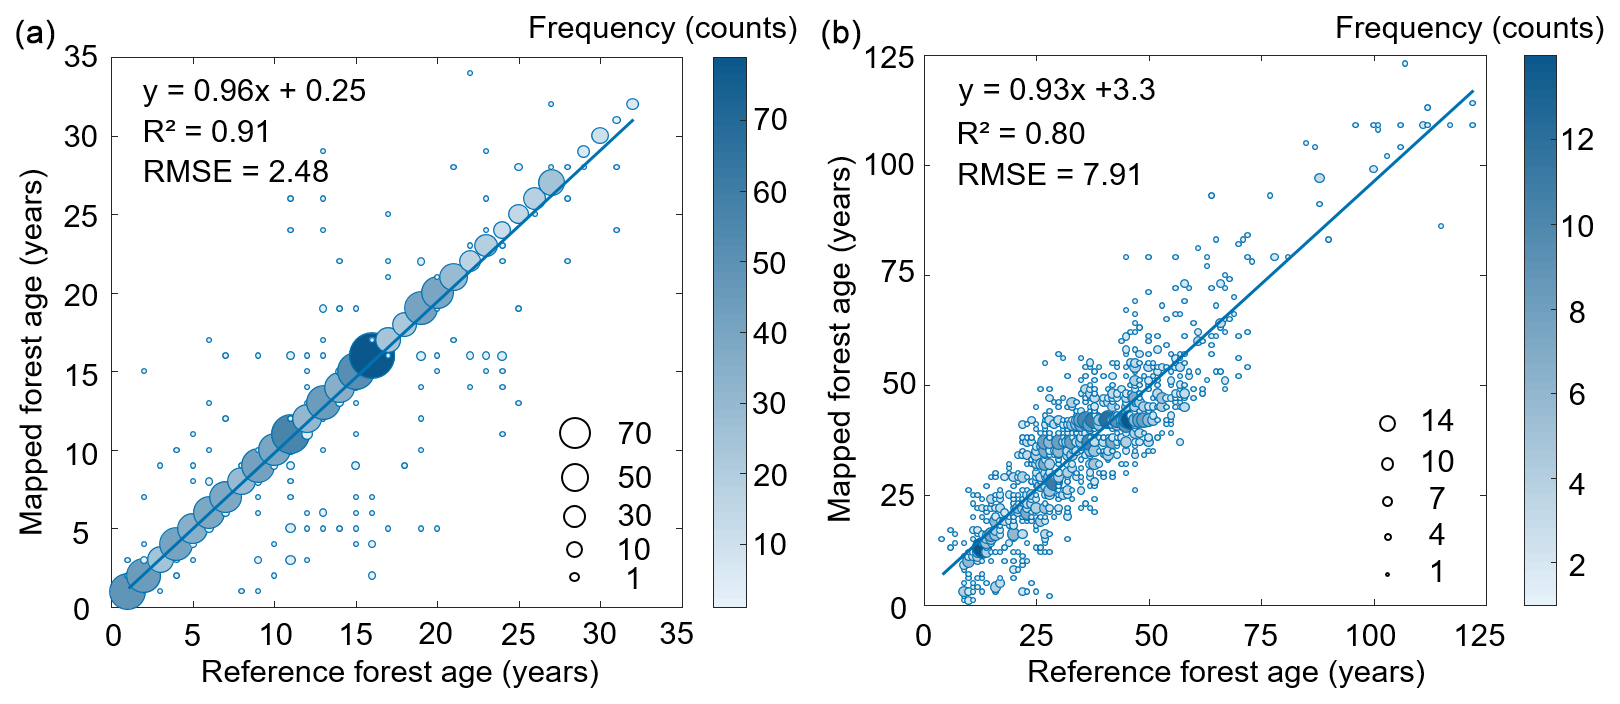
Figure 7Validation of China's forest age mapping in the CAFA V2.0 dataset. Panel (a) shows the age validation of forests disturbed at least once from 1986 to 2022, whereas panel (b) displays the age validation of undisturbed forests. The sizes and colors of the circles represent the number of samples at that location.
The enhancement in age accuracy for disturbed forests stemmed primarily from refining the forest disturbance monitoring algorithm. Figure 8 presents two typical examples of the mapped forest ages from forest disturbance monitoring using COLD, LandTrendr, and mCOLD. In both cases, mCOLD mapped a more accurate extent of the forest disturbances, and its results were used to mask the outputs of other algorithms. The first example pertains to a forest fire that occurred in 2010. Both COLD and LandTrendr detected the disturbance, but their detected extents were inaccurate with significant omissions. This resulted in substantial overestimations of forest age, which was derived using height-based methods. The second example involves a forest fire that took place in the winter. COLD identified the disturbance with an incomplete extent, whereas LandTrendr missed the disturbance entirely. Consequently, significant overestimations existed in the forest age products derived from these two algorithms. In comparison, mCOLD demonstrated superior performance with respect to identifying the full extent of the forest disturbances compared to LandTrendr and COLD. As a result, forest age mapping accuracy improved notably for disturbed forests using mCOLD, particularly in the Northeastern and Southwestern regions of China, where the RMSE values decreased by 0.71 and 1.9, respectively (Fig. 9a and c).
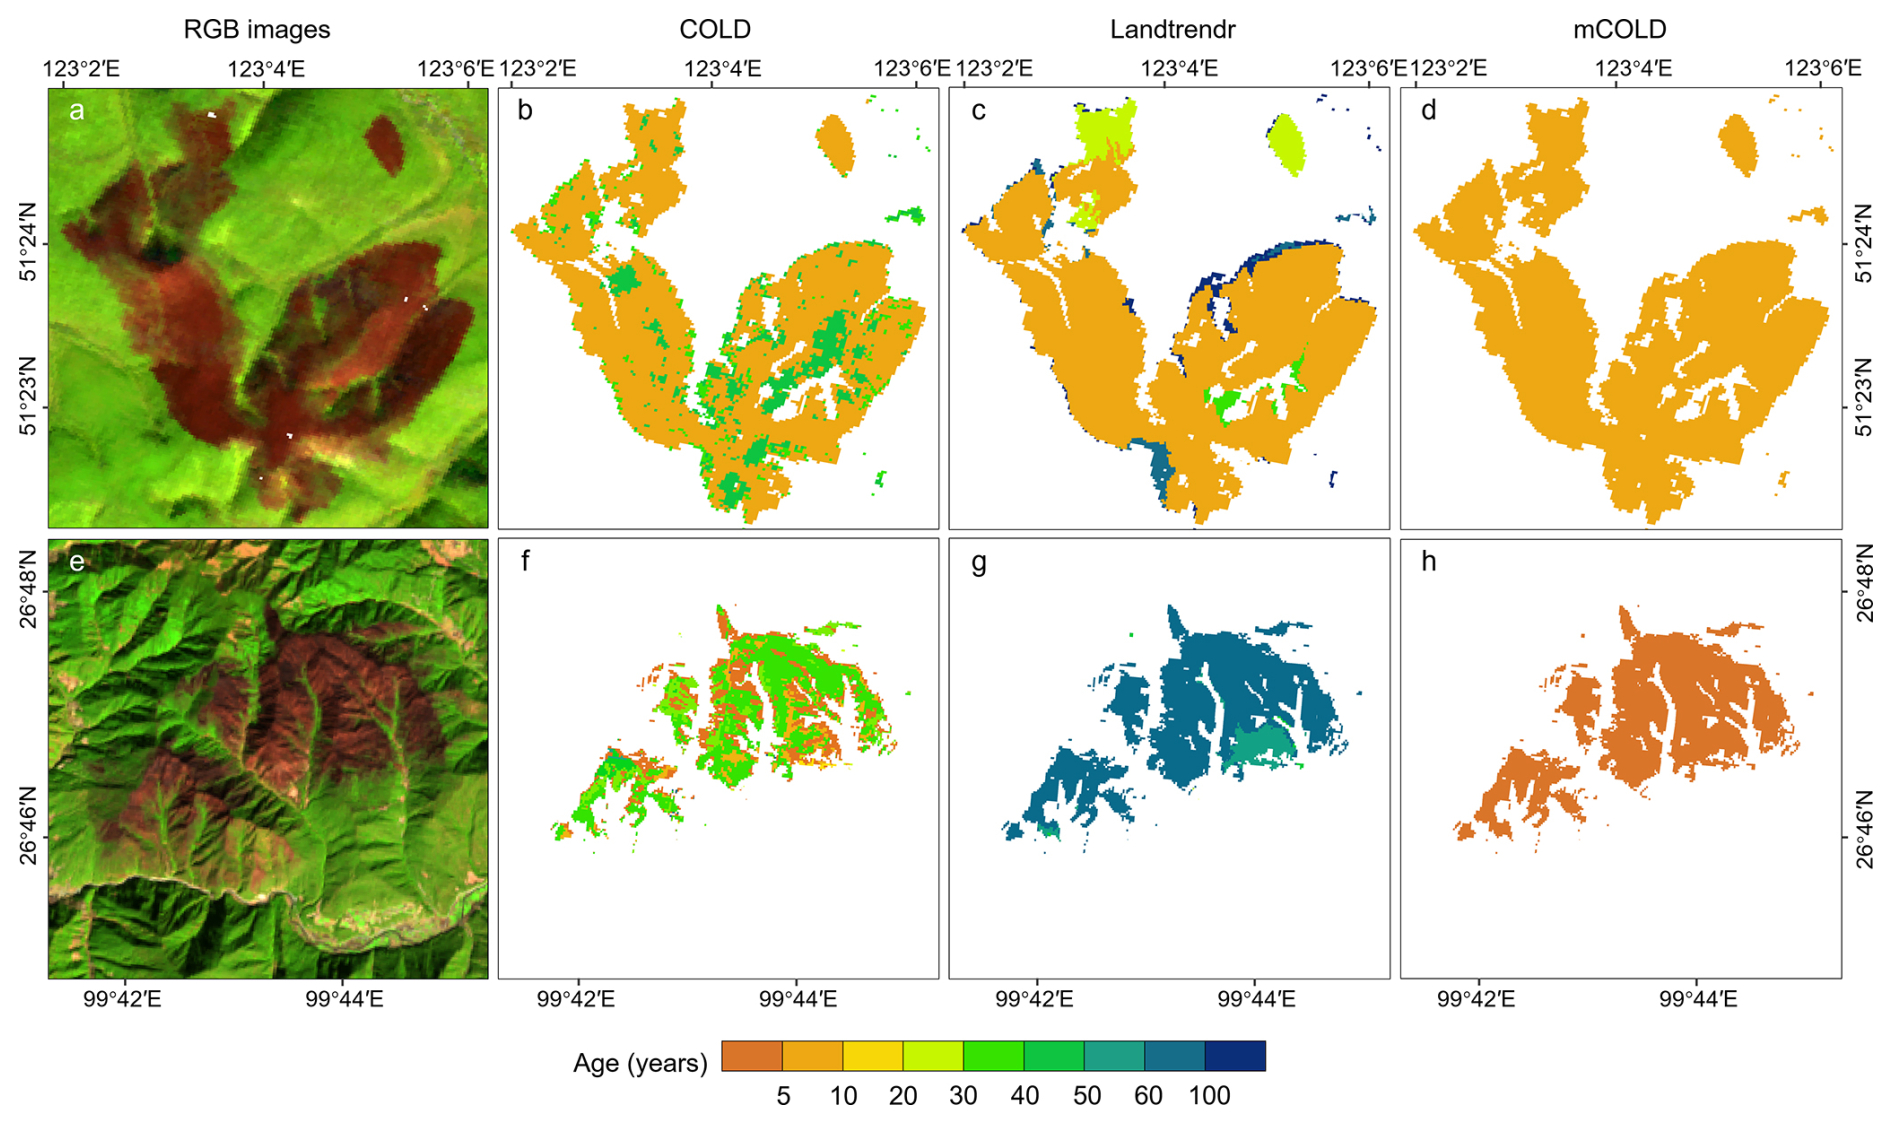
Figure 8Typical examples of the mapped forest age in 2019 using forest disturbance monitoring. The first example is a forest fire that occurred in March 2010, while the second example is a forest fire that happened in January 2017. Panels (a) and (e) present Landsat RGB composite images after forest disturbance on 10 March 2010 and 8 February 2017, respectively. Panels (b) and (f) show the mapped forest age using COLD (Shang et al., 2023a). Panels (c) and (g) present the mapped forest age (calculated by deducting 1 year from the 2020 forest age) using LandTrendr (Cheng et al., 2024). Panels (d) and (h) show the mapped forest age using mCOLD.
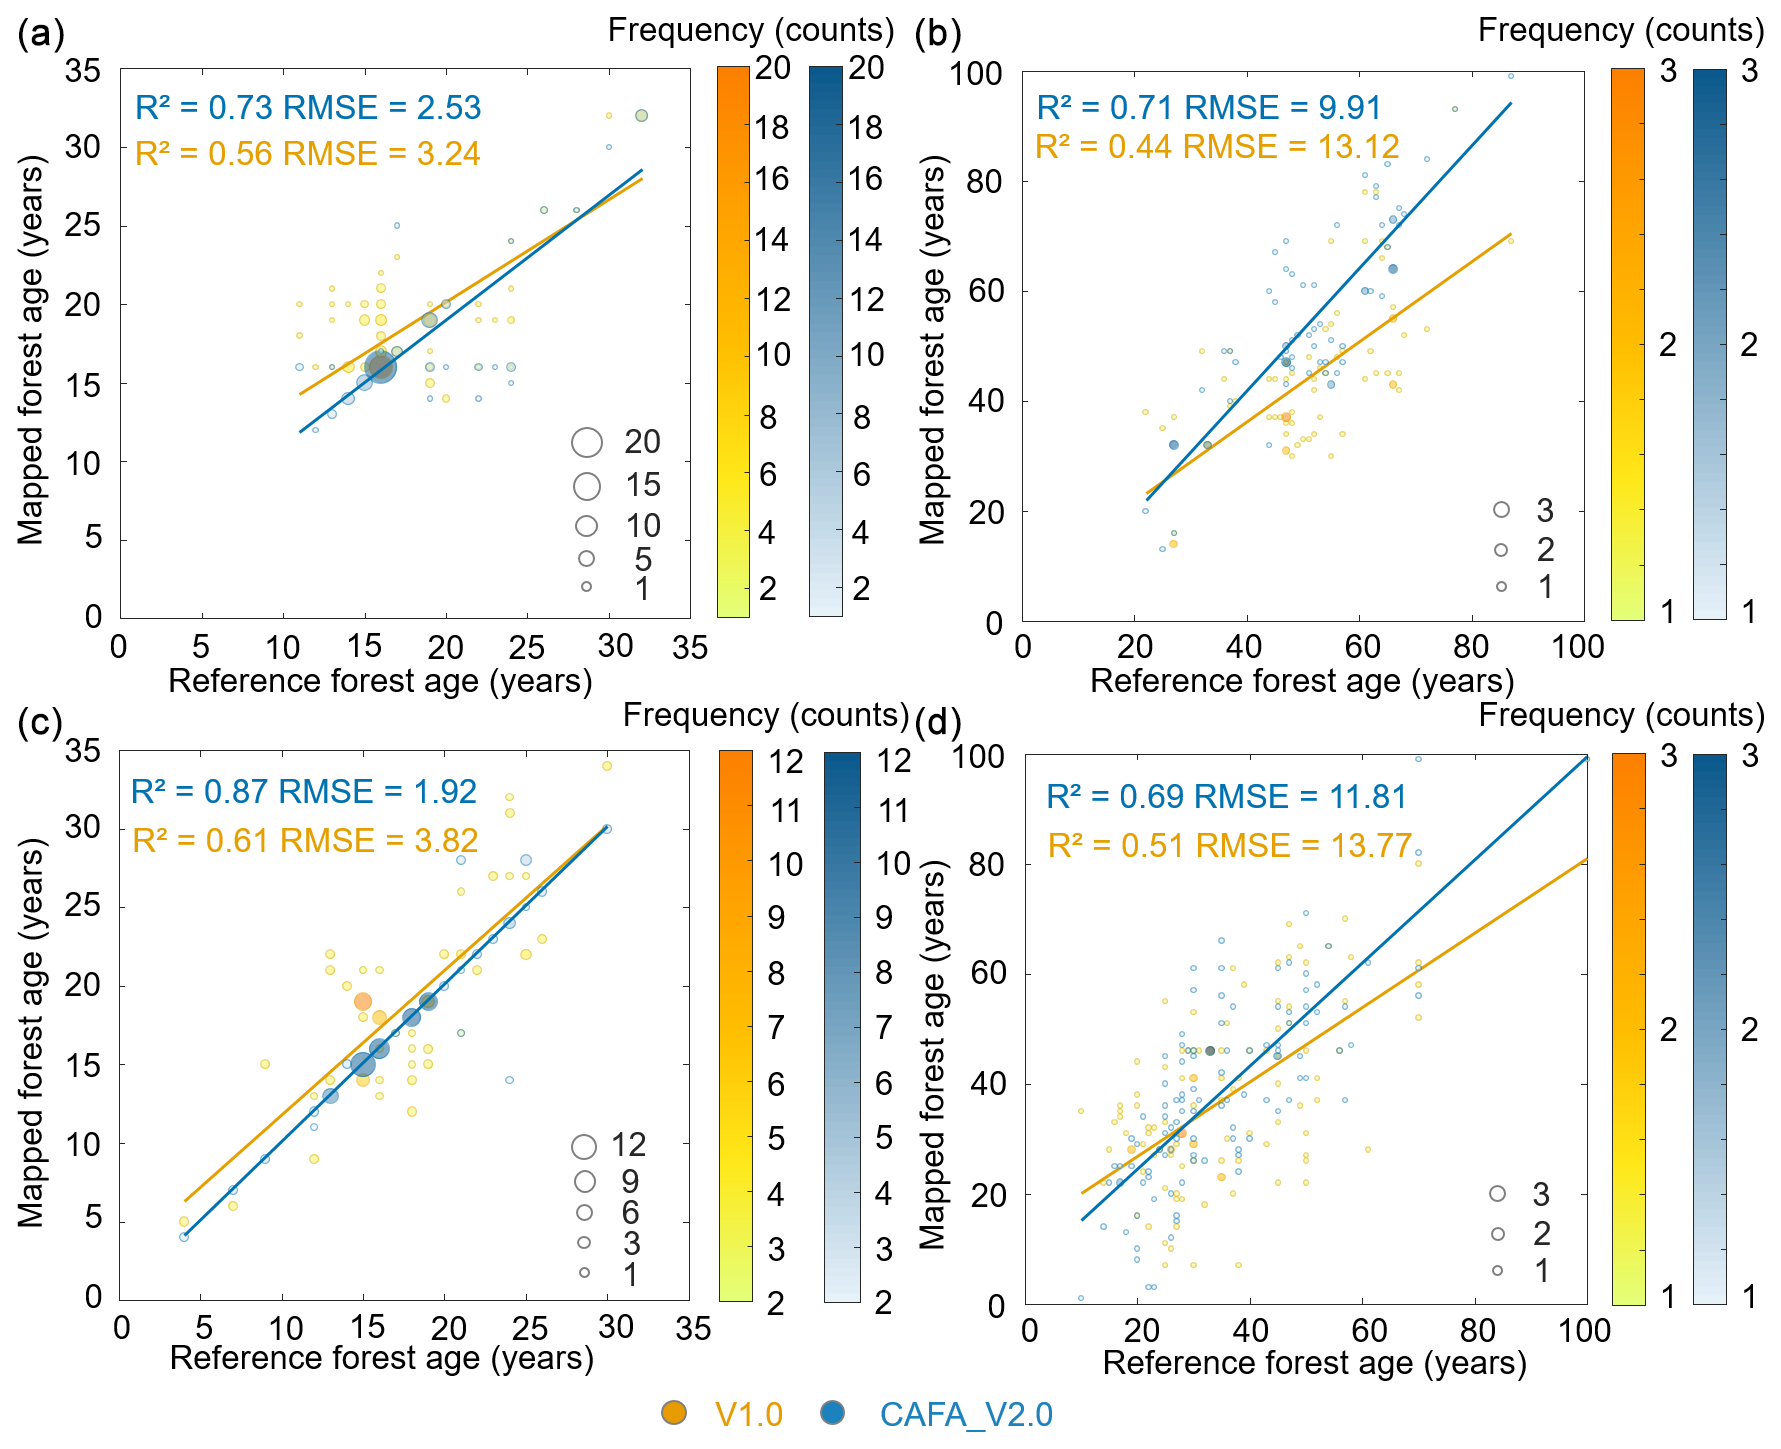
Figure 9Comparison of forest age mapping in Northeastern and Southwestern China between the V1.0 and V2.0 forest age products. Panels (a) and (b) show Northeastern China, whereas panels (c) and (d) show Southwestern China. Panels (a) and (c) are comparisons of forest age mapping with at least one disturbance between 1986 and 2022, whereas panels (b) and (d) are comparisons of forest age mapping without disturbances between 1986 and 2022.
The improvement in age accuracy for undisturbed forests was achieved through separate modeling for different regions and forest cover types, as well as enhancements in the reference forest age samples used for model training. In version 1.0, forest ages tended to be underestimated in the Northeastern and Southwestern regions of China due to limited reference samples, although this issue was substantially improved in CAFA V2.0. As depicted in Fig. 9, the RMSE values decreased by 3.21 and 1.96, respectively (Fig. 9b and d). In conclusion, CAFA V2.0 represents a significant enhancement in the accuracy of forest age mapping across China.
4.3 Comparisons with previous forest age products
The dynamic forest age dataset (CAFA V2.0) was compared with four existing static forest age products, including two at a 1000 m resolution for the years 2005 (Age2005) (Zhang et al., 2014) and 2010 (Age2010) (Besnard et al., 2021) and two at a 30 m resolution for the years 2019 (Age2019) (Shang et al., 2023a) and 2020 (Age2020) (Cheng et al., 2024). Figure 10 illustrates the spatial distributions of these four forest age products and the age differences between them and the CAFA V2.0 product. Overall, the spatial patterns of forest age in CAFA V2.0 align with the other four products, with older forests predominantly located in the Northeastern, Northwestern, and Southwestern regions of China. Significant forest age differences (≥30 years) are also observed in these regions, especially in areas affected by forest disturbances. The average forest age was 43.1±9.5 years (within the 95 % confidence interval) for Age2005, while the corresponding value for CAFA V2.0 in 2005 was 45.8±8.1 years (Fig. 11a). For 2010, Age2010 had an average forest age of 45.3±6.2 years, while CAFA V2.0 showed an age of 49.6±7.9 years (Fig. 11b). For 2019, Age2019 had an average forest age of 53.2±8.3 years, while CAFA V2.0 showed an age of 58.1±7.3 years (Fig. 11c). Similarly, for 2020, the average ages for Age2020 were 57.3±10.1 years, compared to 59.2±8.5 years for CAFA V2.0 (Fig. 11d).
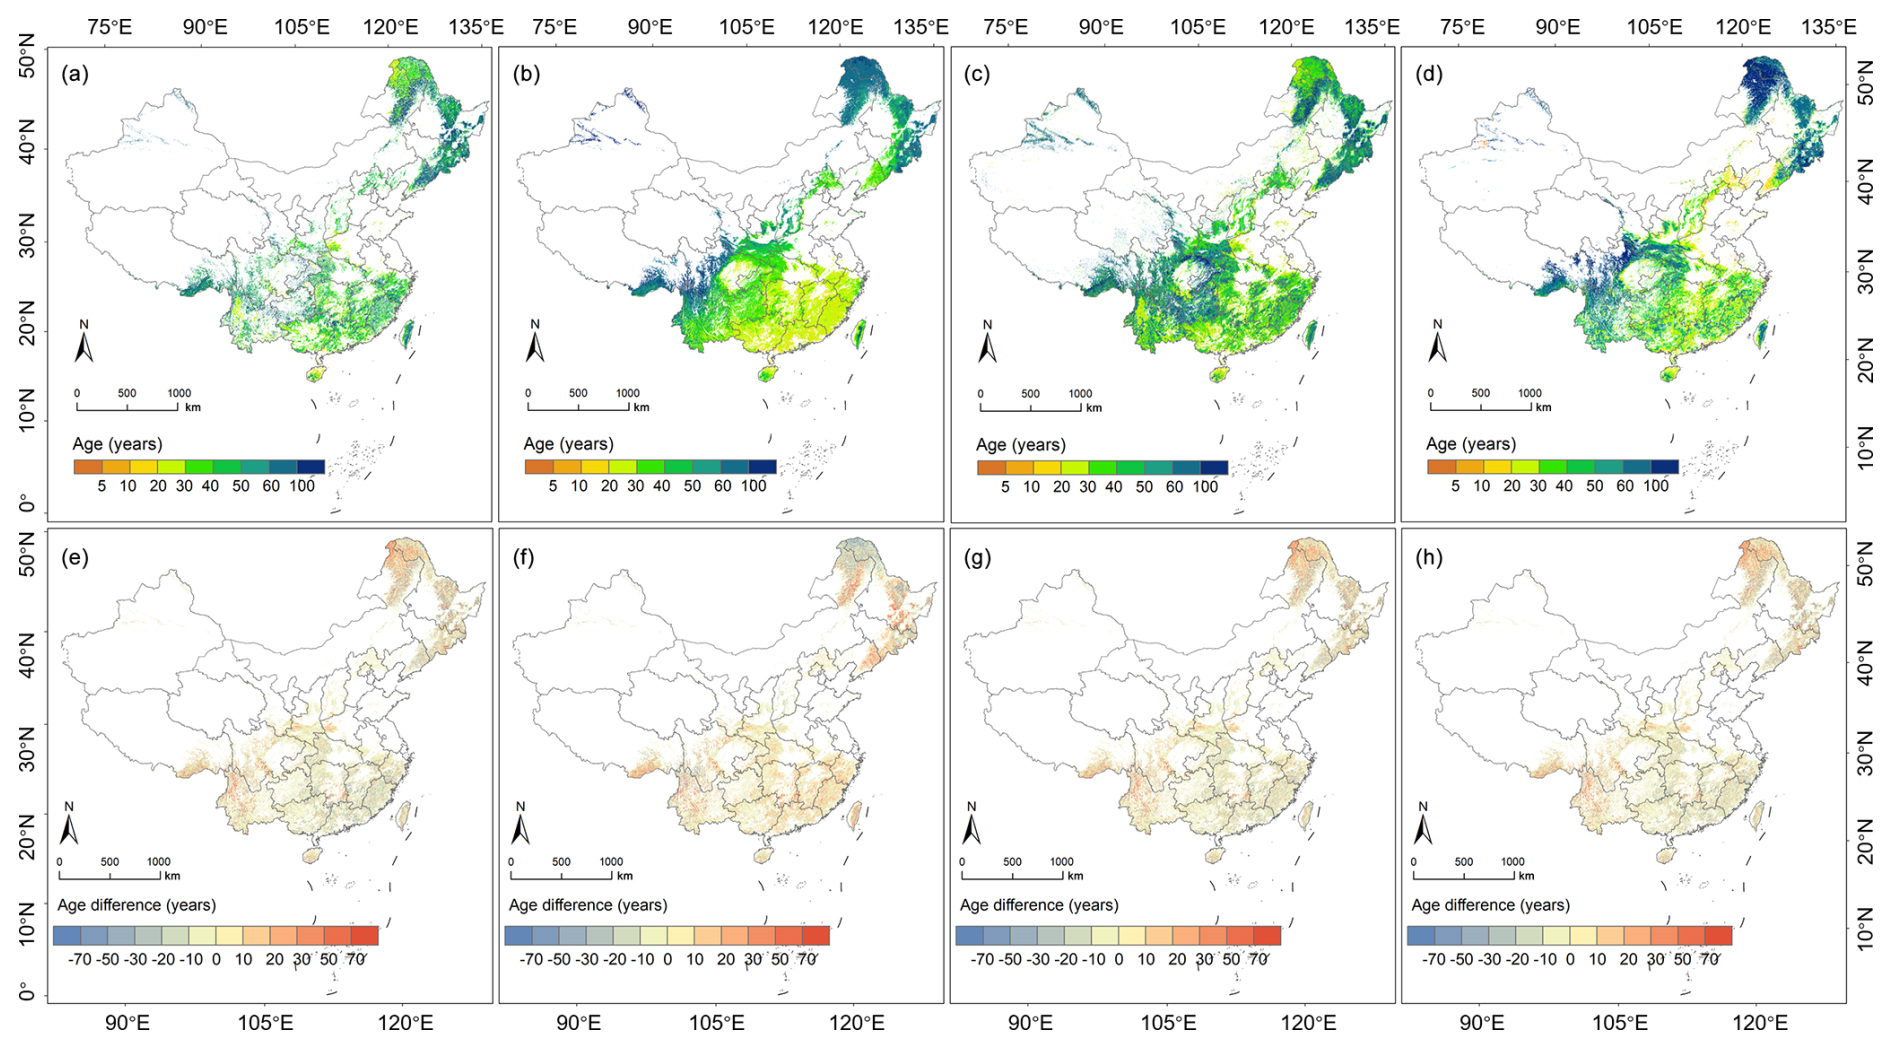
Figure 10Comparisons of the CAFA V2.0 forest age with previous forest age products. Panels (a), (b), (c), and (d) are the age products in 2005, 2010, 2019, and 2020 from Zhang et al. (2014), Besnard et al. (2021), Shang et al. (2023a), and Cheng et al. (2024), respectively. Panels (e), (f), (g), and (h) are the differences between the CAFA V2.0 forest age and the abovementioned four forest age products, respectively.
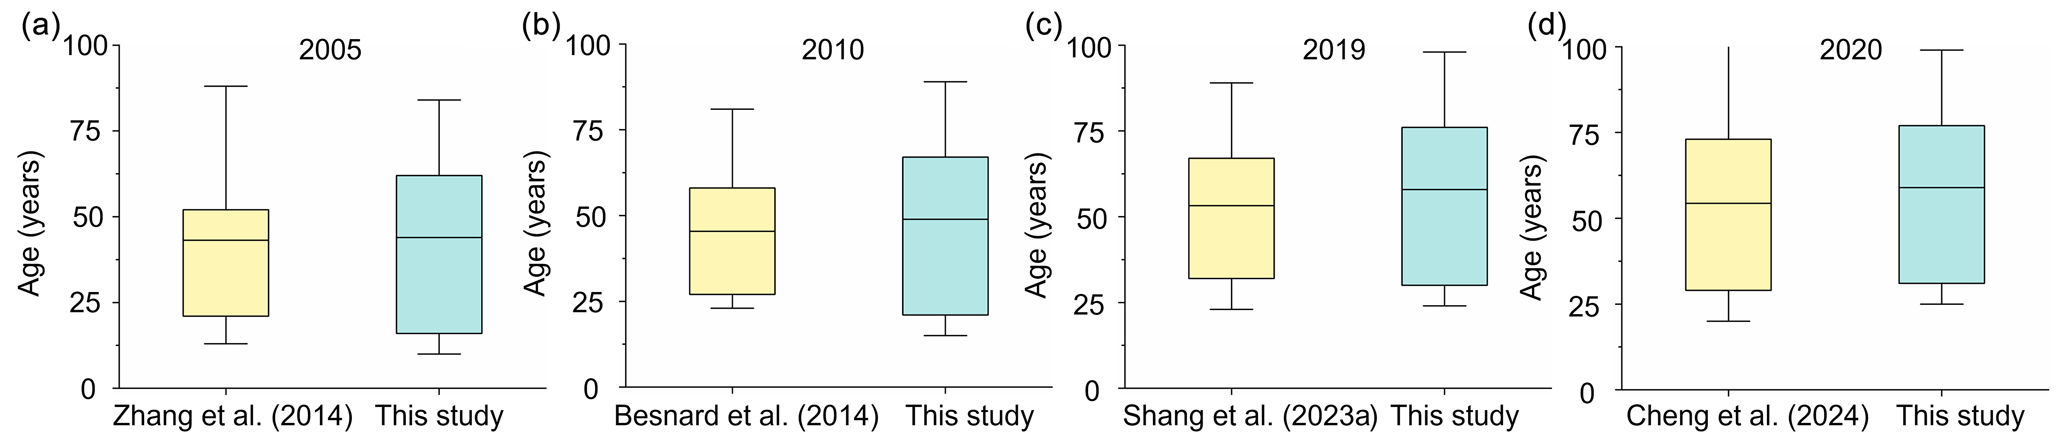
Figure 11Box plots of CAFA V2.0 forest age and four previous forest age products in China. Panels (a), (b), (c), and (d) are Zhang et al. (2014), Besnard et al. (2021), Shang et al. (2023a), and Cheng et al. (2024), respectively.
The four existing static forest age products were also validated using the same 30 % subset of reference forest age samples (Fig. 12). It should be noted that Age2005, Age2010, and Age2020 lacked forest age values for certain reference samples. These samples are displayed in Fig. 11 with a forest age of 0, but they are excluded from the fitting line and the calculations of the R2 and RMSE values. All four forest age products showed higher RMSE values compared to the CAFA V2.0 product, including our previous static forest age product, Age2019, which had an RMSE of 10.29 years. Age2020 exhibited the highest RMSE at 19.31 years, likely due to young forests impacted by disturbances that were omitted by the LandTrendr forest disturbance monitoring algorithm (Qiu et al., 2023) but inaccurately classified as old forests with high ages in Age2020. Except for those disturbed forests, Age2020 demonstrated reasonable forest age mapping accuracy. The CAFA V2.0 forest age product had the lowest RMSE of 7.91 years, owing to the modified forest disturbance monitoring and improvements in age mapping of undisturbed forests, particularly in Northeastern and Southwestern China, where additional reference samples and region- and forest-cover-type-specific models were applied.
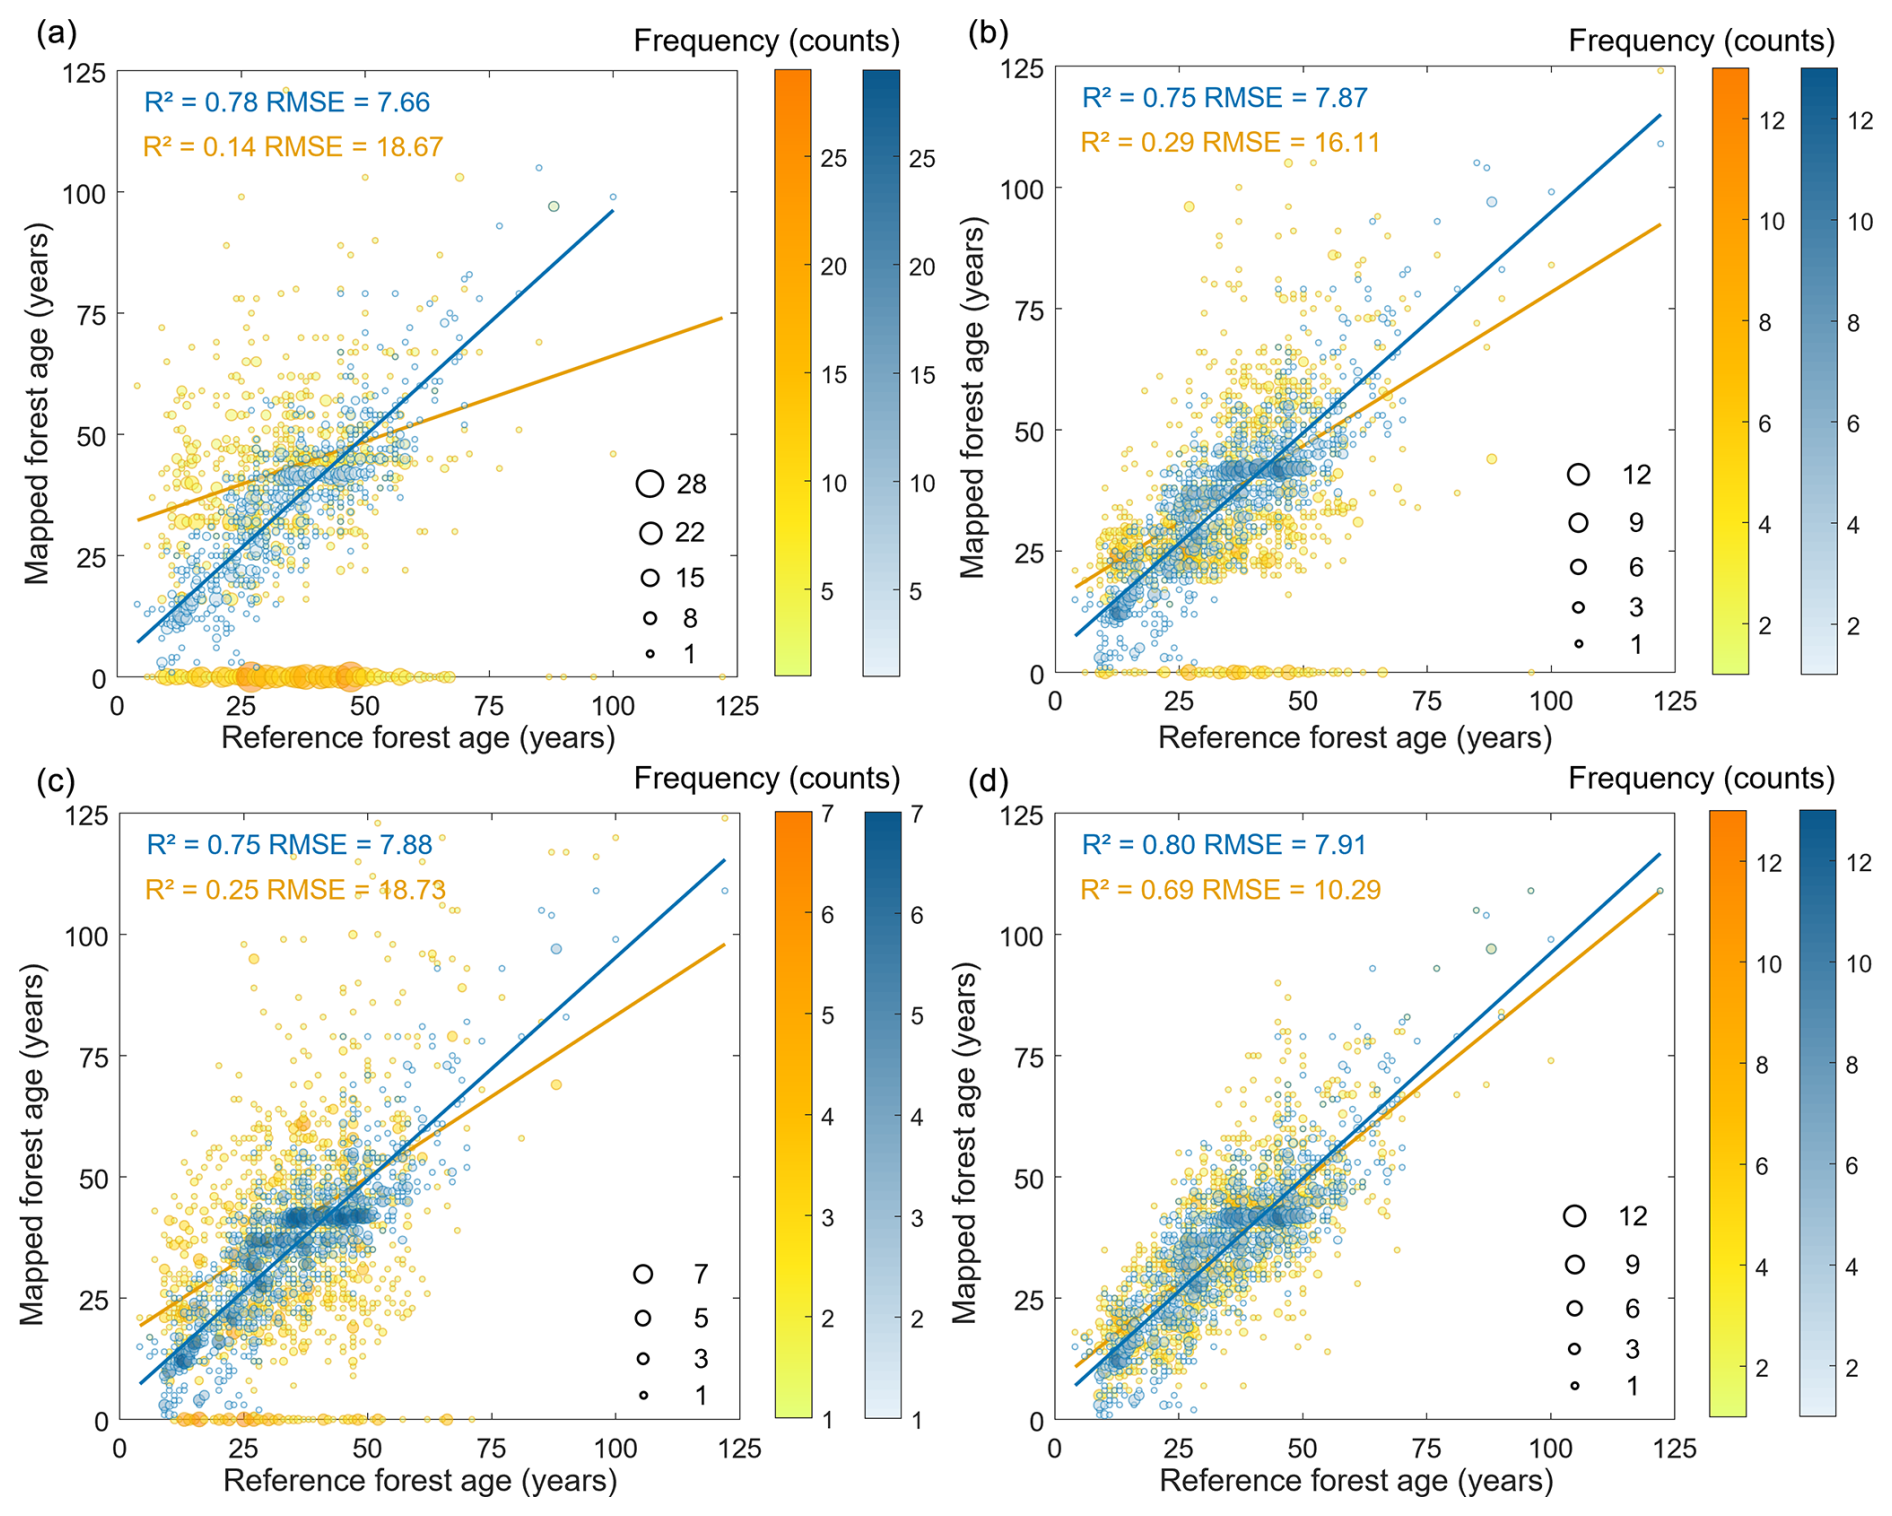
Figure 12Validation of the four forest age products using the same 30 % subset of reference forest age samples compared with the CAFA V2.0 product. Panels (a), (b), (c), and (d) are the forest ages of Age2005, Age2010, Age2020, and Age2019 generated by Zhang et al. (2014), Besnard et al. (2021), Cheng et al. (2024), and Shang et al. (2023a), respectively. Blue represents the CAFA V2.0 product, whereas yellow represents the four products. An age of 0 in Age2005, Age2010, and Age2020 indicates no available forest age in these products for the validated reference samples, and these values were excluded from the fitting line and the calculations of the R2 and RMSE. To maintain consistency, the validation of the CAFA V2.0 product also excluded these reference samples.
5.1 Contributions of different input factors to forest age mapping
A total of 15 input factors were utilized to map the age of undisturbed forests across six regions and five forest cover types in China. To investigate the contribution of each factor to the model, we first calculated the absolute mean SHAP value and then calculated its ratio in all mean SHAP values for each forest cover type (Fig. 13). A larger ratio of absolute mean SHAP value indicates a greater impact of that factor on forest age mapping. The results revealed that forest height was the dominant factor and contributed more than 20 % to forest age mapping for most forest types, aligning with previous findings (Lin et al., 2023; Cheng et al., 2024). This was because forest height is a key indicator of forest structure, which reflects the maturity and biomass of the forest (Shugart et al., 2010). Two terrain factors, slope and aspect, generally ranked second or third, suggesting that individual terrain factors had a larger impact on forest age mapping than individual climate factors. For the NIRv, NDVI, and the eight climate factors, there were no clear patterns across the five forest cover types. Most of these factors rank in the middle to lower positions, and the differences in the absolute mean SHAP values among the climate factors were minimal. However, there were some regional and forest cover type exceptions. For example, the lowest annual temperature contributed 21 % to forest age mapping for deciduous broad-leaved forests in East China, likely because low temperatures limit the growth of certain tree species and affect vegetation composition and distribution (Gazol et al., 2022). In the case of evergreen coniferous forests in Northwestern China, mean annual precipitation contributed 20.9 % to forest age mapping. Precipitation is critical for supporting evergreen vegetation growth in this region, as it ensures both the productivity of evergreen forests and the stability of the ecosystem (Duan et al., 2019). Soil type, on the other hand, did not have a significant impact, aligning with findings by Cheng et al. (2024), who suggested that soil type plays a relatively minor role in forest age mapping.
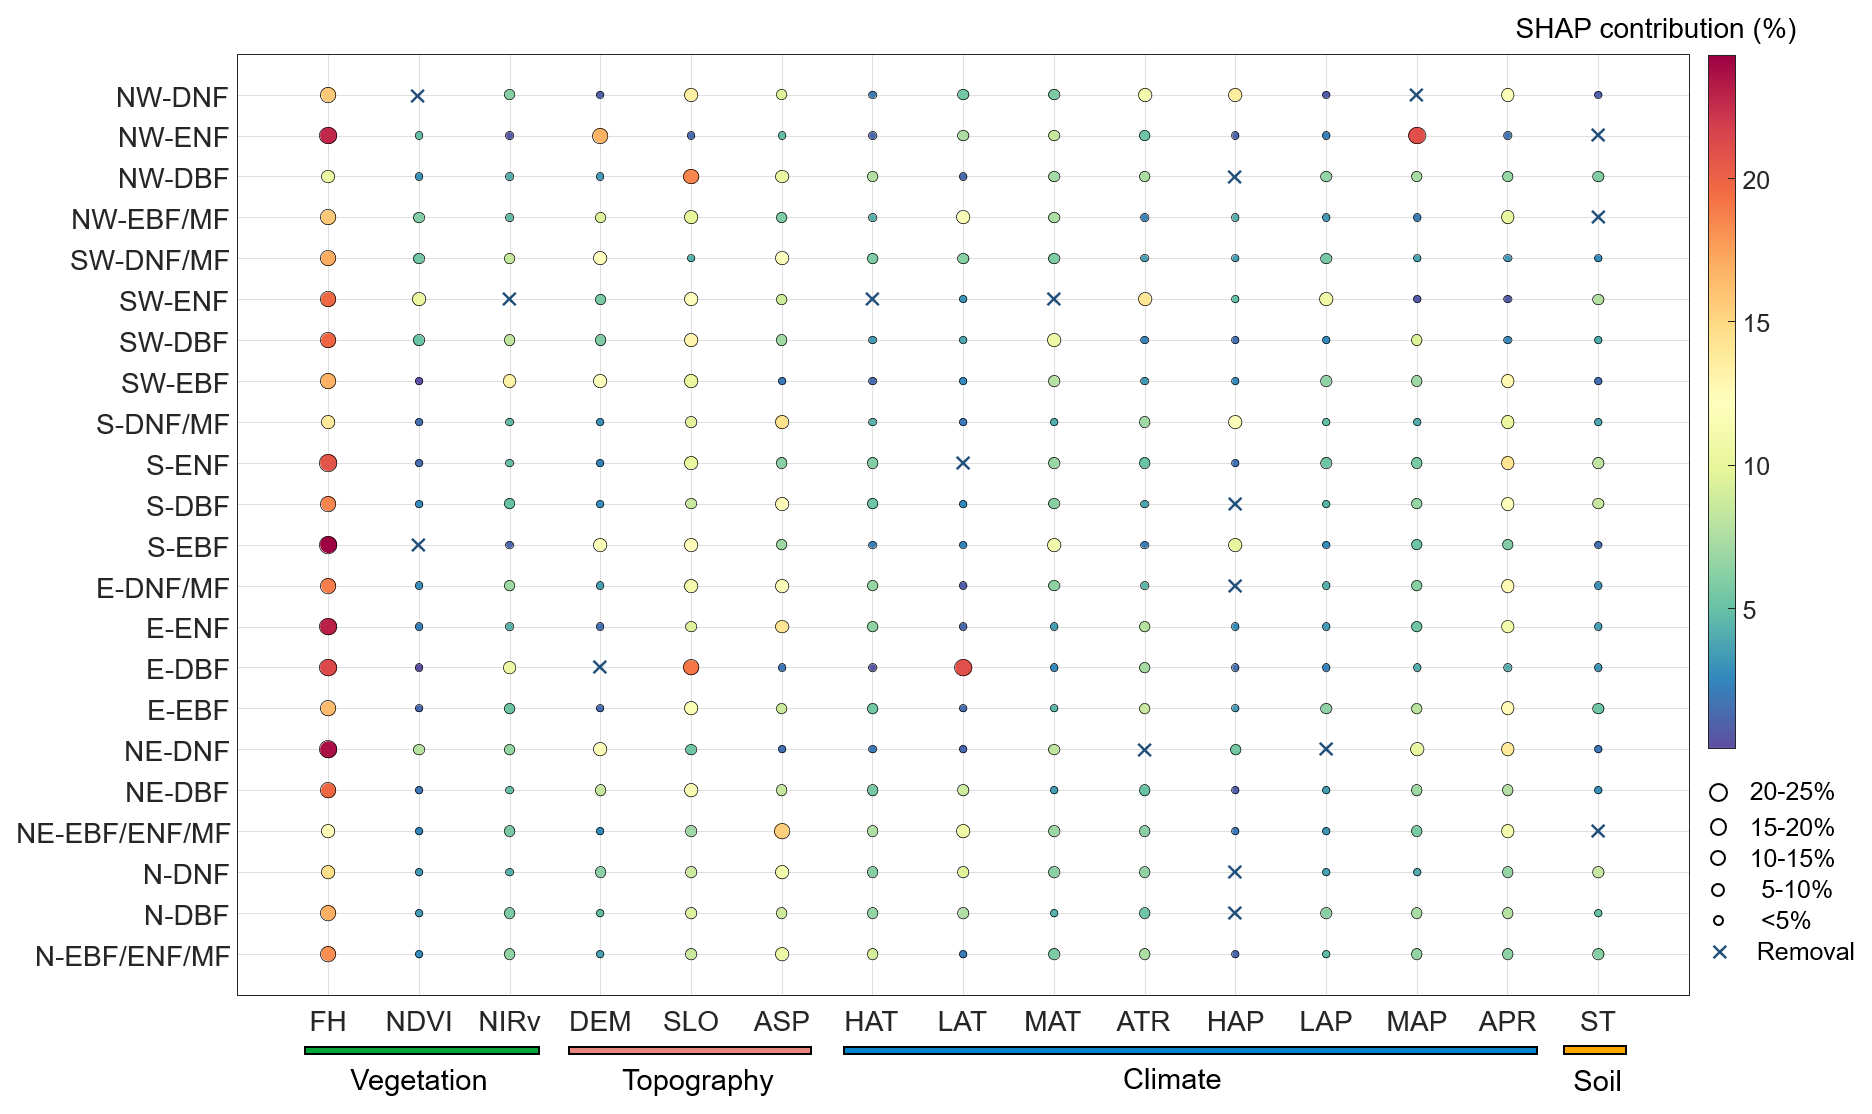
Figure 13Contributions of different input factors to forest age mapping for five forest cover types. The following abbreviations are used in the figure: EBF – evergreen broad-leaved forest; DBF – deciduous broad-leaved forest; ENF – evergreen coniferous forest; DNF – deciduous coniferous forest; MF – mixed forest; N – North China; NE – Northeastern China; E – East China; S – South China; SW – Southwestern China; NW – Northwestern China; FH – forest height; NDVI – normalized difference vegetation index; NIRv – near-infrared reflectance of vegetation; DEM – digital elevation model; SLO – slope; ASP – aspect; HAT – highest annual temperature; LAT – lowest annual temperature; MAT – mean annual temperature; ATR – annual temperature range; HAP – highest annual precipitation; LAP – lowest annual precipitation; MAP – mean annual precipitation; APR – annual precipitation range; ST – soil type.
5.2 The impact of different forest height retrievals on age mapping
Forest height retrieval was necessary for age mapping in two situations: first, when forest height data were unavailable from the two forest height products in 2019, and second, when at least one disturbance occurred before 2019. Figure 4a presents the histogram of the percentage of pixels requiring forest height retrieval each year from 1986 to 2019. All years had percentages below 0.8 %, with an average of 0.42 %, indicating that only a small portion of the total pixels required height retrieval. It should be noted that the forest height retrieval used in this study differed from the 2019 forest height products, as the models were trained on different samples and input factors, potentially introducing uncertainties into forest age mapping. To assess the impact of varying forest height retrieval methods, 50 % of the validation samples were randomly selected to compare forest age mapping based on the retrieved forest height in this study and the 2019 forest height product. Differences in forest height were observed between the two methods, which resulted in an RMSE of 5.92 years in forest age mapping (Fig. 14b). However, as 99.58 % of pixels did not require forest height retrieval, we believe that the impact of these differences on forest age mapping in CAFA V2.0 is negligible.
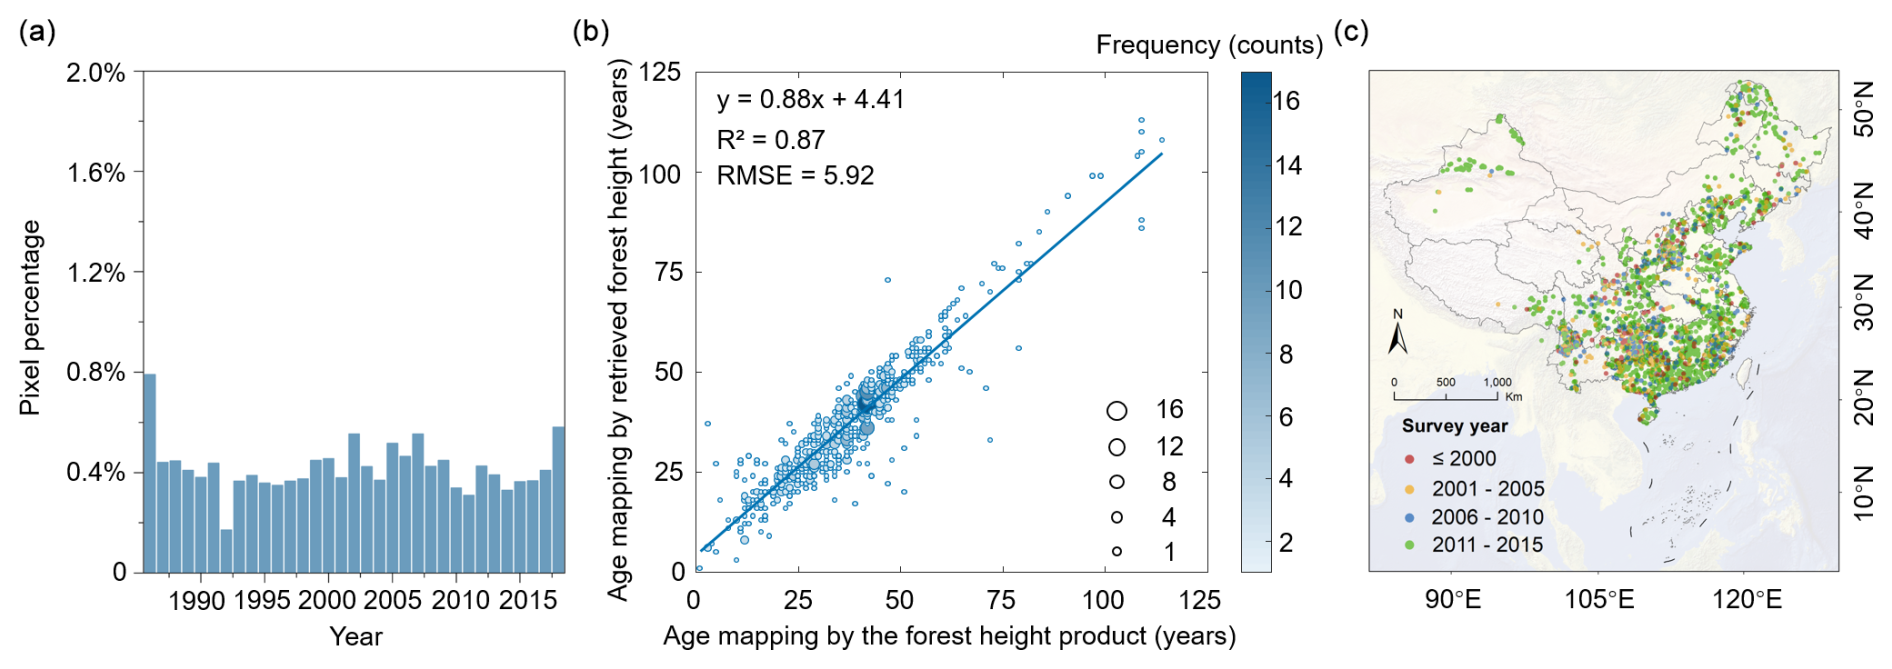
Figure 14The percentages of pixels needing forest height retrieval from 1986 to 2019 (a), comparisons of forest age mapping using the retrieved forest height versus forest height product in 2019 (b), and the spatial distribution of the survey years of samples used for comparison (c).
5.3 Importance of forest age mapping for different forest cover types
The ages of undisturbed forests were mapped using separate RF models for different forest cover types in this study, as different forest cover types exhibited varying growth patterns and responses to environmental factors (Körner, 2007; Bazzaz, 1996). To demonstrate its applicability, we compared the forest age mapping with and without forest cover type classifications (Fig. 15), using the same input factors, training samples, and validation samples. Results indicated that classifying forest cover types led to an overall increase in the R2 value of 0.07 and a decrease in the RMSE of 1.44. The accuracy for each forest type was also higher than that without forest cover type classification, with the accuracy for DNF increasing the most (as its RMSE decreased by 3.77). Therefore, classifying forest cover types was essential for improving the accuracy of national forest age mapping.
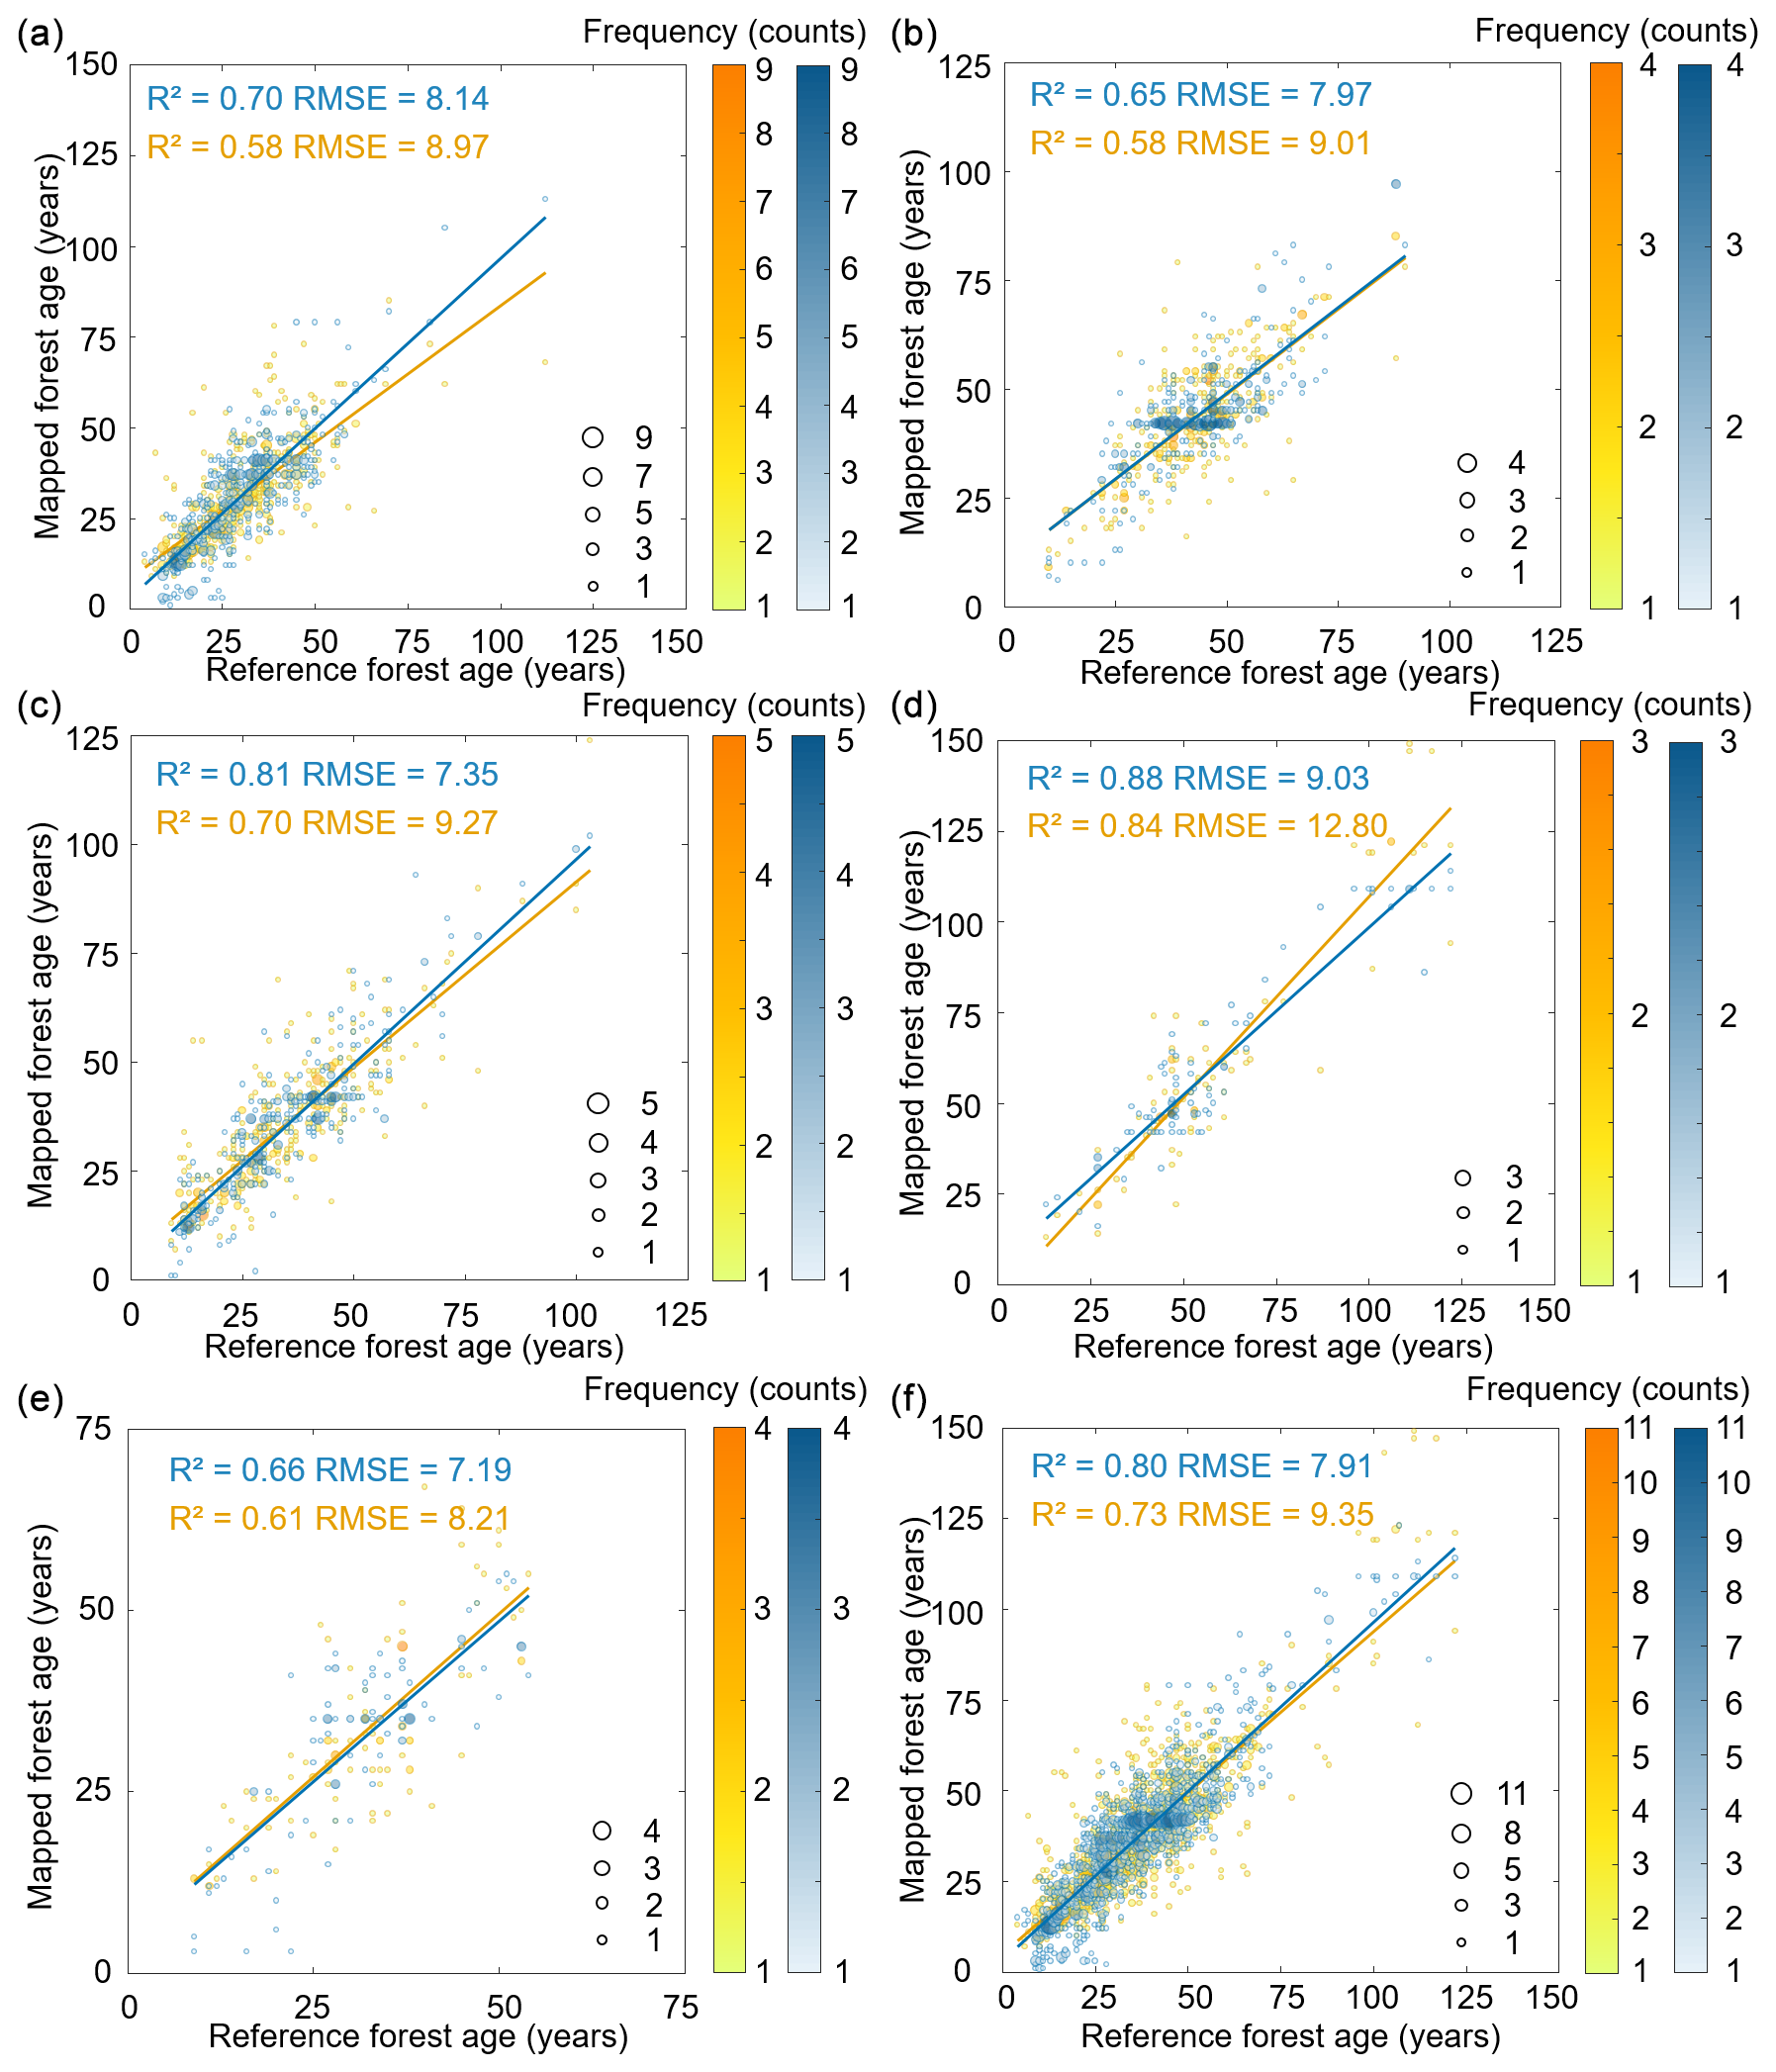
Figure 15Comparisons of the forest age mapping with and without forest cover type classifications. Panel (a) is evergreen broad-leaved forest, panel (b) is deciduous broad-leaved forest, panel (c) is evergreen coniferous forest, panel (d) is deciduous coniferous forest, panel (e) is mixed forest, and panel (f) is all forest.
5.4 Limitations and future modifications
There were also some limitations in mapping forest age in CAFA V2.0. First, the year of disturbance may not always coincide with the year when forests are replanted or begin to recover. In this study, it was assumed that the forest age was 0 in the year of disturbance and that it was 1 in the following year. However, delays in replanting or natural recovery after a disturbance could result in slight deviations in forest age estimates. The mCOLD forest disturbance monitoring algorithm can identify both the date of disturbance (t_break) and the date when vegetation recovery begins (t_start). As t_break is determined with higher accuracy compared to t_start (Shang et al., 2025), it was used in this study for forest age mapping. To assess the potential impact of this assumption, the time interval between t_break and t_start was calculated for reference forest disturbance samples. Results showed that 88.78 % of reference samples had an interval of less than 1 year, 8 % had an interval of 1–2 years, and 3.22 % had an interval of more than 2 years. These findings suggest that using the disturbance year instead of the actual recovery year only has a minor impact on forest age mapping. Furthermore, planted young trees may already be older than 1 year, which could partially offset the discrepancies caused by the time difference between the disturbance year and recovery year in forest age mapping.
Second, the number of reference forest age samples is limited. The reference forest age samples used in this study include 3121 samples obtained from SPPCB field surveys (Fang et al., 2018) and an additional 2183 samples obtained via a literature review (Luo et al., 2014; Cook-Patton et al., 2020). However, the samples, particularly those derived from the literature, were collected by various researchers using different methods to estimate forest age. This methodological variation may introduce some degree of bias into the final forest age mapping. Additionally, differences in the sample distribution across regions and forest cover types may also contribute to uncertainties in forest age estimation. Furthermore, due to the limited samples, especially in the northwestern region, the ages of some very old trees may be underestimated. Most of these trees are found in high-altitude areas without competition from other vegetation (Liu et al., 2019), and their coverage is often smaller than the 30 m resolution of Landsat pixels, resulting in their higher ages being averaged out. Therefore, future work should focus on collecting more field-based forest age reference samples to minimize the uncertainties in forest age mapping caused by the reference sample limitations.
Third, the varied plot sizes of reference samples may influence forest age mapping, particularly for the 2183 samples derived from a literature review. While SPPCB samples had consistent plot sizes (primarily 1000 m2), the plot sizes of the literature-derived samples varied. To assess these impacts, we analyzed spatial heterogeneity using a 100 m × 100 m window – much larger than the SPPCB plot size – with forest height standard deviation (SD) as the key metric. The results indicated that 89.1 % of samples had low heterogeneity (SD < 2 m), corresponding to a mean forest age mapping difference of 5.7 years, which was smaller than the mapping error of 7.91 years for undisturbed forests. Moderate heterogeneity (SD 2–3 m) affected 7.33 % of samples, causing a comparable difference of 8.3 years. High heterogeneity (SD > 3 m) was found in 3.67 % of samples, leading to relatively larger differences of 13.3 years. Although 96.33 % of samples had low to median heterogeneity with acceptable mapping errors, the identified high-heterogeneity samples (3.67 %) caused relatively larger mapping errors of 13.3 years. Therefore, future studies should consider filtering out high-heterogeneity samples in forest age mapping.
Fourth, some of the input factors used in estimating the age of undisturbed forests with the boosted-RF model may exhibit autocorrelation, potentially introducing biases into the forest age estimation. This study employed a total of 15 input factors for forest age mapping, including three vegetation factors, three topographic factors, eight climate factors, and one soil factor. There may be some degree of autocorrelation within each category of input factors. To mitigate the effects of autocorrelation, this study proposed an automatic iterative selection mechanism for input factors, excluding those contributing less than 0.5 % in each, and ultimately using the final model obtained after three iterations for forest age estimation. A comparison of the accuracy of forest age estimations with and without the automatic iterative mechanism showed that the mechanism slightly improved estimation accuracy, thereby reducing the impact of autocorrelation among input factors to some extent.
Fifth, other input data may also affect the forest age mapping. For instance, the original spatial resolutions of the climate and soil data were larger than 30 m, and these disparities in spatial resolution were likely to introduce uncertainty. However, due to the high spatial similarities of climate and soil within a small area, minimal variations are expected among nearby pixels. Moreover, the contributions of these input factors to forest age mapping were relatively small (Sect. 5.1). Therefore, their impact on the accuracy of forest age mapping would not be significant.
Finally, due to data limitations, some input factors that could potentially enhance forest age estimation accuracy were not included in this study, such as the diameter at breast height (DBH), forest density, site index, and soil fertility (Chen et al., 2019; Lin et al., 2023; Wylie et al., 2019). Our previous research in Fujian Province has shown that incorporating factors like DBH, forest density, and site index can improve forest age estimation accuracy to some extent (Lin et al., 2023). However, as these data are not available on a national scale, they were excluded from this study. As remote-sensing technologies continue to evolve, it is likely that these factors will eventually become estimable (Li et al., 2024; Socha et al., 2020; Fan et al., 2018), further improving the accuracy of forest age mapping.
China's Annual Forest Age (CAFA V2.0) dataset at a 30 m spatial resolution from 1986 to 2022 is publicly available at https://doi.org/10.6084/m9.figshare.24464170 (Shang et al., 2023b).
The codes are available from the first and corresponding authors upon request.
This study generated China's annual forest age dataset (CAFA V2.0) at a 30 m resolution from 1986 to 2022, combining forest disturbance monitoring and machine learning techniques. Forest disturbance monitoring, which has lower uncertainty than machine learning, was used to update the annual forest age, employing the modified COLD (mCOLD) algorithm and considering the spatial variation within the disturbance area and bidirectional time-series tracking. For undisturbed forests, the forest age was estimated using machine learning models tailored to different regions and forest types, incorporating forest height, vegetation indices, climate, terrain, and soil data. Adjustments were made for underestimations in Northeastern and Southwestern China identified in CAFA V1.0, with additional reference samples and region-specific and forest-type-specific models. Validation showed that the mapped age of disturbed forests had a small error of ±2.48 years, whereas undisturbed forests had a relatively large error of ±7.91 years. The generated 30 m annual forest age dataset can facilitate forest carbon cycle modeling in China, offering valuable insights for national forest management practices.
RS and JC: conceptualization; XL, RS, JC, and YL: methodology; XL and RS: validation; XL, KF, MX, YY, RL, YL, WJ, LL, JL, WL, and JZ: formal analysis; RS and XL: writing – original draft; RS, JC, and MX: writing – review and editing; RS, MX, and ZH: funding acquisition; GY, NH, and LX: data curation.
The contact author has declared that none of the authors has any competing interests.
Publisher's note: Copernicus Publications remains neutral with regard to jurisdictional claims made in the text, published maps, institutional affiliations, or any other geographical representation in this paper. While Copernicus Publications makes every effort to include appropriate place names, the final responsibility lies with the authors. Regarding the maps used in this paper, please note that Figs. 1, 2, 5, 6, 10, and 14 contain disputed territories.
We would like to express our sincere gratitude to all those who provided data and suggestions for this study.
This research has been supported by the National Natural Science Foundation of China (grant nos. U23A2002, 42471356, 42101367, and 42201360), the Natural Science Foundation of Fujian Province (grant no. 2021J05041), and the Open Fund Project of the Academy of Carbon Neutrality of Fujian Normal University (grant no. TZH2022-02).
This paper was edited by Zhen Yu and reviewed by Qin Ma and one anonymous referee.
Badgley, G., Field, C. B., and Berry, J. A.: Canopy near-infrared reflectance and terrestrial photosynthesis, Sci. Adv., 3, e1602244, https://doi.org/10.1126/sciadv.1602244, 2017.
Badgley, G., Anderegg, L. D. L., Berry, J. A., and Field, C. B.: Terrestrial gross primary production: Using NIRV to scale from site to globe, Global Change Biol., 25, 3731–3740, https://doi.org/10.1111/gcb.14729, 2019.
Bazzaz, F. A.: Plants in Changing Environments: Linking Physiological, Population, and Community Ecology, Cambridge University Press, ISBN 9780521398435, 1996.
Bellassen, V., Viovy, N., Luyssaert, S., Le Maire, G., Schelhaas, M. J., and Ciais, P.: Reconstruction and attribution of the carbon sink of European forests between 1950 and 2000, Global Change Biol., 17, 3274–3292, https://doi.org/10.1111/j.1365-2486.2011.02476.x, 2011.
Besnard, S., Koirala, S., Santoro, M., Weber, U., Nelson, J., Gütter, J., Herault, B., Kassi, J., N'Guessan, A., Neigh, C., Poulter, B., Zhang, T., and Carvalhais, N.: Mapping global forest age from forest inventories, biomass and climate data, Earth Syst. Sci. Data, 13, 4881–4896, https://doi.org/10.5194/essd-13-4881-2021, 2021.
Cahoon Jr., D. R., Levine, J. S., Cofer III, W. R., Miller, J. E., Minnis, P., Tennille, G. M., Yip, T. W., Stocks, B. J., and Heck, P. W.: The Great Chinese Fire of 1987: A View from Space, MIT Press, 27 November 1991, https://doi.org/10.7551/mitpress/3286.003.0009, 1991.
Chapin, F. S., Chapin, M. C., Matson, P. A., and Vitousek, P.: Principles of Terrestrial Ecosystem Ecology, Springer, New York, ISBN 9781441995049, 2011.
Chen, J., Chen, W., Liu, J., Cihlar, J., and Gray, S.: Annual carbon balance of Canada's forests during 1895–1996, Global Biogeochem. Cy., 14, 839–849, https://doi.org/10.1029/1999GB001207, 2000.
Chen, J. M., Ju, W., Cihlar, J., Price, D., Liu, J., Chen, W., Pan, J., Black, A., and Barr, A.: Spatial distribution of carbon sources and sinks in Canada's forests, Tellus B, 55, 622–641, https://doi.org/10.3402/tellusb.v55i2.16711, 2003.
Chen, L., Ren, C. Y., Zhang, B., Wang, Z. M., and Wang, Y. Q.: Mapping Spatial Variations of Structure and Function Parameters for Forest Condition Assessment of the Changbai Mountain National Nature Reserve, Remote Sens., 11, 2072–4292, https://doi.org/10.3390/rs11243004, 2019.
Cheng, K., Chen, Y., Xiang, T., Yang, H., Liu, W., Ren, Y., Guan, H., Hu, T., Ma, Q., and Guo, Q.: A 2020 forest age map for China with 30 m resolution, Earth Syst. Sci. Data, 16, 803–819, https://doi.org/10.5194/essd-16-803-2024, 2024.
Chorshanbiyev, F., Abdullayev, O., Khalilova, K., Kodirova, M., Xalimjanov, A., Rakhimov, U., and Rakhimov, J.: Study on Species and Age Structure of Forests: Optimization of Forest Stand Completeness, E3S Web Conf., 497, 03015, https://doi.org/10.1051/e3sconf/202449703015, 2024.
Cook-Patton, S. C., Leavitt, S. M., Gibbs, D., Harris, N. L., Lister, K., Anderson-Teixeira, K. J., Briggs, R. D., Chazdon, R. L., Crowther, T. W., Ellis, P. W., Griscom, H. P., Herrmann, V., Holl, K. D., Houghton, R. A., Larrosa, C., Lomax, G., Lucas, R., Madsen, P., Malhi, Y., Paquette, A., Parker, J. D., Paul, K., Routh, D., Roxburgh, S., Saatchi, S., van den Hoogen, J., Walker, W. S., Wheeler, C. E., Wood, S. A., Xu, L., and Griscom, B. W.: Mapping carbon accumulation potential from global natural forest regrowth, Nature, 585, 545–550, https://doi.org/10.1038/s41586-020-2686-x, 2020.
Diao, J., Feng, T., Li, M., Zhu, Z., and Ji, B.: Use of vegetation change tracker, spatial analysis, and random forest regression to assess the evolution of plantation stand age in Southeast China, Ann. Forest Sci., 77, 27, https://doi.org/10.1007/s13595-020-0924-x, 2020.
Duan, K., Caldwell, P. V, Sun, G., McNulty, S. G., Zhang, Y., Shuster, E., Liu, B., and Bolstad, P. V: Data on projections of surface water withdrawal, consumption, and availability in the conterminous United States through the 21st century, Data Brief, 23, 103786, https://doi.org/10.1016/j.dib.2019.103786, 2019.
Dubayah, Hofton, M., and Blair, J.: GEDI L2A Elevation and Height Metrics Data Global Footprint Level V002, NASA EOSDIS Land Processes Distributed Active Archive Center, https://doi.org/10.5067/GEDI/GEDI02_A.002, 2020.
ESA: Land Cover CCI Product User Guide Version 2, Tech. rep., http://maps.elie.ucl.ac.be/CCI/viewer/download/ESACCI-LC-Ph2-PUGv2_2.0.pdf (last access: 2 July 2025), 2017.
Fan, Y., Feng, Z., Mannan, A., Khan, T. U., Shen, C., and Saeed, S.: Estimating Tree Position, Diameter at Breast Height, and Tree Height in Real-Time Using a Mobile Phone with RGB-D SLAM, Remote Sens., 10, 1845, https://doi.org/10.3390/rs10111845, 2018.
Fang, J., Yu, G., Liu, L., Hu, S., and Chapin, F. S.: Climate change, human impacts, and carbon sequestration in China, P. Natl. Acad. Sci. USA, 115, 4015–4020, https://doi.org/10.1073/pnas.1700304115, 2018.
Gazol, A., Camarero, J. J., Igual, J. M., González de Andrés, E., Colangelo, M., and Valeriano, C.: Intraspecific trait variation, growth, and altered soil conditions at tree species distribution limits: From the alpine treeline to the rear edge, Agr. Forest Meteorol., 315, 108811, https://doi.org/10.1016/j.agrformet.2022.108811, 2022.
Hansen, M. C., Potapov, P. V, Moore, R., Hancher, M., Turubanova, S. A., Tyukavina, A., Thau, D., Stehman, S. V, Goetz, S. J., Loveland, T. R., Kommareddy, A., Egorov, A., Chini, L., Justice, C. O., and Townshend, J. R. G.: High-Resolution Global Maps of 21st-Century Forest Cover Change, Science, 342, 850–853, https://doi.org/10.1126/science.1244693, 2013.
He, L. M., Chen, J. M., Pan, Y. D., Birdsey, R., and Kattge, J.: Relationships between net primary productivity and forest stand age in U.S. forests, Global Biogeochem. Cy., 26, GB3009, https://doi.org/10.1029/2010gb003942, 2012.
Jahan, L. N., Munshi, T. A., Sutradhor, S. S., and Hashan, M.: A comparative study of empirical, statistical, and soft computing methods coupled with feature ranking for the prediction of water saturation in a heterogeneous oil reservoir, Acta Geophys., 69, 1697–1715, https://doi.org/10.1007/s11600-021-00647-w, 2021.
Ji, X., Han, X., Zhu, X., Huang, Y., Song, Z., Wang, J., Zhou, M., and Wang, X.: Comparison and Validation of Multiple Medium- and High-Resolution Land Cover Products in Southwest China, Remote Sens., 16, 1111, https://doi.org/10.3390/rs16061111, 2024.
Kennedy, R. E., Yang, Z., and Cohen, W. B.: Detecting trends in forest disturbance and recovery using yearly Landsat time series: 1. LandTrendr – Temporal segmentation algorithms, Remote Sens. Environ., 114, 2897–2910, https://doi.org/10.1016/j.rse.2010.07.008, 2010.
Körner, C.: The use of `altitude' in ecological research, Trends Ecol. Evol., 22, 569–574, https://doi.org/10.1016/j.tree.2007.09.006, 2007.
Kurz, W. A. and Apps, M. J.: A 70-Year Retrospective Analysis of Carbon Fluxes in the Canadian Forest Sector, Ecol. Appl., 9, 526–547, https://doi.org/10.1890/1051-0761(1999)009[0526:AYRAOC]2.0.CO;2, 1999.
Lang, A. C., Hardtle, W., Bruelheide, H., Geissler, C., Nadrowski, K., Schuldt, A., Yu, M. J., and von Oheimb, G.: Tree morphology responds to neighbourhood competition and slope in species-rich forests of subtropical China, Forest Ecol. Manage., 260, 1708–1715, https://doi.org/10.1016/j.foreco.2010.08.015, 2010.
Leuschner, C. and Ellenberg, H.: Ecology of Central European Forests Vegetation Ecology of Central Europe, in: Vol. 1, Springer, 1–971, https://doi.org/10.1007/978-3-319-43042-3, 2017.
Li, W., Guo, W.-Y., Pasgaard, M., Niu, Z., Wang, L., Chen, F., Qin, Y., and Svenning, J.-C.: Human fingerprint on structural density of forests globally, Nat. Sustainabil., 6, 368–379, https://doi.org/10.1038/s41893-022-01020-5, 2023.
Li, W., Guo, W.-Y., Pasgaard, M., Niu, Z., Wang, L., Chen, F., Qin, Y., Qiao, H., and Svenning, J.-C.: Unmanaged naturally regenerating forests approach intact forest canopy structure but are susceptible to climate and human stress, One Earth, 7, 1068–1081, https://doi.org/10.1016/j.oneear.2024.05.002, 2024.
Lin, X., Shang, R., Chen, J. M., Zhao, G., Zhang, X., Huang, Y., Yu, G., He, N., Xu, L., and Jiao, W.: High-resolution forest age mapping based on forest height maps derived from GEDI and ICESat-2 space-borne lidar data, Agr. Forest Meteorol., 339, 109592, https://doi.org/10.1016/j.agrformet.2023.109592, 2023.
Liu, H., Gong, P., Wang, J., Wang, X., Ning, G., and Xu, B.: Production of global daily seamless data cubes and quantification of global land cover change from 1985 to 2020 – iMap World 1.0, Remote Sens. Environ., 258, 112364, https://doi.org/10.1016/j.rse.2021.112364, 2021.
Liu, J., Yang, B., and Lindenmayer, D. B.: The oldest trees in China and where to find them, Front. Ecol. Environment, 17, 319–322, https://doi.org/10.1002/fee.2046, 2019.
Liu, X., Su, Y., Hu, T., Yang, Q., Liu, B., Deng, Y., Tang, H., Tang, Z., Fang, J., and Guo, Q.: Neural network guided interpolation for mapping canopy height of China's forests by integrating GEDI and ICESat-2 data, Remote Sens. Environ., 269, 112844, https://doi.org/10.1016/J.RSE.2021.112844, 2022.
Lundberg, S. M. and Lee, S.-I.: A unified approach to interpreting model predictions, in: Proceedings of the 31st International Conference on Neural Information Processing Systems, Red Hook, NY, USA, 4768–4777, ISBN 9781510860964, 2017.
Lundberg, S. M., Erion, G. G., and Lee, S.-I.: Consistent Individualized Feature Attribution for Tree Ensembles, CoRR, abs/1802.03888, arXiv [preprint], https://doi.org/10.48550/arXiv.1802.03888, 2018.
Luo, Y., Zhang, X., Wang, X., and Lu, F.: Biomass and its allocation of Chinese forest ecosystems, Ecology, 95, 2026, https://doi.org/10.1890/13-2089.1, 2014.
Peng, S., Ding, Y., Liu, W., and Li, Z.: 1 km monthly temperature and precipitation dataset for China from 1901 to 2017, Earth Syst. Sci. Data, 11, 1931–1946, https://doi.org/10.5194/essd-11-1931-2019, 2019.
Poggio, L., de Sousa, L. M., Batjes, N. H., Heuvelink, G. B. M., Kempen, B., Ribeiro, E., and Rossiter, D.: SoilGrids 2.0: producing soil information for the globe with quantified spatial uncertainty, SOIL, 7, 217–240, https://doi.org/10.5194/soil-7-217-2021, 2021.
Potapov, P., Li, X. Y., Hernandez-Serna, A., Tyukavina, A., Hansen, M. C., Kommareddy, A., Pickens, A., Turubanova, S., Tang, H., Silva, C. E., Armston, J., Dubayah, R., Blair, J. B., and Hofton, M.: Mapping global forest canopy height through integration of GEDI and Landsat data, Remote Sens. Environ., 253, 112165, https://doi.org/10.1016/j.rse.2020.112165, 2021.
Qiu, D., Liang, Y., Shang, R., and Chen, J. M.: Improving landtrendr forest disturbance mapping in china using multi-season observations and multispectral indices, Remote Sens., 15, 2381, https://doi.org/10.3390/rs15092381, 2023.
Racine, E. B., Coops, N. C., St-Onge, B., and Begin, J.: Estimating forest stand age from LiDAR-derived predictors and nearest neighbor imputation, Forest Sci., 60, 128–136, https://doi.org/10.5849/forsci.12-088, 2014.
Schumacher, J., Hauglin, M., Astrup, R., and Breidenbach, J.: Mapping forest age using National Forest Inventory, airborne laser scanning, and Sentinel-2 data, Forest Ecosyst., 7, 60, https://doi.org/10.1186/s40663-020-00274-9, 2020.
Shang, R., Zhu, Z., Zhang, J., Qiu, S., Yang, Z., Li, T., and Yang, X.: Near-real-time monitoring of land disturbance with harmonized Landsats 7–8 and Sentinel-2 data, Remote Sens. Environ., 278, 113073, https://doi.org/10.1016/j.rse.2022.113073, 2022.
Shang, R., Chen, J. M., Xu, M., Lin, X., Li, P., Yu, G., He, N., Xu, L., Gong, P., Liu, L., Liu, H., and Jiao, W.: China's current forest age structure will lead to weakened carbon sinks in the near future, Innovation, 4, 100515, https://doi.org/10.1016/j.xinn.2023.100515, 2023a.
Shang, R., Lin, X., Chen, J. M., and Xu, M.: China's annual forest age dataset at 30-m spatial resolution from 1986 to 2022, figshare [data set], https://doi.org/10.6084/m9.figshare.24464170, 2023b.
Shang, R., Yang, Z., Liang, Y., Chen, J. M., Zhu, Z., Cao, G., Fang, K., Lin, X., Liu, L., Li, J., Li, W., Ge, R., and Hu, Z.: Mapping annual forest disturbance from 1986 to 2021 at 30-m resolution in China using the modified COLD algorithm, SSRN [preprint], https://doi.org/10.2139/ssrn.5207098, 2025.
Shugart, H. H., Saatchi, S., and Hall, F. G.: Importance of structure and its measurement in quantifying function of forest ecosystems, J. Geophys. Res.-Biogeo., 115, G00E13, https://doi.org/10.1029/2009JG000993, 2010.
Socha, J., Hawryło, P., Stereńczak, K., Miścicki, S., Tymińska-Czabańska, L., Młocek, W., and Gruba, P.: Assessing the sensitivity of site index models developed using bi-temporal airborne laser scanning data to different top height estimates and grid cell sizes, Int. J. Appl. Earth Obs. Geoinf., 91, 102129, https://doi.org/10.1016/j.jag.2020.102129, 2020.
Su, Y. J., Guo, Q. H., Ma, Q., and Li, W. K.: SRTM DEM Correction in Vegetated Mountain Areas through the Integration of Spaceborne LiDAR, Airborne LiDAR, and Optical Imagery, Remote Sens., 7, 11202–11225, https://doi.org/10.3390/rs70911202, 2015.
Sun, B., Cui, W., Liu, G., Zhou, B., and Zhao, W.: A hybrid strategy of AutoML and SHAP for automated and explainable concrete strength prediction, Case Stud. Construct. Mater., 19, e02405, https://doi.org/10.1016/j.cscm.2023.e02405, 2023.
Takeda, H., Farsiu, S., and Milanfar, P.: Kernel Regression for Image Processing and Reconstruction, IEEE T. Image Process., 16, 349–366, https://doi.org/10.1109/TIP.2006.888330, 2007.
Uuemaa, E., Ahi, S., Montibeller, B., Muru, M., and Kmoch, A.: Vertical Accuracy of Freely Available Global Digital Elevation Models (ASTER, AW3D30, MERIT, TanDEM-X, SRTM, and NASADEM), Remote Sens., 12, 3482, https://doi.org/10.3390/rs12213482, 2020.
Vastaranta, M., Niemi, M., Wulder, M. A., White, J. C., Nurminen, K., Litkey, P., Honkavaara, E., Holopainen, M., and Hyyppa, J.: Forest stand age classification using time series of photogrammetrically derived digital surface models, Scand. J. Forest Res., 31, 194–205, https://doi.org/10.1080/02827581.2015.1060256, 2016.
Véga, C. and St-Onge, B.: Height growth reconstruction of a boreal forest canopy over a period of 58 years using a combination of photogrammetric and lidar models, Remote Sens. Environ., 112, 1784–1794, 2008.
Wylie, R. R. M., Woods, M. E., and Dech, J. P.: Estimating Stand Age from Airborne Laser Scanning Data to Improve Models of Black Spruce Wood Density in the Boreal Forest of Ontario, Remote Sens., 11, 2022, https://doi.org/10.3390/rs11172022, 2019.
Xiao, Y., Wang, Q., Tong, X., and Atkinson, P. M.: Thirty-meter map of young forest age in China, Earth Syst. Sci. Data, 15, 3365–3386, https://doi.org/10.5194/essd-15-3365-2023, 2023.
Yang, J. and Huang, X.: The 30 m annual land cover dataset and its dynamics in China from 1990 to 2019, Earth Syst. Sci. Data, 13, 3907–3925, https://doi.org/10.5194/essd-13-3907-2021, 2021.
Yang, X., Liu, Y., Wu, Z., Yu, Y., Li, F., and Fan, W.: Forest age mapping based on multiple-resource remote sensing data, Environ. Monit. Assess., 192, 734, https://doi.org/10.1007/s10661-020-08694-4, 2020.
Ye, S., Zhu, Z., and Cao, G.: Object-based continuous monitoring of land disturbances from dense Landsat time series, Remote Sens. Environ., 287, 113462, https://doi.org/10.1016/j.rse.2023.113462, 2023.
Yu, Z., Zhao, H., Liu, S., Zhou, G., Fang, J., Yu, G., Tang, X., Wang, W., Yan, J., Wang, G., Ma, K., Li, S., Du, S., Han, S., Ma, Y., Zhang, D., Liu, J., Liu, S., Chu, G., Zhang, Q., and Li, Y.: Mapping forest type and age in China's plantations, Sci. Total Environ., 744, 140790, https://doi.org/10.1016/j.scitotenv.2020.140790, 2020.
Zeng, Y., Hao, D., Huete, A., Dechant, B., Berry, J., Chen, J. M., Joiner, J., Frankenberg, C., Bond-Lamberty, B., Ryu, Y., Xiao, J., Asrar, G. R., and Chen, M.: Optical vegetation indices for monitoring terrestrial ecosystems globally, Nat. Rev. Earth Environ., 3, 477–493, https://doi.org/10.1038/s43017-022-00298-5, 2022.
Zhang, C., Ju, W., Chen, J. M., Wang, X., Yang, L., and Zheng, G.: Disturbance-induced reduction of biomass carbon sinks of China's forests in recent years, Environ. Res. Lett., 10, 114021, https://doi.org/10.1088/1748-9326/10/11/114021, 2015.
Zhang, C., Dong, J., and Ge, Q.: Quantifying the accuracies of six 30-m cropland datasets over China: A comparison and evaluation analysis, Comput. Elect. Agricult., 197, 106946, https://doi.org/10.1016/j.compag.2022.106946, 2022.
Zhang, C. H., Ju, W. M., Chen, J. M., Li, D. Q., Wang, X. Q., Fan, W. Y., Li, M. S., and Zan, M.: Mapping forest stand age in China using remotely sensed forest height and observation data, J. Geophys. Res.-Biogeo., 119, 1163–1179, https://doi.org/10.1002/2013jg002515, 2014.
Zhang, F. M., Chen, J. M., Pan, Y. D., Birdsey, R. A., Shen, S. H., Ju, W. M., and He, L. M.: Attributing carbon changes in conterminous U.S. forests to disturbance and non-disturbance factors from 1901 to 2010 (vol 117, G02021, 2012), J. Geophys. Res.-Biogeo., 118, 1345–1346, https://doi.org/10.1002/jgrg.20083, 2013.
Zhang, H., Yang, Q., Zhou, D., Xu, W., Gao, J., and Wang, Z.: How evergreen and deciduous trees coexist during secondary forest succession: Insights into forest restoration mechanisms in Chinese subtropical forest, Global Ecol. Conserv., 25, e01418, https://doi.org/10.1016/j.gecco.2020.e01418, 2021a.
Zhang, J., Shang, R., Rittenhouse, C., Witharana, C., and Zhu, Z.: Evaluating the impacts of models, data density and irregularity on reconstructing and forecasting dense Landsat time series, Sci. Remote Sens., 4, 100023, https://doi.org/10.1016/j.srs.2021.100023, 2021b.
Zhang, M., Sun, P., and Sun, Z.: Spatiotemporally Mapping Non-Grain Production of Winter Wheat Using a Developed Auto-Generating Sample Algorithm on Google Earth Engine, Remote Sens., 16, 659, https://doi.org/10.3390/rs16040659, 2024.
Zhang, M., He, H., Zhang, L., Yu, G., Ren, X., Huang, Y., Yuan, W., and Niu, Z.: A Terrestrial Ecosystem Carbon Sink Assessment Model Considering Forest Age Dynamics (CEVSA-AgeD), J. Adv. Mode. Earth Syst., 17, e2024MS004575, https://doi.org/10.1029/2024MS004575, 2025.
Zhang, X., Liu, L., Chen, X., Gao, Y., Xie, S., and Mi, J.: GLC_FCS30: global land-cover product with fine classification system at 30 m using time-series Landsat imagery, Earth Syst. Sci. Data, 13, 2753–2776, https://doi.org/10.5194/essd-13-2753-2021, 2021c.
Zhang, Y., Yao, Y., Wang, X., Liu, Y., and Piao, S.: Mapping spatial distribution of forest age in China, Earth Space Sci., 4, 108–116, https://doi.org/10.1002/2016EA000177, 2017.
Zhao, G., Sanchez-Azofeifa, A., Laakso, K., Sun, C., and Fei, L.: Hyperspectral and Full-Waveform LiDAR Improve Mapping of Tropical Dry Forest's Successional Stages, Remote Sens., 13, 3830, https://doi.org/10.3390/rs13193830, 2021.
Zheng, H., Du, P., Guo, S., Wang, X., Zhang, W., Liu, S., and Li, X.: Bi-CCD: Improved Continuous Change Detection by Combining Forward and Reverse Change Detection Procedure, IEEE Geosci. Remote Sens. Lett., 19, 1–5, https://doi.org/10.1109/LGRS.2021.3095508, 2022.
Zhu, Z. and Woodcock, C. E.: Continuous change detection and classification of land cover using all available Landsat data, Remote Sens. Environ., 144, 152–171, https://doi.org/10.1016/j.rse.2014.01.011, 2014.
Zhu, Z., Wang, S., and Woodcock, C. E.: Improvement and expansion of the Fmask algorithm: cloud, cloud shadow, and snow detection for Landsats 4–7, 8, and Sentinel 2 images, Remote Sens. Environ., 159, 269–277, https://doi.org/10.1016/j.rse.2014.12.014, 2015.
Zhu, Z., Piao, S., Myneni, R. B., Huang, M., Zeng, Z., Canadell, J. G., Ciais, P., Sitch, S., Friedlingstein, P., Arneth, A., Cao, C., Cheng, L., Kato, E., Koven, C., Li, Y., Lian, X., Liu, Y., Liu, R., Mao, J., Pan, Y., Peng, S., Peñuelas, J., Poulter, B., Pugh, T. A. M., Stocker, B. D., Viovy, N., Wang, X., Wang, Y., Xiao, Z., Yang, H., Zaehle, S., and Zeng, N.: Greening of the Earth and its drivers, Nat. Clim. Change, 6, 791–795, https://doi.org/10.1038/nclimate3004, 2016.
Zhu, Z., Zhang, J. X., Yang, Z. Q., Aljaddani, A. H., Cohen, W. B., Qiu, S., and Zhou, C. L.: continuous monitoring of land disturbance based on Landsat time series, remote sensing of environment (vol 238, 11116, 2020), Remote Sens. Environ., 244, 111116, https://doi.org/10.1016/j.rse.2020.111824, 2020.