the Creative Commons Attribution 4.0 License.
the Creative Commons Attribution 4.0 License.
 | 03 Jul 2025
A dataset of ground-based vertical profile observations of aerosol, NO2, and HCHO from the hyperspectral vertical remote sensing network in China (2019–2023)
Peiyuan Jiao
Yikai Li
Xiangguang Ji
Wei Tan
Qihua Li
Haoran Liu
Vertical profile observations of atmospheric composition are crucial for understanding the generation, evolution, and transport of regional air pollution. However, existing technological limitations and costs have resulted in a scarcity of vertical profile data. This study introduces a high-time-resolution (approximately 15 min) dataset of vertical profile observations of atmospheric composition (aerosol, NO2, and HCHO) conducted using passive remote sensing technology across 32 sites in 7 major regions of China from 2019–2023. The study meticulously documents the vertical distribution, seasonal variations, and diurnal pattern of these pollutants, revealing long-term trends in atmospheric composition across various regions of China. This dataset provides essential scientific evidence for regional environmental management and policymaking. Its sharing would facilitate the scientific community in exploring source–receptor relationships, investigating the impacts of atmospheric composition on regional and global climate and feedback mechanisms. It also holds potential for enhancing satellite retrieval methods and advancing the development of regional transport models. The dataset is available for free at Zenodo (https://doi.org/10.5281/zenodo.15211604, Jiao et al., 2024).
- Article
(5940 KB) - Full-text XML
-
Supplement
(8417 KB) - BibTeX
- EndNote


In recent years, the implementation of policies such as the “Action Plan for Air Pollution Prevention and Control” (2013) and the “Three-Year Action Plan for Winning the Blue Sky War” (2018) has led to significant improvements in air quality across China (Feng et al., 2019; Maji et al., 2020; Jiang et al., 2021). Concentrations of pollutants such as PM2.5, NO2, and SO2 have substantially decreased nationwide (Zhang et al., 2020). However, O3 pollution has shown a continuous upward trend in some regions, emerging as a new environmental challenge (Li et al., 2024; Liu et al., 2022; Fan et al., 2020). As a developing country, China still faces elevated risks of exposure to PM2.5-O3 compound pollution, with its risk levels remaining relatively high on a global scale (He et al., 2024). This exacerbates threats to the ecological environment, climate systems, and human health. Therefore, there is an urgent need to establish a comprehensive monitoring network spanning from the surface to the upper atmosphere to systematically observe and analyze PM2.5, O3, and their precursors. Such efforts will facilitate the coordinated control of PM2.5-O3 compound pollution and provide critical data to support the development of effective and scientifically grounded mitigation strategies.
Aerosol, as one of the most complex and critical compositions of the atmospheric environment, is closely associated with PM2.5. It serves as both a major constituent and source of PM2.5, significantly impacting regional and global climates through direct and indirect radiative effects while posing multifaceted threats to air quality and human health (Ramanathan et al., 2001; Russell and Brunekreef, 2009). NO2 and volatile organic compounds (VOCs) such as HCHO participate in atmospheric photochemical reactions, acting as key precursors for O3 and secondary organic aerosol (SOA) (Chan et al., 2023; Liu et al., 2019). Various techniques have been employed to monitor and analyze these pollutants, including in-situ measurements, satellite observations, model simulations, and ground-based remote sensing. The China National Environmental Monitoring Center (CNEMC) has established a nationwide air quality monitoring network based on in-situ measurements, encompassing 2026 sites by 2023, to measure key pollutants such as PM2.5, PM10, NO2, and SO2. However, this network lacks VOC monitoring capabilities, preventing the acquisition of data on critical precursors such as HCHO. Additionally, as CNEMC measurements are limited to surface-level concentrations, they cannot adequately characterize pollutant transport within the boundary layer or distributions in elevated atmospheric columns (Huang et al., 2018b). Similarly, the AERONET dataset provides high-temporal-resolution data on aerosol optical depth (AOD) through in-situ measurements (Holben et al., 1998) but lacks insights into the vertical profile of aerosol. NASA's MODIS satellite aerosol products offer global, long-term vertical column density (VCD) data with extensive spatial coverage but are constrained by limited temporal and spatial resolution, making continuous monitoring within specific regions challenging (Justice et al., 2002). Moreover, relying solely on VCD measurements can lead to distorted assessments of local and regional contributions due to the vertical formation, aging, and transport processes occurring above ground level. The CALIPSO satellite offers insights into aerosol vertical profiles (Huang et al., 2007) but has a relatively long revisit cycle (∼16 days), limiting its ability to capture processes that change dramatically over time. Chemical transport models (CTMs) and regional climate models (RCMs) provide valuable information on trace gas concentrations and their evolution through atmospheric chemistry simulations (Huang et al., 2018a). However, these models depend heavily on accurate input parameters and initial conditions. Insufficient model representation and parameterization schemes introduce significant uncertainties in characterizing vertical distribution (Huang et al., 2016). To address the shortcomings in vertical distribution monitoring, some studies have employed ground-based remote sensing techniques to obtain the atmospheric vertical profile. Lidar systems provide high-resolution vertical profile data but are limited in the number of detectable pollutants and have a restricted spatial coverage. Airborne and balloon-based platforms offer detailed data on the upper atmospheric composition but are costly to operate and unsuitable for long-term, continuous monitoring. Tower-based observations cover the vertical distribution of pollutants within a few hundred meters above the surface but are unable to capture information from higher altitudes within the boundary layer.
This study, based on the hyperspectral vertical remote sensing network, provides a high-temporal-resolution dataset of vertical profiles of atmospheric composition in China from 2019–2023. To address the lack of vertical profile data for pollutants such as aerosol, NO2, and HCHO across the country, more than 30 hyperspectral vertical remote sensing sites were deployed across 7 major regions in China (North China, East China, South China, Southwest China, Northwest China, Northeast China, and Central China). This established a comprehensive ground-based remote sensing observation network, fulfilling the need for long-term vertical monitoring on a national scale. Section 2 details the distribution of monitoring sites, the MAX-DOAS instrumentation, and the data retrieval algorithms employed. Section 3 focuses on the vertical distribution characteristics of aerosol, NO2, and HCHO, along with their seasonal and diurnal variations. Sections 4 and 5 address the availability of the dataset and provide a summary of the findings, respectively.
2.1 Description of the monitoring sites
This dataset originates from 32 hyperspectral vertical remote sensing sites, covering 7 major regions in China (9 sites in North China, 13 sites in East China, 3 sites in South China, 2 sites in Southwest China, 2 sites in Northwest China, 2 sites in Northeast China, and 1 site in Central China). Table 1 presents the geographical distribution and detailed information about each site. The sites span typical regions of China, including major metropolitan areas, rural areas, coastal regions, basins, and plateaus. Table S1 in the Supplement offers information on site type and major emission sources in the surrounding areas. Coverage of densely populated urban areas provides data pertinent to anthropogenic emissions, while observations from remote and high-altitude locations offer insights into background atmospheric conditions and long-distance transport processes. The diversity of sites allows for a comprehensive assessment of the vertical distribution characteristics of aerosol, NO2, and HCHO across China.
Table 1Geography of the hyperspectral vertical remote sensing network of China. Regional division is based on China's administrative division standards.
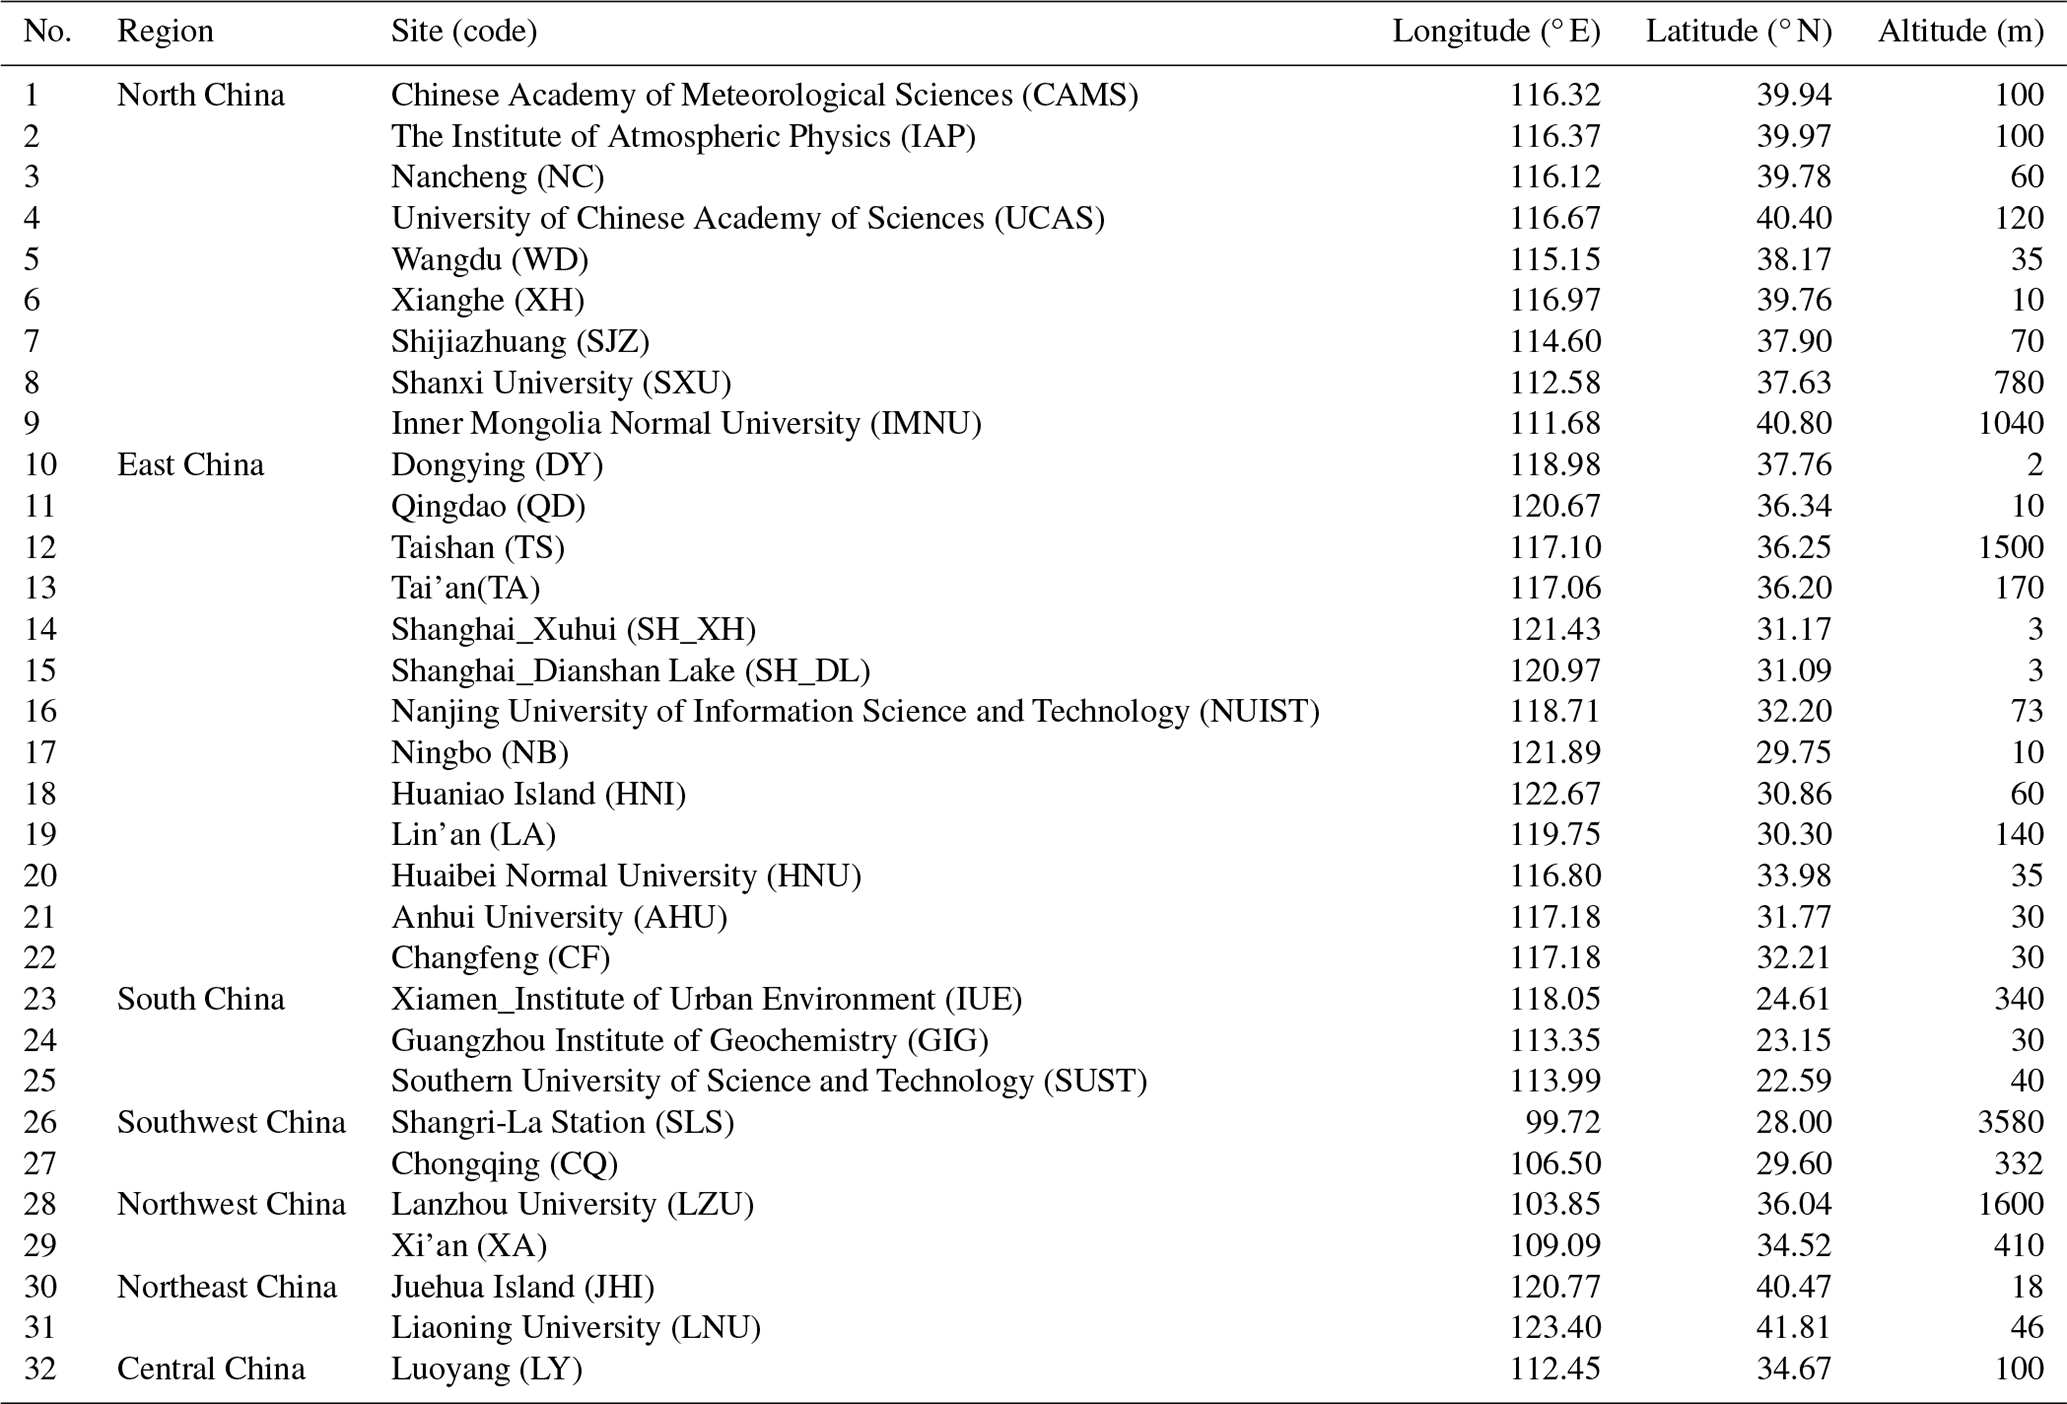
In this study, we set up 32 monitoring sites across 7 regions nationwide, encompassing a range of geographic environments, from coastal plains to inland plateaus. The elevations of these monitoring sites range from near sea level (2 m) to the Tibetan Plateau (3580 m), representing a variety of terrain features, climate conditions, and pollution source distributions. The diversity of these monitoring sites helps provide a complete perspective on the vertical distribution of aerosol, NO2, and HCHO in China. In North China, monitoring sites are widely distributed, such as the Chinese Academy of Meteorological Sciences (CAMS), the Institute of Atmospheric Physics of the Chinese Academy of Sciences (IAP), and the University of the Chinese Academy of Sciences (UCAS). These sites, situated within the Beijing–Tianjin–Hebei urban cluster, are located at altitudes ranging from 10–120 m, focusing on the impact of urbanization and industrialization on atmospheric composition. Sites like Nancheng (NC) and Wangdu (WD) in suburban and rural areas represent background atmospheric conditions. Additionally, sites in Shijiazhuang (SJZ), Shanxi University (SXU), and Inner Mongolia Normal University (IMNU) extend coverage across diverse terrains such as the Taihang Mountains and Inner Mongolia Plateau, providing essential data for studying pollutant formation and transport between mountainous and plain areas. In East China, sites are primarily distributed across coastal areas and the mid-to-lower reaches of the Yangtze River, such as Xuhui in Shanghai (SH_XH), and Nanjing University of Information Science and Technology (NUIST), which are located in China's economically developed and densely populated areas. Coastal sites like Qingdao (QD), Dongying (DY), and Ningbo (NB) vary in altitude from 2–170 m, significantly influenced by ocean–land interactions. Sites at Mount Tai (TS) and Taian (TA), located at 1500 and 170 m, respectively, offer vertical distribution data across different elevations. Sites like Lin'an (LA) and Huaniao Island (HNI) expand observations into inland mountainous and offshore island areas, supporting the study of trace gas distributions in different terrains and the interface between land and sea. In South China, sites such as the Institute of Urban Environment in Xiamen (IUE), the Guangzhou Institute of Geochemistry (GIG), and Southern University of Science and Technology (SUST) span from coastal cities to inland mountains within a typical subtropical climate zone. These sites, at altitudes ranging from 30–340 m, provide valuable data on the vertical distribution of aerosol, NO2, and HCHO under tropical and subtropical conditions influenced by oceanic monsoons and typhoons. Sites in Southwest China include Shangri-La (SLS), located on the southeastern Tibetan Plateau at 3580 m, which is the highest site in the network, representing background atmospheric conditions at high altitudes and providing unique data on vertical distributions in elevated regions. Chongqing (CQ), located in the Sichuan Basin, is densely populated and industrialized, making it an ideal location to study atmospheric transport between plateaus and basins. Sites in Northwest China include Lanzhou University (LZU) and Xi'an (XA), situated on the Loess Plateau and Hexi Corridor at altitudes of 1600 and 410 m, respectively. These sites represent the typical arid and semi-arid atmospheric environment influenced by dust storms and desert-source aerosol, essential for understanding aerosol and trace gas transport and transformation in arid regions. Northeast China covers the Northeast Plain and Liaodong Peninsula, including Juhua Island (JHI) and the Liaoning University (LNU) site. JHI is located on an offshore island at an elevation of 18 m, monitoring air quality and atmospheric composition changes at the land–sea boundary. LNU is located in Shenyang at an elevation of 46 m, and Shenyang represents an area with both industrial and agricultural activities, aiding in the analysis of aerosol and pollutant profiles in the northeast. Central China includes a site in Luoyang (LY) at 100 m, situated in the middle reaches of the Yellow River, a crucial industrial and agricultural area. The LY site provides critical data on vertical distribution in the central plains, supporting studies on regional transport and accumulation of air pollutants.
The diversity in geographic location, altitude, and regional characteristics of these monitoring sites enables comprehensive monitoring of various atmospheric environments across China. This extensive coverage captures the vertical distribution features of aerosol, NO2, and HCHO across urban, rural, coastal, mountainous, and plateau regions, forming a robust monitoring network that reflects the complex air pollution dynamics within China.
2.2 MAX-DOAS measurements
The MAX-DOAS instruments at the 32 sites operated in varying periods from 2019–2023. Each instrument comprises three essential components: two AvaSpec-ULS2048L-USB2 spectrometers (covering the UV range from 296–408 nm and the visible range from 420–565 nm), a telescope with a viewing precision of <0.1° and a field of view of <0.3°, and a computer for controlling operations and data storage. The telescope's elevation and azimuth angles are controlled by two stepper motors, allowing measurements of atmospheric composition at different angles. The elevation angles sequence used in this study is set to 1°, 2°, 3°, 4°, 5°, 6°, 8°, 10°, 15°, 30°, and 90°, with each cycle taking approximately 12 min, depending on the intensity of scattered sunlight. During nighttime, dark currents and offsets are recorded and later corrected in the spectral analysis. To minimize stratospheric interference, spectra collected at solar zenith angles (SZAs) greater than 75° are excluded.
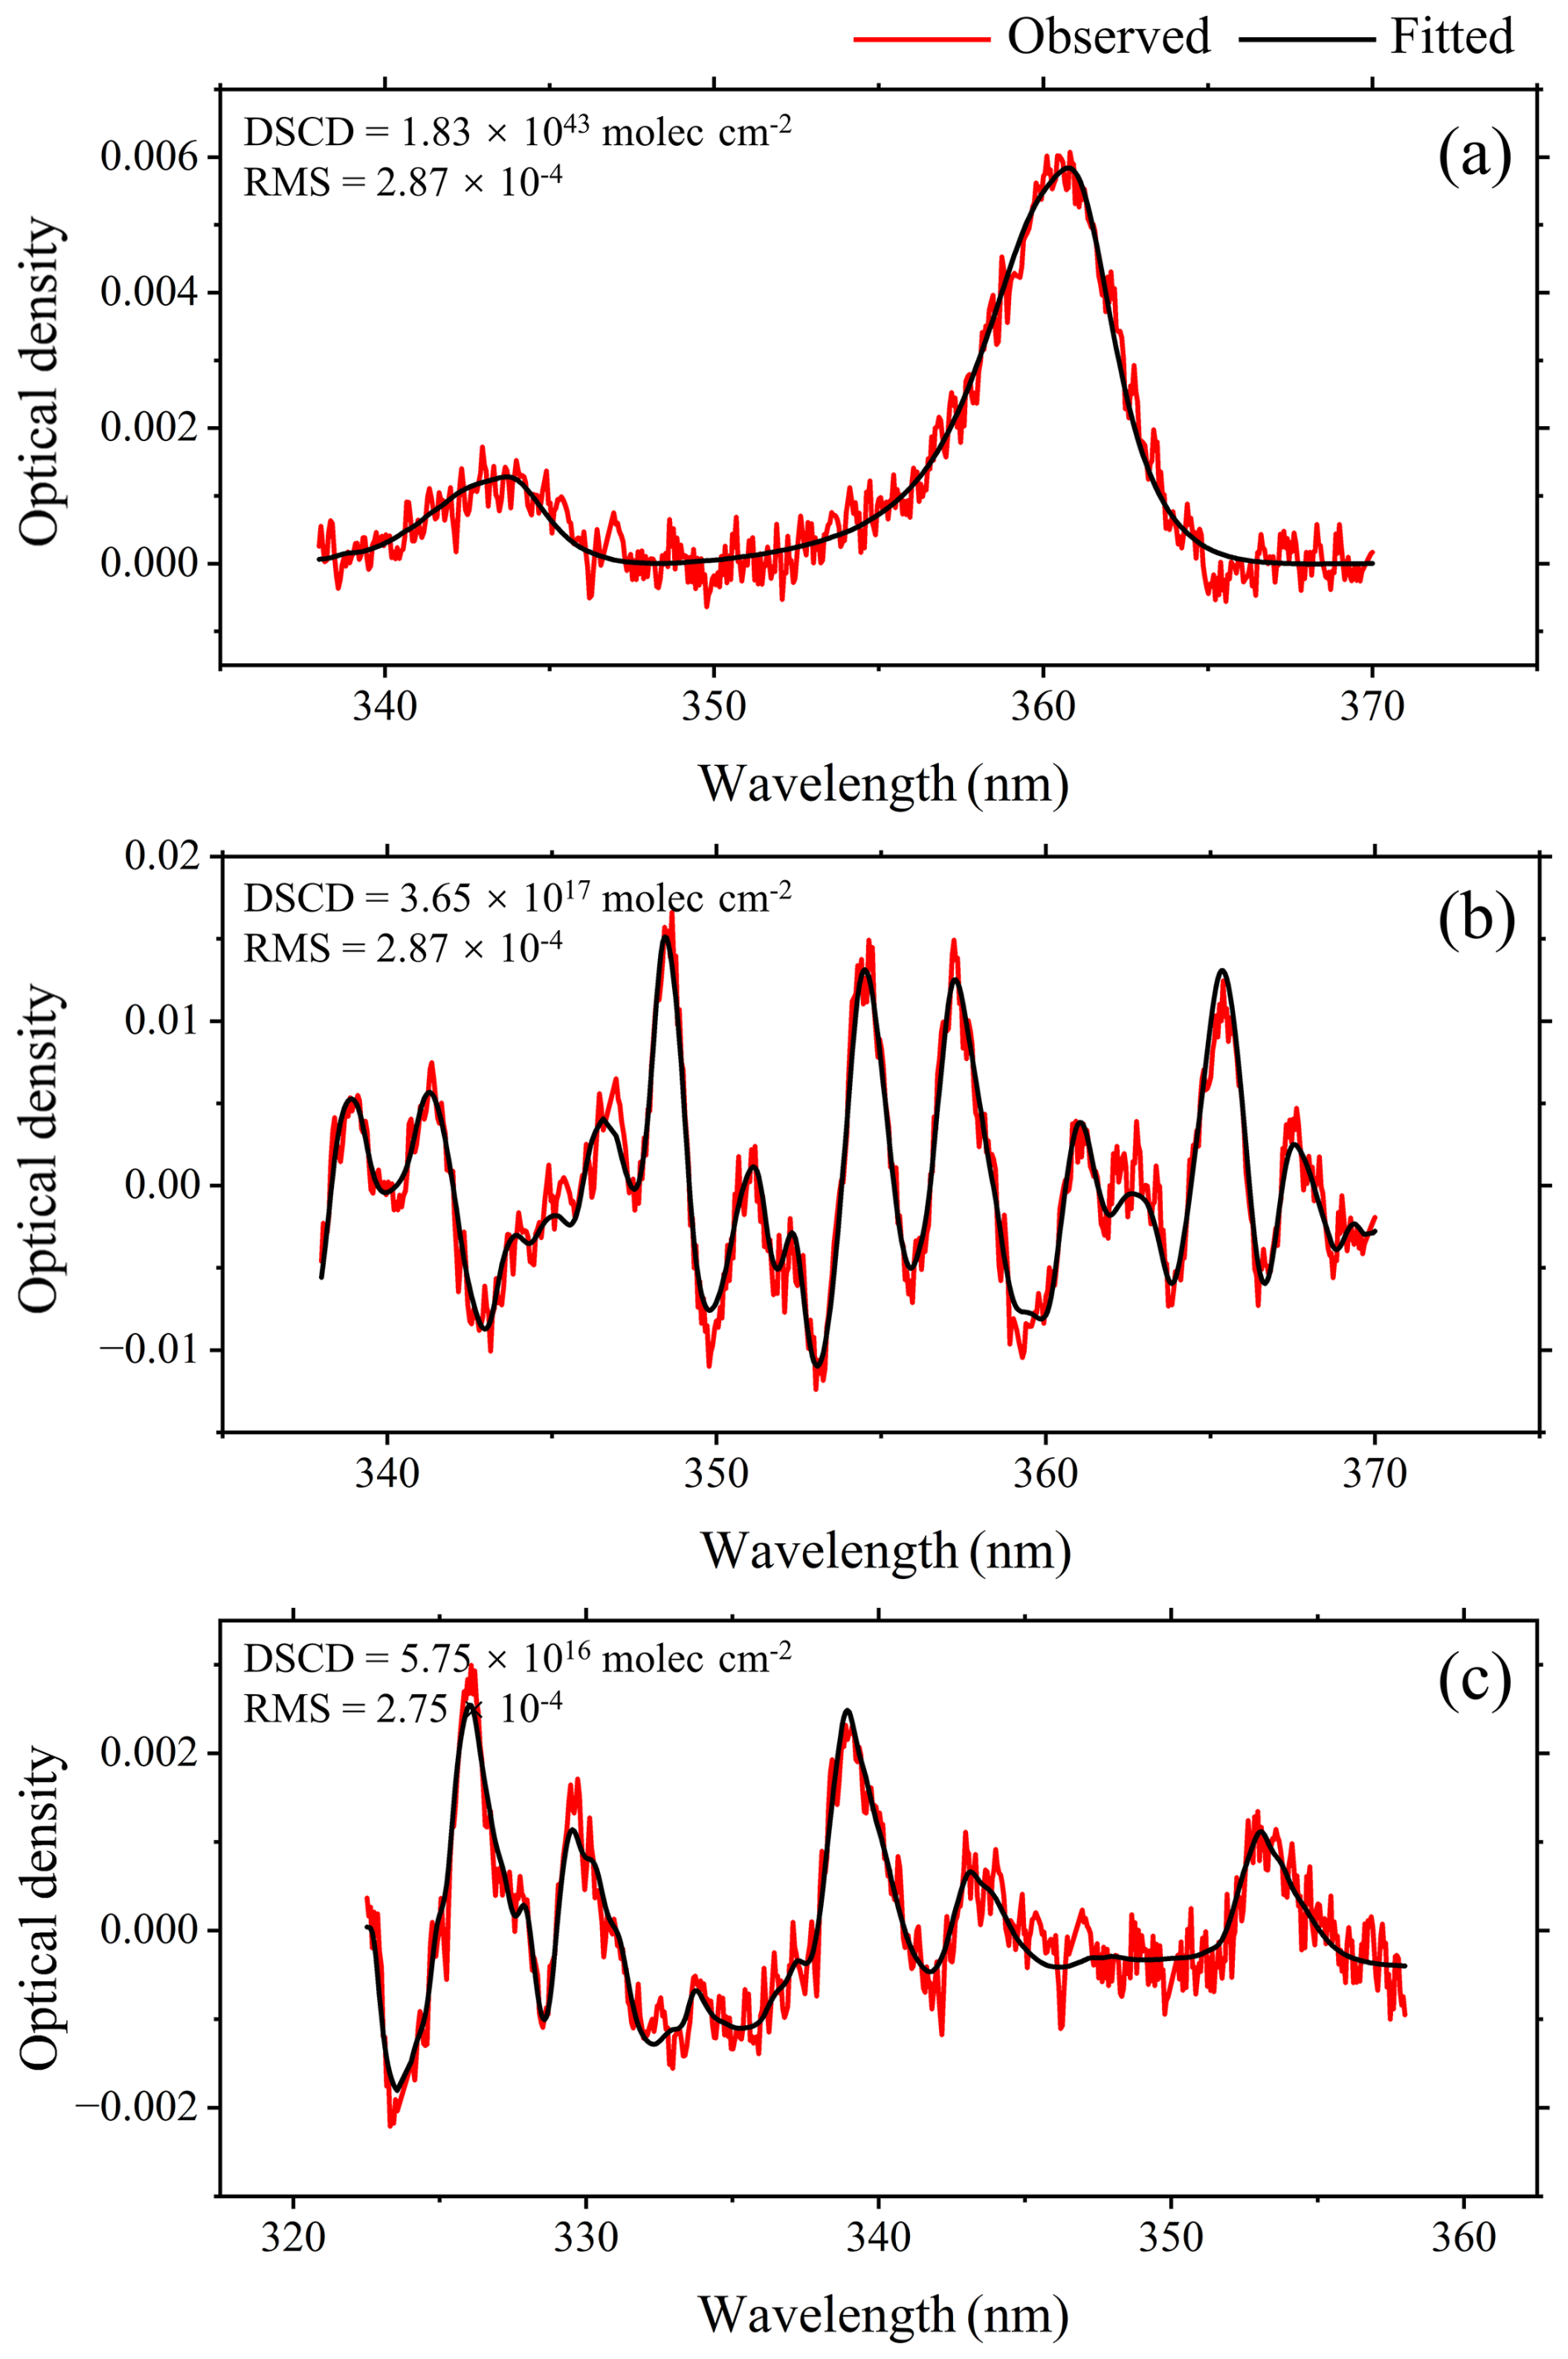
For differential slant column density (DSCD) retrievals of oxygen dimer (O4), NO2, and HCHO, the QDOAS software developed by BIRA-IASB is utilized, with configuration settings following Xing et al. (2020, 2021b) and detailed in Table 2. In the retrieval process, spectra measured at 90° elevation serve as reference spectra, and the DSCD is calculated by difference with each elevation series spectra, enabling absorption analysis for O4, NO2, and HCHO. An example of the DOAS fitting results for these three compositions is shown in Figure 1. To ensure data validity, retrievals with an rms value greater than are filtered out. To account for cloud effects, a color index (CI) threshold is computed using a fifth-order polynomial fit, excluding the lowest 10 % of CI data.
Table 2Detailed retrieval settings of O4, NO2, and HCHO.
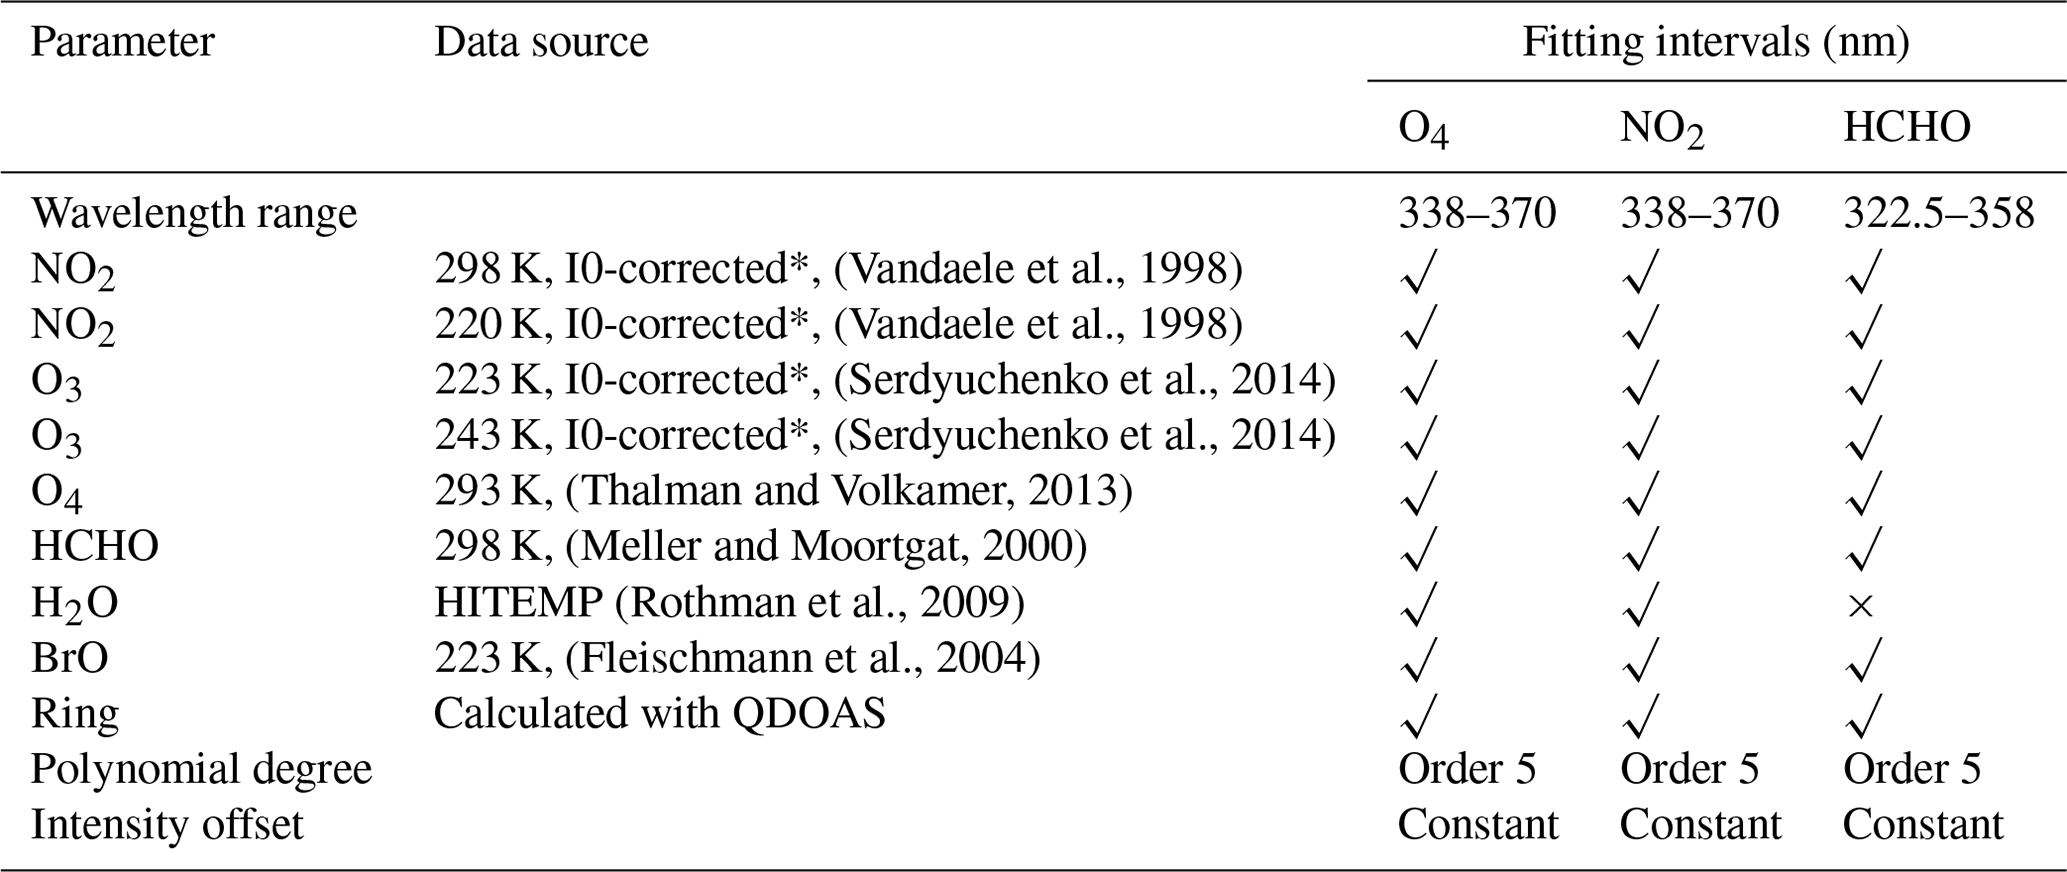
∗ Solar I0 correction, Aliwell et al. (2002).
Vertical profiles of aerosol and trace gases (NO2 and HCHO) are retrieved using an Optimal Estimation Method (OEM), with the VLIDORT radiative transfer model serving as the forward model. The retrieval process minimizes the following cost function, χ2, to estimate the posterior state vector x:
Here, F(x,b) represents the forward model, describing the measurement vector y (DSCDs at different elevation angles) as a function of the state vector x (pollutant profiles) and actual atmospheric parameters (temperature and pressure profiles, surface albedo, and aerosol phase function). xa denotes a priori state vector, while Sε and Sa are the covariance matrices for y and xa, respectively. The retrieval uses a two-step Gaussian–Newton (GN) approach, first deriving aerosol profiles from O4 DSCDs and subsequently inputting them as forward model parameters to obtain NO2 and HCHO profiles. Profile data with a degree of freedom (DOF) below 1.0, χ2 above 200, or relative retrieval error above 50 % are excluded.
Figure 2 shows the monthly data integrity for the aerosol, NO2, and HCHO vertical profiles at each site during 2019–2023, with full continuity indicated by 100 %. The observation period varied among sites due to differing setup dates. Of the 32 sites, 81.3 % recorded over 1 year of profile data, and 59.4 % provided more than 2 years. Long-term sites, such as CAMS, UCAS, WD, and NC in North China; AHU, NUIST, and HNI in East China; SUST and GIG in South China; CQ in Southwest China; LZU in Northwest China; and LY in Central China achieved data coverage spanning 2–5 years. These sites reflect the impact of natural and anthropogenic factors on atmospheric composition over extended time scales in different regions of China. Some sites, like LNU and IUE, operated for shorter periods due to experimental scheduling and equipment availability but still captured more than 4 months of data. For regional representativeness, these sites provide references for variations in atmospheric composition under diverse geographic and climatic conditions. Among all sites, 90.6 % recorded more than 6 months of continuous data, and 68.8 % achieved over 1 year of continuous observations. This continuity enhances data reliability and provides robust insights into long-term trends and patterns of aerosol and trace gases. Some sites experienced data gaps due to factors such as power or equipment failures, adverse weather conditions (e.g., rain or heavy clouds), or high retrieval error and low DOF, which occasionally led to retrieval failures. Given the heterogeneity of atmospheric composition, the vertical profile resolution was set to 0.1 km for the 0–1.0 km range and 0.2 km for the 1.0–3.0 km range (Xing et al., 2021a). As the daytime boundary layer height typically ranges from 0.1–2 km (Guo et al., 2016), we used three altitude layers of 0–100, 500–600, and 900–1000 m to represent the lower, middle, and upper boundary layers, respectively. The time series of the aerosol extinction coefficient, NO2 concentration, and HCHO concentration for the three altitude layers during 2019–2023 are shown in Figures S1–S3, with the corresponding correlation analysis provided in Section S2.
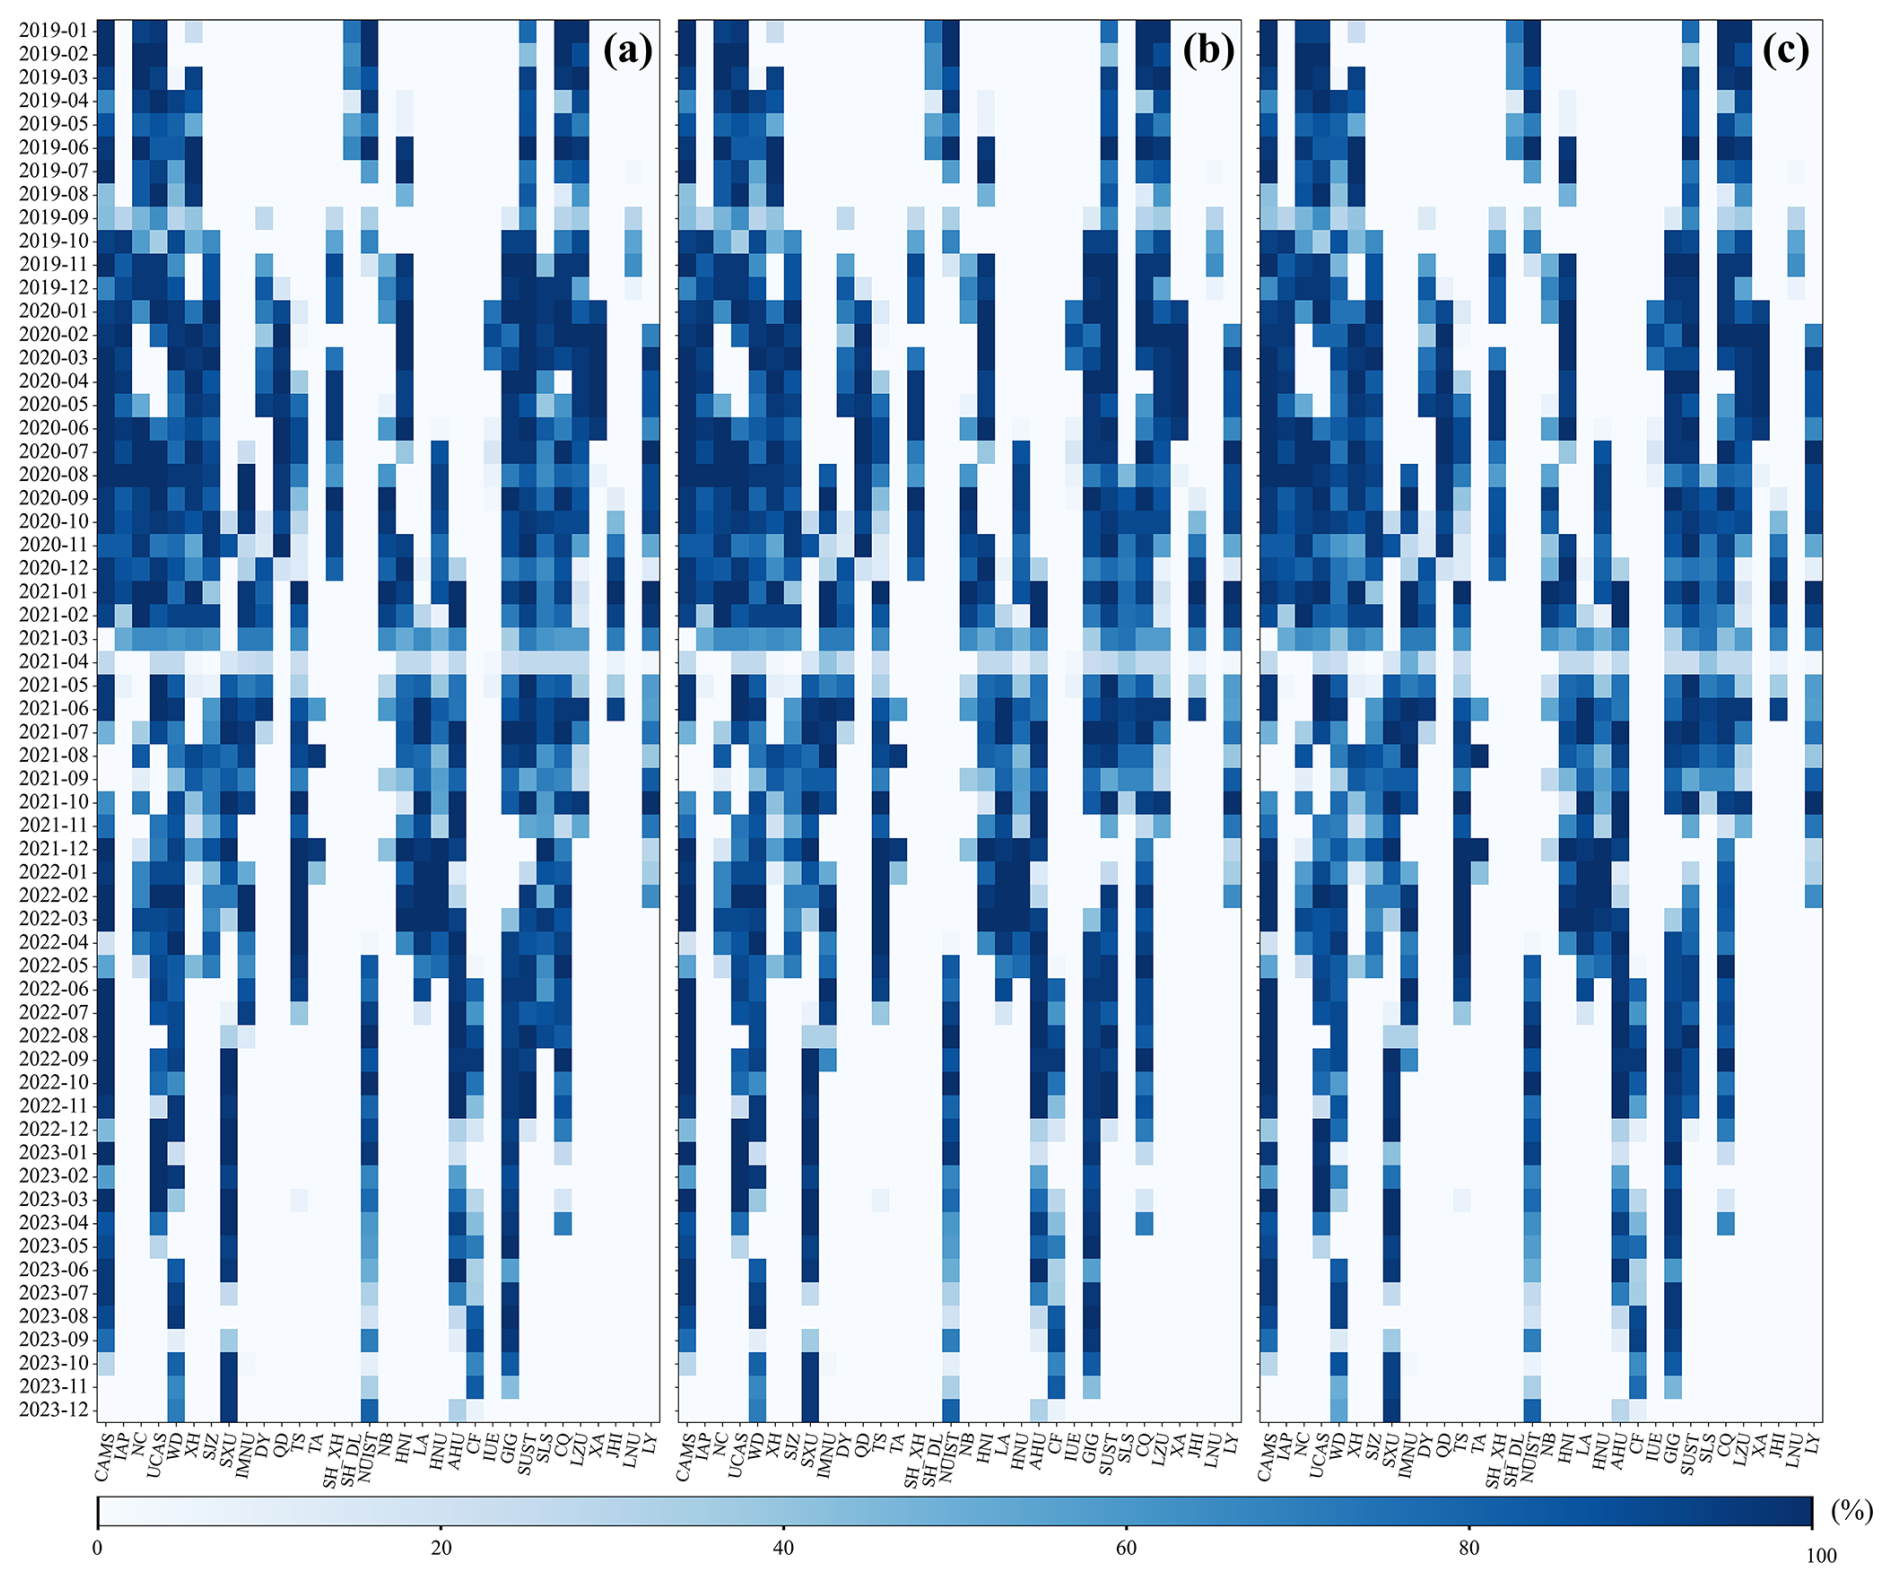
Figure 2Monthly data integrity for (a) aerosol, (b) NO2, and (c) HCHO vertical profiles during 2019–2023.
3.1 Aerosol
The box plot of the total AOD for the 32 sites during the period from 2019–2023 is shown in Figure 3. The median of the box plot represents the typical or representative AOD value at each site during the observation period, while the length of the box reflects the range of AOD variation over the observation period. AOD values in East China, South China, Southwest China, and Central China are generally higher than those in North China, Northwest China, and Northeast China, showing an overall trend of a higher AOD in the south and east, and lower in the north and west. This pattern is consistent with the findings of Filonchyk et al. (2019). The median of AOD in Central China is 0.73, the highest among all regions, followed by South China at 0.69. These values are 181 % and 165 % higher than the lowest median of AOD in Northeast China, respectively. It is important to note that Central China has only one site (LY) located in the industrial city of Luoyang, which may result in an overestimation of the representative AOD for the region. In addition, the SLS site in Southwest China is located in a high-altitude, clean environment, with a median of AOD of 0.11, which is close to 0. In contrast, the CQ site, located in the Sichuan Basin, has a median of AOD of 0.89. Sites in North China, such as XH, NC, and IAP, show relatively high upper quartile values of AOD (0.97, 0.88, and 0.93, respectively), indicating more frequent high AOD events in this region. This is likely associated with the higher level of industrialization and pollution accumulation during the winter heating season in North China (Xiao et al., 2015; Cai et al., 2020). Notably, the AOD upper quartile for the SJZ site is 1.18, significantly higher than other North China sites, reflecting the heavier aerosol load in this area. In East China, the AOD range varies from 0.39–0.94, with the lower bound attributed to the TS site, which is located on the summit of Mount Tai, far from pollution sources, in a relatively clean environment. The upper bound occurs at the SH_DL site, which is located near a lake. The higher air humidity at this site leads to hygroscopic growth of aerosol particles (Lee et al., 2008; Wang et al., 2021), resulting in consistently high AOD values, with the upper whisker reaching 3.67. The AOD range in South China is between 0.46 and 1.09, while in Northwest China, it ranges from 0.40–0.81. Northeast China exhibits the lowest AOD values, with an average range of 0.12–0.55. This may be due to the colder temperatures and lower solar radiation in Northeast China, which result in more active cold air movements and stronger winds that accelerate the diffusion of pollutants (Zhao et al., 2013).
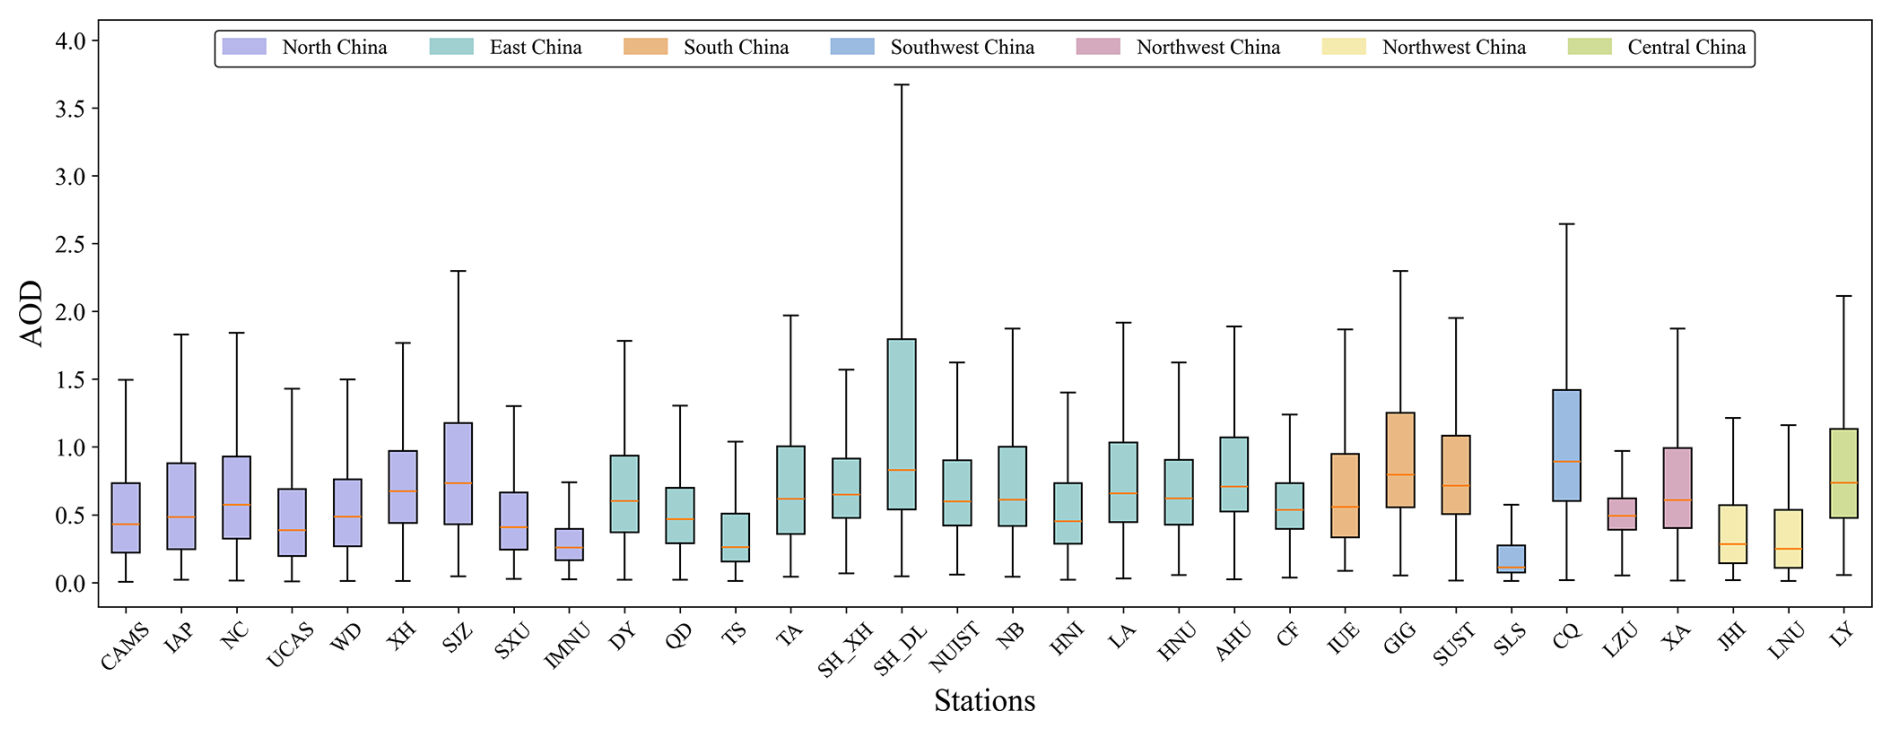
Figure 3Total AOD box plot for each site in 2019–2023, and the color of each box represents the region where the site is located.
Figure 4 shows the total averaged vertical profiles of aerosol extinction from 2019–2023. The averaged profiles for almost all sites exhibit a decreasing trend, with the highest aerosol extinction occurring near the surface, rapidly decreasing with the altitude. In North China, the near-surface aerosol extinction coefficients (AECs) at Beijing sites average 0.67, which is 16 % lower than that of other cities in the region. This may be attributed to the strict environmental regulations and denser environmental monitoring in the capital. Overall, the SH_DL site shows a significantly higher surface AEC of 1.96, which can be attributed to its proximity to a lake–wetland environment, where aerosol particles condensate under high air humidity, leading to an increase in aerosol content (Wang et al., 2021). Similarly, the CQ site, located in a subtropical humid climate, experiences higher air humidity, and the basin topography restricts the diffusion of pollutants, resulting in elevated surface aerosol concentrations, with a coefficient reaching 1.48 (Yuan et al., 2023). The maximum extinction coefficient of the total averaged profile at the SUST site occurs at an altitude of 200 m above the ground, possibly due to the regional transport of pollutants from the north (Wu et al., 2022). The seasonal averaged vertical profiles of AEC are shown in Figures S4–S7. The ratios of the middle to lower boundary layer AECs in the total averaged, spring averaged, summer averaged, autumn averaged, and winter averaged profiles are 63.71 %, 64.58 %, 68.50 %, 59.37 %, and 52.76 %, respectively. The upper-layer ratios decrease to 32.93 %, 33.85 %, 35.90 %, 30.45 %, and 26.08 %. Near-surface aerosol content exhibits seasonal variation. The averaged near-surface AECs in spring, summer, autumn, and winter account for 23.60 %, 24.63 %, 24.69 %, and 27.08 % of the total averaged values of the four seasons, respectively. The peak in aerosol concentration occurs in winter, which is closely linked to the large-scale coal combustion emissions from heating in northern regions and the formation of thermal inversion layers in winter (Bai et al., 2022; Cai et al., 2020). In spring, sandstorms are frequent in North China and Northwest China, and the accumulation of dust aerosol in the upper atmosphere significantly increases the extinction coefficient (Gui et al., 2022; Filonchyk et al., 2018). This results in seasonal increases in aerosol concentrations at sites such as SXU, IMNU, and LZU during spring. Some southeastern coastal sites, such as SUST and GIG, exhibit lower AECs across the entire vertical profile during the summer, likely due to the frequent rainfall and monsoon influences. This reduction in aerosol concentration may be attributed to the efficient removal of aerosol particles through wet deposition (Liu et al., 2021). Some southern sites exhibit moderate pollution accumulation in winter, which may be associated with long-range transport of pollutants from the north (Xiao et al., 2015; Lee and Hills, 2003). The SLS site in the southwestern plateau is located in a remote area, far from industrial and urban pollution sources, resulting in generally low AECs. At the CQ site, aerosol concentrations peak during the winter, which may be associated with topography and adverse meteorological conditions, such as low boundary layer height, which impede the dispersion of pollutants (Wang and Cai, 2023; Zhao et al., 2019).
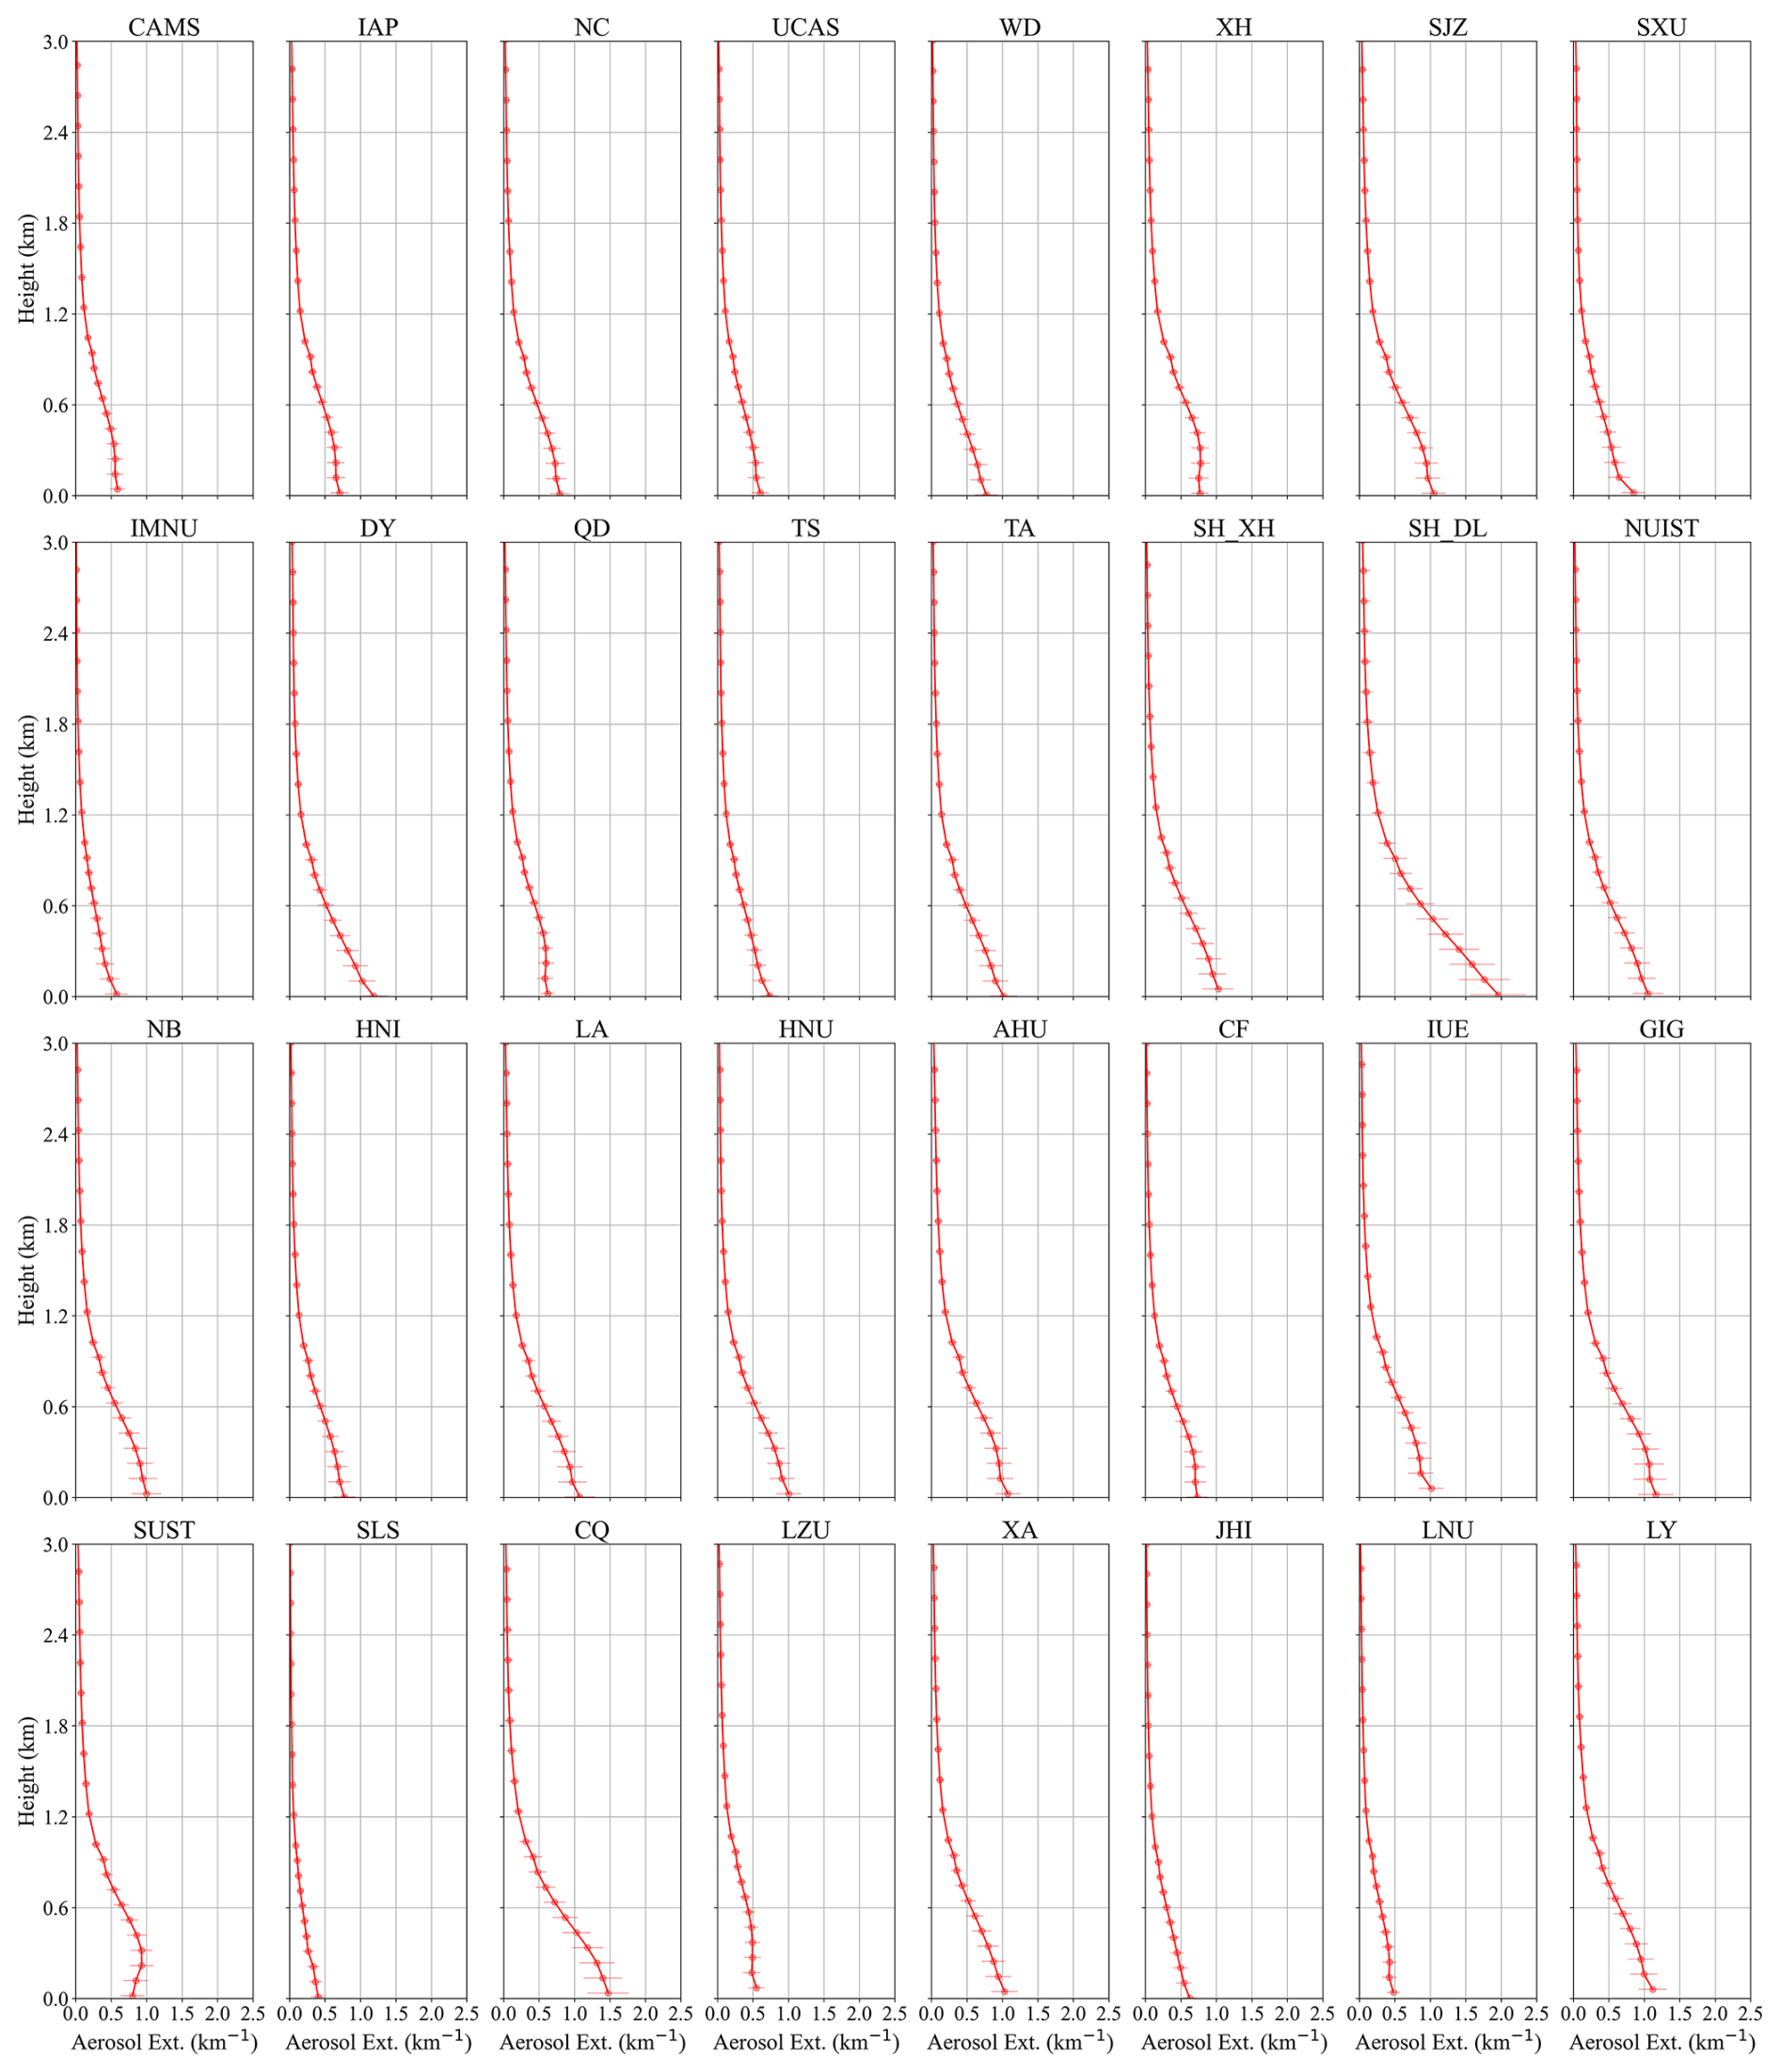
Figure 5 illustrates the diurnal variation of the total averaged aerosol extinction vertical profiles. High-concentration aerosols with extinction coefficients exceeding 1.0 km−1 are primarily distributed below 600 m, while aerosols with extinction coefficients greater than 0.6 km−1 are concentrated below 1000 m. At many sites, the AEC exhibits a bimodal pattern, with one peak occurring before 12:00 Beijing time (BJT) and the other between 16:00 and 18:00 BJT. The afternoon decline in aerosol concentration can be attributed to increased atmospheric mixing driven by higher temperatures, while the evening increase may result from the formation of a stable boundary layer that inhibits vertical dispersion of pollutants (Liu et al., 2024). This bimodal pattern is more pronounced at urban sites such as CAMS, IAP (located in central Beijing) and SH_XH (located in central Shanghai), likely due to the significant contribution of traffic emissions during the morning and evening rush hours. In contrast, the SH_DL site, located near a lake and subject to high humidity, exhibits persistently elevated aerosol concentrations without distinct peaks. At urban sites in southeastern cities such as SH_XH (Shanghai), GIG (Guangzhou), and SUST (Shenzhen), a concentration peak around midday is observed. This can be attributed to intensified photochemical reactions driven by elevated surface temperatures, leading to secondary aerosol formation (Chang and Lee, 2007; Wang et al., 2016). The bimodal pattern is less distinct in regions such as East China and Southwest China. This difference could stem from variations in aerosol sources. In northern regions, a greater proportion of aerosol originates from sources like dust and coal combustion, which are prone to accumulation and peak formation. Conversely, finer aerosol prevalent in southeastern regions have shorter atmospheric residence times, resulting in less pronounced concentration changes (Zhang et al., 2022; Cheng et al., 2024). Most sites exhibit lower AECs between 14:00 and 16:00 BJT, likely due to the enhanced solar radiation and elevated boundary layer height during this period, which facilitate vertical dispersion of aerosol and lead to reduced extinction coefficients (Gu et al., 2020; Huang et al., 2023). The diurnal variation of vertical profiles across different seasons is shown in Figures S8–S11. During winter, the bimodal aerosol extinction pattern is most prominent, closely linked to coal-burning heating activities concentrated in the morning and evening in northern rural regions (Cai et al., 2020). The frequent occurrence of temperature inversions during these times further exacerbates the bimodal pattern by trapping aerosol from rush-hour traffic and industrial emissions near the surface (Bai et al., 2022). In summer, the maximum aerosol dispersion height is observed, with high extinction coefficients at some sites appearing in 200–500 m. This phenomenon may be associated with active atmospheric circulation facilitating regional pollutant transport during the summer months.
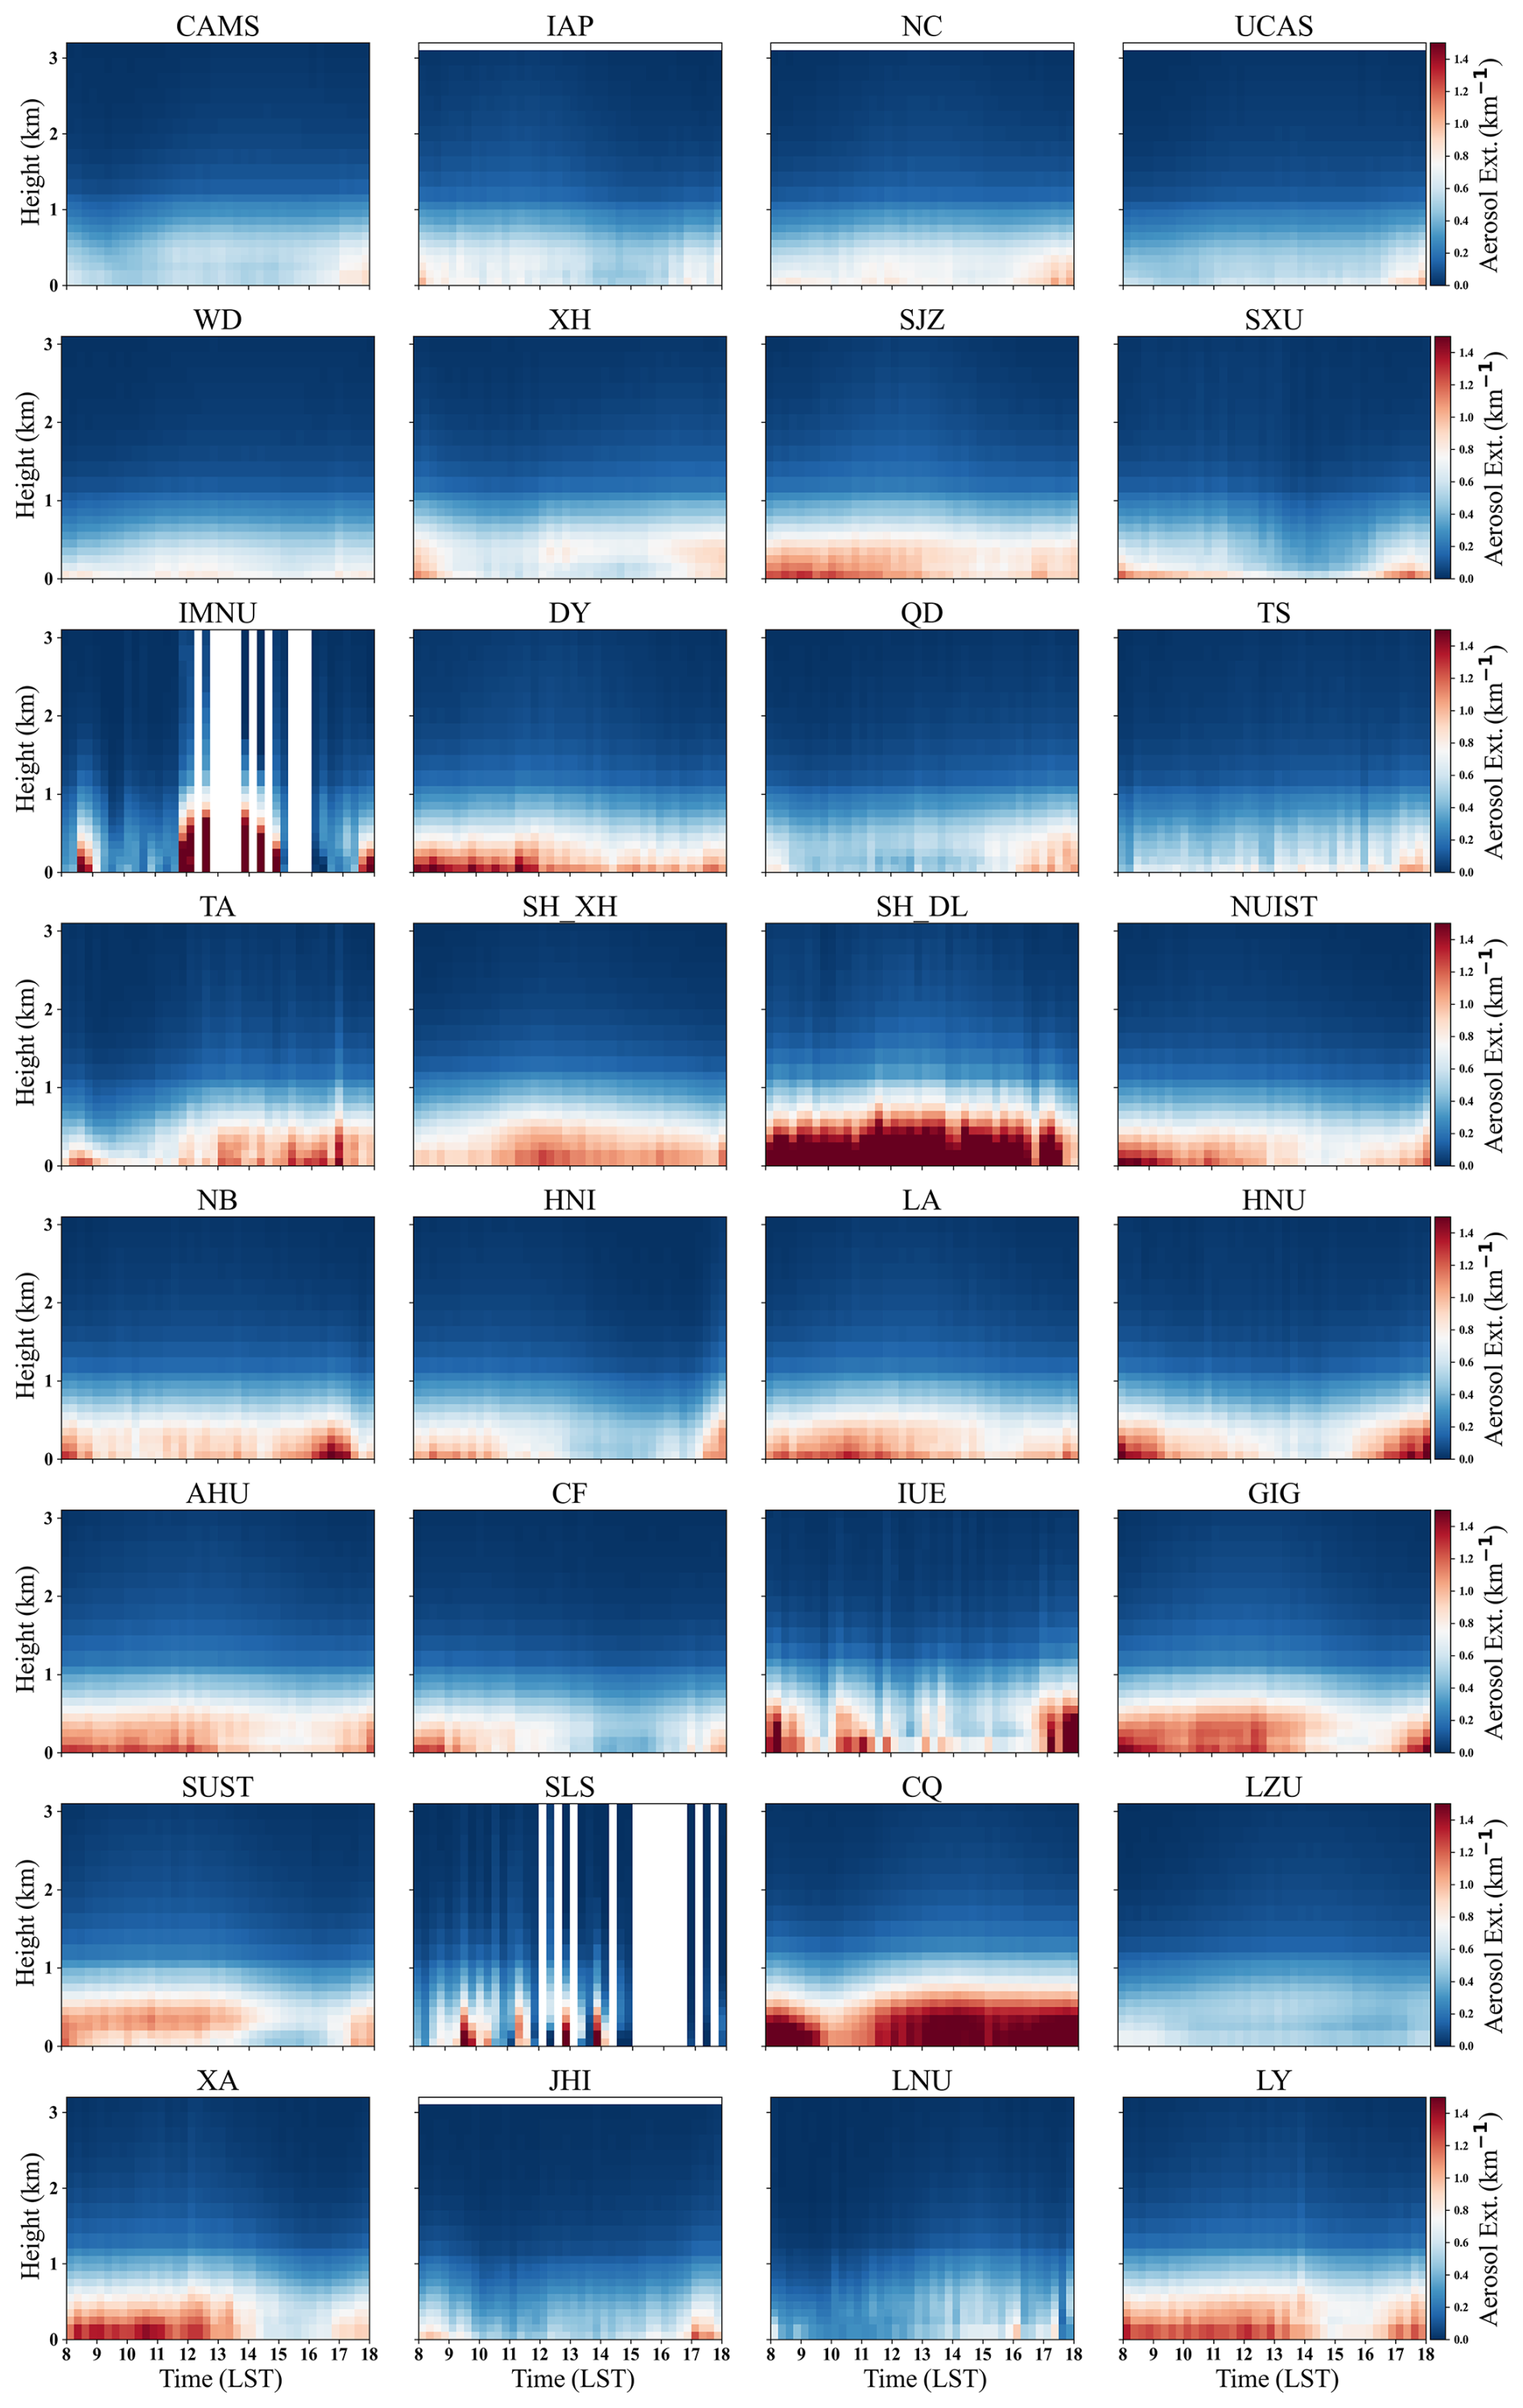
Figure 5Diurnal variation of the total averaged aerosol extinction vertical profiles during 2019–2023.
3.2 Nitrogen dioxide (NO2)
Figure 6 presents the total averaged vertical profile of NO2 from 2019–2023. NO2 concentrations exhibit distinct variations across the lower, middle, and upper atmospheric layers, with the highest levels concentrated near the surface. At most sites, NO2 concentrations are elevated near the surface and decrease sharply with the altitude, a pattern closely linked to ground-based emission sources such as transportation and industrial activities (Liu et al., 2017; Jiang et al., 2020). However, some sites, such as SXU, show an atypical vertical profile where elevated NO2 concentrations are observed at approximately 100 m above ground level. This anomaly may result from variations in the height of local emission sources, atmospheric temperature inversions, and local wind field effects that facilitate the accumulation of pollutants at this altitude (Bai et al., 2022; Li et al., 2023). At urban sites, such as IAP and AHU, located in the central areas of Beijing and Hefei, high NO2 concentrations near the surface are primarily attributed to high population density, rapid industrialization, and heavy vehicular emissions (He et al., 2023; Lamsal et al., 2013). In contrast, suburban and rural sites, such as UCAS and CF near Beijing and Hefei respectively, exhibit lower NO2 concentrations due to fewer emission sources and more favorable dispersion conditions. Specifically, the averaged near-surface NO2 concentration at the IAP site (Beijing urban center) is 13.96 ppb, 125.16 % higher than the UCAS site (Beijing suburb), which has an averaged concentration of 6.20 ppb. Similarly, the AHU site (Hefei urban center) records an averaged near-surface NO2 concentration of 9.39 ppb, 103.69 % higher than the CF site (Hefei rural area), which averages 4.61 ppb. At remote locations, such as the SLS site in Southwest China and the TS site atop Mount Tai, where anthropogenic emission sources are minimal, and atmospheric convection in the mountainous areas facilitates vertical dispersion (Triantafyllou and Kassomenos, 2002), NO2 concentrations are generally lower, with minimal vertical gradients. Seasonal averaged vertical profiles of NO2 are illustrated in Figures S12–S15. The ratios of the middle to lower boundary layer NO2 concentrations in the total averaged, spring averaged, summer averaged, autumn averaged, and winter averaged profiles are 33.50 %, 36.46 %, 36.85 %, 34.04 %, and 30.69 %, respectively. The proportions in the upper layer decrease to 15.92 %, 17.57 %, 18.19 %, 16.20 %, and 14.26 %, respectively. The averaged near-surface NO2 concentrations in spring, summer, autumn, and winter account for 23.06 %, 16.57 %, 25.74 %, and 34.63 % of the total averaged values of the four seasons, respectively. During the winter heating season, northern sites experience significant NO2 emissions from coal combustion (Wang et al., 2023; Meng et al., 2018), coupled with temperature inversions that inhibit vertical diffusion, leading to a vertical profile where concentrations decline rapidly with the altitude (Bai et al., 2022; Cai et al., 2020). In summer, stronger atmospheric convection and more favorable dispersion conditions result in smoother vertical profiles and lower overall NO2 concentrations, attributable to the scavenging effects of precipitation and strong winds (Shen et al., 2021; Harkey et al., 2015).
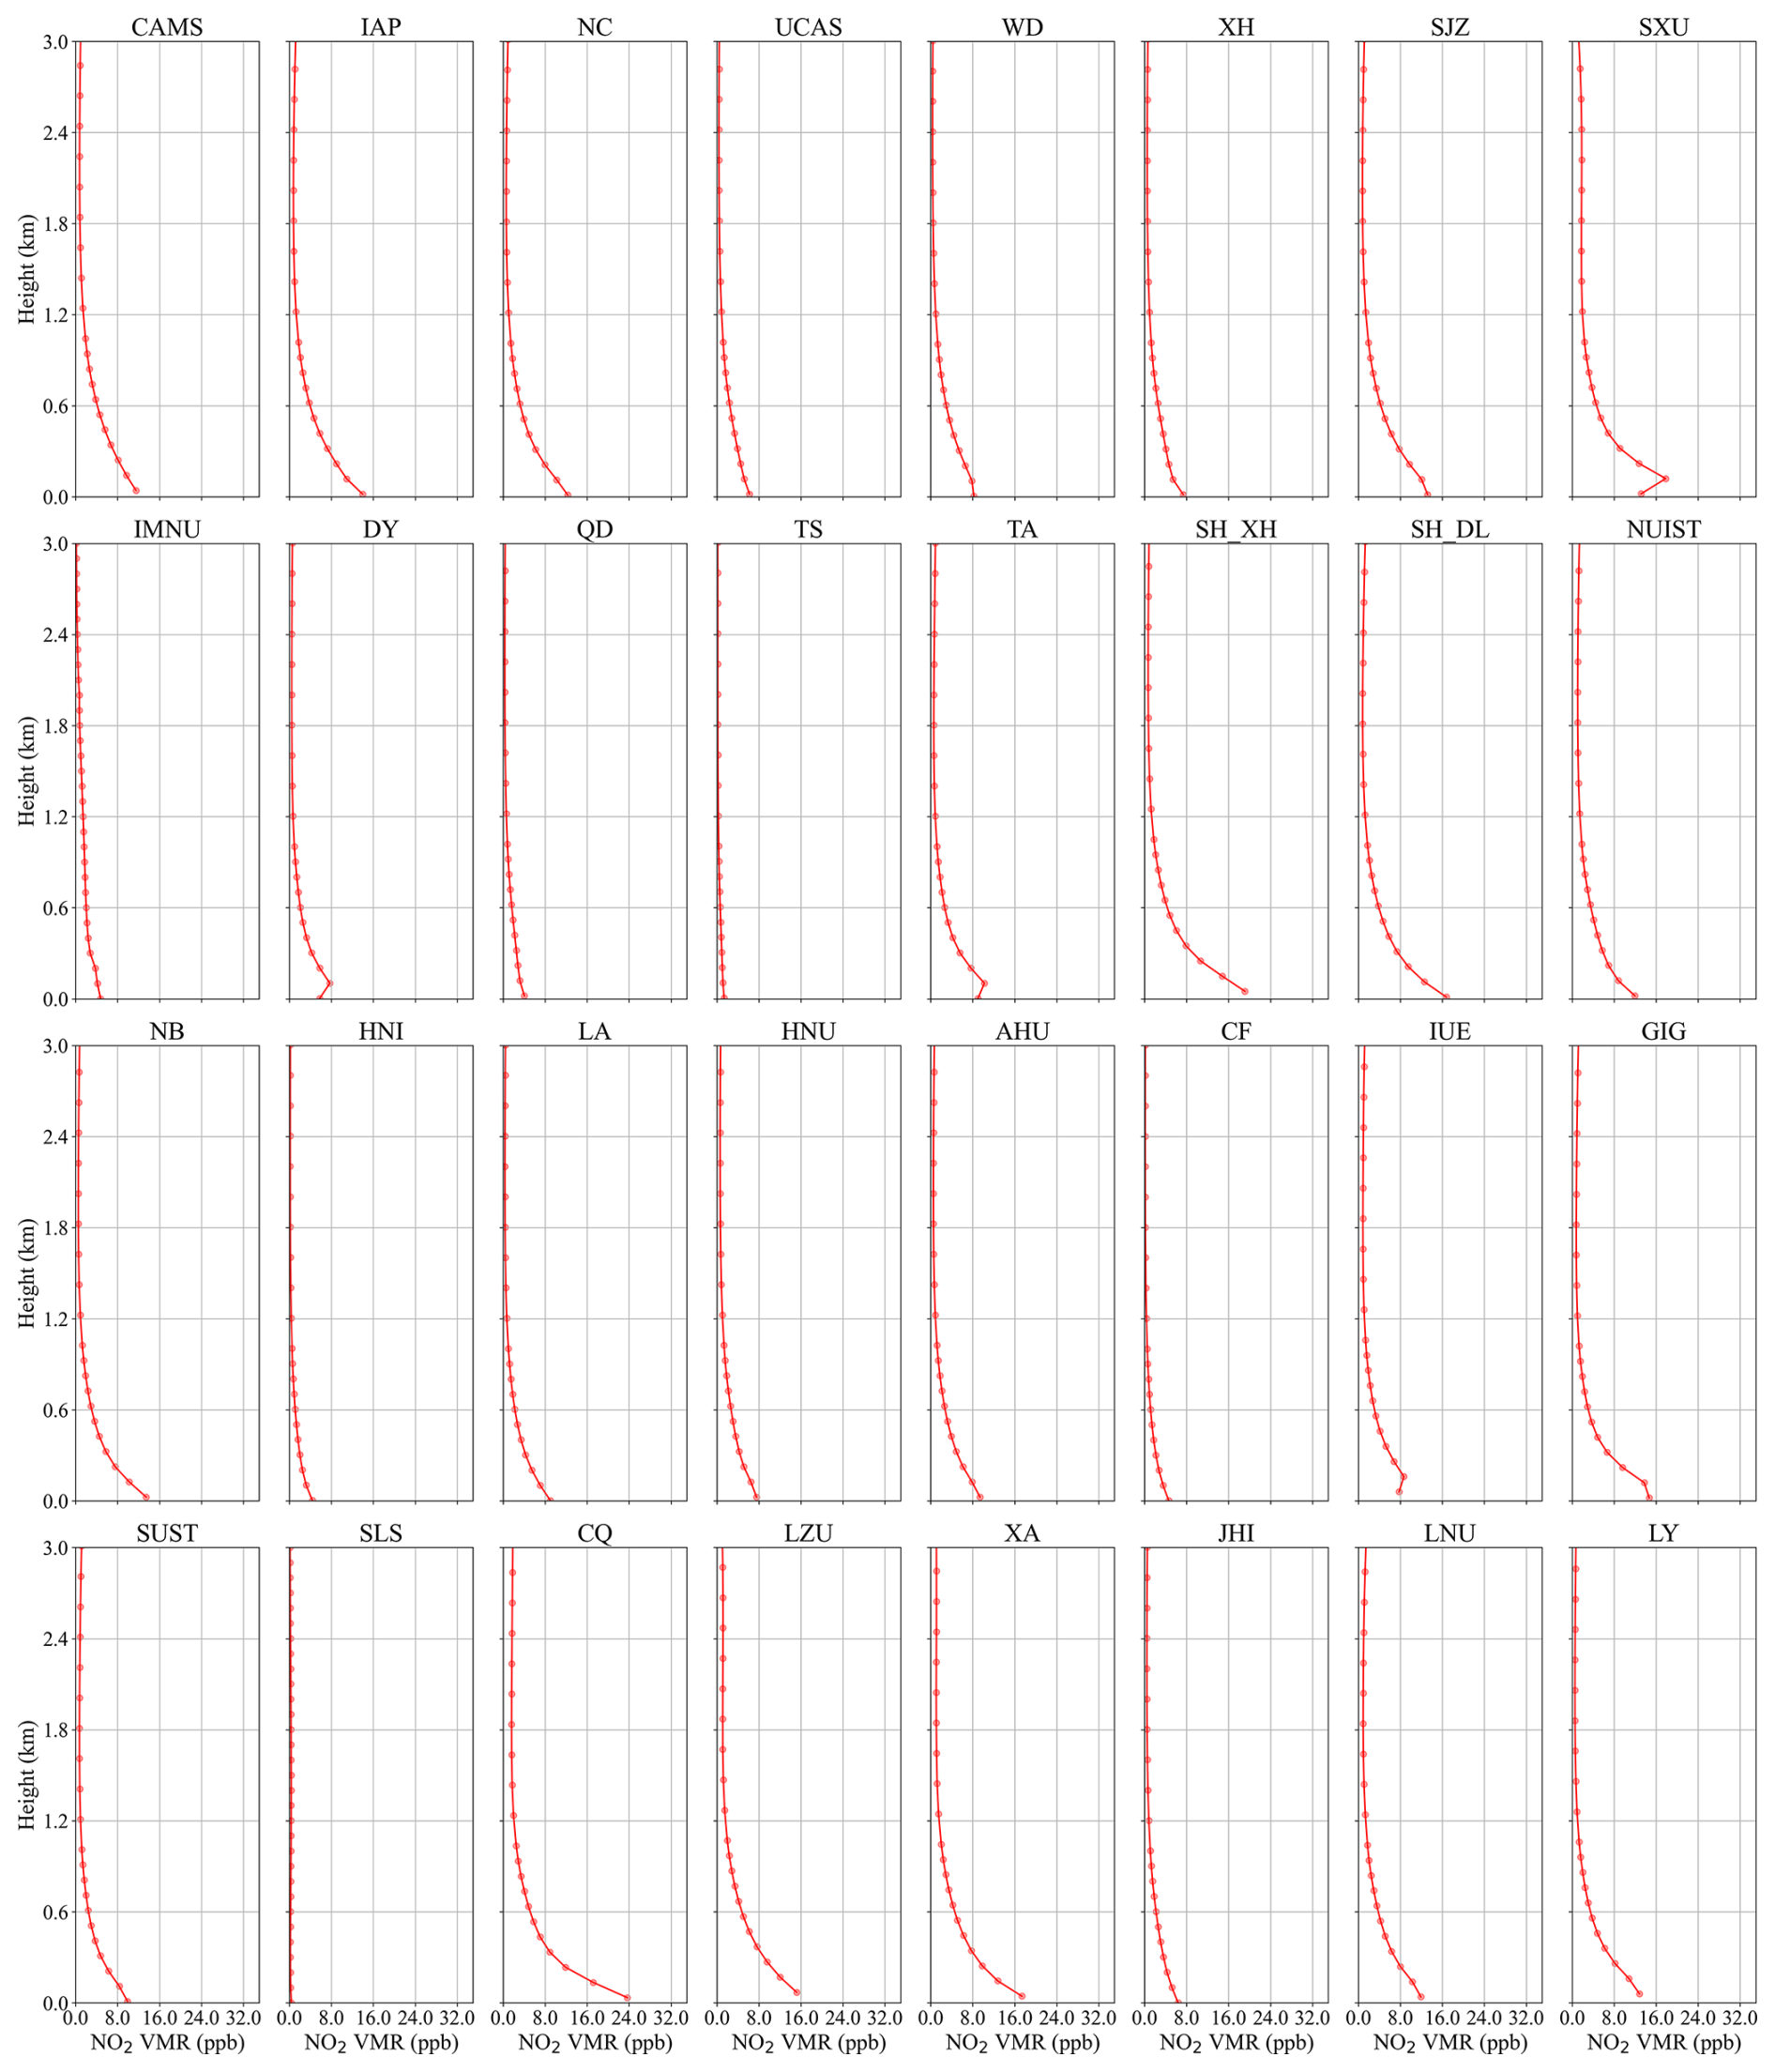
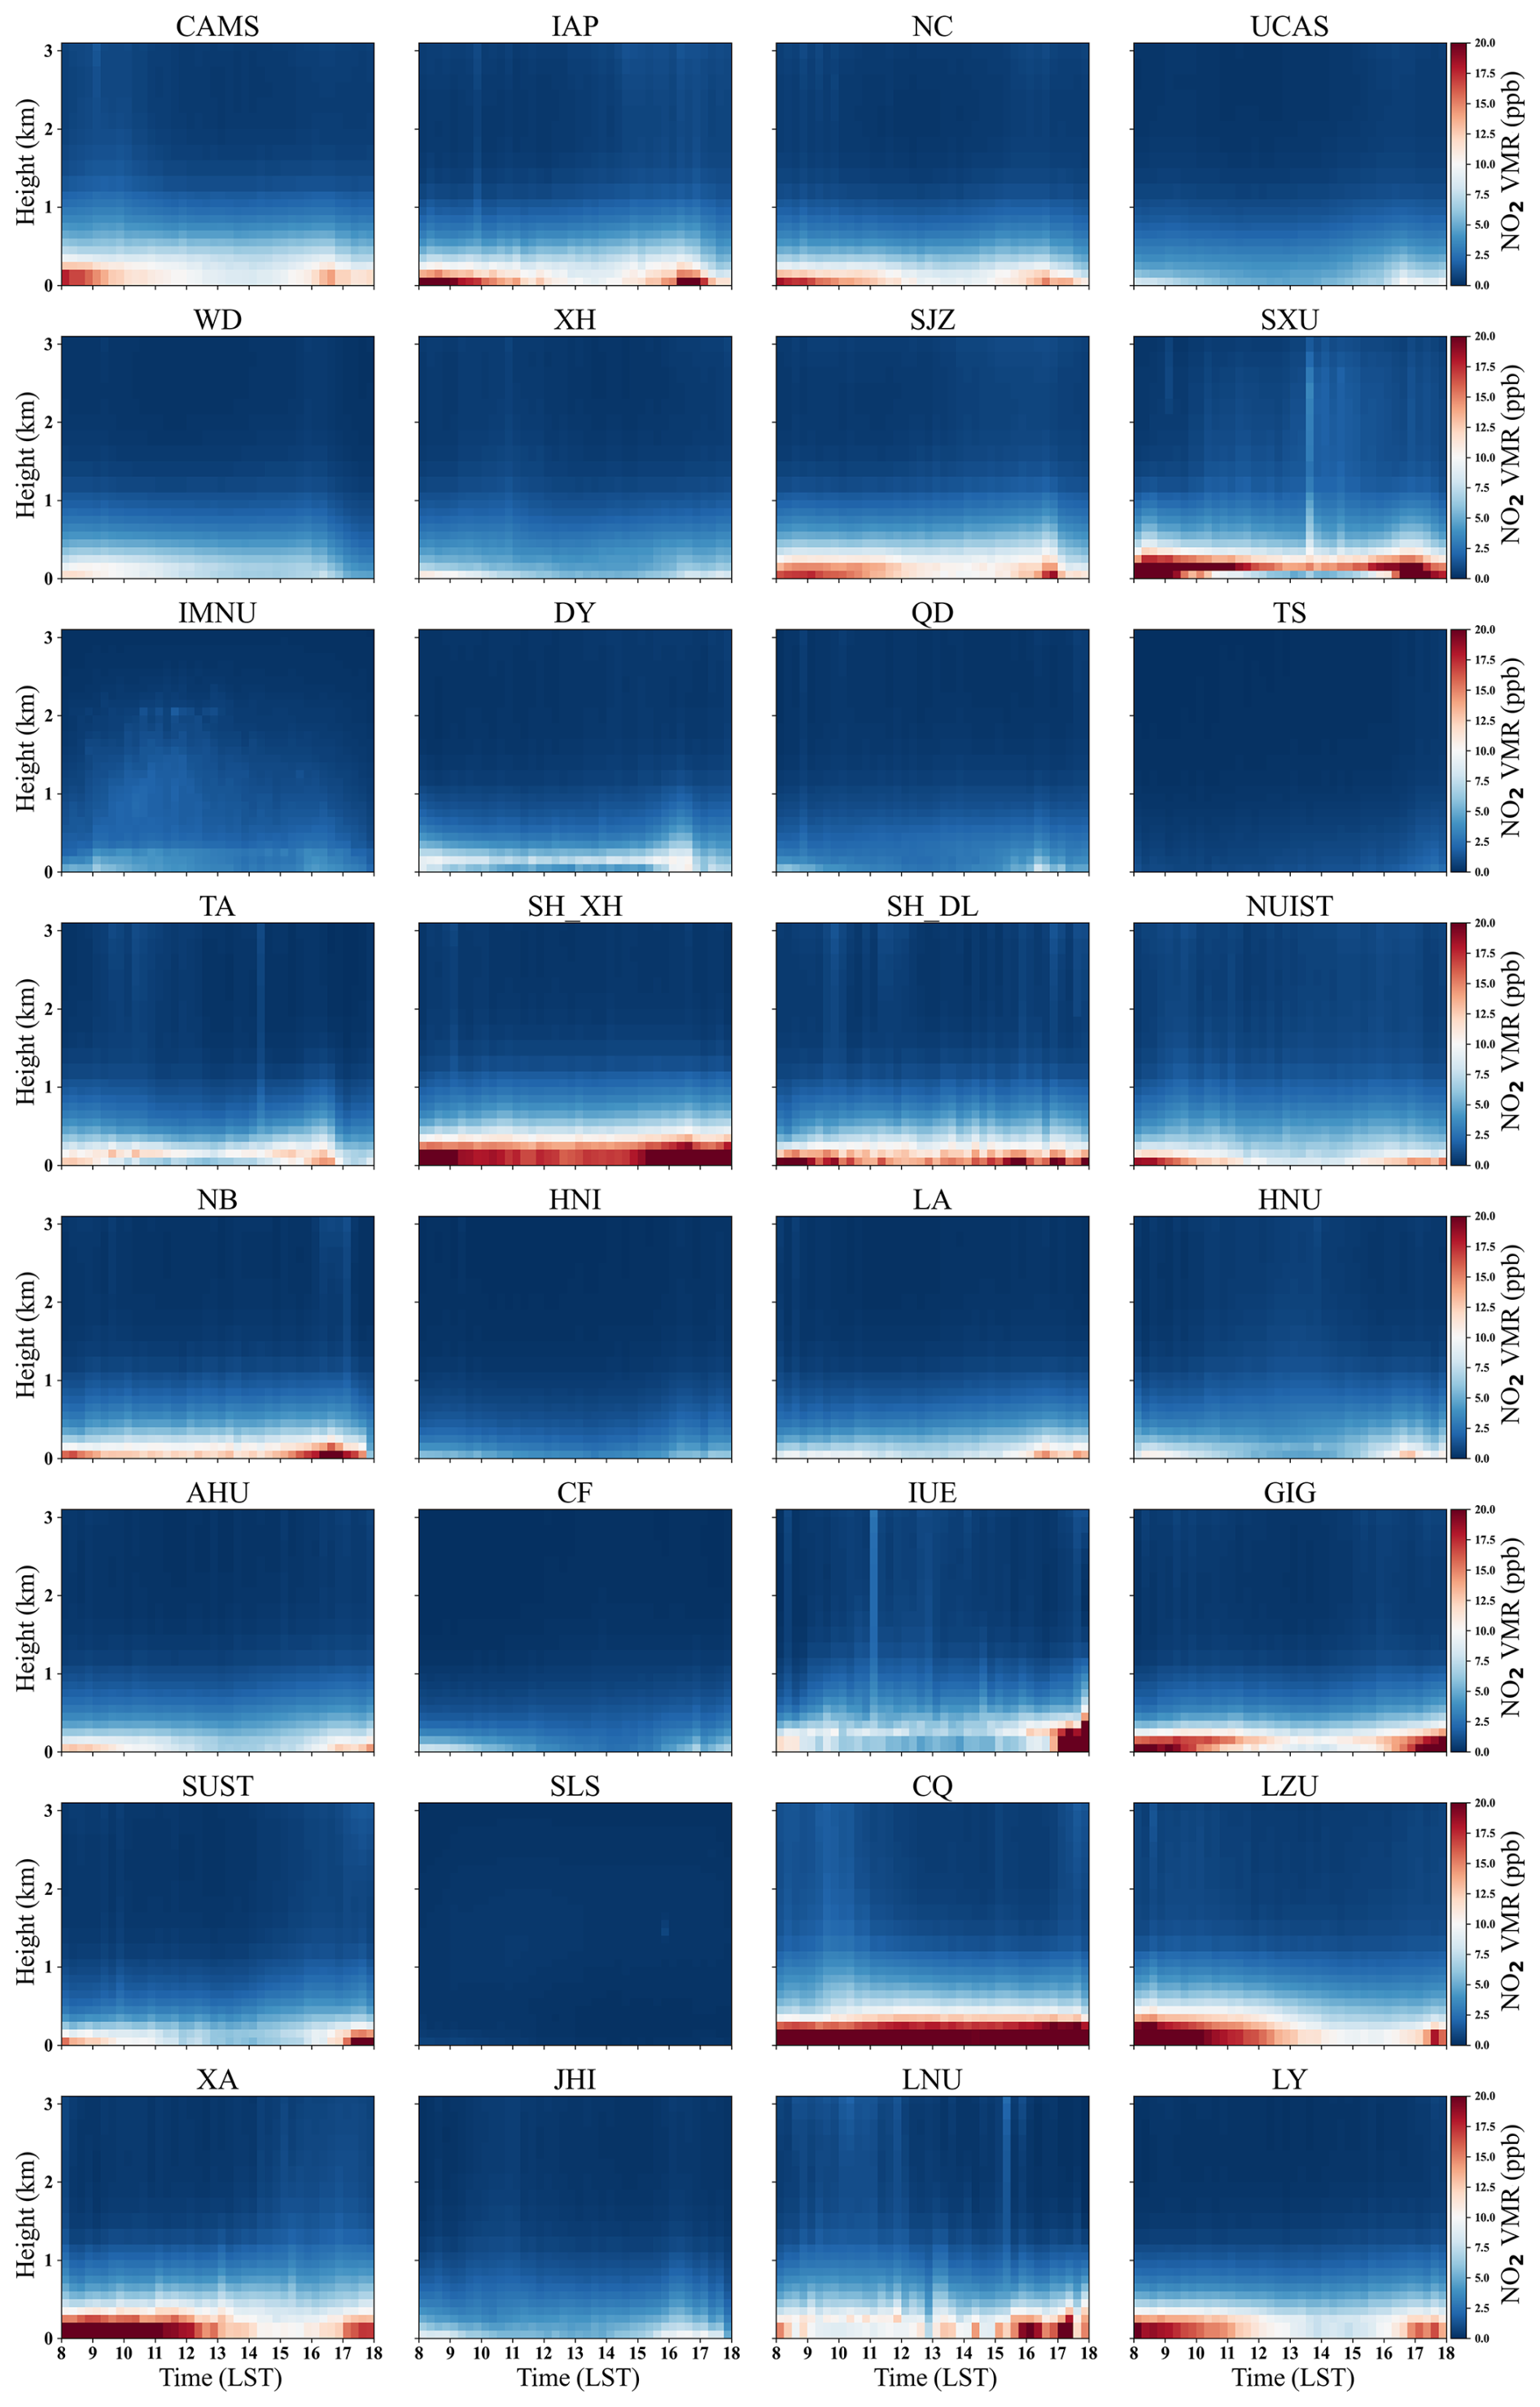
Figure 7 displays the diurnal variation of the total averaged NO2 vertical profiles. At most sites, peak NO2 concentrations occur during the morning and evening rush hours, with morning peaks generally higher than evening peaks due to nighttime emissions and accumulation (Yang et al., 2019; Wen et al., 2020; Shen et al., 2023). NO2 levels rise sharply during the morning peak from 07:00–09:00 BJT, followed by a decline in the afternoon due to enhanced photochemical reactions and vertical mixing driven by the rising boundary layer (Xie et al., 2016). In the evening, NO2 concentrations increase again as solar radiation weakens and the boundary layer contracts (Shen et al., 2023), forming a pronounced diurnal variation. Seasonal diurnal variations of vertical profiles are shown in Figures S16–S19, with NO2 concentrations exhibiting a consistent bimodal pattern across all four seasons, peaking at 08:00–10:00 BJT in the morning and 16:00–18:00 BJT in the evening.
3.3 Formaldehyde (HCHO)
HCHO is one of the most significant VOCs in the atmosphere (Lei et al., 2009) and it acts as a critical precursor driving O3 formation through atmospheric photochemical reactions (Hassan et al., 2018; Luecken et al., 2012). HCHO originates from diverse sources, including fossil fuel combustion (Ho et al., 2012; Schauer et al., 2002), biomass burning (Carlier et al., 1986; Lee et al., 1997), transportation, and industrial activities (Buzcu Guven and Olaguer, 2011). Additionally, it can form in the atmosphere through the oxidation of biogenic VOCs, further amplifying its concentration variability (Altshuller, 1993; Carter, 1995; Seinfeld et al., 1998). Figure 8 presents the total averaged vertical profiles of HCHO from 2019–2023. Similar to NO2, the vertical profiles of HCHO at some sites exhibit an exponential decay pattern, with the highest concentrations in the lower boundary layer. At certain locations, however, HCHO peaks appear at altitudes of 100–200 m. The GIG site in South China experiences elevated HCHO concentrations, driven by high temperature and humidity levels combined with intense solar radiation, which enhance the photolysis of biogenic VOCs (Cheng et al., 2014; Ho et al., 2002). Figures S20–S23 illustrate the seasonal averaged vertical profiles of HCHO. The ratios of the middle to lower boundary layer HCHO concentrations of the total, spring, summer, autumn, and winter averaged profiles are 77.33 %, 83.32 %, 76.65 %, 74.75 %, and 69.28 %, respectively. At upper layers, the ratios decrease to 54.34 %, 59.59 %, 53.23 %, 52.66 %, and 48.60 %, respectively. The near-surface HCHO concentrations during spring, summer, autumn, and winter account for 21.52 %, 35.34 %, 24.30 %, and 18.84 % of the seasonal total averages, with peak concentrations observed in summer. In North China, low temperatures and weak solar radiation in winter limit photochemical reactions, resulting in HCHO production being dominated by primary emissions (Cerón et al., 2007). The presence of temperature inversions in winter further inhibits vertical dispersion, leading to typical vertical profiles with concentrations near the surface. In contrast, summer observes enhanced solar radiation and active photochemical reactions, driving elevated HCHO concentrations (Huang et al., 2008).
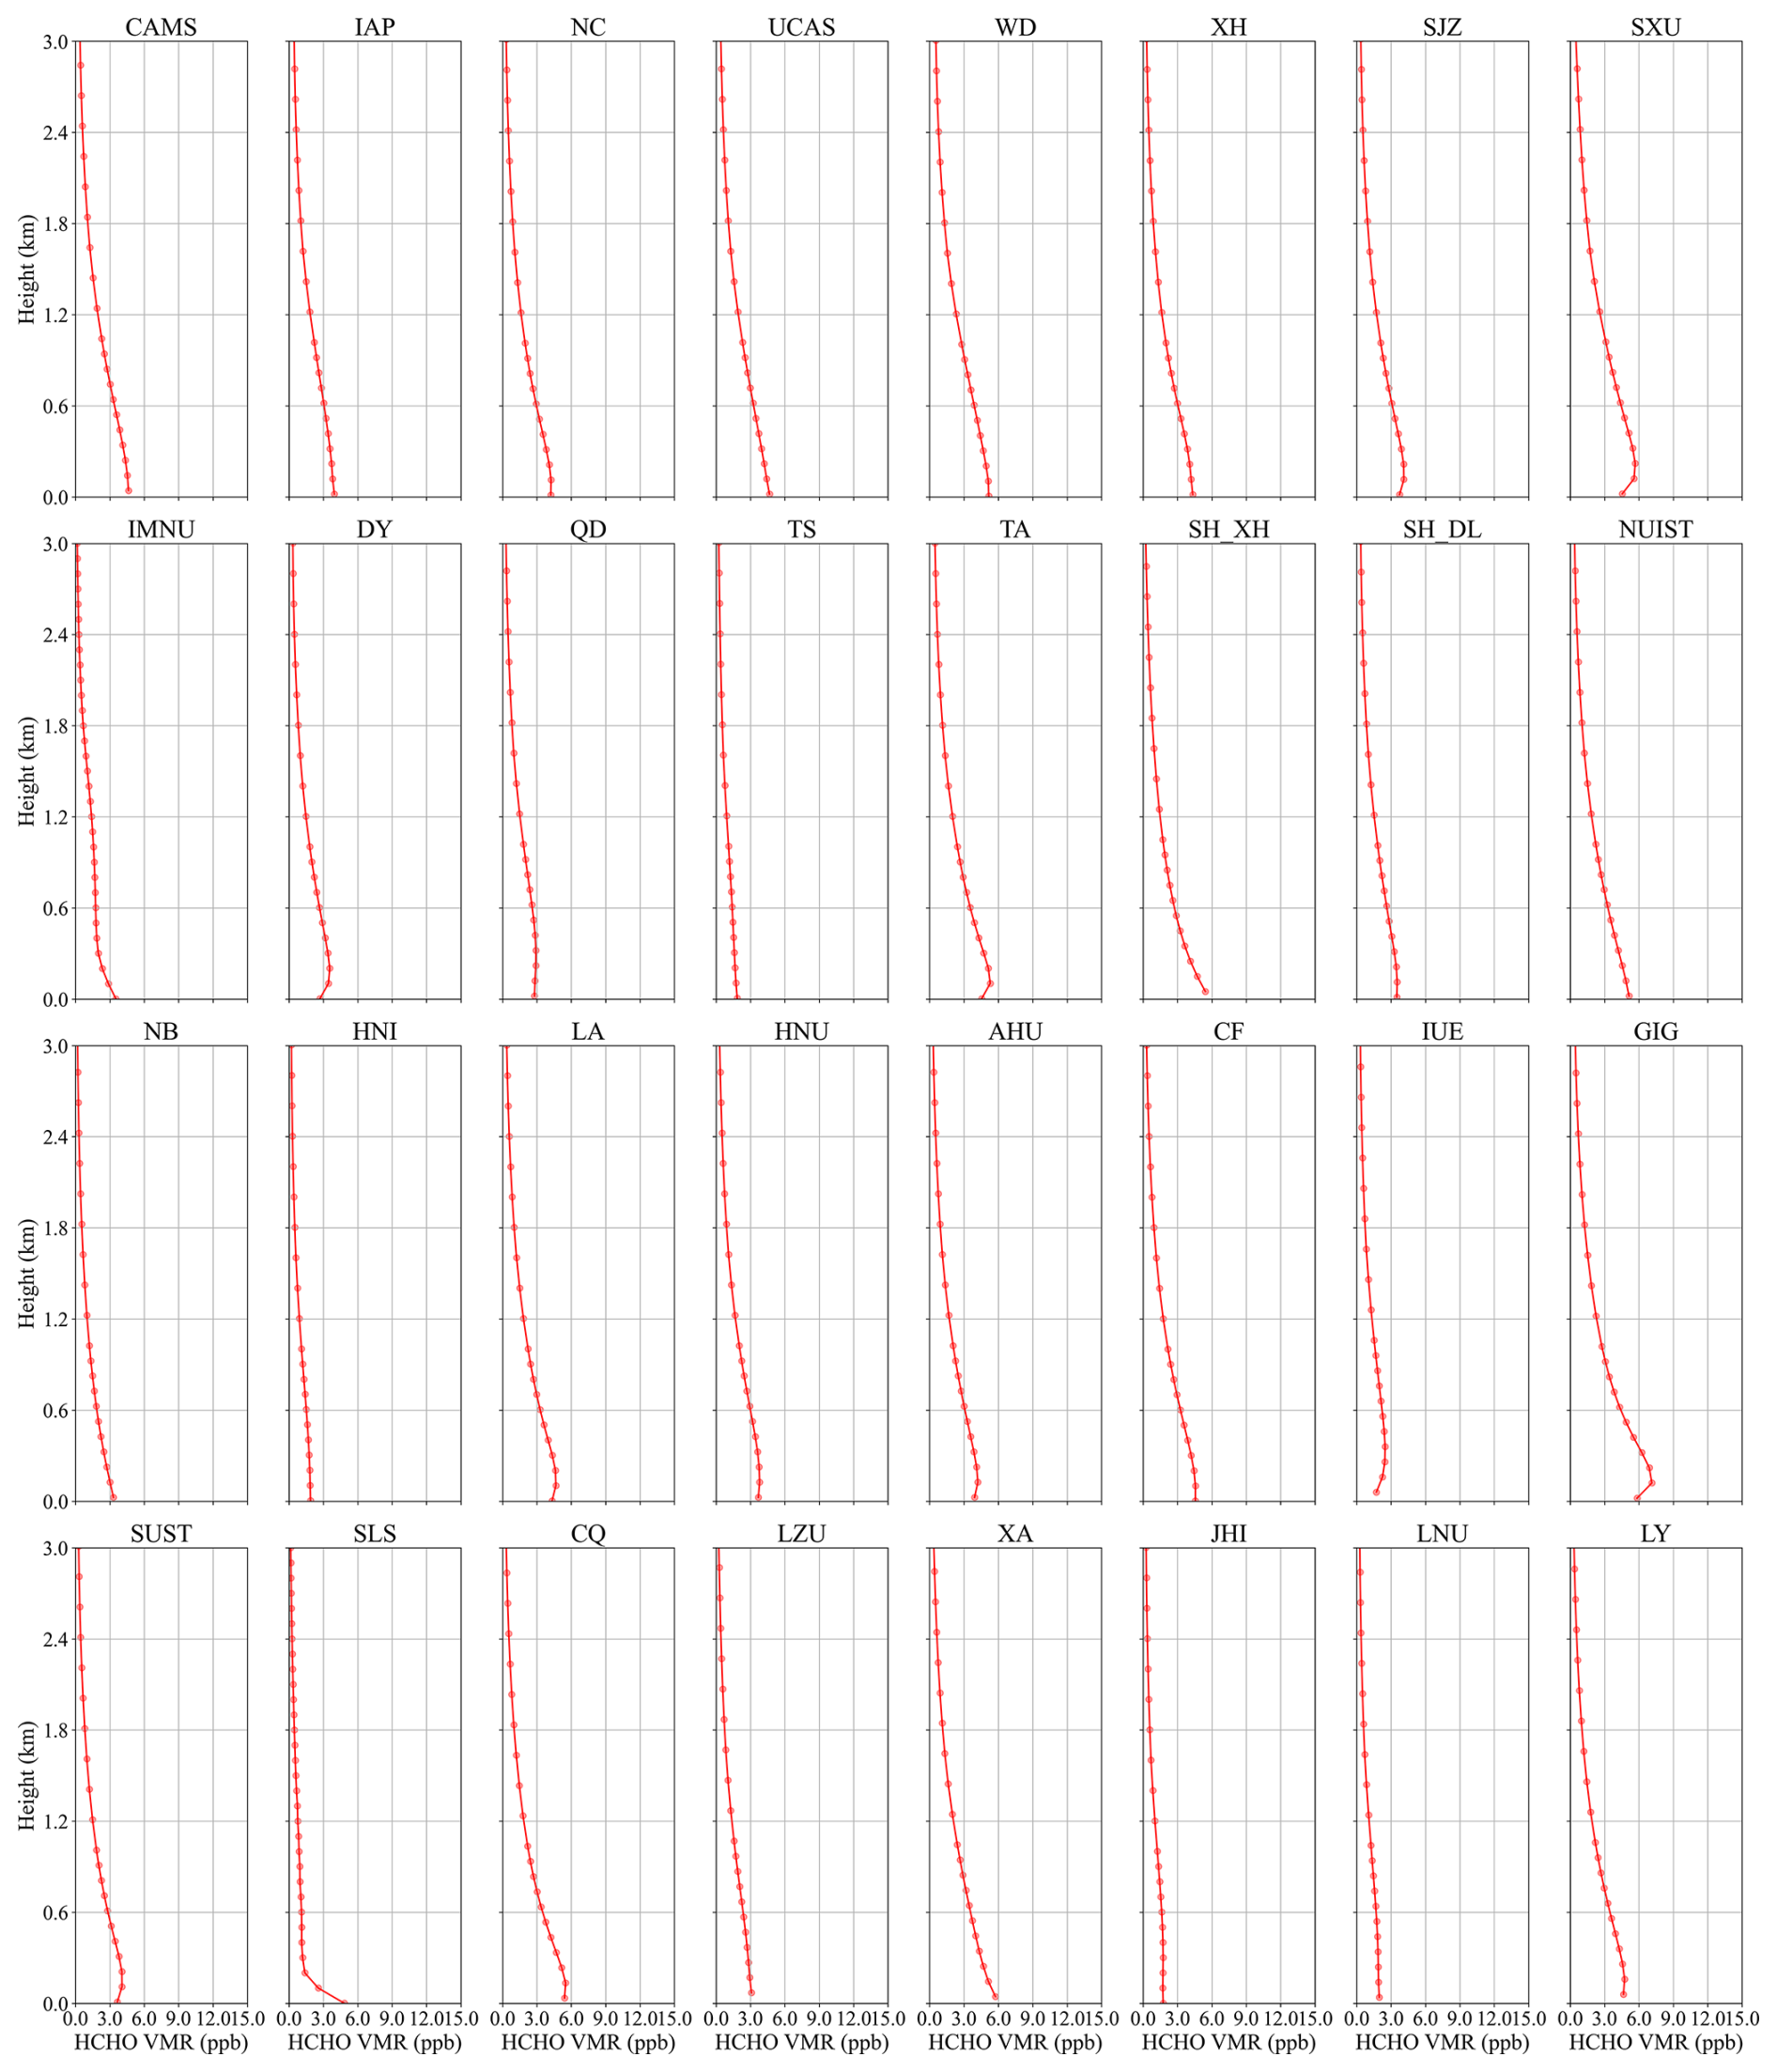
Figure 9 illustrates the diurnal variation of the total averaged HCHO vertical profiles. Starting at 08:00 BJT, HCHO concentrations increase and reach the first peak between 11:00 and 13:00 BJT. In the afternoon, the boundary layer rises and vertical mixing intensifies, leading to a decline in HCHO concentrations. From 17:00 BJT, HCHO concentrations begin to rise again, peaking at 18:00 BJT, likely due to the lowering of the boundary layer (Franco et al., 2016). At certain suburban and rural sites, high vegetation coverage leads to substantial emissions of VOCs (Cao et al., 2022), which undergo photochemical reactions to produce HCHO, resulting in its accumulation over time (Nussbaumer et al., 2021). In the evening, the weakening of HCHO photolysis reduces its consumption, combined with the decrease in the boundary layer height that limits dispersion, further enhancing the concentration peak (Biswas et al., 2020). At the SLS site, elevated HCHO levels are observed between 08:00 and 09:00 BJT. This may be attributed to strong morning solar radiation on the plateau, coupled with stable nighttime atmospheric conditions and morning inversion layers at high altitudes, which promote the accumulation of HCHO and its precursors near the surface and initiate early photochemical reactions, resulting in a concentration peak. Figures S24–S27 present the seasonal averaged diurnal variation of HCHO vertical profiles. During summer, most sites exhibit Gaussian-shaped diurnal profiles, with concentrations peaking in the high noon, driven by active photochemical reactions under intense solar radiation (Hong et al., 2021; Gao et al., 2023). In winter, some sites show elevated HCHO concentrations in the morning, likely due to the accumulation of HCHO precursors near the surface under temperature inversion conditions. Upon exposure to solar radiation, rapid photochemical reactions lead to a sharp increase in HCHO concentrations (Wei et al., 2023).
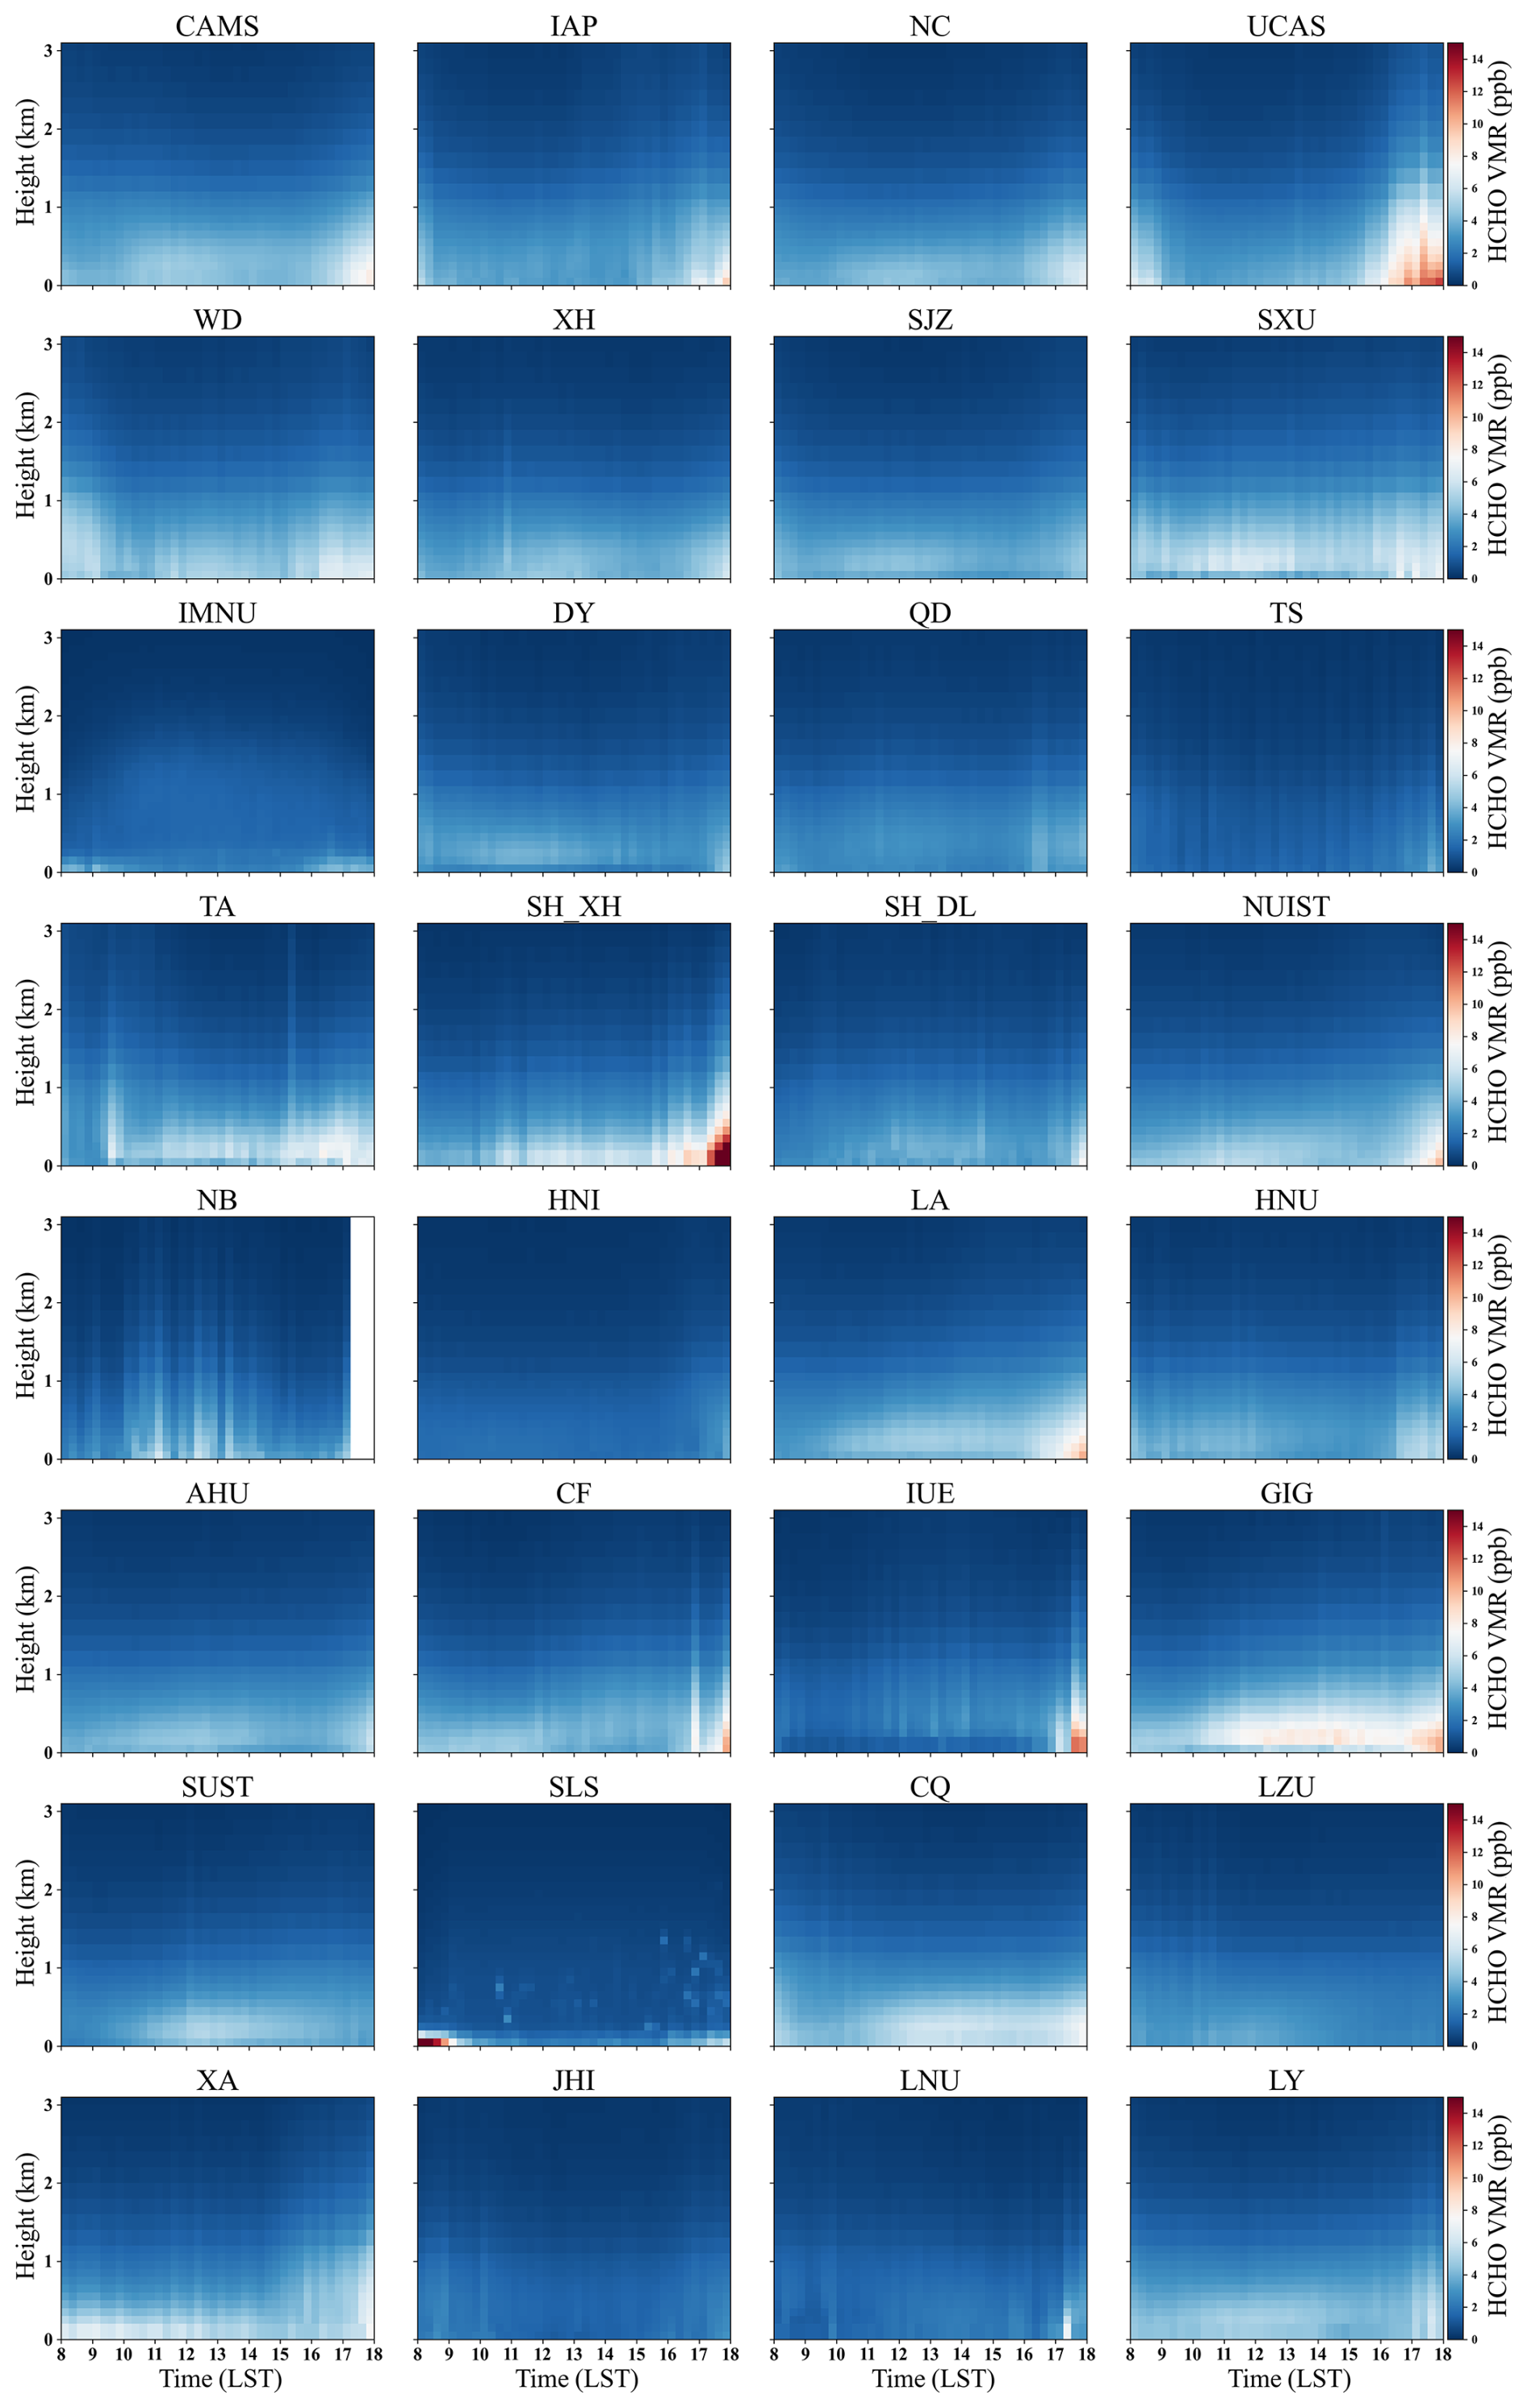
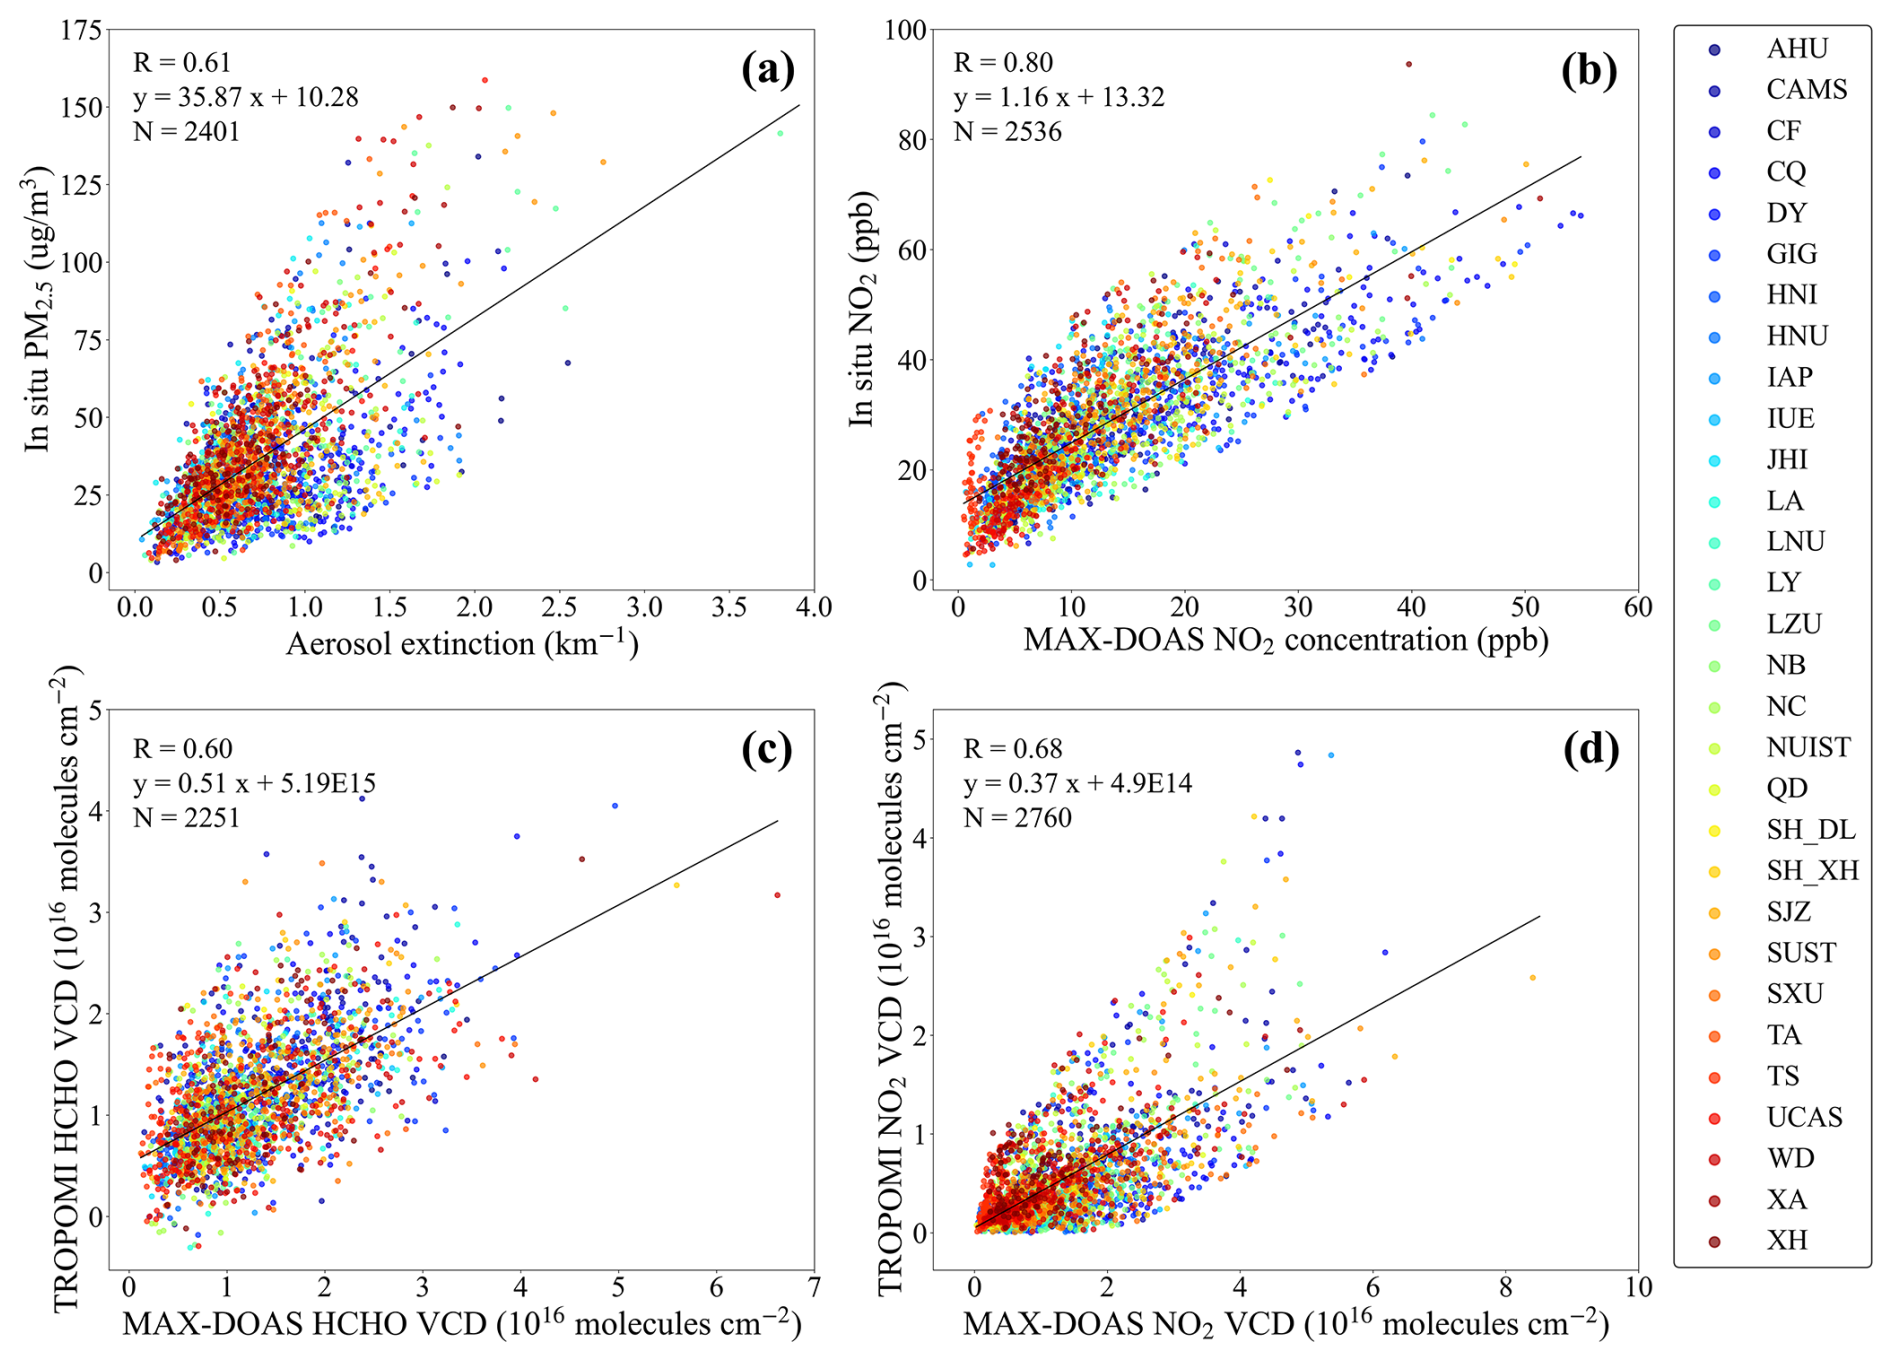
Figure 10Correlation analysis (a) of PM2.5 measured by CNEMC and surface AEC (0–100 m) measured by MAX-DOAS, (b) of NO2 concentration measured by CNEMC and MAX-DOAS, (c) of the tropospheric HCHO VCD measured by TROPOMI and MAX-DOAS, and (d) of the tropospheric NO2 VCD measured by TROPOMI and MAX-DOAS.
3.4 Validations
This study employs two methods to validate the dataset. The first method involves comparing surface AECs and NO2 concentrations measured at the hyperspectral sites with ground-based data from the CNEMC stations for the period 2019–2023. We calculate the distances between each hyperspectral site and nearby CNEMC station, excluding sites based on the O4 effective optical path thresholds (Song et al., 2023). The relevant distances are listed in Table S4. As shown in Figure 10a and b, there is a strong correlation between NO2 concentrations from the hyperspectral sites and CNEMC measurements, with a Pearson correlation coefficient (R) of 0.71. The correlation between PM2.5 concentrations and AEC is 0.53, which is influenced by the relative humidity. Figures S28 and S29 show the individual correlations of aerosol and NO2 between each hyperspectral site and CNEMC station. For sites in regions such as North China and Northwest China, where the air humidity is relatively low, the correlation between PM2.5 concentrations and AEC is generally stronger than that observed at sites in the southwest, coastal, or lakeside areas. The second validation method uses TROPOMI satellite data, comparing the VCD of HCHO and NO2 from the hyperspectral sites with the corresponding measurements from TROPOMI. The data from the hyperspectral sites are averaged within a 30 min window (from 13:30–14:00 BJT) around the satellite overpass time. TROPOMI data are spatially averaged within a 7 km×7 km grid centered on the hyperspectral site, as TROPOMI has a spatial resolution of 7 km×7 km. The linear relationships between hyperspectral sites and TROPOMI measurements are shown in Figure 10c and d. A strong correlation was found between hyperspectral sites and TROPOMI observations, with R of 0.68 and 0.60 for NO2 and HCHO, respectively. Figures S30 and S31 show the individual correlations of HCHO and NO2 between each site and TROPOMI.
The vertical profiles of atmospheric composition over the major regions of China presented here are available in .xlsx format at Zenodo (https://doi.org/10.5281/zenodo.15211604; Jiao et al., 2024).
High-temporal-resolution monitoring and analysis methods that include vertical profiles and VOC gases are currently scarce but critically important. This study provides a dataset of high-resolution vertical profiles of aerosol, NO2, and HCHO, observed over periods ranging from 5 months to 5 years at 32 sites across China between 2019 and 2023. The dataset captures the vertical distribution, diurnal pattern, and seasonal variations of these compositions. It has been validated against TROPOMI satellite observations and ground-based CNEMC measurements, showing good correlations. The results highlight the spatial and temporal complexities of these atmospheric compositions, with the following key findings: (1) AOD levels are generally higher in East China, South China, and Southwest China compared to North China and Northwest China, exhibiting a south-high-north-low and east-high-west-low distribution. The vertical profile of AEC decreases with the altitude, with near-surface AEC showing significant seasonal variation influenced by human activities (e.g., winter heating) and meteorological conditions, peaking prominently in winter. (2) In northern regions, NO2 concentrations exhibit a wintertime emission peak, while southern regions demonstrate stronger cleaning and dispersion capacity in summer. Diurnal patterns show significant influence from traffic emissions during the morning and evening rush hours. (3) HCHO concentrations are strongly affected by photochemical reactions, peaking during summer and around noon. In humid and warm regions such as South China and Southwest China, a secondary concentration peak around 200 m altitude is observed.
The dataset has the following limitations: (1) Under conditions such as heavy fog or extensive cloud cover, the MAX-DOAS instrument is affected by photon scattering noise and reduced spectral signal intensity, which typically increase retrieval errors. To ensure data reliability, retrievals with relative errors exceeding 50 % are excluded from the dataset. (2) MAX-DOAS operates using passive sunlight scattering, which limits retrievals of aerosol, NO2, and HCHO vertical profiles to daytime observations. To avoid interference from strong stratospheric absorption, spectral data collected when the solar zenith angle exceeds 75° are filtered out. (3) Due to hardware and algorithmic limitations, the current maximum vertical resolution is 100 m. While this represents a significant advancement, further improvements are needed in the future. (4) In regions such as Central China and Southwest China, the number of monitoring sites is relatively limited. This uneven distribution may potentially affect the representativeness of the results for these areas. Despite these limitations, the dataset provides higher temporal resolution and broader temporal coverage, addressing critical gaps in vertical profiling. It helps mitigate the underestimation of near-surface concentrations in satellite retrievals and reduces uncertainties in the vertical direction for CTMs and RCMs. Potential applications of this dataset include the following: (1) As a valuable complement to national monitoring efforts, the dataset offers detailed regional atmospheric composition data, providing scientific support for governmental and research institutions in air pollution control and policymaking. (2) By leveraging high-resolution data, the dataset facilitates source apportionment analyses for aerosol, NO2, and HCHO, revealing inter-regional interactions and pollutant transport pathways. (3) The long-term monitoring data can inform RCMs, improving the assessment of climate change impacts and enabling more robust evaluations of mitigation and adaptation strategies.
The supplement related to this article is available online at https://doi.org/10.5194/essd-17-3167-2025-supplement.
All authors contributed to the generation of the dataset described in this paper. PJ, CX, and CL wrote the manuscript, while all other authors participated in its revision.
The contact author has declared that none of the authors has any competing interests.
Publisher's note: Copernicus Publications remains neutral with regard to jurisdictional claims made in the text, published maps, institutional affiliations, or any other geographical representation in this paper. While Copernicus Publications makes every effort to include appropriate place names, the final responsibility lies with the authors.
This research is supported by the National Key Research and Development Program of China (grant no. 2023YFC3705300), the National Natural Science Foundation of China (grant nos. 42225504, U21A2027), and the President's Foundation of Hefei Institutes of Physical Science, Chinese Academy of Sciences (grant nos. BJPY2024B09, YZJJQY202401).
This paper was edited by Jing Wei and reviewed by three anonymous referees.
Aliwell, S. R., Van Roozendael, M., Johnston, P. V., Richter, A., Wagner, T., Arlander, D. W., Burrows, J. P., Fish, D. J., Jones, R. L., Tørnkvist, K. K., Lambert, J.-C., Pfeilsticker, K., and Pundt, I.: Analysis for BrO in zenith-sky spectra: An intercomparison exercise for analysis improvement, J. Geophys. Res.-Atmos., 107, ACH10-1–ACH10-20, https://doi.org/10.1029/2001JD000329, 2002.
Altshuller, A. P.: Production of aldehydes as primary emissions and from secondary atmospheric reactions of alkenes and alkanes during the night and early morning hours, Atmos. Environ. A-Gen., 27, 21–32, https://doi.org/10.1016/0960-1686(93)90067-9, 1993.
Bai, K., Li, K., Guo, J., Cheng, W., and Xu, X.: Do More Frequent Temperature Inversions Aggravate Haze Pollution in China?, Geophys. Res. Lett., 49, e2021GL096458, https://doi.org/10.1029/2021GL096458, 2022.
Biswas, M. S., Pandithurai, G., Aslam, M. Y., Patil, R. D., Anilkumar, V., Dudhambe, S. D., Lerot, C., De Smedt, I., Van Roozendael, M., and Mahajan, A. S.: Effect of Boundary Layer Evolution on Nitrogen Dioxide (NO2) and Formaldehyde (HCHO) Concentrations at a High-altitude Observatory in Western India, Aerosol Air Qual. Res., 21, 200193, https://doi.org/10.4209/aaqr.2020.05.0193, 2020.
Buzcu Guven, B. and Olaguer, E. P.: Ambient formaldehyde source attribution in Houston during TexAQS II and TRAMP, Atmos. Environ., 45, 4272–4280, https://doi.org/10.1016/j.atmosenv.2011.04.079, 2011.
Cai, H., Nan, Y., Zhao, Y., Jiao, W., and Pan, K.: Impacts of winter heating on the atmospheric pollution of northern China's prefectural cities: Evidence from a regression discontinuity design, Ecol. Indic., 118, 106709, https://doi.org/10.1016/j.ecolind.2020.106709, 2020.
Cao, J., Situ, S., Hao, Y., Xie, S., and Li, L.: Enhanced summertime ozone and SOA from biogenic volatile organic compound (BVOC) emissions due to vegetation biomass variability during 1981–2018 in China, Atmos. Chem. Phys., 22, 2351–2364, https://doi.org/10.5194/acp-22-2351-2022, 2022.
Carlier, P., Hannachi, H., and Mouvier, G.: The chemistry of carbonyl compounds in the atmosphere – A review, Atmos. Environ., 20, 2079–2099, https://doi.org/10.1016/0004-6981(86)90304-5, 1986.
Carter, W. P. L.: Computer modeling of environmental chamber measurements of maximum incremental reactivities of volatile organic compounds, Atmos. Environ., 29, 2513–2527, https://doi.org/10.1016/1352-2310(95)00150-W, 1995.
Cerón, R. M., Cerón, J. G., and Muriel, M.: Diurnal and seasonal trends in carbonyl levels in a semi-urban coastal site in the Gulf of Campeche, Mexico, Atmos. Environ., 41, 63–71, https://doi.org/10.1016/j.atmosenv.2006.08.008, 2007.
Chan, K. L., Valks, P., Heue, K.-P., Lutz, R., Hedelt, P., Loyola, D., Pinardi, G., Van Roozendael, M., Hendrick, F., Wagner, T., Kumar, V., Bais, A., Piters, A., Irie, H., Takashima, H., Kanaya, Y., Choi, Y., Park, K., Chong, J., Cede, A., Frieß, U., Richter, A., Ma, J., Benavent, N., Holla, R., Postylyakov, O., Rivera Cárdenas, C., and Wenig, M.: Global Ozone Monitoring Experiment-2 (GOME-2) daily and monthly level-3 products of atmospheric trace gas columns, Earth Syst. Sci. Data, 15, 1831–1870, https://doi.org/10.5194/essd-15-1831-2023, 2023.
Chang, S.-C. and Lee, C.-T.: Secondary aerosol formation through photochemical reactions estimated by using air quality monitoring data in Taipei City from 1994–2003, Atmos. Environ., 41, 4002–4017, https://doi.org/10.1016/j.atmosenv.2007.01.040, 2007.
Cheng, Y., Lee, S. C., Huang, Y., Ho, K. F., Ho, S. S. H., Yau, P. S., Louie, P. K. K., and Zhang, R. J.: Diurnal and seasonal trends of carbonyl compounds in roadside, urban, and suburban environment of Hong Kong, Atmos. Environ., 89, 43–51, https://doi.org/10.1016/j.atmosenv.2014.02.014, 2014.
Cheng, Y., Chen, L., Wu, H., Liu, J., Ren, J., and Zhang, F.: Wintertime fine aerosol particles composition and its evolution in two megacities of southern and northern China, Sci. Total Environ., 914, 169778, https://doi.org/10.1016/j.scitotenv.2023.169778, 2024.
Fan, H., Zhao, C., and Yang, Y.: A comprehensive analysis of the spatio-temporal variation of urban air pollution in China during 2014–2018, Atmos. Environ., 220, 117066, https://doi.org/10.1016/j.atmosenv.2019.117066, 2020.
Feng, Y., Ning, M., Lei, Y., Sun, Y., Liu, W., and Wang, J.: Defending blue sky in China: Effectiveness of the “Air Pollution Prevention and Control Action Plan” on air quality improvements from 2013–2017, J. Environ. Manage., 252, 109603, https://doi.org/10.1016/j.jenvman.2019.109603, 2019.
Filonchyk, M., Yan, H., and Li, X.: Temporal and spatial variation of particulate matter and its correlation with other criteria of air pollutants in Lanzhou, China, in spring-summer periods, Atmos. Pollut. Res., 9, 1100–1110, https://doi.org/10.1016/j.apr.2018.04.011, 2018.
Filonchyk, M., Yan, H., Zhang, Z., Yang, S., Li, W., and Li, Y.: Combined use of satellite and surface observations to study aerosol optical depth in different regions of China, Sci. Rep., 9, 6174, https://doi.org/10.1038/s41598-019-42466-6, 2019.
Fleischmann, O. C., Hartmann, M., Burrows, J. P., and Orphal, J.: New ultraviolet absorption cross-sections of BrO at atmospheric temperatures measured by time-windowing Fourier transform spectroscopy, J. Photoch. Photobio. A, 168, 117–132, https://doi.org/10.1016/j.jphotochem.2004.03.026, 2004.
Franco, B., Marais, E. A., Bovy, B., Bader, W., Lejeune, B., Roland, G., Servais, C., and Mahieu, E.: Diurnal cycle and multi-decadal trend of formaldehyde in the remote atmosphere near 46° N, Atmos. Chem. Phys., 16, 4171–4189, https://doi.org/10.5194/acp-16-4171-2016, 2016.
Gao, Y., Pan, H., Cao, L., Lu, C., Yang, Q., Lu, X., Ding, H., Li, S., and Zhao, T.: Effects of anthropogenic emissions and meteorological conditions on diurnal variation of formaldehyde (HCHO) in the Yangtze River Delta, China, Atmos. Pollut. Res., 14, 101779, https://doi.org/10.1016/j.apr.2023.101779, 2023.
Gu, J., Zhang, Y., Yang, N., and Wang, R.: Diurnal variability of the planetary boundary layer height estimated from radiosonde data, Earth Planet Phys., 4, 479–492, https://doi.org/10.26464/epp2020042, 2020.
Gui, K., Yao, W., Che, H., An, L., Zheng, Y., Li, L., Zhao, H., Zhang, L., Zhong, J., Wang, Y., and Zhang, X.: Record-breaking dust loading during two mega dust storm events over northern China in March 2021: aerosol optical and radiative properties and meteorological drivers, Atmos. Chem. Phys., 22, 7905–7932, https://doi.org/10.5194/acp-22-7905-2022, 2022.
Guo, J., Miao, Y., Zhang, Y., Liu, H., Li, Z., Zhang, W., He, J., Lou, M., Yan, Y., Bian, L., and Zhai, P.: The climatology of planetary boundary layer height in China derived from radiosonde and reanalysis data, Atmos. Chem. Phys., 16, 13309–13319, https://doi.org/10.5194/acp-16-13309-2016, 2016.
Harkey, M., Holloway, T., Oberman, J., and Scotty, E.: An evaluation of CMAQ NO2 using observed chemistry-meteorology correlations, J. Geophys. Res.-Atmos., 120, 11775-11797, https://doi.org/10.1002/2015JD023316, 2015.
Hassan, S. K., El-Abssawy, A. A., and Khoder, M. I.: Effect of Seasonal Variation on the Levels and Behaviours of Formaldehyde in the Atmosphere of a Suburban Area in Cairo, Egypt, Asian J. Atmos. Environ., 12, 356–368, https://doi.org/10.5572/ajae.2018.12.4.356, 2018.
He, C., Liu, J., Zhou, Y., Zhou, J., Zhang, L., Wang, Y., Liu, L., and Peng, S.: Synergistic PM2.5 and O3 control to address the emerging global PM2.5–O3 compound pollution challenges, Eco-Environ. Health, 3, 325–337, https://doi.org/10.1016/j.eehl.2024.04.004, 2024.
He, T., Tang, Y., Cao, R., Xia, N., Li, B., and Du, E.: Distinct urban–rural gradients of air NO2 and SO2 concentrations in response to emission reductions during 2015–2022 in Beijing, China, Environ. Pollut., 333, 122021, https://doi.org/10.1016/j.envpol.2023.122021, 2023.
Ho, K. F., Lee, S. C., Louie, P. K. K., and Zou, S. C.: Seasonal variation of carbonyl compound concentrations in urban area of Hong Kong, Atmos. Environ., 36, 1259–1265, https://doi.org/10.1016/S1352-2310(01)00570-2, 2002.
Ho, S. S. H., Ho, K. F., Lee, S. C., Cheng, Y., Yu, J. Z., Lam, K. M., Feng, N. S. Y., and Huang, Y.: Carbonyl emissions from vehicular exhausts sources in Hong Kong, J. Air Waste Manag., 62, 221–234, https://doi.org/10.1080/10473289.2011.642952, 2012.
Holben, B. N., Eck, T. F., Slutsker, I., Tanré, D., Buis, J. P., Setzer, A., Vermote, E., Reagan, J. A., Kaufman, Y. J., Nakajima, T., Lavenu, F., Jankowiak, I., and Smirnov, A.: AERONET – A Federated Instrument Network and Data Archive for Aerosol Characterization, Remote Sens. Environ., 66, 1–16, https://doi.org/10.1016/S0034-4257(98)00031-5, 1998.
Hong, Q., Liu, C., Hu, Q., Zhang, Y., Xing, C., Su, W., Ji, X., and Xiao, S.: Evaluating the feasibility of formaldehyde derived from hyperspectral remote sensing as a proxy for volatile organic compounds, Atmos. Res., 264, 105777, https://doi.org/10.1016/j.atmosres.2021.105777, 2021.
Huang, J., Minnis, P., Yi, Y., Tang, Q., Wang, X., Hu, Y., Liu, Z., Ayers, K., Trepte, C., and Winker, D.: Summer dust aerosols detected from CALIPSO over the Tibetan Plateau, Geophys. Res. Lett., 34, L18805, https://doi.org/10.1029/2007GL029938, 2007.
Huang, J., Feng, Y., Li, J., Xiong, B., Feng, J., Wen, S., Sheng, G., Fu, J., and Wu, M.: Characteristics of carbonyl compounds in ambient air of Shanghai, China, J. Atmos. Chem., 61, 1–20, https://doi.org/10.1007/s10874-009-9121-x, 2008.
Huang, M., Crawford, J. H., Diskin, G. S., Santanello, J. A., Kumar, S. V., Pusede, S. E., Parrington, M., and Carmichael, G. R.: Modeling Regional Pollution Transport Events During KORUS-AQ: Progress and Challenges in Improving Representation of Land–Atmosphere Feedbacks, J. Geophys. Res.-Atmos., 123, 10732–10756, https://doi.org/10.1029/2018JD028554, 2018a.
Huang, X., Zhou, L., Ding, A., Qi, X., Nie, W., Wang, M., Chi, X., Petäjä, T., Kerminen, V.-M., Roldin, P., Rusanen, A., Kulmala, M., and Boy, M.: Comprehensive modelling study on observed new particle formation at the SORPES station in Nanjing, China, Atmos. Chem. Phys., 16, 2477–2492, https://doi.org/10.5194/acp-16-2477-2016, 2016.
Huang, X., Wang, Z., and Ding, A.: Impact of Aerosol-PBL Interaction on Haze Pollution: Multiyear Observational Evidences in North China, Geophys. Res. Lett., 45, 8596–8603, https://doi.org/10.1029/2018GL079239, 2018b.
Huang, X., Wang, Y., Shang, Y., Song, X., Zhang, R., Wang, Y., Li, Z., and Yang, Y.: Contrasting the effect of aerosol properties on the planetary boundary layer height in Beijing and Nanjing, Atmos. Environ., 308, 119861, https://doi.org/10.1016/j.atmosenv.2023.119861, 2023.
Jiang, L., Chen, Y., Zhou, H., and He, S.: NOx emissions in China: Temporal variations, spatial patterns and reduction potentials, Atmos. Pollut. Res., 11, 1473–1480, https://doi.org/10.1016/j.apr.2020.06.003, 2020.
Jiang, X., Li, G., and Fu, W.: Government environmental governance, structural adjustment and air quality: A quasi-natural experiment based on the Three-year Action Plan to Win the Blue Sky Defense War, J. Environ. Manage., 277, 111470, https://doi.org/10.1016/j.jenvman.2020.111470, 2021.
Jiao, P., Xing, C., and Liu, C.: A dataset of ground-based vertical profile observations of aerosol, NO2 and HCHO from the hyperspectral vertical remote sensing network in China (2019–2023), Zenodo [data set], https://doi.org/10.5281/zenodo.15211604, 2024.
Justice, C. O., Townshend, J. R. G., Vermote, E. F., Masuoka, E., Wolfe, R. E., Saleous, N., Roy, D. P., and Morisette, J. T.: An overview of MODIS Land data processing and product status, Remote Sens. Environ., 83, 3–15, https://doi.org/10.1016/S0034-4257(02)00084-6, 2002.
Lamsal, L. N., Martin, R. V., Parrish, D. D., and Krotkov, N. A.: Scaling Relationship for NO2 Pollution and Urban Population Size: A Satellite Perspective, Environ. Sci. Technol., 47, 7855–7861, https://doi.org/10.1021/es400744g, 2013.
Lee, A. K. Y., Ling, T. Y., and Chan, C. K.: Understanding hygroscopic growth and phase transformation of aerosols using single particle Raman spectroscopy in an electrodynamic balance, Faraday Discuss., 137, 245–263, https://doi.org/10.1039/B704580H, 2008.
Lee, M., Heikes, B. G., Jacob, D. J., Sachse, G., and Anderson, B.: Hydrogen peroxide, organic hydroperoxide, and formaldehyde as primary pollutants from biomass burning, J. Geophys. Res.-Atmos., 102, 1301–1309, https://doi.org/10.1029/96JD01709, 1997.
Lee, Y. C. and Hills, P. R.: Cool season pollution episodes in Hong Kong, 1996–2002, Atmos. Environ., 37, 2927–2939, https://doi.org/10.1016/S1352-2310(03)00296-6, 2003.
Lei, W., Zavala, M., de Foy, B., Volkamer, R., Molina, M. J., and Molina, L. T.: Impact of primary formaldehyde on air pollution in the Mexico City Metropolitan Area, Atmos. Chem. Phys., 9, 2607–2618, https://doi.org/10.5194/acp-9-2607-2009, 2009.
Li, Y., Xing, C., Peng, H., Song, Y., Zhang, C., Xue, J., Niu, X., and Liu, C.: Long-term observations of NO2 using GEMS in China: Validations and regional transport, Sci. Total Environ., 904, 166762, https://doi.org/10.1016/j.scitotenv.2023.166762, 2023.
Li, Y., Xing, C., Hong, Q., Jiao, P., Peng, H., Tang, Z., and Liu, C.: Ozone Formation Sensitivity at Various Altitudes: Seeking the Optimal Method for Sensitivity Threshold Determination, Environ. Sci. Tech. Let., https://doi.org/10.1021/acs.estlett.4c00777, 2024.
Liu, C., Xing, C., Hu, Q., Li, Q., Liu, H., Hong, Q., Tan, W., Ji, X., Lin, H., Lu, C., Lin, J., Liu, H., Wei, S., Chen, J., Yang, K., Wang, S., Liu, T., and Chen, Y.: Ground-Based Hyperspectral Stereoscopic Remote Sensing Network: A Promising Strategy to Learn Coordinated Control of O3 and PM2.5 over China, Engineering, 19, 71–83, https://doi.org/10.1016/j.eng.2021.02.019, 2022.
Liu, F., Beirle, S., Zhang, Q., van der A, R. J., Zheng, B., Tong, D., and He, K.: NOx emission trends over Chinese cities estimated from OMI observations during 2005 to 2015, Atmos. Chem. Phys., 17, 9261–9275, https://doi.org/10.5194/acp-17-9261-2017, 2017.
Liu, S., Jiang, X., Tsona, N. T., Lv, C., and Du, L.: Effects of NOx, SO2 and RH on the SOA formation from cyclohexene photooxidation, Chemosphere, 216, 794–804, https://doi.org/10.1016/j.chemosphere.2018.10.180, 2019.
Liu, S., Wang, H., Zhao, D., Ke, Y., Wu, Z., Shen, L., and Zhao, T.: Aircraft observations of aerosols and BC in autumn over Guangxi Province, China: Diurnal variation, vertical distribution and source appointment, Sci. Total Environ., 906, 167550, https://doi.org/10.1016/j.scitotenv.2023.167550, 2024.
Liu, Y., Lin, T., Hong, J., Wang, Y., Shi, L., Huang, Y., Wu, X., Zhou, H., Zhang, J., and de Leeuw, G.: Multi-dimensional satellite observations of aerosol properties and aerosol types over three major urban clusters in eastern China, Atmos. Chem. Phys., 21, 12331–12358, https://doi.org/10.5194/acp-21-12331-2021, 2021.
Luecken, D. J., Hutzell, W. T., Strum, M. L., and Pouliot, G. A.: Regional sources of atmospheric formaldehyde and acetaldehyde, and implications for atmospheric modeling, Atmos. Environ., 47, 477–490, https://doi.org/10.1016/j.atmosenv.2011.10.005, 2012.
Maji, K. J., Li, V. O. K., and Lam, J. C. K.: Effects of China's current Air Pollution Prevention and Control Action Plan on air pollution patterns, health risks and mortalities in Beijing 2014–2018, Chemosphere, 260, 127572, https://doi.org/10.1016/j.chemosphere.2020.127572, 2020.
Meller, R. and Moortgat, G. K.: Temperature dependence of the absorption cross sections of formaldehyde between 223 and 323 K in the wavelength range 225–375 nm, J. Geophys. Res.-Atmos., 105, 7089–7101, https://doi.org/10.1029/1999JD901074, 2000.
Meng, K., Xu, X., Cheng, X., Xu, X., Qu, X., Zhu, W., Ma, C., Yang, Y., and Zhao, Y.: Spatio-temporal variations in SO2 and NO2 emissions caused by heating over the Beijing–Tianjin–Hebei Region constrained by an adaptive nudging method with OMI data, Sci. Total Environ., 642, 543–552, https://doi.org/10.1016/j.scitotenv.2018.06.021, 2018.
Nussbaumer, C. M., Crowley, J. N., Schuladen, J., Williams, J., Hafermann, S., Reiffs, A., Axinte, R., Harder, H., Ernest, C., Novelli, A., Sala, K., Martinez, M., Mallik, C., Tomsche, L., Plass-Dülmer, C., Bohn, B., Lelieveld, J., and Fischer, H.: Measurement report: Photochemical production and loss rates of formaldehyde and ozone across Europe, Atmos. Chem. Phys., 21, 18413–18432, https://doi.org/10.5194/acp-21-18413-2021, 2021.
Ramanathan, V., Crutzen, P. J., Kiehl, J. T., and Rosenfeld, D.: Aerosols, Climate, and the Hydrological Cycle, Science, 294, 2119–2124, https://doi.org/10.1126/science.1064034, 2001.
Rothman, L. S., Gordon, I. E., Barbe, A., Benner, D. C., Bernath, P. F., Birk, M., Boudon, V., Brown, L. R., Campargue, A., Champion, J.-P., Chance, K., Coudert, L. H., Dana, V., Devi, V. M., Fally, S., Flaud, J.-M., Gamache, R. R., Goldman, A., Jacquemart, D., Kleiner, I., Lacome, N., Lafferty, W. J., Mandin, J.-Y., Massie, S. T., Mikhailenko, S. N., Miller, C. E., Moazzen-Ahmadi, N., Naumenko, O. V., Nikitin, A. V., Orphal, J., Perevalov, V. I., Perrin, A., Predoi-Cross, A., Rinsland, C. P., Rotger, M., Šimečková, M., Smith, M. A. H., Sung, K., Tashkun, S. A., Tennyson, J., Toth, R. A., Vandaele, A. C., and Vander Auwera, J.: The HITRAN 2008 molecular spectroscopic database, J. Quant. Spectrosc. Ra., 110, 533–572, https://doi.org/10.1016/j.jqsrt.2009.02.013, 2009.
Russell, A. G. and Brunekreef, B.: A Focus on Particulate Matter and Health, Environ. Sci. Technol., 43, 4620–4625, https://doi.org/10.1021/es9005459, 2009.
Schauer, J. J., Kleeman, M. J., Cass, G. R., and Simoneit, B. R. T.: Measurement of Emissions from Air Pollution Sources. 5. C1-C32 Organic Compounds from Gasoline-Powered Motor Vehicles, Environ. Sci. Technol., 36, 1169–1180, https://doi.org/10.1021/es0108077, 2002.
Seinfeld, J. H., Pandis, S. N., and Noone, K.: Atmospheric Chemistry and Physics: From Air Pollution to Climate Change, Phys. Today, 51, 88–90, https://doi.org/10.1063/1.882420, 1998.
Serdyuchenko, A., Gorshelev, V., Weber, M., Chehade, W., and Burrows, J. P.: High spectral resolution ozone absorption cross-sections – Part 2: Temperature dependence, Atmos. Meas. Tech., 7, 625–636, https://doi.org/10.5194/amt-7-625-2014, 2014.
Shen, Y., Jiang, F., Feng, S., Zheng, Y., Cai, Z., and Lyu, X.: Impact of weather and emission changes on NO2 concentrations in China during 2014–2019, Environ. Pollut., 269, 116163, https://doi.org/10.1016/j.envpol.2020.116163, 2021.
Shen, Y., Jiang, F., Feng, S., Xia, Z., Zheng, Y., Lyu, X., Zhang, L., and Lou, C.: Increased diurnal difference of NO2 concentrations and its impact on recent ozone pollution in eastern China in summer, Sci. Total Environ., 858, 159767, https://doi.org/10.1016/j.scitotenv.2022.159767, 2023.
Song, Y., Xing, C., Liu, C., Lin, J., Wu, H., Liu, T., Lin, H., Zhang, C., Tan, W., Ji, X., Liu, H., and Li, Q.: Evaluation of transport processes over North China Plain and Yangtze River Delta using MAX-DOAS observations, Atmos. Chem. Phys., 23, 1803–1824, https://doi.org/10.5194/acp-23-1803-2023, 2023.
Thalman, R. and Volkamer, R.: Temperature dependent absorption cross-sections of O2–O2 collision pairs between 340 and 630 nm and at atmospherically relevant pressure, Phys. Chem. Chem. Phys., 15, 15371–15381, https://doi.org/10.1039/C3CP50968K, 2013.
Triantafyllou, A. G. and Kassomenos, P. A.: Aspects of atmospheric flow and dispersion of air pollutants in a mountainous basin, Sci. Total Environ., 297, 85–103, https://doi.org/10.1016/S0048-9697(02)00090-6, 2002.
Vandaele, A. C., Hermans, C., Simon, P. C., Carleer, M., Colin, R., Fally, S., Mérienne, M. F., Jenouvrier, A., and Coquart, B.: Measurements of the NO2 absorption cross-section from 42 000 cm−1 to 10 000 cm−1 (238–1000 nm) at 220 and 294 K, J. Quant. Spectrosc. Ra., 59, 171–184, https://doi.org/10.1016/S0022-4073(97)00168-4, 1998.
Wang, D., Zhou, B., Fu, Q., Zhao, Q., Zhang, Q., Chen, J., Yang, X., Duan, Y., and Li, J.: Intense secondary aerosol formation due to strong atmospheric photochemical reactions in summer: observations at a rural site in eastern Yangtze River Delta of China, Sci. Total Environ., 571, 1454–1466, https://doi.org/10.1016/j.scitotenv.2016.06.212, 2016.
Wang, J., Wang, S., Xu, X., Li, X., He, P., Qiao, Y., and Chen, Y.: The diminishing effects of winter heating on air quality in northern China, J. Environ. Manage., 325, 116536, https://doi.org/10.1016/j.jenvman.2022.116536, 2023.
Wang, R. and Cai, H.: City-Scale Aerosol Loading Changes in the Sichuan Basin from 2001–2020 as Revealed by MODIS 1 km Aerosol Product, Atmosphere, 14, 1715, https://doi.org/10.3390/atmos14121715, 2023.
Wang, Y., Hu, M., Hu, W., Zheng, J., Niu, H., Fang, X., Xu, N., Wu, Z., Guo, S., Wu, Y., Chen, W., Lu, S., Shao, M., Xie, S., Luo, B., and Zhang, Y.: Secondary Formation of Aerosols Under Typical High-Humidity Conditions in Wintertime Sichuan Basin, China: A Contrast to the North China Plain, J. Geophys. Res.-Atmos., 126, e2021JD034560, https://doi.org/10.1029/2021JD034560, 2021.
Wei, C.-B., Yu, G.-H., Cao, L.-M., Han, H.-X., Xia, S.-Y., and Huang, X.-F.: Tempo-spacial variation and source apportionment of atmospheric formaldehyde in the Pearl River Delta, China, Atmos. Environ., 312, 120016, https://doi.org/10.1016/j.atmosenv.2023.120016, 2023.
Wen, Y., Zhang, S., Zhang, J., Bao, S., Wu, X., Yang, D., and Wu, Y.: Mapping dynamic road emissions for a megacity by using open-access traffic congestion index data, Appl. Energy, 260, 114357, https://doi.org/10.1016/j.apenergy.2019.114357, 2020.
Wu, J., Bei, N., Li, X., Wang, R., Liu, S., Jiang, Q., Tie, X., and Li, G.: Impacts of Transboundary Transport on Coastal Air Quality of South China, J. Geophys. Res.-Atmos., 127, e2021JD036213, https://doi.org/10.1029/2021JD036213, 2022.
Xiao, Q., Ma, Z., Li, S., and Liu, Y.: The impact of winter heating on air pollution in China, PLoS One, 10, e0117311, https://doi.org/10.1371/journal.pone.0117311, 2015.
Xie, M., Zhu, K., Wang, T., Chen, P., Han, Y., Li, S., Zhuang, B., and Shu, L.: Temporal characterization and regional contribution to O3 and NOx at an urban and a suburban site in Nanjing, China, Sci. Total Environ., 551–552, 533–545, https://doi.org/10.1016/j.scitotenv.2016.02.047, 2016.
Xing, C., Liu, C., Hu, Q., Fu, Q., Lin, H., Wang, S., Su, W., Wang, W., Javed, Z., and Liu, J.: Identifying the wintertime sources of volatile organic compounds (VOCs) from MAX-DOAS measured formaldehyde and glyoxal in Chongqing, southwest China, Sci. Total Environ., 715, 136258, https://doi.org/10.1016/j.scitotenv.2019.136258, 2020.
Xing, C., Liu, C., Wu, H., Lin, J., Wang, F., Wang, S., and Gao, M.: Ground-based vertical profile observations of atmospheric composition on the Tibetan Plateau (2017–2019), Earth Syst. Sci. Data, 13, 4897–4912, https://doi.org/10.5194/essd-13-4897-2021, 2021a.
Xing, C., Liu, C., Hu, Q., Fu, Q., Wang, S., Lin, H., Zhu, Y., Wang, S., Wang, W., Javed, Z., Ji, X., and Liu, J.: Vertical distributions of wintertime atmospheric nitrogenous compounds and the corresponding OH radicals production in Leshan, southwest China, J. Environ. Sci., 105, 44–55, https://doi.org/10.1016/j.jes.2020.11.019, 2021b.
Yang, D., Zhang, S., Niu, T., Wang, Y., Xu, H., Zhang, K. M., and Wu, Y.: High-resolution mapping of vehicle emissions of atmospheric pollutants based on large-scale, real-world traffic datasets, Atmos. Chem. Phys., 19, 8831–8843, https://doi.org/10.5194/acp-19-8831-2019, 2019.
Yuan, J., Wang, X., Feng, Z., Zhang, Y., and Yu, M.: Spatiotemporal Variations of Aerosol Optical Depth and the Spatial Heterogeneity Relationship of Potential Factors Based on the Multi-Scale Geographically Weighted Regression Model in Chinese National-Level Urban Agglomerations, Remote Sens., 15, 4613, https://doi.org/10.3390/rs15184613, 2023.
Zhang, D., Li, Z., Wu, H., Wu, T., Ren, R., Cai, Z., Liang, C., and Chen, L.: Analysis of aerosol particle number size distribution and source attribution at three megacities in China, Atmos. Environ., 279, 119114, https://doi.org/10.1016/j.atmosenv.2022.119114, 2022.
Zhang, K., Zhao, C., Fan, H., Yang, Y., and Sun, Y.: Toward Understanding the Differences of PM2.5 Characteristics Among Five China Urban Cities, Asia-Pac. J. Atmospheric Sci., 56, 493–502, https://doi.org/10.1007/s13143-019-00125-w, 2020.
Zhao, H., Che, H., Zhang, X., Ma, Y., Wang, Y., Wang, X., Liu, C., Hou, B., and Che, H.: Aerosol optical properties over urban and industrial region of Northeast China by using ground-based sun-photometer measurement, Atmos. Environ., 75, 270–278, https://doi.org/10.1016/j.atmosenv.2013.04.048, 2013.
Zhao, H., Che, H., Xia, X., Wang, Y., Wang, H., Wang, P., Ma, Y., Yang, H., Liu, Y., Wang, Y., Gui, K., Sun, T., Zheng, Y., and Zhang, X.: Climatology of mixing layer height in China based on multi-year meteorological data from 2000–2013, Atmos. Environ., 213, 90–103, https://doi.org/10.1016/j.atmosenv.2019.05.047, 2019.