the Creative Commons Attribution 4.0 License.
the Creative Commons Attribution 4.0 License.
 | 01 Jul 2025
A high-quality data set for seismological studies in the East Anatolian Fault Zone, Türkiye
Leonardo Colavitti
Dino Bindi
Gabriele Tarchini
Davide Scafidi
Matteo Picozzi
Daniele Spallarossa
This work aims to develop and share a high-quality seismic data set for the East Anatolian Fault Zone (EAFZ), a highly active seismic area that is prone to earthquakes, as evidenced by the two major earthquakes of magnitude 7.8 and 7.6 that occurred on 6 February 2023 in central Türkiye and northern and western Syria.
The data set described here (available at https://doi.org/10.5281/zenodo.13838992, Colavitti et al., 2024) encompasses seismic events from 1 January 2019–29 February 2024, focusing on small to moderate earthquakes with an ML between 2.0 and 5.5 and is intended as a useful tool for researchers working on seismic source characterization and strong motion parameters.
The data set consists of 9442 events recorded by 271 stations and includes a total of 270 704 seismic phases (148 223 P and 122 481 S). The complete automatic seismic processor (CASP) software package ensures accurate arrival times and refined earthquake locations, while the local magnitude is calibrated using a nonparametric approach. In addition to the earthquake catalog, the data set features strong motion parameters such as peak ground acceleration (PGA), peak ground velocity (PGV), and Fourier amplitude spectra (FAS) in the frequency range from 0.05–47.2 Hz.
The disseminated product aims to support applications in spectral decomposition using the generalized inversion technique (GIT), promote investigations in local earthquake tomography (LET), and contribute to the development of ground-motion prediction equations (GMPEs). Long-term objectives include studying the spatiotemporal evolution of seismicity to identify preparatory processes for significant earthquakes, integrating these data with geodetic investigations, and enhancing earthquake hazard assessments.
- Article
(6063 KB) - Full-text XML
-
Supplement
(6083 KB) - BibTeX
- EndNote


On 6 February 2023 a seismic sequence hit southern and central Türkiye and northern and western Syria along the East Anatolian Fault Zone (EAFZ). The sequence was started by a moment magnitude Mw 7.8 earthquake along the Nurdağı–Pazarcık fault and was followed, about 9 h later, by a Mw 7.6 earthquake that occurred north-northeast from the first shock in Kahramanmaraş province, involving the Sürgü and Çardak faults (Güvercin et al., 2022; Dal Zilio and Ampuero, 2023; Melgar et al., 2023; Petersen et al., 2023). According to the Disaster and Emergency Management Authority (Afet ve Acil Durum Yönetimi Başkanlığı, AFAD, 1990), the combined death contribution in Türkiye and Syria exceeds 60 000 people, with more than 120 000 injured and economic loss amounting to USD 163.6 billion, representing the deadliest natural disaster in the modern history of Türkiye at present, since the 526 Antioch event (Sbeinati et al., 2005).
In this study, we focus on the EAFZ, which is a portion of a major fault zone that runs through eastern Türkiye as it accommodates the tectonic relative motion between the Arabian and Anatolian microplates (Ambraseys, 1989). According to Melgar et al. (2023), the first event nucleated on a previously unmapped fault before transitioning to the East Anatolian Fault, which ruptured over a length of approximately 350 km, while the second one ruptured the Sürgü Fault over ∼160 km.
The goal of this study is to describe the procedure that led to the creation of a high-quality seismic data set for the EAFZ, where the 2023 Kahramanmaraş event occurred, and its dissemination to the scientific community to promote high-quality seismological research. Indeed, the development of high-quality data sets is crucial for the investigation of critical open issues, such as the estimation of source parameters (e.g., the seismic energy and the stress drop), which represent fundamental information for understanding fault mechanics and obtaining rupture scenarios for seismic risk mitigation but are difficult to estimate and affected by large uncertainties (Cotton et al., 2013; Abercrombie, 2015).
Recently, benchmark studies have been carried out to facilitate the comparison of the results of different approaches to estimate source parameters applied to the same data set (e.g., Pennington et al., 2021; Shible et al., 2022; Morasca et al., 2022; Bindi et al., 2023a, b). Following these efforts, a data set for the 2019 Ridgecrest earthquake sequence was disseminated in the context of the community stress-drop validation study (Baltay et al., 2024).
We believe that the creation of high-quality, standardized, and open-source seismic data sets including waveforms, Fourier amplitude spectra (FAS), peak ground acceleration (PGA), and peak ground velocity (PGV) is the key to promote the progress of the seismological and seismic engineering communities. In this paper, we describe in detail the procedures used to construct the data set and the criteria applied for selecting the data to be distributed.
The data set includes earthquakes that occurred along the EAFZ main segments (Fig. 1) in the period from 1 January 2019–29 February 2024 and thus includes both the years preceding the 2023 Kahramanmaraş earthquake and those of the following aftershocks. The data set focuses on small to moderate earthquakes in the magnitude range from 2.0–5.5, which is typically used in studies focusing on source parameters (Parolai et al., 2000, 2007; Picozzi et al., 2017). Larger earthquakes are not included (besides the 2 mainshocks of 6 February 2023, we did not consider other 22 events with magnitudes from 5.6–6.6) as they are already available in accelerometric databases such as the Engineering Strong-Motion Database (ESM) by Luzi et al. (2020) or in a recent work by Sandıkkaya et al. (2024).
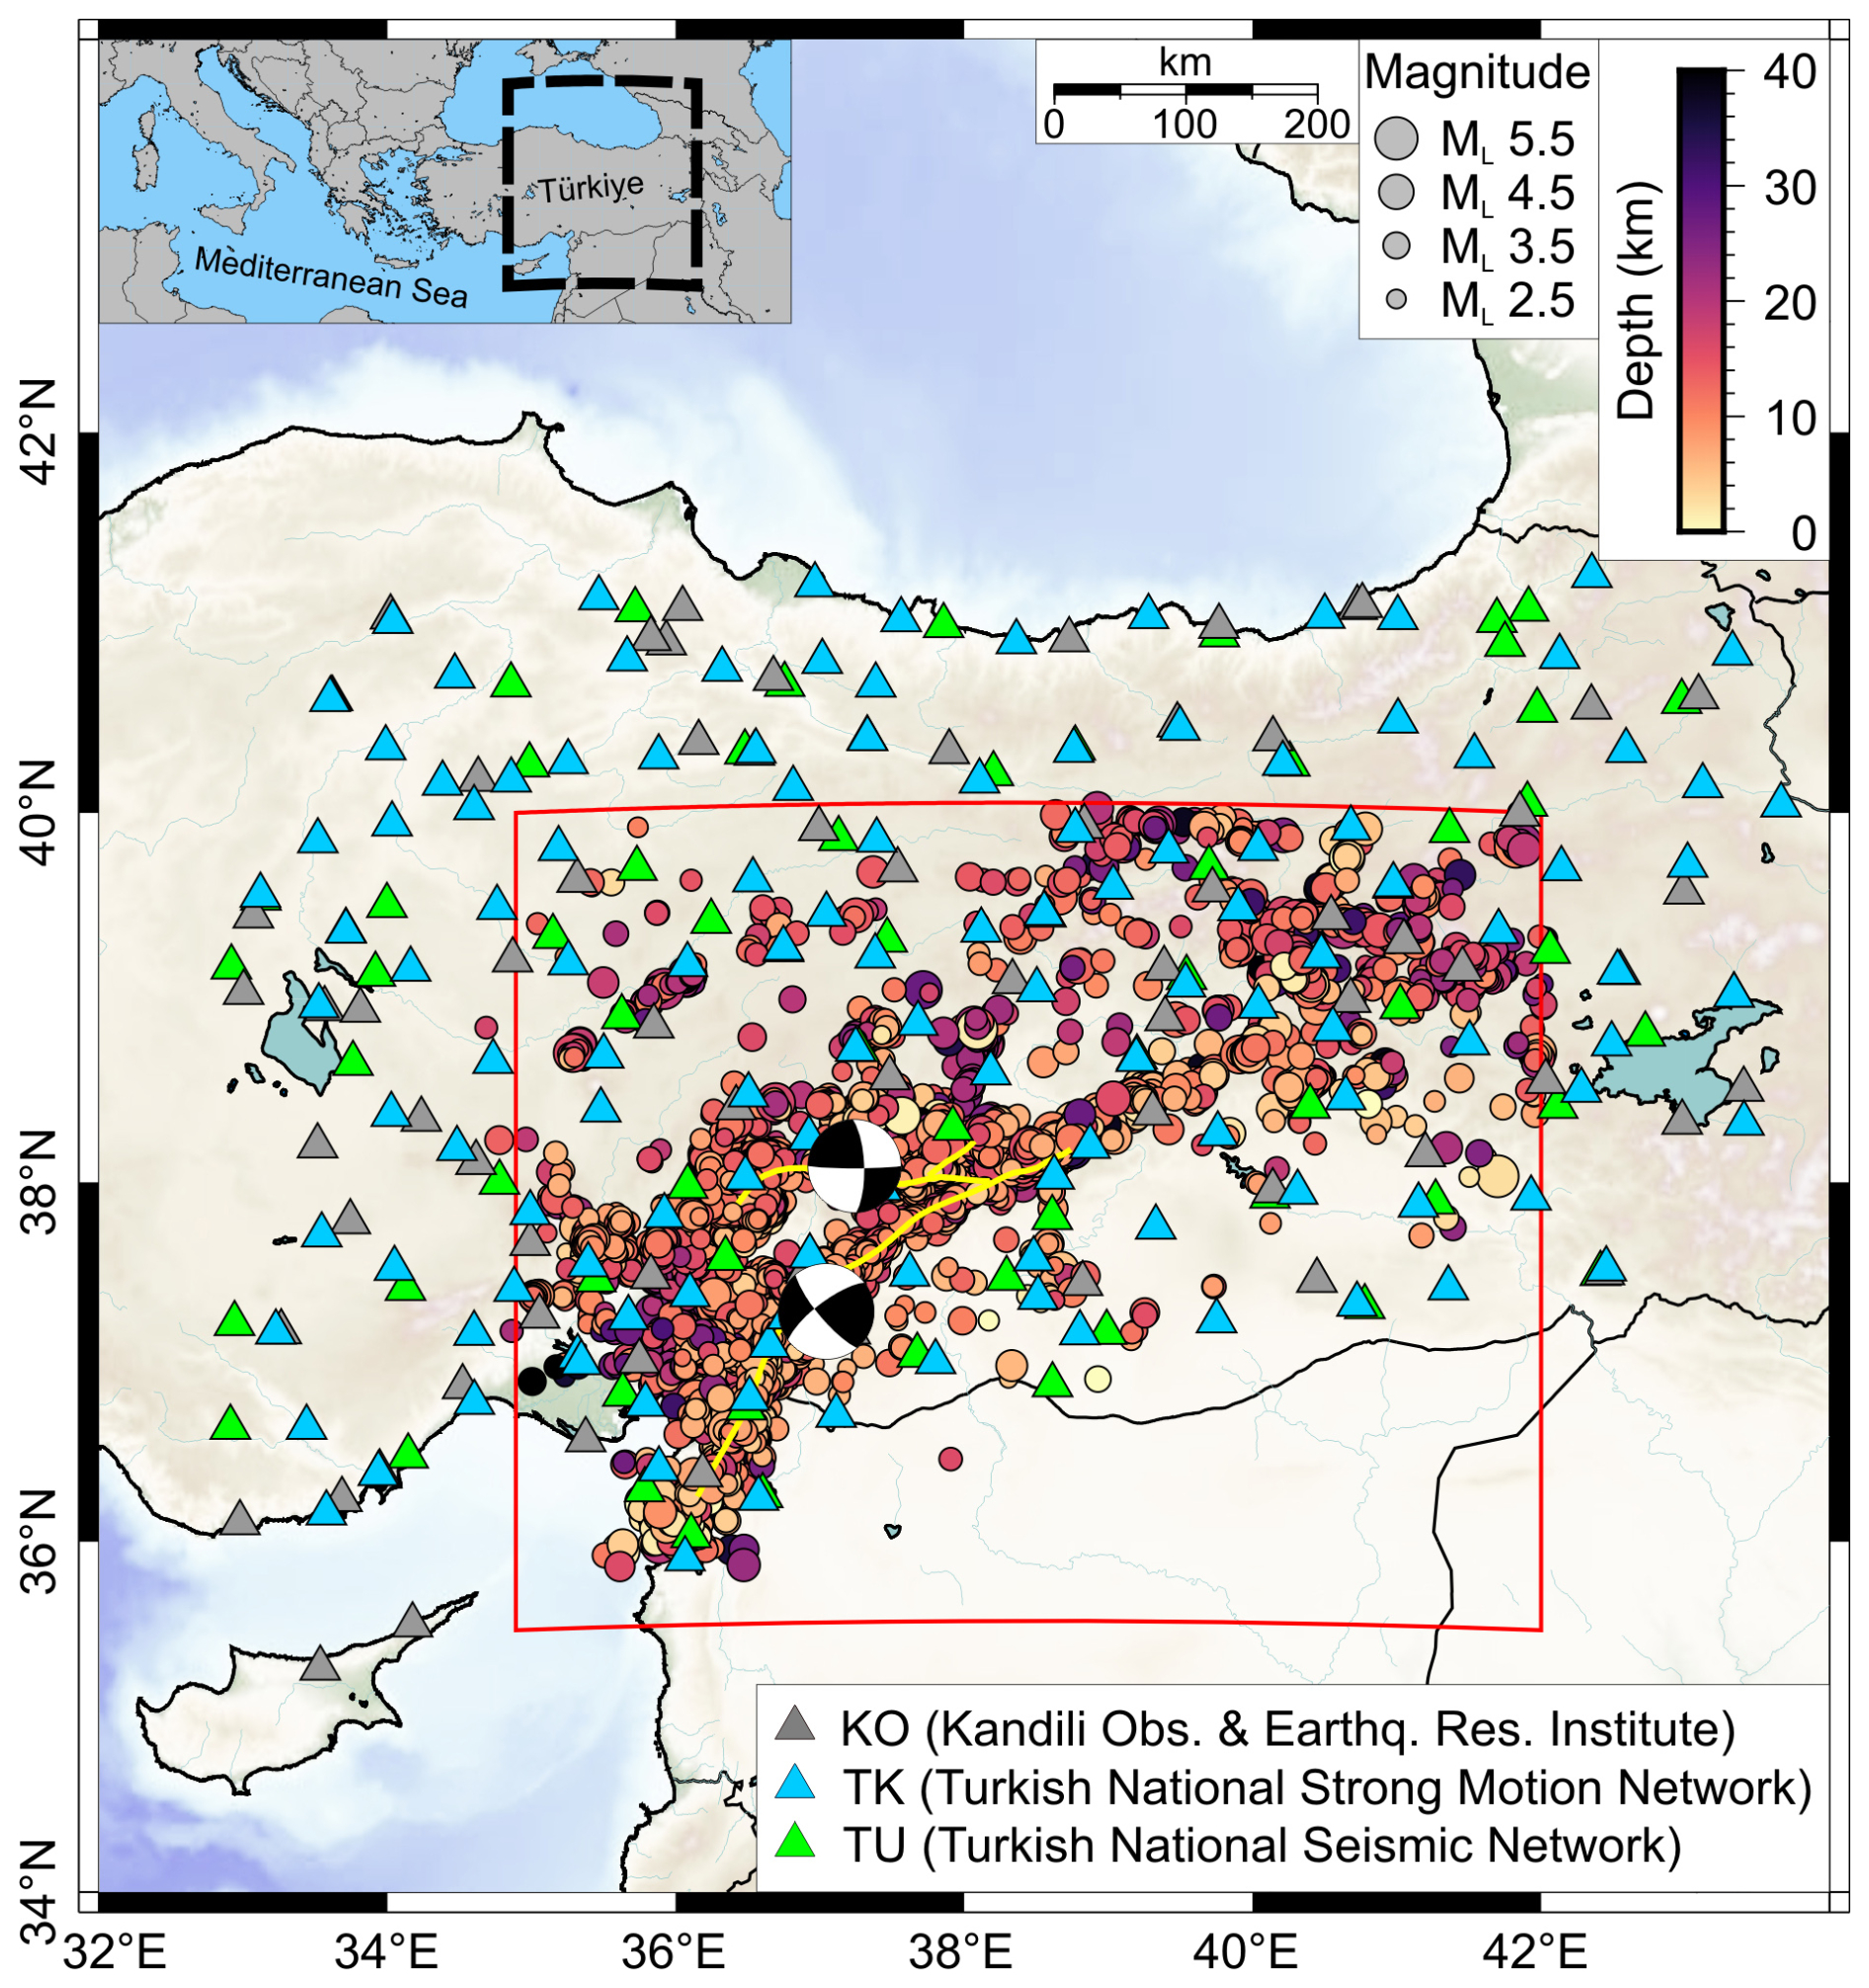
Figure 1The data set for the East Anatolian Fault Zone (EAFZ) described in this work, bounded by the red box (long–lat vertices – SW: 34.89, 35.50; SE: 42.00, 35.50; NE: 42.00, 40.00; NW: 34.89, 40.0). Dots represent the events with ML between 2.0 and 5.5 in the period from 1 January 2019–29 February 2024. The size is proportional to the magnitude; the color palette represents the event depth. The two beach balls lying in the Melgar faults (yellow lines) represent the Mw 7.8 Pazarcık earthquake and the Mw 7.6 Elbistan earthquake that occurred on 6 February 2023, which are not considered in this catalog. The triangles show the different networks that recorded the events: KO (gray), TK (cyan), and TU (green).
The distributed data set includes a selected seismic catalog, selected peak ground acceleration (PGA), peak ground velocity (PGV), and selected Fourier amplitude spectra (FAS) in the frequency range of 0.05–47.20 Hz.
The primary focus of the 2019–2024 EAFZ data set that we envision is the source parameter applications discussed previously. However, we believe it is particularly suitable for investigating the evolution of ground-shaking patterns in space and time during seismic sequences.
Moreover, in the light of recent studies (Picozzi et al., 2022, 2023a, b) on spatiotemporal analysis of seismicity and ground-motion parameters (i.e., GMAs, ground-motion anomalies; defined in Picozzi et al., 2024), the provided data set can support seismic studies for intercepting the preparatory phase of strong earthquakes.
The flowchart in Fig. 2 shows the process that led to the creation and selection of the data set. We used the AFAD online catalog to geographically select all earthquakes that occurred between 32 and 44° E longitude and 34–43° N latitude (at this stage considering an area larger than the only EAFZ bounded by the red rectangle in Fig. 1), at a depth of up to 120 km, with ML in the range 2.0–5.5, and for the period from 1 January 2019–29 February 2024. The initially selected reference catalog consists of 78 728 events, which are shown in the map in Fig. S1 in the Supplement.
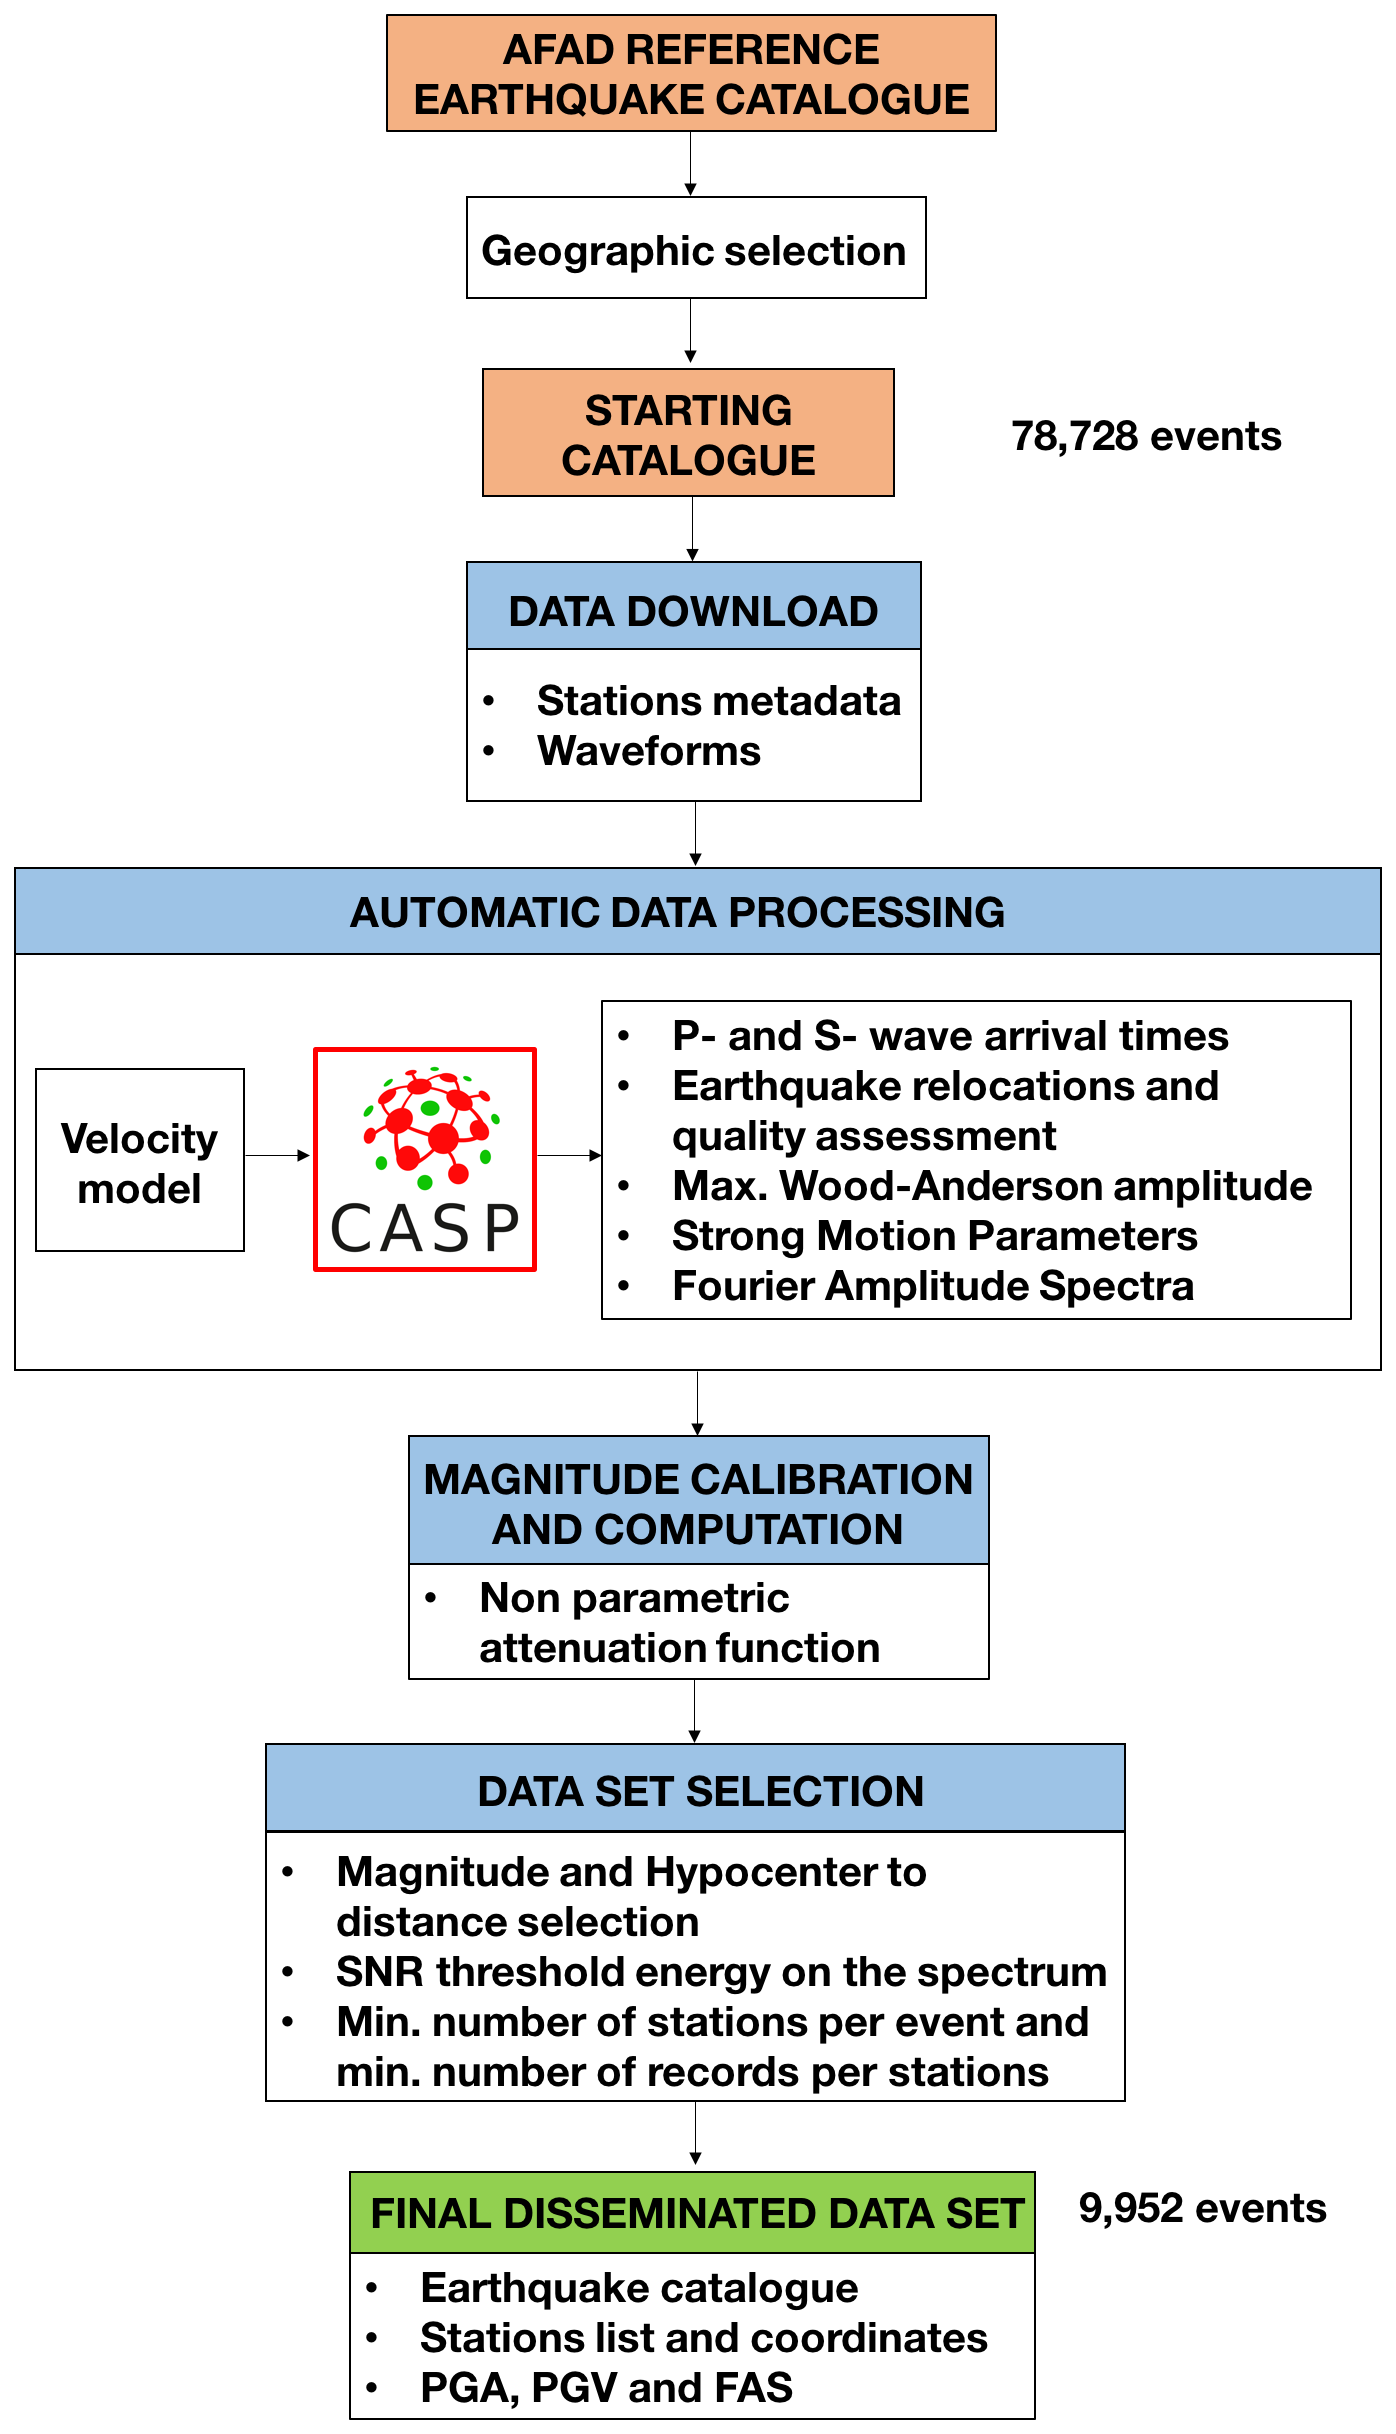
Figure 2Flowchart of the approach adopted in this work for the creation of the data set. Red boxes represent the catalogs of the data set and blue boxes the main procedure of the calculations. CASP: complete automatic seismic processor. The last box represents the disseminated data set discussed in this work.
The starting catalog was downloaded through the International Federation of Digital Seismograph Networks (FDSN, https://www.fdsn.org/, last access: 1 March 2024) web service using the fdsnws-event command to access event parameters via the AFAD (1990) repository (reference website: https://deprem.afad.gov.tr/event-catalog, last access: 1 March 2024). We downloaded the metadata for the stations belonging to the KO (Kandilli Observatory and Earthquake Research Institute, Boğaziçi University, 1971), TK (Disaster and Emergency Management Authority, 1973), and TU (Disaster and Emergency Management Authority, 1990) networks implemented into the data centers of AFAD and the European Integrated Data Archive (EIDA, https://www.orfeus-eu.org/data/eida/, last access: 29 February 2024).
All waveforms for the three ground-motion components were downloaded in MiniSEED format from the EIDA and AFAD repositories using the fdsnws-dataselect command. The seismograms of the events were extracted by selecting segments from continuous seismic recordings and converting them to the Seismic Analysis Code (SAC) format. Each time window contains 30 s of noise before the theoretical P-wave first arrival and has a total duration of 90 s. The entire earthquake catalog, with around 78 000 events, contains waveforms of different quality.
While studies focusing on statistical seismology (e.g., deviations from the Gutenberg–Richter law, such as b-value studies) are sometimes less sensitive to certain aspects of data quality, ensuring high data quality is critical for the accurate derivation of source parameters and the calibration of ground-motion models, making the implementation of thorough data selection and quality analysis procedures a priority.
Therefore, to generate a high-quality data set, which is the most innovative aspect of this work, we used the complete automatic seismic processor (CASP, Scafidi et al., 2019) software, which determines seismic-phase arrival times with an advanced picker engine (RSNI-Picker2; see Spallarossa et al., 2014; Scafidi et al., 2016, 2018). This process resulted in a massive set of accurate P- and S-wave arrival times consistent with earthquake locations. RSNI-Picker2 provides a quality estimate for each computed parameter, such as automatic pick weighting and standard location quality metrics.
The search for reliable seismic-phase arrival times in CASP is linked to and driven by seismic locations. To obtain reliable seismic locations, the nonlinear location (NLLoc, Lomax et al., 2000, 2012) algorithm was used, which implements a regional velocity model specifically suited for the EAFZ (Güvercin, 2023). As mentioned in Spallarossa et al. (2021a), CASP enhances detectability by improving the accuracy of arrival times; increasing reliability; and minimizing the rate of false picks, and, in general, the accuracy of results. The final result of the CASP procedure is a data set of P- and S-phase arrival times and an earthquake catalog of origin time, location, depth, and local magnitude ML, all seamlessly linked together.
In the initial processing phase, ML was calculated using a generic calibration relationship (Hutton and Boore, 1987). After processing the selected 2019–2024 EAFZ data set with CASP, a new calibration relationship was developed using a nonparametric approach (see Sect. 3.2), and magnitudes were recalculated for all events.
In this work, the automatic procedures of the CASP software also provide some strong motion parameters such as PGA, PGV, and Fourier amplitude spectra (FAS).
The method used to calculate the FAS and to select the data set is described in detail in Pacor et al. (2016) and has been applied in subsequent studies (e.g., Picozzi et al., 2022; Castro et al., 2022a) to analyze seismic sequences in central Italy.
The FAS were calculated considering 98 frequencies equally spaced on the logarithmic scale in the frequency range of 0.05–47.2 Hz and smoothed using the Konno and Ohmachi (1998) algorithm, with the smoothing parameter b set to 40.
The selection of the high-quality data set is therefore based on the following criteria:
- i.
events restricted to the EAFZ (see red box in Fig. 1; long–lat vertices – SW: 34.89, 35.50; SE: 42.00, 35.50; NE: 42.00, 40.00; NW: 34.89, 40.0);
- ii.
ML between 2.0 and 5.5;
- iii.
hypocentral distance of up to 150 km;
- iv.
a recursive procedure ensuring that at least 60 % of the Fourier spectra have points that have a signal-to-noise ratio (SNR) greater than 2.5;
- v.
events recorded by at least six stations, with each station having a minimum of six recordings.
After selection, the final data set ready for distribution described in the following sections consists of 9442 events recorded by 271 stations, including 142 strong-motion (channel HN), 123 high-gain high-broadband (HH), 4 high-gain broadband (BH), and 2 short-period seismometers (EH). In total, the data set comprises 843 651 waveforms for the three ground-motion components.
The 2019–2024 EAFZ high-quality data set consists of an earthquake catalog, a table with the coordinates of the stations used and the values of strong motion parameter, such as PGA, PGV, and FAS (see Sect. 5, “Data availability”, for more details).
As we can observe in Fig. 3, the data set is well sampled, with approximately 50 % of earthquakes recorded by 10 stations and about 50 % of earthquakes having more than 100 records. More details on the distribution of the number of recordings per event and per station can be found in Fig. S2 in the Supplement.
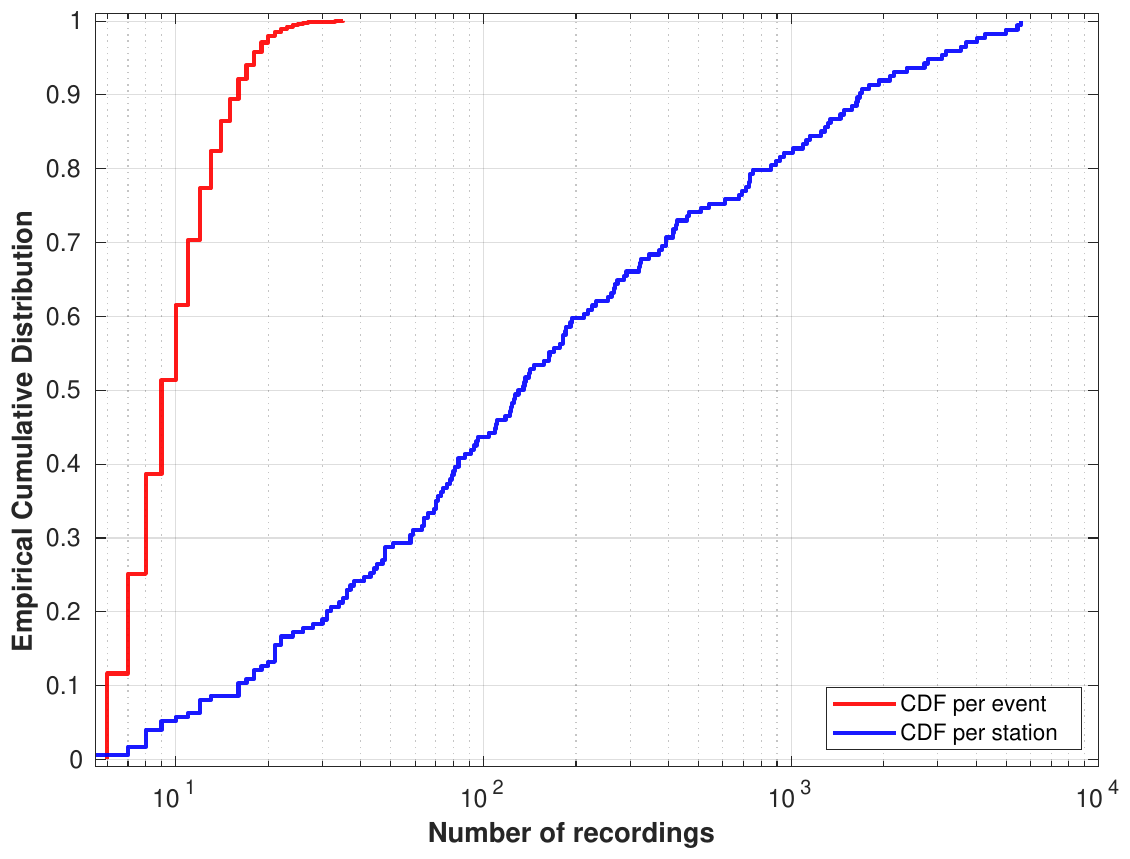
Figure 3Cumulative distribution function (CDF) per event (blue) and per station (red) used in the data set.
Figure 4 shows the heat map of the recordings in terms of hypocentral distance and ML at the sampling frequency of 1 Hz (variations of the heat map at different frequencies can be found in Fig. S3 in the Supplement). The figure shows that the most sampled area is at about 70 km hypocentral distance and an ML of 3, with some cells (with a resolution of 4 km for hypocentral distance and 0.1 for magnitude) reaching up to 300 counts.
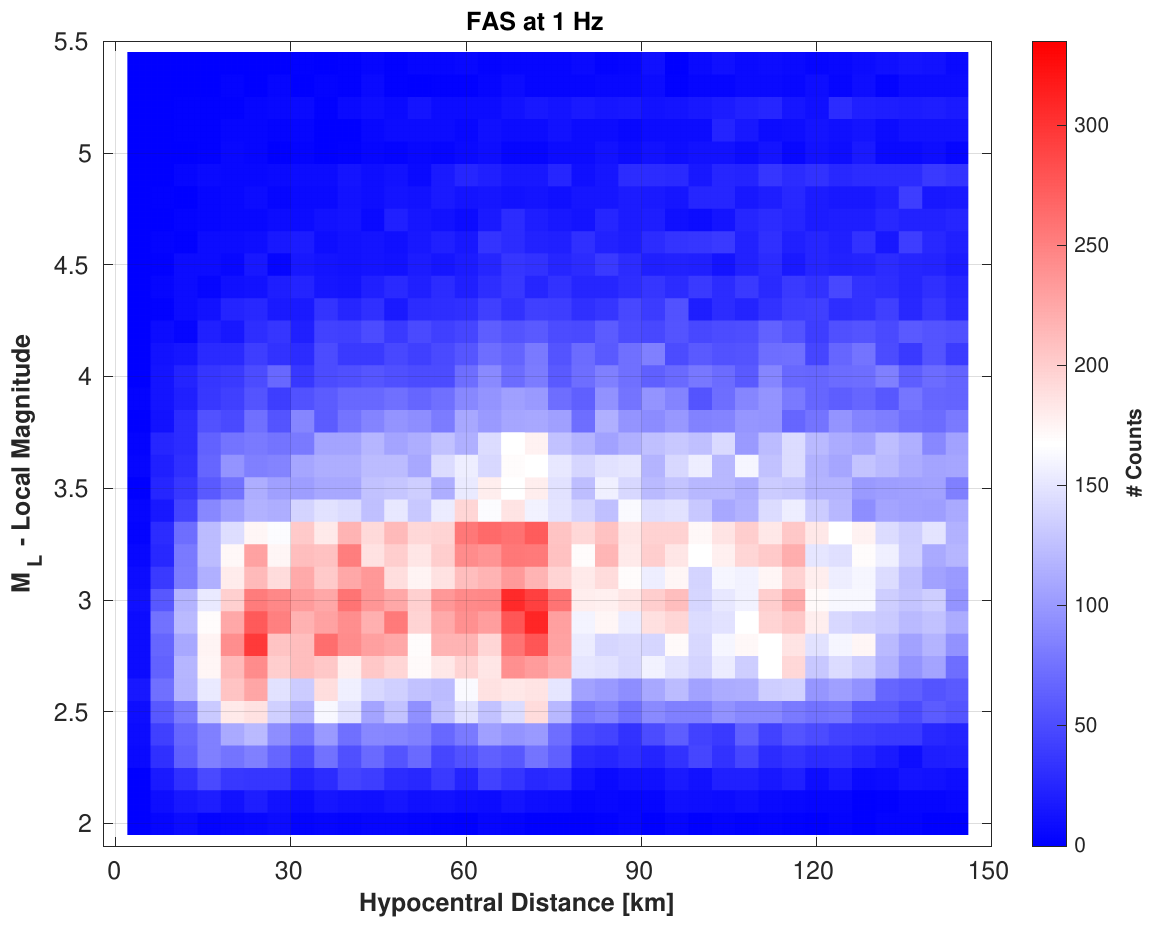
Figure 4Local magnitude versus hypocentral distance of the recordings considered in this study at FAS=1 Hz.
More than 50 % of the records include a hypocentral distance <80 km and about 67 % a hypocentral distance of less than 100 km, and more than 80 % of the data is recorded at a hypocentral distance<120 km. Regarding the magnitude distribution, about 50 % of the observed recordings is below an ML of 3.2, about 67 % below an ML of 3.5, and around 86 % below ML 4.0.
3.1 P- and S-phase picking and event relocation using CASP
The event relocation is performed using the complete automatic seismic processor procedure (CASP), which has been described in detail in previous studies (Scafidi et al., 2018, 2019).
CASP consists of four main steps, which can be summarized as follows:
-
Step 1 (RSNI-trigger module). The signal is band-pass-filtered to retrieve P onsets: a preliminary short-term average and long-term average (STA and LTA) is calculated. If the ratio exceeds a threshold value, a single-station trigger is declared: the final trigger time is then determined as the minimum of the Akaike information criterion (AIC) functions (Akaike, 1974). The output of the RSNI-trigger module is a list of trigger times for each station.
-
Step 2 (RSNI-detect module). This step is designed to be effectively applied to different cases, from small local seismic networks to large and dense regional ones. The detector algorithm is based on a system defining the number of data channels that must have been triggered within a coincidence window to declare the start of a potential event. The detector algorithm is based on a module that performs an additional check based on the comparison among earthquake locations computed using the trigger times as P-phase picks by the NLLoc software (Lomax et al., 2000, 2012), with a configuration optimized for the study area.
-
Step 3 (RSNI-extract module). The seismograms of the detected potential events are extracted from the data set containing all continuous recordings and converted to SAC format.
-
Step 4 (RSNI-picker2 module). The extracted seismograms relevant to each recognized event are processed using the RSNI-picker2 module (Spallarossa et al., 2014; Scafidi et al., 2018, 2019) to determine the P- and S-phase arrival times and the earthquake locations, to calibrate the magnitude, and compute strong-motion parameters. The first set of iterations for P and S phases is followed by a quality check of the location based on the number of phases and computed location errors, which controls the triggering of the second set of iterations for the S phases. The quality of the final solution is also assessed by considering time residuals and other predictors.
For the study area, the seismic locations were obtained using the EAFZ regional velocity model obtained by local earthquake tomography by Güvercin et al. (2022), which is a multi-layer model using VELEST inversion code (Kissling et al., 1994) obtained using 700 selected events with an azimuthal gap <80° and relocated using at least 25 phase readings.
Detailed information on the velocity structure used as the initial model can be found in Table S1 in the Supplement.
The distributed data set comprises a total of 270 704 phases selected by CASP (see Fig. S4a in the Supplement). Figure 5 shows the distribution of the P and S phases.
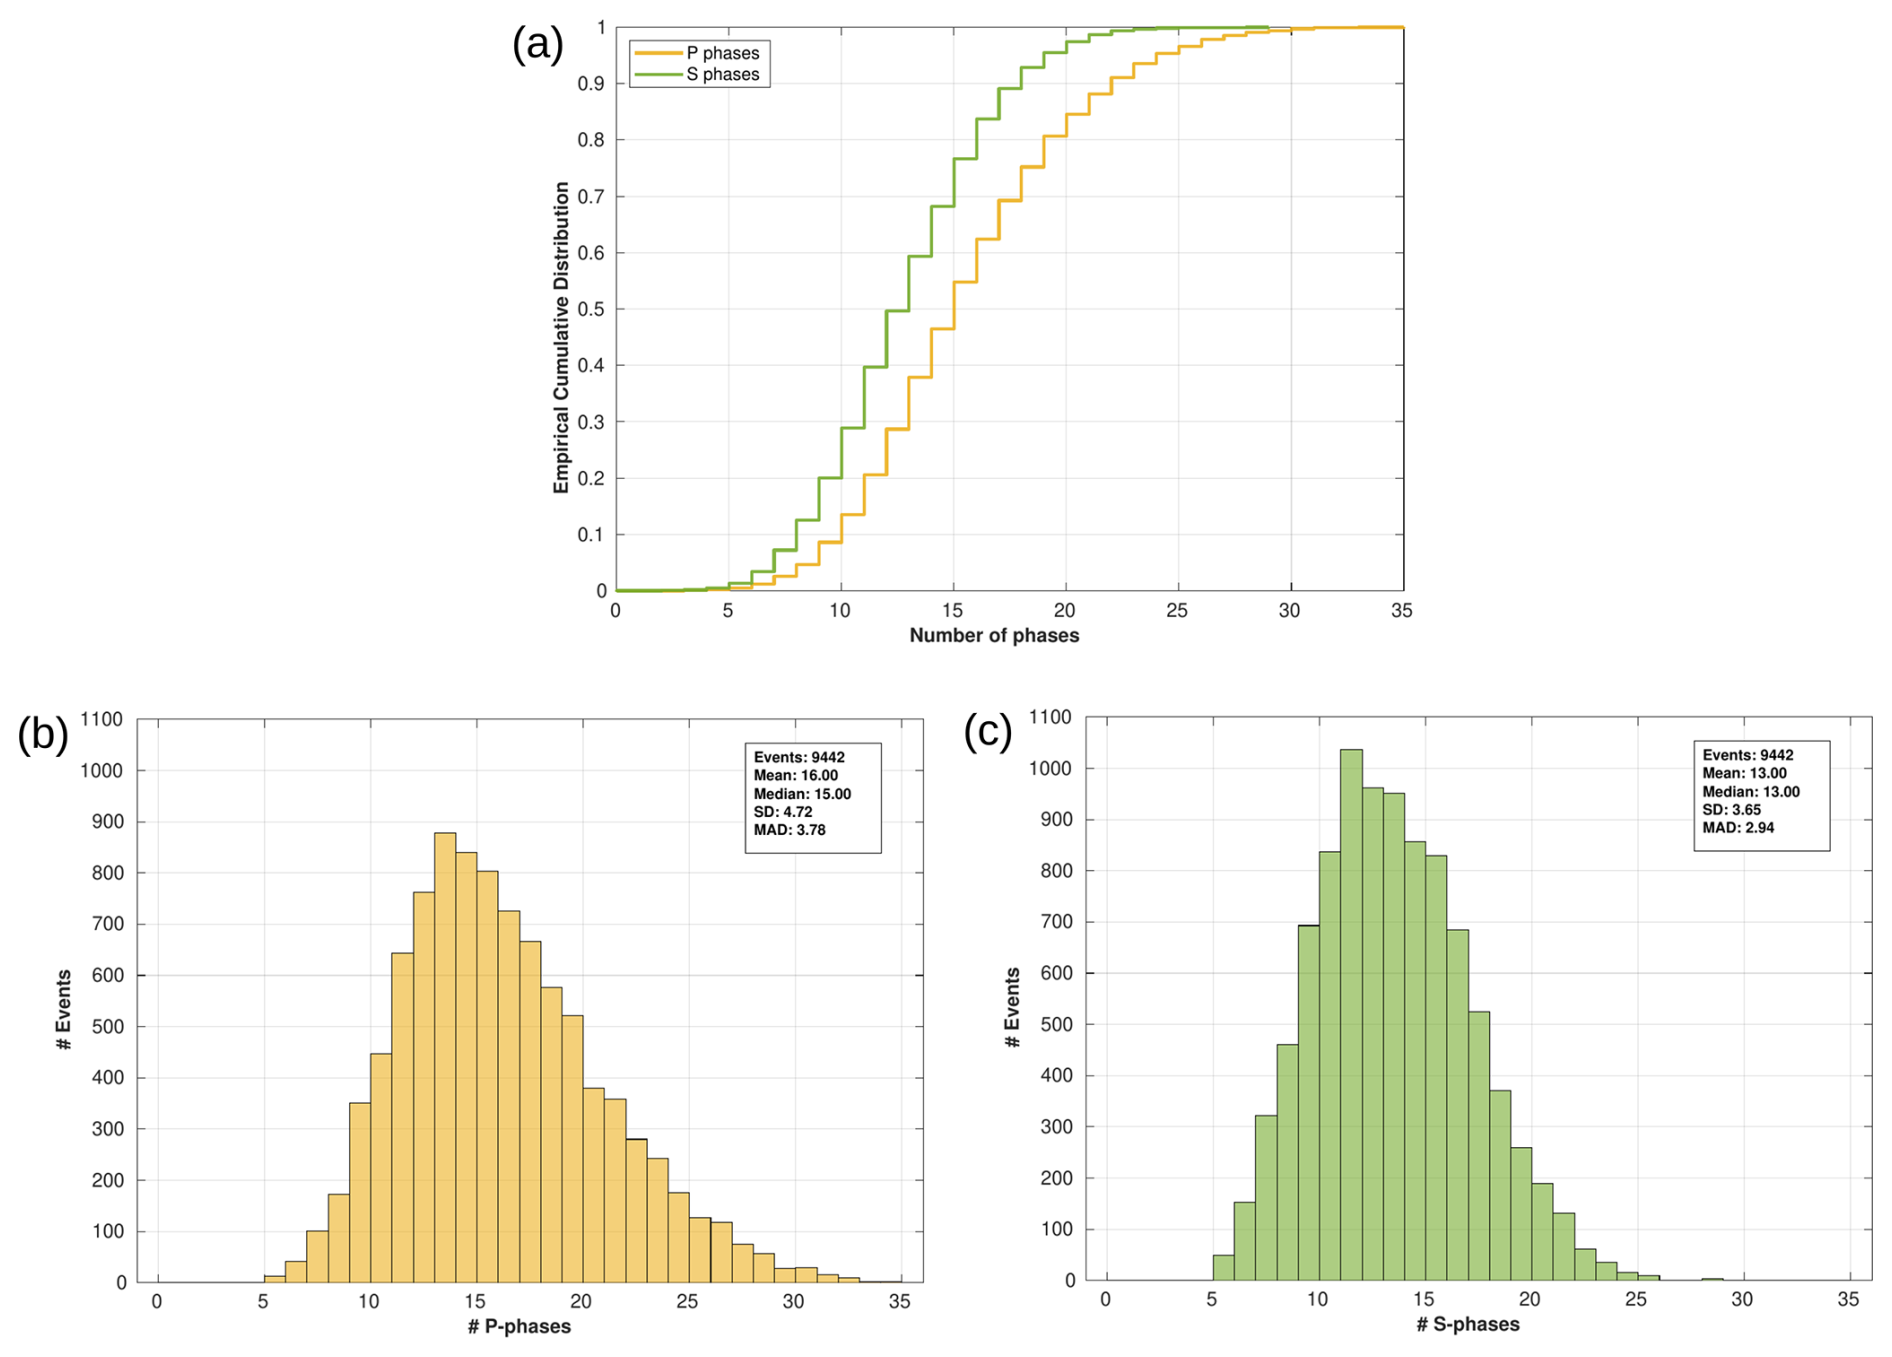
Figure 5(a) Empirical cumulative distribution of P and S phases in the present data set. (b) Histogram of the number of P waves, in yellow (b), and S waves, in green (c), picked by the complete automatic seismic processor procedure (CASP).
The minimum number of total seismic phases recorded per event is 10 (5 for the P-phase and 5 for the S-phase), and, as can be seen in Fig. 5a, 50 % of the entire data set has at least 15 P phases (yellow curve) and 13 S phases (green curve). Figure 5b and c show that the most frequent value in the distribution of histograms is 13 for the P phases and 11 for the S phases. A total of 148 223 P and 122 481 S phases were used, which corresponds to a ratio of approximately 55 % to 45 % of the total seismic phases considered. This considerable amount of high-precision P- and S-phase arrival times can be well utilized by the seismological community involved in tomographic studies, especially in the context of local earthquake tomography (LET) investigations.
3.1.1 Quality of earthquake location
NLLoc provides the quality and uncertainty of seismic locations through several parameters, including the horizontal and depth error. The horizontal error (Err H) is expressed as a confidence region in the horizontal plane, indicating the area where the earthquake is located with a certain probability, while the depth error (Err Z) is derived from the vertical axis of the error ellipsoid. Figure 6a shows the empirical distribution curve for the location error.
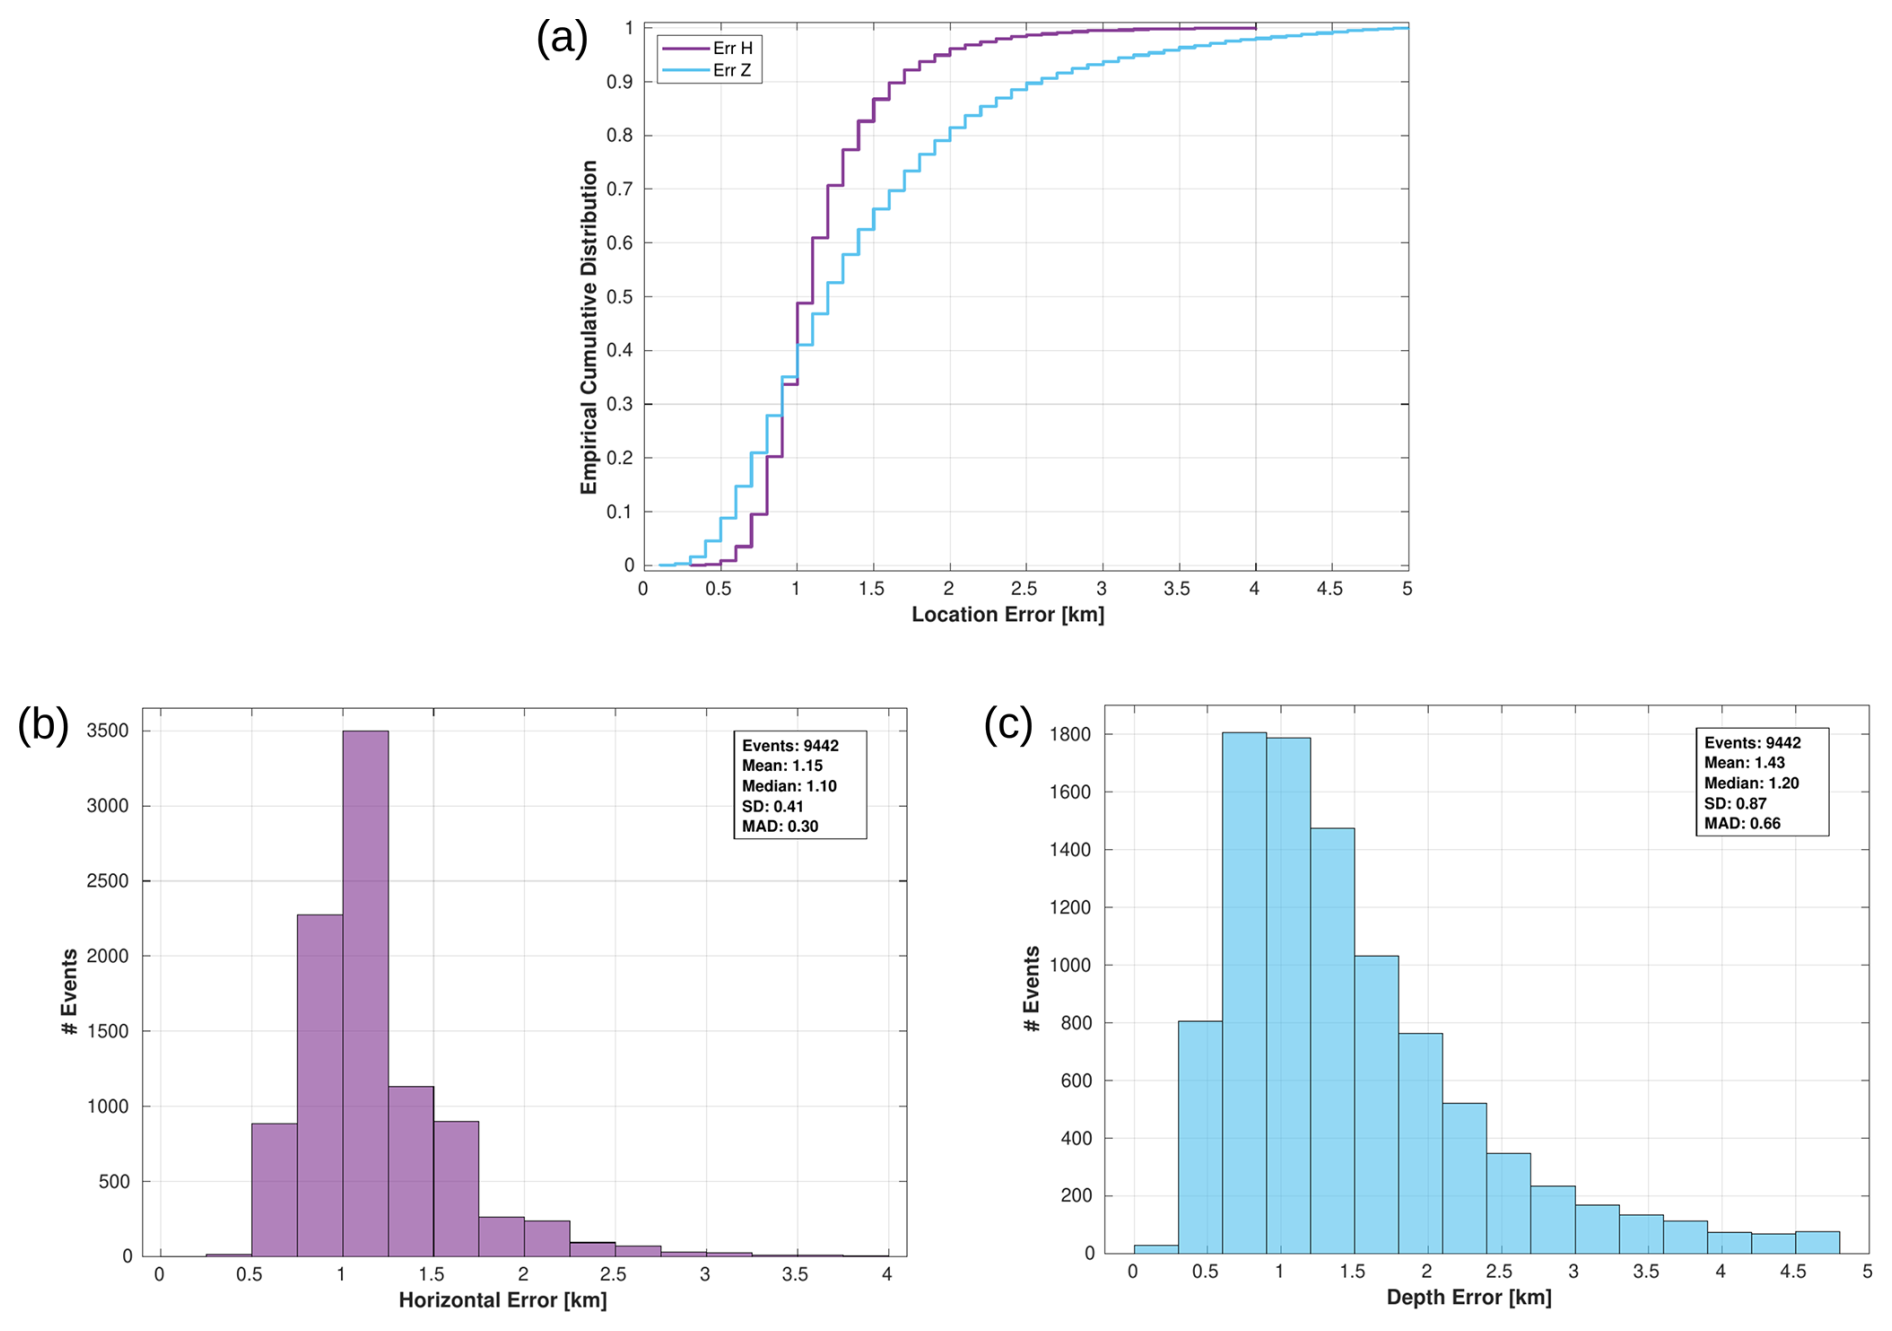
Figure 6(a) Empirical cumulative distribution of the horizontal error and error in depth in the present data set. (b) Histogram of the horizontal error (purple) and depth error (cyan) provided by nonlinear location (NLLoc).
The histograms of a horizontal location error (Fig. 6b, in purple) and depth error (Fig. 6c, in cyan) show that the overall uncertainty is small and has a median error of 1.1 km for the horizontal location (min Err H: 0.30 km; max Err H: 4 km) and 1.2 km for the depth location (min Err H: 0.1 km; max Err Z: 5 km).
Both horizontal and depth errors are influenced by several factors, including seismic network geometry, travel-time measurement accuracy and velocity model complexity. In general, we can affirm that the NLLoc algorithm can determine the epicentral location with a precision of ±1 km, even in the presence of errors in crustal velocities, as observed in Laporte et al. (2024), who address uncertainties in earthquake location using different techniques derived from the global sensitivity analysis (GSA) framework. A further indicator of the high quality of the seismic locations obtained is the azimuthal gap, which reflects how well the seismic stations are distributed around the earthquake location. Approximately 98.5 % of the events have gaps of less than 180°, with over 70 % of the events having a gap below than 90° and the median gap being 75° (see histogram in Fig. S4b). The root mean square (RMS) error is also a key parameter for assessing the earthquake location quality. The RMS is defined as the difference between the observed and calculated seismic wave arrival times at the stations. In the formula
the following applies:
-
tobs,i is the observed arrival time at the station i,
-
tcalc,i is the computed arrival time at the station i,
-
N is the total number of stations that recorded the event.
Low RMS error values indicate good agreement between observed and calculated arrival times, suggesting accurate seismic location. Conversely, high RMS values indicate larger discrepancies and potential location errors. According to Lienert and Havskov (1995), an RMS value between 0 and 1 s indicates a highly accurate location. In this study (see Fig. S4c for details), the maximum RMS values reach 0.89 s with a median of 0.27 s.
A further parameter providing indications about the reliability of seismic location reliability in the NLLoc (Lomax, 2000) software is the covariance matrix, a square matrix describing the variance and covariance between residuals, which is solved for four unknowns: spatial coordinates x and y, depth z, and time t. As provided in Fig. S5 in the Supplement, which shows histograms for the covariance values, Covx and Covy are small, with a median around 0.5 and a mean of around 0.75. In contrast, Covz and CovT exhibit higher values with median values of 1.5 and 1.9 and means around 2.8 and 3.2, respectively.
3.1.2 Epicentral comparison with the AFAD catalog
Figure 7 compares event location of each event, computing the distance between the epicenters identified in this study and those given in the AFAD catalog. The distance is computed using the haversine formula (short for half versed sine, see Robusto, 1957), with the Earth radius fixed at 6371 km, and the great circle distance between two points on a sphere based on their longitude and latitude.
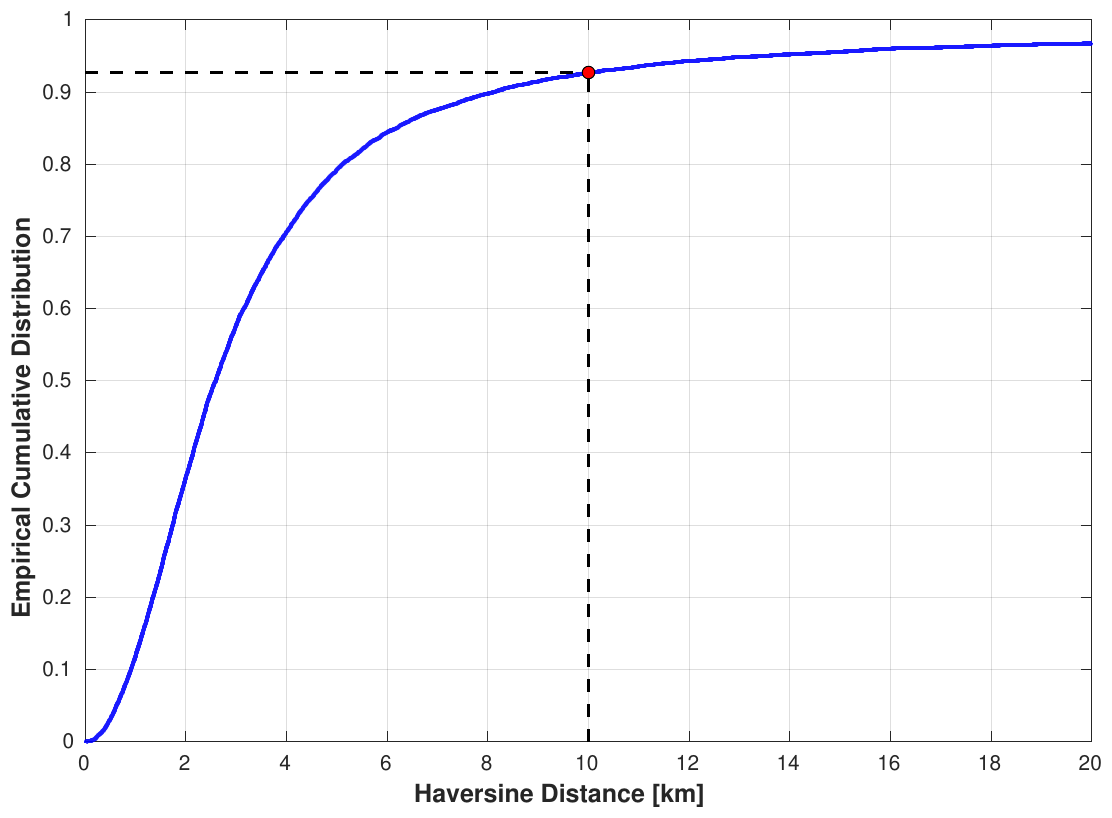
Figure 7Cumulative distribution function (CDF) with the haversine distance computed between the location obtained in this work and the one provided by the AFAD catalog. The dashed black line shows the distance at 10 km, corresponding to the 92.7 % of the CDF (blue curve); the red point shows the intercept.
The CDF shows that about 80 % of the entire data set has a location difference within 5 km, 92.7 % of the events are below 10 km (marked by the red intersection point), and over 97 % of the events are within 20 km. This again confirms the reliability and precision of the epicenters in our catalog.
3.1.3 Depth comparison with the AFAD catalog
We compared the hypocentral depth estimates obtained with NLLoc with those from the AFAD EAFZ catalog. The latter shows that most events are located at about 7 km depth (i.e., 80 % of the depths are between 6 and 8 km). Such clustering in the hypocentral depth estimates often indicates the presence of a high gradient in the velocity model used in the inversion procedure. This might also be the case for the AFAD catalog, as discussed by Çıvgın and Scordillis (2019).
As shown in Fig. 8a, our study (red histogram) shows a more even distribution over different depths compared to the AFAD catalog (Fig. 8b).
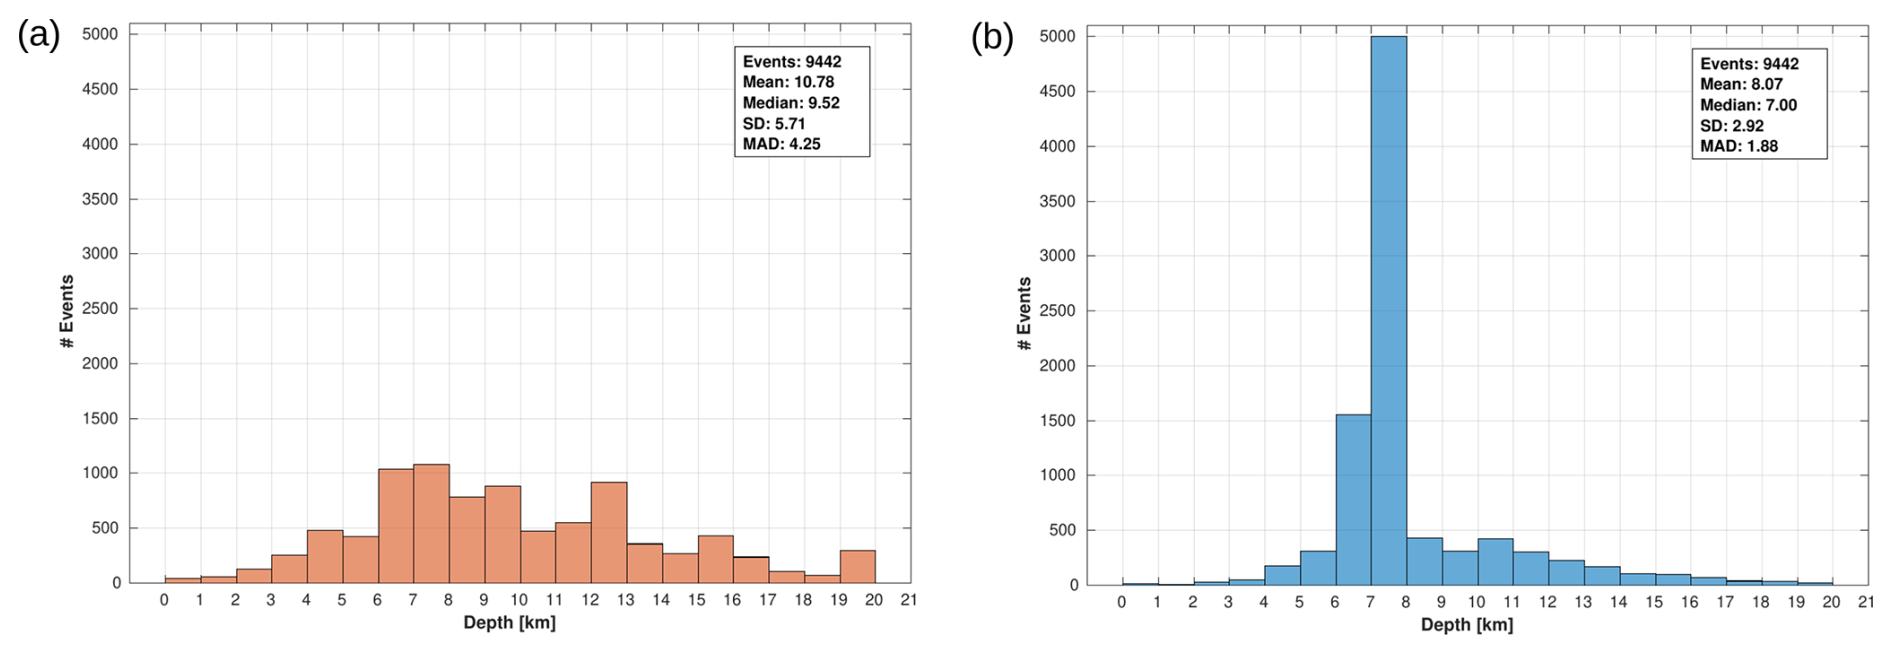
The median depth in this study is about 10 km, with no prominent peaks in the distribution. The relatively uniform depth estimates between 4 and 16 km appear to be consistent with the geometrical complexities of the fault segments in the 2023 Türkiye earthquake sequence (Gabriel et al., 2023).
3.2 Magnitude computation
To ensure a homogeneous magnitude for all considered earthquakes, we calibrated an ML (Richter, 1935) following a nonparametric approach (Savage and Anderson, 1995; Spallarossa et al., 2002; Bindi et al., 2018, 2019, 2020). Magnitudes were determined by applying station corrections to account for local site effects and to avoid biasing the amplitude measurements used for magnitude calculation. In our study (see Fig. S6 in the Supplement), corrections of more than 0.60 had to be applied to 2 out of 271 stations (TK.6802 and TK.6102) as they are located at sites with low Vs,30 (less than 250 m s−1). The nonparametric approach was applied to all data downloaded from the AFAD catalog.
With our analyses, we computed and provided the Wood–Anderson maximum amplitudes, which were then used to calibrate a EAFZ ML scale based on the following equation:
where Aij is the maximum Wood–Anderson amplitude (in mm) measured for event i recorded at the hypocentral distance Rij. MLi is the local magnitude of event i, A0 is the zero-magnitude attenuation function defined as a table of values an linearly interpolated between nodes n and n+1, with , while is the magnitude correction of station j. C can be either north–south or east–west, considering the two horizontal components to be independent measurements (Uhrhammer et al., 2011). As for the reference distance at which the attenuation function is anchored, we used a distance of Rref=17 km (Hutton and Boore, 1987), and the mean value of all stations was equal to zero. In Fig. S7 in the Supplement, we show the output of the nonparametrically calibrated magnitude, with the comparison between the local magnitude ML and the magnitude of the AFAD reference catalog ML ref.
Figure 9 compares the calibrated log A0 function performed in the EAF (listed in Table S2 in the Supplement) with the curve computed for southern California (Hutton and Boore, 1987).
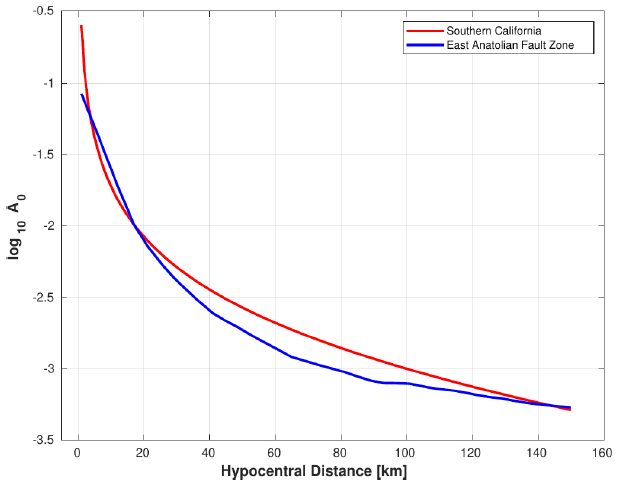
Figure 9Nonparametric magnitude attenuation function log A0 calibrated in the East Anatolian Fault (blue curve) and southern California (red curve).
In the distance range between 20 and 100 km, the EAF curve shows a stronger attenuation than the one computed for the southern California region but is similar at hypocentral distances of more than 100 km. For each ML value, the standard deviation is also computed (Fig. 10). Both the mean and the median magnitudes of the analyzed events considered are around 3.1, with over 90 % of the events having an ML value below 4 (Fig. 10a).
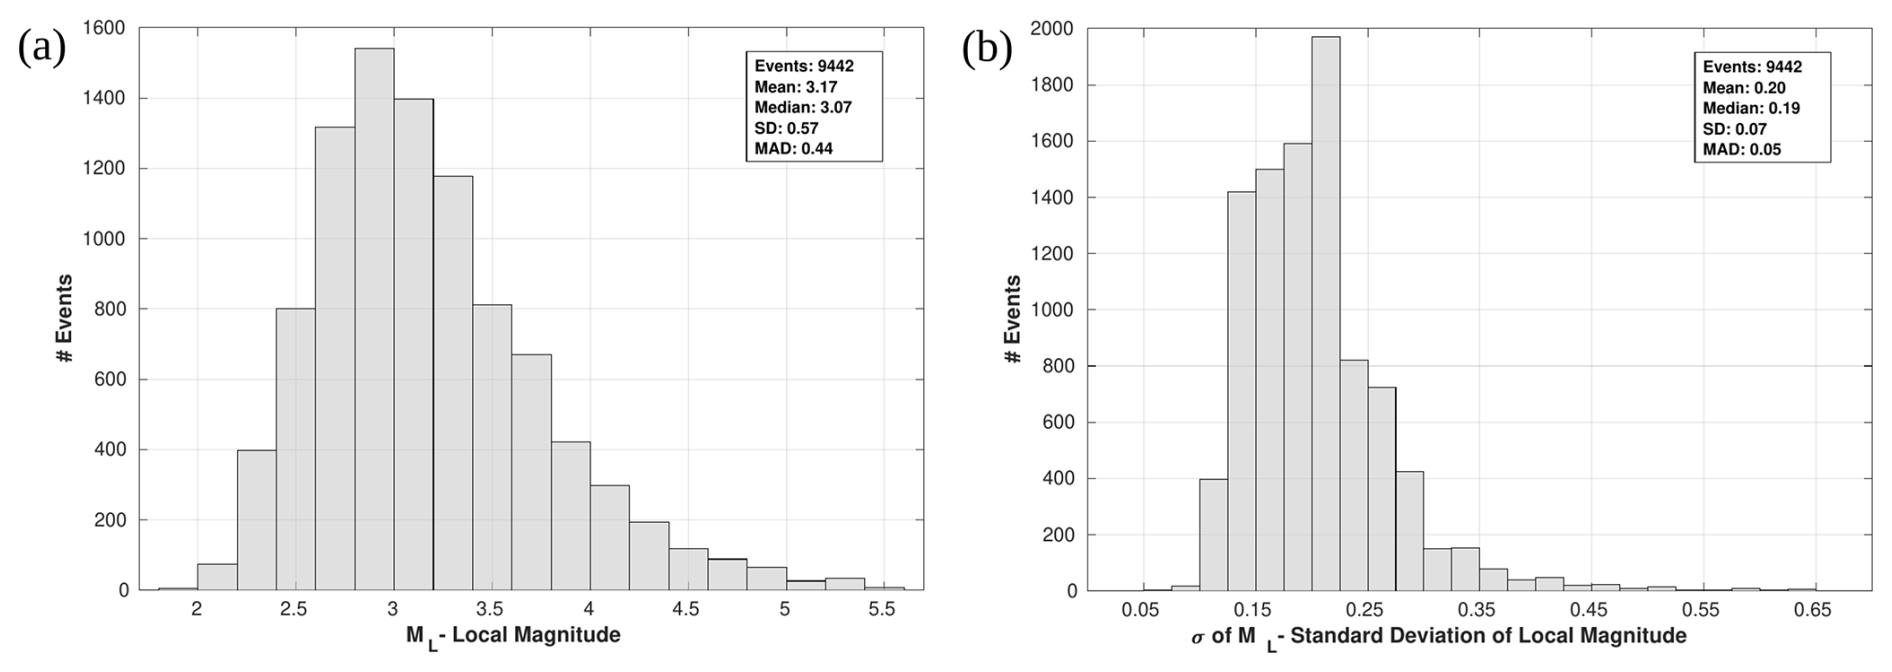
Figure 10Distribution of the local magnitude (a) and the standard deviation (b) of the events presented in this work.
The standard deviation graph shows a median of 0.19 (mean 0.20) with generally low values as less than 2 % of the events have a magnitude uncertainty greater than 0.40, which shows that the ML measurement is very accurate.
We have also analyzed the cumulative frequency magnitude (CFM) distribution analyzing the b value using the maximum likelihood approach (Aki, 1965), while the uncertainty in the b value is computed by means of a bootstrap approach (Efron, 1979) and the b positive by applying the procedure proposed by van der Elst (2021).
As written in Figs. S8 and S9 in the Supplement, the best estimate for the b value is 0.89±0.01 with a b positive of 0.85±0.01 considering the entire data set and 0.90±0.01 for both b value and b positive and considering the generalized inversion technique (GIT) distributed data set.
3.2.1 Magnitude comparison with the AFAD catalog
Figure 11 shows the comparison between ML distribution the present data set (Fig. 11a) and with the magnitude of the AFAD catalog (Fig. 11b). It is worth mentioning that the AFAD catalog lacks a uniform parameter to characterize the earthquake size, so other magnitude types (e.g., duration magnitude, MD) are used in addition to ML.
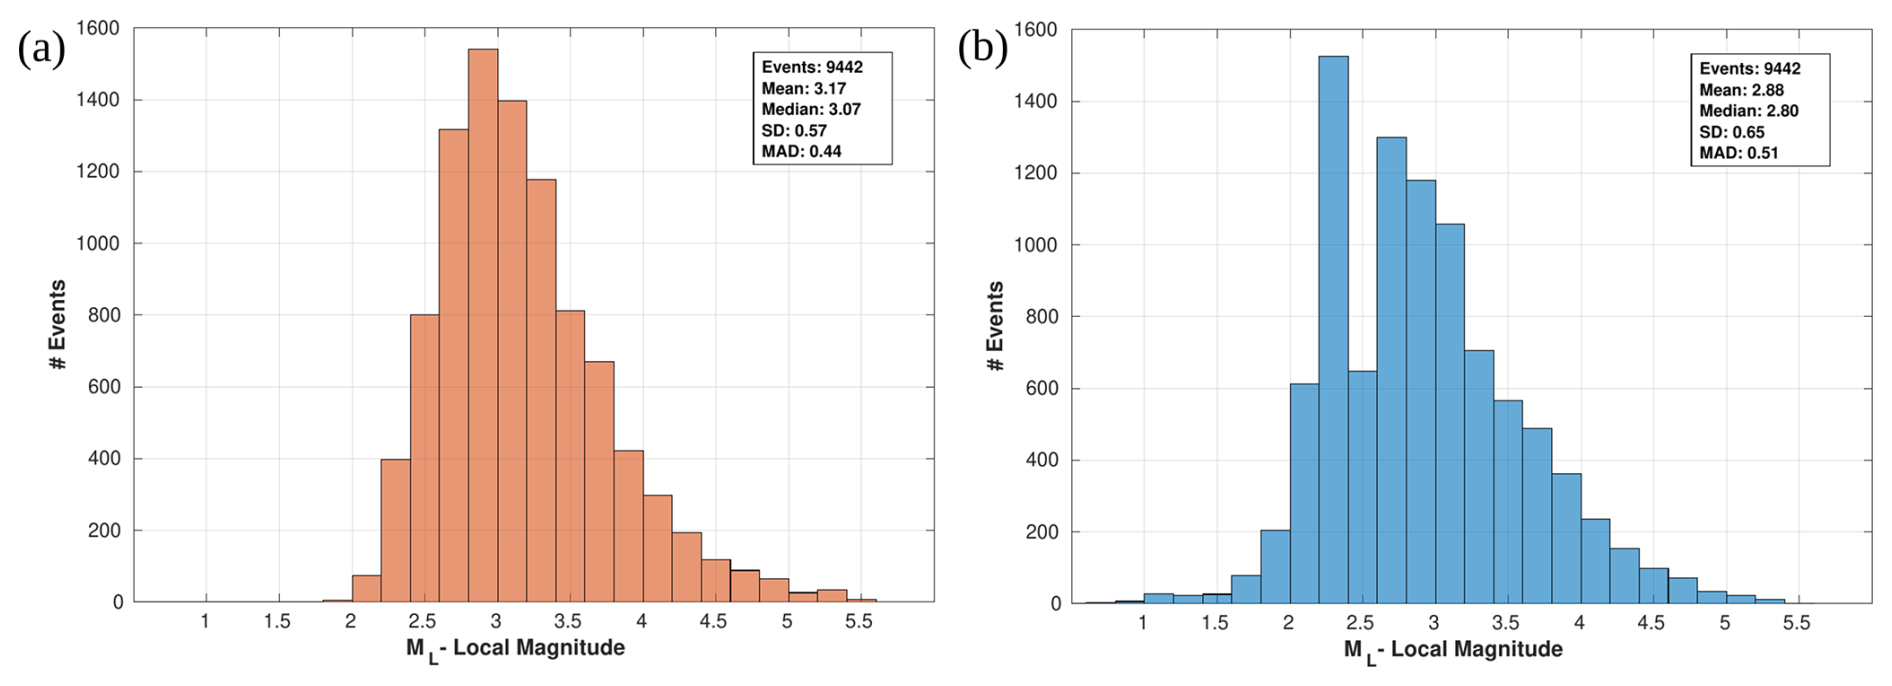
The magnitude distribution appears to be similar between the two data sets. However, the median value in the AFAD catalog (around 2.8) is lower than in our data set. Also, only a small part of the distribution, about 7 %, includes magnitude values above 4 compared to 10 % in our data set.
3.3 Strong motion parameters
As mentioned before, we applied P and S onset detection to estimate ML and extract different several features from the recordings, such as the peak displacement (PGD), the integral of the squared velocity (IVs2) evaluated over the S-wave window at local distances, the peak ground velocity (PGV), and the peak ground acceleration (PGA).
These features are extracted directly from the recordings and form the basis for the Rapid Assessment of MOmeNt and Energy Service (RAMONES) project (Spallarossa et al., 2021b, https://distav.unige.it/rsni/ramones.php, last access: 1 March 2024). This service provides the seismic moment M0 and radiated energy Er and relies on the measurement of specific ground-motion features directly from seismograms and their correction for propagation and site effects using empirical models previously calibrated for the region of interest.
Figure 12 shows an example of a three-component recording (N–S: north–south; E–W: east–west; Z: vertical) relative to the record ML 4.0 earthquake recorded at the station HASA that occurred on 20 March 2023 at 15:40:34 UTC.
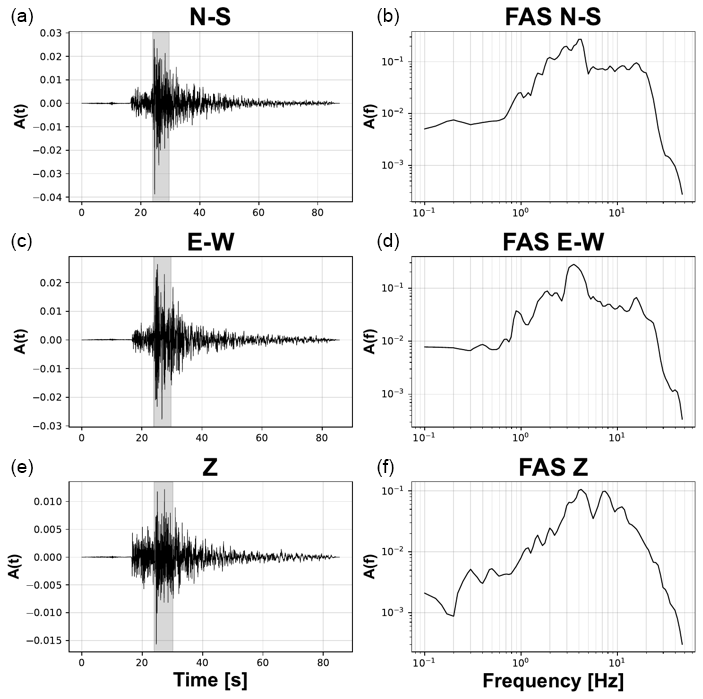
Figure 12Record for the ML 4.0 event occurred on 20 March 2023 at 15:40:34 UTC at the station HASA, where the portion of the signals for which FAS is computed is shown in gray. The panels on the left represent the seismic signals, and on the right are the corresponding FAS. North–south component is at the top (a, b), east–west component in the middle (c, d), and vertical component at the bottom (e, f).
Fourier amplitude spectra (FAS) are calculated for all three signal components using a recursive procedure based on a distance-dependent energy criterion to determine the S-wave time window length. A frequency-dependent threshold of the signal-to-noise ratio (SNR>2.5) is then used to select the spectral amplitudes for the inversion (Pacor et al., 2016).
The FAS calculation is performed on time windows starting 0.1 s before the S-wave onset and extending until 60 % of the total energy of the full spectrum is reached. The spectral amplitudes are calculated considering 98 frequencies equally spaced in the logarithmic scale in the range between 0.05 and 47.2 Hz. In addition to FAS, PGV and PGA values are also distributed as they provide a comprehensive overview of seismic motion and its potential impact on structures (Trifunac and Brady, 1975; Aki and Richards, 2002).
Figure 13a shows the values of log 10 PGA as a function of hypocentral distance, defined for different magnitude ranges.
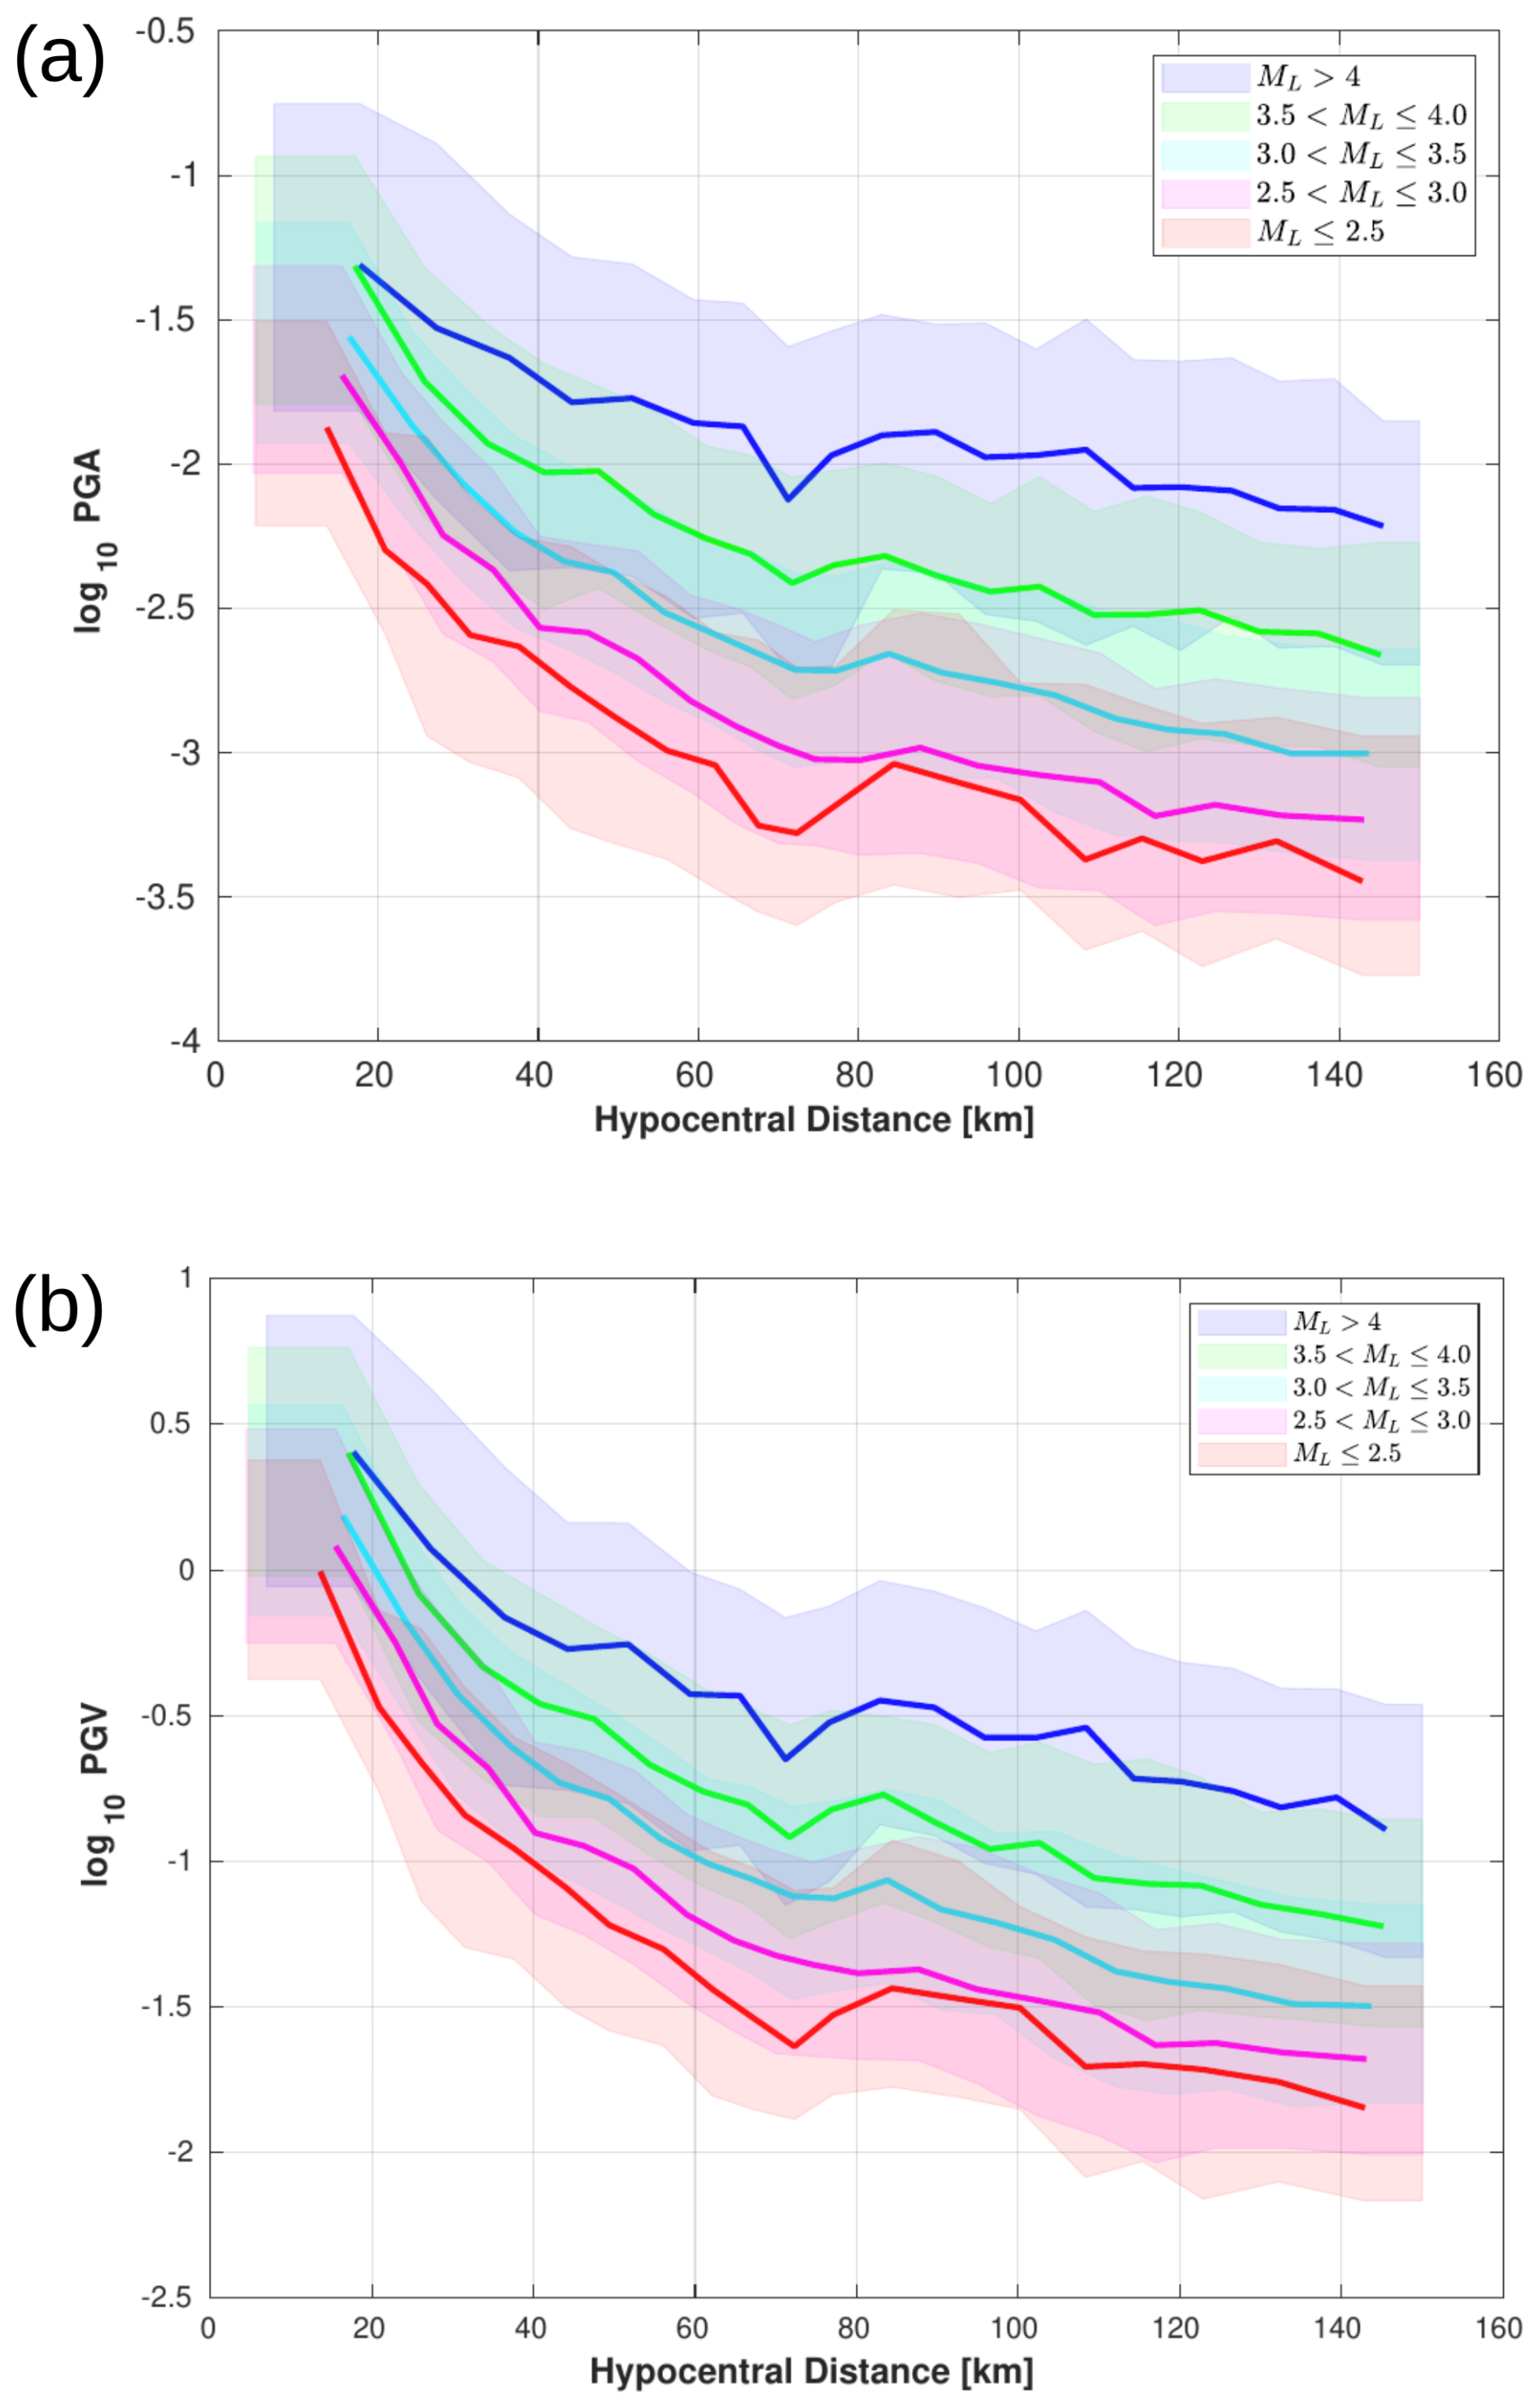
Figure 13Distribution of hypocentral distance of the log 10 PGA (a) and log 10 PGV (b) over the S-wave window. The trends of the parameters averaged over five narrow magnitude ranges as indicated in the panels (ML≦2.5, , , ; ML>4.0) are also shown. Shaded areas show the variability of each curve bounded by the lower quartile (25th percentile) and upper quartile (75th percentile).
The solid line represents the median curve for a given magnitude, while the shaded areas indicate the variability within each of hypocenter bin distance bounded by the lower quartile (25th percentile) and the upper quartile (75th percentile), respectively.
PGA here refers to PHA (peak horizontal acceleration), which represents the vector composition of the horizontal components of strong ground motion:
where PGAN–S is the component of PGA along the north–south direction, while PGAE–W is the component of PGA along the east–west direction.
The distribution of PGA and PGV with respect to the hypocentral distance can be found in Fig. S10 in the Supplement.
As expected, log 10 PGA values are the highest at small hypocentral distances with median values between −2 and −1 at hypocentral distances of less than 20 km. For intermediate hypocentral distances, between 20 and 80 km, log 10 PGA decreases and has median values between −3 and −1.5. For larger hypocentral distances, beyond 80 km, log 10 PGA values appears to reach a plateau. A similar trend is observed for PGV, as shown in Fig. 13b, in which the median log 10 PGV values are between −2 and 0.5. Curves representing five magnitude ranges (red: ML≦2.5, pink: , cyan: , green: , blue: >4.0) show that higher ML values correspond to higher PGA. This effect is particularly evident at hypocentral distances greater than 40 km, where the curves are clearly separated by magnitude.
Although the primary objective of this study is not a spatiotemporal investigation of seismicity in the EAFZ, we have mapped seismic activity from this catalog to obtain a general assessment of its distribution in relation to the major active geological structures. Figure 14 shows a map of our study area illustrating seismicity over time, with the first mainshock on 6 February 2023 at 01:17:35 UTC serving as a reference point (zero time). Light-green to green colors represent events that occurred further in the past (4 and 3 years before the mainshock, respectively), while bluish to blue colors indicate events closer to the first mainshock. Events in the immediate vicinity of the first mainshock are shown in shades of red, whereas aftershocks that occurred at a later date are shown in shades of orange.
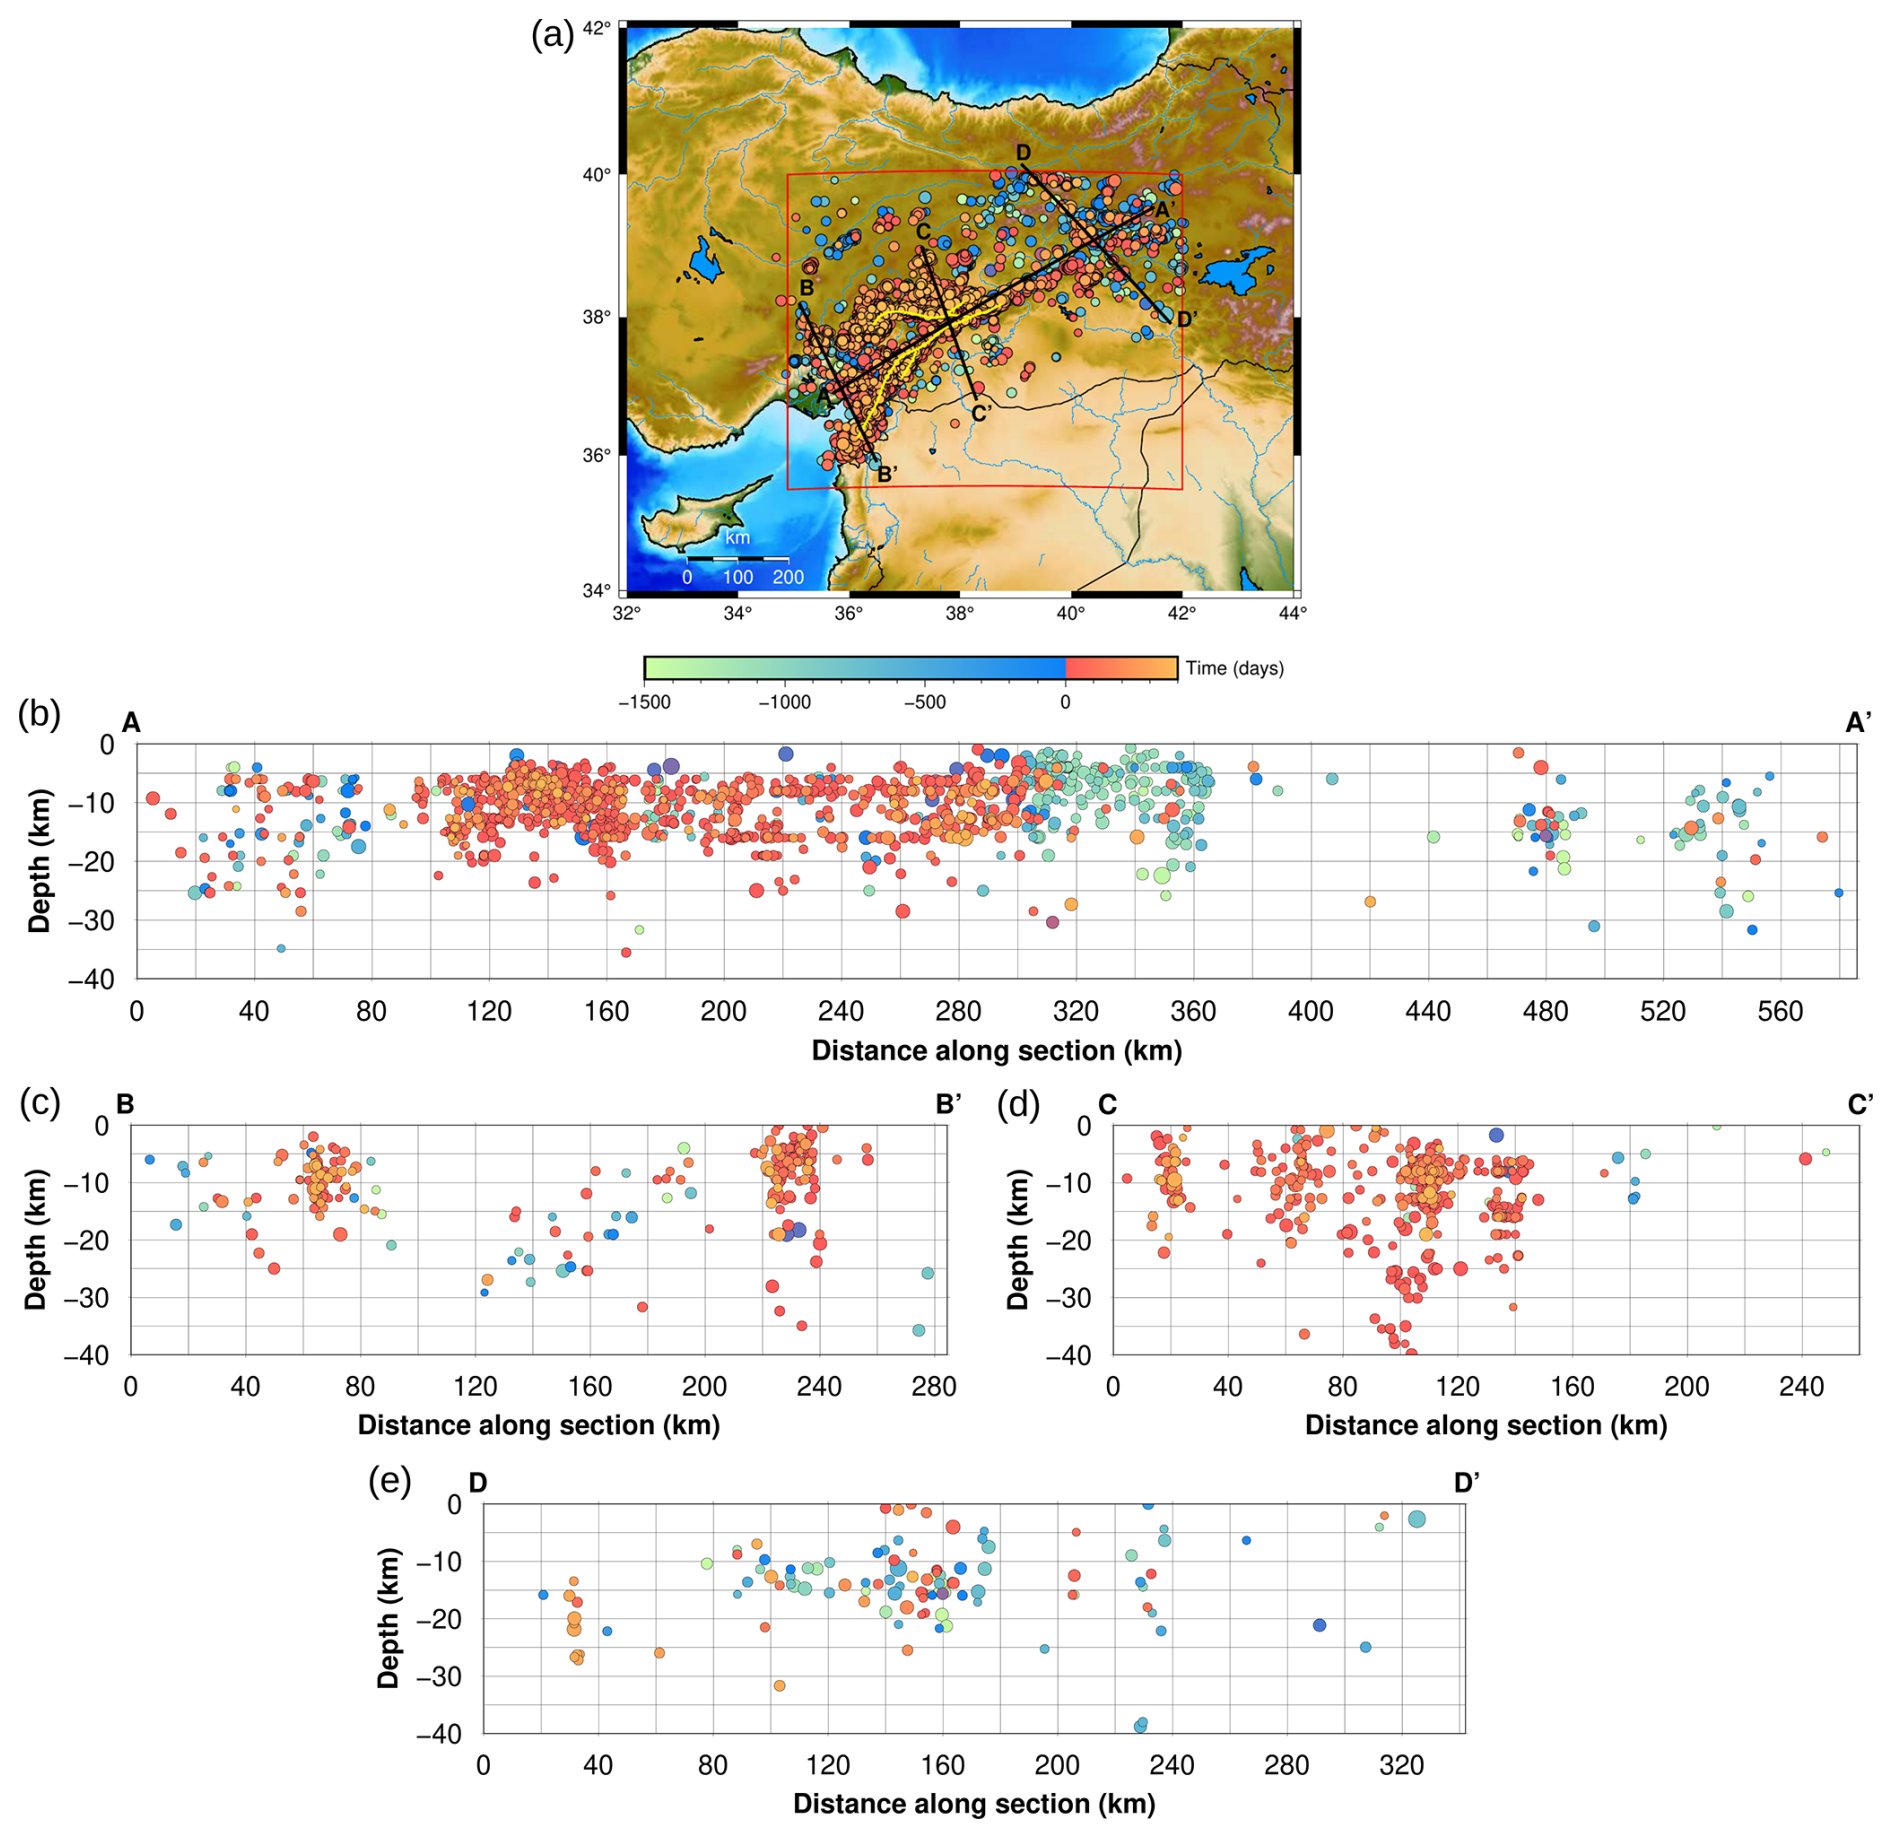
Figure 14(a) Seismicity map of the distributed catalog. The color scale represents the temporal evolution of the seismicity, while the size of the point is proportional to the magnitude. In red is the rectangle surrounding the study area, and in yellow we show the faults according to Melgar et al. (2023). Profiles are shown by black lines. (b) Section A–A′, 586 km length, 1303 events. (c) Section B–B′, 284 km length, 202 events. (d) Section C–C′, 260 km length, 433 events. (e) Section D–D′, 342 km length, 118 events.
The map shows that seismicity is mainly concentrated along the southern Nurdağı–Pazarcık Fault, where the first event occurred, and near the Sürgü Fault, where the Mw 7.6 Ekinözü earthquake struck on 6 February 2023 at 10:24:49 UTC. This high-magnitude event, which occurred on a separate fault structure, is considered to be part of a “doublet” rather than a traditional mainshock–aftershock sequence (see Taymaz et al., 2022). To better visualize the seismicity distribution, we extracted several cross sections.
Each profile was performed considering the events 10 km further to the left and 10 km to the right with respect to the line track. Vertical exaggeration of the cross sections is 2:1.
Section A–A′ (Fig. 14b) extends from the southwest to the northeast, running parallel to the average strike of the faults that generated the two main earthquakes. In the first 80 km of the section, the seismicity appears to be scattered, while beyond 100 km, a clear cluster emerges in the hypocentral area of Nurdağı. Here, the aftershocks are mainly concentrated at shallow depths (5–18 km), which is consistent with the results of previous investigations (e.g., Melgar et al., 2023; Rodríguez-Pérez and Zúñiga, 2025).
Beyond 300 km along the profile, the aftershocks become much more sporadic. The first notable cluster corresponds to the Mw 6.7 Elazığ earthquake, which occurred on 24 January 2020 at 17:55 UTC near the town of Sivrice (Taymaz et al., 2021). Our catalog includes the largest aftershock from this sequence (a Mw 5.1 event that occurred on 25 January 2020) along with 17 other events of Mw 4.0 or higher for a total of about 100 events in the 40 d following the mainshock. In the northeasternmost part of the section, we observe a “seismicity gap” followed by an almost even distribution of foreshocks and aftershocks at a depth of 10–30 km over the last 100 km. The presence of the seismic gap (also evident in Melgar et al., 2023) is solely due to the time frame of our catalog, as Karabulut et al. (2023) show that this section of the EAFZ has also experienced moderate-magnitude earthquakes. In particular, the 2010 Kovancılar earthquake ruptured approximately 30 km of the northeasternmost extent of the EAFZ (Tan et al., 2011). Additionally, the adjacent Palu segment (∼80 km long) partially ruptured between 2010 and 2011, producing two moderate-magnitude earthquakes (Mw 5.4 and Mw 6.1) and has remained continuously active.
Section B–B′ (Fig. 14c) runs along the southwestern part of our study area: in its northern section, we find a cluster associated with the second major event of 6 February 2023. As it progresses, the seismicity becomes more scattered at depths between 10 and 30 km before culminating in a well-defined cluster that extends over 20 km and is associated with aftershocks along the Nurdağı–Pazarcık Fault.
Section C–C′ (Fig. 14d), which is located near the center of our study area, is particularly significant as it transversely intersects the A–A' trace and the two main faults: the Nurdağı–Pazarcık Fault to the north and the Sürgü Fault to the south. Aftershocks are clearly visible along both faults, increasing in depth from north to south and reaching from the surface to a depth of about 40 km. In the last 100 km of the section, seismic activity is minimal, which is remarkable as this area is largely flat.
Finally, section D–D′ (Fig. 14e), which focuses on the northeastern part of the study area, shows diffuse seismicity at different depths, including both very shallow and deep events, as also noted by Güvercin (2023). The temporal evolution of seismicity in this section shows an almost even distribution of foreshocks and aftershocks.
In all these considerations, it should not be forgotten that the seismotectonic setting in the region is ruled by a complex fault network that accommodates the stress generated by the relative motion at the triple junction of the Anatolian, Arabian, and African plates (Güvercin et al., 2022). Therefore, while these considerations provide a general overview of seismicity, a more detailed understanding requires in-depth studies of the mechanical behavior of the different EAF segments (Palo and Zollo, 2024; Wang and Barbot, 2024).
The products derived by the procedures discussed above are available on a Zenodo repository at https://doi.org/10.5281/zenodo.13838992 (Colavitti et al., 2024) in the form of tables, relative to events, stations, PGA, PGV, and FAS. Open-access policy on these data has been adopted under the license CC BY 4.0. In this section, we thus provide a description of the tables that can be found in the repository, with the explanation of the fields relative to the presented data set.
5.1 Earthquake file
The distributed data set contains the following fields:
-
Id_AFAD is the earthquake reference number according to AFAD;
-
Date is the event date (three fields) in the format yyyy:mm:dd (year:month:day);
-
Time is the origin time (three fields) in the format hh:mm:ss (hours:minutes:seconds);
-
Ev_Lat is the earthquake latitude in decimal degrees (°);
-
Ev_Lon is the earthquake longitude in decimal degrees (°);
-
Ev_Depth is the depth in kilometers (km);
-
ML is the recalibrated local magnitude;
-
StdML is the ML standard deviation;
-
Rms is the root mean square error in local magnitude residuals at maximum likelihood or expectation hypocenter, expressed in seconds (s);
-
Erh is the horizontal error in kilometers (km), given by the NLLoc algorithm;
-
Erz is the vertical error in kilometers (km), given by the NLLoc algorithm;
-
Gap is the maximum azimuth gap between stations used for location, expressed in decimal degrees (°);
-
Np is the number of P-wave phases used for location;
-
Ns is the number of S-wave phases used for location;
-
Ntot is the total number of phases, both P- and S-wave, used for location;
-
CovX is the covariance matrix value along the X direction given by NLLoc;
-
CovY is the covariance matrix value along the Y direction given by NLLoc;
-
CovZ is the covariance matrix value along depth given by NLLoc;
-
CovT is the covariance matrix related to the observed arrival times by NLLoc.
5.2 Station file
The distributed station file contains the following fields:
-
FDSN_Sta_Code is the combined string code based on network–station–location–channel,
-
Sta_Lat is the latitude of the station in decimal degrees (°),
-
Sta_Lon is the longitude of the station in decimal degrees (°),
-
Sta_Elev is the elevation of the station in meters (m).
5.3 PGA and PGV file
The distributed PGA and PGV file contains the following fields:
-
Id_AFAD is the earthquake reference number according to AFAD,
-
FDSN_Sta_Code is the combined string code based on network–station–location–channel,
-
Dist_Hypo is the hypocentral distance event-station in kilometers (km),
-
PGV_Z is the peak ground velocity relative to the vertical component (cm s−1),
-
PGV_NS is the peak ground velocity in the N–S direction (cm s−1),
-
PGV_EW is the peak ground velocity in the E–W direction (cm s−1),
-
PGA_Z is the peak ground acceleration relative to the vertical component (cm s−2),
-
PGA_NS is the peak ground acceleration in the N–S direction (cm s−2),
-
PGA_EW is the peak ground acceleration in the E–W direction (cm s−2).
5.4 FAS file
We also report the acceleration Fourier amplitude spectra (FAS) for 98 frequency values from 0.05–47.2 Hz, equally spaced on the logarithmic scale.
Each file contains the following fields:
-
Id_AFAD is the AFAD catalog reference ID,
-
Ev_Lat is the earthquake latitude in decimal degrees (°),
-
Ev_Lon is the earthquake longitude in decimal degrees (°),
-
Depth is the hypocentral depth in kilometers (km),
-
ML is the recalculated local magnitude,
-
FDSN_Sta_Code is the combined string code based on network–station–location–channel,
-
Sta_Lat is the station latitude in decimal degrees (°),
-
Sta_Lon is the station longitude in decimal degrees (°),
-
Sta_Elev is the elevation of the station in meters (m),
-
Dist_Hypo is the hypocentral distance event station in kilometers (km),
-
FAS_xxx_Z is the acceleration FAS at xxx Hz relative to the vertical component (cm s−1),
-
FAS_xxx_NS is the acceleration FAS at xxx Hz in the N–S direction (cm s−1),
-
FAS_xxx_EW is the acceleration FAS at xxx Hz the E–W direction (cm s−1),
where xxx refers to a frequency between 0.05 and 47.2 Hz.
The frequencies used (in Hz) are as follows: 0.05, 0.08, 0.10, 0.13, 0.15, 0.17, 0.20, 0.22, 0.25, 0.28, 0.30, 0.32, 0.35, 0.38, 0.40, 0.43, 0.45, 0.47, 0.50, 0.53, 0.56, 0.59, 0.63, 0.67, 0.71, 0.75, 0.79, 0.84, 0.89, 0.94, 1.00, 1.06, 1.12, 1.19, 1.26, 1.33, 1.41, 1.49, 1.58, 1.67, 1.77, 1.88, 1.99, 2.11, 2.23, 2.37, 2.51, 2.65, 2.81, 2.98, 3.15, 3.34, 3.54, 3.75, 3.97, 4.21, 4.46, 4.72, 5.00, 5.30, 5.61, 5.94, 6.29, 6.67, 7.06, 7.48, 7.92, 8.39, 8.89, 9.42, 9.98, 10.57, 11.19, 11.86, 12.56, 13.30, 14.09, 14.93, 15.81, 16.75, 17.74, 18.79, 19.91, 21.08, 22.33, 23.66, 25.06, 26.54, 28.12, 29.78, 31.55, 33.42, 35.40, 37.49, 39.72, 42.07, 44.56, and 47.20.
The 2019–2024 EAFZ high-quality data set offers numerous potential application and prospects. As we mentioned above, one of its main applications is spectral decomposition using the generalized inversion technique (GIT), first introduced by Andrews (1986), Iwata and Irikura (1988), and Castro et al. (1990). The GIT is a reliable approach for the simultaneous investigation of source, path, and site contributions to the observed ground motions in the frequency domain and plays a crucial role in improving the understanding of seismic processes and earthquake hazard assessment. This method is based on linear and time-invariant assumptions for which the output is given by the convolution between the input with the transfer function of the system (Bindi et al., 2023b).
As we can see from Fig. 15, which shows the coverage map of the data set at 1 Hz, the study area is well sampled and dense in rays, especially along the main tectonic alignments of the EAF.
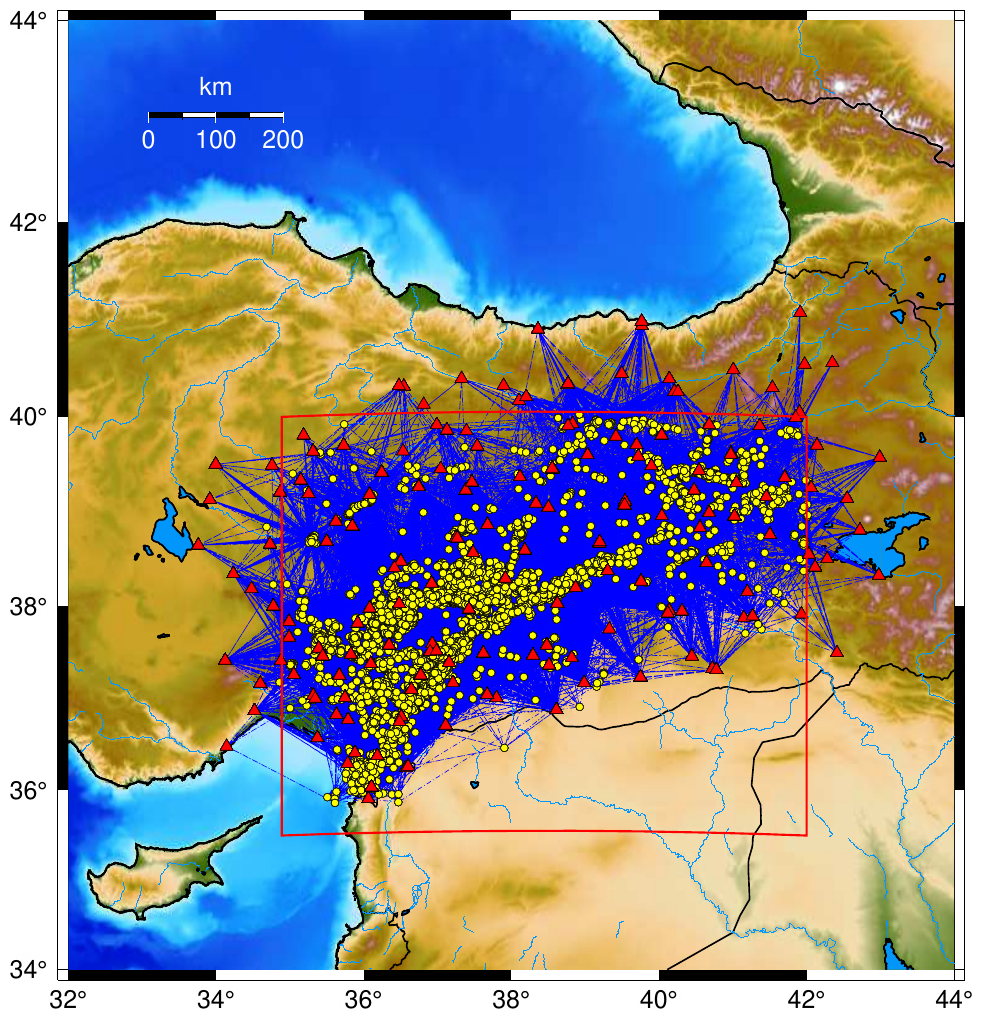
Figure 15Ray coverage map at f=1 Hz. Events are represented by yellow dots, stations by red triangles, and rays by blue lines.
One of the long-term objectives of the work is to provide a solid basis for the study of source parameters similarly to the efforts of the Southern California Earthquake Center (SCEC) community. There, spectral decomposition was applied to isolate source spectra of events belonging to the 2019 Ridgecrest seismic sequence (Bindi et al., 2023b), with a comparison study providing an epistemic analysis of the results uncertainties (Bindi et al., 2023c). From a spatial perspective, the data set provides excellent sampling across various frequencies (see Figs. S11 and S13 in the Supplement).
Ensuring comprehensive ray coverage is essential to obtain robust and meaningful seismological results and is crucial to the success of GIT studies as it directly impacts the accuracy and reliability of the derived source, path, and site parameters.
Such dense ray coverage can also benefit the tomography community, especially for application such as local earthquake tomography (LET), which uses first arrival times (Gökalp, 2007, 2012; Ozer et al., 2019; Medved et al., 2021; Güvercin, 2023), or attenuation tomography studies (Koulakov et al., 2010; Toker and Şakir, 2022) in the EAFZ and surrounding regions. In this sense, the disseminated data set is highly valuable in terms of both the amount of data and the quality of earthquake location and dense frequency sampling, which can help us improve the mapping of seismic structures in such a complex geological area.
The presented data set can be a valuable resource for the development of the STATION (Seismic sTATion and sIte amplificatiON, https://distav.unige.it/rsni/station.php, last access: 1 March 2024) service (Tarchini et al., 2025), which is a product based on the exchange and dissemination of seismological data from seismic stations in Italy and neighboring regions. Starting from an automatic picking procedure of P and S phases, STATION guarantees a quasi-automatic elaboration of a selection of data records and is finalized by the calculation of horizontal-to-vertical spectral ratios (HVSRs) and station-specific ML residuals. A similar procedure has already been started for the EAFZ using this data set (see Fig. S13), with the aim of precise site characterization.
In addition, the disseminated data set can significantly contribute to the development of the existing ground-motion prediction equations (GMPEs) in the EAFZ and, thus, to some extent to the improvement of earthquake hazard assessment (Akkar and Çağnan, 2010; Kale et al., 2015).
With over 5 years of recorded seismicity, the data set also enables the study of variations in the Q parameter, which quantifies the attenuation of seismic energy through coda waves (Sertçelik, 2012) or, moving to higher frequencies supports the investigation of the kappa (κ) parameter, which depends on the geological characteristics of the sites (Biro, 2024). In this context, recent studies in central Italy (Castro et al., 2022b, 2025) based on high-quality data sets that include low to moderate seismicity (Spallarossa et al., 2022) have shown that the temporal study of κ can provide insights into the role of fluid circulation and contribute to the monitoring of the seismic cycle.
One of the ultimate goals for which the data set was developed is to analyze the spatiotemporal evolution of seismicity and to investigate whether a preparatory process for preceded the 6 February 2023, Mw 7.8 earthquake (see Kwiatek et al., 2023; Picozzi et al., 2023b) and to understand how the identification of microseismicity is crucial for the detection and triggering of major events.
In the last few years, a set of physics-based features aimed at intercepting the preparatory phase of strong earthquakes have been developed (Picozzi et al., 2022, 2023a). In general, seismic sequences are analyzed based on the time–space intervals between earthquakes (Zaliapin et al., 2008; Zaliapin and Ben-Zion, 2016), which serve as an important tool for identifying seismic crises (see Fig. S14 in the Supplement).
For a more detailed investigation of the spatiotemporal evolution, a future study will focus on analyzing the systematic deviations of the PGAs generated by each earthquake from the values predicted by a reference GMM calibrated for background seismicity, referred to as event-specific ground-motion anomalies (eGMSs), as shown in Picozzi et al. (2024).
Finally, the data set can be effectively integrated with geodetic investigations such as interferometric synthetic aperture radar (InSAR), which provides pre-, co-, and post-seismic deformation images and offer valuable insights into slow-slip events and fault behavior (for EAF, see An et al., 2023; He et al., 2023).
By integrating InSAR data with seismological information, it is indeed possible to gain a more comprehensive understanding of active tectonic mechanisms and fault dynamics in the region, which ultimately improves earthquake process analysis and seismic risk assessment.
Most of the figures were generated using MATLAB software (https://www.mathworks.com, MathWorks, 2023). We used Generic Mapping Tools (Wessel et al., 2013) to produce Figs. 1, 14, and 15. Figure 12 was made using the ObsPy package (Beyreuther et al., 2010), a Python framework for processing seismological data. The codes used to generate the figures and statistics in this study is openly available on a Zenodo repository at https://doi.org/10.5281/zenodo.15775474 (Colavitti et al., 2025) under the CC BY 4.0 license. Seismic waveforms, pick observations and P and S travel times are available on request by contacting the author. The data set is freely available on a Zenodo repository at https://doi.org/10.5281/zenodo.13838992 (Colavitti et al., 2024) under the CC BY 4.0 license.
This work presents a seismic catalog that covers the period between 1 January 2019 and 29 February 2024 and includes both the pre- and post-seismic periods of the devastating 6 February 2023 earthquake sequence that struck southern and central Türkiye and northern and western Syria along the EAFZ. The data set focuses on small to moderate earthquakes in the ML range of 2.0–5.5 and is intended as a valuable tool for researchers investigating seismic source characterization and strong motion parameters.
The high-quality catalog of this study was achieved with the application of the CASP (Scafidi et al., 2019) software, which allowed the identification of 270 704 seismic phases (148 223 P-wave and 122 481 S-wave first arrivals) for a total of 9442 events recorded by 271 stations. All events were located with the NLLoc algorithm (Lomax et al., 2000, 2012). An initial velocity model specifically suited to the EAFZ was used, resulting in reliable earthquake locations with an uncertainty of ±1 km for both horizontal and depth location. Notably, our depth estimates differ from those of the AFAD reference catalog and appear to be consistent with the geometrical complexities of the fault segments involved in the 2023 Türkiye earthquake sequence (Palo and Zollo, 2024). In addition, the distributed catalog contains ML values calibrated using a nonparametric approach (Bindi et al., 2020).
The last section of this paper deals with possible applications of the data set. It was developed specifically for spectral decomposition, allowing for the separation and analysis of key factors such as source characteristics, attenuation, and site effects. In addition, the new event locations can support research on attenuation in terms of the Q factor or κ parameter. An important long-term goal of the catalog is to understand the spatiotemporal evolution of seismicity, identifying potential proxies to intercept the preparatory phase of strong earthquakes (Picozzi et al., 2023b).
We strongly believe that the creation of high-quality, standardized, and open-source seismic data sets, including FAS and widely used strong motion parameters such as PGA and PGV, is essential for the advancement of seismological and earthquake engineering research.
The supplement related to this article is available online at https://doi.org/10.5194/essd-17-3089-2025-supplement.
DSp, DB, and MP conceptualized the study. DSp developed the code used to compile the disseminated data set. DB recalibrated the local magnitude. LC developed the quality checks and created the images of the manuscript, with the contribution of DSc and GT.
LC organized the publication and, with the contribution of DB, GT, DSc, MP, and DSp, wrote the first draft of the manuscript. All authors participated to the finalization of the article.
The contact author has declared that none of the authors has any competing interests.
Publisher's note: Copernicus Publications remains neutral with regard to jurisdictional claims made in the text, published maps, institutional affiliations, or any other geographical representation in this paper. While Copernicus Publications makes every effort to include appropriate place names, the final responsibility lies with the authors.
The authors are very grateful to the handling topic editor Andrea Rovida and two anonymous reviewers for their valuable comments that improved this manuscript.
This research is supported by the PREPARED (PREparatory Phase of lARge earthquakes from seismic information and gEodetic Displacement) project, project code 2022ZHWC9, in the frame of Bando PRIN 2022 – Progetto di Rilevante Interesse Nazionale (DD MUR no. 746, 31 May 2023).
This paper was edited by Andrea Rovida and reviewed by two anonymous referees.
Abercrombie, R. E.: Investigating uncertainties in empirical Green's function analysis of earthquake source parameters, J. Geophys. Res.-Sol. Ea., 120, 4263–4277, https://doi.org/10.1002/2015JB011984, 2015.
AFAD: Disaster and Emergency Management Presidency. National Seismic Network of Turkey (DDA), International Federation of Digital Seismograph Networks, http://tdvm.afad.gov.tr/ (last access: February 2024), 1990.
Akaike, H.: Markovian representation of stochastic processes and its application to the analysis of autoregressive moving average process, Ann. I. Stat. Math., 26, 363–387, https://doi.org/10.1007/BF02479833, 1974.
Aki, K.: Maximum Likelihood Estimate of b in the Formula and its confidence limits, B. Earthq. Res., 43, 237–239, 1965.
Aki, K. and Richards, P. G.: Quantitative seismology, 2nd edn., Univ. Sci. Books, Sausalito, California, 700 pp., ISBN 0935702962, 2002.
Akkar, S. and Çağnan, Z.: A Local Ground-Motion Predictive Model for Turkey, and Its Comparison with Other Regional and Global Ground-Motion Models, B. Seismol. Soc. Am., 100, 2978–2995, https://doi.org/10.1785/0120090367, 2010.
Ambraseys, N.: Temporary seismic quiescence: SE Turkey, Geophys. J. Int., 96, 11–331, https://doi.org/10.1111/j.1365-246X.1989.tb04453.x., 1989.
An, Q., Feng, G., He, L., Xiong, Z., Lu, H., Wang, X., and Wei, J.: Three-Dimensional Deformation of the 2023 Turkey Mw 7.8 and Mw 7.7 Earthquake Sequence Obtained by Fusing Optical and SAR Images, Remote Sens., 15, 2656, https://doi.org/10.3390/rs15102656, 2023.
Andrews, D. J.: Objective determination of source parameters and similarity of earthquakes of different size, Earthquake Source Mechanics, 37, 259–267, https://doi.org/10.1029/GM037p0259, 1986.
Baltay, A., Abercrombie, R., Chu, S., and Taira, T.: The SCEC/USGS community stress drop validation study using the 2019 Ridgecrest earthquake sequence, Seismica, 3, 1, https://doi.org/10.26443/seismica.v3i1.1009, 2024.
Beyreuther, M., Barsch, R., Krischer, L., Megies, T., Behr, Y., and Wassermann, J.: ObsPy: A Python Toolbox for Seismology, Seismol. Res. Lett., 81, 530–533, https://doi.org/10.1785/gssrl.81.3.530, 2010.
Bindi, D., Spallarossa, D., Picozzi, M., Scafidi, D., and Cotton, F.: Impact of magnitude selection on Aleatory variability associated with ground-motion prediction equations: Part I – Local, energy, and moment magnitude calibration and stress-drop variability in Central Italy, B. Seismol. Soc. Am., 108, 1427–1442, https://doi.org/10.1785/0120170356, 2018.
Bindi, D., Picozzi, M., Spallarossa, D., Cotton, F., and Kotha, S. R.: Impact of magnitude selection on Aleatory variability associated with ground motion prediction equations: Part II – Analysis of the between-event distribution in central Italy, B. Seismol. Soc. Am., 109, 251–262, https://doi.org/10.1785/0120180239, 2019.
Bindi, D., Zaccarelli, R., and Kotha, S. R.: Local and Moment Magnitude Analysis in the Ridgecrest Region, California: Impact on Interevent Ground-Motion Variability, B. Seismol. Soc. Am., 111, 339–355, https://doi.org/10.1785/0120200227, 2020.
Bindi, D., Zaccarelli, R., Cotton, F., Weatherill, G., and Kotha, S. R.: Source Scaling and Ground Motion Variability along the East Anatolian Fault, Seism. Rec., 34, 311–321, https://doi.org/10.1785/0320230034, 2023a.
Bindi, D., Spallarossa, D., Picozzi, M., Oth, A., Morasca, P., and Mayeda, K.: The Community Stress-Drop Validation Study – Part I: Source, Propagation, and Site Decomposition of Fourier Spectra, Seismol. Res. Lett., 94, 1980–1991, https://doi.org/10.1785/0220230019, 2023b.
Bindi, D., Spallarossa, D., Picozzi, M., Oth, A., Morasca, P., and Mayeda, K.: The Community Stress-Drop Validation Study – Part II: Uncertainties of the Source Parameters and Stress-Drop Analysis, Seismol. Res. Lett., 94, 1992–2002, https://doi.org/10.1785/0220230020, 2023c.
Biro, Y.: Magnitude dependency of spectral decay parameter kappa in East Anatolian Fault related events, 18th World Conference on Earthquake Engineering, 18th World Conference on Earthquake Engineering, Milan, Italy, 30 June–5 July 2024, https://proceedings-wcee.org/view.html?id=23577&conference=18WCEE (last access: 6 March 2025), 2024.
Castro, R. R., Anderson, J. G., and Singh, S. K.: Site response, attenuation and source spectra of S waves along the Guerrero, Mexico, subduction zone, B. Seismol. Soc. Am., 80, 1481–1503, 1990.
Castro, R. R., Colavitti, L., Vidales-Basurto, C. A., Pacor, F., Sgobba, S., and Lanzano, G.: Near-source attenuation and spatial variability of the spectral decay parameter kappa in central Italy, B. Seismol. Soc. Am., 93, 2299–2310, https://doi.org/10.1785/0220210276, 2022a.
Castro, R. R., Spallarossa, D., Pacor, F., Colavitti, L., Lanzano, G., Vidales-Basurto, C. A., and Sgobba, S.: Temporal variation of the spectral decay parameter kappa detected before and after the 2016 main earthquakes in central Italy, B. Seismol. Soc. Am., 112, 3037–3045, https://doi.org/10.1785/0120220107, 2022b.
Castro, R. R., Colavitti, L., Pacor, F., Lanzano, G., Sgobba, S., and Spallarossa, D.: Temporal variation of S-wave attenuation during the 2009 L'Aquila, Central Italy, seismic sequence, Geophys. J. Int., 240, 317–328, https://doi.org/10.1093/gji/ggae380, 2025.
Çıvgın, B. and Scordillis, E. M.: Investigating the consistency of online earthquake catalogs of Turkey and surroundings, J. Seismol., 23, 1255–1278, https://doi.org/10.1007/s10950-019-09863-w, 2019.
Colavitti, L., Bindi, D., Tarchini, G., Scafidi, D., Picozzi, M., and Spallarossa, D.: Data Set of selected strong motion parameters and Fourier Amplitude Spectra for the East Anatolian Fault Zone, Türkiye (January 2019–February 2024), Zenodo [data set], https://doi.org/10.5281/zenodo.13838992, 2024.
Colavitti, L., Bindi, D., Tarchini, G., Scafidi, D., Picozzi, M., and Spallarossa, D.: Code release for: “A high-quality data set for seismological studies in the East Anatolian Fault Zone, Türkiye” (v1.0.0), Zenodo [code], https://doi.org/10.5281/zenodo.15775474, 2025.
Cotton, F., Archuleta, R., and Causse, M. What is Sigma of the Stress Drop?, Seismol. Res. Lett., 84, 42–48, https://doi.org/10.1785/0220120087, 2013.
Dal Zilio, L. and Ampuero, J. P.: Earthquake doublet in Turkey and Syria, Commun. Earth Environ. 4, 71, https://doi.org/10.1038/s43247-023-00747-z, 2023.
Efron, B.: Bootstrap Methods: Another Look at the jackknife, Ann. Stat., 7, 1–26, https://doi.org/10.1214/aos/1176344552, 1979.
Gabriel, A. A., Ulrich, T., Merchandon, M., Biemiller, J., and Rekoske, J.: 3D Dynamic Rupture Modeling of the 6 February 2023, Kahramanmaraş, Turkey Mw 7.8 and 7.7 Earthquake Doublet Using Early Observations, Seism. Rec., 3, 342–356, 2023.
Gökalp, H.: Local earthquake tomography of the Erzincan Basin and the surrounding area in Turkey, Ann. Geophys., 50, 707–724, https://doi.org/10.4401/ag-3052, 2007.
Gökalp, H.: Tomographic imaging of the seismic structure beneath the east Anatolian Plateau, eastern Turkey, Pure Appl. Geophys., 169, 1749–1776, https://doi.org/10.1007/s00024-011-0432-x, 2012.
Güvercin, S. E.: A local earthquake tomography on the EAF shows dipping fault structure, Turk. J. Earth Sci., 32, 5, https://doi.org/10.55730/1300-0985.1845, 2023.
Güvercin, S. E., Karabulut, H., Konca, A. O., Doğan, U., and Ergintav, S.: Active seismotectonics of the East Anatolian Fault, Geophys. J. Int., 230, 50–69, https://doi.org/10.1093/gji/ggac045, 2022.
He, L., Feng, G., Xu, W., Wang, Y., Xiong, Z., Gao, H., and Liu, X.: Coseismic kinematics of the 2023 Kahramanmaras, Turkey earthquake sequence from InSAR and optical data, Geophys. Res. Lett., 50, e2023GL104693, https://doi.org/10.1029/2023GL104693, 2023.
Hutton, L. K. and Boore, D. M.: The ML scale in southern California, B. Seismol. Soc. Am., 77, 2074–2094, https://doi.org/10.1785/BSSA0770062074, 1987.
Iwata, T. and Irikura, K.: Source parameters of the 1983 Japan Sea earthquake sequence, J. Phys. Earth, 36, 155–184, https://doi.org/10.4294/jpe1952.36.155, 1988.
Kale, Ö, Akkar, S., Ansari, A., and Hamzehloo, H.: A Ground-Motion Predictive Model for Iran and Turkey for Horizontal PGA, PGV, and 5 % Damped Response Spectrum: Investigation of Possible Regional Effects, B. Seismol. Soc. Am., 105, 963–980, https://doi.org/10.1785/0120140134, 2015.
Karabulut, H., Güvercin, S. E., Hollingsworth, J., and Özgün Konca, A.: Long silence on the East Anatolian Fault Zone (Southern Turkey) ends with devastating double earthquakes (6 February 2023) over a seismic gap: implications for the seismic potential in the Eastern Mediterranean region, J. Geol. Soc., 180, jgs2023–021, https://doi.org/10.1144/jgs2023-021, 2023.
Kissling, E., Ellsworth, W. L., Eberhart-Phillips, D., and Kradolfer, U.: Initial reference models in local earthquake tomography, J. Geophys. Res.-Sol. Ea., 99, 19635–19646, https://doi.org/10.1029/93JB03138, 1994.
KO – Kandilli Observatory and Earthquake Research Institute: Boğaziçi University (KOERI) [Data set], International Federation of Digital Seismograph Networks, https://doi.org/10.7914/SN/KO, 1971.
Konno, K. and Ohmachi, T.: Ground-motion characteristics estimated from spectral ratio between horizontal and vertical components of microtremor, B. Seismol. Soc. Am., 88, 228–241, https://doi.org/10.1785/BSSA0880010228, 1998.
Koulakov, I., Bindi, D., Parolai, S., Grosser, H., and Milkereit, C.: Distribution of Seismic Velocities and Attenuation in the Crust beneath the North Anatolian Fault (Turkey) from Local Earthquake Tomography, B. Seismol. Soc. Am., 100, 207–224, https://doi.org/10.1785/0120090105, 2010.
Kwiatek, G., Martínez-Garzón, P., Becker, D., Dresen, G., Cotton, F., Beroza, G., Acarel, D., Ergintav, S., and Bohnoff, M.: Months-long seismicity transients preceding the 2023 Mw 7.8 Kahramanmaraş, earthquake, Türkiye, Nat. Commun., 14, 7534, https://doi.org/10.1038/s41467-023-42419-8, 2023.
Laporte, M., Letort, J., Bertin, M., and Bollinger, L.: Understanding earthquake location uncertainties using global sensitivity analysis framework, Geophys. J. Int., 237, 1048–1060, https://doi.org/10.1093/gji/ggae093, 2024.
Lienert, B. R. and Havskov, J.: A Computer Program for Locating Earthquakes Both Locally and Globally, Seismol. Res. Lett., 66, 26–36, https://doi.org/10.1785/gssrl.66.5.26, 1995.
Lomax, A., Virieux, J., Volant, P., and Berge-Thierry, C.: Probabilistic earthquake location in 3D and layered models: Introduction of a Metropolis-Gibbs method and comparison with linear locations, in: Advances in Seismic Event Location – Modern Approaches in Geophysics, edited by: Thurber, C. H. and Rabinowitz, Kluwer Academic Publishers, 101–134, https://doi.org/10.1007/978-94-015-9536-0_5, 2000.
Lomax, A., Satriano, C., and Vassallo, M.: Automatic picker developments and optimization: FilterPicker – a robust, broadband picker for real-time seismic monitoring and earthquake early warning, Seismol. Res. Lett., 83, 531–540, https://doi.org/10.1785/gssrl.83.3.531, 2012.
Luzi, L., Lanzano, G., Felicetta, C., D'Amico, M. C., Russo, E., Sgobba, S., Pacor, F., and ORFEUS Working Group 5: Engineering Strong Motion Database (ESM) (Version 2.0), Istituto Nazionale di Geofisica e Vulcanologia (INGV), https://doi.org/10.13127/ESM.2, 2020.
MathWorks: MATLAB, version 9.15 (R2023b), Natick, Massachusetts: The MathWorks Inc., https://www.mathworks.com (last access: 6 March 2025), 2023
Medved, I., Polat, G., and Koulakov, I.: Crustal Structure of the Eastern Anatolia Region (Turkey) Based on Seismic Tomography, Geoscience, 11, 91, https://doi.org/10.3390/geosciences11020091, 2021.
Melgar, D., Taymaz, T., Ganas, A., Crowell, B. W., Öcalan, T., Kahraman, M., Tsironi, V., Yolsal-Çevikbilen, Valkaniotis, S., Irmak, T. S., Eken, T., Erman, C., Özkan, Doğan, A. H., and Altuntaş, C.: Sub- and super-shear ruptures during the 2023 Mw 7.8 and Mw 7.6 earthquake doublet in SE Türkiye, Seismica, 2, 3, https://doi.org/10.26443/seismica.v2i3.387, 2023.
Morasca, P., Bindi, D., Mayeda, K., Roman-Nieves, J., Barno, J., Walter, W. R., and Spallarossa, D.: Source scaling comparison and validation in Central Italy: data intensive direct S waves versus the sparse data coda envelope methodology, Geophys. J. Int., 231, 1573–1590, https://doi.org/10.1093/gji/ggac268, 2022.
Ozer, C., Ozyazicioglu, M., Gok, E., and Polat, O.: Imaging the Crustal Structure Throughout the East Anatolian Fault Zone, Turkey, by Local Earthquake Tomography, Pure Appl. Geophys., 176, 2235–2261, https://doi.org/10.1007/s00024-018-2076-6, 2019.
Pacor, F., Spallarossa, D., Oth, A., Luzi, L., Puglia, R., Cantore, R., Mercuri, A., D'Amico, M., and Bindi, D.: Spectral models for ground motion prediction in the L'Aquila region (central Italy): Evidence for stress-drop dependence on magnitude and depth, Geophys. J. Int., 204, 697–718, https://doi.org/10.1093/gji/ggv448, 2016.
Palo, M. and Zollo, A.: Small-scale segmented fault rupture along the East Anatolian Fault during the 2023 Kahramanmaraş earthquake, Communications Earth & Environment, 5, 431, https://doi.org/10.1038/s43247-024-01597-z, 2024.
Parolai, S., Bindi, D., and Augliera, P.: Application of the Generalized Inversion Technique (GIT) to a Microzonation Study: Numerical Simulations and Comparison with Different Site-Estimation Techniques, B. Seismol. Soc. Am., 90, 286–297, 2000.
Parolai, S., Bindi, D., Durukal, E., Grosser, H., and Milkereit, C.: Source Parameters and Seismic Moment-Magnitude Scaling for Northwestern Turkey, B. Seismol. Soc. Am., 97, 655–660, https://doi.org/10.1785/0120060180, 2007.
Pennington, C. N., Chen, X., Abercrombie, R. E., and Wu, Q.: Cross validation of stress drop estimates and interpretations for the 2011 Prague, OK, earthquake sequence using multiple methods, J. Geophys. Res.-Sol. Ea., 126, e2020JB020888, https://doi.org/10.1029/2020JB020888, 2021.
Petersen, G. M., Büyükakpinar, P., Vera Sanhueza, F. O., Metz, M., Cesca, S., Akbayram, K., Saul, J., and Dahm, T.: The 2023 Southeast Türkiye Seismic Sequence: Rupture of a Complex Fault Network, Seism. Rec., 3, 134–143, https://doi.org/10.1785/0320230008, 2023.
Picozzi, M., Oth, A., Parolai, S., Bindi, D., De Landro, G., and Amoroso, O.: Accurate estimation of seismic source parameters of induced seismicity by a combined approach of generalized inversion and genetic algorithm: Application to The Geysers geothermal area, California, J. Geophys. Res.-Sol. Ea., 122, 3916–3933, https://doi.org/10.1002/2016JB013690, 2017.
Picozzi, M., Spallarossa, D., Iaccarino, A. G., and Bindi, D.: Temporal evolution of radiated energy to seismic moment scaling during the preparatory phase of the Mw 6.1, 2009 L'Aquila Earthquake (Italy), Geophys. Res. Lett., 49, 7382, e2021GL097382, https://doi.org/10.1029/2021GL097382, 2022.
Picozzi, M., Iaccarino, A. G., Spallarossa, D., and Bindi, D.: On catching the preparatory phase of damaging earthquakes: an example from central Italy, Sci. Rep., 13, 14403, https://doi.org/10.1038/s41598-023-41625-0, 2023a.
Picozzi, M., Iaccarino, A. G., and Spallarossa, D.: The preparatory process of the 2023 Mw 7.8 Türkiye earthquake, Sci. Rep., 13, 17853, https://doi.org/10.1038/s41598-023-45073-8, 2023b.
Picozzi, M., Spallarossa, D., Iaccarino, A. G., and Bindi, D.: Event-specific ground motion anomalies highlight the preparatory phase of earthquakes during the 2016–2017 Italian seismicity, Comm. Earth Environ., 5, 289, https://doi.org/10.1038/s43247-024-01455-y, 2024.
Richter, C.: An instrumental earthquake magnitude scale, B. Seismol. Soc. Am., 25, 1–32, https://doi.org/10.1785/BSSA0250010001,1935.
Robusto, C. C.: The cosine-haversine formula, Am. Math. Mon., 64, 38–40, https://doi.org/10.2307/2309088, 1957.
Rodríguez-Pérez, Q. and Zúñiga, F. R.: Statistical and source characterization of the 2023 Kahramanmaraş Türkiye earthquake sequence, Acta Geophys., 73, 1241–1260, https://doi.org/10.1007/s11600-024-01428-x, 2025.
Sandıkkaya, M. A., Güryuva, B., Kale, Ö., Okçu, O., İçen, A., Yenier, E., and Akkar, S.: An updated strong-motion database of Türkiye (SMD-TR), Earthq. Spectra, 40, 847–870, https://doi.org/10.1177/87552930231208158, 2024.
Savage, M. K. and Anderson, J. G.: A local-magnitude scale for the western great basin-eastern Sierra Nevada from synthetic Wood-Anderson seismograms, B. Seismol. Soc. Am., 85, 1236–1243, https://doi.org/10.1785/BSSA0850041236, 1995.
Sbeinati, M. R., Darawcheh, R., and Mouty, M.: The historical earthquakes of Syria: an analysis of large and moderate earthquakes from 1365 B. C. to 1900 A. D., Ann. Geophys., 48, 347–435, https://doi.org/10.4401/ag-3206, 2005.
Scafidi, D., Spallarossa, D., Tunino, C., Ferretti, G., and Viganò, A.: Automatic P- and S-Wave Local Earthquake Tomography: Testing Performance of the Automatic Phase-Picker Engine “RSNI-Picker”, B. Seismol. Soc. Am., 106, 526–536, https://doi.org/10.1785/0120150084, 2016.
Scafidi, D., Viganò, A., Ferretti, G., and Spallarossa, D.: Robust picking and accurate location with RSNI-Picker2: Real-Time Automatic Monitoring of Earthquakes and Non Tectonic Events, Seism. Res. Lett., 89, 1478–1487, https://doi.org/10.1785/0220170206, 2018.
Scafidi, D., Spallarossa, D., Ferretti, G., Barani, S., Castello, B., and Margheriti, L.: A Complete Automatic Procedure to Compile Reliable Seismic Catalogs and Travel-Time and Strong-Motion Parameters Datasets, Seism. Res. Lett., 90, 1308–1317, https://doi.org/10.1785/0220180257, 2019.
Sertçelik, F.: Estimation of Coda Wave Attenuation in the East Anatolia Fault Zone, Turkey, Pure Appl. Geophys., 169, 1189–1204, https://doi.org/10.1007/s00024-011-0368-1, 2012.
Shible, H., Hollender, F., Bindi, D., Traversa, P., Oth, A., Edwards, B., Klin, P., Kawase, H., Grendas, I., Castro, R. R., Theodoulis, N., and Gueguen, P.: GITEC: A Generalized Inversion Technique Benchmark, B. Seismol. Soc. Am., 112, 850–877, https://doi.org/10.1785/0120210242, 2022.
Spallarossa, D., Bindi, D., Augliera, P., and Cattaneo, M.: An Ml scale in northwestern Italy, B. Seismol. Soc. Am., 92, 2205–2216, https://doi.org/10.1785/0120010201, 2002.
Spallarossa, D., Ferretti, G., Scafidi, D., Turino, C., and Pasta, M.: Performance of the RSNI-Picker, Seismol. Res. Lett., 85, 1243–1254, https://doi.org/10.1785/0220130136, 2014.
Spallarossa, D., Cattaneo, M., Scafidi, D., Michele, M., Chiaraluce, L., Segou, M., and Main, I. G.: An automatically generated high-resolution earthquake catalogue for the 2016–2017 Central Italy seismic sequence, including P and S phase arrival times, Geophys. J. Int., 225, 555–571, https://doi.org/10.1093/gji/ggaa604, 2021a.
Spallarossa, D., Picozzi, M., Scafidi, D., Morasca, P., Turino, C., and Bindi, D.: The RAMONES Service for Rapid Assessment of Seismic Moment and Radiated Energy in Central Italy: Concepts, Capabilities, and Future Perspectives, Seismol. Res. Lett., 92, 1759–1772, https://doi.org/10.1785/0220200348, 2021b.
Spallarossa, D., Colavitti, L., Lanzano, G., Sgobba, S., Pacor, F., and Felicetta, C.: CI-FAS_Flatfile: Parametric table of the Fourier Amplitude Spectra ordinates and associated metadata for the shallow active crustal events in Central Italy (2009–2018), [Data set], Istituto Nazionale di Geofisica e Vulcanologia (INGV), https://doi.org/10.13127/CI_dataset/CI-FAS_flatfile, 2022.
Tan, O., Pabuççu, Z., Tapırdamaz, C. M., İnan S., Ergintav, S., Eyidoğan, H., Aksoy, E., Kuluöztürk, F.: Aftershock study and seismotectonic implications of the 8 March 2010 Kovancılar (Elazığ, Turkey) earthquake (MW=6.1), Geophys. Res. Lett., 38, 4–9, https://doi.org/10.1029/2011GL047702, 2011.
Tarchini, G., Scafidi, D., Parolai, S., Picozzi, M., Bindi, D., and Spallarossa, D.: The Seismic Station and Site Amplification Service: Continuously Updated Information on Italian Seismic Stations, Seismol. Res. Lett., 96, 2027–2038, https://doi.org/10.1785/0220240291, 2025.
Taymaz, T., Ganas, A., Yolsal-Çevikbilen S., Vera, F., Eken, T., Erman, C., Keles, D., Kapetadinis, V., Valkaniotis, S., Karasante, I., Tsironi, V., Gaebler, P., Melgar, D., and Öcalan, T.: Source Mechanism and Rupture Process of the 24 January 2020 Mw 6.7 Doğanyol-Sivrice Earthquake obtained from Seismological Waveform Analysis and Space Geodetic Observations on the East Anatolian Fault Zone (Turkey), Tectonophysics, 804, 228745, https://doi.org/10.1016/j.tecto.2021.228745, 2021.
Taymaz, T., Ganas, A., Berberian, M., Eken, T., Irmak, T., Kapetanidis, V., Yolsal-Çevikbilen, S., Erman, C., Keles, D., Esmaeili, C., Tsironi, V., and Özkan, B.: The 23 February 2020 Qotur-Ravian Earthquake Doublet at the Iranian-Turkish Border: Seismological and InSAR Evidence for Escape Tectonics, Tectonophysics, 838, TECTO15364-229482, https://doi.org/10.1016/j.tecto.2022.229482, 2022.
TK – Disaster and Emergency Management Authority: Turkish National Strong Motion Network [Data set], Department of Earthquake, Disaster and Emergency Management Authority, https://doi.org/10.7914/SN/TK, 1973.
Toker, M. and Şakir, Ş.: Upper- to mid-crustal seismic attenuation structure above the mantle wedge in East Anatolia, Turkey: Imaging crustal scale segmentation and differentiation, Phys. Earth Planet. In., 329–330, 106908, https://doi.org/10.1016/j.pepi.2022.106908, 2022.
Trifunac, M. D., and Brady, A. G.: A study on the duration of strong earthquake ground motion, B. Seismol. Soc. Am., 65, 581–626, 1975.
TU – Disaster and Emergency Management Authority: Turkish National Seismic Network [Data set], Department of Earthquake, Disaster and Emergency Management Authority, https://doi.org/10.7914/SN/TU, 1990.
Uhrhammer, R. A., Hellweg, M., Hutton, K., Lombard, P., Walters, A. W., Hauksson, E., and Oppenheimer, D.: California Integrated Seismic Network (CISN) local magnitude determination in California and vicinity, B. Seismol. Soc. Am., 101, 2685–2693, https://doi.org/10.1785/0120100106, 2011.
van der Elst, N. J.: B-Positive: A Robust Estimator of Aftershock Magnitude Distribution in Transiently Incomplete Catalogs, J. Geophys. Res.-Sol. Ea., 126, e2020JB021027, https://doi.org/10.1029/2020JB021027, 2021.
Wang, B. and Barbot, S.: Rupture segmentation on the East Anatolian fault (Turkey) controlled by along-strike variations in long-term slip rates in a structurally complex fault system, Geology, 52: 779–783, https://doi.org/10.1130/G52403.1, 2024.
Wessel, P., Smith, W. H. F., Scharroo, R., Luis, J., and Wobbe, F.: Generic Mapping Tools: Improved Version Released, EOS, 94, 409–410, https://doi.org/10.1002/2013EO450001, 2013.
Zaliapin, I. and Ben-Zion, Y.: A global classification and characterization of earthquake clusters, Geophys. J. Int., 207, 608–634, https://doi.org/10.1093/gji/ggw300, 2016.
Zaliapin, I., Gabrielov, A., Keilis-Borok, V., and Wong, H.: Clustering analysis of seismicity and aftershock identification, Phys. Rev. Lett., 101, 018501, https://doi.org/10.1103/PhysRevLett.101.018501, 2008.
- Abstract
- Introduction
- Data set construction and selection
- Data set characteristics
- Discussions: seismicity distribution in the EAFZ
- Data availability
- Applications and prospects
- Code and data availability
- Conclusive remarks
- Author contributions
- Competing interests
- Disclaimer
- Acknowledgements
- Financial support
- Review statement
- References
- Supplement