the Creative Commons Attribution 4.0 License.
the Creative Commons Attribution 4.0 License.
 | 27 Jun 2025
An annual 30 m cultivated-pasture dataset of the Tibetan Plateau from 1988 to 2021
Binghong Han
Shengli Tao
Tong Yang
Yongli Tang
Mengshuai Ge
Zhenong Jin
Jinwei Dong
Zhibiao Nan
Cultivated pastures have rapidly developed across the Tibetan Plateau over the past several decades, raising concerns about grassland degradation. Accordingly, considerable attention is paid to the protection of Tibetan grassland ecosystems. However, high-resolution spatial distribution of cultivated pastures on the Tibetan Plateau remains poorly understood, primarily due to the difficulty in discriminating cultivated pastures from other land cover types using remote sensing techniques. The absence of such information hinders efficient agricultural and livestock husbandry management, making it challenging to support ecological protection and restoration efforts. Here, we mapped the cultivated pastures on the Tibetan Plateau at a 30 m resolution for the years 1988 to 2021 using Landsat data from the Google Earth Engine (GEE) cloud computing platform. We built a random forest (RF) binary classification model with inputs of the spectral–temporal metrics of Landsat data acquired in the growing season, as well as ancillary topographic data. The model was trained using carefully selected training samples and was validated against 2000 independent random reference points in two pilot study regions with different climates and landscapes. The model achieved an overall accuracy of 97.05 % ± 0.4 % and an F1 spatial consistency score of 82.51 % ± 14.22 % (precision: 90.04 % ± 6.18 %; recall: 76.74 % ± 9.91 %), suggesting high confidence in mapping the distribution of cultivated pastures on the plateau. Using the RF model, we then produced a dataset of cultivated-pasture maps for the years from 1988 to 2021 for Qinghai Province and the Tibet Autonomous Region on the Tibetan Plateau, covering 77 % of the plateau. At both the province and county levels, the cultivated-pasture areas estimated in this study matched well with government statistics for recent years. The area of cultivated pastures on the Tibetan Plateau experienced a significant expansion from 0.46 Mha in 1988 to 1.57 Mha in 2021, with an average annual growth of 33.5±2.5 Kha. To our knowledge, we are the first to map cultivated pastures on the Tibetan Plateau, and our RF binary classification approach holds promise in identifying cultivated pastures in other regions of the world, which could prove to be invaluable for scientists, policymakers, ecological conservation practitioners, and herdspeople. The dataset is available on Zenodo at https://doi.org/10.5281/zenodo.14271782 (Han et al., 2024).
- Article
(9711 KB) - Full-text XML
-
Supplement
(2091 KB) - BibTeX
- EndNote


Grasslands on the Tibetan Plateau play essential roles in carbon, water, and nutrient cycles (Chen et al., 2022; Piao et al., 2020; Wang et al., 2022a; Zhang et al., 2022b), in maintaining biodiversity (He et al., 2024), in mediating energy balances (Chang et al., 2021), and in supporting the livelihoods of millions of pastoralists (Fuglie et al., 2021; Hou et al., 2021). However, under the joint influence of climate change (He et al., 2020; Yao et al., 2022; Zhang et al., 2020) and human activity (Ding et al., 2022; Li et al., 2021; Zhang et al., 2022b), Tibetan grasslands face serious degradation problems (Bardgett et al., 2021; Wang et al., 2022c; Zhu et al., 2023). Numerous ecological restoration measures have been implemented in the past 2 decades to address the problem of grassland degradation on the plateau (Bardgett et al., 2021; Li et al., 2020; Zhu et al., 2023) and to improve the welfare of Tibetan pastoral communities (Fuglie et al., 2021; Hou et al., 2021). The establishment of cultivated pastures, which is common in western developed countries (Vroey et al., 2022), is encouraged in developing countries as one of these efforts (Wang and Zhang, 2023).
Cultivated pastures are also known as tame grasslands or pastures (Fisher et al., 2018; McInnes et al., 2015), agricultural grasslands (Zalite et al., 2016), green-fodder lands (Yang et al., 2021), or planted pastures (Parente et al., 2017). Cultivated pastures primarily cultivate alfalfa, silage corn, forage oat, ryegrass, or similar crops. The vegetation spectral signals of these cultivated pastures are similar to those of conventional croplands during peak growing seasons. However, cultivated pastures are generally harvested before reaching full maturity to optimize nutrient retention and to maintain palatability. As a result, the duration of vegetation growth in cultivated pastures is shorter compared to croplands. This discrepancy may lead to noticeable differences in vegetation spectral signals between conventional croplands and cultivated pastures at the end of the growing season (Ashourloo et al., 2018; Yang et al., 2021).
Mapping cultivated pastures on the Tibetan Plateau is important for the following reasons. Firstly, cultivated pastures provide substantial amounts of forage for livestock, the main economic income of Tibetan pastoralists (Fuglie et al., 2021; Hou et al., 2021). Secondly, cultivated pastures are essential for the ecological conservation and restoration efforts in this ecologically fragile area through reducing grazing pressure on natural grasslands (Kumar et al., 2019; Fang et al., 2016). Thirdly, encouraging cultivated pastures on the Tibetan Plateau has led to considerable changes in land use and land cover. These cultivated pastures, if well planned, can have significant impacts on ecosystem services and biodiversity conservation (Chen et al., 2021; Dong et al., 2022); if not well planned, they will result in ecosystem degradation that will be difficult to restore in these extreme environments.
Satellite remote sensing is an essential tool for mapping cultivated pastures (McInnes et al., 2015; Ashourloo et al., 2018; Fisher et al., 2018; Yang et al., 2021; Wang et al., 2022b). For example, McInnes et al. (2015) used MODIS data to discriminate native and non-native grasslands in a dry mixed prairie in Canada, with an overall accuracy of 73 %, as assessed by independent validation. Ashourloo et al. (2018) identified alfalfa fields in Iran and the United States using Landsat time series data, and the overall accuracy reached above 90 % by means of cross-validation, although their method did not require a very dense number of valid observations. Lidar data have been used to distinguish cultivated grasslands from natural grasslands, as in one study in southwestern Saskatchewan, Canada, with an overall accuracy of 96 % being achieved (Fisher et al., 2018). Satellite remote sensing has also been used to map pastoral lands in China. Yang et al. (2021) used Landsat data during the growing season to map green-fodder fields in the northeastern Tibetan Plateau in 2010, 2015, and 2019 and achieved overall accuracies of 94.2 %, 93.1 %, and 96.6 %. They found that the green-fodder lands in northeastern Tibetan Plateau expanded from 16.3 km2 in 2010 to 136.1 km2 in 2019, 7.35 times the initial area. Wang et al. (2022b) identified oat pastures in Shandan County of Gansu Province using Sentinel-2 data from 2019 to 2021, with an overall accuracy of 98 %, as assessed by cross-validation. They found that the area of cultivated oat pastures decreased from 347.8 km2 in 2019 to 318.9 km2 in 2021.
While a number of studies have mapped cultivated pastures (Ashourloo et al., 2018; Fisher et al., 2018; McInnes et al., 2015; Wang et al., 2022b; Yang et al., 2021), many have mapped cultivated pastures that grow certain types of tame grass species, such as alfalfa (Ashourloo et al., 2018), oat (Wang et al., 2022b) and rapeseed (Yang et al., 2021); few studies have focused on the mapping of general cultivated pastures, especially in the harsh environments on the Tibetan Plateau. The temporal evolution of the distribution of cultivated pastures on the Tibetan Plateau, which is of great interest to policymakers and researchers, remains poorly understood.
Therefore, the aims of the study are (1) to develop a method for mapping general cultivated pastures using satellite remote sensing data, (2) to clarify important technical details for successful mapping of general cultivated pastures on the Tibetan Plateau, and (3) to understand the temporal evolution of the spatial distribution of cultivated pastures on the Tibetan Plateau.
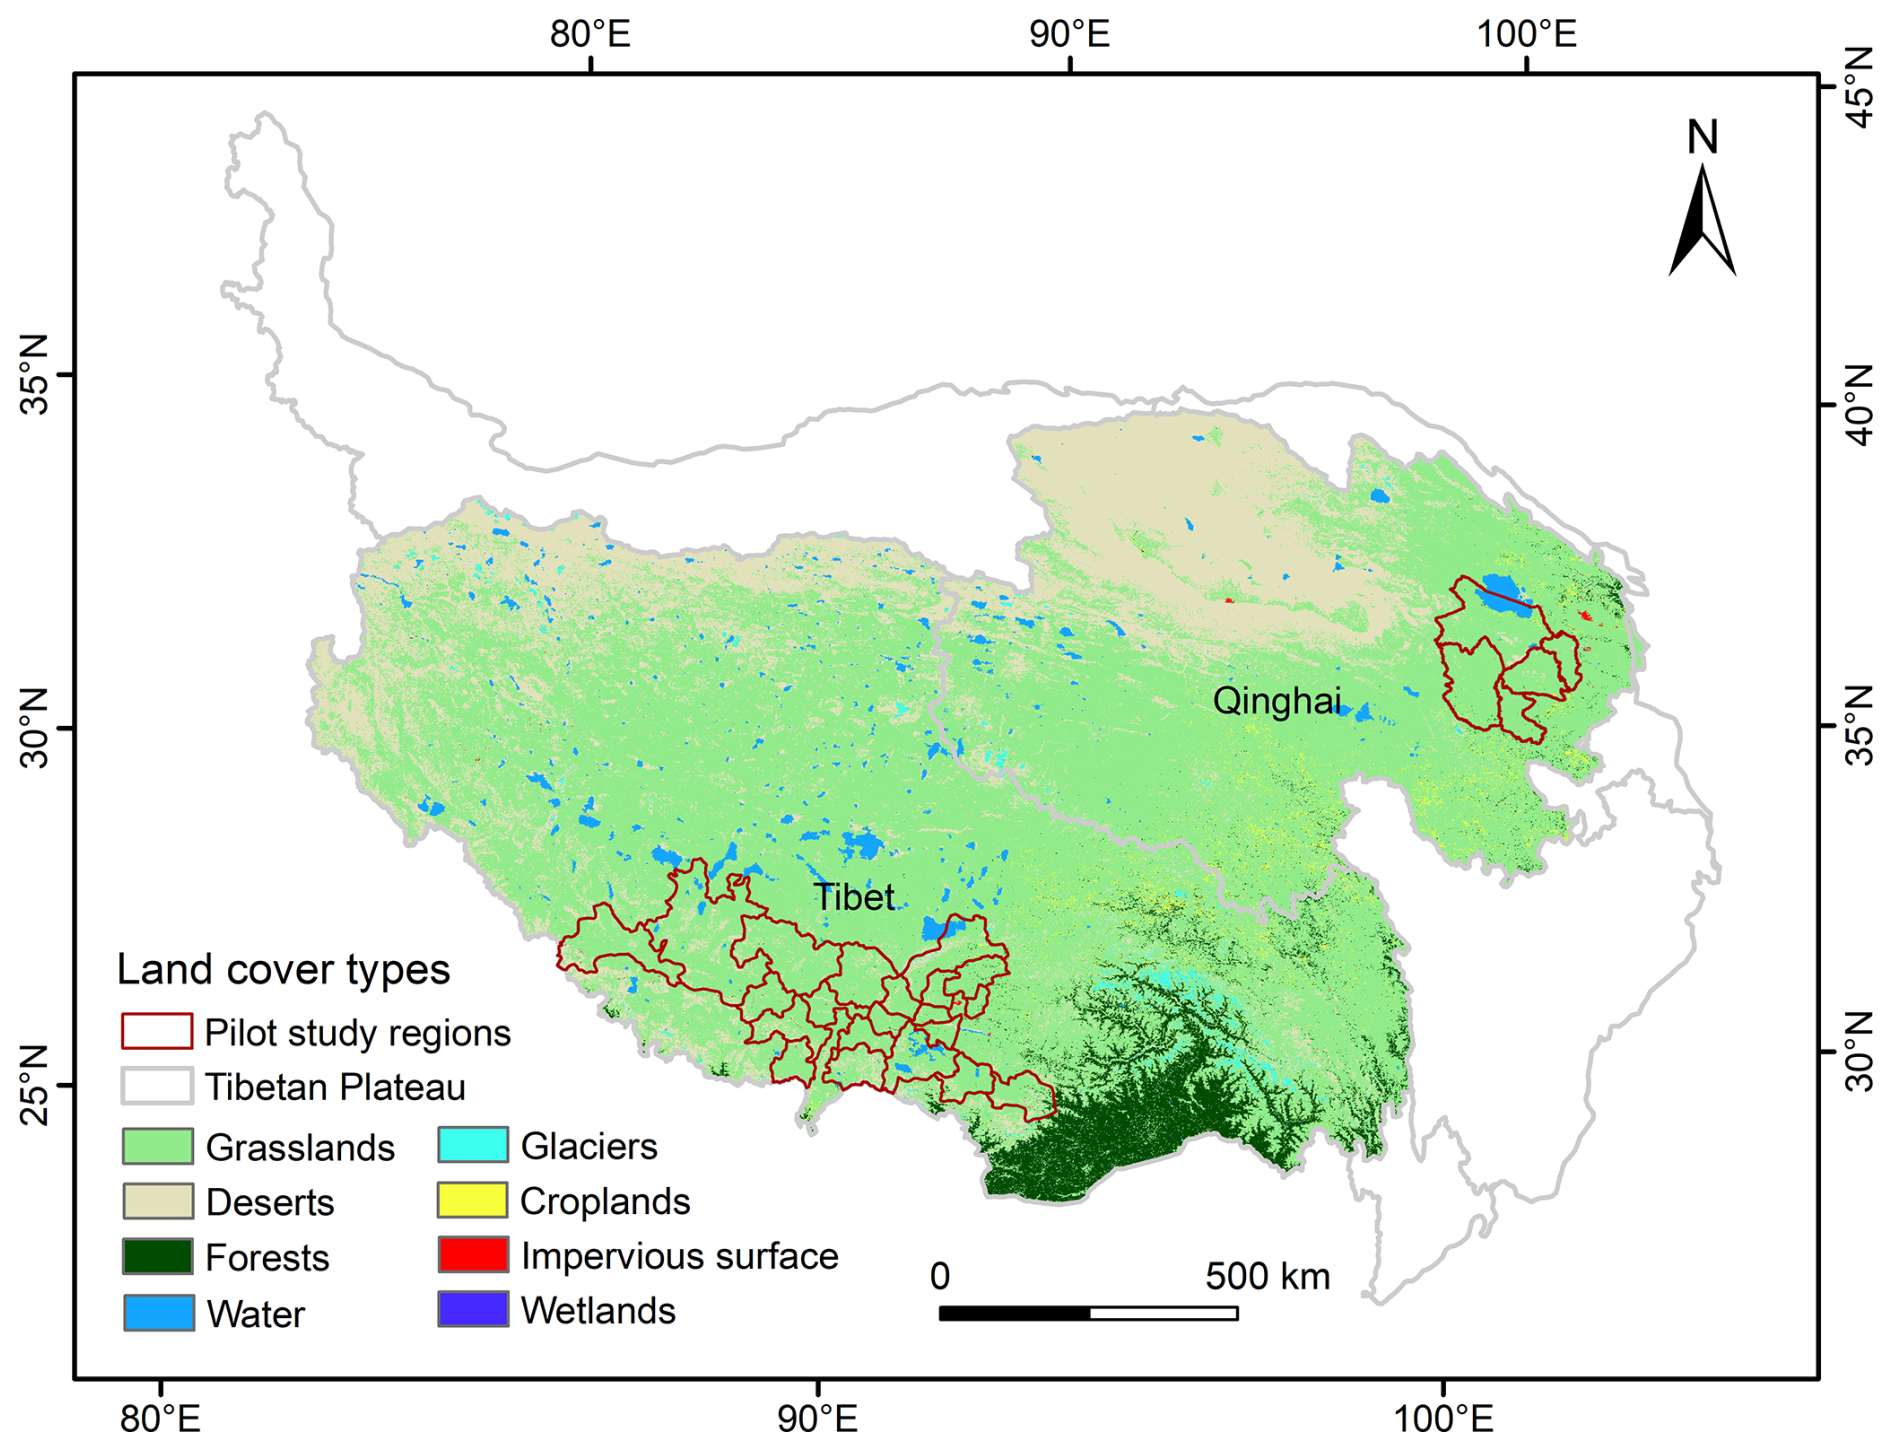
Figure 1The land cover types of the study region and the distribution of the pilot study regions in Qinghai and Tibet. The land cover data source is the Resource and Environment Science and Data Center (http://www.resdc.cn/, last access: 30 March 2025) of the Chinese Academy of Sciences. The binary classification model for mapping cultivated pastures was trained and validated in the pilot study regions.
The Tibetan Plateau spans from 73°29′ to 104°40′ E and from 25°59′ to 40°04′ N, with an average elevation of over 4000 m (Fig. 1). The region has a continental plateau climate, with an annual mean temperature of 2.0 °C and an annual mean precipitation of 373.5 mm (Zhang et al., 2023). The growing season lasts from April to October (Wang et al., 2020). The land cover types include grasslands, deserts, croplands, and forests (Fig. 1). The Tibetan Plateau is the habitat of over 50 million Tibetan sheep and 13 million yaks (Cheng et al., 2016), which rely on natural grasslands and cultivated pastures for their forage. The dominant native grass species in this region mainly include Stipa aliena, Carex przewalskii, and Kobresia deasyi (Jia et al., 2019). The cultivated grass species are Elymus nutans, Medicago sativa, Poa crymophila, Lolium perenne, Avena sativa, and Zea mays (Fig. 2). Our study region is geographically limited to Qinghai and Tibet, which, together, comprise approximately 77 % of the Tibetan Plateau.
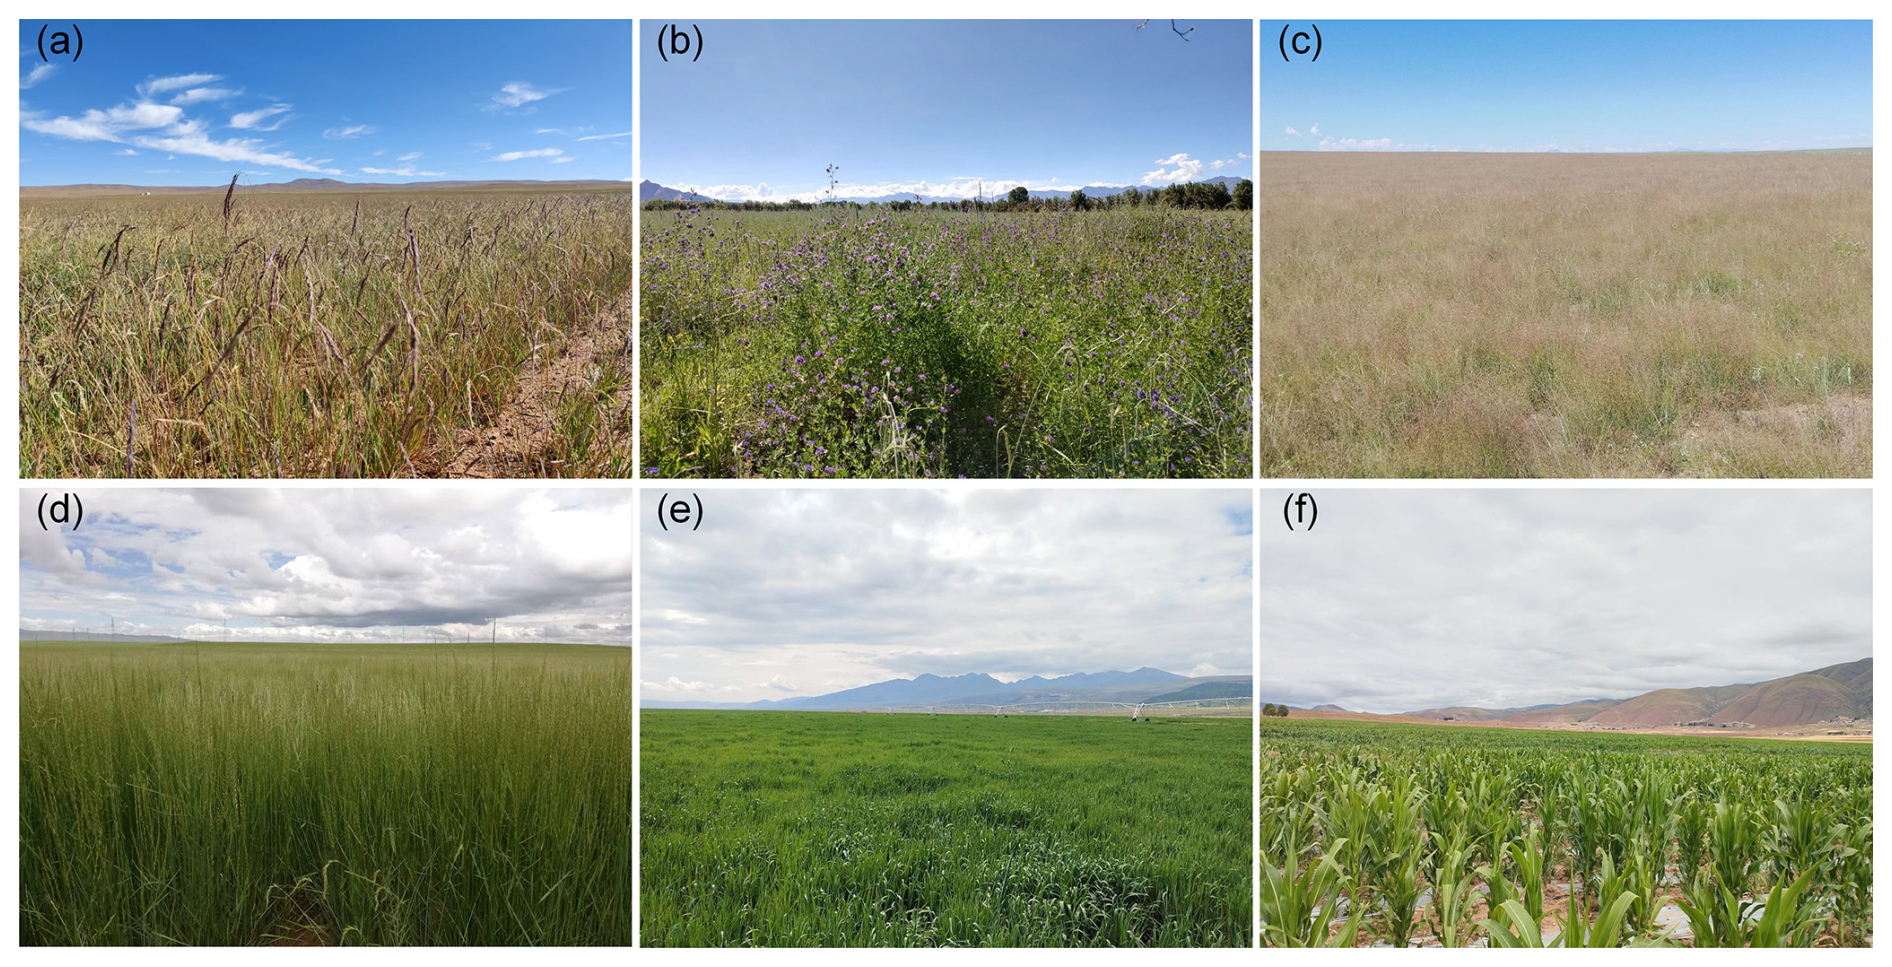
Figure 2Photographs of the cultivated pastures visited in the 2021 field campaign on the Tibetan Plateau. (a) Dahurian wildrye (Elymus nutans), (b) alfalfa (Medicago sativa), (c) annual bluegrass (Poa crymophila), (d) ryegrass (Lolium perenne), (e) oat (Avena sativa), and (f) silage corn (Zea mays).
During the summer of 2021, we conducted a field campaign in Qinghai Province and the Tibet Autonomous Region on the Tibetan Plateau. We traveled 4280 km and visited the counties of Gonghe, Xinghai, Tongde, Guinan, Guide, Kangma, Linzhou, Sajia, Dangxiong, Longzi, and Nanmulin. These counties are referred to as the pilot study regions in Qinghai Province and the Tibet Autonomous Region (Fig. 1).
We used surface reflectance (SR) data from the Thematic Mapper (TM), Enhanced Thematic Mapper Plus (ETM+), and Operational Land Imager (OLI) sensors on board the Landsat satellites (Wulder et al., 2022) to map cultivated pastures on the Tibetan Plateau. The mapping algorithm classified the spectral–temporal metrics of each pixel into two categories: cultivated pasture and other. The other category includes natural grasslands, forests, croplands, deserts, and waterbodies. The random forest (RF) (Breiman, 2001) method was used as the classification algorithm. Since we were interested in the identification of cultivated pastures rather than other land cover types, the RF model was designed as a binary classification model. The random forest binary classification model used in this study was trained with representative land cover type samples carefully selected during the field campaign or with the aid of high-spatial-resolution images on Google Earth. The inputs into the binary classification model were the spectral–temporal metrics of Landsat visible and infrared bands, spectral indices, and ancillary topographical information. The binary classification algorithm was implemented on the Google Earth Engine (GEE; Gorelick et al., 2017) cloud computing platform using the geoscience data stored on it.
3.1 Data
To map cultivated pastures on the Tibetan Plateau, we used the surface reflectance (SR) data from the Landsat 5, 7, and 8 satellites (Roy et al., 2014) in the visible and infrared bands in the years from 1988 to 2021. Globally, the Landsat 5 TM data were available from March 1984 to June 2013, the Landsat 7 ETM+ data were available from April 1999, and the Landsat 8 OLI data were available from February 2013. The band settings of OLI are different from those of TM and ETM+, and so we used a conversion procedure (Roy et al., 2016) to convert the SR of TM and ETM+ into that of OLI. This way, the RF binary classification model trained with the Landsat 8 data from 2021 as inputs can be applied to historical periods when TM or ETM+ data were available.
The Landsat data have a spatial resolution of 30 m and a temporal frequency of 16 d (Wulder et al., 2019). The Land Surface Reflectance Code (LaSRC; Vermote et al., 2018) was used to perform atmospheric correction. The data also include quality assessment (QA) fields produced with the CFMask method (Zhu and Woodcock, 2014), labeling clouds, cloud shadows, snow, water, and pixel saturation. We used Landsat data from the growing season (April to October) on the Tibetan Plateau as there is little vegetation signal during the non-growing season (Wang et al., 2020). The QA fields in the Landsat data were used to mask out clouds, cloud shadows, snow, and pixel saturation. Although the nominal temporal frequency of Landsat data is 16 d, the actual valid observations tend to have a temporal frequency of more than 16 d due to cloud, cloud shadow, and snow interference. Moreover, due to the side-overlapping of Landsat scenes, some locations have more valid observations compared to others. There were more valid Landsat observations in recent years than in earlier years (Fig. S1 in the Supplement). The striping patterns in Fig. S1 arise from the overlapping paths of Landsat swaths (Zhang et al., 2022a).
In addition to the SR, we also used seven spectral indices including the normalized difference vegetation index (NDVI; Tucker, 1979), the enhanced vegetation index (EVI; Liu and Huete, 1995), the normalized burn ratio (NBR; López García and Caselles, 1991), the normalized difference built-up index (NDBI; Zha et al., 2003), the normalized difference phenology index (NDPI; Wang et al., 2017), the normalized difference water index (NDWI; Gao, 1996), and the modified normalized difference water index (MNDWI; Xu, 2006). Using these spectral indices can expedite the land cover classification efficiency at both the training and classification stages.
Topography can affect the growth conditions of grasses. Cultivated pastures are typically located on flat terrains to facilitate the use of automated machinery for ploughing and harvesting; hence, topography features may be useful in identifying cultivated pastures. In our study region, we characterized the topography using the Shuttle Radar Topography Mission (SRTM) digital elevation model (DEM) data (Farr et al., 2007), which had a spatial resolution of 30 m. The RF binary classification model's inputs included slope, aspect, and hill shade derived from elevation.
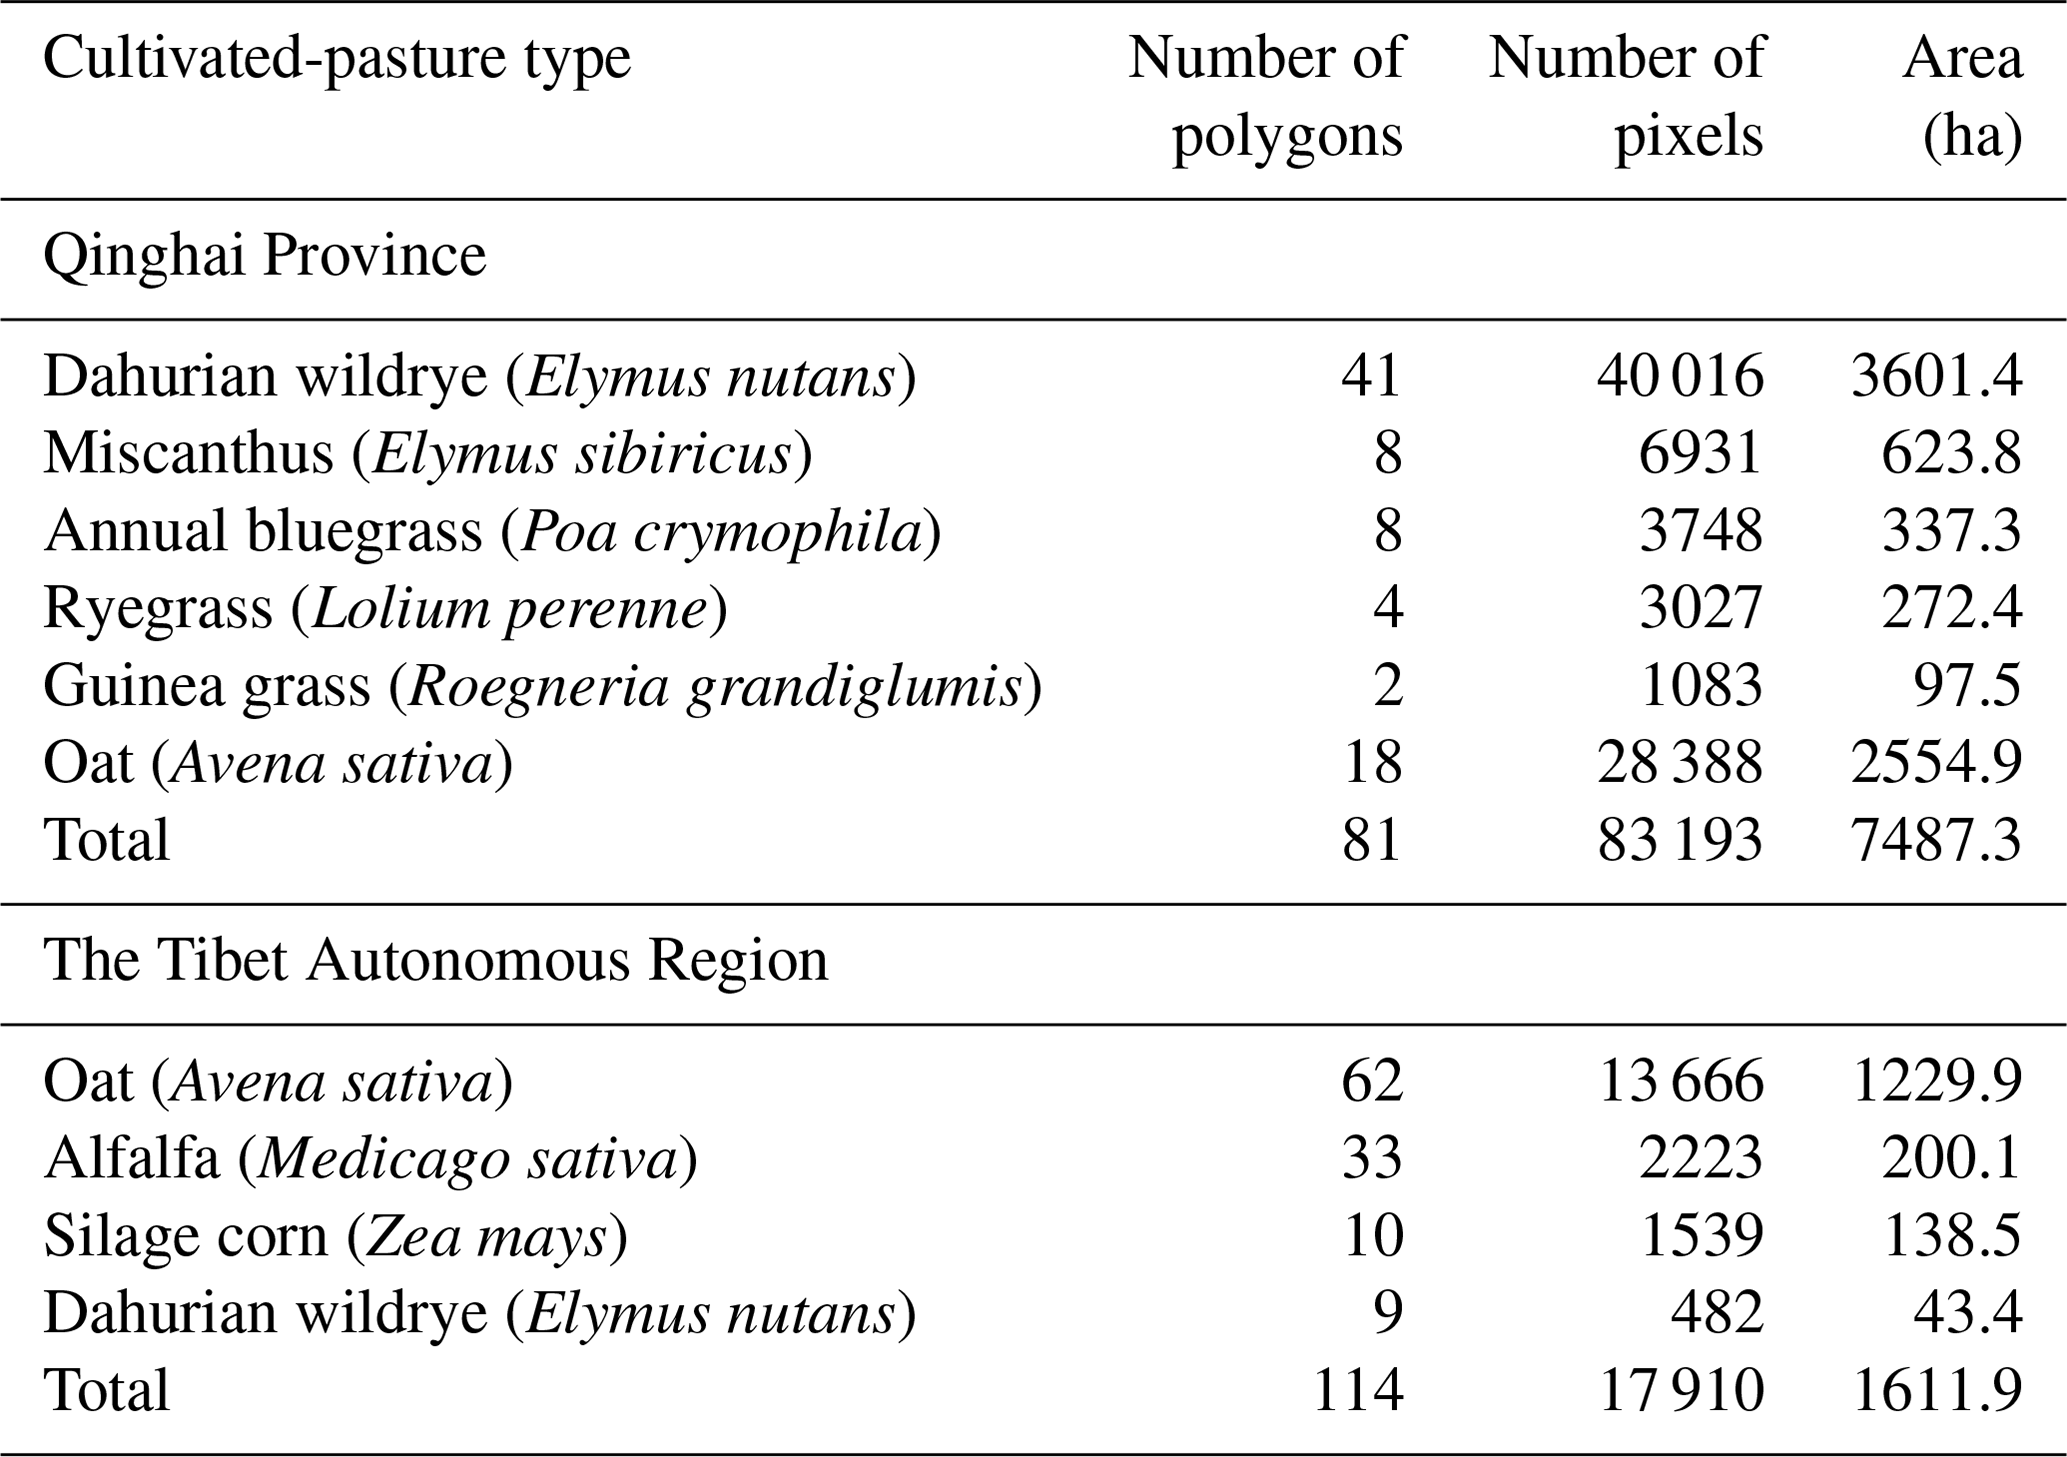
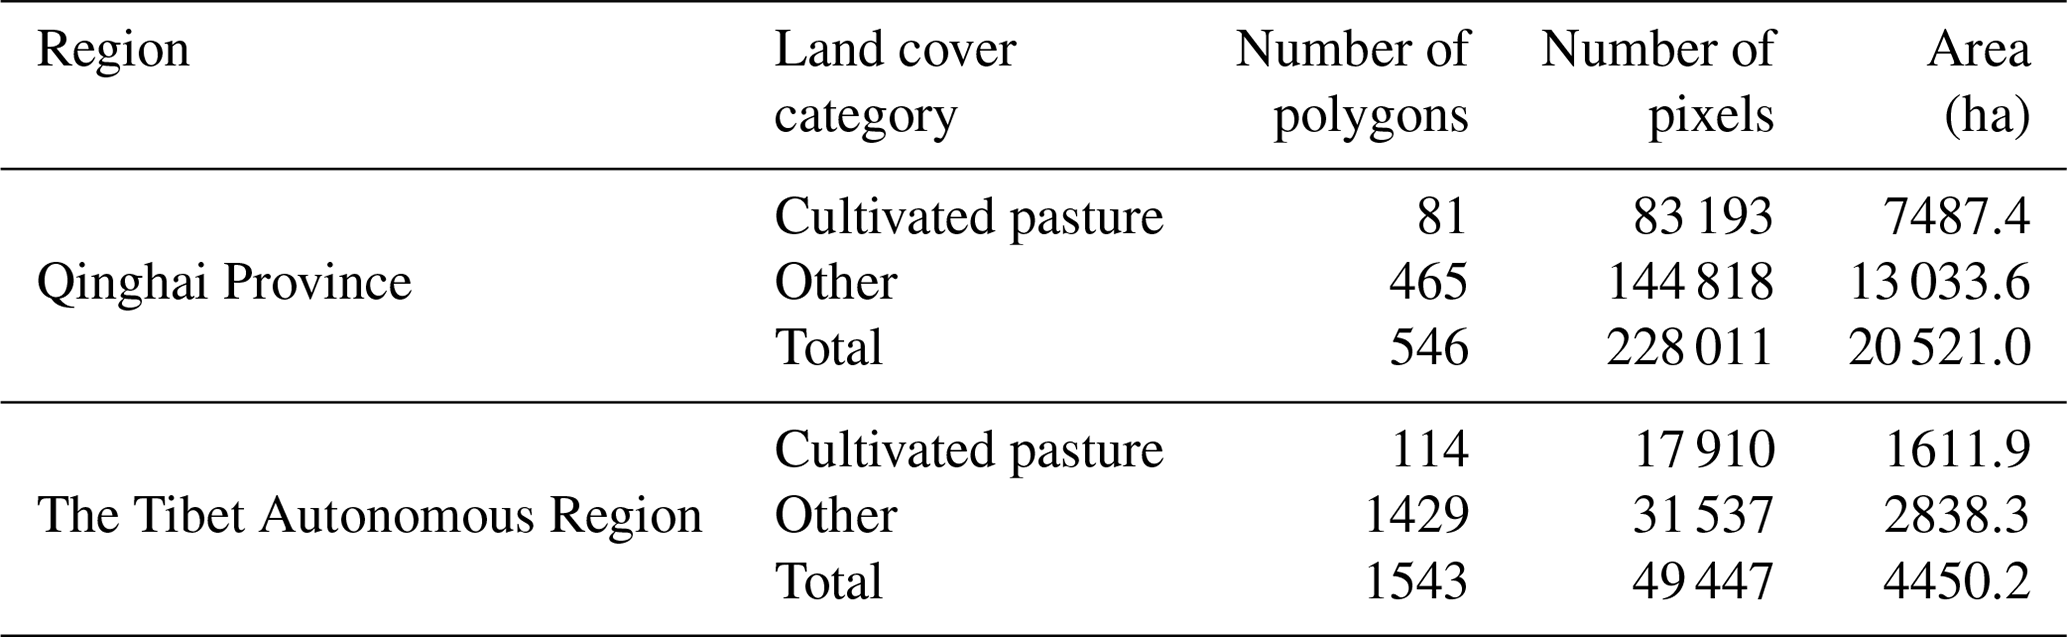
Table 1Summary of the type, number, and area of the cultivated pastures visited during the 2021 summer field campaign in the pilot study regions.
3.2 Spectral–temporal metrics
Remotely sensed vegetation spectrums are characterized by high reflectance in near-infrared wavelengths and low reflectance in visible wavelengths (Tian et al., 2023). During the peak growing season, many vegetation types exhibit similar spectral features (Zeng et al., 2022). We used satellite remote sensing data throughout the growing season because vegetation has different phenological profiles due to species composition and human management (Dong et al., 2016; Parente et al., 2017). We used some key metrics from among all spectral–temporal data to reduce the computation burden while maintaining accuracy (Parente et al., 2019, 2017; Parente and Ferreira, 2018; Wang et al., 2022b; Yang et al., 2021). Specifically, we used three descriptive statistical metrics, namely the 25 %, 50 %, and 75 % quantiles of remote sensing data during the growing season instead of the complete time series of all available Landsat data during the growing season (Aghighi et al., 2018; Moon et al., 2021). We referred to these descriptive statistical metrics of remote sensing data as spectral–temporal metrics. The spectral–temporal metrics inherently contain vegetation phenological information that can be used to classify land covers. The quantiles were used as independent input variables in the random forest classification model and did not interact with one another. As is standard with random forest models, the importance of each input variable is determined during the training process and is subsequently applied uniformly across all pixels in the classification. In summary, we used the 25 %, 50 %, and 75 % quantiles of the time series of all available Landsat visible and infrared SR, specifically seven spectral indices (i.e., NDVI, EVI, NBR, NDBI, NDPI, NDWI, and MNDWI), in the growing season.
3.3 The training samples
In the pilot study region of Qinghai Province, we visited 81 cultivated pastures. Of these, 40 were Dahurian wildrye (Elymus nutans) fields, 11 were miscanthus (Elymus sibiricus) fields, 6 were annual bluegrass (Poa crymophila) fields, 4 were ryegrass (Lolium perenne) fields, 2 were Guinea grass (Roegneria grandiglumis) fields, and 18 were oat (Avena sativa) fields. In the pilot study region of the Tibet Autonomous Region, we visited 114 cultivated pastures. Of these fields, 62 were oat pasture (Avena sativa), 33 were alfalfa (Medicago sativa), 10 were silage corn (Zea mays), and 9 were Dahurian wildrye (Elymus nutans). The detailed number and area of the visited cultivated pastures are listed in Table 1 and shown in Fig. 3a and c. The boundaries of the visited cultivated pastures were recorded using a handheld global positioning system (GPS) device. Figure 3a and c show the spatial distribution of the two land cover categories (cultivated pasture and other) in the pilot study regions used to train the RF binary classification model. The number and area of the training polygons for cultivated pasture and other are summarized in Table 2.
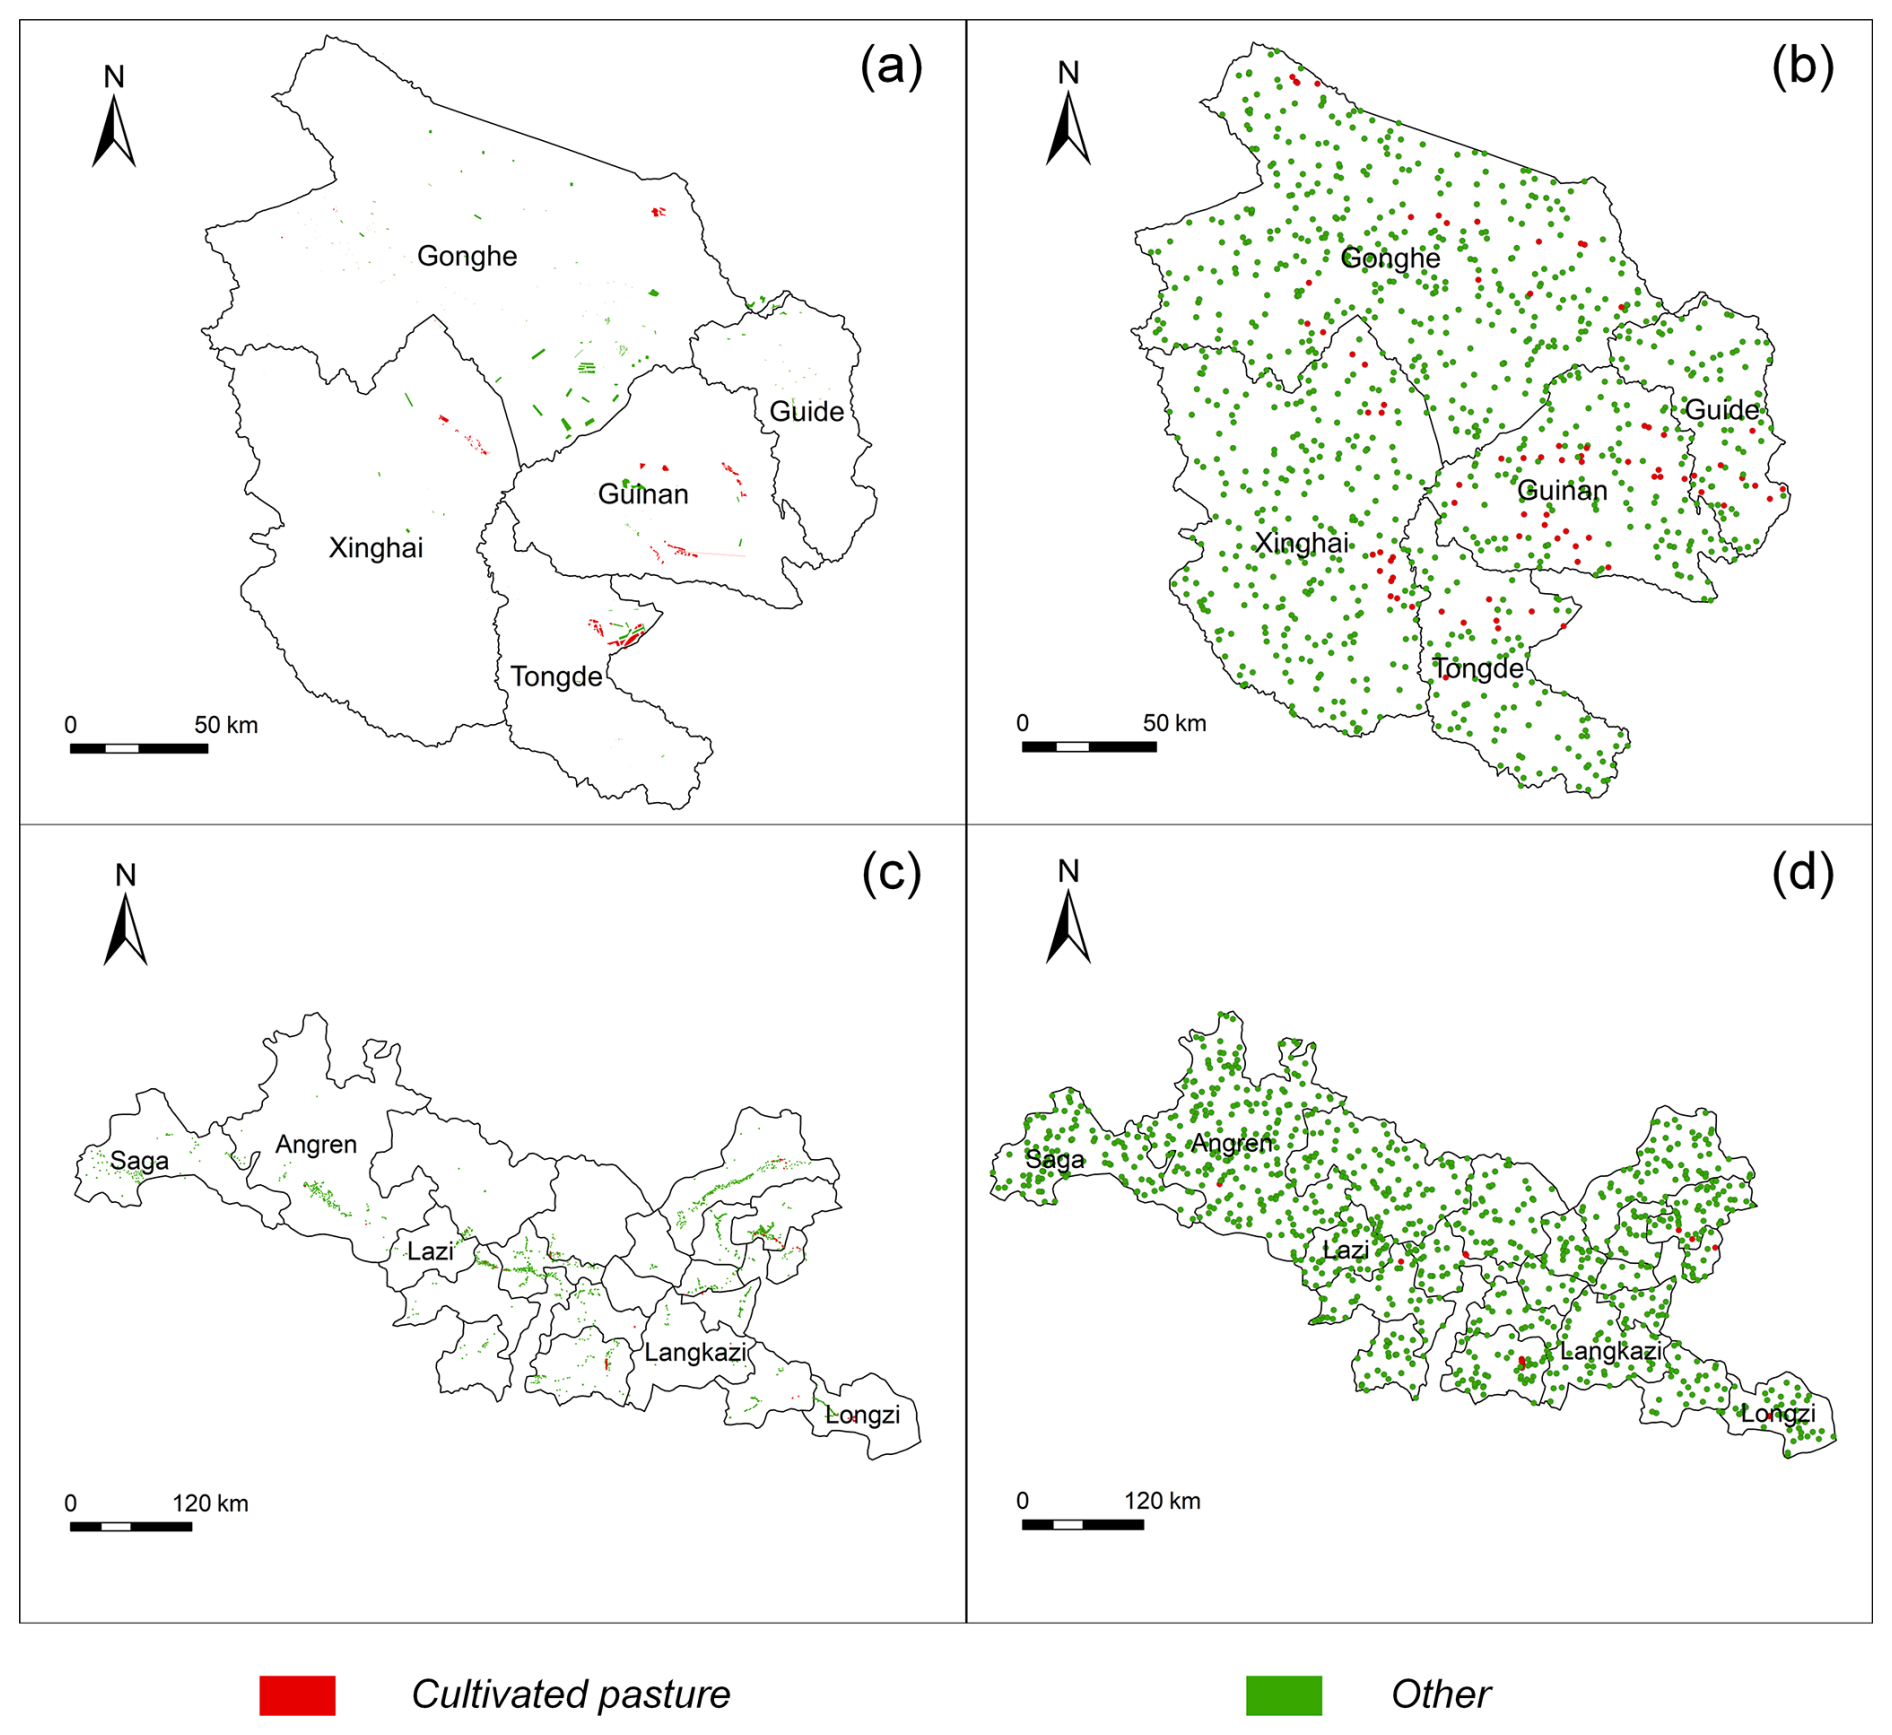
Figure 3The spatial distribution of the training polygons and the validation points in the pilot study regions. The training polygons (a, c) were recorded during the 2021 field campaign, and the 1000 independent random validation points (b, d) in each pilot study region were labeled with the aid of high-resolution images on Google Earth.
Table 2Summary of the training polygons in the pilot study regions.
3.4 The government statistics data
China Agricultural Press in Beijing published the annual China Pratacultural Statistics (e.g., Li and Wang, 2017), in which the areas of cultivated pastures were reported at the province level. The area of cultivated pastures at the province level were summed from the county-level areas of cultivated pastures, which were from the county-level governments' cultivated-pasture census data. However, the areas of cultivated pastures at the county level were not reported in the annual China Pratacultural Statistics.
From 2010 to 2017, the annual China Pratacultural Statistics considered all grasslands having undergone interventions by humans, i.e., cultivated pastures, including purely cultivated pastures and grasslands improved by human activities (i.e., seed sowing and grazing prohibition). From 2001 to 2009 and from 2018 to 2021, the annual China Pratacultural Statistics only considered grasslands with ploughing and seed-sowing management practices to be cultivated pastures. The statical caliber in the years from 2010 to 2017 was more reasonable and agreed with our definition of cultivated pastures.
Furthermore, we collected some county-level statistics data (13 counties in Qinghai and 12 counties in Tibet) for the areas of cultivated pastures for 2021 from the Qinghai Province Bureau of Forestry and Grassland, as well as from the Bureau of Agriculture and Rural Affairs of the Tibet Autonomous Region. We collected these county-level statistics data for comparison with the areas of cultivated pastures mapped through remote sensing.
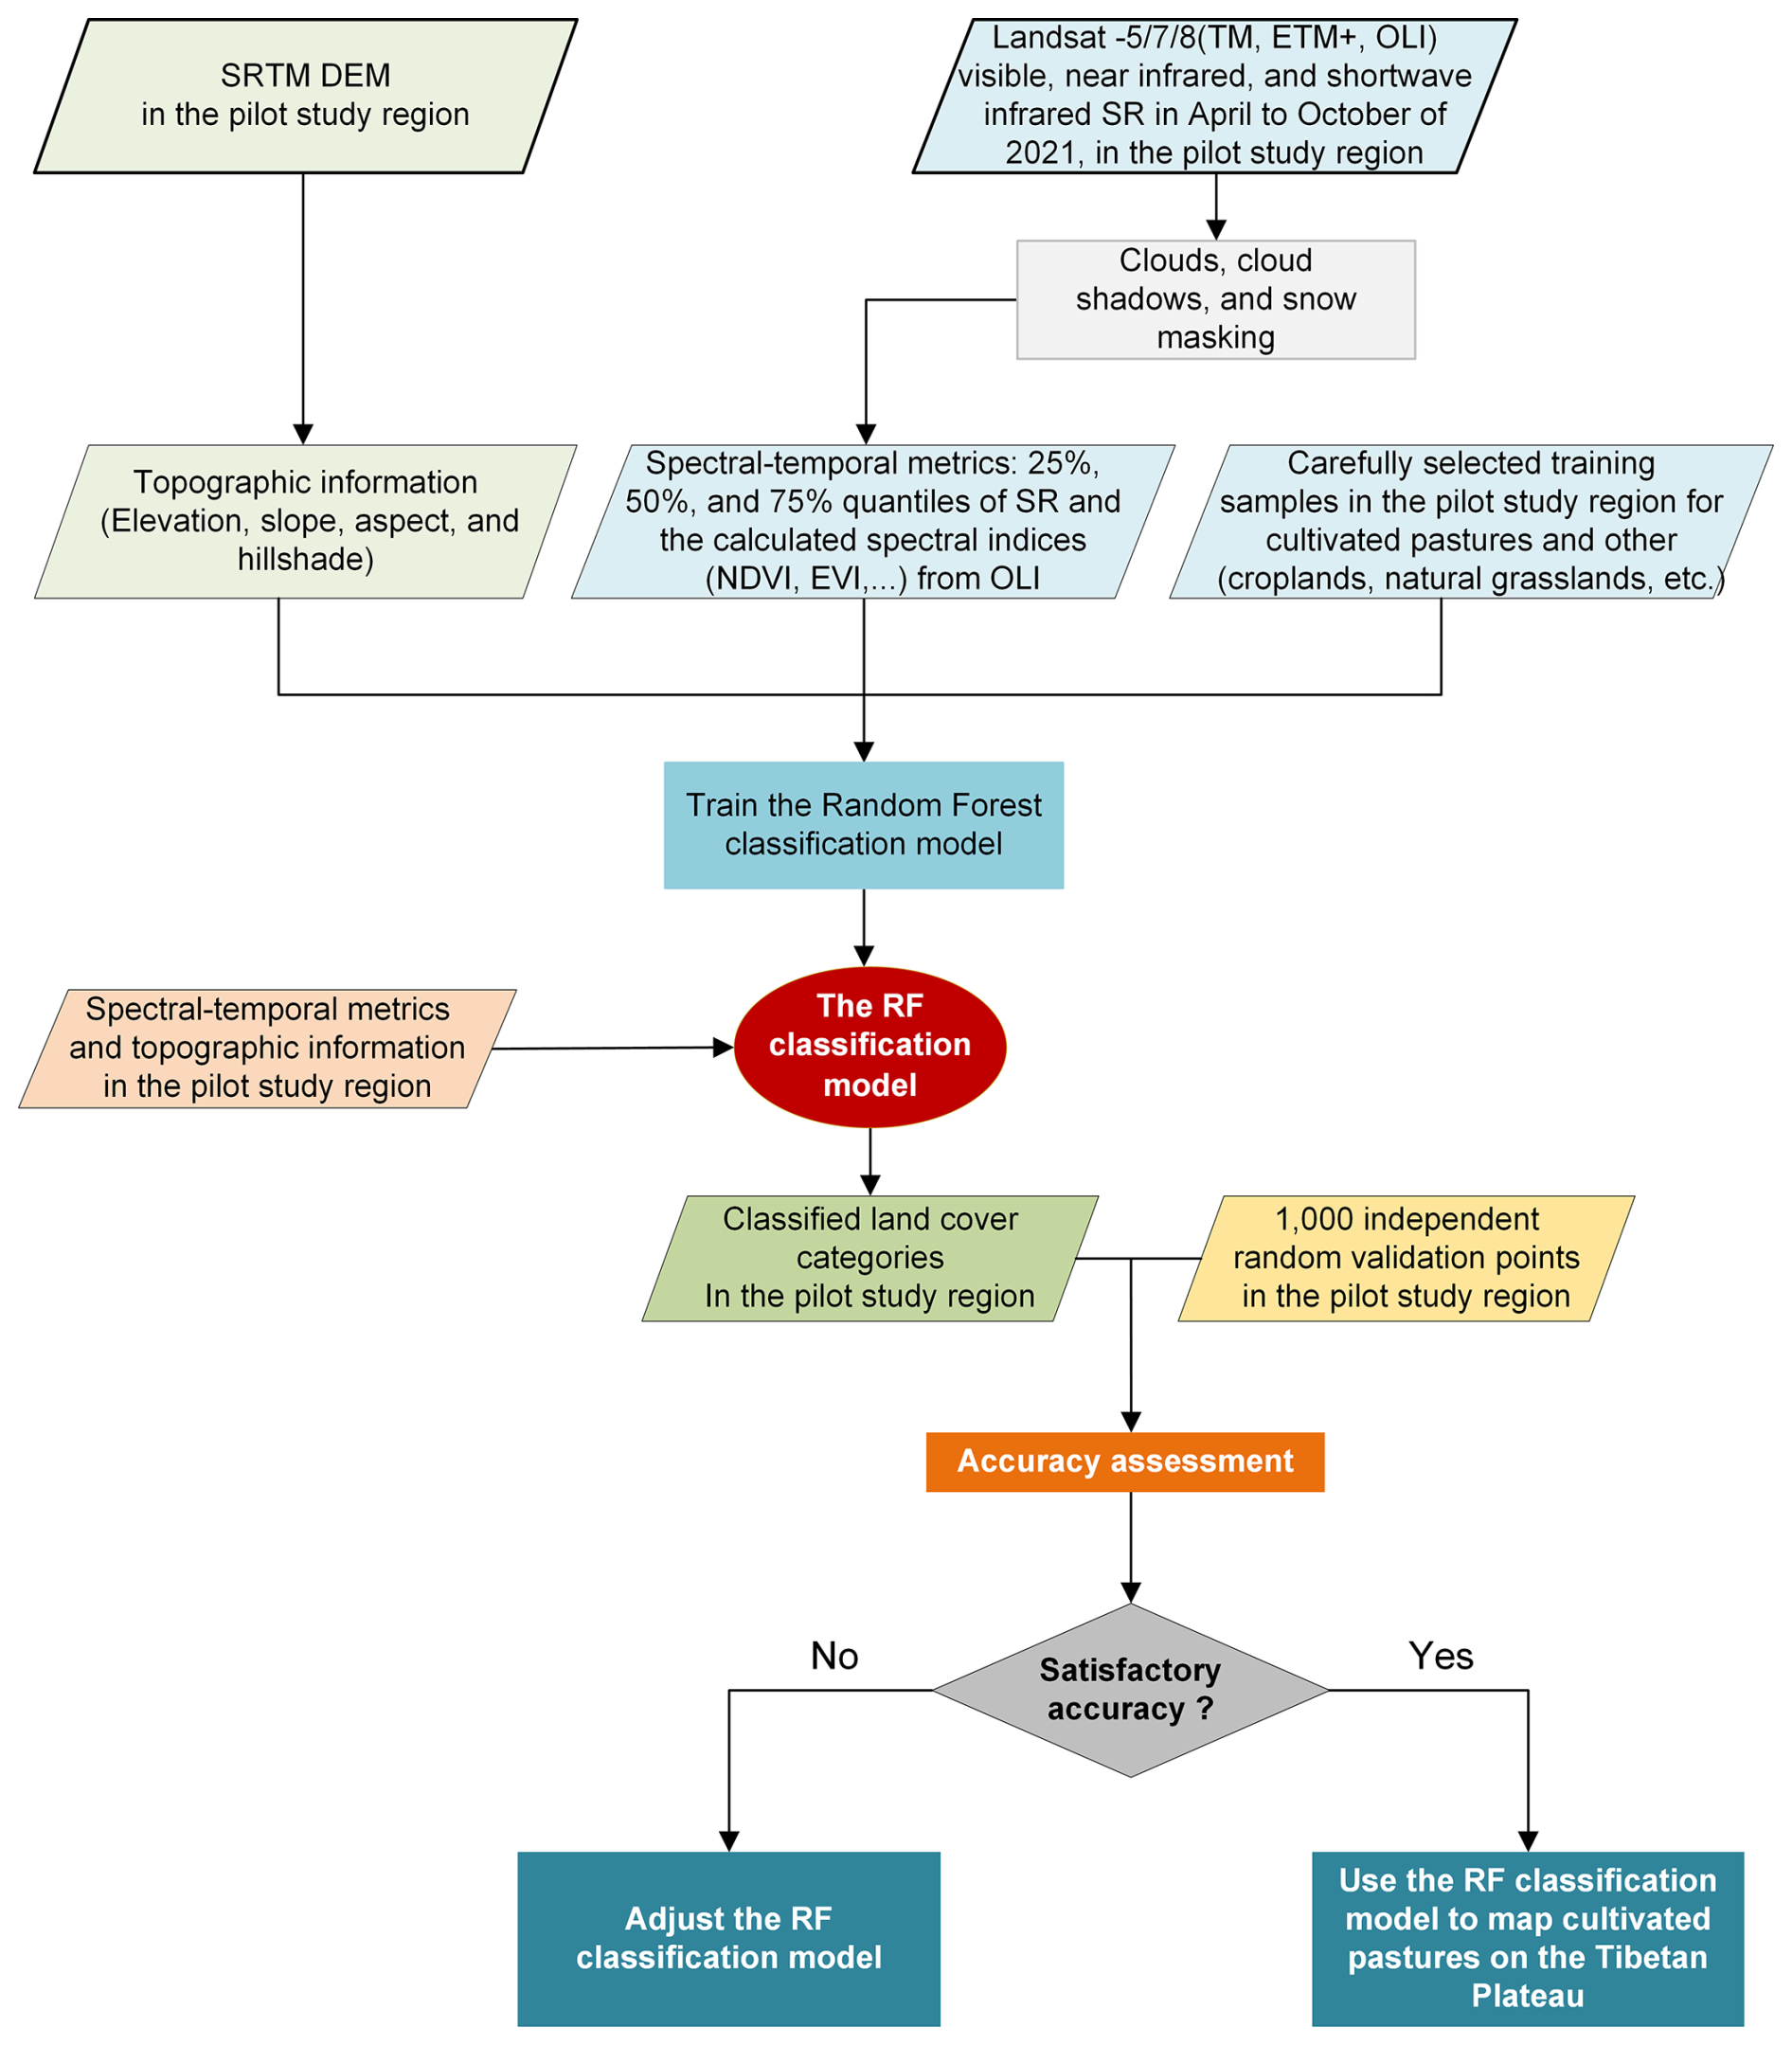
3.5 The binary classification algorithm
An RF binary classification model was used to identify cultivated pastures in the study region (Fig. 4). The classification model consisted of 500 trees and used the spectral–temporal metrics of the remote sensing data (SR in the seven Landsat visible and infrared bands: NDVI, EVI, NBR, NDBI, NDPI, NDWI, and MNDWI) in the growing season, as well as the ancillary topographic data, as inputs. The RF binary classification model was trained using the training polygons shown in Fig. 3a and c. The training process using the GEE platform took 10 min. The RF binary classification model generated the likelihood of each pixel belonging to the two land cover categories (cultivated pasture and other) and classified the pixel into the land cover category with the higher likelihood.
The RF binary classification model was assessed in the pilot study regions using the validation points (refer to Sect. 3.6). When the classification's overall accuracy was not satisfactory (less than 90 %), the model was adjusted by refining the training polygons by excluding cultivated-pasture polygons with possible mixed-pixel problems until the overall accuracy was over 95 %.
3.6 Accuracy assessment and area estimation
To evaluate the accuracy of the cultivated-pasture mapping, we used 1000 randomly selected independent validation points in the pilot study region of Qinghai Province and another 1000 in the pilot study region of the Tibet Autonomous Region, as shown in Fig. 3b and d. Independent validation was used rather than cross-validation to avoid overestimating the accuracy of classified land cover maps (Foody, 2002; Friedl et al., 2000). Two authors independently labeled the land cover type of each validation site as either being cultivated pastures or not using high-spatial-resolution images on Google Earth. To visualize the spatial extent of a validation site, a 30 m radius buffer circle with the validation site as the center was introduced. The authors used field knowledge gained during the 2021 campaign to label the validation sites. For instance, forage production companies in the pilot study regions typically managed cultivated pastures using heavy mechanical machines. As a result, tractor furrows were present, but field ridges were not. In contrast, many field ridges were visible in conventional croplands managed by small household farmers.
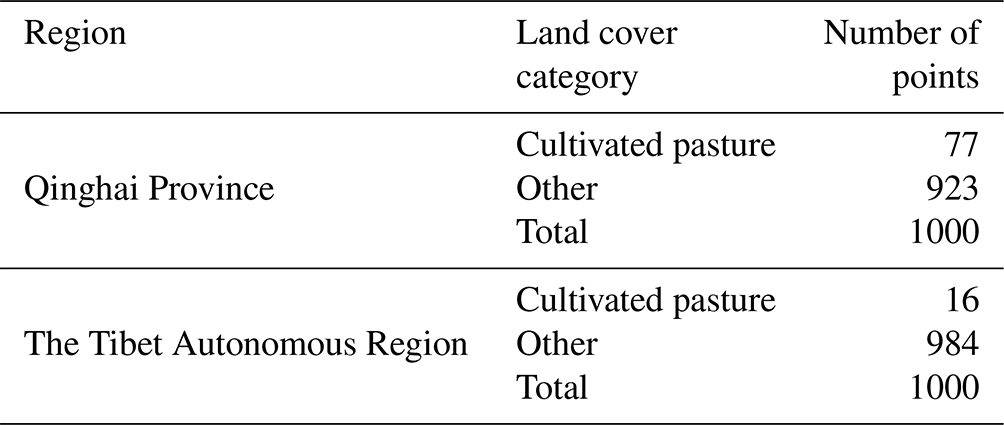
When both interpretations agreed, the identified land cover category was assigned to the validation point. In cases when the two interpretations did not agree, a third author was invited to resolve the conflict. The land cover category determined by the three coauthors was then assigned to the validation point. The labeled independent random validation reference points are illustrated in Fig. 3b and d and summarized in Table 3.
Table 3Summary of the labeled independent random validation points in the pilot study regions in Qinghai Province and the Tibet Autonomous Region.
The overall, producer's, and user's accuracies of the trained RF binary classification model in the pilot study regions were calculated. Since this was a binary classification, the F1 spatial consistency score (based on precision and recall) was also calculated. The kappa coefficient was not reported since it has been proven to be unsuitable for assessing land cover maps' accuracy (Foody, 2002). To compute the uncertainties of the overall accuracy, producer's accuracy, user's accuracy, and F1 spatial consistency score, we used the method described in Yang et al. (2024). In addition, we computed the areas of cultivated pastures in each of the pilot study regions and the uncertainties using the method described in Olofsson et al. (2014).
In this study, our primary objective was to assess the quality of the final cultivated-pasture dataset rather than the performance of the classification model per se. Therefore, we employed an independent validation approach using a separate set of reference data instead of cross-validation. This approach is better suited to evaluating the accuracy and reliability of the dataset itself.
4.1 The maps of cultivated pastures in the pilot study regions in 2021
Figures 5a and 6a show the extent of cultivated pastures in the pilot study regions in 2021, when the field campaign was conducted. In the pilot region in Qinghai Province, cultivated pastures were mainly distributed around Qinghai Lake and in valleys with favorable hydrothermal conditions. In the pilot study region in the Tibet Autonomous Region, cultivated pastures were primarily located in low-altitude regions such as Shigatse, Lhasa, Shannan, Nyingchi, and Chamdo. Figures 5b and 6b show the number of valid Landsat OLI observations during the 2021 growing season in the pilot study regions. The RF binary classification model generated the likelihood of each pixel belonging to one of two land cover categories: cultivated pasture and other. The land cover category with the higher likelihood was assigned to the pixel grid. For instance, Figs. 5c and 6c illustrate the likelihood of each pixel belonging to the cultivated-pasture category.
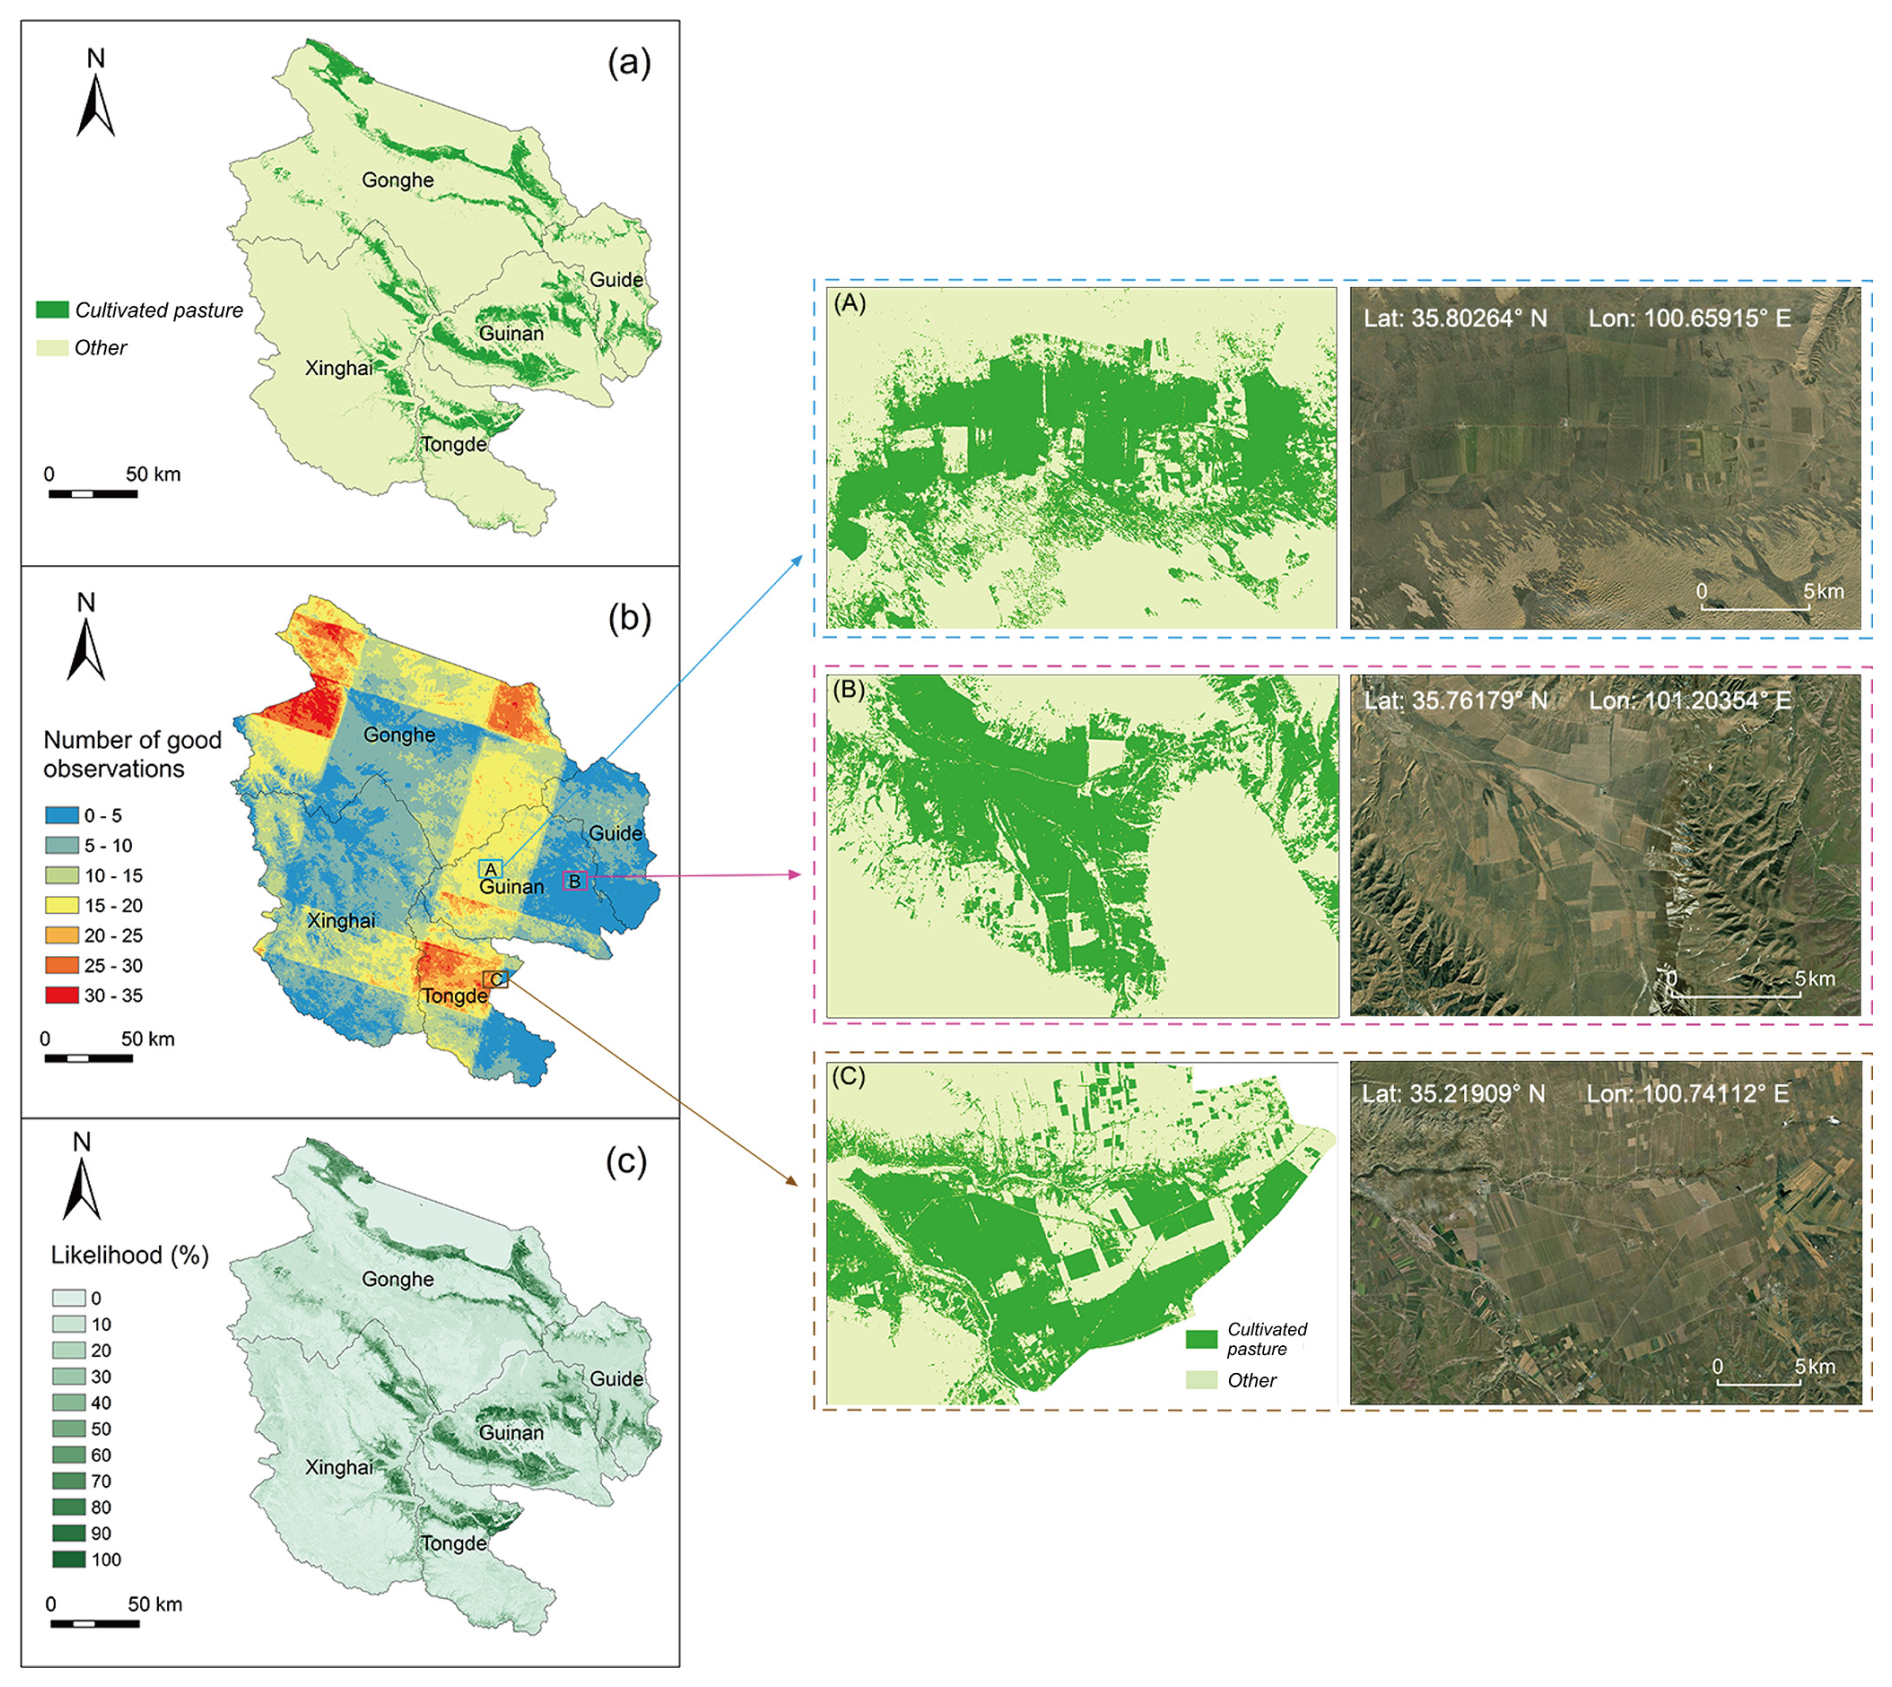
Figure 5Mapped cultivated pastures in the Qinghai Province pilot study region in 2021. (a) Despite displaying a similar spectrum to natural grasslands during the peak growing season, cultivated pastures were identified by the RF binary classification model. (b) The number of good observations from Landsat OLI in the pilot study region in 2021. Close-up views of the three regions (A, B, and C) are shown in the right panel. In particular, region B had fewer than five good observations, but this did not prevent the RF binary classification algorithm from identifying cultivated pastures there. (c) The likelihood of each 30 m grid being classified as cultivated pasture in the pilot study region. The likelihood was calculated by the RF binary classification algorithm.
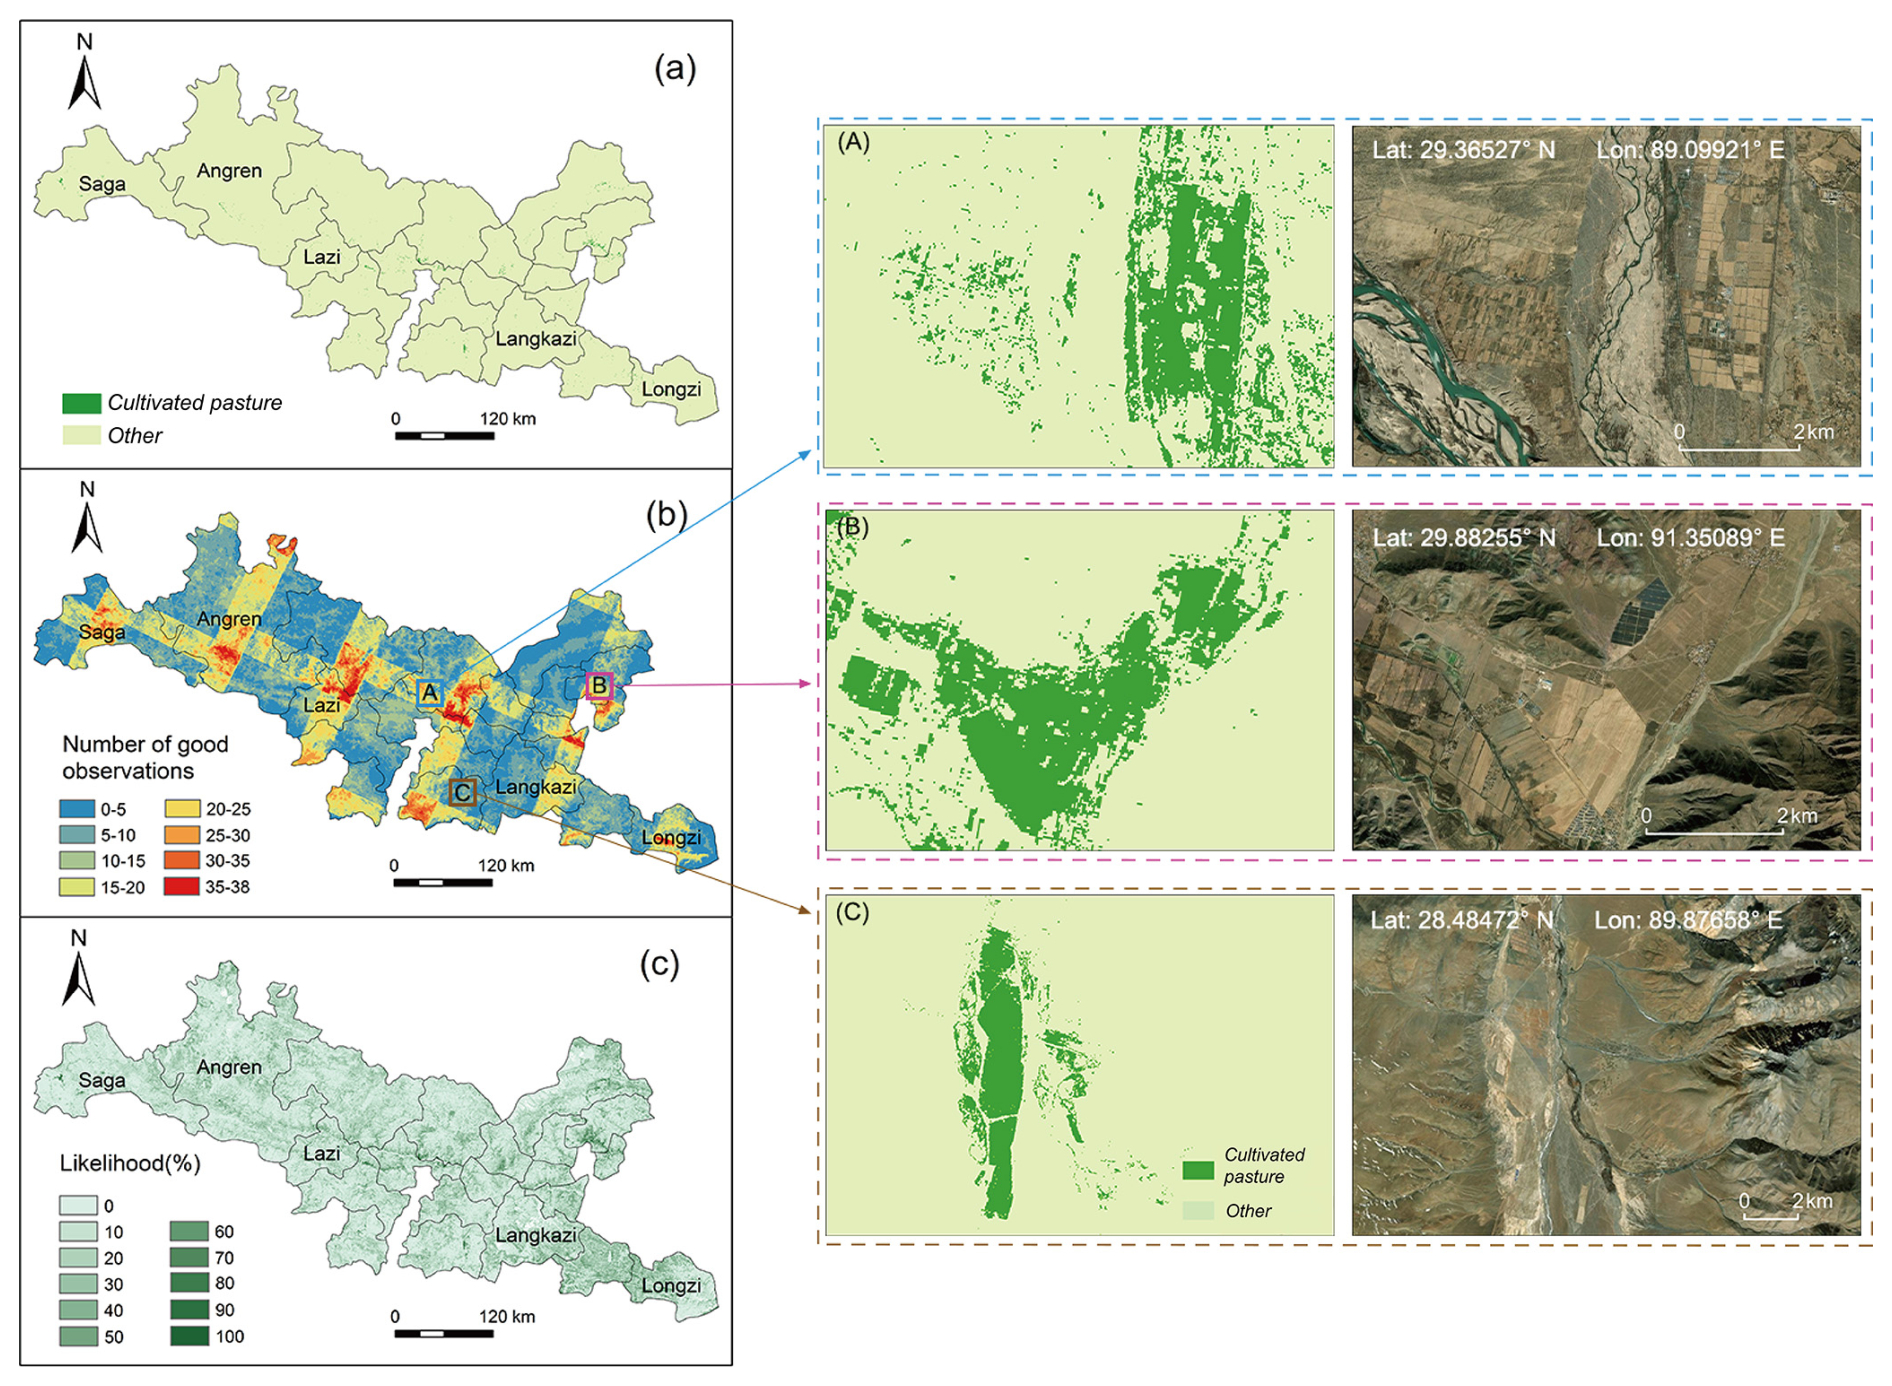
Figure 6Mapped cultivated pastures in pilot study region of the Tibet Autonomous Region in 2021. The panel descriptions are the same as those of Fig. 5.
The areas of cultivated pastures in the pilot study regions were estimated (Fig. 7a). In the pilot study region in Qinghai Province, cultivated pastures covered 0.422±0.03 Mha, and in the pilot study region of the Tibet Autonomous Region, they covered 0.058±0.03 Mha. In addition, Figs. 5 and 6 provide close-ups illustrating the boundaries of cultivated pastures. The distinct boundaries between cultivated pasture and other suggested that our RF binary classification method could effectively identify cultivated pastures.
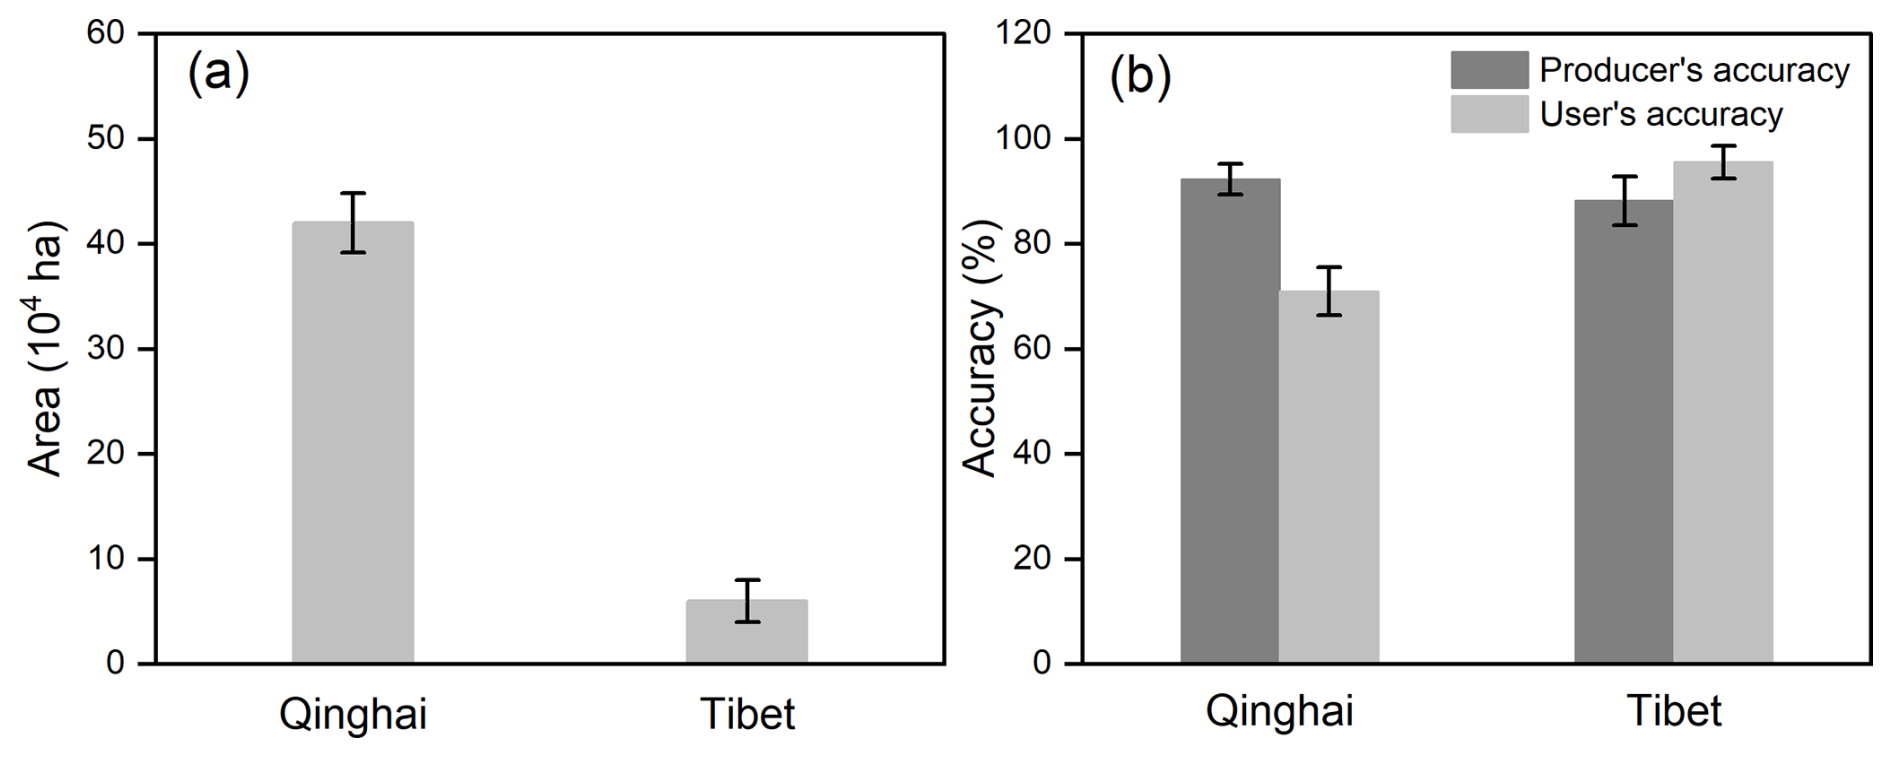
Figure 7The areas and classification accuracies of the mapped cultivated pastures in the pilot study regions in Qinghai Province and the Tibet Autonomous Region.
4.2 Accuracy of the mapping method
The likelihood of cultivated pastures being classified as cultivated pasture was way higher than the likelihood of pastures being classified as other in the pilot study regions of both Qinghai Province and the Tibet Autonomous Region (Fig. S2). As assessed by our independent random validation sites, the cultivated-pasture map in Fig. 5a has an overall accuracy of 96.5 % ± 0.5 % and an F1 spatial consistency score of 80 % ± 12 %, and the land cover map in Fig. 6a has an overall accuracy of 99.2 % ± 0.3 % and an F1 spatial consistency score of 85 % ± 14 % (Table 4). In the Qinghai Province pilot study region, the producer's accuracy (92.3 % ± 2.9 %) was higher than the user's accuracy (71.0 % ± 4.6 %) for cultivated pastures (Fig. 7b), indicating a higher commission error than omission error. In the pilot study region of the Tibet Autonomous Region, the user's accuracy (95.6 % ± 3.1 %) was higher than the producer's accuracy (88.2 % ± 4.6 %) for cultivated pastures (Fig. 7b), indicating a higher omission error than commission error. To evaluate the overall accuracy of the cultivated-pasture mapping, we combined the validation points from Qinghai and Tibet, resulting in an accuracy of 97.05 % ± 0.4 % and an F1 spatial consistency score of 82.51 % ± 14.22 % (precision: 90.04 % ± 6.18 %; recall: 76.74 % ± 9.91 %). In the pilot study regions where the climates and landscapes differ substantially, the overall accuracies of our cultivated-pasture mapping method were both higher than 95 %, indicating that we could use the mapping method to map cultivated pastures on the Tibetan Plateau.
Table 4The error matrix for the cultivated-pasture maps in the pilot study regions in Qinghai Province and the Tibet Autonomous Region.
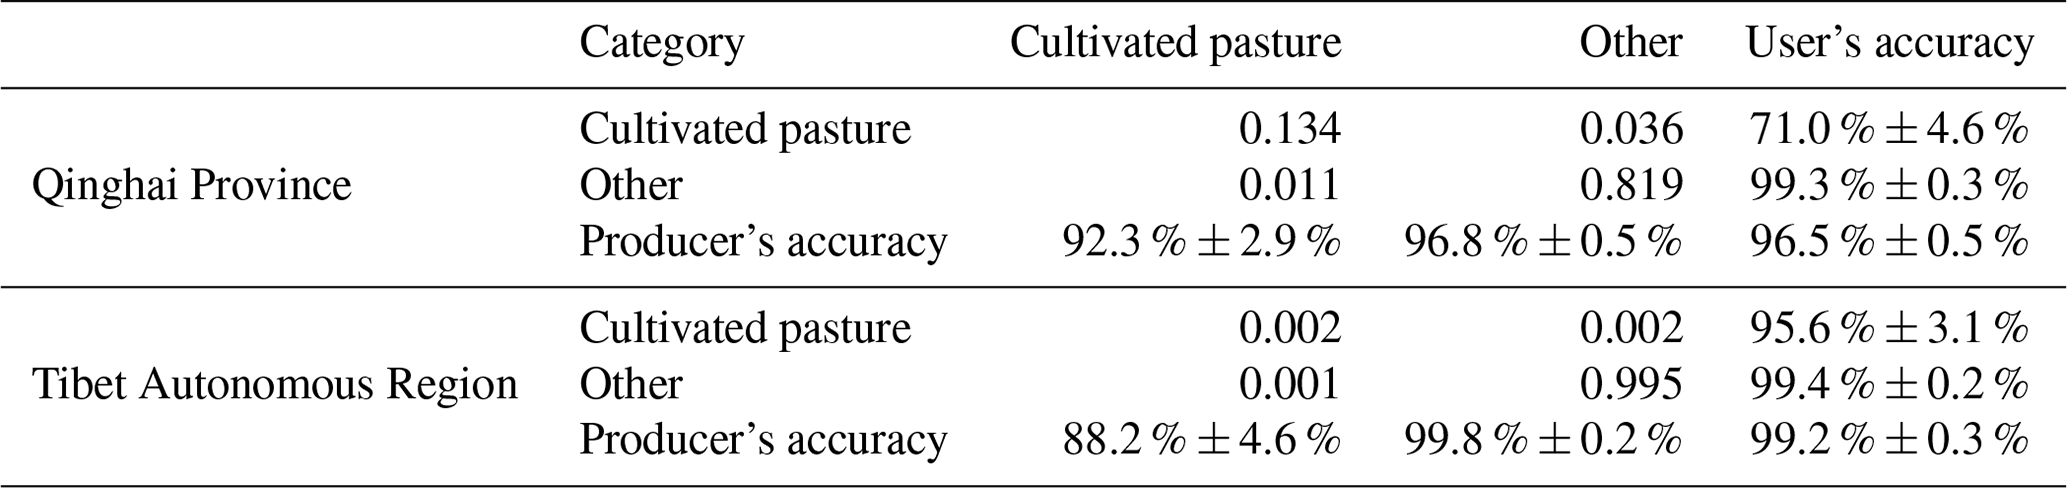
Table 5The importance of each input variable in the trained random forest models for classifying cultivated pastures in Qinghai and Tibet.
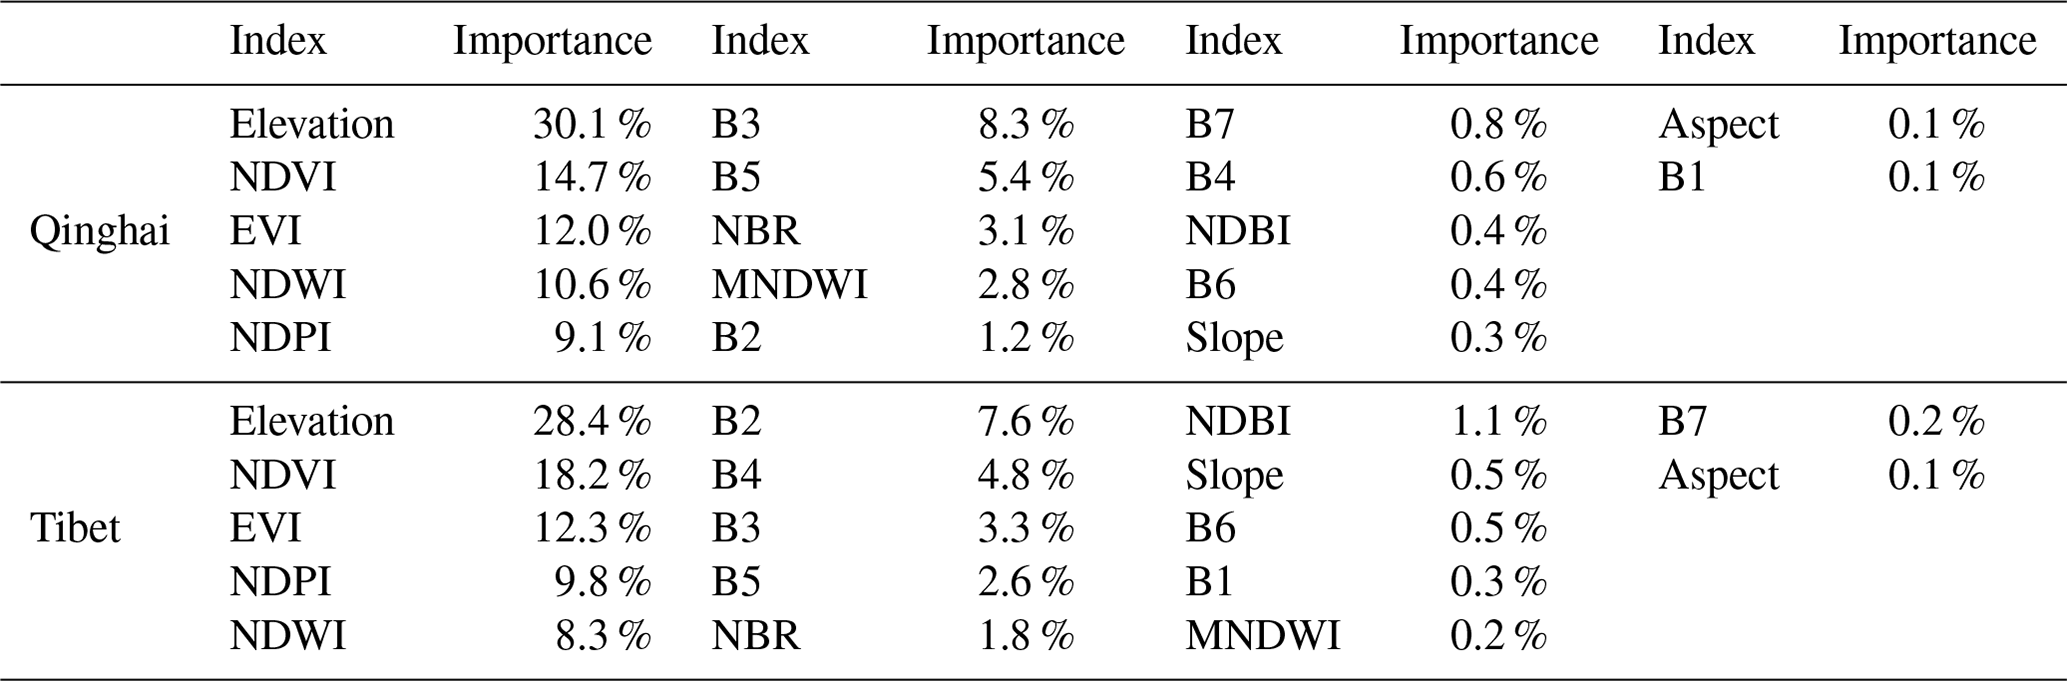
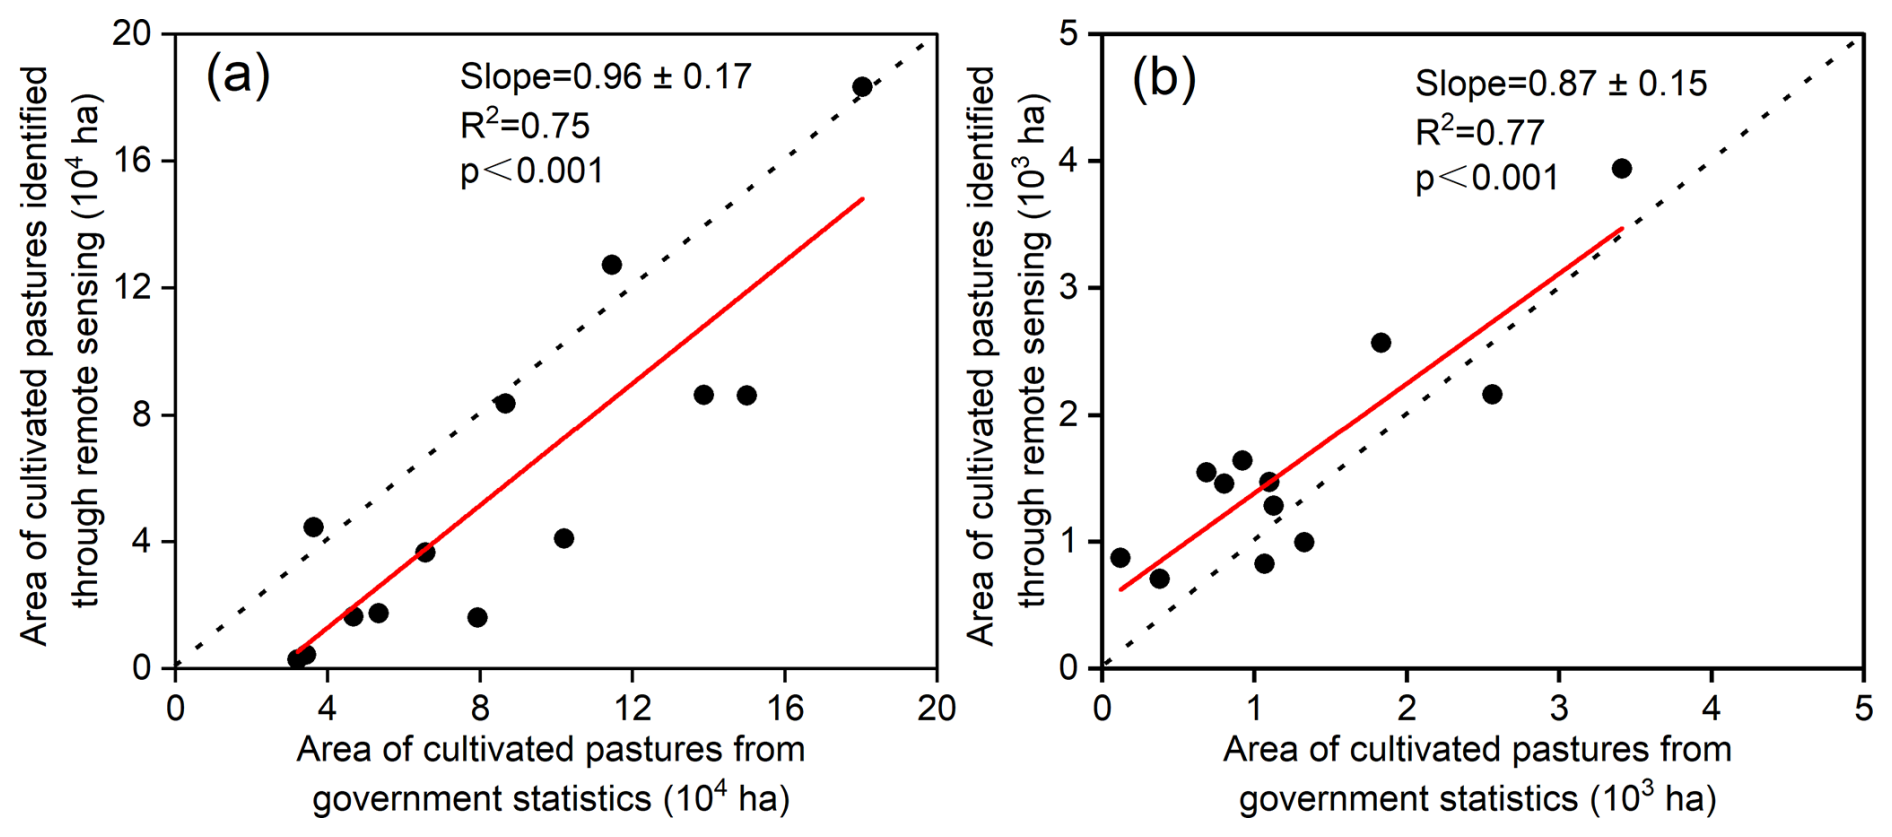
Figure 8Comparison of the areas of cultivated pastures mapped using remote sensing with those from the government statistics at the county level for 2021 in (a) Qinghai Province and (b) the Tibet Autonomous Region. The government statistics of cultivated-pasture areas were from the Qinghai Forestry and Grassland Bureau and the Tibet Autonomous Region Agriculture and Rural Affairs Department.
The importance rankings of input variables in the trained random forest models for classifying cultivated pastures revealed consistent patterns across Qinghai and Tibet (Table 5). In both regions, elevation emerged as the most influential variable, contributing 30.1 % and 28.4 % of the model importance in Qinghai and Tibet, respectively. Vegetation indices such as NDVI, EVI, NDWI, and NDPI also played major roles, collectively accounting for a substantial portion of the variable importance in both regions. For instance, NDVI contributed 14.7 % in Qinghai and 18.2 % in Tibet. Spectral bands (e.g., B2, B3, B4, B5) had moderate to low importance, while topographic variables such as slope and aspect, along with certain indices like NDBI and MNDWI, showed relatively minor contributions. These findings underscore the critical role of both topography and vegetation dynamics in distinguishing cultivated pastures on the Tibetan Plateau.
We also compared the area of cultivated pastures mapped using remote sensing with those from the government statistics. In the government statistics reports on grasslands in 2021, there were 13 county-level summaries of the area of cultivated pastures in Qinghai Province and 12 county-level summaries of the area of cultivated pastures in the Tibet Autonomous Region (Table S1 in the Supplement). We compared these with the areas of cultivated pastures mapped using remote sensing data (Fig. 8). Our estimates using remote sensing data matched well with those from the government statistics.
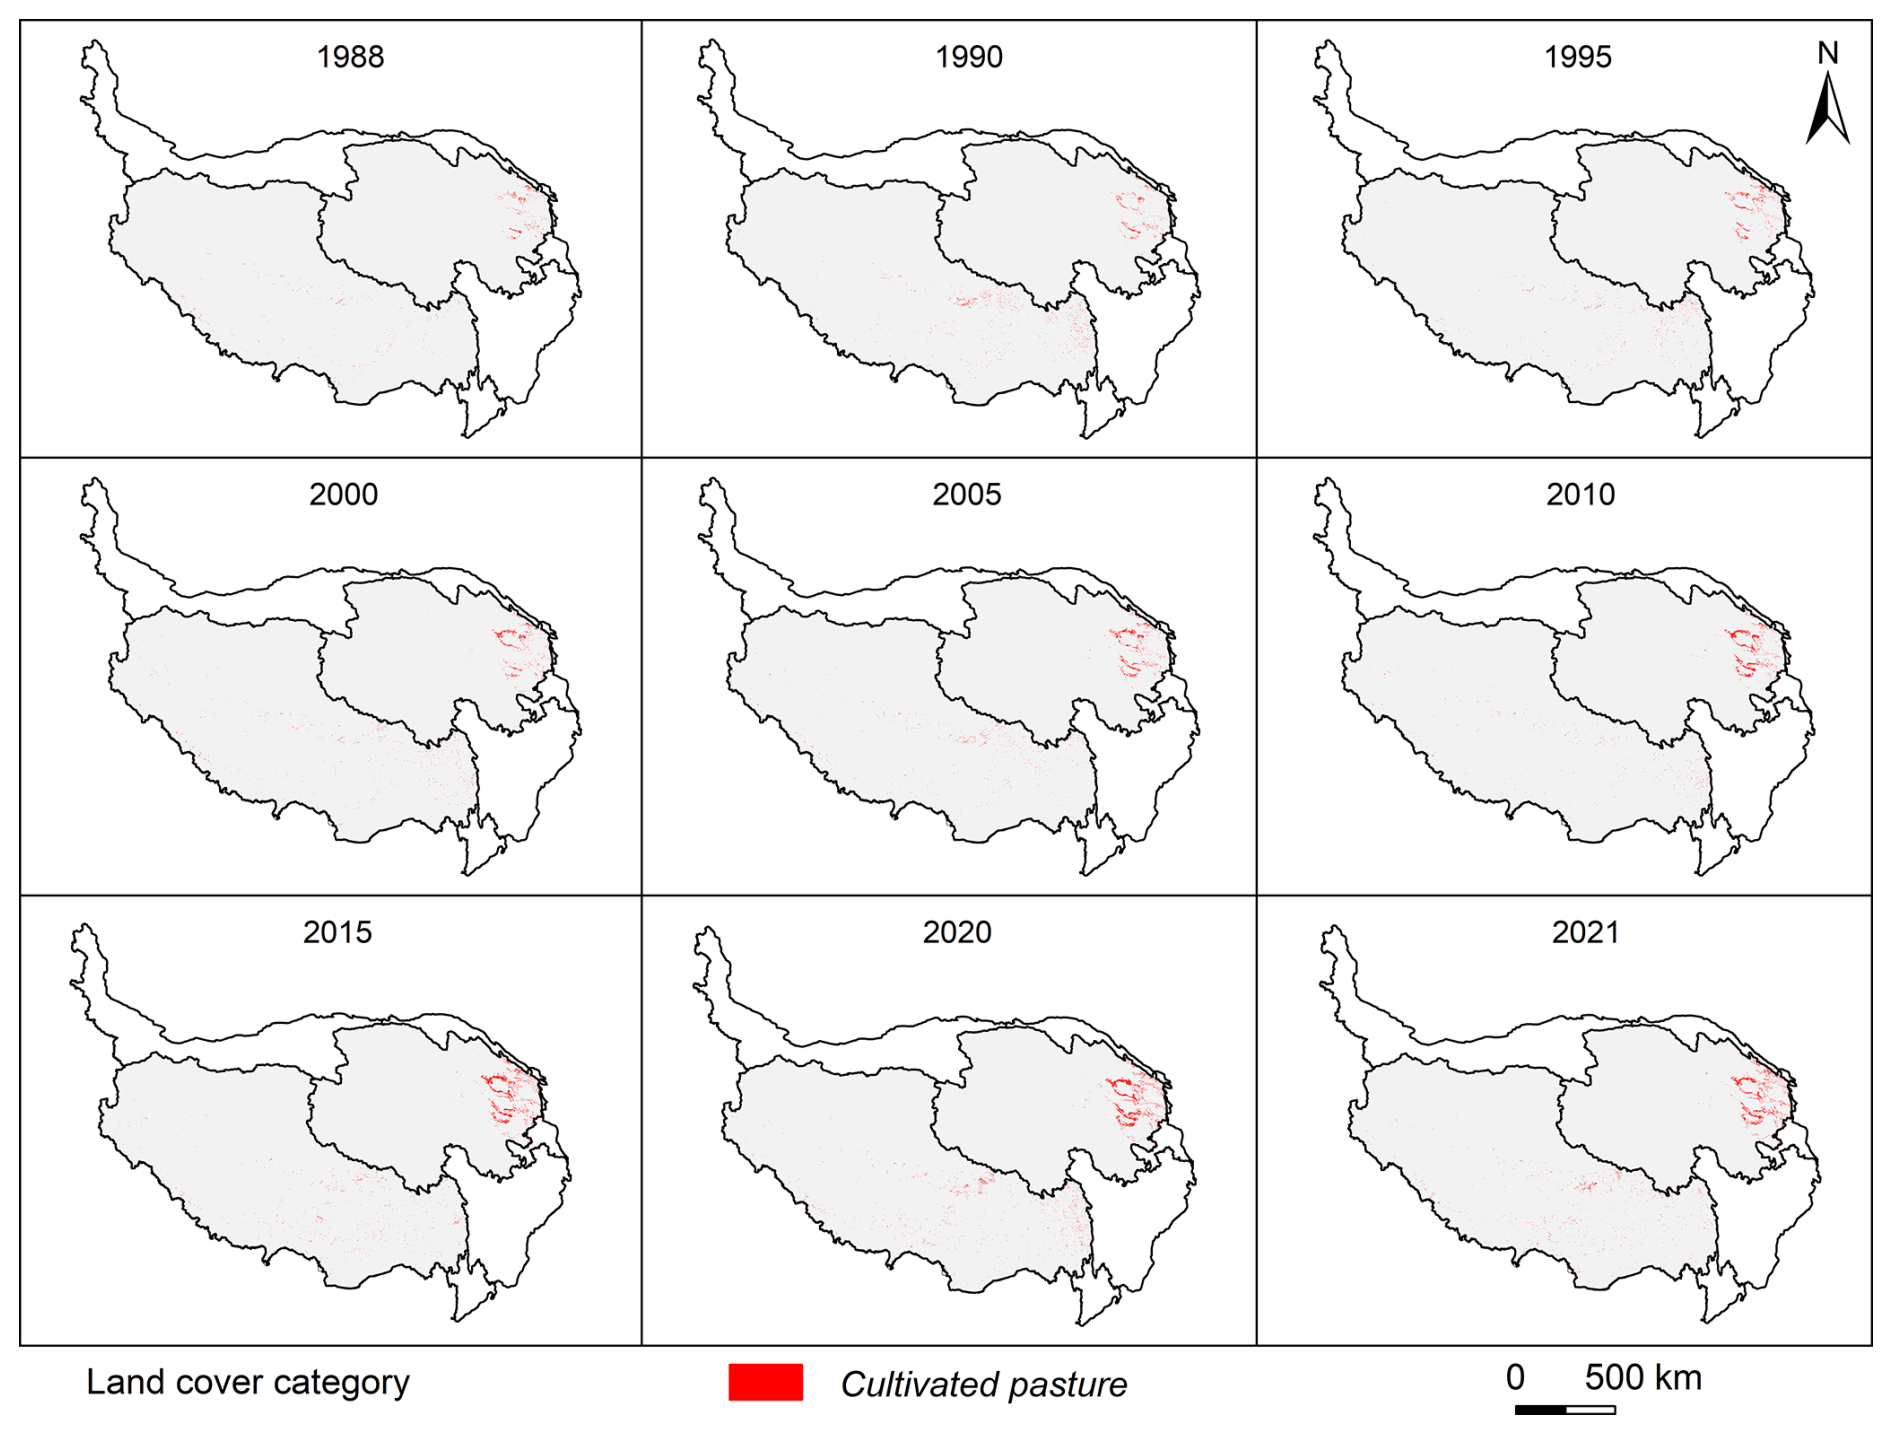
Figure 9The maps of cultivated pastures in Qinghai Province and the Tibet Autonomous Region on the Tibetan Plateau from 1988 to 2021 (selected years are displayed for brevity, and the whole time series can be found in Fig. S3).
4.3 The spatial and temporal distribution of cultivated pastures on the Tibetan Plateau
Using the Landsat data from 1988 to 2021 over the Tibetan Plateau, we mapped the annual distribution of cultivated pastures in Qinghai Province and the Tibet Autonomous Region (Fig. 9). Generally, cultivated pastures mainly appeared in certain regions on the plateau. (1) In Qinghai Province, the regions are the Qinghai Lake area (the counties of Gangcha, Haiyan, Huangyuan, Gonghe, Guide, Dulan, and Wulan), the Qilian Mountain area (the counties of Qilian and Menyuan), the Three-River Headwaters area (the counties of Guinan, Tongde, Xinghai, Maqin, Dari, and Jiuzhi), and the Yushu area. (2) In the Tibet Autonomous Region, the regions are northern Tibet (the counties of Bange, Nima, Dinqing, Naqu, and Gaize); southeastern Tibet (the counties of Longzi, Qunar, and Basu); and the watersheds of the rivers Yarlung Tsangpo, Lhasa, and Nianchu (the counties of Gongga, Linzhou, Dangxiong, Kangma, Nanmuling, and Saga). The cultivated pastures in Qinghai were more clustered, while in Tibet they were more dispersed.
Cultivated pastures in Qinghai Province existed longer than in the Tibet Autonomous Region (Fig. 10). In Qinghai Province, many cultivated pastures existed for more than 20 years, from 1988 to 2021, especially around the Qinghai Lake. In the Tibet Autonomous Region, cultivated pastures were generally in existence for less than 10 years. Some of the cultivated pastures were established in very recent years, coinciding with the introduction of regional farming policies promoting the development of cultivated pastures (Fig. S4).
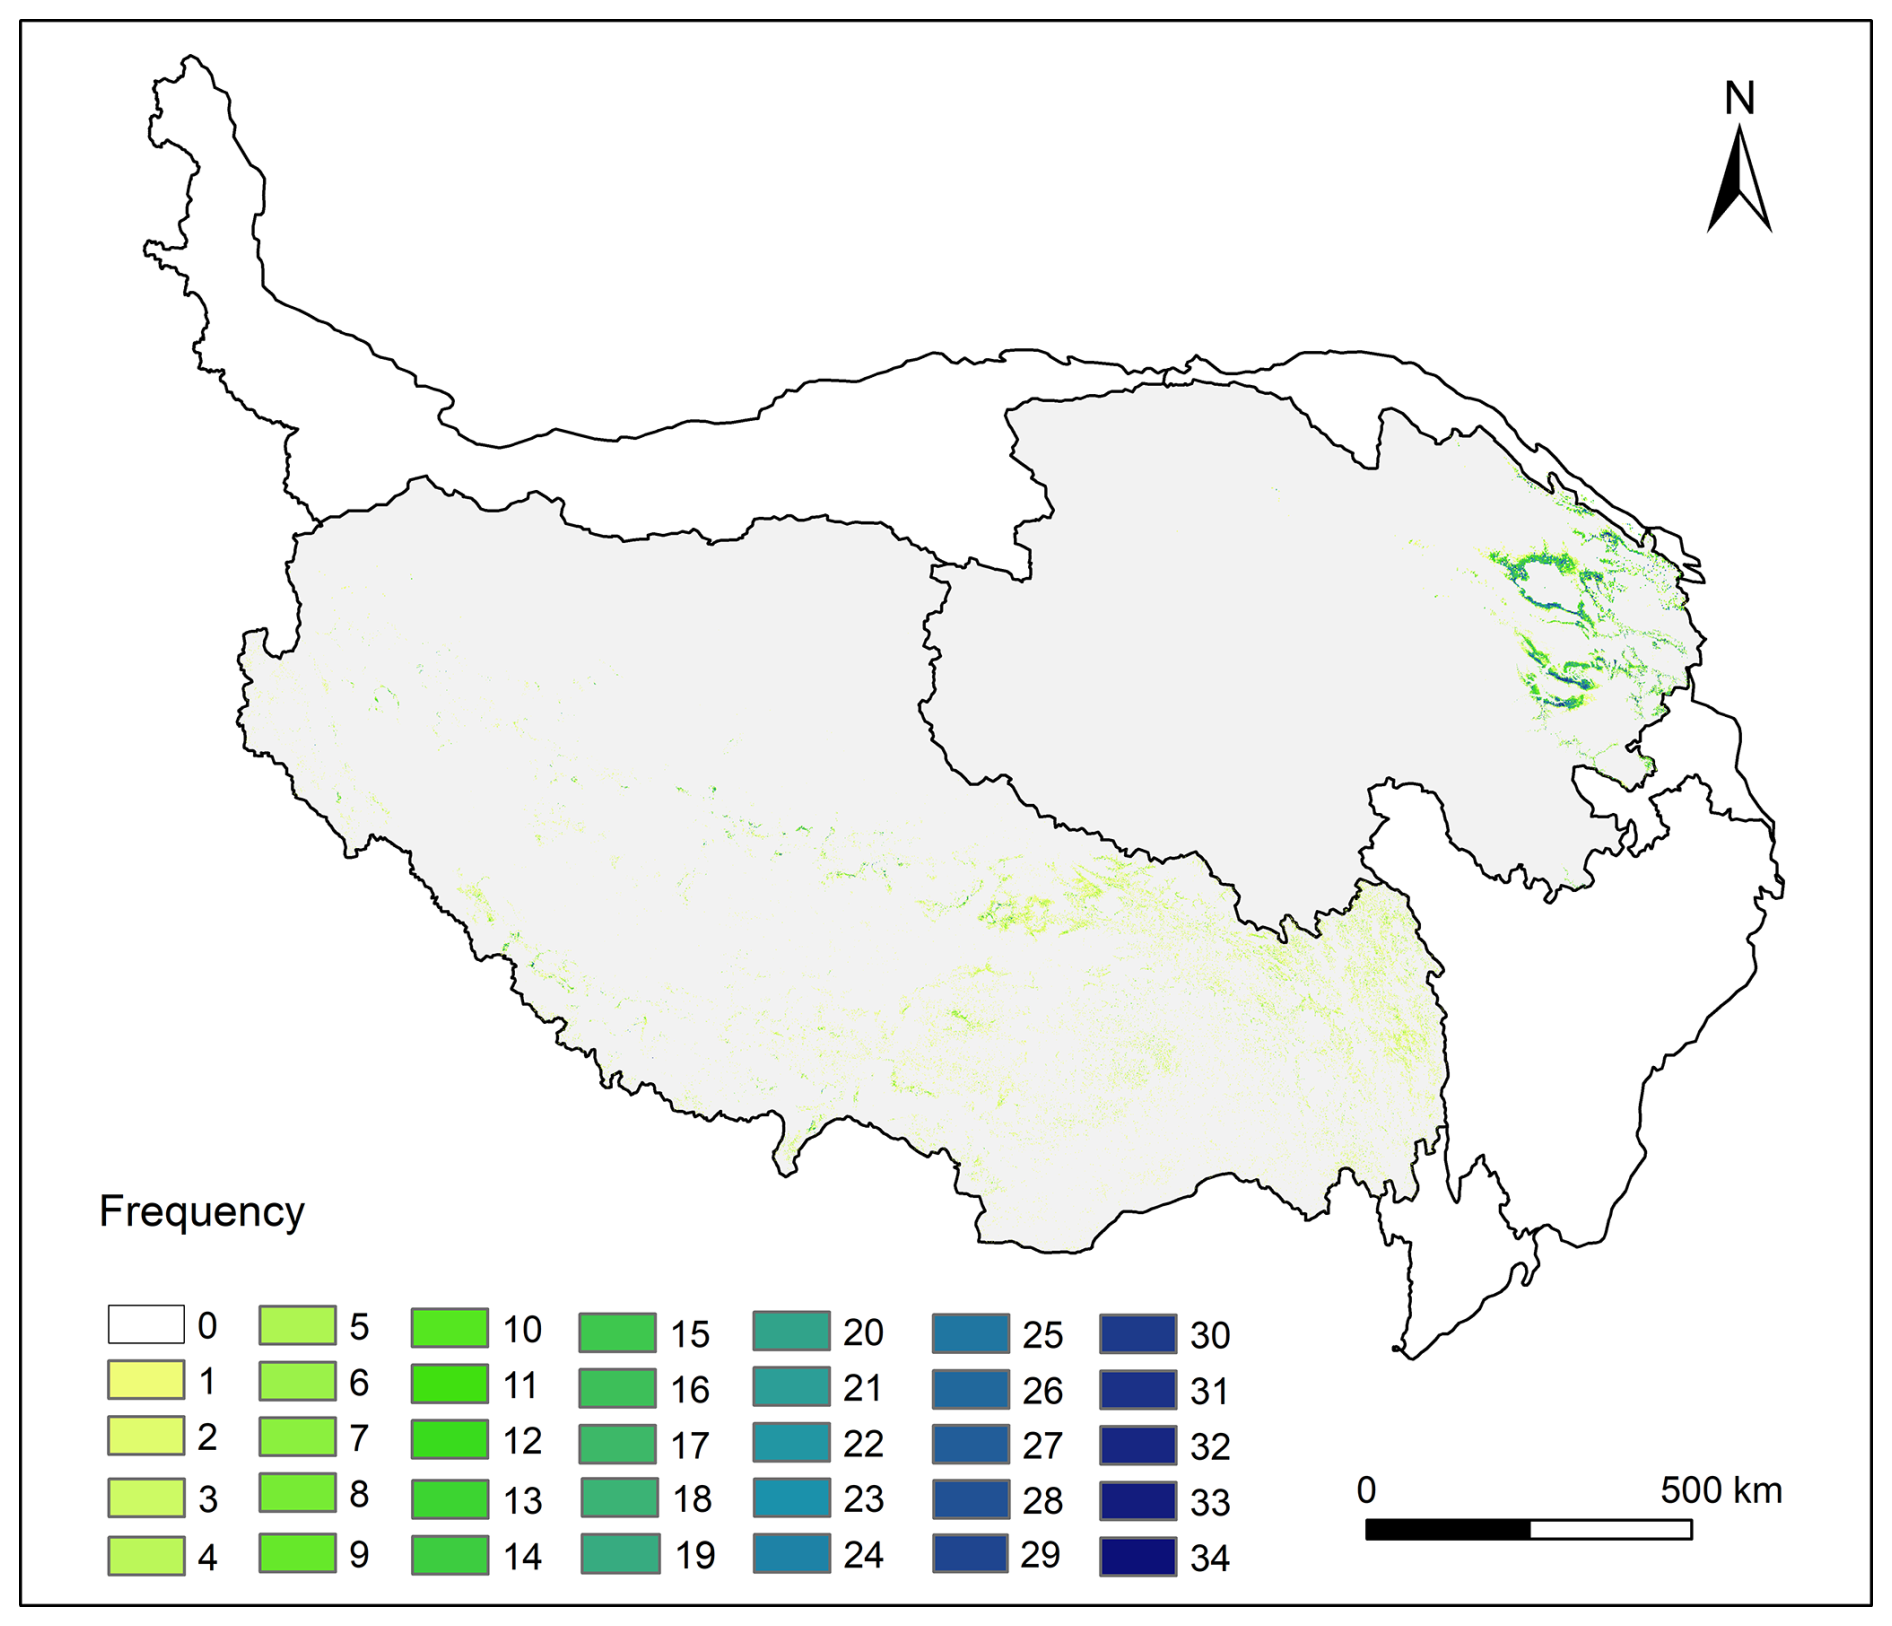
Figure 10The number of years that cultivated pastures existed in each 30 m grid in Qinghai Province and the Tibet Autonomous Region from 1988 to 2021.
There were government statistics data for cultivated pasture areas at the province level in Qinghai Province and the Tibet Autonomous Region from 2001 to 2021. But only in the years from 2010 to 2017 did the government's statistical caliber of cultivated pastures roughly align with our definition of cultivated pastures, and the cultivated pasture areas reported by government statistics were reasonably close to those mapped using remote sensing from 2010 to 2017 (Fig. 11). Since the statistical criteria for cultivated pastures used by local governments do not fully align with our definition, we focused the comparison between our results and government statistics at the county level on correlation metrics rather than absolute or relative errors (Fig. 8 and Table S1). The coefficients of determination were 0.75 for Qinghai and 0.77 for Tibet, indicating the reliability of our results.
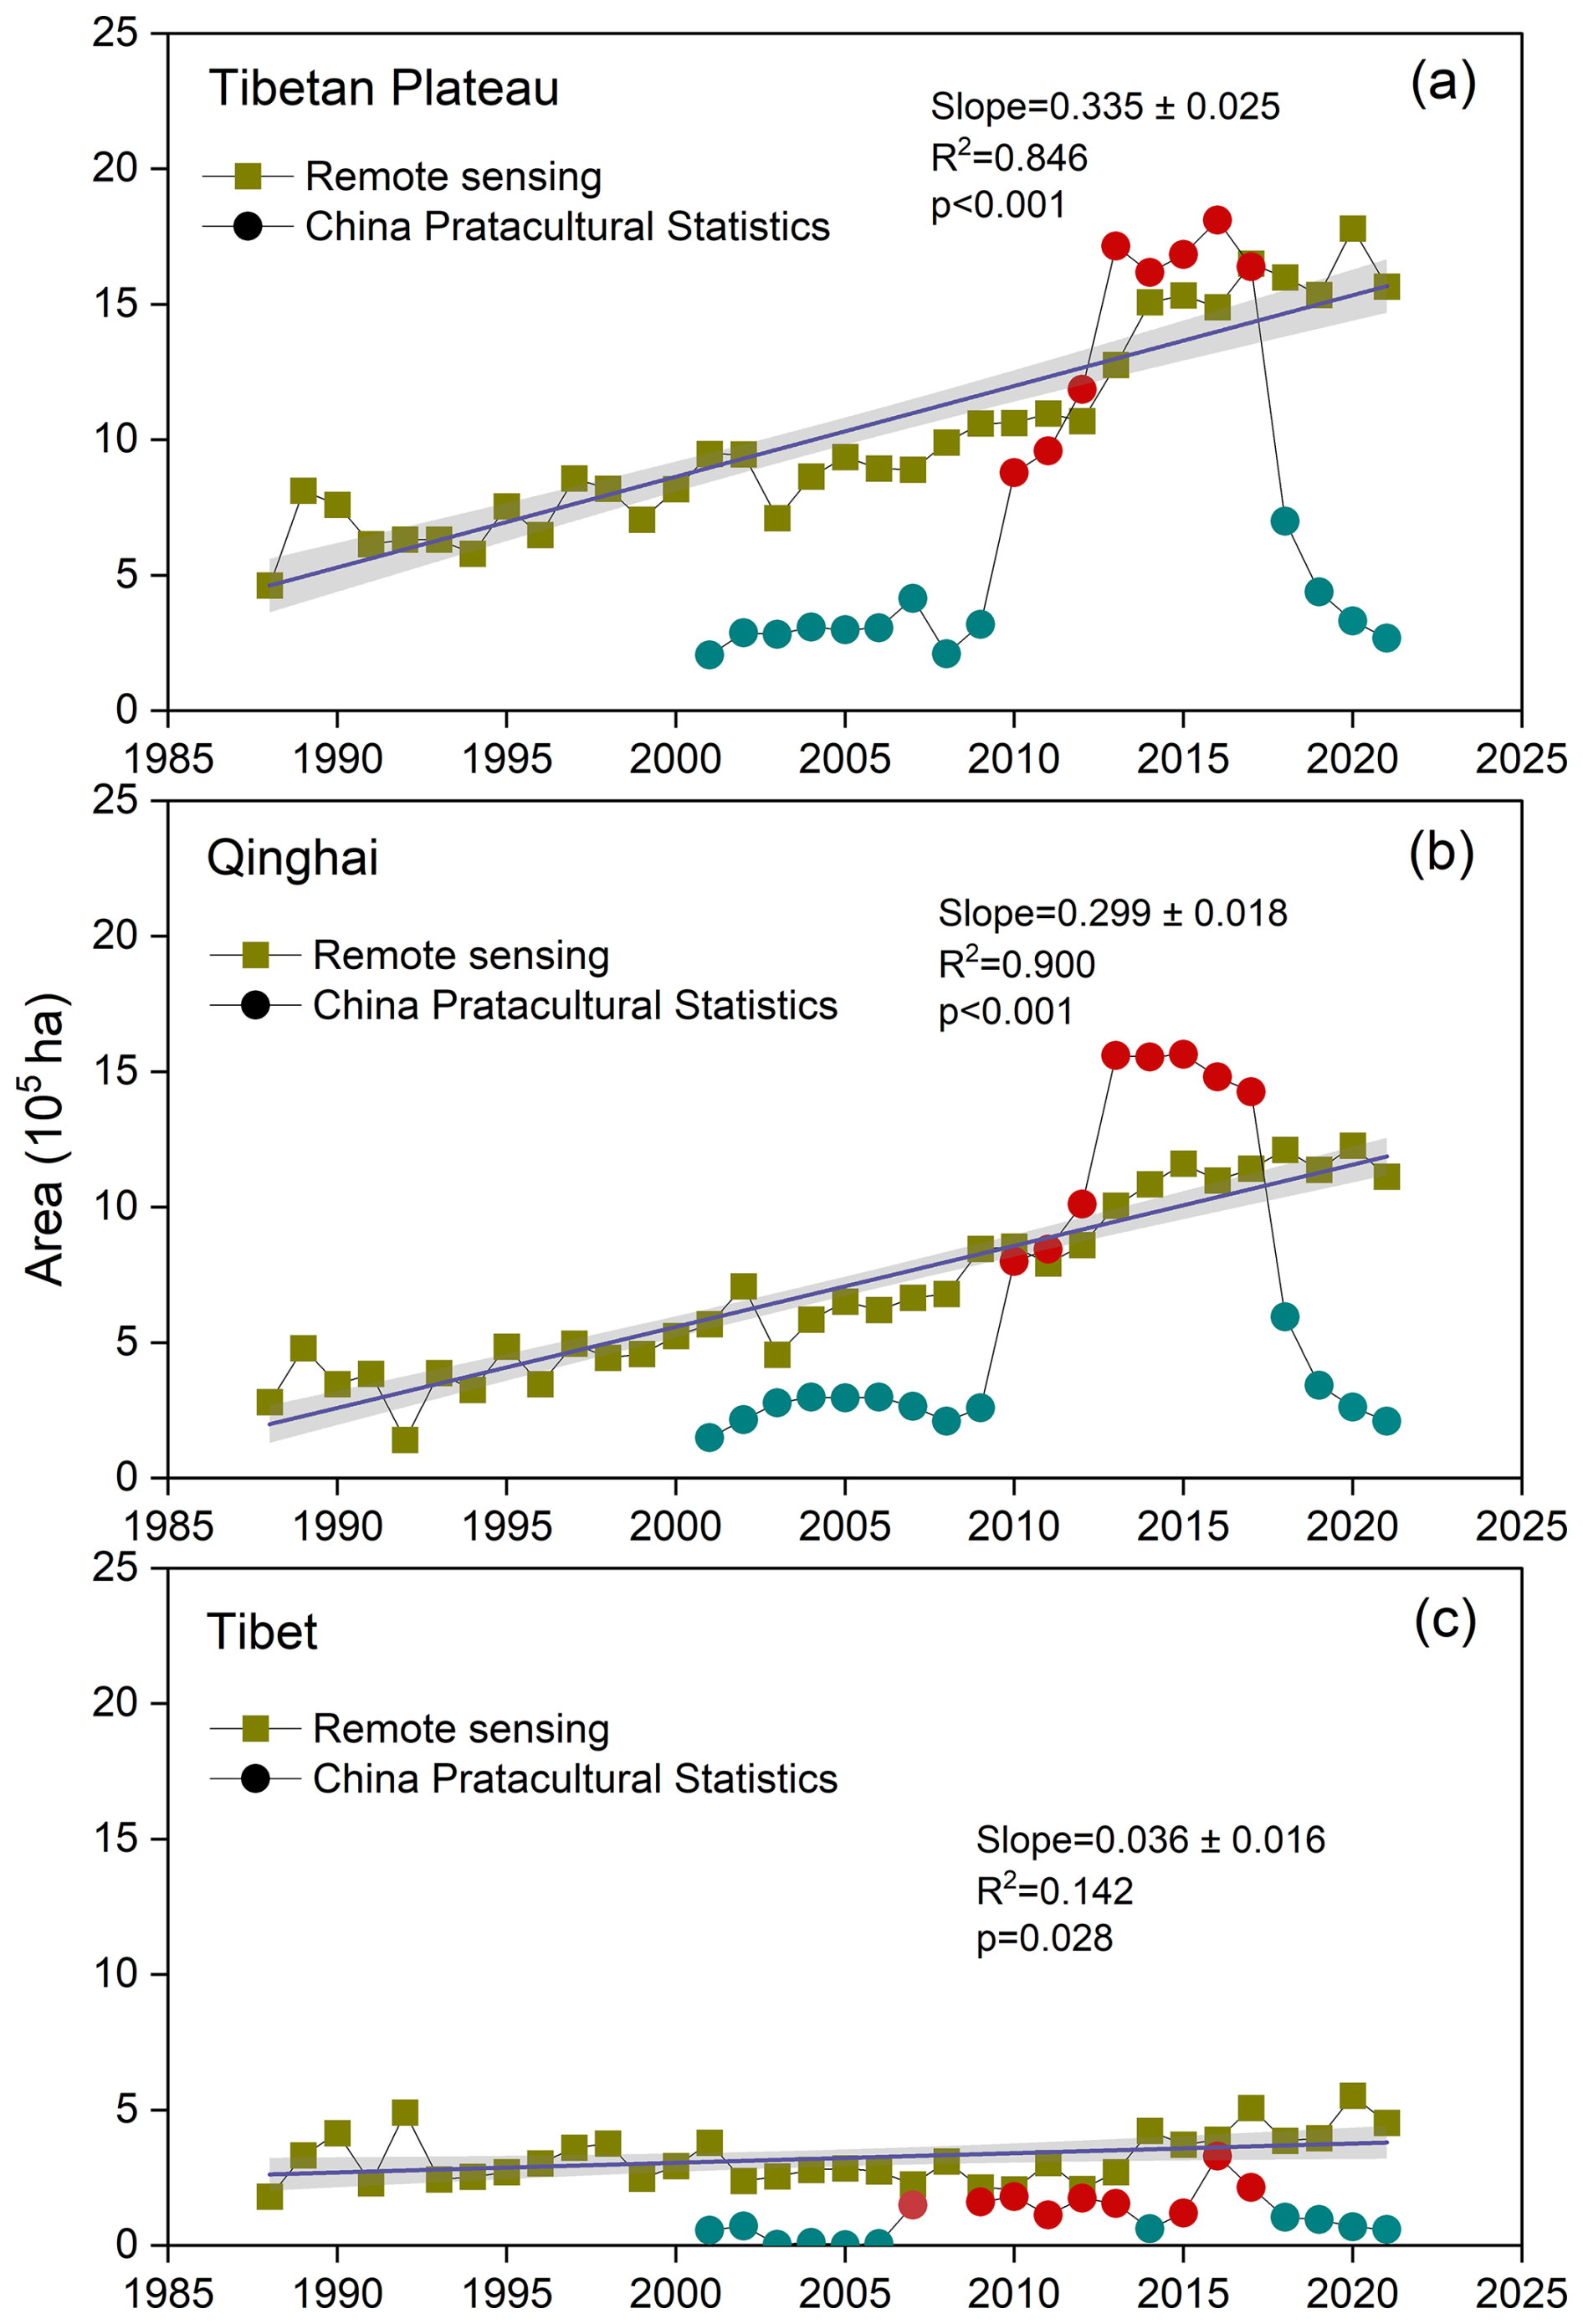
Figure 11The time series of cultivated-pasture areas based on remote sensing and the government statistics data for (a) the Tibetan Plateau, (b) Qinghai Province, and (c) the Tibet Autonomous Region. The red dots in the China Pratacultural Statistics time series correspond to the years when the cultivated-pasture statistical caliber aligned with our definition of cultivated pasture in the remote sensing mapping efforts.
The average area of cultivated pastures on the plateau from 1988 to 2021 was approximately 1.0 Mha, with ∼0.7 Mha in Qinghai and ∼0.3 Mha in Tibet. From 1988 to 2021, there was an increasing trend in the area of cultivated pastures on the plateau based on our mapping results using remote sensing data (Fig. 11a), and the increasing trend was mostly due to the expansion of cultivated pastures in Qinghai (Fig. 11b and c). The increasing rate of the area of cultivated pastures on the Tibetan Plateau was 33.5±2.5 Kha yr−1. In most counties of Qinghai Province and the Tibet Autonomous Region, cultivated-pasture areas did not change much from 1988 to 2021 (Fig. 12). Cultivated pastures expanded substantially in Gonghe, Gangcha, Guinan, and Xinghai, while they contracted notably in Karuo and Luolong (Table S2).
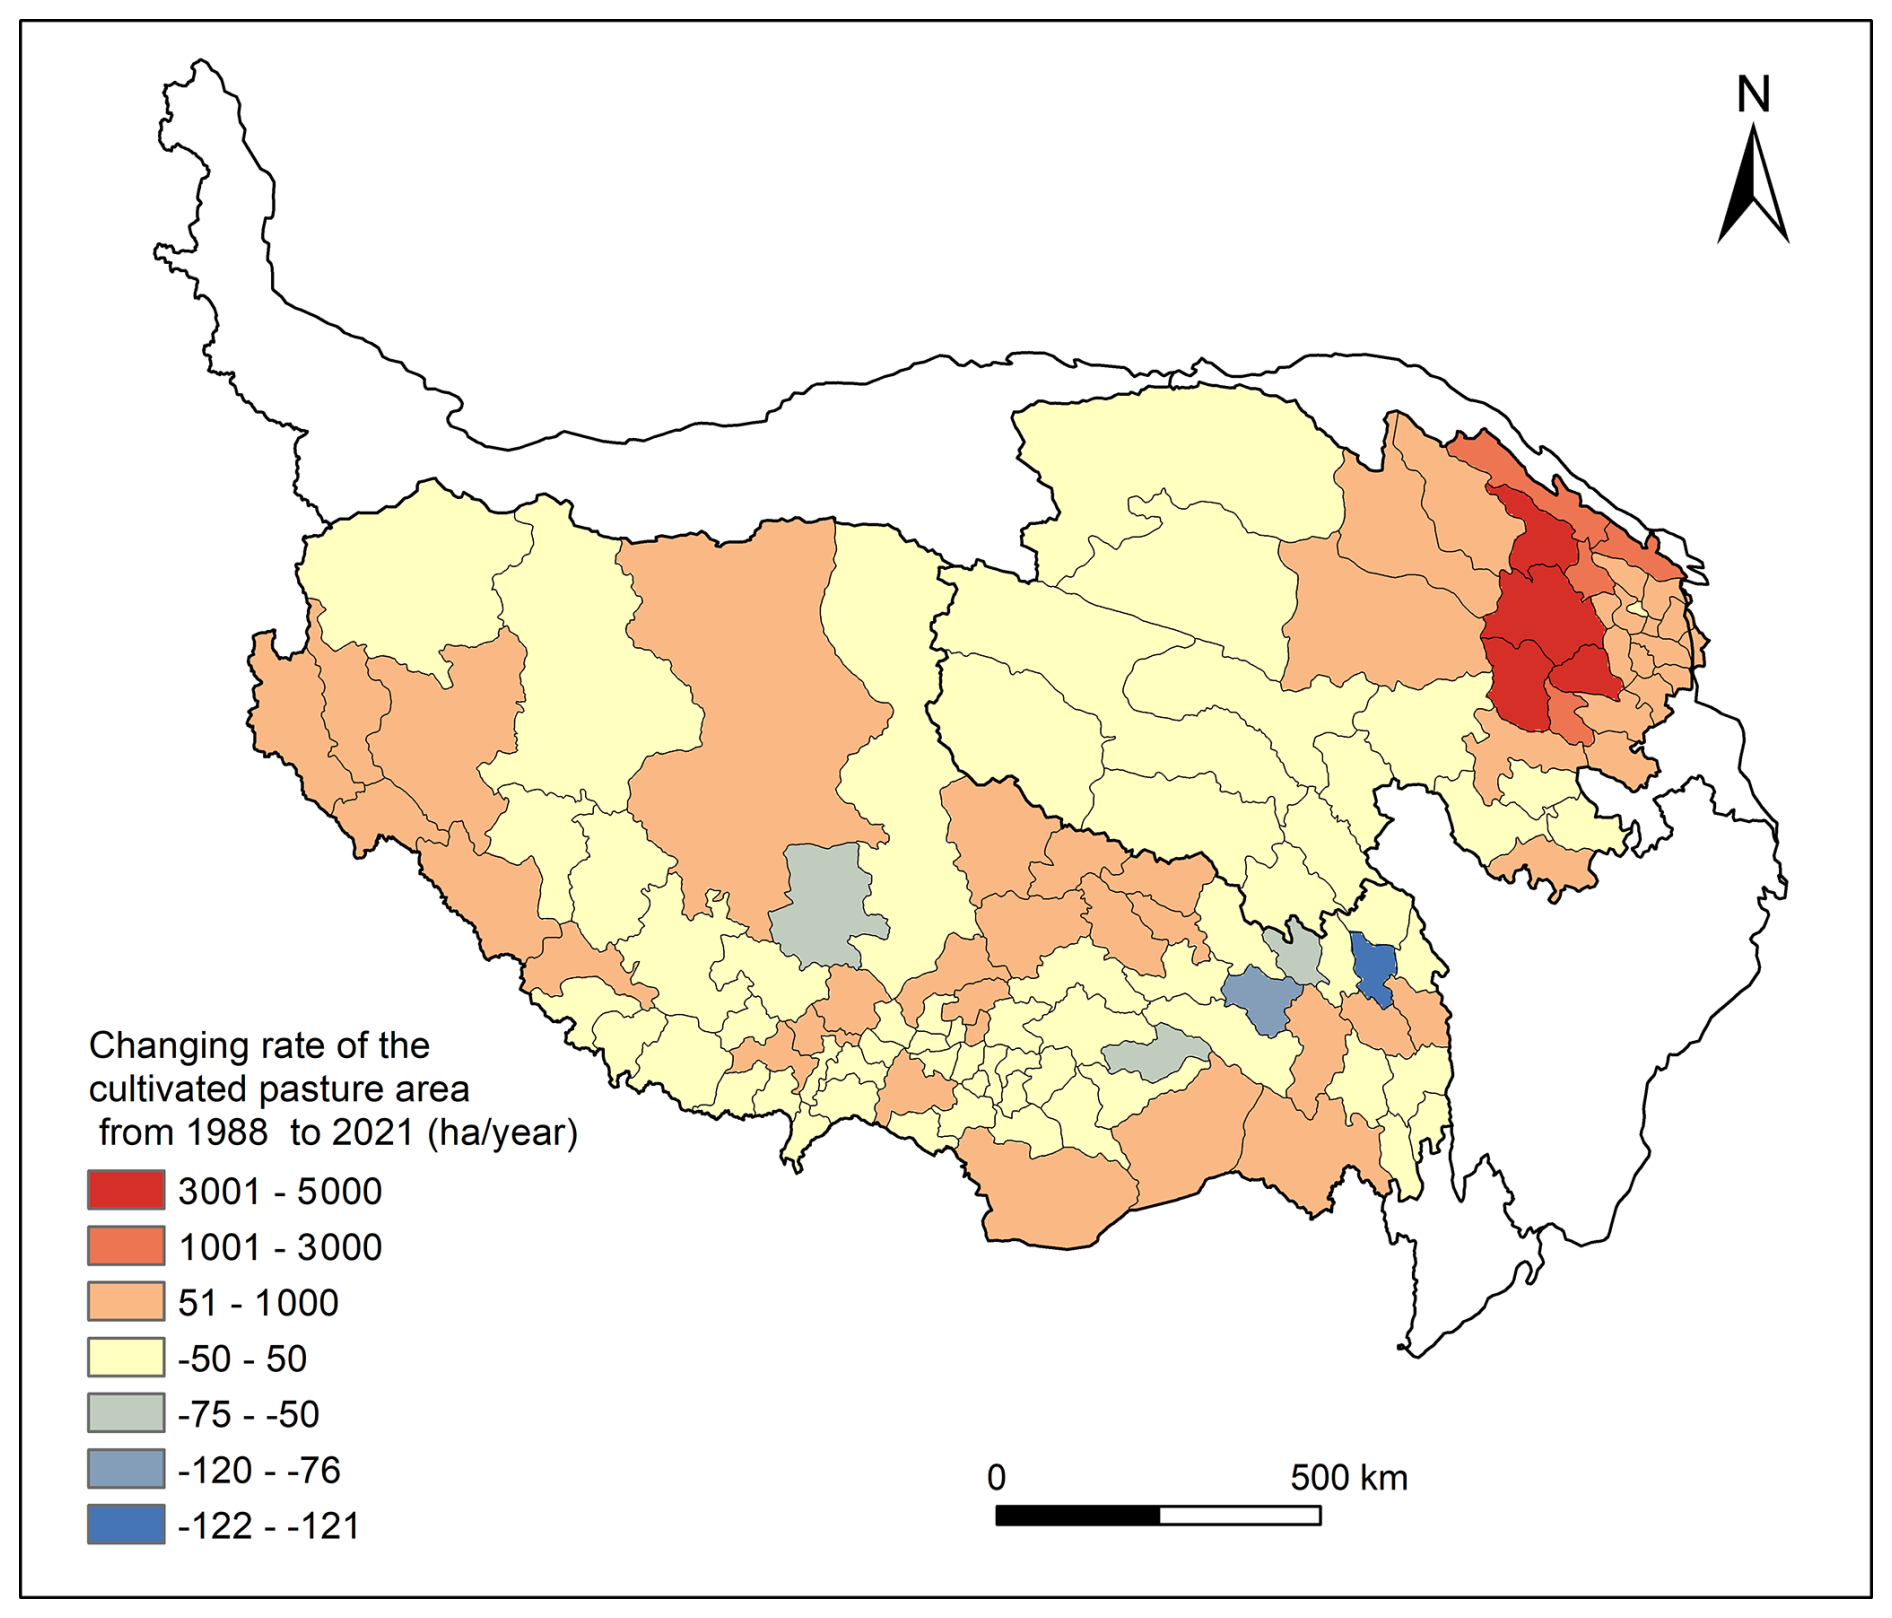
Figure 12Trend of cultivated-pasture areas from 1988 to 2021 in each county of Qinghai Province and the Tibet Autonomous Region. Cultivated pastures expanded substantially in Gonghe, Gangcha, Guinan, and Xinghai, while they contracted notably in Karuo and Luolong.
In this study, with decent accuracy, we successfully mapped the distribution of cultivated pastures on the Tibetan Plateau for the first time. Compared to previous efforts aimed at mapping only certain types of cultivated pastures (Parente et al., 2019; Wang et al., 2022b; Yang et al., 2021), this method could map general cultivated pastures.
5.1 The method for cultivated-pasture mapping
A distinctive feature of our mapping method is the use of spectral–temporal metrics derived from remote sensing time series data rather than the complete time series of all valid observations during the growing season. While prior studies (e.g., Wang et al., 2022b) have relied on dense time series data to characterize vegetation dynamics, our approach condenses these data into a set of statistical descriptors (e.g., median, maximum, minimum, standard deviation) of key vegetation indices. These spectral–temporal metrics serve as compact representations of phenological patterns and temporal variability in vegetation reflectance, which are especially informative in distinguishing cultivated pastures from other land cover types. This strategy reduces data dimensionality and computational load while retaining the essential temporal information relevant for classification, thereby enhancing both efficiency and accuracy.
Another critical strength of our approach lies in the volume and structure of the training data. Our dataset was built from training polygons collected through extensive fieldwork rather than from isolated training points. Polygons offer a more comprehensive sampling of spectral variability within each land cover type and provide more training samples to the classifier, improving generalizability. In contrast, previous studies (e.g., Wang et al., 2022b) often used sparse point-based training data, which may not adequately capture the heterogeneity of cultivated pasture across large regions.
Furthermore, we chose to use remote sensing data from a single growing season rather than multi-year composite datasets (e.g., Potapov et al., 2022). This decision was informed by the unique land management practices on the Tibetan Plateau, where inter-annual crop rotation is prevalent among cultivated pastures. Although multi-year composites are useful in mitigating atmospheric noise such as cloud contamination, they risk introducing classification errors due to the temporal inconsistency of land cover resulting from rotation. By focusing on a single year, we ensure that the remote sensing signatures align with the actual land cover state at the time of classification.
Finally, we implemented an independent validation strategy based on an external reference dataset (Yang et al., 2021) rather than relying on internal cross-validation. While cross-validation is common in remote sensing applications (Ashourloo et al., 2018; Wang et al., 2022b), it can lead to over-optimistic accuracy estimates if the same spatial samples are used for both training and validation (Friedl et al., 2000; Foody, 2002). By separating the training and validation datasets, our assessment provides a more realistic and conservative estimate of classification performance, especially across diverse pasture types.
5.2 Accuracy assessment of mapped cultivated pastures
The accuracy assessment of the binary classification model is essential in the cultivated-pasture mapping practice (Olofsson et al., 2014; Stehman and Foody, 2019). In this study, the RF binary classification model demonstrated a good ability to identify cultivated pastures, with an overall accuracy of 97.05 % ± 0.4 % and an F1 spatial consistency score of 0.83±0.14. This was superior to a recent study mapping the spatial extents of green-fodder lands in the northeastern Tibetan Plateau using Landsat data with overall accuracies of 94.2 %, 93.1 %, and 96.6 % in 2010, 2015, and 2019 (Yang et al., 2021). The cultivated-pasture mapping accuracy obtained in this study (overall accuracy of 97.05 % ± 0.4 %) was close to that reported by Wang et al. (2022b). Wang et al. (2022b) solely mapped oat pastures at the county scale at Shandan Racecourse in the northeastern Tibetan Plateau, with an overall accuracy of 98 %. Our results were also better than another effort at mapping native and non-native grasslands using MODIS NDVI time series data in Canada, which achieved an overall accuracy of 73 % (McInnes et al., 2015).
We found that the differences in the spatial fragmentation of cultivated pastures in Qinghai Province and the Tibet Autonomous Region could affect the accuracy of the cultivated-pasture maps. During our field visits, we noticed that the spatial distribution of cultivated pastures in the Tibet Autonomous Region was much more fragmented and dispersed than in Qinghai Province. In Qinghai Province, the cultivated pastures were sometimes in the shape of long stripes and were next to conventional croplands, which might cause the mixed-pixel problem and lower the identification accuracy of cultivated pastures (user's accuracy of 71.0 % ± 4.6 % in Qinghai vs. user's accuracy of 95.6 % ± 3.1 % in Tibet) since the spectral characteristics of conventional croplands and cultivated pastures are very similar during the peak growing season (Yang et al., 2021; Wang et al., 2022b).
5.3 Comparison of the mapped cultivated pasture areas with government statistics
We found that the areas of cultivated pastures identified through remote sensing were comparable to the areas of cultivated pastures reported in government statistics for Qinghai and Tibet (e.g., Li and Wang, 2017). For example, in 2021, the year for which we trained the RF binary classification model for cultivated pastures on the Tibetan Plateau, we mapped 1.57 Mha of cultivated pastures in Qinghai and Tibet, while the area of cultivated pastures in 2017 reported in the government statistics was 1.640 Mha. We used the statistics data of cultivated pastures for 2017 because this was the year in which the statical caliber used by the annual China Pratacultural Statistics agreed most closely with our definition of cultivated pastures.
The time series of the area of cultivated pastures on the Tibetan Plateau mapped through remote sensing from 1988 to 2021 was likely to be driven by the implementation of ecological and agricultural policies (Fig. S4; Schils et al., 2022; Zhou et al., 2020). However, the time series of the area of cultivated pastures on the Tibetan Plateau reported in the annual China Pratacultural Statistics did not exhibit any correlation with the implementation of ecological and agricultural policies and was severely distorted by the shift in the statistical caliber of cultivated pastures within it. The areas of cultivated pasture reported in the annual China Pratacultural Statistics for the years from 2010 to 2017 were substantially higher than those for the remaining years (Fig. 9); nevertheless, they were close to the remote sensing estimates for the period from 2010 to 2017. The time series of the areas of cultivated pastures mapped by remote sensing from 1988 to 2021 on the Tibetan Plateau was more realistic than the government statistics data. A sharp increase in the area of cultivated pastures for Qinghai is reported in the 2013 government statistics (Fig. 11b), suggesting a potential shift in the statistical criteria for cultivated pastures that year. In contrast, our results show a more gradual increase, which likely reflects a more consistent and accurate representation of the actual expansion of cultivated pastures on the Plateau. Our findings indicate that government statistics warrant further scrutiny in future policy development related to cultivated pastures.
The increasing trend in the area of cultivated pastures estimated through remote sensing in this study agrees with a previous relevant regional study of cultivated-pasture mapping on the Tibetan Plateau. Yang et al. (2021) found a rapid expansion of green-fodder lands in the northeastern Tibetan Plateau from 1.63 Kha in 2010 to 13.61 Kha in 2019.
5.4 Limitations and future prospects
Time series of cultivated-pasture maps on the Tibetan Plateau were produced for the first time; nevertheless, the mapping method and the maps had several limitations and could be improved in future.
-
The remote sensing data used in this study were Landsat data with a spatial resolution of 30 m. While Landsat data have been widely utilized for land cover classification, the 30 m spatial resolution may be insufficient for accurately capturing cultivated pastures with dimensions smaller than 30 m. Specifically, long and narrow cultivated pastures, often found on the Tibetan Plateau, may not be well-represented in the 30 m resolution map. In some cases, these small patches were adjacent to conventional croplands, leading to mixed-pixel problems. When the proportion of cultivated pastures in these mixed pixels was less than 50 %, the pixels were typically classified as croplands. This issue could potentially be alleviated with higher-spatial-resolution data, such as Sentinel-2 imagery, which has a spatial resolution of 10 m and became available in 2015 (Phiri et al., 2020). However, we opted not to use Sentinel-2 data as our focus was on the long-term spatial distribution of cultivated pastures on the Tibetan Plateau.
-
We employed quantile metrics of the remote sensing time series for cultivated-pasture classification, a method that has proven to be successful in capturing cultivated-pasture dynamics. The input features derived from these metrics were more effective compared to those used in previous studies, such as that of Wang et al. (2022b), which relied on monthly NDVI, EVI, NDPI, SR, and SAVI (soil-adjusted vegetation index) data for select months. While the latter approach utilized limited spectral information, our method incorporated a broader range of spectral indices, thus enhancing the overall classification accuracy.
-
As with many optical remote sensing studies, our research was affected by atmospheric disturbances such as cloud cover and cloud shadows, which can reduce the number of valid observations, particularly in certain regions and time periods. While we incorporated all available Landsat data during the growing season, the quality and density of the time series varied spatially and temporally, which may have impacted the consistency of the analysis.
-
To manage the computational burden associated with processing extensive time series data, we utilized descriptive statistical metrics (i.e., 25 %, 50 %, and 75 % quantiles) of the remote sensing data for the growing season. While this approach helped maintain classification accuracy while reducing computation time, it may have resulted in the loss of finer temporal phenological details that could be captured through the analysis of the full time series.
-
The random forest (RF) algorithm, which we employed for binary classification, is a powerful method known for its ability to handle complex relationships in the data. However, its performance depends heavily on the quality and representativeness of the training data. We are confident that the large volume of training data collected during extensive fieldwork, which encompassed a variety of cultivated-pasture types, contributed significantly to model performance.
-
Although we validated the cultivated-pasture maps for 2021 in two pilot study regions with different climates, landscapes, soil properties, and ecological conditions and observed a good match with government statistics at both the county and provincial levels, the validation of maps spanning from 1988 to 2021 could benefit from further feedback. Additional validation efforts by other researchers or practitioners in different regions and under varying local conditions could provide important insights for refining and improving the cultivated-pasture mapping methodology.
The cultivated-pasture maps generated in this study can be accessed at https://doi.org/10.5281/zenodo.14271782 (Han et al., 2024). All maps are at a 30 m (∼0.00027°) spatial resolution under the EPSG:4326 (WGS84) spatial reference system.
Cultivated pastures are crucial forage sources for livestock on the Tibetan Plateau. Additionally, they have significant implications for the region's ecological conservation and restoration efforts. In this study, we mapped cultivated pastures from 1988 to 2021 on the Tibetan Plateau using satellite remote sensing data for the first time. The mapping method performed satisfactorily, with an overall accuracy of 97.05 % ± 0.4 % and an F1 spatial consistency score of 82.51 % ± 14.22 % (precision: 90.04 % ± 6.18 %; recall: 76.74 % ± 9.91 %). At both the province and county levels, the cultivated-pasture area estimated in this study matched well with government statistics. The area of cultivated pastures on the Tibetan Plateau experienced a notable increasing trend from 1988 to 2021 at a rate of 33.5±2.5 Kha yr−1. The cultivated-pasture mapping method can be adopted to identify cultivated grasslands in other regions of the world.
The supplement related to this article is available online at https://doi.org/10.5194/essd-17-2933-2025-supplement.
JSH and JB designed the research. BH, TY, YT, and JB performed the analysis. BH and MG collected the field data and remote sensing data. BH, JB, and JSH wrote the first draft of the paper. All of the authors participated in the review and editing of the paper.
The contact author has declared that none of the authors has any competing interests.
Publisher's note: Copernicus Publications remains neutral with regard to jurisdictional claims made in the text, published maps, institutional affiliations, or any other geographical representation in this paper. While Copernicus Publications makes every effort to include appropriate place names, the final responsibility lies with the authors.
We gratefully acknowledge all of the data providers whose data have been used in this study and would like to thank the topical editor and the anonymous referees for their constructive comments.
This research has been supported by the National Natural Science Foundation of China (grant nos. 32192461 and 32130065) and the Chinese Academy of Engineering (grant no. 2023-XY-28).
This paper was edited by Zhen Yu and reviewed by two anonymous referees.
Aghighi, H., Azadbakht, M., Ashourloo, D., Shahrabi, H. S., and Radiom, S.: Machine learning regression techniques for the silage maize yield prediction using time-series images of Landsat 8 OLI, IEEE J. Select. Top. Appl. Earth Obs. Remote Sens., 11, 4563–4577, https://doi.org/10.1109/JSTARS.2018.2823361, 2018.
Ashourloo, D., Shahrabi, H. S., Azadbakht, M., Aghighi, H., Matkan, A. A., and Radiom, S.: A novel automatic method for alfalfa mapping using time series of Landsat-8 OLI data, IEEE J. Select. Top. Appl. Earth Obs. Remote Sens., 11, 4478–4487, https://doi.org/10.1109/jstars.2018.2874726, 2018.
Bardgett, R. D., Bullock, J. M., Lavorel, S., Manning, P., Schaffner, U., Ostle, N., Chomel, M., Durigan, G., Fry, E. L., Johnson, D., Lavallee, J. M., Provost, G. L., Luo, S., Png, K., Sankaran, M., Hou, X., Zhou, H., Ma, L., Ren, W., Li, X., Ding, Y., Li, Y., and Shi, H.: Combatting global grassland degradation, Nat. Rev. Earth Environ., 2, 720–735, https://doi.org/10.1038/s43017-021-00207-2, 2021.
Breiman, L.: Random Forests, Mach. Learn., 45, 5–32, https://doi.org/10.1023/a:1010933404324, 2001.
Chang, J., Ciais, P., Gasser, T., Smith, P., Herrero, M., Havlík, P., Obersteiner, M., Guenet, B., Goll, D. S., Li, W., Naipal, V., Peng, S., Qiu, C., Tian, H., Viovy, N., Yue, C., and Zhu, D.: Climate warming from managed grasslands cancels the cooling effect of carbon sinks in sparsely grazed and natural grasslands, Nat. Commun., 12, 118, https://doi.org/10.1038/s41467-020-20406-7, 2021.
Chen, H., Ju, P., Zhu, Q., Xu, X., Wu, N., Gao, Y., Feng, X., Tian, J., Niu, S., Zhang, Y., Peng, C., and Wang, Y.: Carbon and nitrogen cycling on the Qinghai–Tibetan Plateau, Nat. Rev. Earth Environ., 3, 701–716, https://doi.org/10.1038/s43017-022-00344-2, 2022.
Chen, L., Jiang, L., Jing, X., Wang, J., Shi, Y., Chu, H., and He, J.-S.: Above and belowground biodiversity jointly drive ecosystem stability in natural alpine grasslands on the Tibetan Plateau, Global Ecol. Biogeogr., 30, 1418–1429, https://doi.org/10.1111/geb.13307, 2021.
Cheng, Y., Cai, Y., and Wang, S.-Q.: Yak and Tibetan sheep dung return enhance soil N supply and retention in two alpine grasslands in the Qinghai-Tibetan Plateau, Biol. Fertil., 52, 413–422, https://doi.org/10.1007/s00374-016-1088-6, 2016.
Ding, L., Kapp, P., Cai, F., Garzione, C. N., Xiong, Z., Wang, H., and Wang, C.: Timing and mechanisms of Tibetan Plateau uplift, Nat. Rev. Earth Environ., 3, 652–667, https://doi.org/10.1038/s43017-022-00318-4, 2022.
Dong, J., Xiao, X., Menarguez, M. A., Zhang, G., Qin, Y., Thau, D., Biradar, C., and Moore, B.: Mapping paddy rice planting area in northeastern Asia with Landsat 8 images, phenology-based algorithm and Google Earth Engine, Remote Sens. Environ., 185, 142–154, https://doi.org/10.1016/j.rse.2016.02.016, 2016.
Dong, S., Shang, Z., Gao, J., and Boone, R.: Enhancing the ecological services of the Qinghai-Tibetan Plateau's grasslands through sustainable restoration and management in era of global change, Agr. Ecosyst. Environ., 326, 107756, https://doi.org/10.1016/j.agee.2021.107756, 2022.
Fang, J., Bai, Y., Li, L., Jiang, G., Huang, J., Huang, Z., Zhang, W., and Gao, S.: Scientific basis and practical ways for sustainable development of China's pasture regions, Chin. Sci. Bull., 61, 155–164, https://doi.org/10.1360/N972015-00718, 2016.
Farr, T., Rosen, P., Caro, E., Crippen, R., Duren, R., Hensley, S., Kobrick, M., Paller, M., Rodriguez, E., Roth, L., Seal, D., Shaffer, S., Shimada, J., Umland, J., Werner, M., Oskin, M., Burbank, D., and Alsdorf, D.: The shuttle radar topography mission, Rev. Geophys., 45, RG2004, https://doi.org/10.1029/2005rg000183, 2007.
Fisher, R. J., Sawa, B., and Prieto, B.: A novel technique using LiDAR to identify native-dominated and tame-dominated grasslands in Canada, Remote Sens. Environ., 218, 201–206, https://doi.org/10.1016/j.rse.2018.10.003, 2018.
Foody, G. M.: Status of land cover classification accuracy assessment, Remote Sens. Environ., 80, 185–201, https://doi.org/10.1016/s0034-4257(01)00295-4, 2002.
Friedl, M. A., Woodcock, C., Gopal, S., Muchoney, D., Strahler, A. H., and Barker-Schaaf, C.: A note on procedures used for accuracy assessment in land cover maps derived from AVHRR data, Int. J. Remote Sens., 21, 1073–1077, https://doi.org/10.1080/014311600210434, 2000.
Fuglie, K., Peters, M., and Burkart, S.: The extent and economic significance of cultivated forage crops in developing countries, Front. Sustain. Food Syst., 5, 712136, https://doi.org/10.3389/fsufs.2021.712136, 2021.
Gao, B.: NDWI – A normalized difference water index for remote sensing of vegetation liquid water from space, Remote Sens. Environ., 58, 257–266, https://doi.org/10.1016/s0034-4257(96)00067-3, 1996.
García, M. J. L. and Caselles, V.: Mapping burns and natural reforestation using thematic mapper data, Geocarto Int., 6, 31–37, https://doi.org/10.1080/10106049109354290, 1991.
Gorelick, N., Hancher, M., Dixon, M., Ilyushchenko, S., Thau, D., and Moore, R.: Google Earth Engine: Planetary-scale geospatial analysis for everyone, Remote Sens. Environ., 202, 18–27, https://doi.org/10.1016/j.rse.2017.06.031, 2017.
Han, B., Bi, J., Tao, S., Yang, T., Tang, Y., Ge, M., Wang, H., Jin, Z., Dong, J., Nan, Z., and He, J.-S.: An annual 30 m cultivated pasture dataset of the Tibetan Plateau from 1988 to 2021, Zenodo [data set], https://doi.org/10.5281/zenodo.14271782, 2024.
He, C., Braun, J., Tang, H., Yuan, X., Acevedo-Trejos, E., Ott, R. F., and de Quay, G. S.: Drainage divide migration and implications for climate and biodiversity, Nat. Rev. Earth Environ., 5, 1–16, https://doi.org/10.1038/s43017-023-00511-z, 2024.
He, J.-S., Dong, S., Shang, Z., Sundqvist, M., Wu, G., and Yang, Y.: Above-belowground interactions in alpine ecosystems on the roof of the world, Plant Soil., 458, 1–6, https://doi.org/10.1007/s11104-020-04761-4, 2020.
Hou, L., Xia, F., Chen, Q., Huang, J., He, Y., Rose, N., and Rozelle, S.: Grassland ecological compensation policy in China improves grassland quality and increases herders' income, Nat. Commun., 12, 4683, https://doi.org/10.1038/s41467-021-24942-8, 2021.
Jia, J., Cao, Z., Liu, C., Zhang, Z., Lin, L., Wang, Y., Haghipour, N., Wacker, L., Bao, H., Dittmar, T., Simpson, M. J., Yang, H., Crowther, T. W., Eglinton, T. I., He, J.-S., and Feng, X.: Climate warming alters subsoil but not topsoil carbon dynamics in alpine grassland, Global Change Biol., 25, 4383–4393, https://doi.org/10.1111/gcb.14823, 2019.
Kumar, S., Singh, A. K., Singh, R., Ghosh, A., Chaudhary, M., Shukla, A. K., Kumar, S., Singh, H. V., Ahmed, A., and Kumar, R. V.: Degraded land restoration ecological way through horti-pasture systems and soil moisture conservation to sustain productive economic viability, Land Degrad. Dev., 30, 1516–1529, https://doi.org/10.1002/ldr.3340, 2019.
Li, C., Fu, B., Wang, S., Stringer, L. C., Wang, Y., Li, Z., Liu, Y., and Zhou, W.: Drivers and impacts of changes in China's drylands, Nat. Rev. Earth Environ., 2, 858–873, https://doi.org/10.1038/s43017-021-00226-z, 2021.
Li, X. and Wang, J. (Eds.): China Pratacultural Statistics, China Agricultural Press, Beijing, ISBN 978-7-109-29243-7, 2017.
Li, Y., Degen, A. A., Sun, T., Wang, W., Bai, Y., Zhang, T., Long, R., and Shang, Z.: Three years of cultivating or fencing lands have different impacts on soil nutrients and properties of a subalpine meadow in the Tibetan plateau, Catena, 186, 104306, https://doi.org/10.1016/j.catena.2019.104306, 2020.
Liu, H. Q. and Huete, A.: A feedback based modification of the NDVI to minimize canopy background and atmospheric noise, IEEE T. Geosci. Remote, 33, 457–465, https://doi.org/10.1109/tgrs.1995.8746027, 1995.
López García, M. J. and Caselles, V.: Mapping burns and natural reforestation using thematic mapper data, Geocarto Int., 6, 31–37, https://doi.org/10.1080/10106049109354290, 1991.
McInnes, W. S., Smith, B., and McDermid, G. J.: Discriminating native and non-native grasses in the dry mixedgrass prairie with MODIS NDVI time series, IEEE J. Select. Top. Appl. Earth Obs. Remote Sens., 8, 1395–1403, https://doi.org/10.1109/jstars.2015.2416713, 2015.
Moon, M., Richardson, A. D., and Friedl, M. A.: Multiscale assessment of land surface phenology from harmonized Landsat 8 and Sentinel-2, PlanetScope, and PhenoCam imagery, Remote Sens. Environ., 266, 112716, https://doi.org/10.1016/j.rse.2021.112716, 2021.
Olofsson, P., Foody, G. M., Herold, M., Stehman, S. V., Woodcock, C. E., and Wulder, M. A.: Good practices for estimating area and assessing accuracy of land change, Remote Sens. Environ., 148, 42–57, https://doi.org/10.1016/j.rse.2014.02.015, 2014.
Parente, L. and Ferreira, L.: Assessing the spatial and occupation dynamics of the Brazilian pasturelands based on the automated classification of MODIS images from 2000 to 2016, Remote Sens., 10, 606, https://doi.org/10.3390/rs10040606, 2018.
Parente, L., Ferreira, L., Faria, A., Nogueira, S., Araújo, F., Teixeira, L., and Hagen, S.: Monitoring the brazilian pasturelands: A new mapping approach based on the landsat 8 spectral and temporal domains, Int. J. Appl. Earth Obs. Geoinf., 62, 135–143, https://doi.org/10.1016/j.jag.2017.06.003, 2017.
Parente, L., Mesquita, V., Miziara, F., Baumann, L., and Ferreira, L.: Assessing the pasturelands and livestock dynamics in Brazil, from 1985 to 2017: A novel approach based on high spatial resolution imagery and Google Earth Engine cloud computing, Remote Sens. Environ., 232, 111301, https://doi.org/10.1016/j.rse.2019.111301, 2019.
Phiri, D., Simwanda, M., Salekin, S., Nyirenda, V. R., Murayama, Y., and Ranagalage, M.: Sentinel-2 Data for Land Cover/Use Mapping: A Review, Remote Sens., 12, 2291, https://doi.org/10.3390/rs12142291, 2020.
Piao, S., Wang, X., Park, T., Chen, C., Lian, X., He, Y., Bjerke, J. W., Chen, A., Ciais, P., Tømmervik, H., Nemani, R. R., and Myneni, R. B.: Characteristics, drivers and feedbacks of global greening, Nat. Rev. Earth Environ., 1, 14–27, https://doi.org/10.1038/s43017-019-0001-x, 2020.
Potapov, P., Turubanova, S., Hansen, M. C., Tyukavina, A., Zalles, V., Khan, A., Song, X.-P., Pickens, A., Shen, Q., and Cortez, J.: Global maps of cropland extent and change show accelerated cropland expansion in the twenty-first century, Nat. Food., 3, 19–28, https://doi.org/10.1038/s43016-021-00429-z, 2022.
Roy, D. P., Wulder, M. A., Loveland, T. R., Woodcock, C. E., Allen, R. G., Anderson, M. C., Helder, D., Irons, J. R., Johnson, D. M., Kennedy, R., Scambos, T. A., Schaaf, C. B., Schott, J. R., Sheng, Y., Vermote, E. F., Belward, A. S., Bindschadler, R., Cohen, W. B., Gao, F., Hipple, J. D., Hostert, P., Huntington, J., Justice, C. O., Kilic, A., Kovalskyy, V., Lee, Z. P., Lymburner, L., Masek, J. G., McCorkel, J., Shuai, Y., Trezza, R., Vogelmann, J., Wynne, R. H., and Zhu, Z.: Landsat-8: Science and product vision for terrestrial global change research, Remote Sens. Environ., 145, 154–172, https://doi.org/10.1016/j.rse.2014.02.001, 2014.
Roy, D. P., Kovalskyy, V., Zhang, H. K., Vermote, E. F., Yan, L., Kumar, S. S., and Egorov, A.: Characterization of Landsat-7 to Landsat-8 reflective wavelength and normalized difference vegetation index continuity, Remote Sens. Environ., 185, 57–70, https://doi.org/10.1016/j.rse.2015.12.024, 2016.
Schils, R. L., Bufe, C., Rhymer, C. M., Francksen, R. M., Klaus, V. H., Abdalla, M., Milazzo, F., Lellei-Kovács, E., ten Berge, H., and Bertora, C.: Permanent grasslands in Europe: Land use change and intensification decrease their multifunctionality, Agr. Ecosyst. Environ., 330, 107891, https://doi.org/10.1016/j.agee.2022.107891, 2022.
Stehman, S. V. and Foody, G. M.: Key issues in rigorous accuracy assessment of land cover products, Remote Sens. Environ., 231, 111199, https://doi.org/10.1016/j.rse.2019.05.018, 2019.
Tian, J., Zhang, Z., Philpot, W. D., Tian, Q., Zhan, W., Xi, Y., Wang, X., and Zhu, C.: Simultaneous estimation of fractional cover of photosynthetic and non-photosynthetic vegetation using visible-near infrared satellite imagery, Remote Sens. Environ., 290, 113549, https://doi.org/10.1016/j.rse.2023.113549, 2023.
Tucker, C. J.: Red and photographic infrared linear combinations for monitoring vegetation, Remote Sens. Environ., 8, 127–150, https://doi.org/10.1016/0034-4257(79)90013-0, 1979.
Vermote, E., Roger, J.-C., Franch, B., and Skakun, S.: LaSRC (Land Surface Reflectance Code): Overview, application and validation using MODIS, VIIRS, LANDSAT and Sentinel 2 data's, in: IEEE Geosci. Remote Sens. Symp., 22–27 July 2018, Valencia, Spain, 8173–8176, https://doi.org/10.1109/IGARSS.2018.8517622, 2018.
Vroey, M. D., de Vendictis, L., Zavagli, M., Bontemps, S., Heymans, D., Radoux, J., Koetz, B., and Defourny, P.: Mowing detection using Sentinel-1 and Sentinel-2 time series for large scale grassland monitoring, Remote Sens. Environ., 280, 113145, https://doi.org/10.1016/j.rse.2022.113145, 2022.
Wang, C., Chen, J., Wu, J., Tang, Y., Shi, P., Black, T. A., and Zhu, K.: A snow-free vegetation index for improved monitoring of vegetation spring green-up date in deciduous ecosystems, Remote Sens. Environ., 196, 1–12, https://doi.org/10.1016/j.rse.2017.04.031, 2017.
Wang, H., Liu, H., Cao, G., Ma, Z., Li, Y., Zhang, F., Zhao, X., Zhao, X., Jiang, L., Sanders, N., Classen, A., and He, J.-S.: Alpine grassland plants grow earlier and faster but biomass remains unchanged over 35 years of climate change, Ecol. Lett., 23, 701–710, https://doi.org/10.1111/ele.13474, 2020.
Wang, P., Wang, J., Elberling, B., Yang, L., Chen, W., Song, L., Yan, Y., Wang, S., Pan, J., and Niu, S.: Increased annual methane uptake driven by warmer winters in an alpine meadow, Global Change Biol., 28, 3246–3259, https://doi.org/10.1111/gcb.16120, 2022a.
Wang, R., Feng, Q., Jin, Z., Ma, K., Zhang, Z., and Liang, T.: Identification and area information extraction of oat pasture based on GEE – A case study in the Shandan Racecourse (China), Remote Sens., 14, 4358, https://doi.org/10.3390/rs14174358, 2022b.
Wang, T. and Zhang, W.-H.: Priorities for the development of alfalfa pasture in northern China, Fundament. Res., 3, 225–228, https://doi.org/10.1016/j.fmre.2022.04.017, 2023.
Wang, Y., Lv, W., Xue, K., Wang, S., Zhang, L., Hu, R., Zeng, H., Xu, X., Li, Y., Jiang, L., Hao, Y., Du, J., Sun, J., Dorji, T., Piao, S., Wang, C., Luo, C., Zhang, Z., Chang, X., Zhang, M., Hu, Y., Wu, T., Wang, J., Li, B., Liu, P., Zhou, Y., Wang, A., Dong, S., Zhang, X., Gao, Q., Zhou, H., Shen, M., Wilkes, A., Miehe, G., Zhao, X., and Niu, H.: Grassland changes and adaptive management on the Qinghai–Tibetan Plateau, Nat. Rev. Earth Environ., 3, 668–683, https://doi.org/10.1038/s43017-022-00330-8, 2022c.
Wulder, M. A., Loveland, T. R., Roy, D. P., Crawford, C. J., Masek, J. G., Woodcock, C. E., Allen, R. G., Anderson, M. C., Belward, A. S., Cohen, W. B., Dwyer, J., Erb, A., Gao, F., Griffiths, P., Helder, D., Hermosilla, T., Hipple, J. D., Hostert, P., Hughes, M. J., Huntington, J., Johnson, D. M., Kennedy, R., Kilic, A., Li, Z., Lymburner, L., McCorkel, J., Pahlevan, N., Scambos, T. A., Schaaf, C., Schott, J. R., Sheng, Y., Storey, J., Vermote, E., Vogelmann, J., White, J. C., Wynne, R. H., and Zhu, Z.: Current status of Landsat program, science, and applications, Remote Sens. Environ., 225, 127–147, https://doi.org/10.1016/j.rse.2019.02.015, 2019.
Wulder, M. A., Roy, D. P., Radeloff, V. C., Loveland, T. R., Anderson, M. C., Johnson, D. M., Healey, S., Zhu, Z., Scambos, T. A., Pahlevan, N., Hansen, M., Gorelick, N., Crawford, C. J., Masek, J. G., Hermosilla, T., White, J. C., Belward, A. S., Schaaf, C., Woodcock, C. E., Huntington, J. L., Lymburner, L., Hostert, P., Gao, F., Lyapustin, A., Pekel, J.-F., Strobl, P., and Cook, B. D.: Fifty years of Landsat science and impacts, Remote Sens. Environ., 280, 113195, https://doi.org/10.1016/j.rse.2022.113195, 2022.
Xu, H.: Modification of normalised difference water index (NDWI) to enhance open water features in remotely sensed imagery, Int. J. Remote Sens., 27, 3025–3033, https://doi.org/10.1080/01431160600589179, 2006.
Yang, T., Zhang, G. L., Li, Y., Fan, J., Sun, D., Wang, J., Di, Y., You, N., Liu, R., Zhang, Q., and Doughty, R. B.: Satellite observed rapid green fodder expansion in northeastern Tibetan Plateau from 2010 to 2019, Int. J. Appl. Earth Obs. Geoinf., 102, 102394, https://doi.org/10.1016/j.jag.2021.102394, 2021.
Yang, T., Han, B., He, X., Ye, Z., Tang, Y., Lin, J., Cui, X., and Bi, J.: Diagnosis of the accuracy of land cover classification using bootstrap resampling, Int. J. Remote Sens., 45, 3897–3912, https://doi.org/10.1080/01431161.2024.2358546, 2024.
Yao, T., Bolch, T., Chen, D., Gao, J., Immerzeel, W., Piao, S., Su, F., Thompson, L., Wada, Y., Wang, L., Wang, T., Wu, G., Xu, B., Yang, W., Zhang, G., and Zhao, P.: The imbalance of the Asian water tower, Nat. Rev. Earth Environ., 3, 618–632, https://doi.org/10.1038/s43017-022-00299-4, 2022.
Zalite, K., Antropov, O., Praks, J., Voormansik, K., and Noorma, M.: Monitoring of agricultural grasslands with time series of X-band repeat-pass interferometric SAR, IEEE J. Select. Top. Appl. Earth Obs. Remote Sens., 9, 3687–3697, https://doi.org/10.1109/jstars.2015.2478120, 2016.
Zeng, Y., Hao, D., Huete, A., Dechant, B., Berry, J., Chen, J. M., Joiner, J., Frankenberg, C., Bond-Lamberty, B., Ryu, Y., Xiao, J., Asrar, G. R., and Chen, M.: Optical vegetation indices for monitoring terrestrial ecosystems globally, Nat. Rev. Earth Environ., 3, 477–493, https://doi.org/10.1038/s43017-022-00298-5, 2022.
Zha, Y., Gao, J., and Ni, S.: Use of normalized difference built-up index in automatically mapping urban areas from TM imagery, Int. J. Remote Sens., 24, 583–594, https://doi.org/10.1080/01431160304987, 2003.
Zhang, C., Dong, J., and Ge, Q.: Quantifying the accuracies of six 30-m cropland datasets over China: A comparison and evaluation analysis, Comput. Electron. Agric., 197, 106946, https://doi.org/10.1016/j.compag.2022.106946, 2022a.
Zhang, H., Tang, Z., Wang, B., Kan, H., Sun, Y., Qin, Y., Meng, B., Li, M., Chen, J., Lv, Y., Zhang, J., Niu, S., and Yi, S.: A 250 m annual alpine grassland AGB dataset over the Qinghai–Tibet Plateau (2000–2019) in China based on in situ measurements, UAV photos, and MODIS data, Earth Syst. Sci. Data., 15, 821–846, https://doi.org/10.5194/essd-15-821-2023, 2023.
Zhang, P., Jeong, J. H., Yoon, J. H., Kim, H., Wang, S., Linderholm, H. W., Fang, K., Wu, X., and Chen, D.: Abrupt shift to hotter and drier climate over inner East Asia beyond the tipping point, Science, 370, 1095–1099, https://doi.org/10.1126/science.abb3368, 2020.
Zhang, Y., Woodcock, C. E., Arévalo, P., Olofsson, P., Tang, X., Stanimirova, R., Bullock, E., Tarrio, K. R., Zhu, Z., and Friedl, M. A.: A Global Analysis of the Spatial and Temporal Variability of Usable Landsat Observations at the Pixel Scale, Front. Remote Sens, 3, 894618, https://doi.org/10.3389/frsen.2022.894618, 2022b.
Zhou, H., Wang, D., Guo, M., Yao, B., and Shang, Z.: Promoting Artificial Grasslands to Improve Carbon Sequestration and Livelihood of Herders, Carbon Management for Promoting Local Livelihood in the Hindu Kush Himalayan (HKH) Region, Springer, Cham, 211–228, https://doi.org/10.1007/978-3-030-20591-1_12, 2020.
Zhu, Q., Chen, H., Peng, C., Liu J., Piao, S., He, J.-S., Wang, S., Zhao, X., Zhang, J., Fang, X., Jin, J., Yang, Q.-E., Ren, L., and Wang, Y.: An early warning signal for grassland degradation on the Tibetan Plateau, Nat. Commun., 14, 6406, https://doi.org/10.1038/s41467-023-42099-4, 2023.
Zhu, Z. and Woodcock, C. E.: Automated cloud, cloud shadow, and snow detection in multitemporal Landsat data: An algorithm designed specifically for monitoring land cover change, Remote Sens. Environ., 152, 217–234, https://doi.org/10.1016/j.rse.2014.06.012, 2014.