the Creative Commons Attribution 4.0 License.
the Creative Commons Attribution 4.0 License.
 | 16 Jun 2025
Expendable bathythermograph (XBT) data collected along the Southern Ocean chokepoint between Aotearoa / New Zealand and Antarctica, 1994–2024
Giuseppe Aulicino
Antonino Ian Ferola
Laura Fortunato
Giorgio Budillon
Pasquale Castagno
Pierpaolo Falco
Giannetta Fusco
Naomi Krauzig
Giancarlo Spezie
Enrico Zambianchi
Yuri Cotroneo
This study presents the water column temperature data collected during several cruises on board the Italica, Araon, and Laura Bassi research vessels in the framework of the Climatic Long-term Interaction for the Mass balance in Antarctica (CLIMA), Southern Ocean Chokepoints Italian Contribution (SOChIC), and Marine Observatory of the Ross Sea (MORSea) projects funded by the Italian National Antarctic Research Program (PNRA). Data were collected between Aotearoa / New Zealand and the Ross Sea during the austral summers from 1994/1995 to 2023/2024. Across this chokepoint of the Antarctic Circumpolar Current, expendable bathythermograph (XBT) Sippican T7 probes were launched with a regular 20 km sampling, providing temperature profiles with a vertical resolution of 65 cm and a maximum nominal depth of 760 m. All temperature profiles underwent rigorous quality control, including a general malfunctioning verification, the removal of spikes, the consistency check of adjacent profiles, the comparison to regional oceanographic features and satellite altimetry observations, and a final visual check by the operator. Data quality checks led us to discard about 12 % of acquired XBT measurements. The full XBT dataset can be accessed as text format files via the following link: https://doi.org/10.5281/zenodo.14848849 (Aulicino et al., 2025). This dataset contributes to the improvement of our understanding of Southern Ocean features, being highly valuable for studies focusing on climate variability, especially across the Antarctic Circumpolar Current and its fronts. Furthermore, we expect that the collected XBT data will serve as a useful tool for the calibration and validation of recent satellite observations and for the improvement of Southern Ocean oceanographic simulations.
- Article
(6744 KB) - Full-text XML
-
Supplement
(17494 KB) - BibTeX
- EndNote


The temperature of the ocean is one of the key parameters identified by the Global Climate Observing System (GCOS) as being essential for climate studies (World Meteorological Organization, 2016). Together with salinity values, ocean temperatures are necessary to identify and trace the main water masses and monitor their evolution at different spatial and temporal scales.
At larger scales, collecting oceanic temperature and salinity data is of paramount importance to the study of the global thermohaline circulation, which plays a pivotal role in the Earth's climate system. The Southern Ocean (SO) plays a fundamental role in this circulation (Gille, 1994; Rintoul, 2018) as some of the global thermohaline circulation engines are located near the Antarctic coast, which is associated with polynya areas (Morales Maqueda et al., 2004; Aulicino and Wadhams, 2022; Falco et al., 2024). At smaller scales, temperature data can be used to describe the vertical structure of the ocean (e.g., the thermocline depth and its variability), locate fronts between different water masses, determine the ocean heat content and volume transport, and identify mesoscale and sub-mesoscale ocean dynamics.
The main current in the SO is the Antarctic Circumpolar Current (ACC), which is its primary source of heat, nutrients and momentum (Sokolov and Rintoul, 2009a, b). The ACC is one of the largest currents on the planet, flowing from west to east and isolating the Antarctic continent, which makes it strongly dependent on the SO conditions. Additionally, the Antarctic ecosystem is very fragile and temperature-dependent, which highlights the importance of monitoring physical changes in the ocean that surrounds it (Convey and Peck, 2019). Therefore, monitoring the SO and its temperature is essential for improving our knowledge of the processes driving the Antarctic variability and the global climate balance (Rintoul, 2018; Armour et al., 2016).
Despite its importance, SO has consistently faced a scarcity of in situ observations due to its remote location and the extreme weather conditions, which often hinder research activities to be carried out on site. The measurements are further limited by the seasonal sea ice presence that inhibits the navigation and the data collection. Additionally, in situ data collection is often conducted with instruments and probes used from ships traveling at their normal speed (e.g., expendable bathythermographs, XBTs) without the possibility of performing classical full-depth conductivity–temperature–depth (CTD) casts that require ship stops. The advent of the international ARGO program significantly increased the number of hydrographic observations available in the SO throughout all seasons (Roemmich et al., 2022). However, Lagrangian floats do not allow for the collection of information along repeated monitoring lines.
Accordingly, many steps have been taken over time to obtain ocean temperature data through remote sensing. Satellite data provide a valuable insight into the upper ocean, especially when considering the fact that the surface layer is closely related to fundamental phenomena (e.g., ocean–atmosphere physical and biogeochemical interactions, fronts, currents, meanders, and eddies) impacting the large-scale circulation and the meso- and small-scale characteristics of the ocean (e.g., McGillicuddy, 2016; Cotroneo et al., 2016; Seo et al., 2023). Additional information about the water column can also be retrieved from numerical models (e.g., Downes et al., 2015) and three-dimensional reconstructions inferred through machine learning and statistical techniques applied to satellite observations, such as sea surface temperature (e.g., Buongiorno Nardelli, 2020). Nonetheless, in situ measurements are indispensable for achieving the necessary precision and depth coverage. In addition, they provide the critical ground truth for the calibration and validation of satellite retrievals of surface variables and the improvement of data acquisition algorithms (Aulicino et al., 2022). It is therefore evident that the collection of in situ data is essential for monitoring ocean temperature.
The Global Ocean Observing System (GOOS) Ship Of Opportunity Program (SOOP) and the related Ship of Opportunity Program Implementation Panel (SOOPIP) address scientific and operational (standardization, maintenance, and advancement of the instruments and techniques) goals, respectively, of building a sustained ocean observing system, e.g., supplementing dedicated research vessels in the collection of upper-ocean in situ XBT data through the use of ships that are already traversing the world's oceans (Legler et al., 2015; Goni et al., 2019).
In this scenario, the University of Naples Parthenope has been taking part since 1994 in the organization and execution of several oceanographic campaigns along the PX36 monitoring line in the Pacific sector of the SO, i.e., between Aotearoa / New Zealand and the Ross Sea, in the framework of the Italian National Antarctic Research Program (PNRA). During each expedition, XBT launches were carried out, collecting ocean temperature data from surface to a maximum of about 760 m depth (Falco et al., 2022). This study presents the collected XBT dataset, which significantly contributes to the accessibility of extensive ocean temperature data.
In this paper, the methodologies used for data collection and quality control (QC) are described in Sect. 2; the results and the discussion are reported in Sect. 3; the data record details and the conclusions are summarized in Sect. 4.
2.1 The XBT dataset
An XBT system is composed of several key components: an expendable ballistic probe that descends into seawater, a data acquisition device that records an electrical signal and converts it into usable numerical data (with the support of a computer unit), and a double copper wire that connects the falling probe to the acquisition device (Goni et al., 2019; Parks et al., 2022; Simoncelli et al., 2024). As the probe descends through the water column, temperature measurements are acquired using a negative temperature coefficient (NTC) thermistor mounted on the probe zinc nose, which alters its resistance in response to the seawater temperature it comes into contact with. The insulated copper wire is unwound simultaneously by two spools, i.e., clockwise on the ship and counterclockwise in the falling probe. This technique decouples the XBT vertical descent through the seawater from the ship translational motion (Simoncelli et al., 2024). Data recording continues until the wire breaks or the recording is terminated by the operator. The depth associated with a temperature measurement is not measured directly because XBT probes do not contain pressure sensors. Instead, depth is estimated using a phenomenological fall rate equation (FRE). In our final data products, depth calculated from the manufacturer's original FRE coefficients as well as corrected depths recommended by Hanawa et al. (1995) and Cheng et al. (2014) are provided. These coefficients, along with details about the data acquisition systems, are typically included in the metadata associated with each XBT cast.
The uncertainties in temperature and pressure values make the XBT probe accuracy generally rated to ±0.10 °C (Parks et al., 2022) although differences can be retrieved depending on the manufacturer and the manufacturing date of different devices (Cowley et al., 2013). Consequently, some crucial information should be always provided with any XBT dataset for subsequent optimal use of the measurements, including a complete description of the system characteristics in the metadata (e.g., probe type, fall rate coefficients, data originator, and platform).
We present here the dataset of water column temperatures collected in the Pacific sector of the Southern Ocean through XBT casts during several research cruises on board the Italian research vessels Italica and Laura Bassi and the Korean icebreaker Araon (see Table 1). These activities were carried out in the framework of the Italian PNRA by several scientific projects, e.g., Climatic Long-term Interaction for the Mass balance in Antarctica (CLIMA), Southern Ocean observing system and Chokepoints Italian Contribution (SOChIC), and Marine Observatory in the Ross Sea (MORSea).
The XBT casts were carried out during the austral summers between 1994/1995 and 2023/2024, mainly in January and February (Fig. 1), using Sippican T7 probes providing temperature profiles with a vertical resolution of 65 cm and a maximum nominal depth of 760 m. Only during the 1994/1995 (PNRA_X) and 1995/1996 (PNRA_XI) cruises were some Sippican T5 probes used, reaching a maximum depth of 1830 m, as reported in the campaign metadata information (Table 2). The majority of transects were completed in 5–6 d and provide a synoptic picture of the thermal structure of the upper SO across its Pacific sector (Fig. 2). A regular 20 km sampling interval was adopted with occasional increased sampling frequency over the main frontal regions of the ACC.
Table 1List of scientific cruises included in this dataset carried out between November 1994 and January 2024.
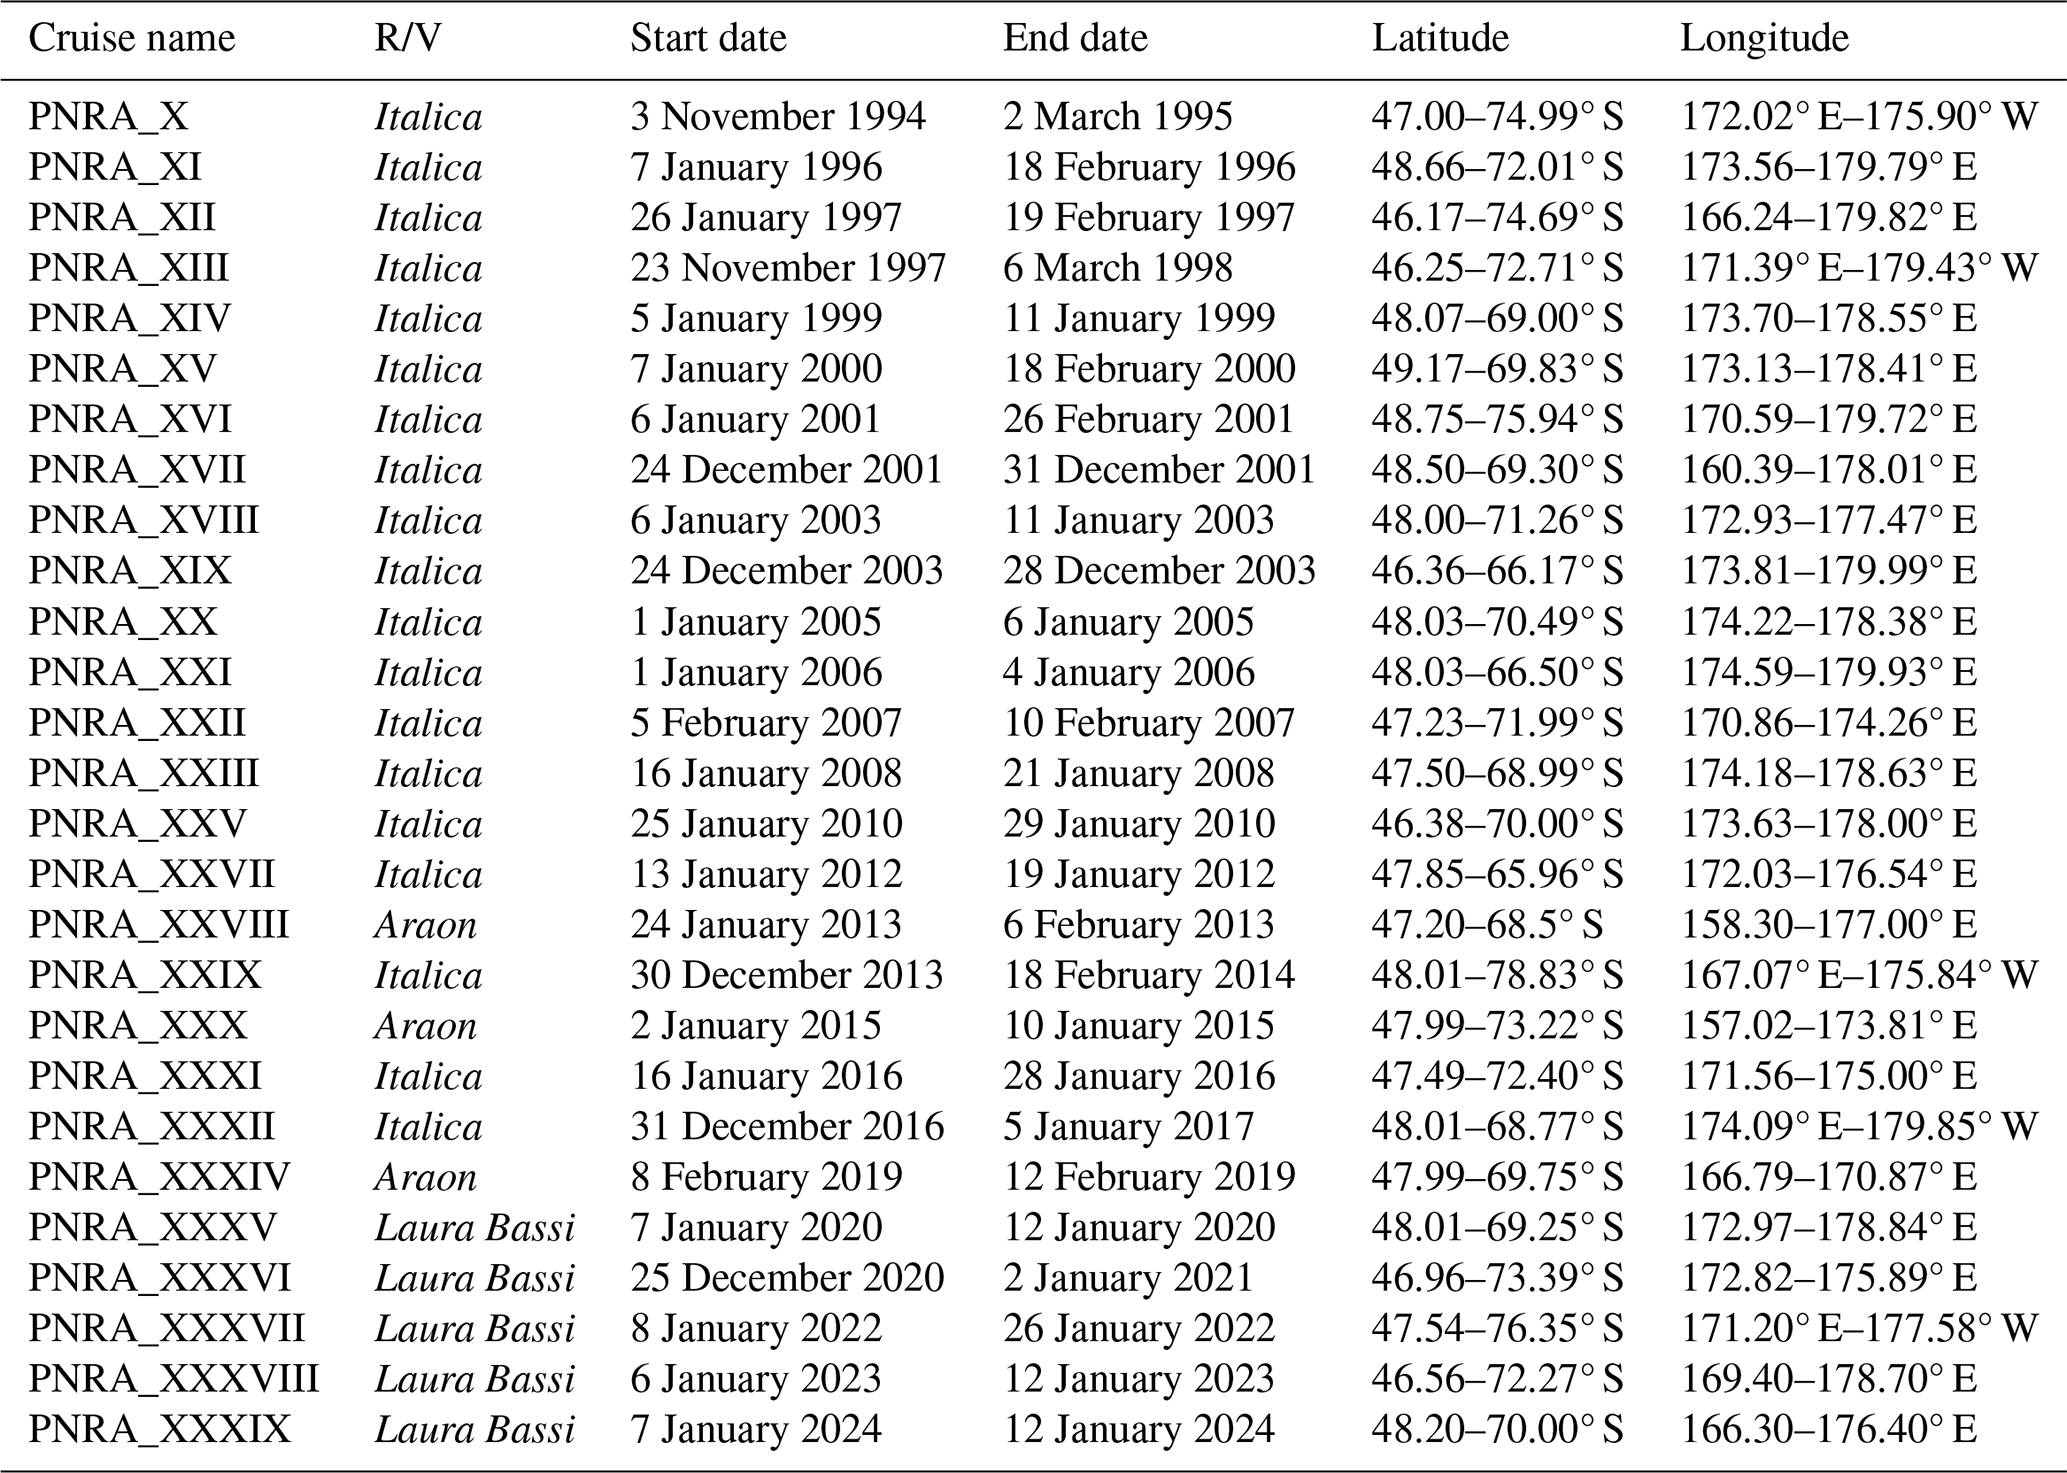
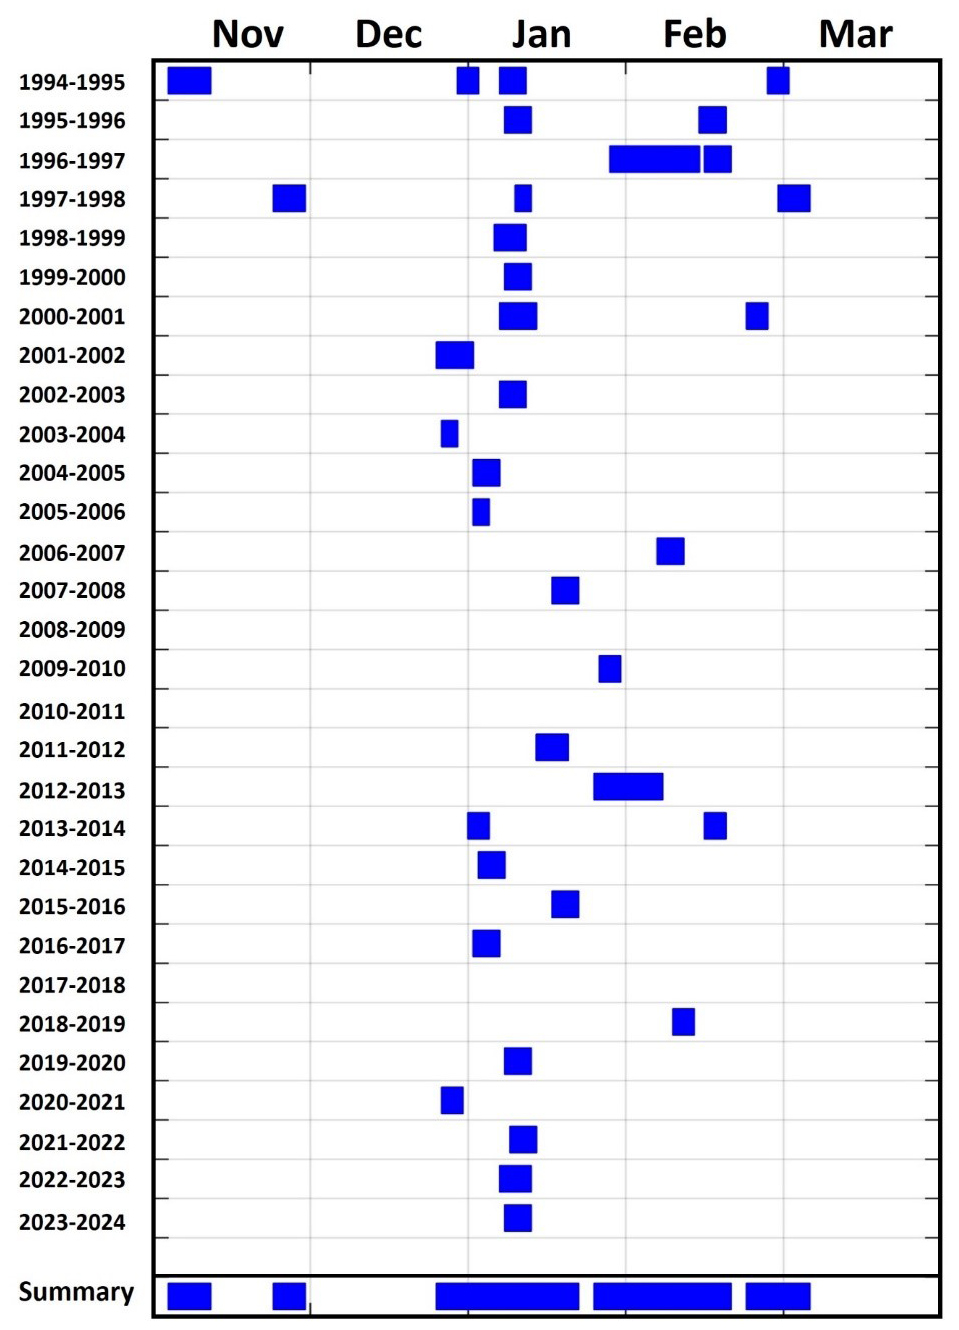
Figure 1Temporal distribution of the oceanographic campaigns conducted along the Aotearoa / New Zealand–Antarctica chokepoint between 1994 and 2024.
Table 2Characteristics of the different XBT probes used in this study: nominal depth guaranteed by Sippican; maximum ship speed suggested by Sippican for an optimal drop; amount of ZAMAK (a zinc-based alloy enriched with aluminum, magnesium, and copper), copper and plastic for each probe type (adapted from Simoncelli et al., 2024).
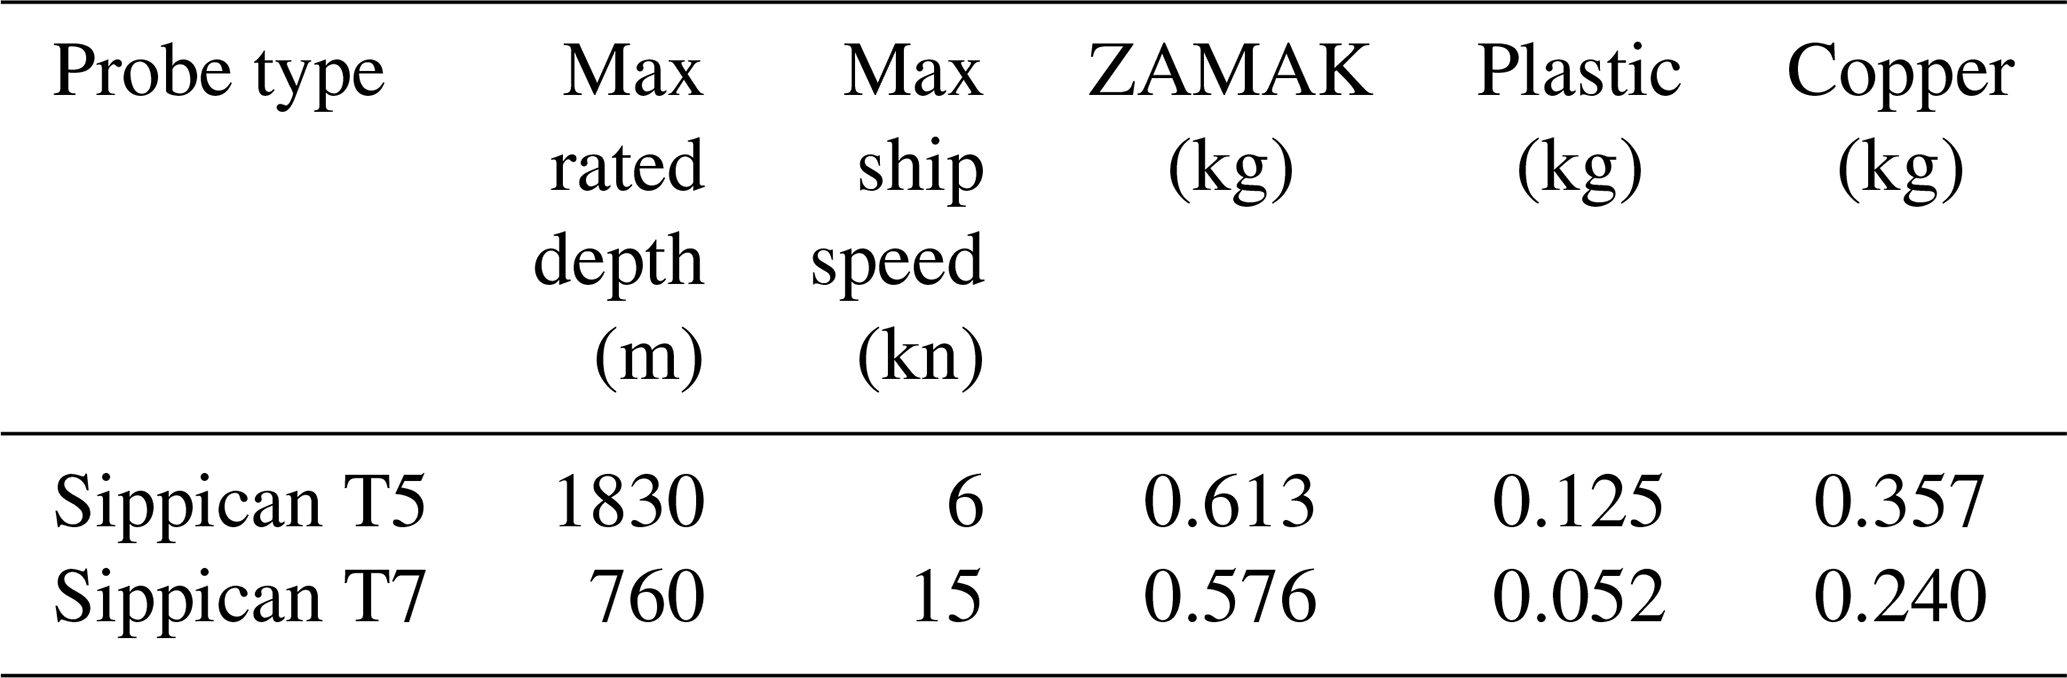
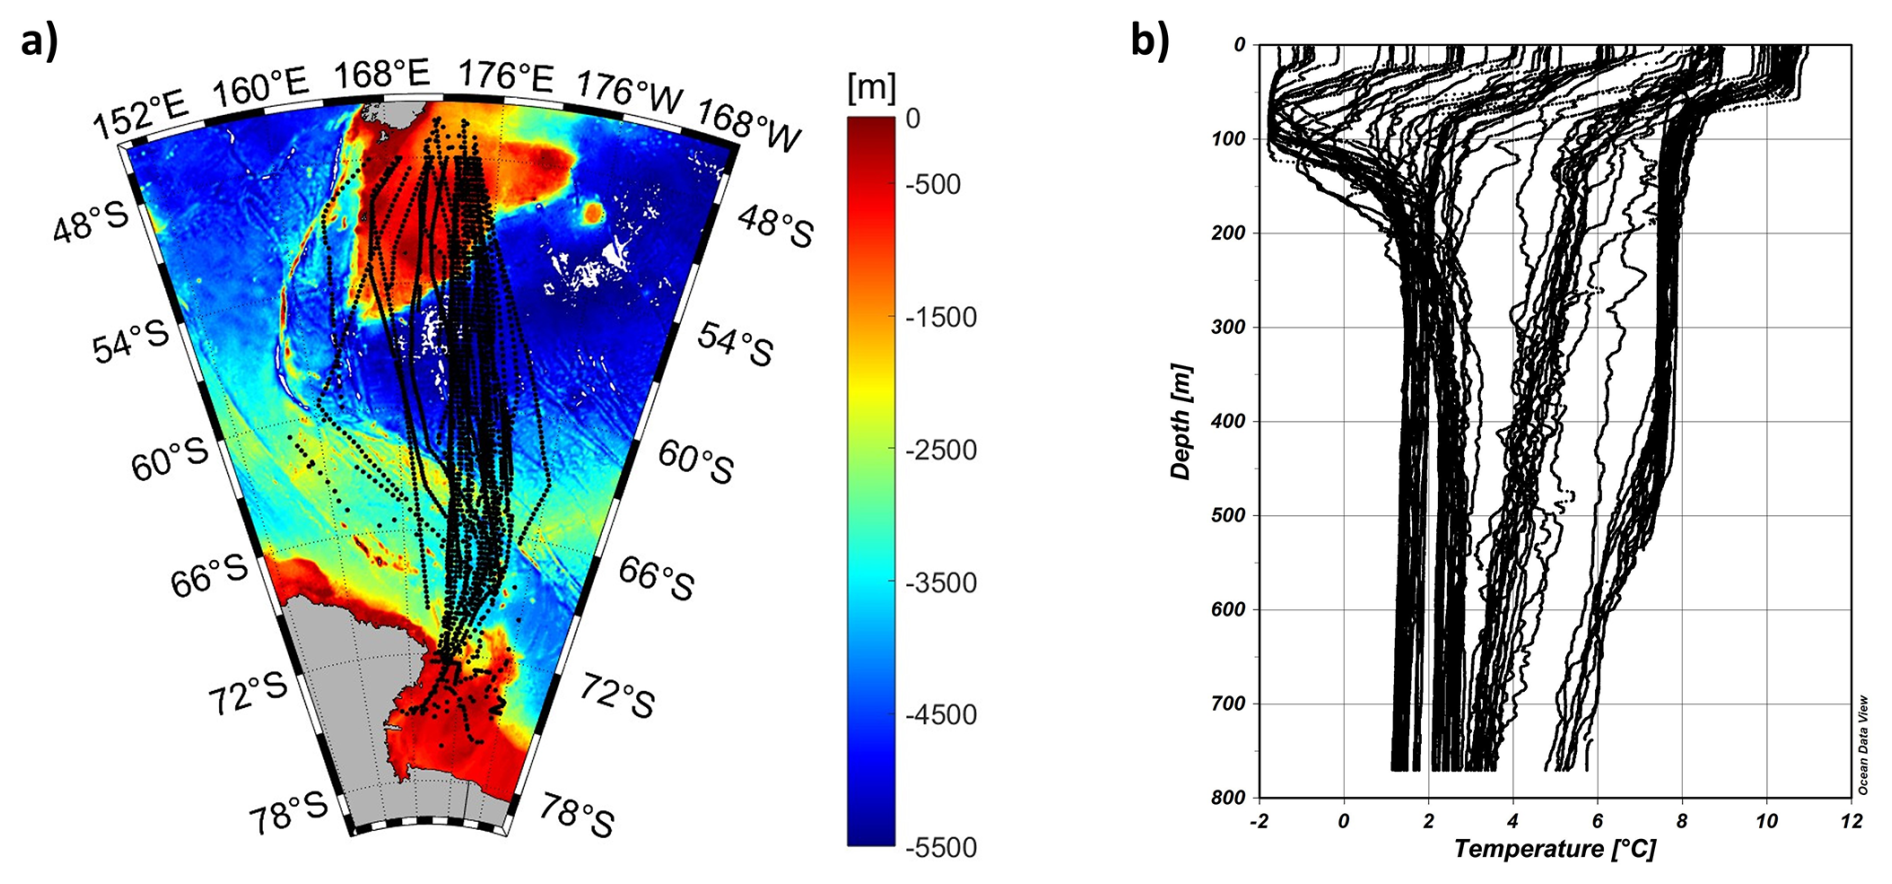
Figure 2(a) Map of the Southern Ocean area between Aotearoa / New Zealand and Antarctica. The black dots represent the position of all XBT launches carried out between December 1994 and January 2024. (b) An example of temperature vertical profiles collected through XBT across the Aotearoa / New Zealand–Ross Sea chokepoint during the XXXV Italian Antarctic Expedition. Plots were realized using Ocean Data View software (Schlitzer, 2022).
2.2 Quality control
Various types of malfunctions can affect XBT measurements and result in inaccurate temperature readings within the temperature profile. These faults can appear as a spike in a single recorded value or affect the temperature across a range of depths. Moreover, some issues can create errors that mimic real phenomena, such as temperature inversions or fronts (Parks et al., 2022; Cowley and Krummel, 2022). Sometimes, profiles can be corrected by deleting or filtering sections of the original data. However, an accurate quality control procedure must be implemented before any data are discarded or manipulated. Additionally, a flagging scheme is generally applied to provide XBT dataset users with quality indicators of the oceanographic data.
Quality flags (QFs) are essential for enabling users to filter the XBT dataset according to the specific quality requirements for the intended use. Several flagging scheme exist in agreement with recommendations provided by the Intergovernmental Oceanographic Commission of UNESCO (IOC, 2013). In this study, we follow the suggestions provided by the Global Temperature and Salinity Profile Program (GTSPP) of National Oceanic and Atmospheric Administration National Centers for Environmental Information (NOAA-NCEI, https://www.ncei.noaa.gov/products/global-temperature-and-salinity-profile-programme, last access: 23 May 2024), resulting in the flagging scheme summarized in Table 3 for indicating the quality of each temperature and depth data point.
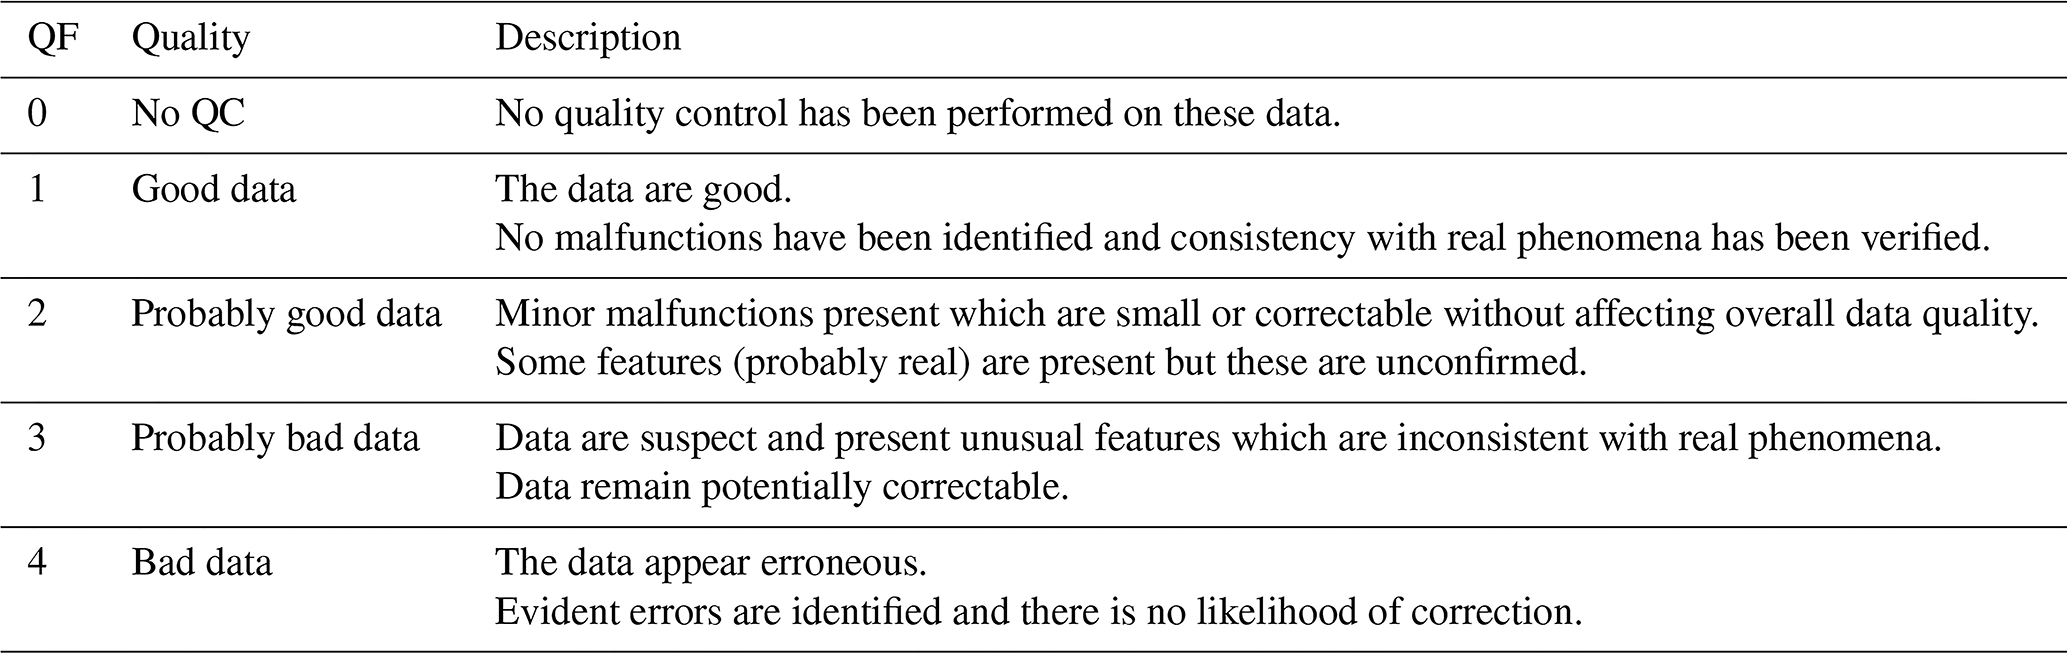
The assignment of QFs is the result of a series of quality control (QC) tests for both temperature and depth data which are used to get a reliable quality check of the temperature measurements collected through our XBTs and of the retrieved depths. Results of each test allowed us to insert the relative flag to the corresponding measurement according to the scheme shown in Table 3. QF = 1 is assigned when all the tests pass and QF = 4 when at least one test fails. For temperature, more detailed checks are performed, including a final visual check, allowing us to introduce QF = 2 and QF = 3 for probably good and probably bad data, respectively (as detailed below).
Overall, the QC procedures applied to our dataset follow recommendations previously suggested by NOAA that have been developed and refined in the last 3 decades (Bailey et al., 1994; Daneshzadeh et al., 1994; Cowley and Krummel, 2022; Parks et al., 2022; Tan et al., 2023). These procedures include several steps undertaken in a top-down manner as temperature data are measured from the surface down, and faults that occur at a given depth may impact on deeper data (Parks et al., 2022).
First, each XBT profile was tested for invalid metadata information, such as the correct time, cast position, and any other possible operator errors, using a sequence of independent checks. All identified errors in date and time were corrected accordingly, with the support of the XBT launch log sheets provided by operators on board. No errors were found concerning the position of the casts after the comparison of latitudes and longitudes against gridded GEBCO 2×2 min bathymetry (GEBCO Compilation Group, 2023). The check of unrealistic positions was also performed using the calculation of vessel speed from profile date and time and an upper general threshold of 20 knots (since most of the launches are realized by ships traveling in the range of 10–15 knots). Additionally, the depth values of each XBT profile were compared to the last good depth value provided by the operators (QF = 1 is assigned to shallower depth values; otherwise, they are flagged as QF = 4).
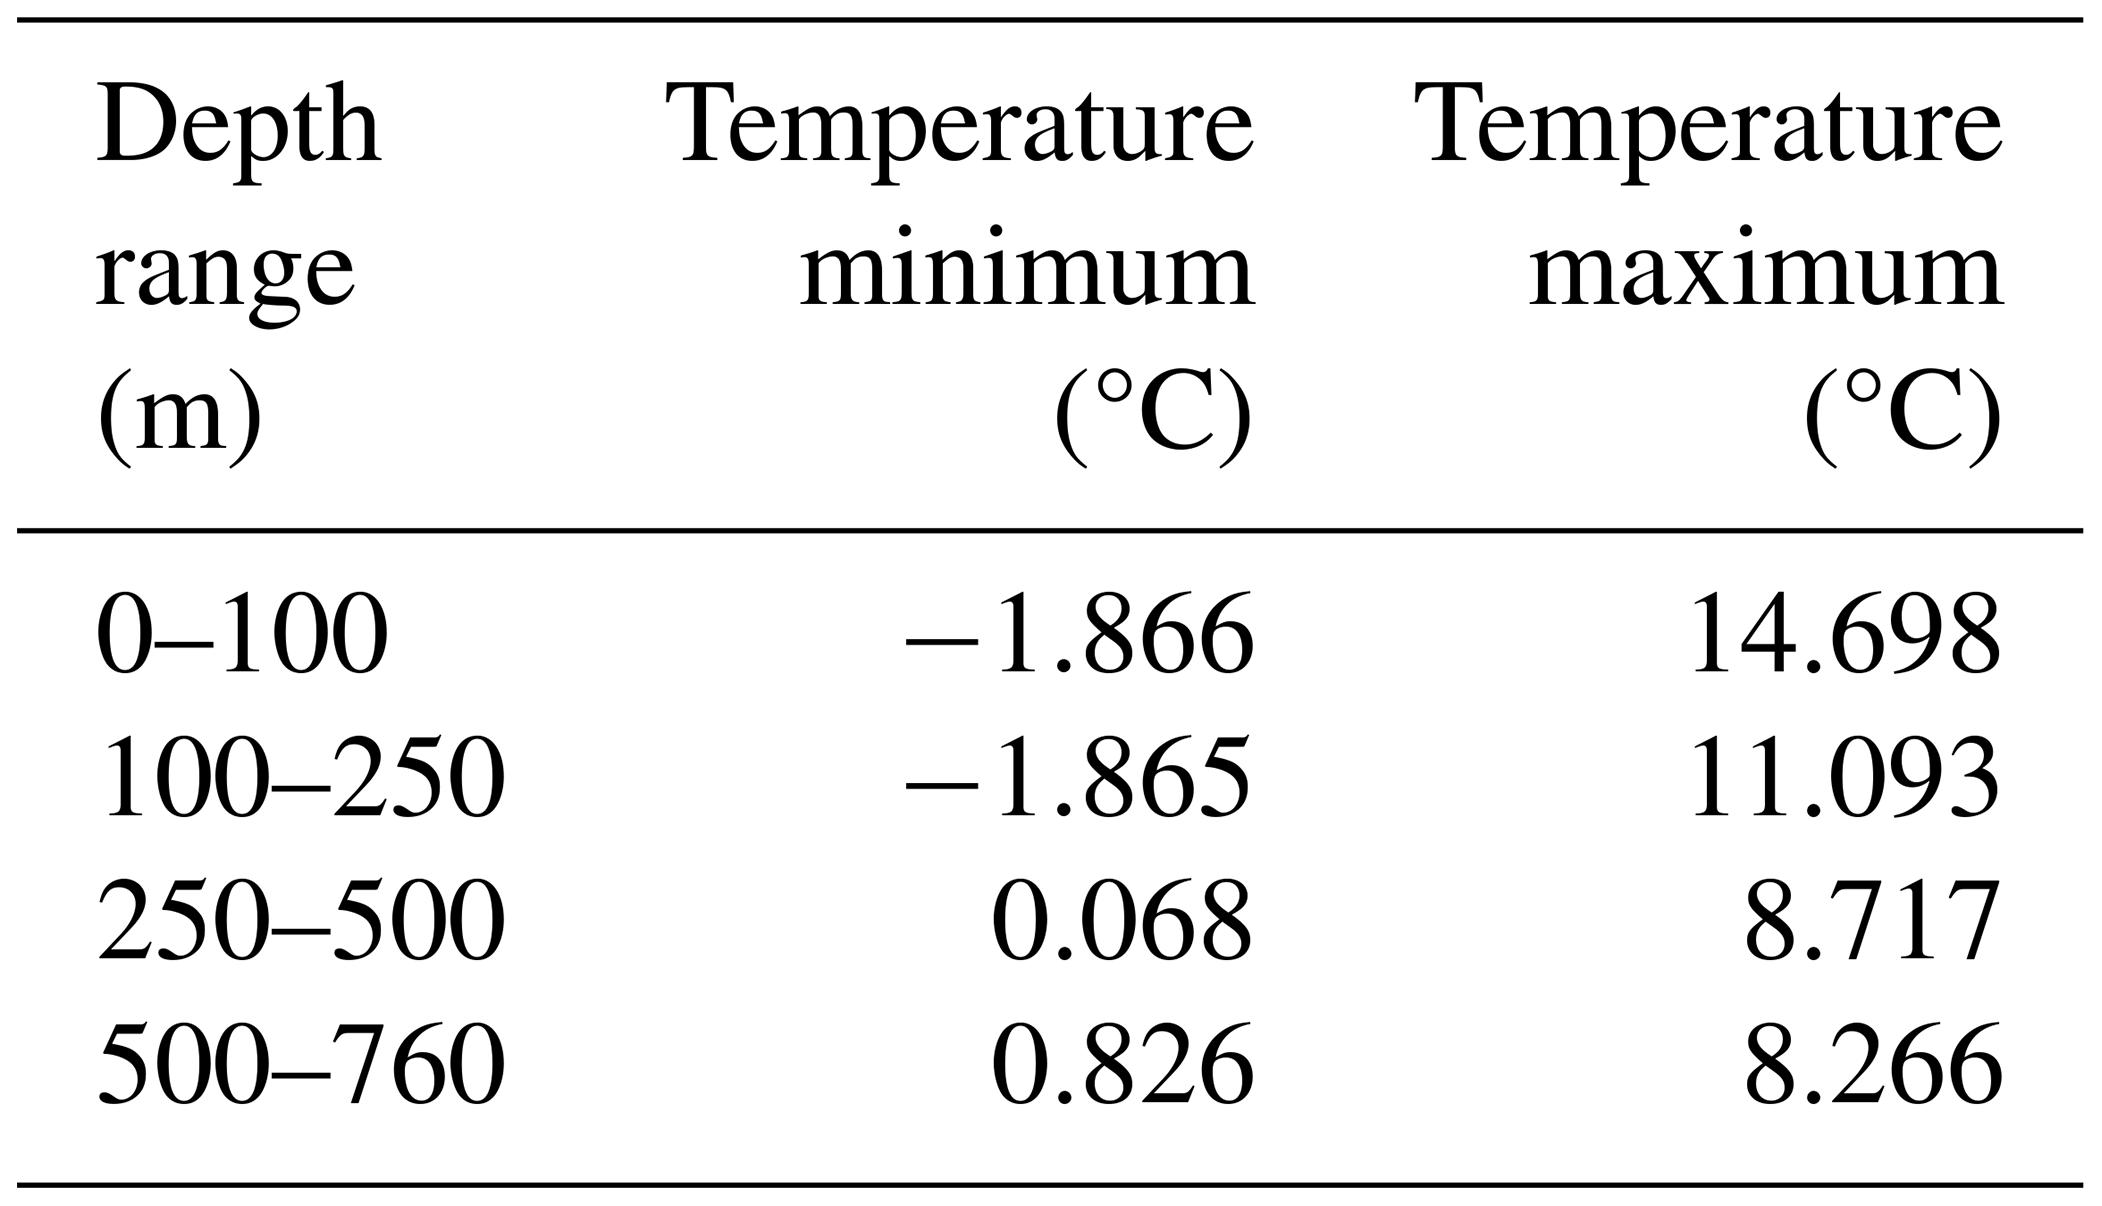
Then, all the vertical temperature profiles were checked for nominal maximum depth (760 m) and carefully inspected to identify malfunctions, coherence to regional oceanographic features, drop-to-drop consistency along the cruise track, and presence of unusual features. In this context, the main difficulty is usually found in distinguishing a common malfunction from a regional oceanographic feature (i.e., unexpected increase in temperature southward or along the water column). Consequently, unusual features were cross-validated by comparison to repeated (within 15 min) or neighboring profiles from the same voyage and eventually to available austral summer ARGO observations over the study area. To this aim, we again took advantage of XBT launch log sheets, in which operators notified any instrument malfunctions, adverse weather conditions, sea ice presence, and local bottom depth. In particular, the bottom depth was relevant to constraining XBT data profiles at the right depth, especially when approaching shallow waters (QF = 1 is assigned to values shallower than bottom depth; otherwise, they are flagged as QF = 4). When the log sheet was unavailable, we relied instead on the GEBCO 2×2 min bathymetry (GEBCO Compilation Group, 2023), which closely corresponded to the in situ reported depths over the area and period of study. Additionally, a gross filter was applied to all the XBT profiles using temperature ranges that vary on four vertical layers, as reported in Table 4. The ranges were defined through the use of ARGO data collected in the study area between 2004 and 2023. QF = 4 was applied to data exceeding the thresholds of ±0.5 °C.
Table 4Temperature ranges applied to XBT profiles, divided into four levels.
Several studies assess that the XBT measurements near the sea surface may be considered unreliable due to the stabilization of motion and thermal adaptation to the surrounding environment (e.g., Bailey et al., 1994; Cowley and Krummel, 2022; Simoncelli et al., 2024). They also suggest that the first acceptable value is at about 4 m depth and that the data user must be carefully informed in order to exclude suspect surface values from scientific analyses. Here, we opted to provide all the original measurements annotating their quality, as resulting from a dedicated test on the initial part of each profile. This test calculates the differences between the value recorded at time t=0.6 s (about 4 m depth) and shallower measurements, classifying them based on the standard uncertainty in temperature attributable to an XBT probe (0.10 °C) as a metric (Simoncelli et al., 2024). Therefore, temperature data are assigned QF = 1 if the difference is less than or equal to the standard deviation (SD), QF = 2 if it is between SD and 2 × SD, QF = 3 if it is between 2 × SD and 3 × SD, and QF = 4 if it is higher than 3 × SD.
Then, the XBT profiles were examined for the presence of spikes, unrealistic oscillations, and unusual gradients in temperature data, as well as sharp variations toward negative or higher values, which could be caused by copper wire breaks. Data are mostly flagged as good (QF = 1) or bad (QF = 4) values. Nonetheless, suspect data are compared with neighboring profiles and ARGO climatology over the study area (obtained from products available at https://www.coriolis.eu.org/Data-Products/Data-selection, last access: 1 February 2025), eventually assigning QF = 1, QF = 2, and QF = 3 attributes. For example, QF = 2 is used when an XBT profile presents a step-like feature that is not confirmed by a neighboring profile but is consistent with similar features previously observed in the study region. QF = 3 is used, instead, when XBT values exhibit suspect temperature values that cannot be confirmed by a neighboring profile and occur in areas where there is no evidence of mesoscale structures (e.g., eddies or fronts).
Nevertheless, an increase or decrease in temperature over large depth ranges compared to neighboring profiles can also be associated with an eddy, a frontal area, or an intense current system. Therefore, QF = 1 is applied when repeated profiles showing similar temperatures or archive data can confirm the feature. The larger-scale description of ocean dynamics obtained through satellite altimetry was also used for controversial results to identify the presence of eddies and frontal systems affecting the temperature data.
However, some profiles might exhibit anomalous features that the described QC procedure cannot detect as erroneous values. Therefore, an additional visual check was carried out for each individual cruise track and each vertical temperature profile to verify the assigned QF = 2 and QF = 3 flags and identify any residual anomalies in the positioning of the XBT launches or outliers in the data collection. This control was performed using the Ocean Data View (ODV) software (Schlitzer, 2022).
Overall, the entire QC led us to discard about 12 % of acquired XBT observations, which were flagged as bad or probably bad data (Fig. 3).
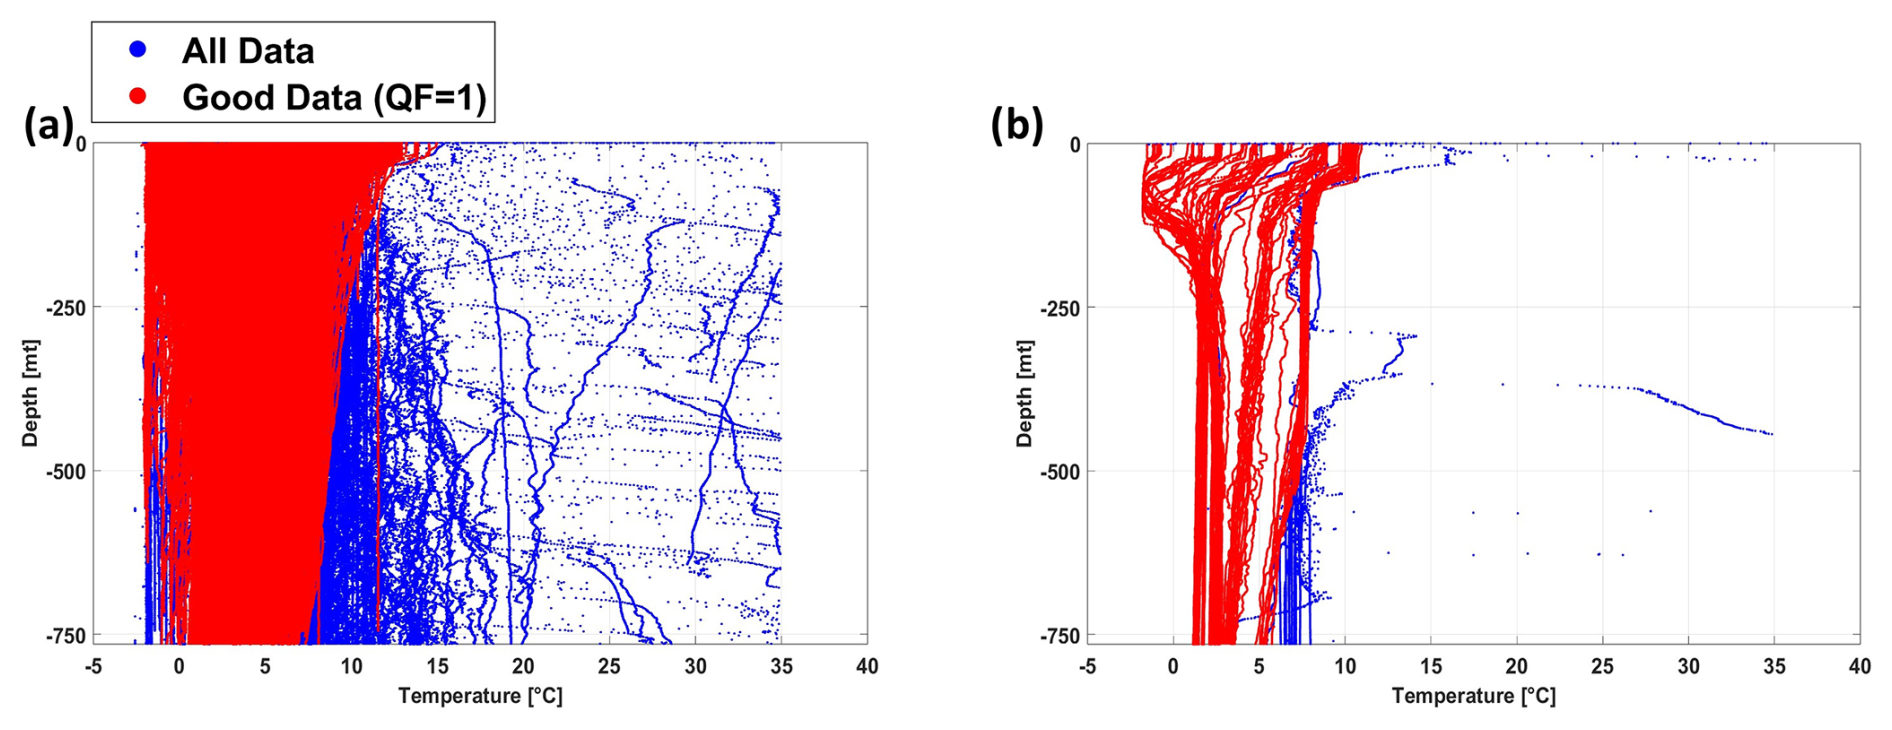
Figure 3(a) XBT observations collected between December 1994 and January 2024 over the Aotearoa / New Zealand–Ross Sea chokepoint before (blue) and after (red) the quality check; (b) an example of the quality check on the XBT data collected during the PNRA_XXXV cruise.
2.3 XBT data biases correction
Previous studies assessed that temperature biases and depth errors, due to inaccurate time conversion to depth through FRE, may affect XBT observations (e.g., Gouretski and Reseghetti, 2010; Cowley et al., 2013). Although a full comprehension of the origins of these issues is still pending, several experiments tried to quantify this bias by comparing XBT profiles with co-located CTD observations, demonstrating that XBT temperatures are usually warmer than reality (Gouretski and Reseghetti 2010; Cheng et al., 2014). Different possible causes of biases emerged, including mechanical (e.g., probe type, manufacturer, and year), external (e.g., launch height and meteo-marine conditions), and electrical (e.g., thermistor, wire) factors (Seaver and Kuleshov, 1982; Green, 1984; Reverdin et al., 2009). Additionally, a decrease in fall rate was observed in cooler waters because of increased viscosity (Gouretski and Reseghetti 2010), making FRE corrections in the Southern Ocean extremely important (Cheng et al., 2014).
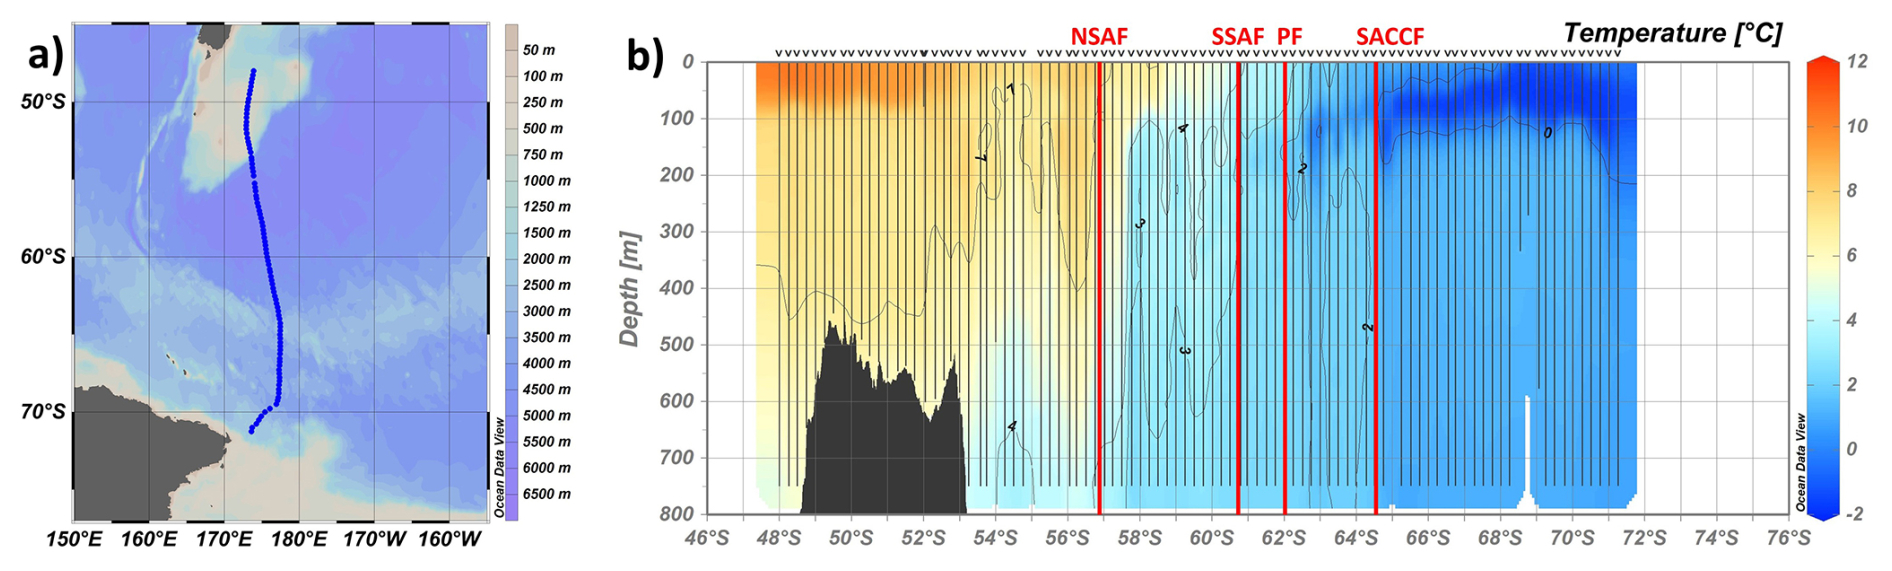
Figure 4(a) Map of the position (blue dots) of all XBT launches carried out during the PNRA_XVIII expedition along the Aotearoa / New Zealand–Antarctica chokepoint (6–11 January 2003). (b) Temperature vertical section from XBT data in (a) in which the vertical black lines represent the XBT casts and the red ones the ACC main front positions: Northern Sub Antarctic Front (NSAF), Southern Sub Antarctic Front (SSAF), Polar Front (PF), and Southern Antarctic Circumpolar Front (SACCF). The black mask represents the bathymetry. Plots were realized using Ocean Data View software (Schlitzer, 2022).
To address these problems, several correction schemes have been proposed over the past few decades. A comprehensive list of related papers is available at https://www.ncei.noaa.gov/products/xbt-corrections (last access: 1 February 2025). Taking advantage of more than 220 000 co-located XBT-CTD pairs, Cheng et al. (2014) examined and compared existing methodologies, proposing a new correction scheme for historical XBT data for nine independent probe-type groups. Their study confirmed that depth error and pure temperature bias are temperature-dependent and may be influenced by the data acquisition and recording systems. Moreover, the resulting scheme also considers that some biases affecting the XBT-derived temperature profiles vary with manufacturer/probe type and have been shown to be time dependent and that depth correction varies with depth (Cheng et al., 2016).
In our dataset, we apply this methodology, which includes corrections for both temperature and depth values based on calendar year, water temperature, and probe type, to provide bias-corrected XBT measurements (Cheng et al., 2014). To this aim, we use the Hanawa et al. (1995) coefficients (i.e., A=6.691 and B=0.00225) in the fall rate equation to derive temperature measurement depths starting from the time elapsed since the probe's release and, consequently, the bias-corrected depth and temperature values. A full description of the methodology is available at https://www.ncei.noaa.gov/products/xbt-corrections (last access: 1 February 2025) (see “CH Correction Method”); the update tables of the applied coefficients are available at http://www.ocean.iap.ac.cn/ftp/images_files/CH14_description/CH14_table1_update2023.txt (last access: 1 February 2025) and http://www.ocean.iap.ac.cn/ftp/images_files/CH14_description/CH14_table2_update2023.txt (last access: 1 February 2025).
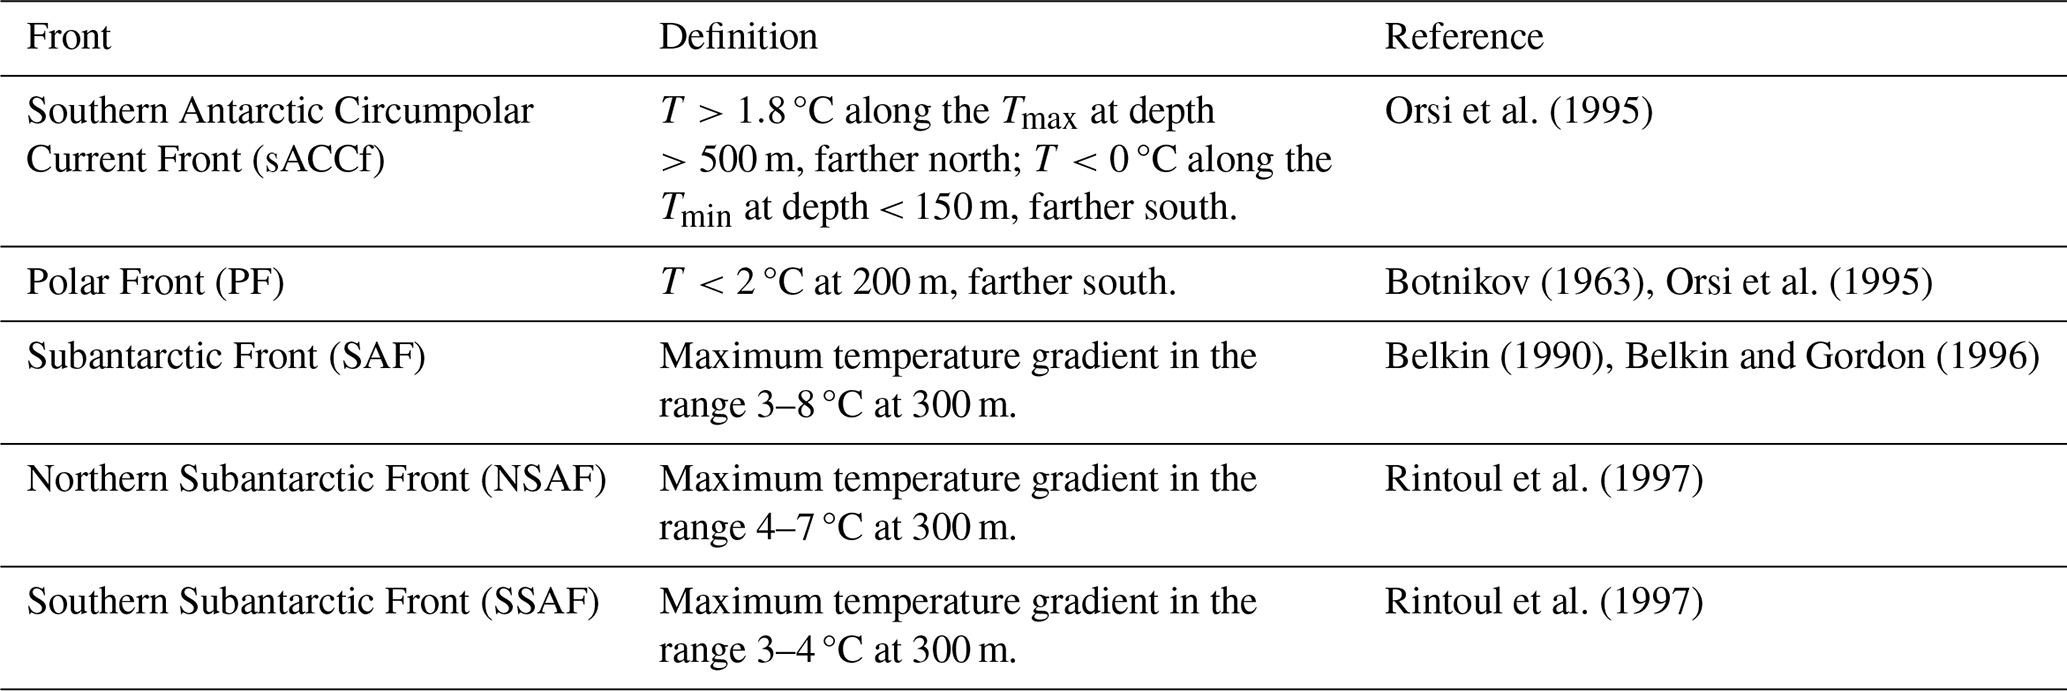
Table 5Criteria for front definitions (adapted from Budillon and Rintoul, 2003).
We believe this exceptional temperature dataset provides a valuable reservoir of high-resolution, independent, and trustworthy information. The dataset assumes notable significance, representing an extensive temporal series of data collected nearly every austral summer over the last 30 years within the same oceanic sector of the SO and along the same monitoring transect (PX36). We exploited this information to provide 36 vertical sections of the ocean temperature, from the surface to about 800 m depth, along the Aotearoa / New Zealand–Antarctica “chokepoint”. Figures representing the latitudinal sections of corrected XBT temperatures during each leg are available in the Supplement (Figs. S1–S36).
The repeated temperature sections significantly enhance our understanding of ACC fronts and their evolution over the last 3 decades. A first application of the dataset is shown in Fig. 4, where XBT observations collected during the PNRA_XVIII expedition are used for the identification of the main ACC front positions: Northern Sub Antarctic Front (NSAF), Southern Sub Antarctic Front (SSAF), Polar Front (PF), and Southern Antarctic Circumpolar Current (sACCf). The criteria used for identifying the fronts (Table 5) follow Budillon and Rintoul (2003), who compiled several hydrographic definitions (Botnikov, 1963; Belkin, 1990; Belkin and Gordon, 1996; Orsi et al., 1995; Rintoul et al., 1997). The southern boundary of the ACC, usually described as the maximum southern extent of vertical maximum of T>1.5 °C at about 200 m (Orsi et al., 1995), is not described in this sector as its position is coincident with the sACCf position in most of the available temperature sections.
The ACC front positions retrieved through XBT data also serve as ground truth for the validation of those retrieved through satellite altimetry (e.g., Sokolov and Rintoul 2009a, b; Graham et al., 2012; Chapman, 2017), thereby enhancing the identification process of fronts within the SO. This is highly desirable in regions significantly influenced by topographic steering, such as the area south of Aotearoa / New Zealand, where the presence of the Campbell Plateau strongly affects the ACC path (Fig. 5). To point out differences and similarities between ACC front positions identified through XBT and satellite observations, in Fig. 5 we present a sea surface height (SSH) map of the study area averaged over the period covered by the temperature section in Fig. 4 (about 7 d). To identify the ACC fronts from satellite data, we applied the SSH isolines methodology that associates a specific value of SSH with each front. For the selection of these values, we relied on previous studies (Sokolov and Rintoul, 2007, 2009a, b) proving that the multiple jets of ACC fronts are consistently aligned with streamlines identified by nearly constant circumpolar values of SSH contours.
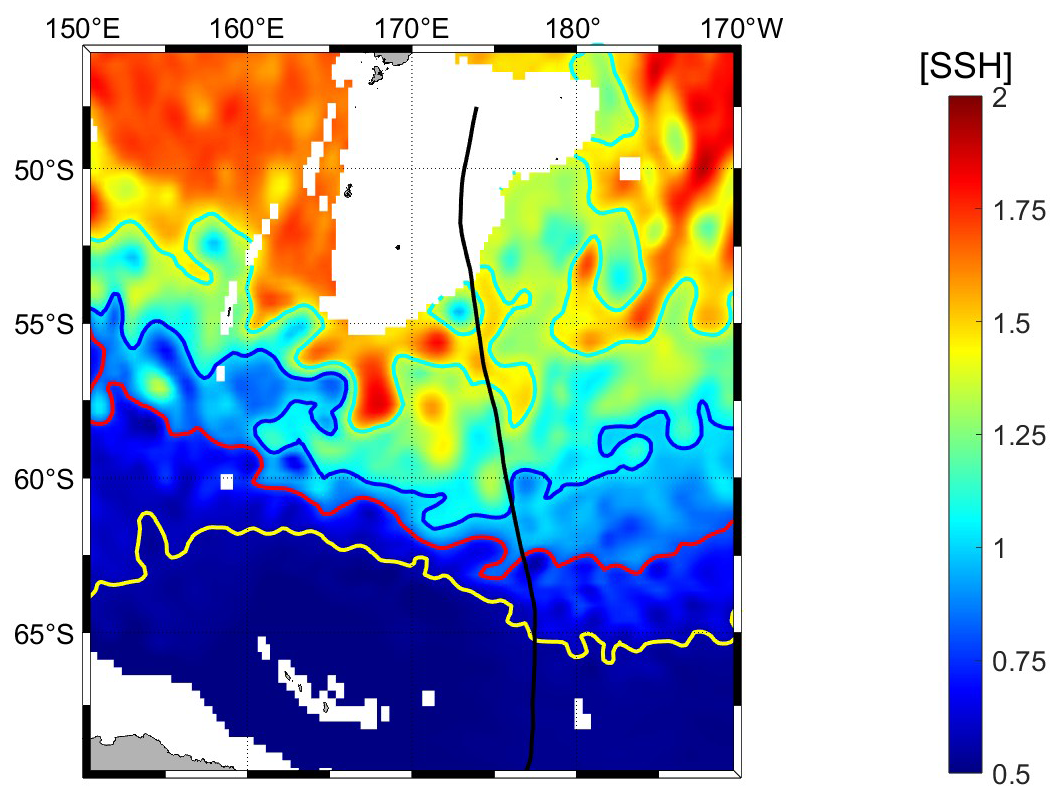
Figure 5Altimetric map of SSH mediated throughout the PNRA_XVIII expedition along the PX36 monitoring line. Contours of different colors identify the position of the main fronts of the ACC retrieved through SSH: NSAF in cyan, SSAF in blue, PF in red and sACCf in yellow. The ship's route is represented by the black line.
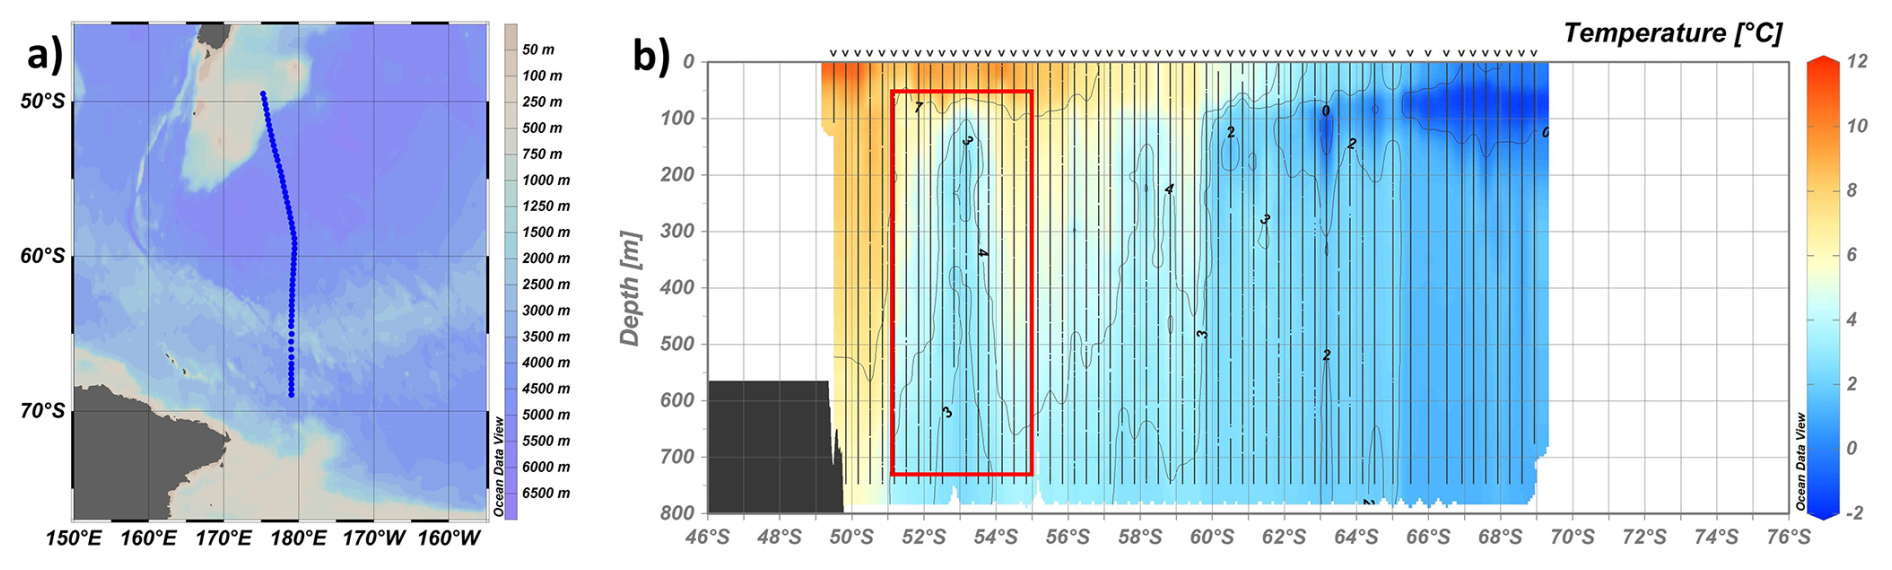
Figure 6(a) Map of the position (blue dots) of all XBT launches carried out during the PNRA_XXIX expedition along the Aotearoa / New Zealand–Antarctica chokepoint (30 December 2013–18 February 2014). (b) Temperature vertical section from XBT data in (a) in which the vertical black lines represent the XBT casts and the red box identifies the position of an ACC's cold-core eddy. The black mask represents the bathymetry. Plots were realized using Ocean Data View software (Schlitzer, 2022).
Furthermore, ACC fronts exhibit instabilities that give rise to the generation of eddies. Eddies, characterized as vortices pervading the ocean, assume a pivotal role, particularly within the SO, contributing significantly to the transfer of heat, nutrients, and momentum (e.g., Chelton et al., 2011; Falco and Zambianchi, 2011; Cotroneo et al., 2013; Trani et al., 2014; Rintoul, 2018; Menna et al., 2020). While altimetry proves valuable in gaining an insight into surface eddy dynamics, it cannot provide information regarding vertical temperature variations within the eddy structure. Through the temperature sections derived from XBT data, we can discern the presence or absence of an eddy and get basic observations for the analysis of its heat content.
An example is provided in Fig. 6, where we present the latitudinal section of temperatures observed during the return leg of the 2013–2014 Italian Antarctic expedition (PNRA_XXIX). This section shows the intrusion of a cold-core eddy at about 53° S, next to the Campbell Plateau edge. The eddy is characterized by a maximum negative temperature anomaly (eddy's core) of about −4 °C compared to the surrounding water. This negative anomaly results in the formation of a depression in the SSH, which is also detectable in satellite imagery. In the SSH map shown in Fig. 7, the cold-core eddy is identified as a closed circle of the blue isoline associated with the SSAF.
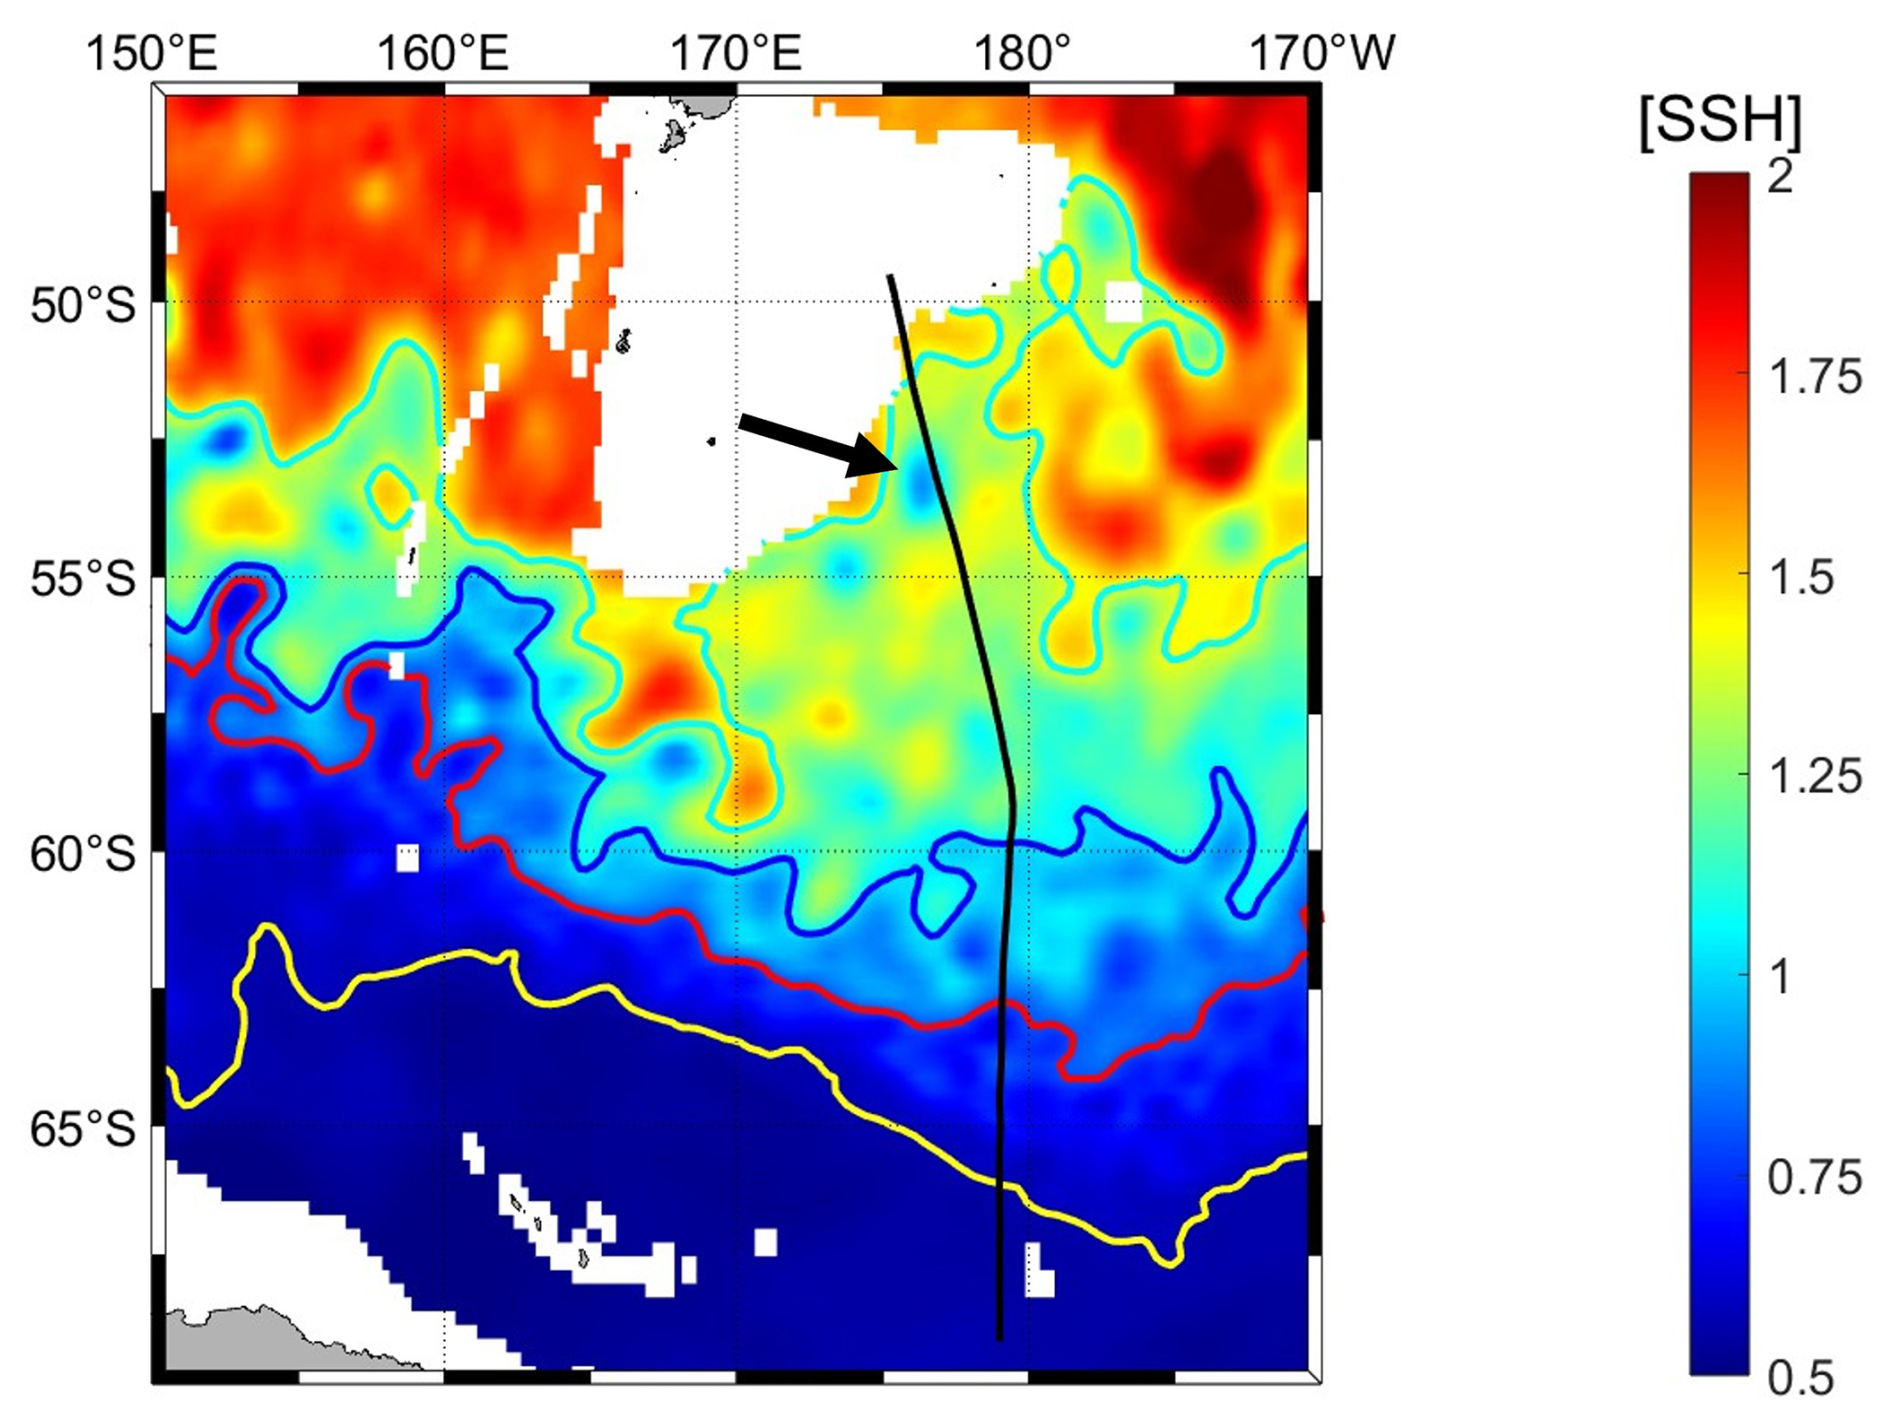
Figure 7Altimetric map of SSH mediated throughout the PNRA_XXIX expedition along the PX36 monitoring line. Contours of different colors identify the position of the main fronts of the ACC retrieved through SSH: NSAF in cyan; SSAF in blue; PF in red and sACCf in yellow. The ship's route is represented by the black line. The black arrow indicates the observed cold-core eddy.
Generally, the combined use of in situ observations and satellite data is crucial as it prevents errors in front positioning and eddy identification. Strong horizontal temperature gradients, often linked to eddies, could be misinterpreted as ACC fronts. Similarly, this approach allows us to distinguish eddies from other mesoscale structures, a difficult task when relying only on altimetry. XBTs and satellite information are also complementary in providing valid terms of comparison at different temporal and spatial scales (XBT at the fine scale and altimetry at the meso- and large scale) for numerical model products representing ocean circulation and eddies dynamics (e.g., Chen et al., 2024a, b).
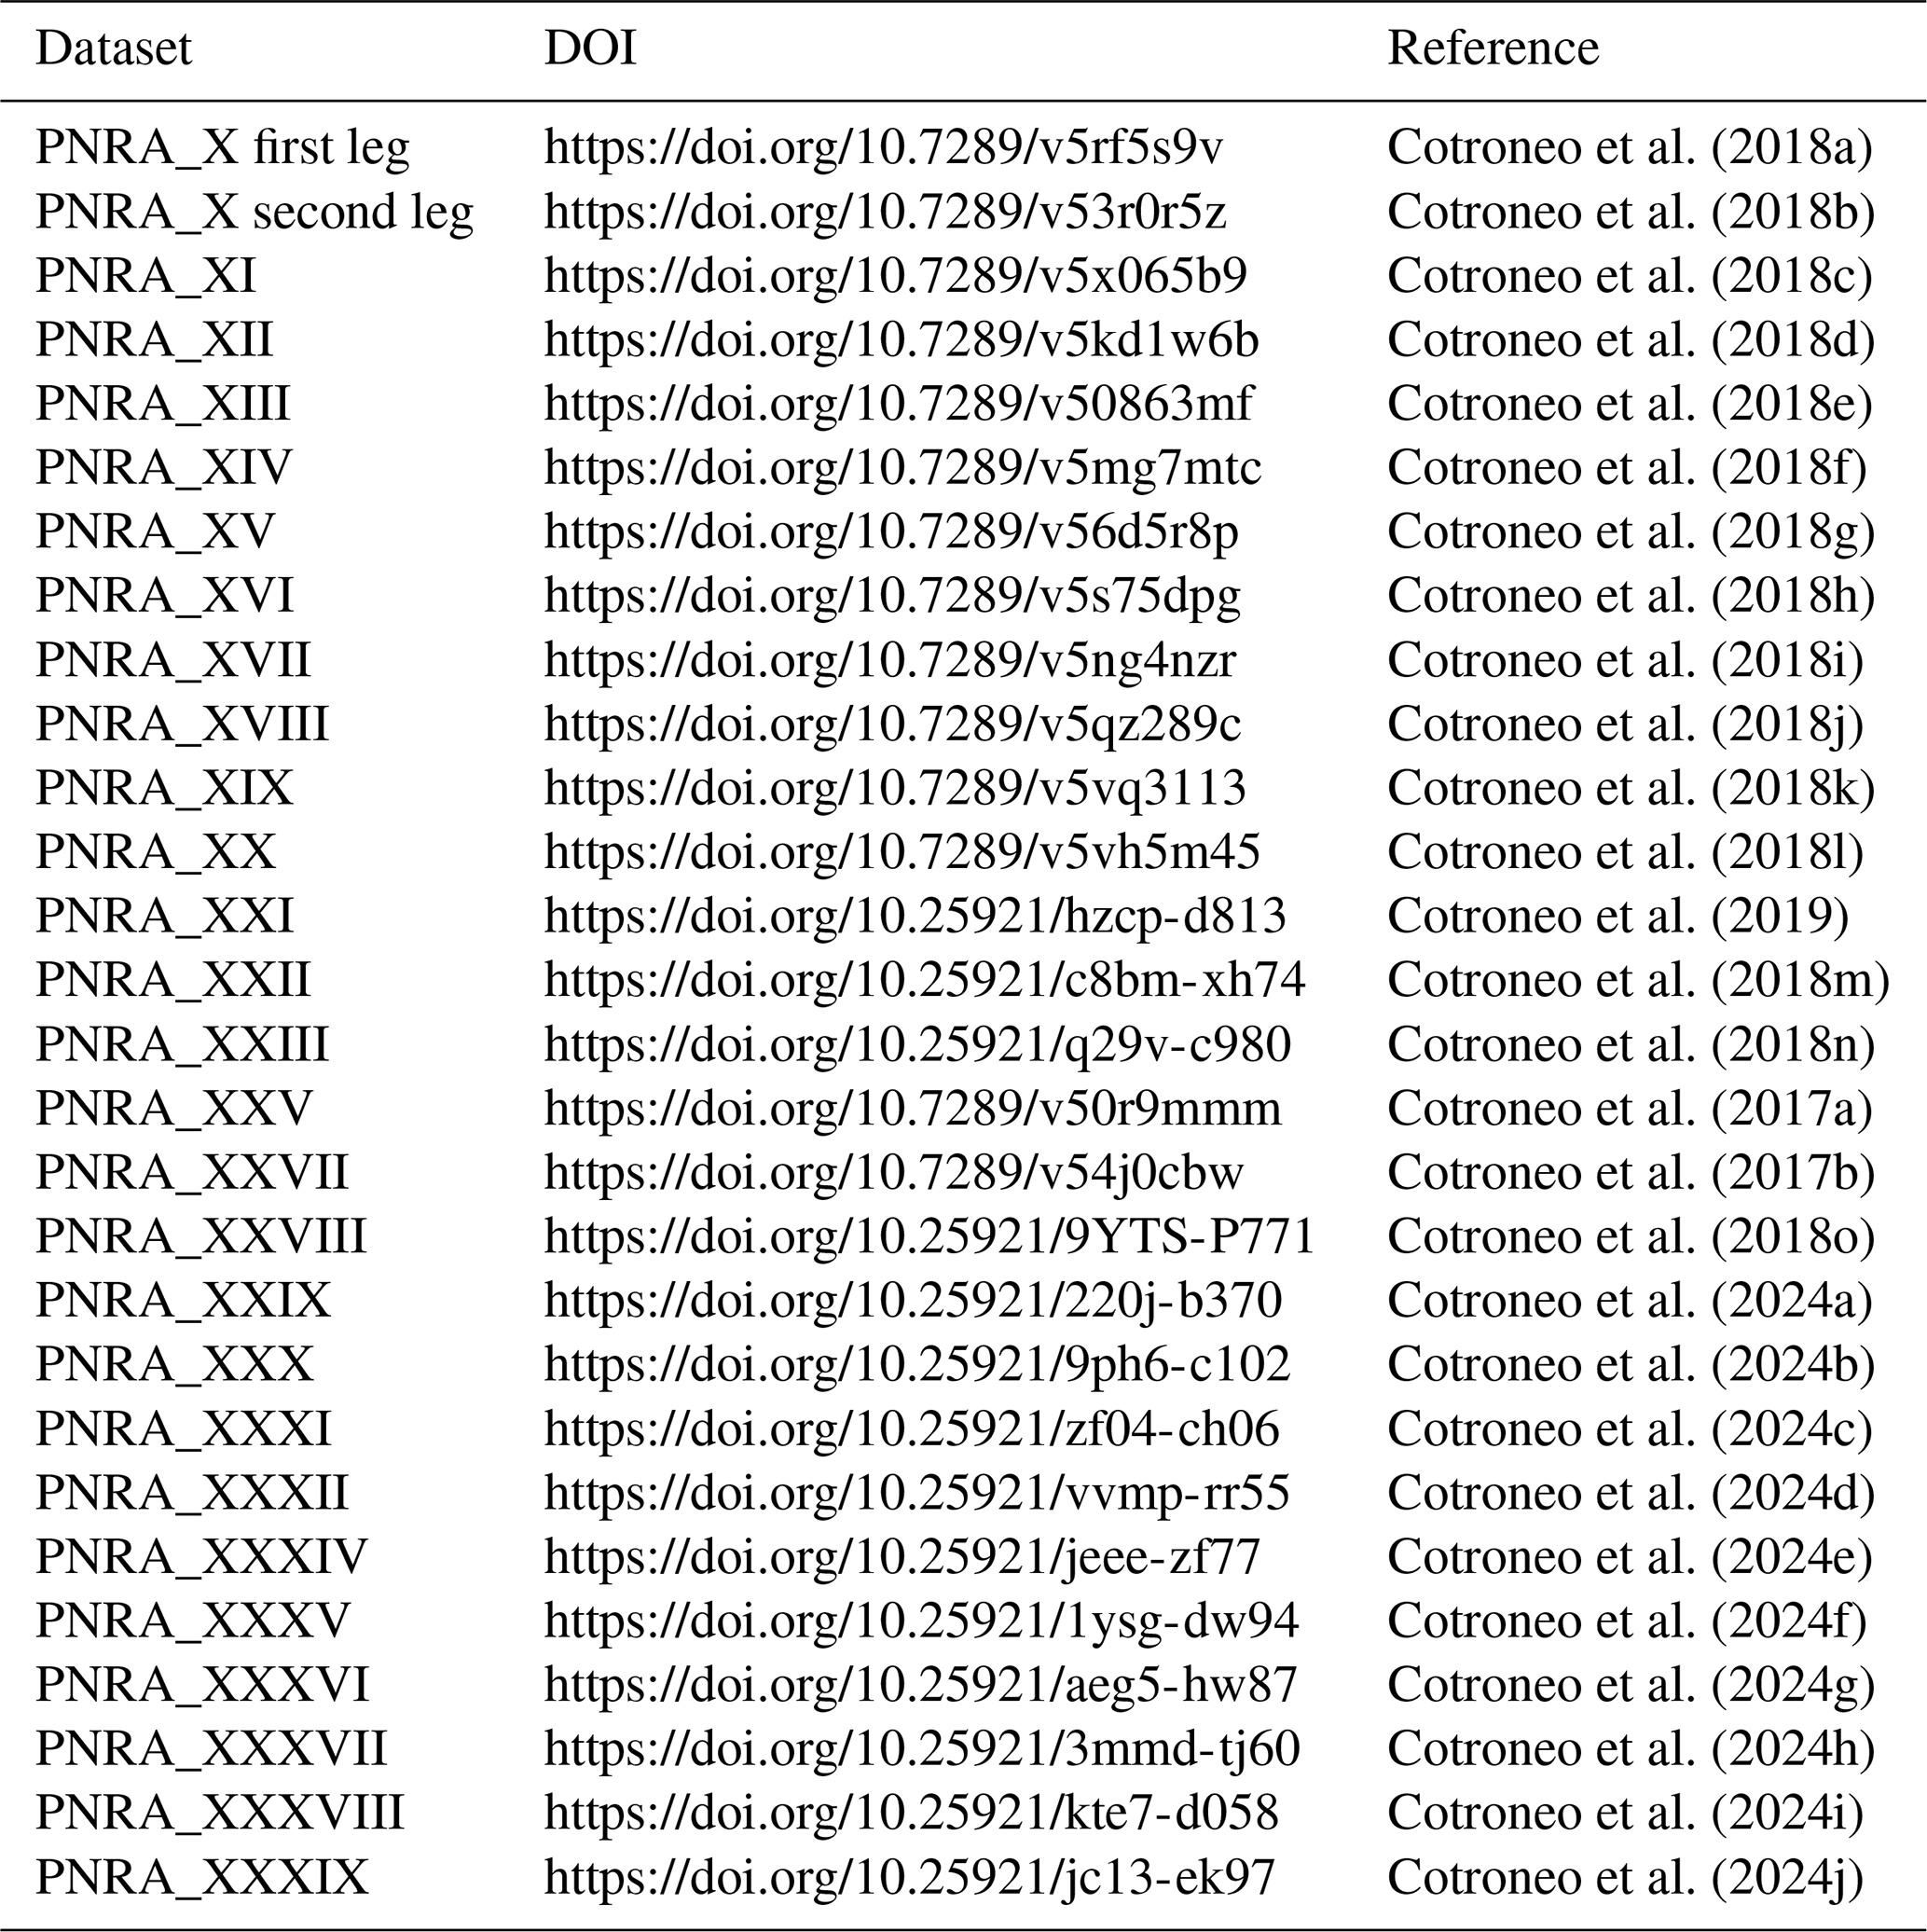
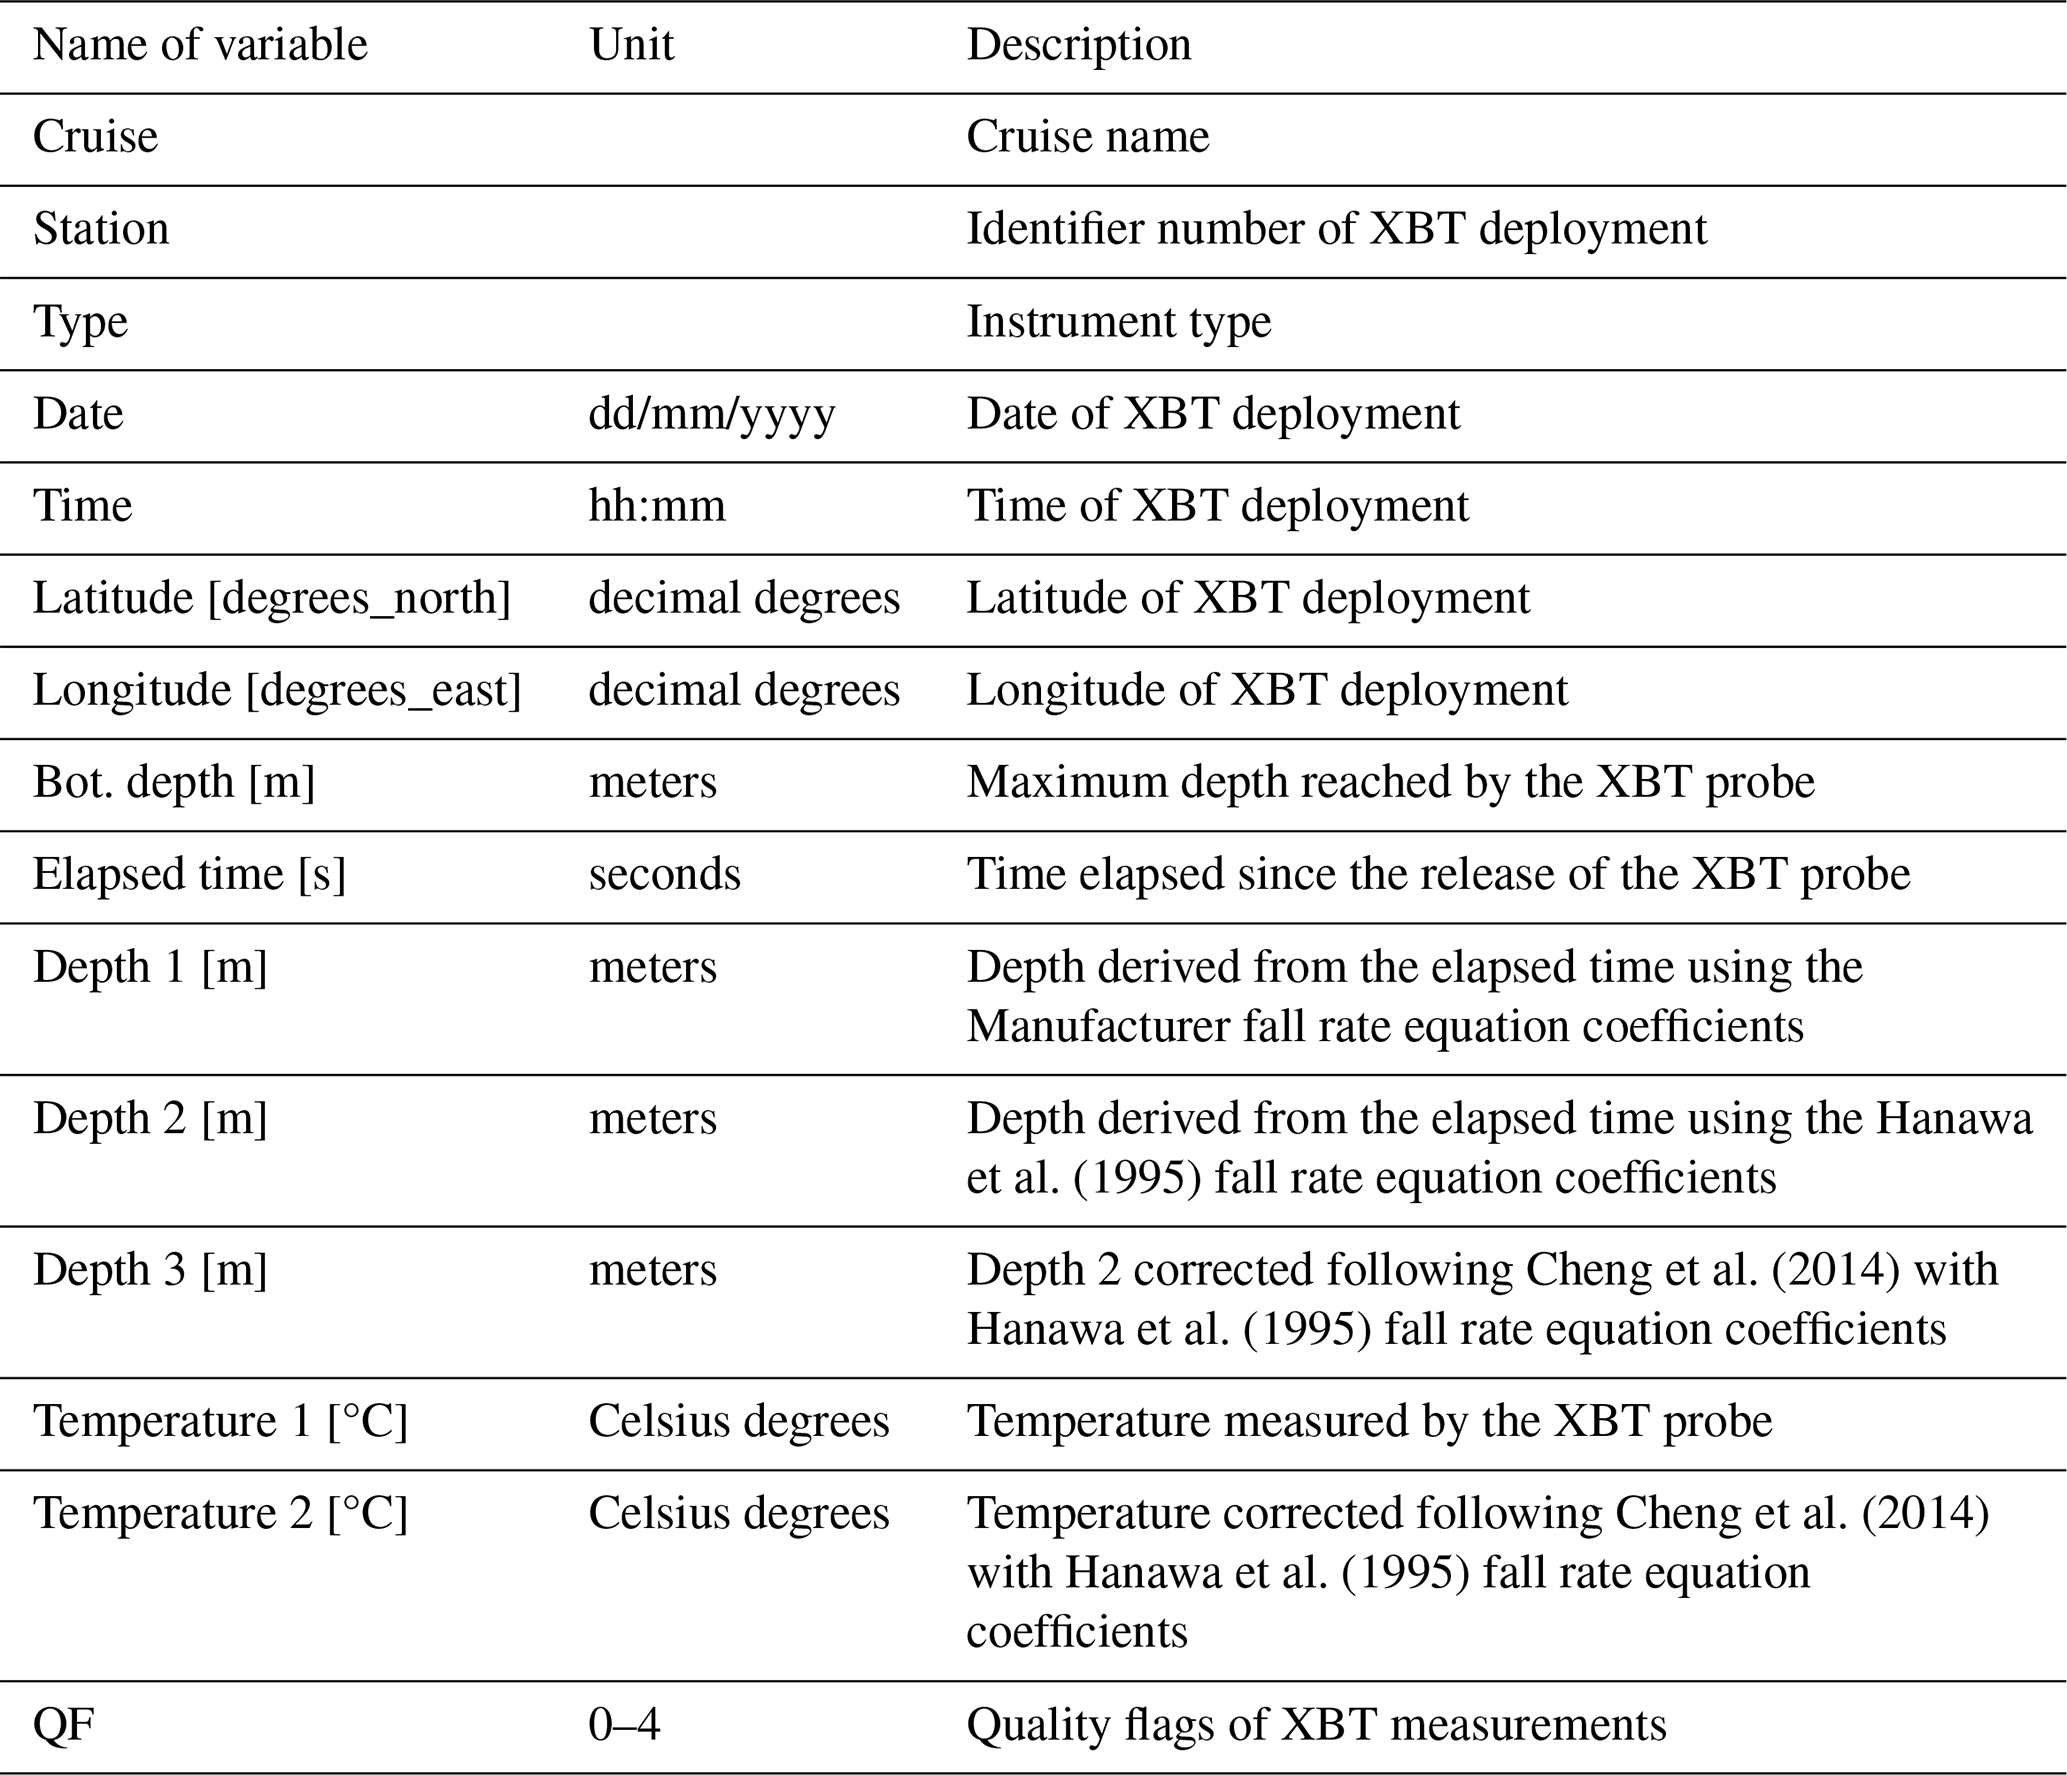
Table 7Name and description of the main variables included in the XBT text files.
The full XBT dataset presented here is publicly accessible as text format files at https://doi.org/10.5281/zenodo.14848849 (Aulicino et al., 2025). Individual cruise data are also available through the National Oceanic and Atmospheric Administration (NOAA) National Centers for Environmental Information (NCEI) unrestricted repositories, as listed in Table 6. NCEI serves as the official archive for data, metadata, and products collected and provided by NOAA scientists. Additionally, NCEI hosts quality-checked data from non-NOAA scientists, which must go through a scientific appraisal process before being accepted into the archive. For this reason, our XBT data underwent a thorough review and improvement process (see Sect. 2.2 and 2.3) prior to publication, resulting in the full dataset presented here, available on a Zenodo repository.
Each XBT file includes the main variables summarized in Table 7, the relative EMODNet-compliant metadata (i.e., about the probe type, software, manufacturer, data originator, scientific project, platform, uncertainties, and QF code), detailed information about the FRE coefficients used for temperature and depth bias correction described in Sect. 2.3, and short description of the dataset. The manufacturer FRE coefficients are also provided in the metadata, allowing anyone who wishes to recalculate the corrections in a different way than using Cheng et al. (2014) to do so.
One file is created for each research cruise. The naming convention is xbt_cruise, where cruise is the identification cruise name of the PNRA research expedition, as in Table 1. Please note that the format and labels of the provided XBT text files are ODV-compliant to facilitate ease of use. All temperature sections presented in Figs. 4, 6, and S1–S36 were realized using ODV software and applying consistent interpolation parameters. The adopted zonal interpolation is based on a spatial weighting model that incorporates three temperature profiles (a central reference profile, an upstream profile, and a downstream profile), considering a maximum influence range of 60 km along the zonal direction and 20 m along depth.
Additionally, a Python code for basic XBT data visualization is included in Code S1 in the Supplement (such as shown for scatterplots of vertical temperature profiles and latitudinal temperature sections in Figs. S37 and S38).
The SO is a key place for atmosphere–ocean physical and biogeochemical interactions at different spatial and temporal scales (Falco and Zambianchi, 2011; Cerrone et al., 2017a, b; Buongiorno Nardelli et al., 2017; Falco et al., 2024). However, despite their importance, processes in many areas of the SO are still poorly known due to the scarcity of in situ measurements. This is particularly true for the ACC region and its fronts, which are characterized by complex dynamics and intense eddy activity (Trani et al., 2011; Cotroneo et al., 2013; Frenger et al., 2015; Menna et al., 2020; Ferola et al., 2023). To fill this gap, all available measurements provide a significant contribution and should be shared within the oceanographic community.
To this goal, here we present 36 vertical sections of XBT ocean temperature data collected between Aotearoa / New Zealand and the Ross Sea (PX36 line) during the austral summers from 1994/1995 to 2023/2024. This dataset provides a direct insight into the 0–800 m thermal characteristics of the Pacific sector of the SO and complements data sourced from observing networks, drifters, ARGO floats, and glider fleets. It is also suitable to be combined with enhanced spatial and temporal scale remotely sensed observations and numerical simulations. This comprehensive dataset lays a robust foundation for a nuanced analysis of the key mechanisms governing thermohaline circulation in the SO and for improving our knowledge of the physical and biogeochemical characteristics of the four-dimensional ocean.
The continuation of this XBT collection over time, in the framework of the Italian PNRA research expeditions to Antarctica, is particularly important due to the inherent challenges associated with data acquisition in the SO and promises an increasingly comprehensive and detailed understanding of thermal variations in this specific maritime region.
The supplement related to this article is available online at https://doi.org/10.5194/essd-17-2625-2025-supplement.
GA, YC, and AIF conceived and designed the manuscript. GA, YC, PC, PF, GF, GB, NK, GS, EZ, and AIF collected the measurements and organized the XBT dataset. GA, YC, LF, and AIF carried out the quality control analyses. All authors analyzed the achieved results, contributed to the writing, and approved the final paper.
The contact author has declared that none of the authors has any competing interests.
Publisher's note: Copernicus Publications remains neutral with regard to jurisdictional claims made in the text, published maps, institutional affiliations, or any other geographical representation in this paper. While Copernicus Publications makes every effort to include appropriate place names, the final responsibility lies with the authors.
This study was made possible thanks to the contribution of the Climatic Long-term Interaction for the Mass balance in Antarctica (CLIMA), Southern Ocean Chokepoints Italian Contribution (SOChIC), Marine Observatory of the Ross Sea (MORSea), Effects of the east current on the Salinity variability in the Ross Sea (ESTRO), Physical and biogeochemical tracing of water masses at source areas and export gates in the Ross Sea and impact on the Southern Ocean (SIGNATURE) and Antarctic Circumpolar Current Eddies Survey and Simulations (ACCESS) projects, part of the Italian National Antarctic Research Program (PNRA). Special thanks go to Arturo De Alteris, Massimo De Stefano, Massimiliano Esposito, and Giovanni Zambardino who provided essential support to data acquisition, as well as to the captain, officers, and crew of the research vessels used for XBT launches. The authors are particularly grateful to the ESSD referees and editors for the constructive comments and suggestions provided during the manuscript discussion.
This paper was edited by Simona Simoncelli and reviewed by Rebecca Cowley and Alexey Mishonov.
Armour, K. C., Marshall, J., Scott, J. R., Donohoe, A., and Newsom, E. R.: Southern Ocean warming delayed by circumpolar upwelling and equatorward transport, Nat. Geosci., 9, 549–554, https://doi.org/10.1038/ngeo2731, 2016.
Aulicino, G. and Wadhams, P.: Editorial for the Special Issue “Remote Sensing of the Polar Oceans”, Remote Sens., 14, 6195, https://doi.org/10.3390/rs14246195, 2022.
Aulicino, G., Cotroneo, Y., de Ruggiero, P., Buono, A., Corcione, V., Nunziata, F., and Fusco, G.: Remote Sensing Applications in Satellite Oceanography, in: Measurement for the Sea. Springer Series in Measurement Science and Technology, edited by: Daponte, P., Rossi, G. B., and Piscopo, V., Springer, Cham, https://doi.org/10.1007/978-3-030-82024-4_8, 2022.
Aulicino, G., Cotroneo, Y., and Ferola, A. I.: XBT water column temperature data collected in the Southern Ocean between New Zealand and the Ross Sea during the austral summers from 1994/1995 to 2023/2024, Zenodo [data set], https://doi.org/10.5281/zenodo.14848849, 2025.
Bailey, R., Gronell, A., Phillips, H., Tanner, E., and Meyers, G.: Quality control cookbook for XBT data, Version 1.1, CSIRO Marine Laboratories Reports 221, CSIRO, https://doi.org/10.25607/OBP-1482, 1994.
Belkin, I. M.: Hydrological fronts of the Indian Subantarctic, in: The Antarctic, The Committee Reports, Nauka, Mosca, 265–268, 1990.
Belkin, I. M. and Gordon, A. L.: Southern Ocean fronts from the Greenwich meridian to Tasmania, J. Geophys. Res., 101, 265–268, https://doi.org/10.1029/95JC02750, 1996.
Botnikov, V. N.: Geographical position of the Antarctic Convergence Zone in the Antarctic Ocean, Soviet Antarctic Exped. Inform. Bull., 41, 324–327, 1963.
Budillon, G. and Rintoul, S. R.: Fronts and upper ocean thermal variability south of New Zealand, Antartct. Sci., 15, 141–152, https://doi.org/10.1017/S0954102003001135, 2003.
Buongiorno Nardelli, B.: A Deep Learning Network to Retrieve Ocean Hydrographic Profiles from Combined Satellite and In Situ Measurements, Remote Sens., 12, 3151, https://doi.org/10.3390/rs12193151, 2020.
Buongiorno Nardelli, B., Guinehut, S., Verbrugge, N., Cotroneo, Y., Zambianchi, E., and Iudicone, D.: Southern Ocean mixed-layer seasonal and interannual variations from combined satellite and in situ data, J. Geophys. Res.-Oceans, 122, 10042–10060, https://doi.org/10.1002/2017JC013314, 2017.
Cerrone, D., Fusco, G., Cotroneo, Y., Simmonds, I., and Budillon, G.: The Antarctic circumpolar wave: Its presence and interdecadal changes during the last 142 years, J. Climate, 30, 6371–6389, https://doi.org/10.1175/JCLI-D-16-0646.1, 2017a.
Cerrone, D., Fusco, G., Simmonds, I., Aulicino, G., and Budillon, G.: Dominant covarying climate signals in the Southern Ocean and Antarctic sea ice influence during the last three decades, J. Climate, 30, 3055–3072, https://doi.org/10.1175/JCLI-D-16-0439.1, 2017b.
Chapman, C. C.: New perspectives on frontal variability in the Southern Ocean, J. Phys. Oceanogr., 47, 1151–1168, https://doi.org/10.1175/JPO-D-16-0222.1, 2017.
Chelton, D. B., Schlax, M. G., and Samelson, R. M.: Global observations of nonlinear mesoscale eddies, Prog. Oceanogr., 91, 167–216, https://doi.org/10.1016/j.pocean.2011.01.002, 2011.
Chen, X., Chen, G., Ge, L., Cao, C. and Huang, B.: Medium-range forecasting of oceanic eddy trajectory, Int. J. Digit. Earth, 17, https://doi.org/10.1080/17538947.2023.2300325, 2024a.
Chen, Z., Wang, X., Cao, H., and Song, X.: Mapping high-resolution surface current by incorporating geostrophic equilibrium with surface quasigeostrophic theory using multi-source satellite observations, Remote Sens. Environ., 304, 114058, https://doi.org/10.1016/j.rse.2024.114058, 2024b.
Cheng, L., Zhu, J., Cowley, R., Boyer, T., and Wijffels, S.: Time, probe type, and temperature variable bias corrections to historical expendable bathythermograph observations, J. Atmos. Ocean. Tech., 31, 1793–1825, https://doi.org/10.1175/Jtech-D-13-00197.1, 2014.
Cheng, L., Abraham, J., Goni, G., Boyer, T., Wijffels, S., Cowley, R., Gouretski, V., Reseghetti, F., Kizu, S., Dong, S., Bringas, F., Goes, M., Houpert, L., Sprintall, J., and Zhu, J.: XBT Science: assessment of instrumental biases and errors, B. Am. Meteorol. Soc., 97, 924–933, https://doi.org/10.1175/BAMS-D-15-00031.1, 2016.
Convey, P. and Peck, L. S.: Antarctic environmental change and biological responses, Sci. Adv., 5, eaaz0888, https://doi.org/10.1126/sciadv.aaz0888, 2019.
Cotroneo, Y., Budillon, G., Fusco, G. and Spezie, G.: Cold core eddies and fronts of the Antarctic Circumpolar Current south of New Zealand from in situ and satellite data, J. Geophys. Res.-Oceans, 118, 2653–2666, https://doi.org/10.1002/jgrc.20193, 2013.
Cotroneo, Y., Aulicino, G., Ruiz, S., Pascual, A., Budillon, G., Fusco, G., and Tintoré, J.: Glider and satellite high resolution monitoring of a mesoscale eddy in the Algerian basin: Effects on the mixed layer depth and biochemistry, J. Mar. Syst., 162, 73–88, https://doi.org/10.1016/j.jmarsys.2015.12.004, 2016.
Cotroneo, Y., Budillon, G., Meloni, R., Aliani, S., Zambardino, G., and Spezie, G.: Water temperature data from XBT taken from research vessel Italica in the Southern Ocean and Southwest Pacific Ocean from 2010-01-25 to 2010-01-29 (NCEI Accession 0167835), NOAA National Centers for Environmental Information [data set], https://doi.org/10.7289/v50r9mmm, 2017a.
Cotroneo, Y., Budillon, G., Castagno, P., De Alteris, A., De Stefano, M., Falco, P., Fusco, G., Zambardino, G., and Spezie, G.: Water temperature from XBT taken from research vessel Italica in the Southern Ocean and Southwest Pacific Ocean from 2012-01-13 to 2012-01-19 (NCEI Accession 0167834), NOAA National Centers for Environmental Information [data set], https://doi.org/10.7289/v54j0cbw, 2017b.
Cotroneo, Y., Budillon, G., Artegiani, A., Conversano, F., Corbo, C., Gallarato, A., Giaquinto, G., Russo, A., Sala, A., Testa, G., and Spezie, G.: Water temperature data from XBT taken from the research vessel Italica in the Southern Ocean and Southwest Pacific Ocean from 1994-11-03 to 1995-01-01 (NCEI Accession 0170608), NOAA National Centers for Environmental Information [data set], https://doi.org/10.7289/v5rf5s9v, 2018a.
Cotroneo, Y., Budillon, G., Artegiani, A., Conversano, F., Corbo, C., Gallarato, A., Giaquinto, G., Russo, A., Sala, A., Testa, G., and Spezie, G.: Water temperature data from XBT taken from the research vessel Italica in the Southern Ocean and Southwest Pacific Ocean from 1995-01-06 to 1995-03-02 (NCEI Accession 0170765), NOAA National Centers for Environmental Information [data set], https://doi.org/10.7289/v53r0r5z, 2018b.
Cotroneo, Y., Budillon, G., Artegiani, A., Ferrara, C., Meloni, R., and Spezie, G.: Water temperature from XBT taken from research vessel Italica in the Southern Ocean and Southwest Pacific Ocean from 1996-01-07 to 1996-02-18 (NCEI Accession 0171481), NOAA National Centers for Environmental Information [data set], https://doi.org/10.7289/v5x065b9, 2018c.
Cotroneo, Y., Budillon, G., Conversano, F., Ferrara, C., and Spezie, G.: Water temperature from XBT taken from the research vessel Italica in the Southern Ocean and Southwest Pacific Ocean from 1997-01-26 to 1997-02-19 (NCEI Accession 0172042), NOAA National Centers for Environmental Information [data set], https://doi.org/10.7289/v5kd1w6b, 2018d.
Cotroneo, Y., Budillon, G., Bergamasco, A., Capello, M., De Stefano, M., Ferrara, C., Paschini, E., Russo, A., and Spezie, G.: Water temperature data from XBT col-lected from research vessel Italica in Southern Ocean and Southwest Pacific Ocean from 1997-11-23 to 1998-03-06 (NCEI Accession 0172859), NOAA National Centers for Environmental Information [data set], https://doi.org/10.7289/v50863mf, 2018e.
Cotroneo, Y., Budillon, G., Ferrara, C., Meloni, R., Paschini, E., and Spezie, G.: Water temperature from XBT taken from the research vessel Italica in the Southern Ocean and Southwest Pacific Ocean from 1999-01-05 to 1999-01-11 (NCEI Accession 0173211), NOAA National Centers for Environmental Information [data set], https://doi.org/10.7289/v5mg7mtc, 2018f.
Cotroneo, Y., Budillon, G., Ferrara, C., Paschini, E., Russo, A., and Spezie, G.: Water temperature from XBT taken from the research vessel Italica in the Southern Ocean and Southwest Pacific Ocean from 2000-01-07 to 2000-02-18 (NCEI Accession 0173212), NOAA National Centers for Environmental Information [data set], https://doi.org/10.7289/v56d5r8p, 2018g.
Cotroneo, Y., Budillon, G., Bergamasco, A., De Stefano, M., Ferrara, C., Paschini, E., and Spezie, G.: Water temperature from XBT taken from the research vessel Italica in the Southern Ocean and Southwest Pacific Ocean from 2001-01-06 to 2001-02-26 (NCEI Accession 0173213), NOAA National Centers for Environmental Information [data set], https://doi.org/10.7289/v5s75dpg, 2018h.
Cotroneo, Y., Budillon, G., Ferrara, C., Orsi, M., Paschini, E., Rivaro, P., and Spezie, G.: Water temperature from XBT taken from the research vessel Italica in the Southern Ocean and Southwest Pacific Ocean from 2001-12-24 to 2001-12-31 (NCEI Accession 0173214), NOAA National Centers for Environmental Information [data set], https://doi.org/10.7289/v5ng4nzr, 2018i.
Cotroneo, Y., Budillon, G., Bergamasco, A., De Alteris, A., De Stefano, M., Ferrara, C., Manno, C., Paschini, E., and Spezie, G.: Water temperature from XBT taken from the research vessel Italica in the Southern Ocean and Southwest Pacific Ocean from 2003-01-06 to 2003-01-11 (NCEI Accession 0173338), NOAA National Centers for Environmental Information [data set], https://doi.org/10.7289/v5qz289c, 2018j.
Cotroneo, Y., Budillon, G., Ferrara, C., Monteduro, R., Russo, A., and Spezie, G.: Water temperature from XBT taken from the research vessel Italica in the Southern Ocean and Southwest Pacific Ocean from 2003-12-24 to 2003-12-28 (NCEI Accession 0173328), NOAA National Centers for Environmental Information [data set], https://doi.org/10.7289/v5vq3113, 2018k.
Cotroneo, Y., Budillon, G., Aliani, S., Capello, M., Ferrara, C., Paschini, E., and Spezie, G.: Water temperature from XBT taken from the research vessel Italica in the Southern Ocean and Southwest Pacific Ocean from 2005-01-01 to 2005-01-06 (NCEI Accession 0173533), NOAA National Centers for Environmental Information [data set], https://doi.org/10.7289/v5vh5m45, 2018l.
Cotroneo, Y., Budillon, G., Ferrara, C., Meloni, R., and Spezie, G.: Water temperature from XBT taken from the research vessel Italica in the Southern Ocean and Southwest Pacific Ocean from 2007-02-05 to 2007-02-10 (NCEI Accession 0174709), Version 1.1, NOAA National Centers for Environmental Information [data set], https://doi.org/10.25921/c8bm-xh74, 2018m.
Cotroneo, Y., Budillon, G., Aliani, S., Ferrara, C., Greco, A., Meloni, R., and Spezie, G.: Water temperature from XBT taken from the research vessel Italica in the Southern Ocean and Southwest Pacific Ocean from 2008-01-16 to 2008-01-21 (NCEI Accession 0174711), Version 1.1, NOAA National Centers for Environmental Information [data set], https://doi.org/10.25921/q29v-c980, 2018n.
Cotroneo, Y., Budillon, G., Castagno, P., Colizza, E., Cotterle, D., Falco, P., Ferrara, C., Karlicek, D., Petronio, L., and Spezie, G.: Water temperature from XBT taken from the research vessel Araon in the Southern Ocean and Southwest Pacific Ocean from 2013-01-24 to 2013-02-06 (NCEI Accession 0174794), Version 1.1, NOAA National Centers for Environmental Information [data set], https://doi.org/10.25921/9YTS-P771, 2018o.
Cotroneo, Y., Budillon, G., Falco, P., Fusco, G., De Stefano, M., Pettersson, E., Zambardino, G., and Spezie, G.: Water temperature from XBT taken from the research vessel Italica in the Southern Ocean and Southwest Pacific Ocean from 2006-01-01 to 2006-01-04 (NCEI Accession 0207044), NOAA National Centers for Environmental Information [data set], https://doi.org/10.25921/hzcp-d813, 2019.
Cotroneo, Y., Ferola, A. I., Aulicino, G., Castagno, P., De Stefano, M., Falco, P., Fusco, G., Spezie, G., Zambardino, G., Zambianchi, E., and Budillon, G.: Water temperature taken by XBT from the research vessel Italica in the Southern Ocean (>60 degrees South) and Southwest Pacific Ocean (limit-147 E to 140 W) from 2013-12-30 to 2014-02-18 (NCEI Accession 0287161), NOAA National Centers for Environmental Information [data set], https://doi.org/10.25921/220j-b370, 2024a.
Cotroneo, Y., Ferola, A. I., Aulicino, G., Castagno, P., Falco, P., Fusco, G., Spezie, G., Zambianchi, E., and Budillon, G.: Water temperature taken by XBT from the research vessel Araon in the Southern Ocean (>60 degrees South) and Southwest Pacific Ocean (limit-147 E to 140 W) from 2015-01-02 to 2015-01-10 (NCEI Accession 0287162), NOAA National Centers for Environmental Information [data set], https://doi.org/10.25921/9ph6-c102, 2024b.
Cotroneo, Y., Ferola, A. I., Aulicino, G., Castagno, P., De Alteris, A., Falco, P., Fusco, G., Spezie, G., Zambardino, G., Zambianchi, E., and Budillon, G.: Water temperature taken by XBT from the research vessel Italica in the Southern Ocean (>60 degrees South) and Southwest Pacific Ocean (limit-147 E to 140 W) from 2016-01-16 to 2016-01-28 (NCEI Accession 0287159), NOAA National Centers for Environmental Information [data set], https://doi.org/10.25921/zf04-ch06, 2024c.
Cotroneo, Y., Ferola, A. I., Aulicino, G., Castagno, P., De Alteris, A., Falco, P., Fusco, G., Spezie, G., Zambardino, G., Zambianchi, E., and Budillon, G.: Water temperature taken by XBT from the research vessel Italica in the Southern Ocean (>60 degrees South) and Southwest Pacific Ocean (limit-147 E to 140 W) from 2016-12-31 to 2017-01-05 (NCEI Accession 0287163), NOAA National Centers for Environmental Information [data set], https://doi.org/10.25921/vvmp-rr55, 2024d.
Cotroneo, Y., Ferola, A. I., Aulicino, G., Castagno, P., De Alteris, A., Falco, P., Fusco, G., Spezie, G., Zambardino, G., Zambianchi, E., and Budillon, G.: Water temperature taken by XBT from the research vessel Araon in Southern Oceans (>60 degrees South) and Southwest Pacific Ocean (limit-147 E to 140 W) from 2019-02-08 to 2019-02-12 (NCEI Accession 0287554), NOAA National Centers for Environmental Information [data set], https://doi.org/10.25921/jeee-zf77, 2024e.
Cotroneo, Y., Ferola, A. I., Aulicino, G., Castagno, P., De Alteris, A., Falco, P., Fusco, G., Spezie, G., Zambardino, G., Zambianchi, E., and Budillon, G.: Water temperature taken by XBT from the research vessel Laura Bassi in the Southern Ocean (>60 degrees South) and Southwest Pacific Ocean (limit-147 E to 140 W) from 2020-01-07 to 2020-01-12 (NCEI Accession 0287549), NOAA National Centers for Environmental Information [data set], https://doi.org/10.25921/1ysg-dw94, 2024f.
Cotroneo, Y., Ferola, A. I., Aulicino, G., Castagno, P., De Alteris, A., Falco, P., Fusco, G., Spezie, G., Zambardino, G., Zambianchi, E., and Budillon, G.: Water temperature taken by XBT from the research vessel Laura Bassi in the Southern Ocean (>60 degrees South) and Southwest Pacific Ocean (limit-147 E to 140 W) from 2020-12-25 to 2021-01-02 (NCEI Accession 0297164), NOAA National Centers for Environmental Information [data set], https://doi.org/10.25921/aeg5-hw87, 2024g.
Cotroneo, Y., Ferola, A. I., Aulicino, G., Castagno, P., De Alteris, A., De Stefano, M., Falco, P., Fusco, G., Spezie, G., Zambardino, G., Zambianchi, E., and Budillon, G.: Water temperature taken by XBT from the research vessel Laura Bassi in the Southern Ocean (>60 degrees South) and Southwest Pacific Ocean (limit-147 E to 140 W) from 2022-01-08 to 2022-01-26 (NCEI Accession 0297165), NOAA National Centers for Environmental Information [data set], https://doi.org/10.25921/3mmd-tj60, 2024h.
Cotroneo, Y., Ferola, A. I., Aulicino, G., Castagno, P., De Alteris, A., De Stefano, V., Falco, P., Fusco, G., Spezie, G., Zambardino, G., Zambianchi, E., and Budillon, G.: Water temperature taken by XBT from the research vessel Laura Bassi in the Southern Ocean (>60 degrees South) and Southwest Pacific Ocean (limit-147 E to 140 W) from 2023-01-06 to 2023-01-12 (NCEI Accession 0297163), NOAA National Centers for Environmental Information [data set], https://doi.org/10.25921/kte7-d058, 2024i.
Cotroneo, Y., Ferola, A. I., Aulicino, G., Castagno, P., De Alteris, A., De Stefano, V., Di Palma, S., Esposito, M., Falco, P., Fusco, G., Garzia, A., Krauzig, N., Lucà, N., Spezie, G., Zambardino, G., Zambianchi, E., and Budillon, G.: Water temperature taken by XBT from the research vessel Laura Bassi in the Southern Ocean (>60 degrees South) and Southwest Pacific Ocean (limit-147 E to 140 W) from 2024-01-07 to 2024-01-12 (NCEI Accession 0297166), NOAA National Centers for Environmental Information [data set], https://doi.org/10.25921/jc13-ek97, 2024j.
Cowley, R. and Krummel, L. Australian XBT Quality Control Cookbook Version 2.1 (updated August 2023), CSIRO, Australia, https://doi.org/10.25919/3tm5-zn80, 2022.
Cowley, R., Wijffels, S., Cheng, L., Boyer, T., and Kizu, S.: Biases in expendable bathythermograph data: A new view based on historical side-by-side comparisons, J. Atmos. Ocean. Tech.., 30, 1195–1225, https://doi.org/10.1175/JTECH-D-12-00127.1, 2013.
Daneshzadeh, Y. H., Festa, J. F., and Minton, S. M.: Procedures used at AOML to quality control real time XBT data collected in the Atlantic Ocean. Miami, USA, NOAA Atlantic Oceanographic and Meteorological Laboratory, 44 pp., https://doi.org/10.25607/OBP-1485, 1994.
Downes, S. M., Farneti, R., Uotila, P., Griffies, S. M., Marsland, S. J., Bailey, D., Behrens, E., Bentsen, M., Bi, D., Biastoch, A., Böning, C., Bozec, A., Canuto, V. M., Chassignet, E., Danabasoglu, G., Danilov, S., Diansky, N., Drange, H., Fogli, P. G., Gusev, A., Howard, A., Ilicak, M., Jung, T., Kelley, M., Large, W. G., Leboissetier, A., Long, M., Lu, J., Masina, S., Mishra, A., Navarra, A., Nurser, A. J. G., Patara, L., Samuels, B. L., Sidorenko, D., Spence, P., Tsujino, H., Wang, Q., and Yeager, S. J.: An assessment of Southern Ocean water masses and sea ice during 1988–2007 in a suite of interannual CORE-II simulations, Ocean Model., 94, 67–94, https://doi.org/10.1016/j.ocemod.2015.07.022, 2015.
Falco, P. and Zambianchi, E.: Near-surface structure of the Antarctic Circumpolar Current derived from World Ocean Circulation Experiment drifter data, J. Geophys. Res.-Oceans, 116, C05003, https://doi.org/10.1029/2010JC006349, 2011.
Falco, P., Castagno, P., Cotroneo, Y., Aulicino, G., Budillon, G., de Ruggiero, P., Fusco, G., and Zambianchi, G.: Measurements for Oceanography, in: Measurement for the Sea, Springer Series in Measurement Science and Technology, edited by: Daponte, P., Rossi, G. B., and Piscopo, V., Springer, Cham, Springer, https://doi.org/10.1007/978-3-030-82024-4_3, 2022.
Falco, P., Aulicino, G., Castagno, P., Capozzi, V., de Ruggiero, P., Garzia, A., Ferola, A. I., Cotroneo, Y., Colella, A., Fusco, G., Pierini, S., Budillon, G., Zambianchi, E., and Spezie, G.: Ocean-atmosphere-ice processes in the Ross Sea: A review, Deep-Sea Res. Pt. II, 218, 105429, https://doi.org/10.1016/j.dsr2.2024.105429, 2024.
Ferola, A. I., Cotroneo, Y., Wadhams, P., Fusco, G., Falco, P., Budillon, G., and Aulicino, G.: The Role of the Pacific-Antarctic Ridge in Establishing the Northward Extent of Antarctic Sea-Ice, Geophys. Res. Lett., 50, e2023GL104373, https://doi.org/10.1029/2023GL104373, 2023.
Frenger, I., Münnich, M., Gruber, N., and Knutti, R.: Southern Ocean eddy phenomenology, J. Geophys. Res.-Oceans, 120, 7413–7449, https://doi.org/10.1002/2015JC011047, 2015.
GEBCO Compilation Group: GEBCO 2023 Grid, https://doi.org/10.5285/f98b053b-0cbc-6c23-e053-6c86abc0af7b, 2023.
Gille, S. T.: Mean sea surface height of the Antarctic Circumpolar Current from GEOSAT 600 data: methods and application, J. Geophys. Res., 99, 18255–18273, https://doi.org/10.1029/94JC01172, 1994.
Goni, G., Sprintall, J., Bringas, F., Cheng, L., Cirano, M., Dong, S., Domingues, R., Goes, M., Lopez, H., Morrow, R., Rivero, U., Rossby, T., Todd, R. E., Trinanes, J., Zilberman, N., Baringer, M., Boyer, T., Cowley, R., Domingues, C. M., Hutchinson, K., Kramp, M., Mata, M. M., Reseghetti, F., Sun, C., Bhaskar, U., and Volkov, D.: More than 50 years of successful continuous temperature section measurements by the global expendable bathythermograph network, its integrability, societal benefits, and future, Front. Mar. Sci., 6, 452, https://doi.org/10.3389/fmars.2019.00452, 2019.
Gouretski, V. and Reseghetti, F.: On depth and temperature biases in bathythermograph data: Development of a new correction scheme based on analysis of a global ocean database. Deep-Sea Res. Pt. I, 57, 812–833, https://doi.org/10.1016/j.dsr.2010.03.011, 2010.
Graham, R. M., de Boer, A. M., Heywood, K. J., Chapman, M. R., and Stevens, D. P.: Southern Ocean fronts: Controlled by wind or topography?, J. Geophys. Res.-Oceans, 117, C08018, https://doi.org/10.1029/2012JC007887, 2012.
Green, A. W.: Bulk dynamics of the expendable bathythermograph (XBT), Deep-Sea Res.Pt. A, 31, 415–426, https://doi.org/10.1016/0198-0149(84)90093-1, 1984.
Hanawa, K., Rual, P., Bailey, R., Sy, A., and Szabados, M.: A new depth-time equation for Sippican or TSK T-7, T-6 and T-4 expendable bathythermographs (XBT), Deep-Sea Res. Pt. I, 42, 1423–1451, https://doi.org/10.1016/0967-0637(95)97154-Z, 1995.
IOC – Intergovernmental Oceanographic Commission: Ocean Data Standards Volume 3, Recommendation for a Quality Flag Scheme for the Exchange of Oceanographic and Marine Meteorological Data, Intergovernmental Oceanographic Commission Manuals and Guides, Vol. 54, UNESCO-IOC, Paris, France, 5 pp. and Annexes, https://doi.org/10.25607/OBP-6, 2013.
Legler, D. M., Freeland, H. J., Lumpkin, R., Ball, G., McPhaden, M. J., North, S., Crowley, R., Goni, G. J., Send, U., and Merrifield, M. A.: The current status of the real-time in situ Global Ocean Observing System for operational oceanography, J. Oper. Oceanogr., 8, s189–s200, https://doi.org/10.1080/1755876X.2015.1049883, 2015.
McGillicuddy Jr., D. J.: Mechanisms of physical-biological-biogeochemical interaction at the oceanic mesoscale, Annu. Rev. Mar. Sci., 8, 125–159, https://doi.org/10.1146/annurev-marine-010814-015606, 2016.
Menna, M., Cotroneo, Y., Falco, P., Zambianchi, E., Di Lemma, R., Poulain, P. M., and Budillon, G.: Response of the Pacific Sector of the Southern Ocean to wind stress variability from 1995 to 2017, J. Geophys. Res.-Oceans, 125, e2019JC015696, https://doi.org/10.1029/2019JC015696, 2020.
Morales Maqueda, M. A., Willmott, A. J., and Biggs, N. R. T.: Polynya dynamics: A review of observations and modelling, Rev. Geophys., 42, RG1004, https://doi.org/10.1029/2002RG000116, 2004.
Orsi, A. H., Whitworth, T., and Nowlin, W. D.: On the meridional extent and fronts of the Antarctic circumpolar current, Deep-Sea Res. Pt. I, 42, 641–673, https://doi.org/10.1016/0967-0637(95)00021-W, 1995.
Parks, J., Bringas, F., Cowley, R., Hanstein, C., Krummel, L., Sprintall, J., Cheng, L., Cirano, M., Cruz, S., Goes, M., Kizu, S., and Reseghetti, F.: XBT operational best practices for quality assurance, Front. Mar. Sci., 9, 991760, https://doi.org/10.3389/fmars.2022.991760, 2022
Reverdin, G., Marin, F., Bourles, B., and L'Herminier, P.: XBT temperature errors during French research cruises (1999–2007), J. Atmos. Ocean. Tech., 26, 2462–2473, https://doi.org/10.1175/2009JTECHO655.1, 2009.
Rintoul, S. R.: The global influence of localized dynamics in the Southern Ocean, Nature, 558, 209–218, https://doi.org/10.1038/s41586-018-0182-3, 2018.
Rintoul, S. R., Donguy, J. R., and Roemmich, D. H.: Seasonal evolution of upper ocean thermal structure between Tasmania and Antarctica, Deep-Sea Res. Pt. I, 44, 1185–1202, https://doi.org/10.1016/S0967-0637(96)00125-2, 1997.
Roemmich, D., Wilson, W. S., Gould, W. J., Owens, W. B., Le Traon, P.-Y., Freeland, H. J., King, B. A., Wijffels, S., Sutton, P. J. H., and Zilberman, N.: Chapter 4 – The Argo Program, in: Science of Sustainable Systems, Partnerships in Marine Research, edited by: Auad, G. and Wiese, F. K., Elsevier, 53–69, https://doi.org/10.1016/B978-0-323-90427-8.00004-6, 2022.
Schlitzer, R.: Ocean Data View, http://odv.awi.de (last access: 13 March 2025), 2022.
Seaver, G. A. and Kuleshov, S.: Experimental and analytical error of the expendable bathythermograph, J. Phys. Oceanogr., 12, 592–600, https://doi.org/10.1175/1520-0485(1982)012<0592:EAAEOT>2.0.CO;2, 1982.
Seo, H., O'Neill, L. W., Bourassa, M. A., Czaja, A., Drushka, K., Edson, J. B., Fox-Kemper, B., Frenger, I., Gille, S. T., Kirtman, B. P., Minobe, S., Pendergrass, A. G., Renault, L., Roberts, M. J., Schneider, N., Small, R. J., Stoffelen, A., and Wang, Q.: Ocean Mesoscale and Frontal-Scale Ocean–Atmosphere Interactions and Influence on Large-Scale Climate: A Review, J. Climate, 36, 1981–2013, https://doi.org/10.1175/JCLI-D-21-0982.1, 2023.
Simoncelli, S., Reseghetti, F., Fratianni, C., Cheng, L., and Raiteri, G.: Reprocessing of eXpendable BathyThermograph (XBT) profiles from the Ligurian and Tyrrhenian seas over the time period 1999–2019 with a full metadata upgrade, Earth Syst. Sci. Data, 16, 5531–5561, https://doi.org/10.5194/essd-16-5531-2024, 2024.
Sokolov, S. and Rintoul, S. R.: Multiple Jets of the Antarctic Circumpolar Current South of Australia, J. Geophys. Res., 37, 1394–1412, https://doi.org/10.1175/JPO3111.1, 2007.
Sokolov, S. and Rintoul, S. R.: Circumpolar structure and distribution of the Antarctic Circumpolar Current fronts: 1. Mean circumpolar paths, J. Geophys. Res., 114, C11018, https://doi.org/10.1029/2008jc005108, 2009a.
Sokolov, S. and Rintoul, S. R.: Circulation structure and distribution of the Antarctic circumpolar current fronts: 2. Variability and relationship to sea surface height, J. Geophys. Res., 114, C11019, https://doi.org/10.1029/2008JC005248, 2009b.
Tan, Z., Cheng, L., Gouretski, V., Zhang, B., Wang, Y., Li, F., and Zhu, J.: A new automatic quality control system for ocean profile observations and impact on ocean warming estimate, Deep-Sea Res. Pt. I, 194, 103961, https://doi.org/10.1016/j.dsr.2022.103961, 2023.
Trani, M., Falco, P., and Zambianchi, E.: Near-surface eddy dynamics in the Southern Ocean, Polar Res., 30, 11203, https://doi.org/10.3402/polar.v30i0.11203, 2011.
Trani, M., Falco, P., Zambianchi, E., and Sallee, J. B.: Aspects of the Antarctic Circumpolar Current dynamics investigated with drifter data, Prog. Oceanogr., 125, 1–15, https://doi.org/10.1016/j.pocean.2014.05.001, 2014.
World Meteorological Organization: WMO statement on the status of the global climate in 2015, World Meteorological Organization, Geneva, Switzerland, https://wedocs.unep.org/20.500.11822/7786 (last access: 23 May 2024), 2016.