the Creative Commons Attribution 4.0 License.
the Creative Commons Attribution 4.0 License.
 | 16 Jun 2025
Mapping global distributions, environmental controls, and uncertainties of apparent topsoil and subsoil organic carbon turnover times
Lei Zhang
Thomas W. Crowther
Constantin M. Zohner
Sebastian Doetterl
Gerard B. M. Heuvelink
Alexandre M. J.-C. Wadoux
A.-Xing Zhu
Yue Pu
Feixue Shen
Haozhi Ma
Yibiao Zou
Chenghu Zhou
The turnover time (τ) of global soil organic carbon is central to the functioning of terrestrial ecosystems. Yet our spatially explicit understanding of the depth-dependent variations and environmental controls of τ at a global scale remains incomplete. In this study, we combine multiple state-of-the-art observation-based datasets, including over 90 000 geo-referenced soil profiles, the latest root observations distributed globally, and large numbers of satellite-derived environmental variables, to generate global maps of apparent τ in topsoil (0–0.3 m) and subsoil (0.3–1 m) layers, with a spatial resolution of 30 arcsec (∼1 km at the Equator). We show that subsoil τ ( years (mean, with a variation range from the 2.5th to 97.5th percentile)) is over 8 times longer than topsoil τ ( years). The cross-validation shows that the fitted machine learning models effectively captured the variabilities in τ, with R2 values of 0.87 and 0.70 for topsoil and subsoil τ mapping, respectively. The prediction uncertainties of the τ maps were quantified for better user applications. The environmental controls on topsoil and subsoil τ were investigated at global, biome, and local scales. Our analyses illustrate the ways in which temperature, water availability, physio-chemical properties, and depth jointly exert impacts on τ. The data-driven approaches allow us to identify their interactions, thereby enriching our comprehension of mechanisms driving nonlinear τ–environment relationships at global to local scales. The distributions of dominating factors of τ at local scales were mapped for purposes of identifying context-dependent controls on τ across different regions. We further reveal that the current Earth system models may underestimate τ by comparing model-derived maps with our observation-derived τ maps. The resulting maps, with new insights, as demonstrated in this study, will facilitate future modelling efforts relating to carbon cycle–climate feedbacks and support effective carbon management. The dataset is archived and freely available at https://doi.org/10.5281/zenodo.14560239 (Zhang, 2025a).
- Article
(6189 KB) - Full-text XML
-
Supplement
(2771 KB) - BibTeX
- EndNote


As the largest active reservoir of organic carbon in terrestrial ecosystems, soils are integral to the global carbon cycle (Schimel, 1995; Batjes, 1996; Smith et al., 2024). Plants capture CO2 from the atmosphere through photosynthesis and transfer carbon into soils through litterfall and root exudates. This carbon is then cycled back to the atmosphere through heterotrophic respiration by organic matter decomposers, a process governed by decomposition rates (Balesdent et al., 2018). The turnover time of soil organic carbon (SOC), denoted as τ (in years), is the average time that organic carbon molecules remain in the soil (Six and Jastrow, 2002; Sierra et al., 2017). This turnover time is a critical factor in determining the size of soil carbon pools (Sierra et al., 2017; Crowther et al., 2019b). Understanding the spatial variation in τ and the underlying environmental drivers is therefore crucial for comprehending the scale and dynamics of terrestrial carbon storage under current and future climate change scenarios (Torn et al., 1997, 2009; Field et al., 2014).
Several studies have estimated the global apparent carbon turnover times in whole terrestrial ecosystems (Carvalhais et al., 2014; Fan et al., 2020). Nevertheless, the detailed patterns of τ in soil systems at the global scale remain to be elucidated. Much work has focused on shallow soil horizons due to the higher carbon content and the greater availability of data in topsoils (e.g. Crowther et al., 2016; Luo et al., 2017; Viscarra Rossel et al., 2019; Wu et al., 2021). However, capturing the biogeographic variability of carbon dynamics in deeper soil layers is emerging as a critical area of research (Hicks Pries et al., 2023) as, there, the environmental sensitivities of SOC can differ substantially from those in surface layers (Rumpel and Kögel-Knabner, 2011; Hicks Pries et al., 2017; Luo et al., 2019; Soong et al., 2021; Zosso et al., 2023). To enhance our understanding of soil carbon turnover and to address these issues, there is a clear need for a global analysis of τ that considers both topsoil and subsoil layers and for the provision of spatially explicit τ maps. Such an analysis should leverage the latest and most comprehensive global soil profile datasets available, enabling more reliable assessments of and insights into terrestrial carbon sink potential.
The ensemble of the latest datasets also supports a more nuanced understanding of the environmental controls on τ, particularly with regard to their potentially nonlinear or distinct effects across different spatial scales and soil depths. Previous studies have shown evidence that the turnover time of SOC is negatively correlated with temperature and precipitation (Davidson and Janssens, 2006; Chen et al., 2013; Wang et al., 2018) and that subsoil carbon may be particularly sensitive to temperature fluctuations (Jia et al., 2019; Soong et al., 2021; Chen et al., 2023). Yet, other studies could not confirm this strong climatic dependency (Giardina and Ryan, 2000; Doetterl et al., 2015), suggesting a predominant influence of soil properties on subsoil carbon turnover times in certain regions or over decadal timescales (Luo et al., 2019). This inconsistency underscores the need for a multifaceted approach to quantify the effects of multiple factors on τ, particularly the interactions between climate and edaphic factors across different spatial scales and soil depths (Schmidt et al., 2011). Comprehensive assessments at the global, biome, and local levels will be crucial to identify the primary controls of τ in both topsoil and subsoil layers. Moreover, observation-based global estimates of τ are essential for simulating the global carbon cycle (Todd-Brown et al., 2013; Friend et al., 2014; Varney et al., 2022). An accurate representation and deeper understanding of the environmental controls of τ – spanning diverse spatial scales and soil depths – will be integral to benchmarking current Earth system models (ESMs) and reducing bias in future carbon cycle projections.
This study aims to develop a global estimation of τ by integrating the state-of-the-art soil and root profile databases with satellite-derived environmental observations. The collected datasets allowed us, firstly, to estimate τ at over 90 000 global sampling sites, and then we used machine learning methods to generate a spatially explicit understanding of global SOC turnover times in the topsoil (0–0.3 m) and subsoil (0.3–1 m). To comprehend the interactive mechanisms among multiple environmental drivers that have shaped variations in topsoil and subsoil τ at the global, biome, and local scales, we used data-driven approaches to characterize the directional contributions of climate, topography, and the physical and chemical properties of soil to explain τ patterns. We further quantified the uncertainty maps for better user applications and compared our observation-derived τ with ESM-derived τ in terms of both spatial variabilities and climatic dependencies.
2.1 Estimation of τ in topsoil and subsoil layers
The SOC turnover time (τ) we estimated in this study is the mean transit time of carbon (i.e. the time that the newly entered carbon spends in soils until it leaves) (Six and Jastrow, 2002; Sierra et al., 2017). When assuming a steady state and homogeneity of the system, in which all particles have the same probability of leaving at any time, τ can be defined as the ratio between SOC stock (SOCS) to the input or output flux of carbon (), which can be called the apparent turnover time (Carvalhais et al., 2014; Fan et al., 2020). We estimated the SOC stock (see Sect. 2.1.1) and vertical allocation of carbon input in two soil layers (see Sect. 2.1.2) and then combined them to calculate topsoil and subsoil τ at all soil profile locations. We then adopted the point-level estimates to map τ variation across the globe.
2.1.1 Estimation of SOC stocks based on soil sample databases
Soil sample data were mainly collected from the standardized soil profile database provided by the World Soil Information Service (WoSIS) (Batjes et al., 2020). The Northern Circumpolar Soil Carbon Database (NCSCD) (Hugelius et al., 2013) was incorporated to supplement samples across the high latitudes of the Northern Hemisphere. In addition, the soil sample data from the project of the National Soil Survey of China were incorporated (Zhang et al., 2013; Liu et al., 2022). To minimize bias due to erroneous and/or uncertain measurements, we removed samples (i) with low accuracy of the geographical coordinates (i.e. the information of degree, minute, and second is not fully provided in the source), (ii) located in areas with exceptionally low NPP (net primary productivity) estimates (below 10 ), (iii) with low-quality NPP estimates (if the quality control value is larger than 50 %), and (iv) with layer observations flagged as surficial litter. Finally, a total number of 95 200 and 66 807 geo-referenced sampling locations providing topsoil and subsoil information were collected for this study (Fig. 1). The estimation of SOC stock (SOCS, kg C m−2) for each soil sample site at a certain depth interval between the upper depth (Du, m) and lower depth (Dl, m) can be computed as follows:
where is the SOC content (g kg−1) in a certain range of soil depths, BD is the soil bulk density (g cm−3), and CF is the percentage of coarse fragments in the entirety of the soil (%). We adopted an approach described in Sect. S1 in the Supplement to fill the missing values by using a specific pedotransfer function depending on the SOC content and the considered layer. When CF was missing, we extracted the corresponding data from their respective locations on the latest version of the SoilGrids maps (Poggio et al., 2021). The equal-area spline algorithm was employed to fit observations along depths (Bishop et al., 1999; Malone et al., 2009). The average of fitted values was adopted to estimate the SOCS in the topsoil and subsoil layers for each profile (Fig. S1 in the Supplement). The probability distributions of SOCS, BD, and CF in different biomes are shown in Figs. S2–S4.
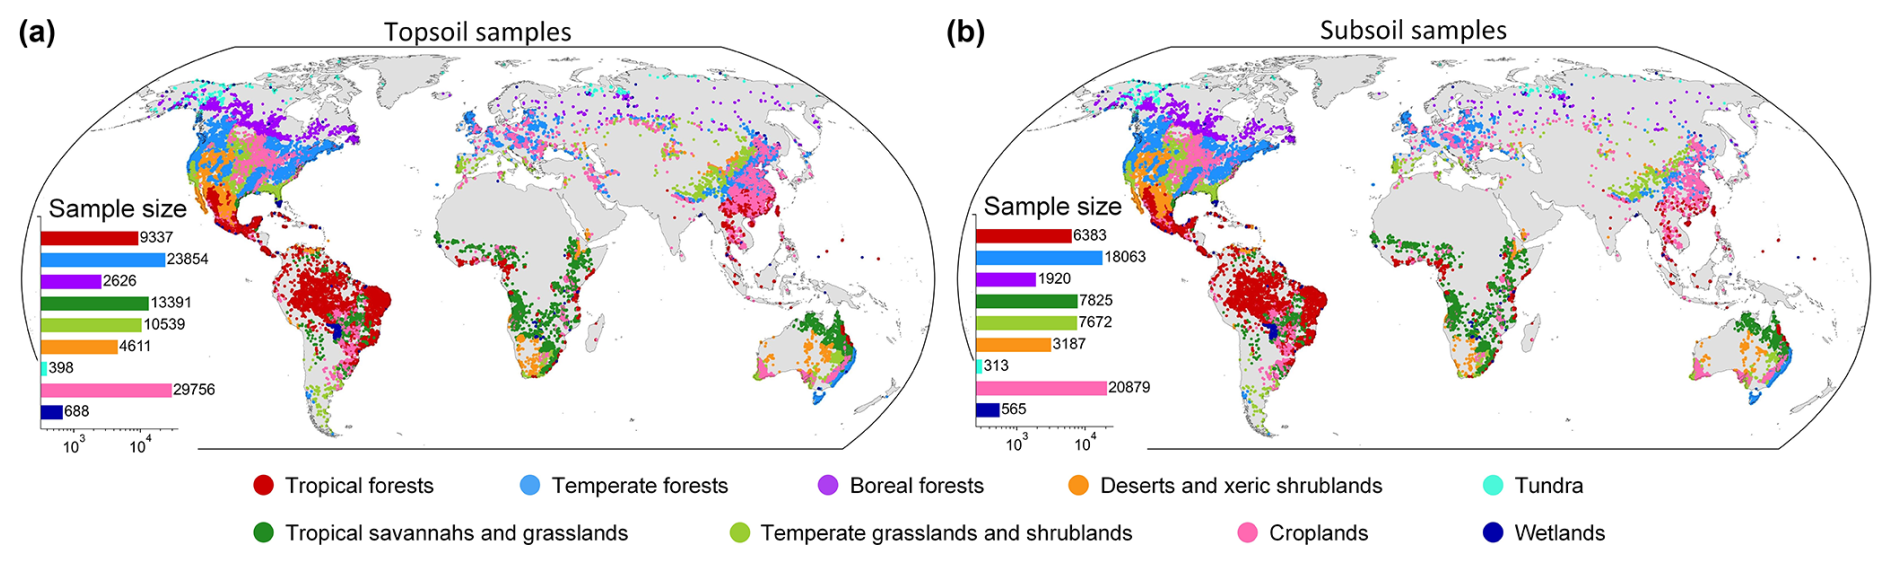
Figure 1Spatial distributions of geo-referenced soil samples used in the study across global biomes. A total of 95 200 (a) (for topsoil) and 66 807 (b) (for subsoil) sampling sites were collected from multiple soil profile databases. The bar plots show the sample size within each biome.
2.1.2 Estimation of carbon allocation belowground
Carbon influx at each soil layer comes from vertical allocation of the amount of net primary productivity (NPP). This involves the estimation of aboveground and belowground NPP and NPP allocation into different soil layers. The annual NPP () produced by the Moderate Resolution Imaging Spectroradiometer (MODIS) was collected at each sample location (Running and Zhao, 2019). The MOD17 version 6 product (https://ladsweb.modaps.eosdis.nasa.gov, last access: 1 January 2025) was used in this study. The mean of annual NPP from 2001 to 2019 was computed to represent the general status of each sample location. Then, we used the biomass ratio between roots and shoots (root-to-shoot ratio, RSR) as a proxy to estimate the amount of NPP allocated to soils as this is generally a realistic estimation for the mean long-term NPP partitioning (Gower et al., 1999). The fraction of belowground NPP can be estimated as the root mass fraction (RMF):
The RSR value at each sample location was collected from the harmonized global maps of aboveground and belowground biomass carbon density (Spawn et al., 2020). The biome-specific variabilities of RMF are shown in Fig. S5.
We used the vertical root biomass distribution to represent the belowground NPP partitioned into different soil depths (Luo et al., 2019; Xiao et al., 2022, 2023). The root distribution information was obtained from the 564 global root profiles compiled by Schenk and Jackson (2002). The logistic dose–response curve function was used to estimate the cumulative amount of root mass r(D) above a certain soil depth D (m):
where Rmax represents the total root mass, D50 is the depth at which r(D) equals half of Rmax, and c is a dimensionless shape parameter; regarding the latter, the reader can refer to Schenk and Jackson (2002) for details. The fraction of roots in a certain soil layer between Du and Dl () can be estimated as follows:
This root profile dataset has been used to analyse the belowground NPP allocation in several previous studies (Luo et al., 2019; Shi et al., 2021). In our study, we extended these data by using the latest Root Systems of Individual Plants (RSIP) database and the Global Root Traits (GRooT) database, which include information regarding the maximum belowground extents of terrestrial plants (Guerrero-Ramírez et al., 2021; Tumber-Dávila et al., 2022). Assuming that the root distribution is proportional to its morphological distribution (Bardgett et al., 2014; Tumber-Dávila et al., 2022), we used the form trait of roots, the maximum rooting depth (Dmax), to generate an alternative representation of the root distribution. A total of 1732 geo-referenced measurements were collected, with descriptions of rooting depth from the above two databases. The vertical root distribution can be estimated according to a commonly used asymptotic equation (Gale and Grigal, 1987; Jackson et al., 1996; Zeng, 2001):
where CRF is the cumulative root fraction from the surface to soil depth D in centimetres, and β is the estimated parameter which controls the decreasing rate of root mass with increasing soil depth (Gale and Grigal, 1987; Zeng, 2001). Finally, the fraction of roots in a certain soil layer between the upper and lower depths () can be quantified as follows: CRF(Dl)−CRF(Du). An illustration of the root distribution estimation using the above approach is shown in Fig. S6.
Hence, the global distributions of all root profiles that characterize the fraction of roots in the two layers were calculated and are shown in Fig. S7. Given that root distribution is generally related to the biome, vegetation type, and soil conditions (Jackson et al., 1996; Schenk and Jackson, 2005), we apply the arithmetic mean of from root profile observations within the same terrestrial ecoregions (Dinerstein et al., 2017) and soil types (FAO–UNESCO, 1990) as the soil sample (Figs. S8 and S9).
It is also necessary to consider the vertical physical transportation of organic carbon, such as through leaching and/or bioturbation. We followed the function designed in a previous model that includes vertical transport of SOC (Braakhekke et al., 2011; Koven et al., 2013; Sierra et al., 2024):
where V is the transported SOC stock (V) in a certain layer; C is the organic carbon content, which is defined volumetrically (kg m−3), at the depth D; and Diff is the diffusivity, which is constant and set to be m2 yr−1 in accordance with previous studies (Koven et al., 2013; Sierra et al., 2024). Thus, the belowground NPP (BNPP) in a certain soil layer can be estimated as follows:
For topsoil, carbon inputs also contain a portion of carbon from surface litterfall, which should also be considered. First, the RSR dataset was adopted to support us in obtaining the aboveground NPP (ANPP). As a decent fraction of NPP was removed as the harvest product in croplands, we performed a specific calculation procedure to estimate the aboveground carbon input in this region, as described in Sect. S2. Second, we used two databases including measurements of aboveground litterfall across the globe (Holland et al., 2015; Jia et al., 2016) to estimate the fraction of aboveground NPP (ANPP) converted into litterfall. Then, we determined the fraction of litterfall allocated as the carbon input into topsoil according to the decomposition processes described in the Community Land Model (Oleson et al., 2013). The details of the calculations related to the fraction of ANPP that was transferred as carbon input into the topsoil (denoted as fra) are described in Sect. S3.
Therefore, the carbon input flux between upper (Du) and lower depths (Dl) can be estimated as follows (the biome-specific variabilities of this variable are shown in Fig. S10):
Combining the estimated SOC stock (Eq. 1) and carbon allocation belowground (Eq. 8) with the equation of apparent τ, the values of τ in the topsoil and subsoil layers were calculated at all sample locations across the globe and are shown in Fig. S11. Table S1 in the Supplement shows the details of the datasets used to calculate τ for all samples.
2.2 Geospatial mapping of τ
The machine-learning-based method was adopted to generate the spatially explicit maps of τ in the two soil layers. For the procedure of geospatial predictive mapping illustrated in Fig. S12, we used the random forest (RF) model to establish the relationship between τ and potentially related geographical variables (i.e. environmental covariates) for mapping the global distribution of τ with a quantification of uncertainty. The advantage of RF is the incorporation of randomized feature selection and training sample selection (Breiman, 2001), such that it can reduce the overfitting risk and lead to a good ability in terms of generalization. This model has been effectively applied to large datasets for geospatial mapping tasks at large scales (van den Hoogen et al., 2019; Ma et al., 2021; Poggio et al., 2021; Guo et al., 2025). There are two important user-defined parameters when using the RF model. The first is the number of covariates that are randomly selected for each tree-building process. We used the rounded-down square root of the total number of covariates as this parameter value by default. The second parameter is the number of trees to be learned in RF. We set this value to be 200 considering the fact that previous soil mapping studies have shown that a number of trees larger than 150 is sufficient to obtain stable results (Wadoux, 2019; Zhang et al., 2021). The covariates, including climate, soil physical properties, soil chemical properties, and topography, were collected (Table S2 and Figs. S13–S18). These covariate maps were overlaid and thus allowed us to predict τ at the global scale with a spatial resolution of 30 arcsec (∼1 km2 at the Equator). Considering the fact that some regions covered by organic soils cannot be well represented when using our method to generate estimations, we masked these regions according to the definition of organic soil in Brady and Weil (1999).
2.3 Analysis of environmental controls
To investigate the environmental controls of the spatial distribution of τ in the two layers, the RF model was adopted based on all soil sample data to quantify the relative importance (RI) of each covariate at the global scale. We used permutation-based feature importance as the metric to assess RI (Altmann et al., 2010) (see Sect. S4).
The directional effects of important environmental factors on τ were investigated by using the partial-regression model to calculate the partial correlations of topsoil and subsoil τ with the six top-ranked environmental variables from RF modelling, as mentioned above. The analysed variables are the mean annual temperature (MAT) and precipitation (MAP), the fine-particle size fraction (CLAY+SILT), the ratio of organic carbon to total nitrogen (C:N), the cation exchange capacity of the soil (CEC), and the soil pH. The partial correlation of each influencing factor was calculated at the mean level while controlling for other factors.
The potential for non-significant effects of a variable (e.g. the global impact of precipitation) on τ in a global-level linear model does not necessarily imply that the respective variable has no influence on τ. Instead, this lack of significance may arise from its divergent effects when interacting with other factors. This has led to an interest in exploring the reasons behind such nonlinear and incoherent driving mechanisms. Considering the fact that the extrinsic climate effects on soil carbon turnover can interact with regionally intrinsic soil characteristics (Doetterl et al., 2015), we used the approach outlined in Sect. S5 to exemplify the interactive effects of MAT and MAP on topsoil and subsoil τ in response to the changes in other factors (namely interactive factors). In addition to the overall importance of covariates analysed at the large scale, the local-level importance for four categories of variables was also assessed (see Sect. S6).
2.4 Evaluation of mapping results
2.4.1 Assessment of accuracy by cross-validation
The mapping accuracy was assessed by using a 10-fold cross-validation. The total sample data were divided into 10 equally sized subsets, and samples of each biome in each subset had the same proportion as in the whole dataset. Nine folds were used as the training data to fit the model, and the prediction was validated based on the one remaining fold. This procedure was carried out 10 times, each time using a different fold for validation. The mean values of the coefficient of determination (R2) and the root mean squared error (RMSE) for all folds were computed as the final accuracy metrics for the assessment of mapping results.
2.4.2 Quantification of uncertainty
To evaluate the uncertainty of predictive maps of τ, we considered two sources of error. One is the model error, which refers to the covariates that do not fully explain the variations in τ and the error in the estimation of the model parameters. Another is the measurement error, which represents the difference between the actual and recorded values of input variables related to τ calculation. To account for the modelling uncertainty, we adopted quantile regression forests (QRFs) (Meinshausen, 2006; Hengl et al., 2018) to derive prediction intervals. QRFs first construct an RF model in the usual way, namely by developing multiple decision trees that use subsets of the training data, whereby the prediction of each tree equals the average of the observations in the end node of the tree in which the prediction point sits. The RF prediction is the average of all tree predictions. Since averaging is a linear process, the RF prediction boils down to a weighted sum over the n observations of the response variable:
In QRFs, the weights wi(x) are used to estimate the cumulative distribution of the response variable Y, given the covariate data x, as follows:
where is the indicator function (i.e. it is 1 if the condition is true and 0 otherwise). Any quantile q of the distribution can then be derived by iterating towards the value of y for which .
We used the R package ranger (Wright and Ziegler, 2017) with the function quantreg to build the QRF models. Using this function, the prediction values at each location can be obtained, and the 0.05th quantile (q0.05), 0.50th quantile (q0.50), and 0.95th quantile (q0.95) can also be computed to derive the lower limit, median, and upper limit of a symmetric 90 % prediction interval. This interval has also been adopted for uncertainty assessment in GlobalSoilMap specifications (Arrouays et al., 2014) and the SoilGrids product (Poggio et al., 2021).
The uncertainty from the input data in the calculation of τ was also considered. When calculating τ for each sample, four input variables (SOCS, NPP, RMF, and ) introduced uncertainty due to errors in the soil measurements and in the estimation of carbon allocation belowground. Errors in these input variables will propagate into the output of τ estimation. To incorporate the error propagation from these inputs into the uncertainty evaluation, the standard deviation (SD) of each input at each sample location needs to be quantified. Here, as the calculation of τ is a simple arithmetic function, the SD of the estimated τ for each sample can be calculated as follows, ignoring the cross-correlation among those inputs (Heuvelink, 1998):
where SDf represents the SD of the output value calculated by the function f, and I1, I2, and Im represent the first, second, and mth input variables, respectively. For RMF, we directly used the uncertainty maps provided by Spawn et al. (2020). The SD of SOCS was obtained from Poggio et al. (2021) when SOCS was supplemented by extracting values from the SoilGrids maps. For quantifying the SD of , the SD of all selected root profile observation values for each soil sample site was adopted to represent its uncertainty. For NPP, most MODIS NPP values are within the mean ±1 SD of the respective values observed from the flux tower (Reichstein et al., 2002), based on which we define the uncertainty of NPP values. The relationships between the estimated values of τ and their corresponding SD for all samples are shown in Fig. S19. After quantifying the SD of the estimated τ at each sample location, a Monte Carlo approach was adopted to incorporate the SD into the estimated τ for each sample. That is, the value of τ at each sample location was randomly drawn 100 times from a normal distribution given the known mean and SD. Then, all generated samples were used to fit a QRF model and to produce the uncertainty maps.
To visualize the spatial distribution of the prediction uncertainty, we calculated the prediction interval ratio (PIR), defined as the ratio of the range between lower and upper limits over the median:
A lower PIR indicates higher confidence in the predictions, while a higher PIR suggests greater uncertainty.
We further assessed the quality of the estimated prediction uncertainty through an accuracy plot approach by calculating the prediction interval coverage probability (PICP) (Goovaerts, 2001). PICP is a metric used for evaluating the reliability of uncertainty quantifications by measuring the proportion of observed values that fall within a given prediction interval. It can effectively evaluate whether the probability assigned to the prediction intervals is equal to the frequency of empirical test data within the prediction intervals (Malone et al., 2011; Schmidinger and Heuvelink, 2023).
3.1 Accuracy assessment
The cross-validation demonstrated that the machine learning models can effectively capture a substantial proportion of τ variations, achieving R2 values of 0.87 and 0.70 and RMSE values of 14.60 and 175.05 for the topsoil and subsoil τ predictions, respectively (Fig. 2). More accuracy metrics are shown in Table S3. Relatively higher model performance was found in boreal and tundra areas for topsoil and in grasslands and shrublands in warm regions for subsoil, while low model performance was found in temperate forests, croplands and wetland areas for the subsoil layer (Figs. S20 and S21). This is probably because soils in these regions constitute some of the most diverse soil landscapes compared to the pedogenetically similar and more climate-driven soils in high-latitude regions and the more weathered homogenous soils dominating many tropical lowland areas.
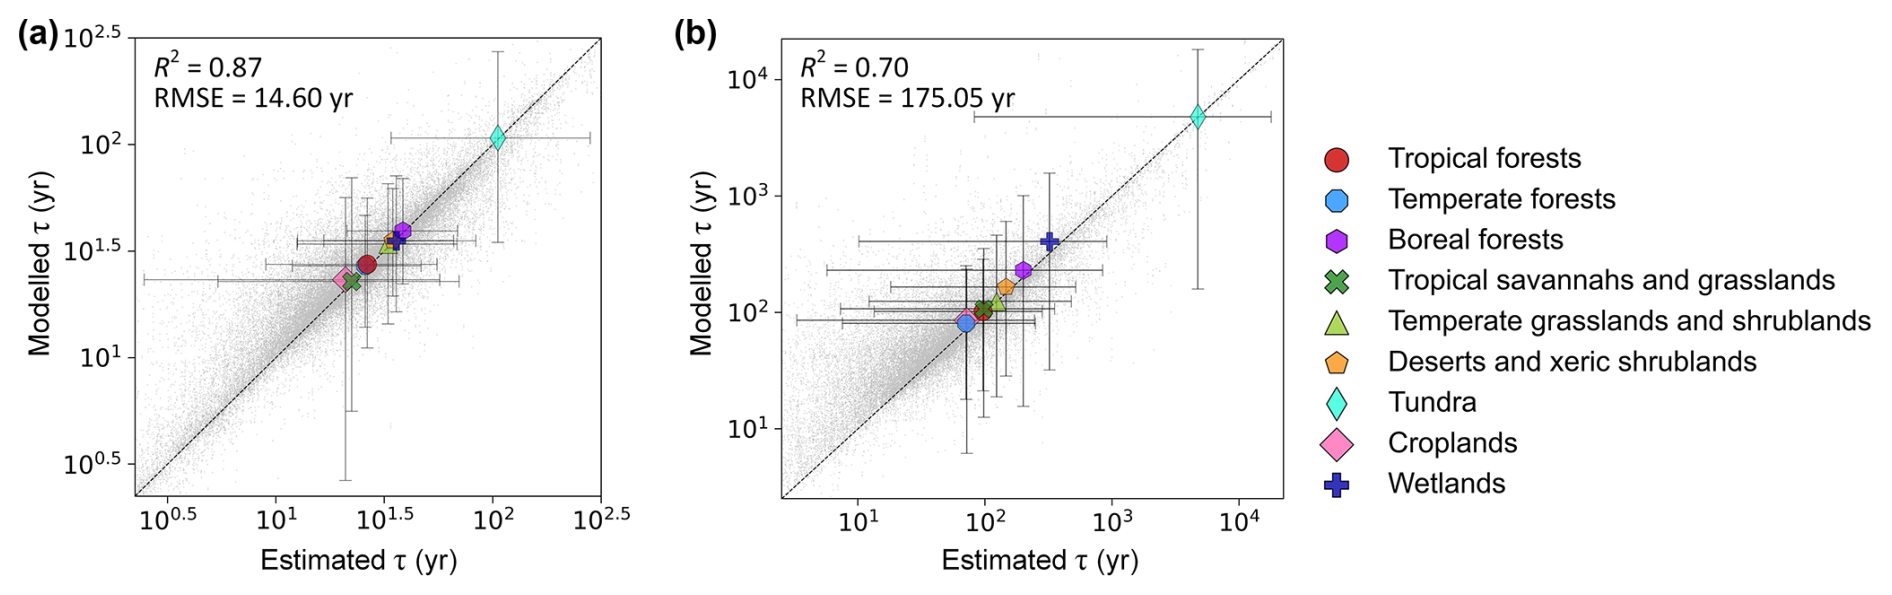
Figure 2Validation plots for predictions of soil organic carbon turnover time (τ, years) in topsoil (a) and subsoil (b) layers. Predictions were generated using random forest regression models. Grey dots are the estimated τ values based on observations for soil profiles and the predicted values for all validation samples using 10-fold cross-validation. Coloured points represent the biome-level validation plot. Error bars show 95 % confidence intervals of τ in each biome. Black lines indicate the regression lines between predicted and measured values. Axes are log10-transformed to account for high skewness of τ.
Table 1Global- and biome-level statistics of the soil organic carbon turnover time (τ, years) in topsoil (0–0.3 m) and subsoil (0.3–1 m) layers.
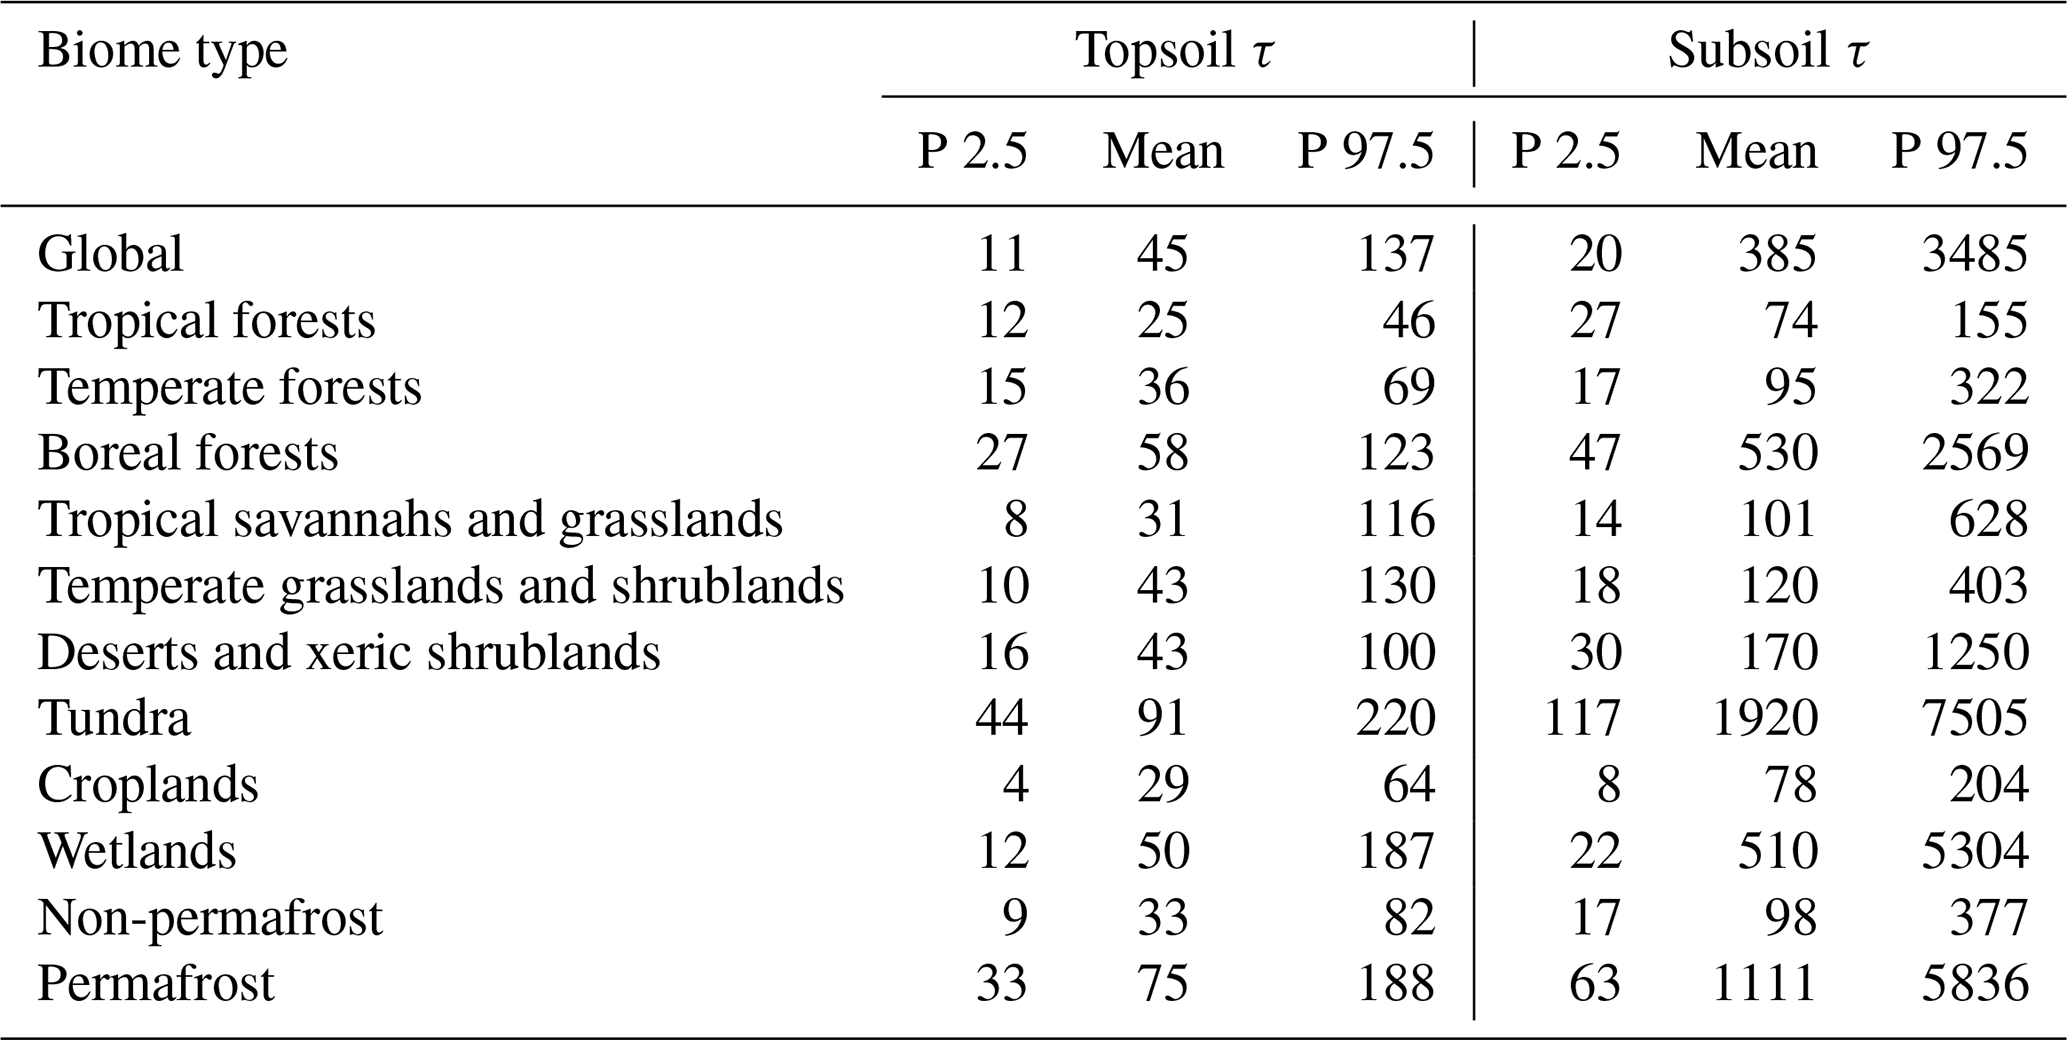
Note that P 2.5 and P 97.5 represent the range of τ between the 2.5th and 97.5th percentiles in each biome based on the aggregation of all estimated τ at the pixel level.
3.2 Global distributions of τ in topsoil and subsoil
The spatially continuous maps of global topsoil and subsoil τ are shown in Fig. 3. On average, the global τ in the topsoil was 45 years, ranging from 11 years (2.5th percentile) to 137 years (97.5th percentile). The average subsoil τ was 385 years, ranging from 20 to 3485 years (Table 1). On a global scale, subsoil SOC turnover time was over 8 times longer than that in topsoil. The values of τ generally increased from low to high latitudes, and this latitudinal pattern was more pronounced in the Northern Hemisphere than in the Southern Hemisphere, and it was more evident in the subsoil than in the topsoil layer (Fig. 3b and d). In tropical forests, the average turnover times were shortest, with approximately 25 and 74 years in the topsoil and subsoil, respectively. The turnover times in temperate, desert, and cropland areas for topsoil and subsoil layers were around 29–43 years and 78–170 years, respectively. The longest turnover times were found for tundra regions, with averages of longer than 90 and 1900 years for the topsoil and subsoil layers, respectively. Boreal forests and wetlands also show long carbon turnover times, with average values of over 50 and 500 years, respectively. As such, the differences in average turnover times between the warmest and coldest biomes were more than 60 and 1800 years for topsoil and subsoil layers, respectively.
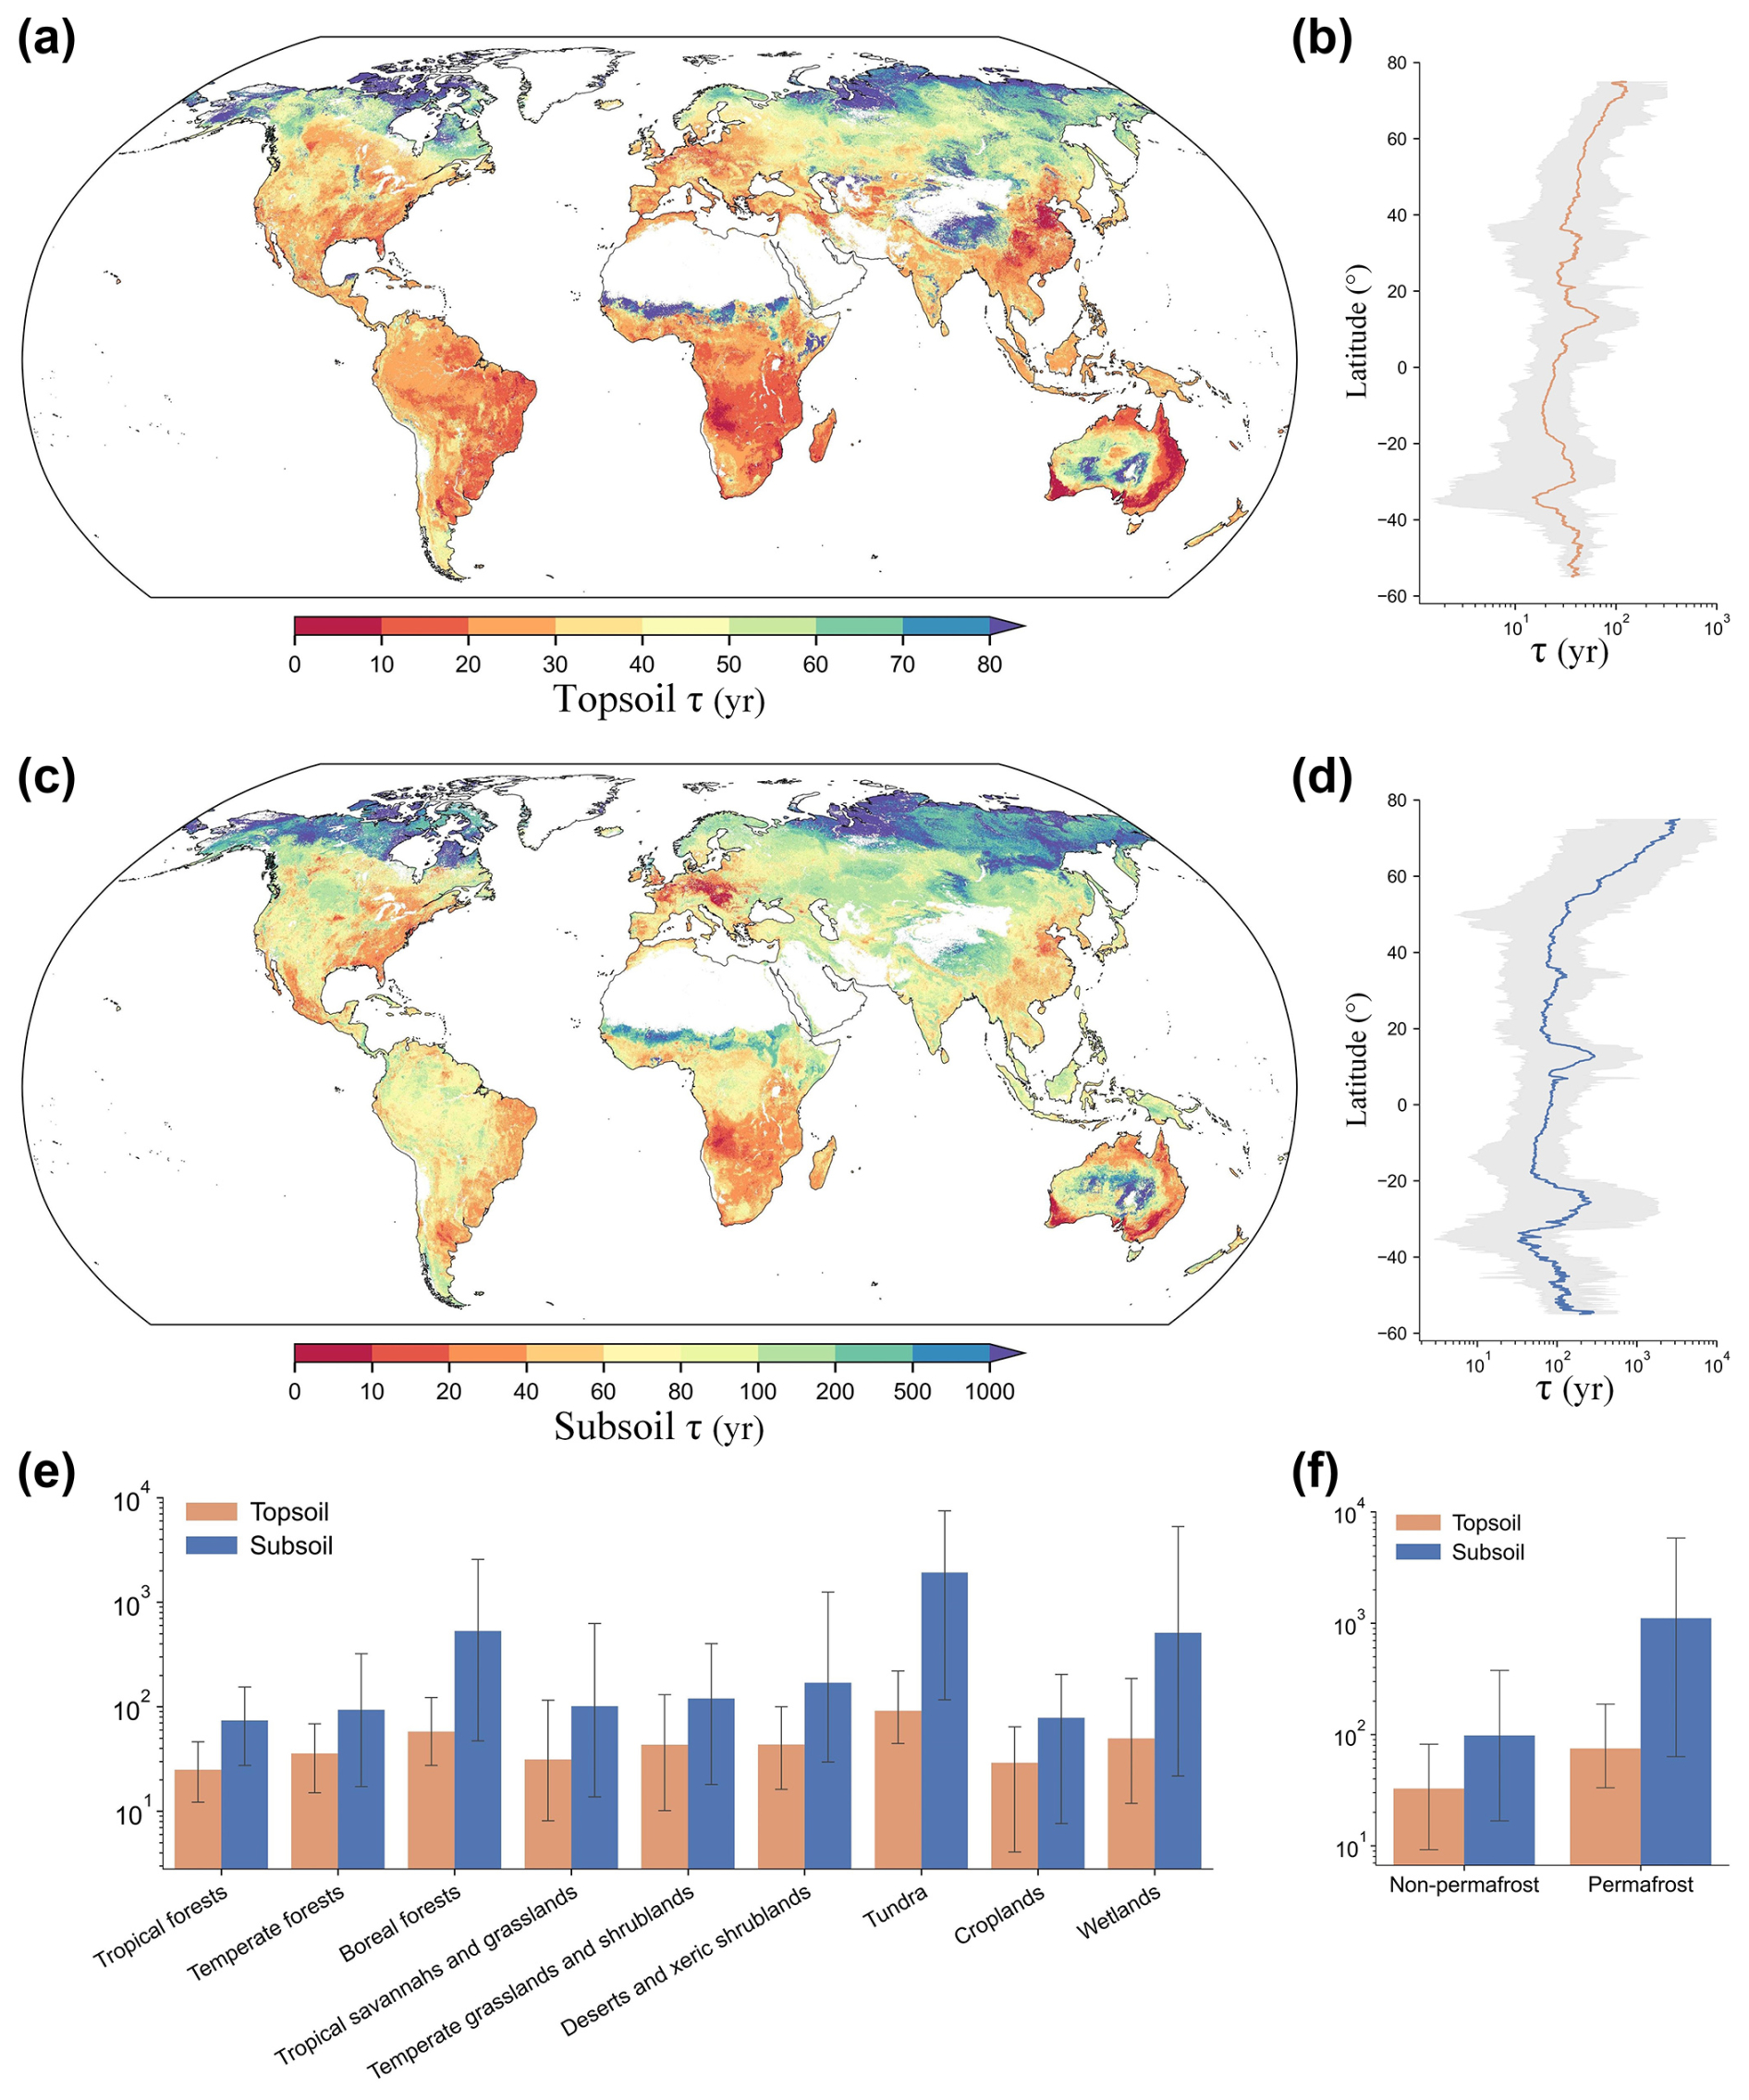
Figure 3Global patterns of topsoil and subsoil organic carbon turnover times (τ, years). Global distributions of τ in topsoil (0–0.3 m) (a) and subsoil (0.3–1 m) (c) layers. The predicted maps, with a spatial resolution of 30 arcsec (∼1 km at the Equator), were generated with τ–environment relationships using a machine learning model trained on global soil profile observations and their environmental covariates. (b, d) Latitudinal patterns of topsoil and subsoil τ. Orange and blue lines represent the average τ in topsoil and subsoil, respectively, with latitude. The shaded grey areas represent the variations in τ between the 2.5th and 97.5th percentiles with latitude. (e, f) Average τ of the two layers in different main biomes. Error bars show the 95 % confidence intervals of the spatial predictions within each biome.
The uncertainty maps quantified for the topsoil and subsoil are shown in Fig. 4. Uncertainties in subsoil τ predictions were generally higher than those in topsoil τ predictions, likely due to the fewer horizontal observations in the deep layers. Wide prediction intervals were mostly found in areas with low sampling density, such as deserts and permafrost regions. According to the PICP calculation results, the accuracy plots (Fig. S22) show that the proportion of observed τ values in the validation set as covered in a certain prediction interval approximately equal the size of that probability interval, which validates the unbiased quantification of uncertainty.
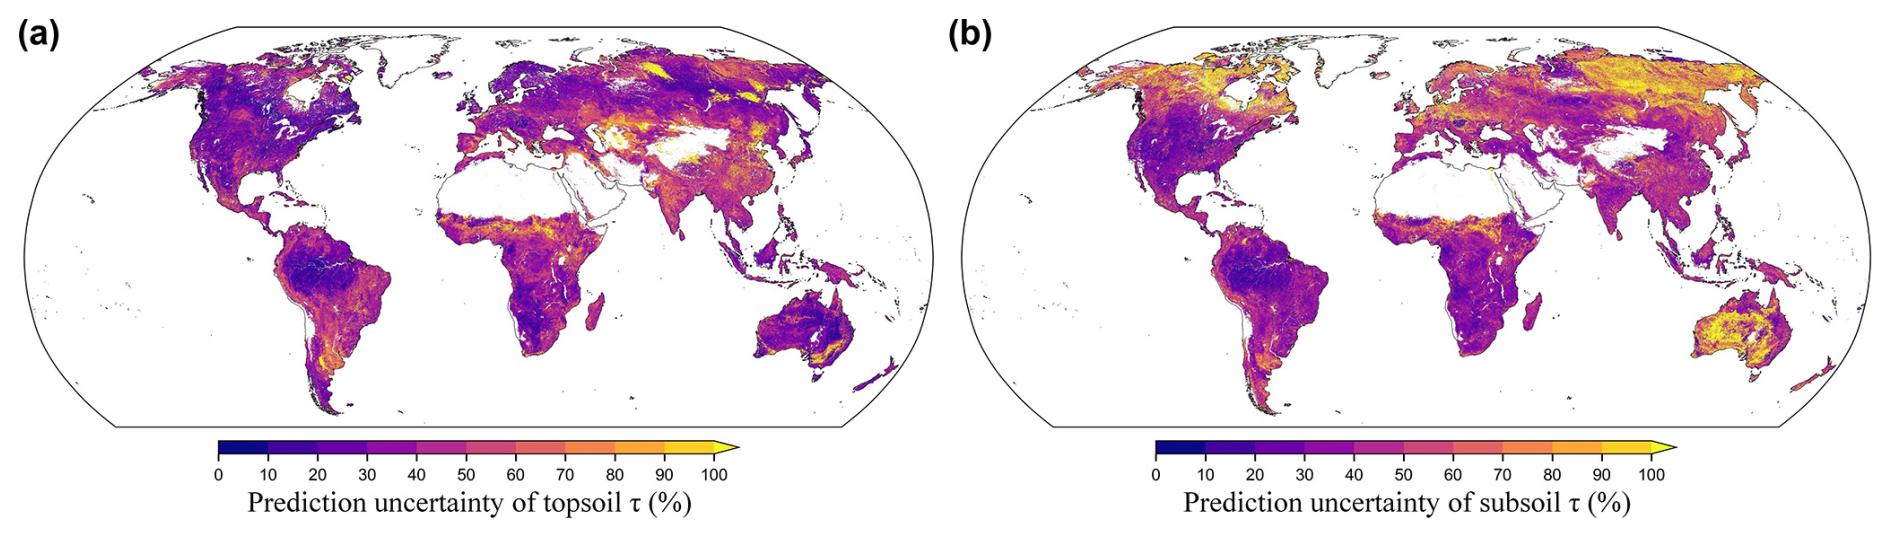
Figure 4Uncertainty maps of predicted soil organic carbon turnover time (τ) in topsoil (a) and subsoil (b) layers. The uncertainty was quantified by using quantile regression forests. The values shown in the maps represent the prediction interval ratio (PIR), which is the ratio of the range between the lower and upper limits (90 % prediction interval bounded by the lower (0.05th quantile) and upper (0.95th quantile) limits) over the median (0.50th quantile) of the predictions.
3.3 Environmental controls of topsoil and subsoil τ
3.3.1 Global- and biome-level analyses
The relative importance and directional effects of climate, soil (divided into physical and chemical properties), and topographic factors in relation to τ variation at global and biome scales were analysed (Figs. 5, S23, and S24). The results suggest scale and depth dependency in the drivers of soil turnover times. While climate was found to be the primary driver (explaining nearly half of the total variation) of topsoil τ at the global scale, the intrinsic soil characteristics (61 %) were more important than climate (32 %) for the subsoil τ (Figs. S23a and S24a). This supports recent studies suggesting that soil turnover in deeper layers is less controlled by climatic factors (Luo et al., 2019; Chen et al., 2021; Han et al., 2022) and more controlled by soil properties (Mathieu et al., 2015; Luo et al., 2019). Importantly, by separating soil factors into soil physical (represented by the fine-particle size fraction (CLAY+SILT)) and chemical categories (including C:N, CEC, and soil pH), our study revealed that the topsoil τ is more influenced by soil physical properties than by chemical properties (33 % versus 15 %). However, for subsoil τ, soil physical properties are less important than soil chemical properties (27 % versus 39 %). These results support the finding that, in addition to the direct control of climate, the pedologic traits and geochemistry of soils exert an equivalent or even stronger control on τ at the global scale (Davidson and Janssens, 2006; Doetterl et al., 2015, 2016).
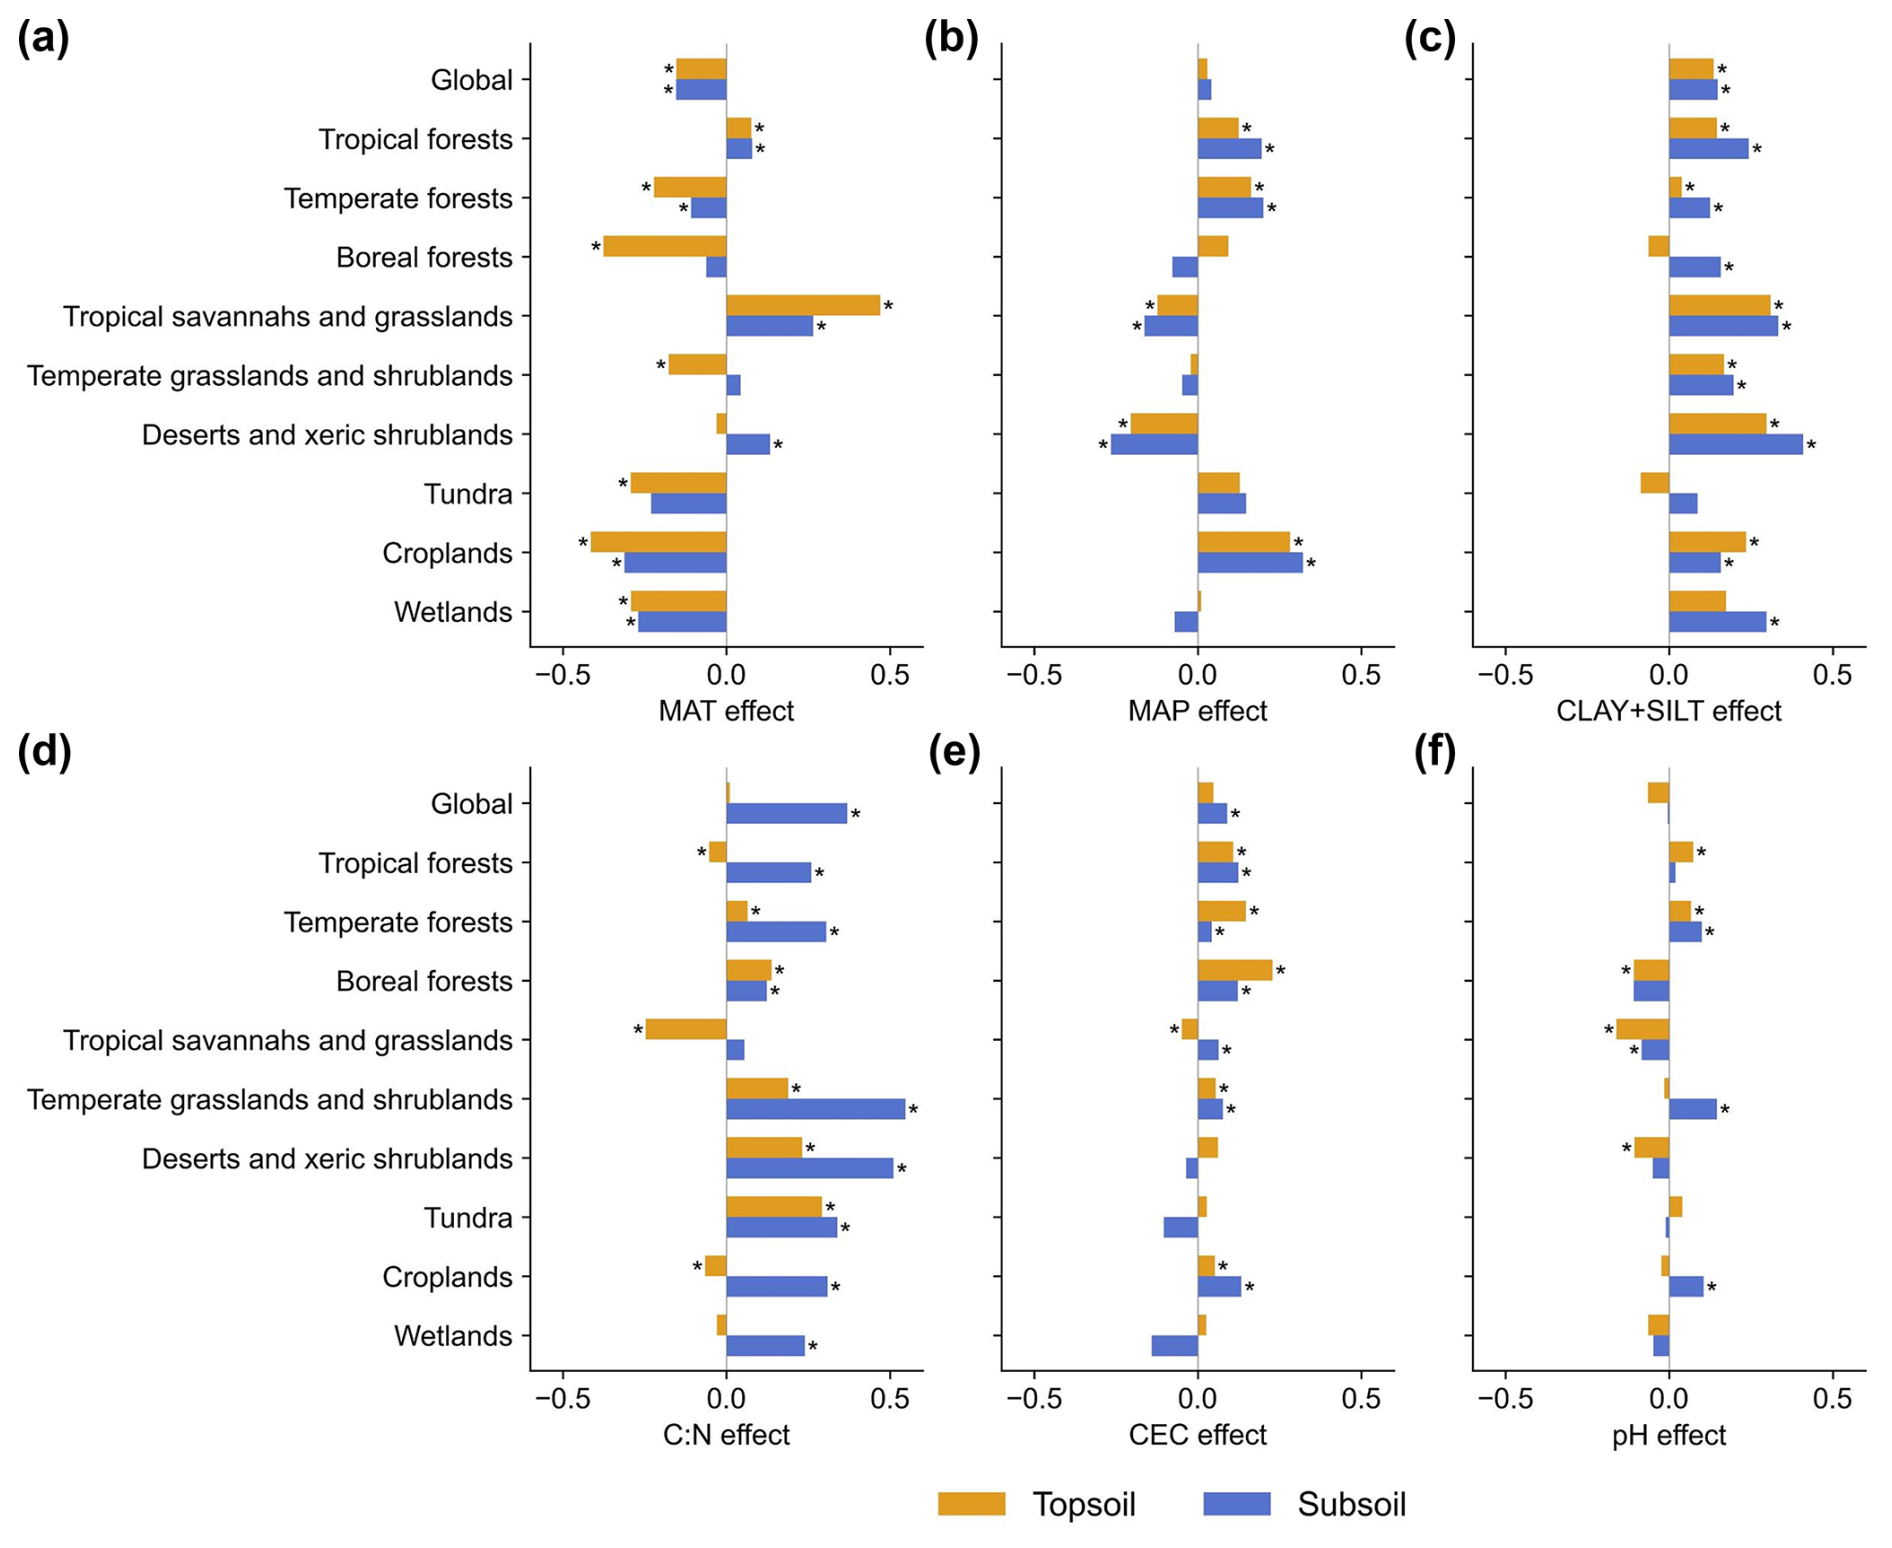
Figure 5Relationships between environmental variables and soil organic carbon turnover time (τ) in topsoil and subsoil layers. Effects of six important variables on τ are shown for the global and biome levels. Values in the bar plots represent coefficients between τ and each variable from the partial-regression model, where positive or negative values indicate a positive or negative effect on τ, respectively. MAT denotes mean annual temperature, MAP denotes mean annual precipitation, CLAY+SILT denotes fine-particle size fraction (the sum of clay and silt content), C:N denotes ratio of organic carbon to total nitrogen, CEC denotes cation exchange capacity of the soil, and pH denotes soil pH. * P<0.001.
In different biomes and at different soil depths, the effects of MAT and MAP show different magnitudes or even opposite directions (Fig. 5a and b). Although a general negative effect of MAT on τ has been found in a previous meta-analysis (Chen et al., 2013), our results show that such an effect was reduced and even changed to be positive in tropical regions (Fig. 5a). This can be attributed to the contrasting relationships of NPP with temperature between tropical and extratropical regions, stemming from their distinct limiting factors affecting plant growth (Fig. S25) (Chapin et al., 2011; Slot and Winter, 2016). In addition, the effect of MAP on τ was not significantly linear at the global scale. This is inconsistent with a previously detected negative relationship (Schimel et al., 1994; Chen et al., 2013) but supports a recent global study that detected a nonlinear relationship between τ and hydrometeorological conditions (Fan et al., 2022). Such previous discrepancies can be explained by contrasting the effects of MAP across different biomes (Fig. 5b). While warm forests and croplands exhibit significant positive effects, notable negative effects are shown in tropical savannahs and grasslands and in arid regions. Additionally, it is shown that MAP negatively impacts subsoil τ in both boreal forests and temperate grasslands and shrublands, but this effect was not significant for topsoil. These τ–climate patterns highlight the nonlinear effects of temperature and water availability on τ globally and the different driving mechanisms across biomes.
Our analyses further revealed that soil physical and chemical properties have comparable or greater effects on τ than climatic effects at global and biome scales (Fig. 5c–f). For soil physical properties, as represented by CLAY+SILT, the fine-particle size fraction in soils was positively related to τ in general (Fig. 5c). This is mainly because soils dominated by finer particles tend to stabilize SOC by means of physical and organo-mineral stabilization mechanisms, while the well-drained sandy soils generally provide limited protection of SOC against microbial decomposition (Krull et al., 2003; Lützow et al., 2006; Cotrufo et al., 2019). The relatively higher effects of CLAY+SILT on subsoil τ than on topsoil τ (except in croplands) further indicate that mineral-associated and physically protected SOC in deep layers may play a crucial role in stabilizing SOC stocks and, consequently, may decrease climate sensitivity (Gillabel et al., 2010; Qin et al., 2019).
Among the effects of soil chemical properties, the C:N ratio plays a key role in regulating subsoil τ, ranking as the most influential soil factor (Fig. S24a). The positive impact of C:N was observed in all biomes for subsoil and specifically in boreal forests, temperate grasslands, deserts, and tundra for topsoil (Fig. 5d). However, the effects of C:N were not found to be significant for topsoil τ, and it is even shown that there is a negative impact in tropical and cropland regions. This finding implies that, in general, nutrient limitations decrease soil respiration and extend carbon residence times by favouring the establishment of slow-decomposing organisms or reducing organic matter quality (Crowther et al., 2019b; Li et al., 2012; Zhou et al., 2007). Whilst this effect is pronounced in the subsoil layer, it cannot be straightforwardly generalized to the topsoil in the tropics and in human-impacted regions. The factor of CEC showed a generally positive impact on τ in forests and croplands, but its effect was weaker in other biomes (Fig. 5e). Soil pH shows a non-significant linear correlation with τ globally, yet it exhibits divergent influences across different biomes and soil depths (Fig. 5f). It has a positive impact on τ in warm forests and on subsoil τ in temperate grasslands and croplands. Conversely, in boreal forests, tropical grasslands, and arid regions, it more negatively impacts τ in topsoil.
In addition to the climate and soil factors, topography can influence τ by affecting soil moisture distribution, drainage conditions, and permafrost dynamics. Our analysis (Figs. S23h and S24h) indicates that topographic variables contribute significantly to τ variability in tundra regions. This might be related to previous studies that found that terrain-driven hydrological differences strongly influence permafrost carbon stability (Schuur et al., 2008; Mishra et al., 2021). This also aligns with research showing that microtopographic variations, such as polygonal tundra structures, create distinct carbon accumulation and decomposition regimes, further influencing SOC turnover times (Jorgenson et al., 2010; Liljedahl et al., 2016).
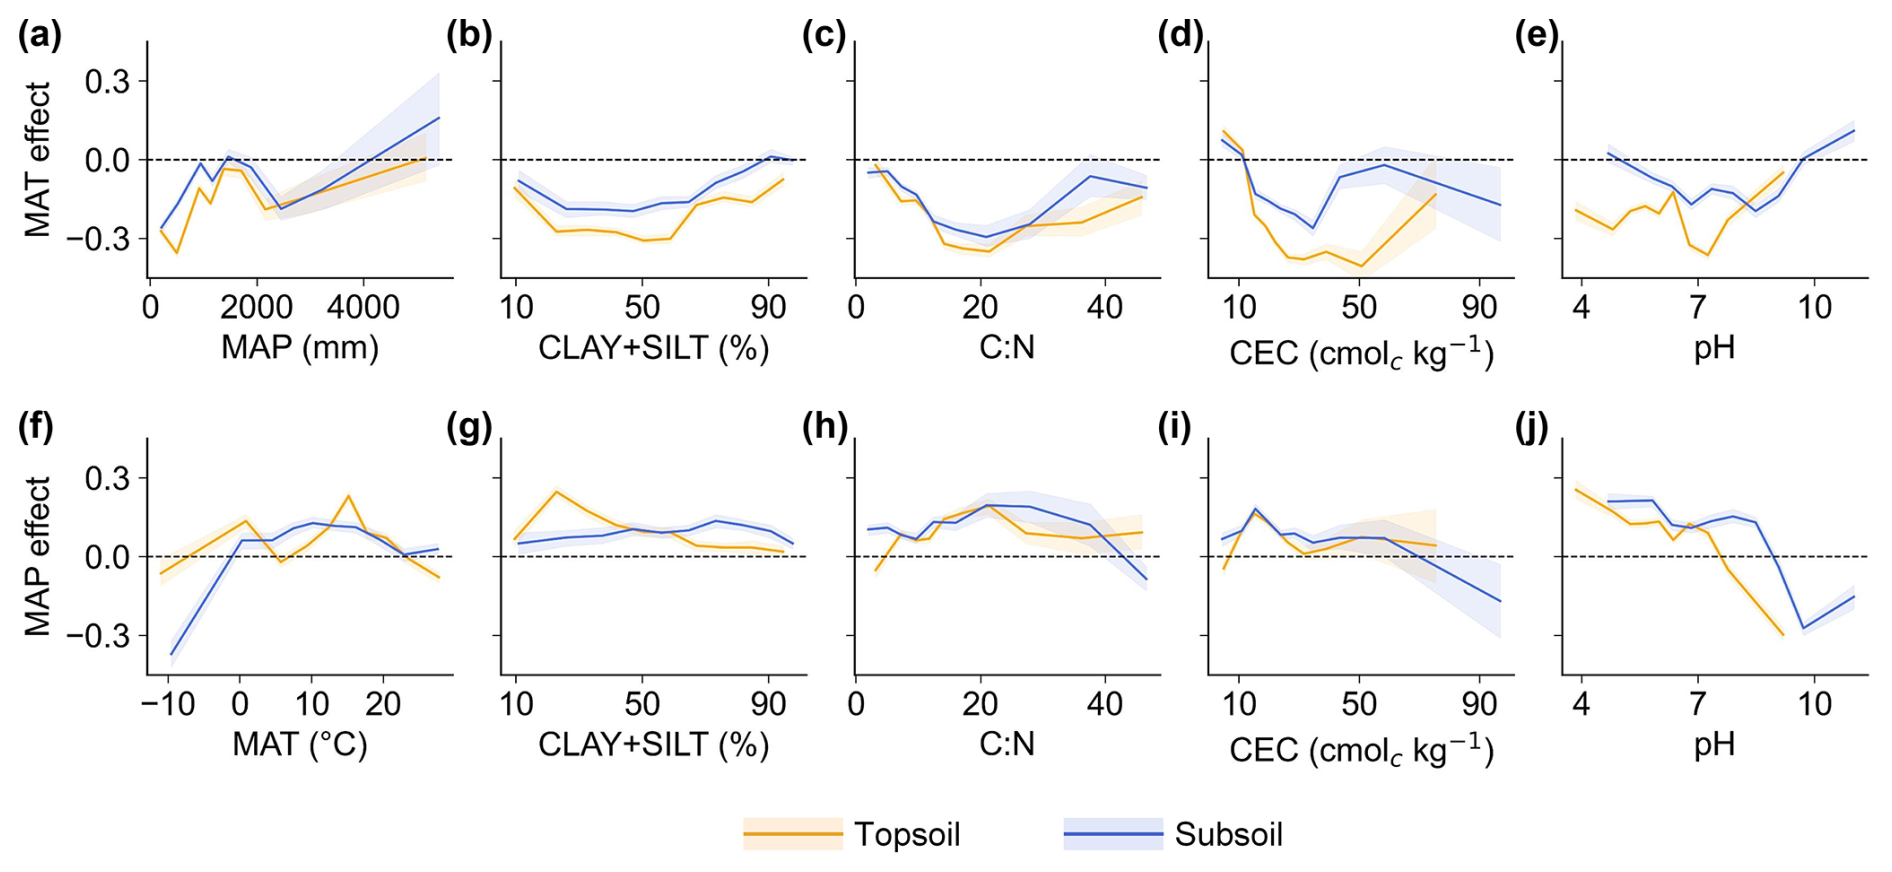
Figure 6The climatic effects on topsoil and subsoil organic carbon turnover time (τ) interacting with other factors. The lines show the mean annual temperature (MAT) effect and the mean annual precipitation (MAP) effect on τ in response to another climatic variable and four important soil physio-chemical (including the fine-particle size fraction (CLAY+SILT), carbon-to-nitrogen ratio (C:N), cation exchange capacity (CEC), and soil pH) variables. The variables on the x axis can be considered to be interactive factors, which influence the MAT and MAP effects on τ. The values on the lines above or below the dashed horizontal lines indicate the positive or negative climatic effects on topsoil or subsoil τ (the MAT and MAP effects were calculated by means of the partial-regression coefficient between MAT and/or MAP and τ) in response to the corresponding values of interactive factors. The shaded areas on the lines represent confidence intervals for the results of partial-correlation analysis.
3.3.2 Interactive effects of climatic and edaphic factors on τ
The detected relationships between environmental factors and τ prompted us to delve deeper into the nonlinear driving mechanisms. We aimed to uncover potential interactions among the primary climatic and edaphic drivers that might be masked by analysing the directional effects of only a single variable. We illustrate how fluctuations in one climatic variable (MAT or MAP) related to changes in another climatic variable (Fig. 6a and f) and four key soil properties (Fig. 6b–e and g–j). We found that the negative effect of MAT on τ was magnified with decreasing MAP (when MAP <1500 mm). Meanwhile, it was also shown that the MAT effect on τ changed to be smaller and could even be positive for subsoil with increasing MAP (when MAP>2000 mm) (Fig. 6a). Notably, the MAP effect transitioned from negative to positive with increasing MAT in colder environments. This effect then diminished after a critical point around 15 °C (Fig. 6f).
Beyond the interplay of climatic factors, soil property values significantly modulated the effects of MAT and MAP on τ. For instance, as CLAY+SILT content decreased, the negative impact of MAT was pronounced (Fig. 6b). The MAP effect was also accentuated in sandy soils but was restricted to the topsoil layer (Fig. 6g). This result suggests that the finer soil texture may reduce carbon turnover sensitivity to temperature or water fluctuations (Krull et al., 2003). Among the interactions of soil chemical properties with climatic impacts on τ, it is evident that extremely low or high C:N ratios in soils lead to smaller climatic effects on τ (Fig. 6c and h), suggesting that the sensitivity of τ to climate is strongly influenced by whether the C:N ratio falls within an optimal range. The negative impacts of temperature were intensified with rising CEC (when CEC<40 cmolc kg−1) (Fig. 6d), mainly because higher CEC typically enhances the nutrient-supplying capacity of soils, thus quickening carbon turnover in warm conditions (Crowther et al., 2019a). The different responses of topsoil and subsoil temperature sensitivity to CEC (Fig. 6d) may result from interactive and combined influencing factors. Higher CEC enhances nutrient availability for microbes and promotes mineral–organic compound formation, potentially increasing SOC temperature sensitivity. Concurrently, elevated CEC can promote plant productivity, leading to greater carbon inputs and influencing NPP sensitivity to temperature. The observed patterns are likely to reflect the combined effects of these processes. The influence of soil pH on MAT effects on τ demonstrated a strong nonlinear trend. A more pronounced negative MAT effect was found when soil pH was neutral for topsoil and mildly alkaline for subsoil (Fig. 6e). This is related to microorganisms having a physiologic optimum pH (Rousk et al., 2010; Don et al., 2017) and results in the warmer temperature significantly accelerating SOC turnover rates when pH is within an optimum range (Frostegård et al., 2022; Xiang et al., 2023). Nevertheless, there is currently a need to further explore the reasons for why these pH ranges are different with soil depth, as well as for their species specificity (Bahram et al., 2018). The impact of MAP appears to be more positive in acidic soils but becomes negative when soil pH exceeds 8 and 9 for topsoil and subsoil, respectively (Fig. 6j). The positive MAP effect on turnover time under acidic conditions could be partly explained by the enhanced effect of increased moisture on soil weathering processes (Porras et al., 2017). Under alkaline conditions, which are mostly seen in dry climates (Slessarev et al., 2016), the negative MAP effect may arise from the intensified microbial transformation of plant-derived organic matter as these soils provide pH and moisture that are favourable to microorganisms (Yang et al., 2022).
Table 2Statistical summary of the local-scale analytical results of variable (classified into four categories) importance in terms of influence on topsoil and subsoil organic carbon turnover time (τ) at the local scale.
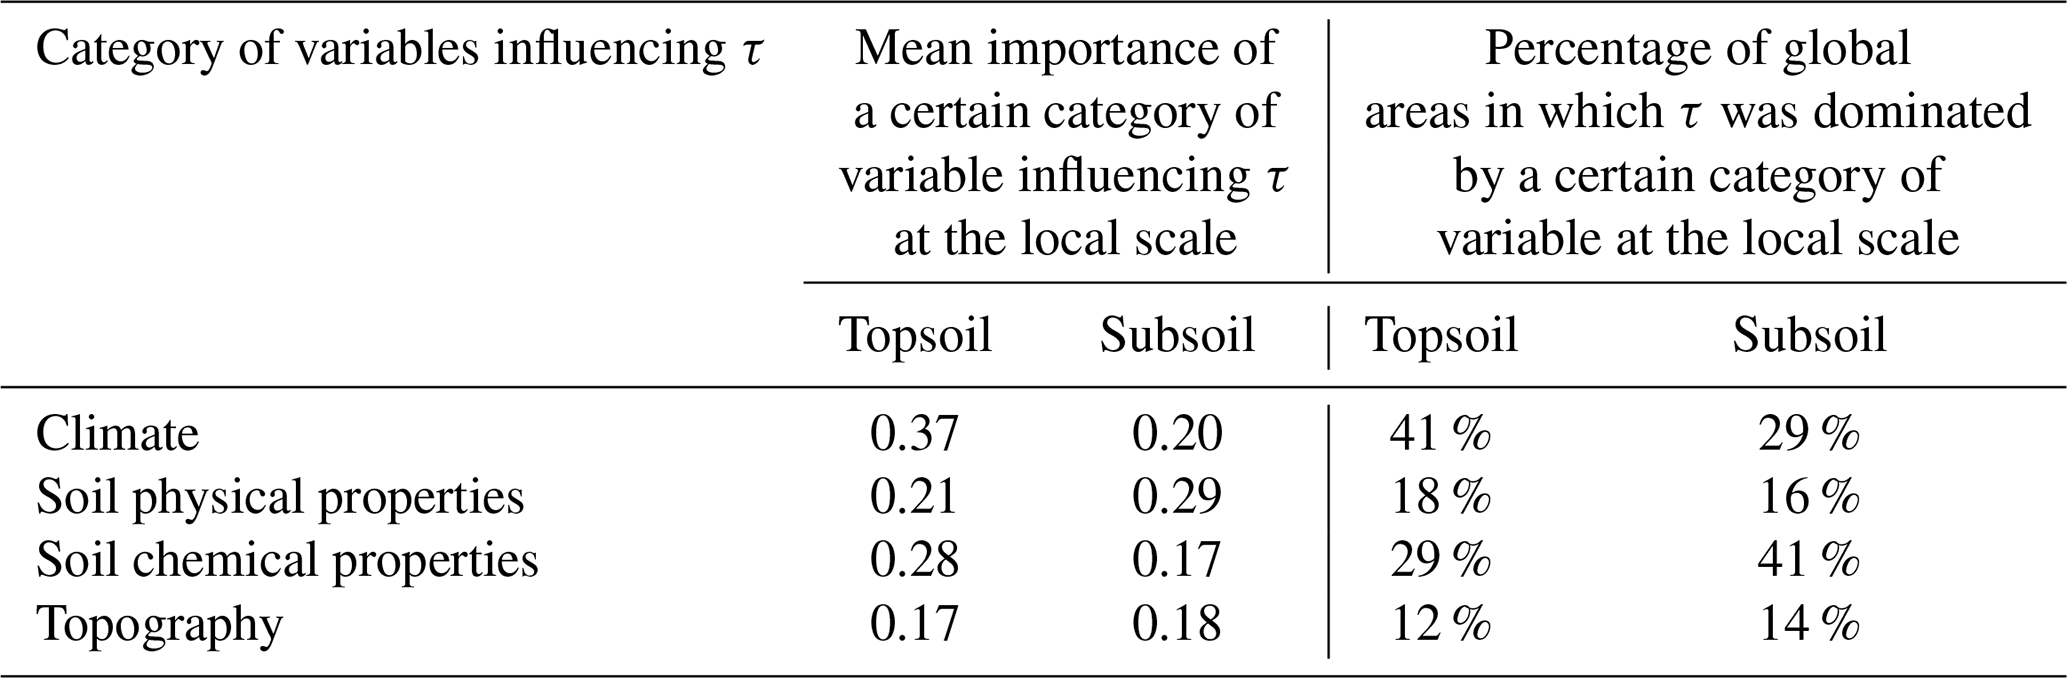
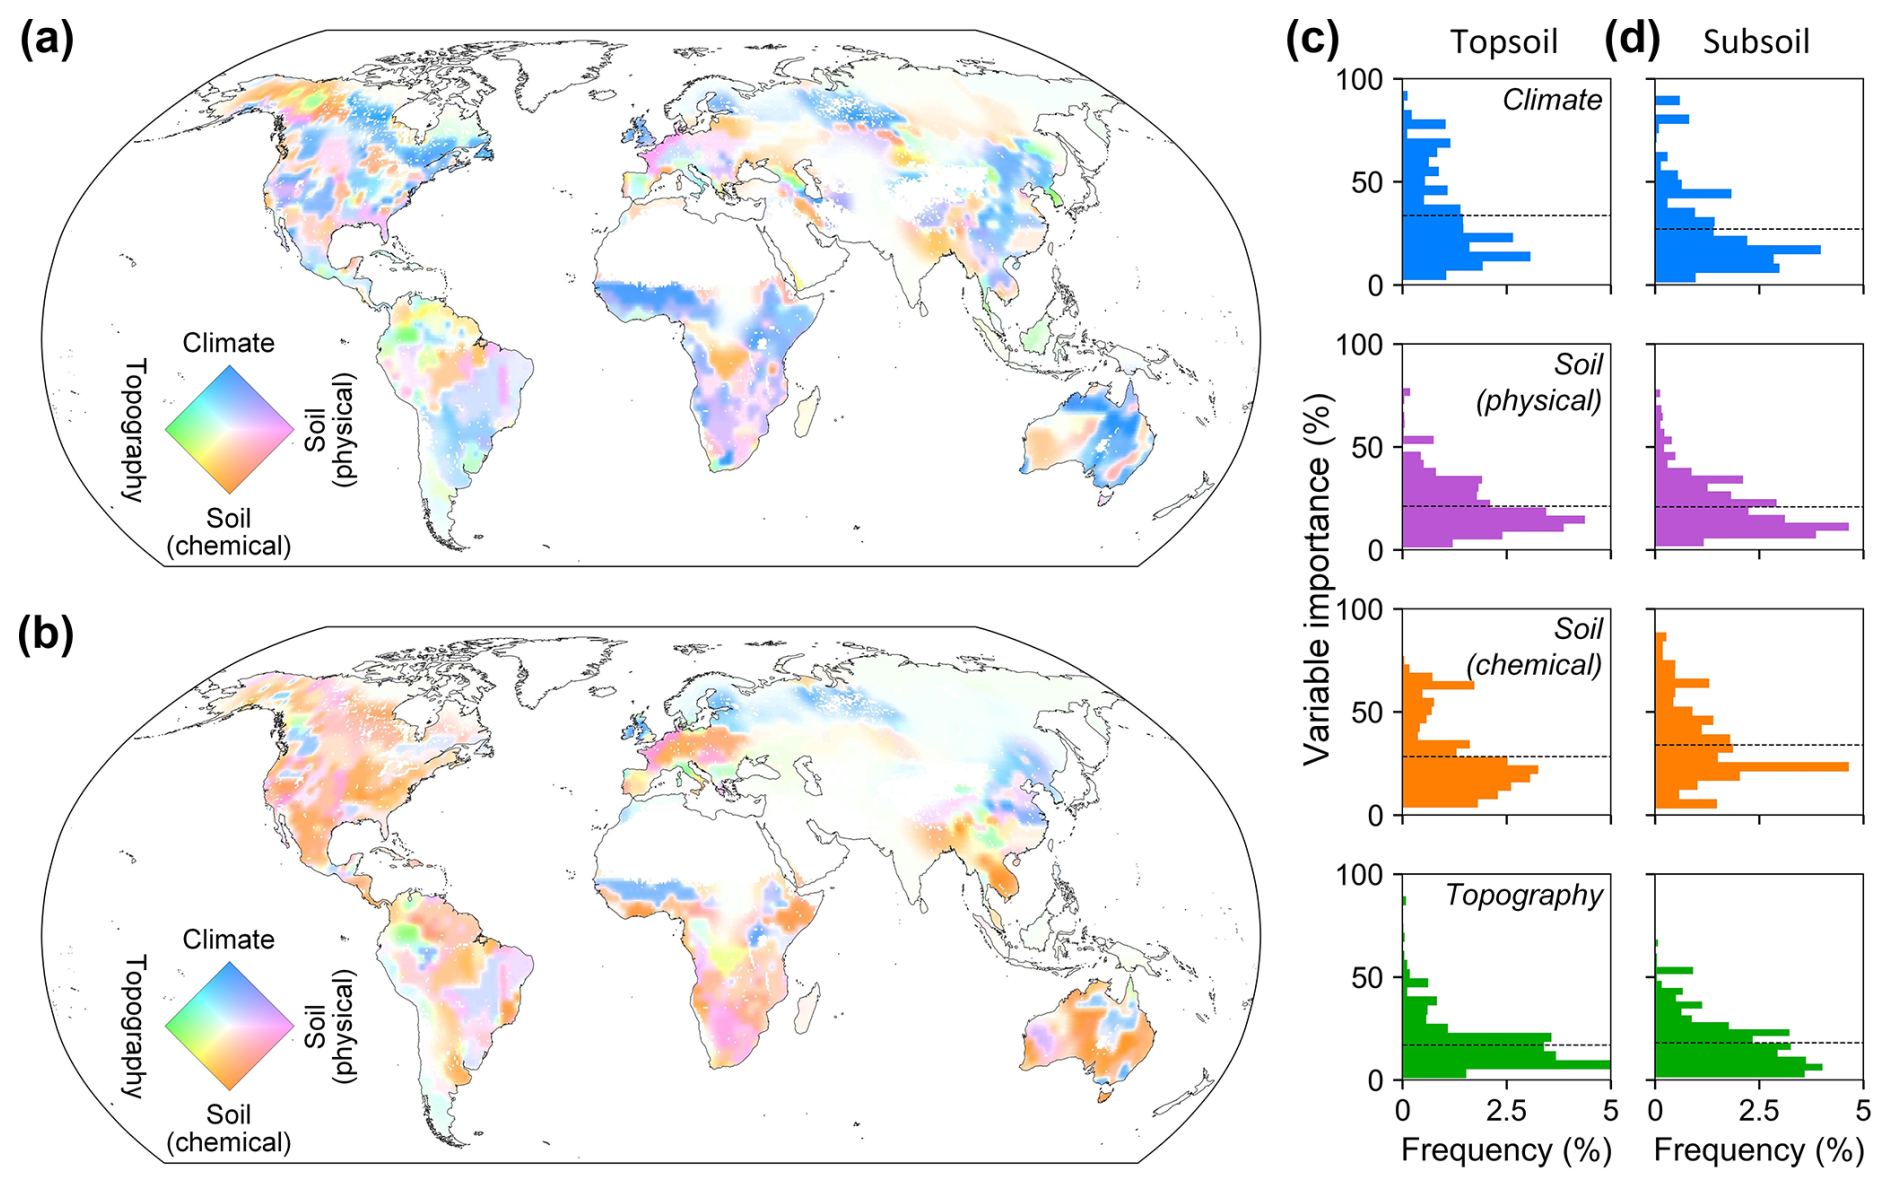
Figure 7Local-level analysis of dominating factors of topsoil and subsoil organic carbon turnover time (τ). Global maps of dominant factors controlling τ in topsoil (a) and subsoil (b) at the local scale. Maps were created by interpolating all results of factor importance from modelling using the sample data within each local area stratified by the ecoregion map. The lighter colours show that the reliability of the local result is low, with a smaller number of available samples for analysis. Histograms of the local-level percentage contribution of each variable category in controlling topsoil (c) and subsoil (d) τ across all local areas. Dashed lines represent the mean values.
3.3.3 Distributions of dominating factors of τ at local scales across the world
We further analysed the effects of these covariates by generating τ–environment models using data from sampling locations within different local areas to assess the deviation of regional patterns from those at the large scale. Overall, we find that the dominant factors controlling τ vary across different local areas (Fig. 7a and b). Across approximately 41 % of the land surface area, climatic factors are the predominant controller of topsoil τ (Table 2). However, for subsoil τ, climatic factors predominantly mediate the variation in τ in only 29 % of the global area. It is noteworthy that, in 57 % of the global area, soil characteristics were the dominant driver of subsoil τ. Overall, soil chemical properties had a larger effect than soil physical properties. This is particularly notable in parts of the tropical forests of the Amazon; the broadleaf forests spanning from eastern Indian to Southeast Asia; most parts of North America; central Europe; and the grasslands, deserts, and xeric shrublands scattered across Africa and Australia (Fig. 7b). This phenomenon is related to previous studies suggesting that nutrient availability for soils and vegetation greatly affects τ (Cleveland and Townsend, 2006; Carvalhais et al., 2014). The contributions of four categories of environmental factors in the local-scale analysis differed less in subsoil compared to in topsoil (Fig. 7c and d and Table 2).
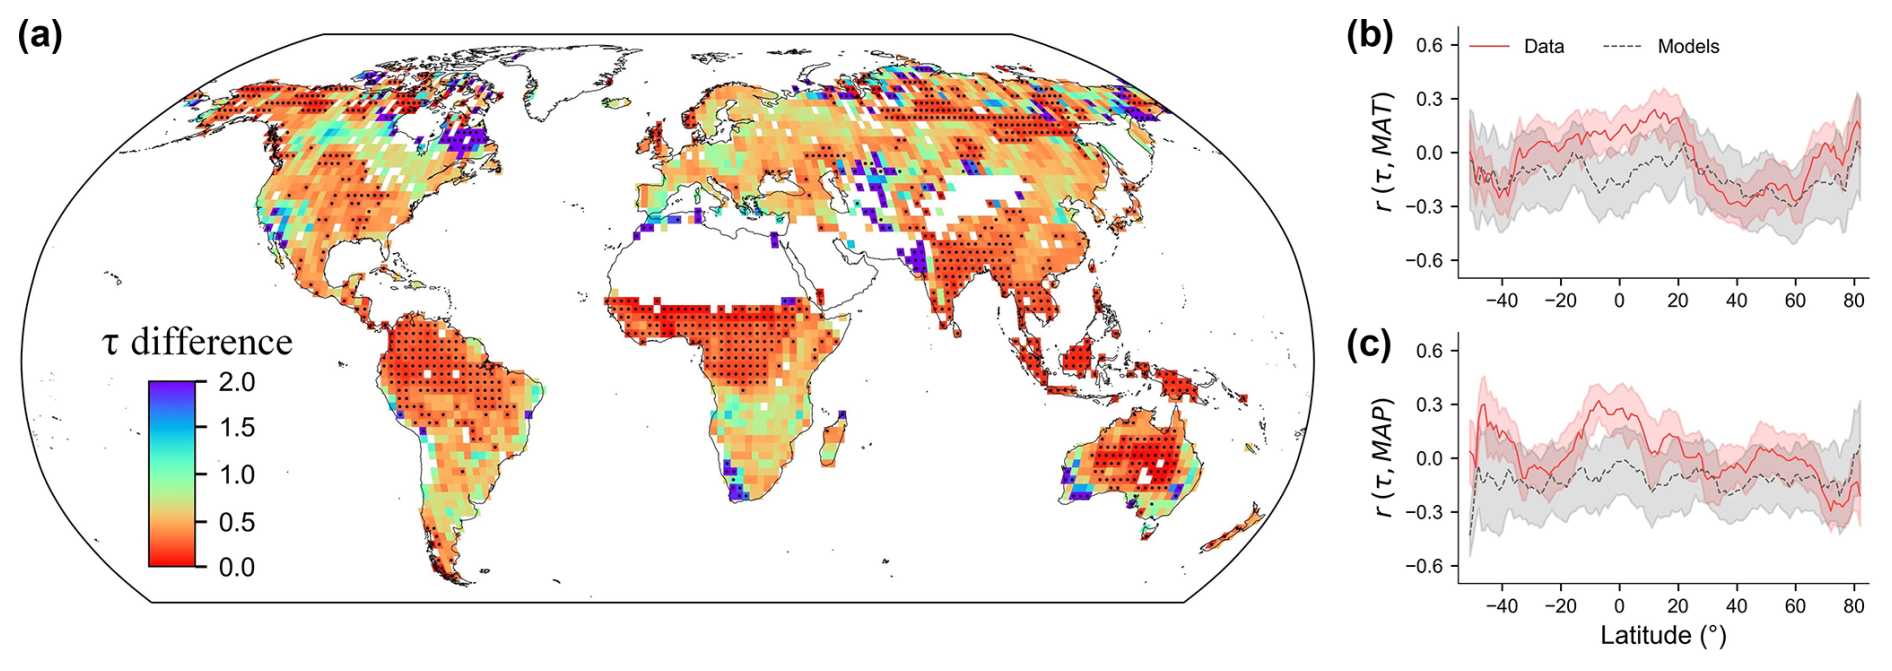
Figure 8Comparisons of soil organic carbon turnover times (τ) from our data-derived estimates and from Earth system models (ESMs). (a) Biases in τ represented by ratios of data-derived to model-derived values across the global grid cells. Black points indicate locations where τ values from ESMs are outside of the 0.05th and 0.95th quantiles of the prediction uncertainty in our data-derived estimations. (b, c) Comparisons of associations of data- and model-derived (ESMs) τ to mean annual temperature (MAT) (b) and mean annual precipitation (MAP) (c) along latitudinal gradients. The y axis shows partial correlations (r) of τ with two climate factors, controlling for precipitation when calculating the correlation between τ and temperature (and vice versa).
3.4 Comparison with τ from Earth system models
Our observation-based τ estimates can help constrain ESM simulations and improve predictions of current and future carbon cycle dynamics. We analysed historical simulation outputs of selected ESMs from CMIP6 (Table S4). While the comparison of our empirical estimates with τ estimates from ESM outputs based on CMIP6 showed broad agreement in terms of the spatial patterns of τ (Pearson's r=0.53, P<0.001), it highlighted that ESMs are likely to underestimate τ across the majority of the globe (Fig. 8a). The soil carbon turnover times estimated from ESMs were, on average, more than 2 times shorter than our data-derived (using ground-sourced samples integrated with remote sensing observations) τ estimates (Table S4). This discrepancy was particularly pronounced in tropical forests, grasslands, and tundra areas (Table S5). In ∼30 % of the global land grids, the τ estimates from ESMs did not fall into the 90 % estimation intervals of our data-driven estimates, and ∼92 % of global land area showed a mean underestimation bias (ESM-derived τ < data-derived τ) (Fig. 8a, Table S4).
The discrepancies between τ from observations and from ESMs are also reflected in their associations with climate variables. The ESMs predicted stronger correlations with temperature and precipitation compared to our τ estimates (Fig. 8b and c). Additionally, there were notable differences in terms of the climate correlations between topsoil and subsoil, which ESMs do not yet capture. These findings emphasize that other factors, such as soil physico-chemical properties and soil depth, need to be accounted for in models to accurately project global soil carbon dynamics.
3.5 Implications and future perspective
Our quantitative maps of SOC turnover times in topsoil and subsoil layers based on an extensive soil profile dataset represent a key step towards a better understanding of global soil carbon stocks and dynamics. Our research illustrates how global variations in τ in both topsoil and subsoil layers are influenced by the interplay of climatic and edaphic factors and demonstrates their pronounced heterogeneity within and across biogeographic zones. These analyses revealed complex interactions between temperature, water availability, and soil physio-chemical properties, thereby enriching our comprehension of the complex mechanisms driving spatial variability and nonlinearity in τ–environment relationships from global to local scales. The distinct factors driving τ in topsoil versus subsoil underscore the importance of incorporating soil depth when assessing large-scale τ patterns.
The findings in this study also have the potential to improve the parameterization and future projections of ESMs by integrating more accurate global τ data. Our results support several previous studies that also identified an underestimation of SOC turnover times in ESMs through 14C observations (He et al., 2016; Shi et al., 2020). This discrepancy between data- and model-derived τ emphasizes the need to incorporate more detailed edaphic- and climate-dependent and depth-specific τ estimates into biogeochemical models to enhance predictive accuracy. Furthermore, there is evidence that the greatest exchange of soil carbon with the atmosphere occurs through relatively small and fast soil carbon pools on a short timescale, which can result in a “leaky-sink” response when carbon input is elevated (Bradford, 2017; van Groenigen et al., 2017). This response may conceal the longer turnover times in inert pools that are not precisely captured by models. Adjusting turnover rates and carbon transfer parameters in ESMs to align with the longer τ values we report here may extend the turnover time of “slow” or “passive” pools in models (especially for deep layers) that constitute the majority of soil carbon (Torn et al., 2009; He et al., 2016).
To improve the accuracy of carbon cycle models and to enhance the projections of future soil carbon sequestration rates and magnitudes, it is essential to incorporate edaphic- and climate-dependent and depth-resolved estimates of turnover times into these models. These insights across various climate zones, biomes, terrains, and soil properties contribute to reducing uncertainties related to context-dependent effects governing soil carbon stocks and dynamics, thus helping to inform strategies that enhance sustainable soil management and mitigate the impacts of climate change.
The global maps of topsoil and subsoil organic carbon turnover times are available online at https://doi.org/10.5281/zenodo.14560239 (Zhang, 2025a).
The code used for this study is publicly available at https://github.com/leizhang-geo/global_soil_carbon_turnover_time.git and is permanently deposited in a Zenodo repository at https://doi.org/10.5281/zenodo.15636310 (Zhang, 2025b).
This study provides a comprehensive assessment of global apparent SOC turnover times in both topsoil and subsoil layers. By integrating state-of-the-art datasets of soil profiles, plant roots, and satellite observations, we employed machine learning models to produce the spatially explicit maps of τ with quantified uncertainties. The results reveal pronounced spatial heterogeneity and nonlinearity in τ–environment relationships within and among different biomes and climatic zones. Our findings demonstrate the context-dependent effects of temperature and water availability on τ, which vary depending on soil attributes, mainly including soil texture, carbon-to-nitrogen ratio, cation exchange capacity, and soil pH. Considering the potentially large differences in the driving factors of τ from large to small scales, we further mapped the dominating factors of τ in two soil layers at local scales. Overall, this study synthesizes the multiple observation-based datasets that are currently available and provides new global maps of topsoil and subsoil organic carbon turnover times. The dataset and new insights of this study are expected to serve as a foundation for benchmarking biogeochemical models and supporting effective carbon management.
The supplement related to this article is available online at https://doi.org/10.5194/essd-17-2605-2025-supplement.
LZ and LY conceived the research. LZ collected the data and performed the analyses. LZ, LY, TWC, CMZ, and CZ interpreted the analytical results, with reviews by all of the authors. SD contributed to the validation and comparison with radiocarbon measurements. GBMH, AMJCW, AXZ, and CZ contributed to the global mapping and uncertainty analysis. LZ, YP, and FS contributed to the data curation and validation. LZ, LY, TWC, and CMZ wrote the paper, with substantial contributions from all of the authors.
The contact author has declared that none of the authors has any competing interests.
Publisher's note: Copernicus Publications remains neutral with regard to jurisdictional claims made in the text, published maps, institutional affiliations, or any other geographical representation in this paper. While Copernicus Publications makes every effort to include appropriate place names, the final responsibility lies with the authors.
The authors express sincere gratitude to Weimin Ju (International Institute for Earth System Science at Nanjing University), Nuno Carvalhais (Max Planck Institute for Biogeochemistry), Alison M. Hoyt (Earth System Science at Stanford University), and Julian Helfenstein (Soil Geography and Landscape Group at Wageningen University), who provided valuable comments and suggestions on an earlier version of our paper.
This work was supported by the National Natural Science Foundation of China (grant no. 42471468), the Fundamental Research Funds for the Central Universities (grant no. 0209-14380115), the Leading Funds for the First-Class Universities (grant nos. 020914912203 and 020914902302), and the Research Funds for the Frontiers Science Center for Critical Earth Material Cycling through Nanjing University. Thomas W. Crowther acknowledges support from DOB Ecology and the Bernina Foundation. Constantin M. Zohner was funded by the Ambizione grant (no. PZ00P3_193646). Lei Zhang acknowledges the support from the US Department of Energy, Office of Science, Office of Biological and Environmental Research, under award no. DE-AC02-05CH11231.
This paper was edited by Jia Yang and reviewed by three anonymous referees.
Altmann, A., Toloşi, L., Sander, O., and Lengauer, T.: Permutation importance: a corrected feature importance measure, Bioinformatics, 26, 1340–1347, https://doi.org/10.1093/bioinformatics/btq134, 2010.
Arrouays, D., McBratney, A., Minasny, B., Hempel, J., Heuvelink, G., MacMillan, R., Hartemink, A., Lagacherie, P., and McKenzie, N.: The GlobalSoilMap project specifications, in: GlobalSoilMap, edited by: Arrouays, D., McKenzie, N., Hempel, J., de Forges, A., and McBratney, A., CRC Press, 9–12, ISBN 978-1-138-00119-0, 2014.
Bahram, M., Hildebrand, F., Forslund, S. K., Anderson, J. L., Soudzilovskaia, N. A., Bodegom, P. M., Bengtsson-Palme, J., Anslan, S., Coelho, L. P., Harend, H., Huerta-Cepas, J., Medema, M. H., Maltz, M. R., Mundra, S., Olsson, P. A., Pent, M., Põlme, S., Sunagawa, S., Ryberg, M., Tedersoo, L., and Bork, P.: Structure and function of the global topsoil microbiome, Nature, 560, 233–237, https://doi.org/10.1038/s41586-018-0386-6, 2018.
Balesdent, J., Basile-Doelsch, I., Chadoeuf, J., Cornu, S., Derrien, D., Fekiacova, Z., and Hatté, C.: Atmosphere–soil carbon transfer as a function of soil depth, Nature, 559, 599–602, https://doi.org/10.1038/s41586-018-0328-3, 2018.
Bardgett, R. D., Mommer, L., and Vries, F. T. D.: Going underground: root traits as drivers of ecosystem processes, Trends Ecol. Evol., 29, 692–699, https://doi.org/10.1016/j.tree.2014.10.006, 2014.
Batjes, N. H.: Total carbon and nitrogen in the soils of the world, Eur. J. Soil Sci., 47, 151–163, https://doi.org/10.1111/j.1365-2389.1996.tb01386.x, 1996.
Batjes, N. H., Ribeiro, E., and van Oostrum, A.: Standardised soil profile data to support global mapping and modelling (WoSIS snapshot 2019), Earth Syst. Sci. Data, 12, 299–320, https://doi.org/10.5194/essd-12-299-2020, 2020.
Bishop, T. F. A., McBratney, A. B., and Laslett, G. M.: Modelling soil attribute depth functions with equal-area quadratic smoothing splines, Geoderma, 91, 27–45, https://doi.org/10.1016/S0016-7061(99)00003-8, 1999.
Braakhekke, M. C., Beer, C., Hoosbeek, M. R., Reichstein, M., Kruijt, B., Schrumpf, M., and Kabat, P.: SOMPROF: A vertically explicit soil organic matter model, Ecol. Model., 222, 1712–1730, https://doi.org/10.1016/j.ecolmodel.2011.02.015, 2011.
Bradford, M. A.: A leaky sink, Nat. Clim. Change, 7, 475–476, https://doi.org/10.1038/nclimate3332, 2017.
Brady, N. C. and Weil, R. R.: The nature and properties of soils, in: 12th Edn., Prentice Hall, Upper Saddle River, NJ, 881 pp., ISBN 978-0-13-852444-9, 1999.
Breiman, L.: Random Forests, Mach. Learn., 45, 5–32, https://doi.org/10.1023/a:1010933404324, 2001.
Carvalhais, N., Forkel, M., Khomik, M., Bellarby, J., Jung, M., Migliavacca, M., Mu, M., Saatchi, S., Santoro, M., Thurner, M., Weber, U., Ahrens, B., Beer, C., Cescatti, A., Randerson, J. T., and Reichstein, M.: Global covariation of carbon turnover times with climate in terrestrial ecosystems, Nature, 514, 213–217, https://doi.org/10.1038/nature13731, 2014.
Chapin, F. S., Matson, P. A., and Vitousek, P. M.: Principles of Terrestrial Ecosystem Ecology, Springer New York, New York, NY, https://doi.org/10.1007/978-1-4419-9504-9, 2011.
Chen, J., Luo, Y., and Sinsabaugh, R. L.: Subsoil carbon loss, Nat. Geosci., 16, 284–285, https://doi.org/10.1038/s41561-023-01164-9, 2023.
Chen, L., Fang, K., Wei, B., Qin, S., Feng, X., Hu, T., Ji, C., and Yang, Y.: Soil carbon persistence governed by plant input and mineral protection at regional and global scales, Ecol. Lett., 24, 1018–1028, https://doi.org/10.1111/ele.13723, 2021.
Chen, S., Huang, Y., Zou, J., and Shi, Y.: Mean residence time of global topsoil organic carbon depends on temperature, precipitation and soil nitrogen, Global Planet. Change, 100, 99–108, https://doi.org/10.1016/j.gloplacha.2012.10.006, 2013.
Cleveland, C. C. and Townsend, A. R.: Nutrient additions to a tropical rain forest drive substantial soil carbon dioxide losses to the atmosphere, P. Natl. Acad. Sci. USA, 103, 10316–10321, https://doi.org/10.1073/pnas.0600989103, 2006.
Cotrufo, M. F., Ranalli, M. G., Haddix, M. L., Six, J., and Lugato, E.: Soil carbon storage informed by particulate and mineral-associated organic matter, Nat. Geosci., 12, 989–994, https://doi.org/10.1038/s41561-019-0484-6, 2019.
Crowther, T. W., Todd-Brown, K. E. O., Rowe, C. W., Wieder, W. R., Carey, J. C., Machmuller, M. B., Snoek, B. L., Fang, S., Zhou, G., Allison, S. D., Blair, J. M., Bridgham, S. D., Burton, A. J., Carrillo, Y., Reich, P. B., Clark, J. S., Classen, A. T., Dijkstra, F. A., Elberling, B., Emmett, B. A., Estiarte, M., Frey, S. D., Guo, J., Harte, J., Jiang, L., Johnson, B. R., Kröel-Dulay, G., Larsen, K. S., Laudon, H., Lavallee, J. M., Luo, Y., Lupascu, M., Ma, L. N., Marhan, S., Michelsen, A., Mohan, J., Niu, S., Pendall, E., Peñuelas, J., Pfeifer-Meister, L., Poll, C., Reinsch, S., Reynolds, L. L., Schmidt, I. K., Sistla, S., Sokol, N. W., Templer, P. H., Treseder, K. K., Welker, J. M., and Bradford, M. A.: Quantifying global soil carbon losses in response to warming, Nature, 540, 104–108, https://doi.org/10.1038/nature20150, 2016.
Crowther, T. W., Riggs, C., Lind, E. M., Borer, E. T., Seabloom, E. W., Hobbie, S. E., Wubs, J., Adler, P. B., Firn, J., Gherardi, L., Hagenah, N., Hofmockel, K. S., Knops, J. M. H., McCulley, R. L., MacDougall, A. S., Peri, P. L., Prober, S. M., Stevens, C. J., and Routh, D.: Sensitivity of global soil carbon stocks to combined nutrient enrichment, Ecol. Lett., 22, 936–945, https://doi.org/10.1111/ele.13258, 2019a.
Crowther, T. W., van den Hoogen, J., Wan, J., Mayes, M. A., Keiser, A. D., Mo, L., Averill, C., and Maynard, D. S.: The global soil community and its influence on biogeochemistry, Science, 365, eaav0550, https://doi.org/10.1126/science.aav0550, 2019b.
Davidson, E. A. and Janssens, I. A.: Temperature sensitivity of soil carbon decomposition and feedbacks to climate change, Nature, 440, 165–173, https://doi.org/10.1038/nature04514, 2006.
Dinerstein, E., Olson, D., Joshi, A., Vynne, C., Burgess, N. D., Wikramanayake, E., Hahn, N., Palminteri, S., Hedao, P., Noss, R., Hansen, M., Locke, H., Ellis, E. C., Jones, B., Barber, C. V., Hayes, R., Kormos, C., Martin, V., Crist, E., Sechrest, W., Price, L., Baillie, J. E. M., Weeden, D., Suckling, K., Davis, C., Sizer, N., Moore, R., Thau, D., Birch, T., Potapov, P., Turubanova, S., Tyukavina, A., de Souza, N., Pintea, L., Brito, J. C., Llewellyn, O. A., Miller, A. G., Patzelt, A., Ghazanfar, S. A., Timberlake, J., Klöser, H., Shennan-Farpón, Y., Kindt, R., Lillesø, J.-P. B., van Breugel, P., Graudal, L., Voge, M., Al-Shammari, K. F., and Saleem, M.: An Ecoregion-Based Approach to Protecting Half the Terrestrial Realm, BioScience, 67, 534–545, https://doi.org/10.1093/biosci/bix014, 2017.
Doetterl, S., Stevens, A., Six, J., Merckx, R., Van Oost, K., Casanova Pinto, M., Casanova-Katny, A., Muñoz, C., Boudin, M., Zagal Venegas, E., and Boeckx, P.: Soil carbon storage controlled by interactions between geochemistry and climate, Nat. Geosci., 8, 780–783, https://doi.org/10.1038/ngeo2516, 2015.
Doetterl, S., Berhe, A. A., Nadeu, E., Wang, Z., Sommer, M., and Fiener, P.: Erosion, deposition and soil carbon: A review of process-level controls, experimental tools and models to address C cycling in dynamic landscapes, Earth-Sci. Rev., 154, 102–122, https://doi.org/10.1016/j.earscirev.2015.12.005, 2016.
Don, A., Böhme, I. H., Dohrmann, A. B., Poeplau, C., and Tebbe, C. C.: Microbial community composition affects soil organic carbon turnover in mineral soils, Biol. Fert. Soils, 53, 445–456, https://doi.org/10.1007/s00374-017-1198-9, 2017.
Fan, N., Koirala, S., Reichstein, M., Thurner, M., Avitabile, V., Santoro, M., Ahrens, B., Weber, U., and Carvalhais, N.: Apparent ecosystem carbon turnover time: uncertainties and robust features, Earth Syst. Sci. Data, 12, 2517–2536, https://doi.org/10.5194/essd-12-2517-2020, 2020.
Fan, N., Reichstein, M., Koirala, S., Ahrens, B., Mahecha, M. D., and Carvalhais, N.: Global apparent temperature sensitivity of terrestrial carbon turnover modulated by hydrometeorological factors, Nat. Geosci., 15, 989–994, https://doi.org/10.1038/s41561-022-01074-2, 2022.
FAO–UNESCO: Soil map of the world, FAO, Rome, Italy, https://www.fao.org/soils-portal/data-hub/soil-maps-and-databases (last access: 1 January 2025), 1990.
Field, C. B., Barros, V. R., and Intergovernmental Panel on Climate Change (Eds.): Climate change 2014: impacts, adaptation, and vulnerability: Working Group II contribution to the fifth assessment report of the Intergovernmental Panel on Climate Change, Cambridge University Press, New York, NY, p. 1, ISBN 978-1-107-64165-5, 2014.
Friend, A. D., Lucht, W., Rademacher, T. T., Keribin, R., Betts, R., Cadule, P., Ciais, P., Clark, D. B., Dankers, R., Falloon, P. D., Ito, A., Kahana, R., Kleidon, A., Lomas, M. R., Nishina, K., Ostberg, S., Pavlick, R., Peylin, P., Schaphoff, S., Vuichard, N., Warszawski, L., Wiltshire, A., and Woodward, F. I.: Carbon residence time dominates uncertainty in terrestrial vegetation responses to future climate and atmospheric CO2, P. Natl. Acad. Sci. USA, 111, 3280–3285, https://doi.org/10.1073/pnas.1222477110, 2014.
Frostegård, Å., Vick, S. H. W., Lim, N. Y. N., Bakken, L. R., and Shapleigh, J. P.: Linking meta-omics to the kinetics of denitrification intermediates reveals pH-dependent causes of N2O emissions and nitrite accumulation in soil, ISME J., 16, 26–37, https://doi.org/10.1038/s41396-021-01045-2, 2022.
Gale, M. R. and Grigal, D. F.: Vertical root distributions of northern tree species in relation to successional status, Can. J. Forest Res., 17, 829–834, https://doi.org/10.1139/x87-131, 1987.
Giardina, C. P. and Ryan, M. G.: Evidence that decomposition rates of organic carbon in mineral soil do not vary with temperature, Nature, 404, 858–861, https://doi.org/10.1038/35009076, 2000.
Gillabel, J., Cebrian-Lopez, B., Six, J., and Merckx, R.: Experimental evidence for the attenuating effect of SOM protection on temperature sensitivity of SOM decomposition, Glob. Change Biol., 16, 2789–2798, https://doi.org/10.1111/j.1365-2486.2009.02132.x, 2010.
Goovaerts, P.: Geostatistical modelling of uncertainty in soil science, Geoderma, 103, 3–26, https://doi.org/10.1016/S0016-7061(01)00067-2, 2001.
Gower, S. T., Kucharik, C. J., and Norman, J. M.: Direct and Indirect Estimation of Leaf Area Index, fAPAR, and Net Primary Production of Terrestrial Ecosystems, Remote Sens. Environ., 70, 29–51, https://doi.org/10.1016/S0034-4257(99)00056-5, 1999.
Guerrero-Ramírez, N. R., Mommer, L., Freschet, G. T., Iversen, C. M., McCormack, M. L., Kattge, J., Poorter, H., van der Plas, F., Bergmann, J., Kuyper, T. W., York, L. M., Bruelheide, H., Laughlin, D. C., Meier, I. C., Roumet, C., Semchenko, M., Sweeney, C. J., van Ruijven, J., Valverde-Barrantes, O. J., Aubin, I., Catford, J. A., Manning, P., Martin, A., Milla, R., Minden, V., Pausas, J. G., Smith, S. W., Soudzilovskaia, N. A., Ammer, C., Butterfield, B., Craine, J., Cornelissen, J. H. C., de Vries, F. T., Isaac, M. E., Kramer, K., König, C., Lamb, E. G., Onipchenko, V. G., Peñuelas, J., Reich, P. B., Rillig, M. C., Sack, L., Shipley, B., Tedersoo, L., Valladares, F., van Bodegom, P., Weigelt, P., Wright, J. P., and Weigelt, A.: Global root traits (GRooT) database, Global Ecol. Biogeogr., 30, 25–37, https://doi.org/10.1111/geb.13179, 2021.
Guo, M., Yang, L., Zhang, L., Shen, F., Meadows, M. E., and Zhou, C.: Hydrology, vegetation, and soil properties as key drivers of soil organic carbon in coastal wetlands: A high-resolution study, Environmental Science and Ecotechnology, 23, 100482, https://doi.org/10.1016/j.ese.2024.100482, 2025.
Han, D., Hu, Z., Wang, X., Wang, T., Chen, A., Weng, Q., Liang, M., Zeng, X., Cao, R., Di, K., Luo, D., Zhang, G., Yang, Y., He, H., Fan, J., and Yu, G.: Shift in controlling factors of carbon stocks across biomes on the Qinghai-Tibetan Plateau, Environ. Res. Lett., 17, 074016, https://doi.org/10.1088/1748-9326/ac78f5, 2022.
He, Y., Trumbore, S. E., Torn, M. S., Harden, J. W., Vaughn, L. J. S., Allison, S. D., and Randerson, J. T.: Radiocarbon constraints imply reduced carbon uptake by soils during the 21st century, Science, 353, 1419–1424, https://doi.org/10.1126/science.aad4273, 2016.
Hengl, T., Nussbaum, M., Wright, M. N., Heuvelink, G. B. M., and Gräler, B.: Random forest as a generic framework for predictive modeling of spatial and spatio-temporal variables, PeerJ, 6, e5518, https://doi.org/10.7717/peerj.5518, 2018.
Heuvelink, G. B. M.: Error Propagation in Environmental Modelling with GIS, CRC Press, London, 150 pp., https://doi.org/10.4324/9780203016114, 1998.
Hicks Pries, C., Ryals, R., Zhu, B., Min, K., Cooper, A., Goldsmith, S., Pett-Ridge, J., Torn, M., and Asefaw Berhe, A.: The Deep Soil Organic Carbon Response to Global Change, Annu. Rev. Ecol. Evol. S., 54, 375–401, https://doi.org/10.1146/annurev-ecolsys-102320-085332, 2023.
Hicks Pries, C. E., Castanha, C., Porras, R. C., and Torn, M. S.: The whole-soil carbon flux in response to warming, Science, 355, 1420–1423, https://doi.org/10.1126/science.aal1319, 2017.
Holland, E. A., Post, W. M., Matthews, E. G., Sulzman, J. M., Staufer, R., and Krankina, O. N.: A Global Database of Litterfall Mass and Litter Pool Carbon and Nutrients, 2.150694 MB, https://doi.org/10.3334/ORNLDAAC/1244, 2015.
Hugelius, G., Tarnocai, C., Broll, G., Canadell, J. G., Kuhry, P., and Swanson, D. K.: The Northern Circumpolar Soil Carbon Database: spatially distributed datasets of soil coverage and soil carbon storage in the northern permafrost regions, Earth Syst. Sci. Data, 5, 3–13, https://doi.org/10.5194/essd-5-3-2013, 2013.
Jackson, R. B., Canadell, J., Ehleringer, J. R., Mooney, H. A., Sala, O. E., and Schulze, E. D.: A global analysis of root distributions for terrestrial biomes, Oecologia, 108, 389–411, https://doi.org/10.1007/BF00333714, 1996.
Jia, B., Zhou, G., and Xu, Z.: Forest litterfall and its composition: a new data set of observational data from China, Ecology, 97, 1365–1365, https://doi.org/10.1890/15-1604.1, 2016.
Jia, J., Cao, Z., Liu, C., Zhang, Z., Lin, L., Wang, Y., Haghipour, N., Wacker, L., Bao, H., Dittmar, T., Simpson, M. J., Yang, H., Crowther, T. W., Eglinton, T. I., He, J.-S., and Feng, X.: Climate warming alters subsoil but not topsoil carbon dynamics in alpine grassland, Glob. Change Biol., 25, 4383–4393, https://doi.org/10.1111/gcb.14823, 2019.
Jorgenson, M. T., Romanovsky, V., Harden, J., Shur, Y., O'Donnell, J., Schuur, E. A. G., Kanevskiy, M., and Marchenko, S.: Resilience and vulnerability of permafrost to climate change, Can. J. Forest Res., 40, 1219–1236, https://doi.org/10.1139/X10-060, 2010.
Koven, C. D., Riley, W. J., Subin, Z. M., Tang, J. Y., Torn, M. S., Collins, W. D., Bonan, G. B., Lawrence, D. M., and Swenson, S. C.: The effect of vertically resolved soil biogeochemistry and alternate soil C and N models on C dynamics of CLM4, Biogeosciences, 10, 7109–7131, https://doi.org/10.5194/bg-10-7109-2013, 2013.
Krull, E. S., Baldock, J. A., and Skjemstad, J. O.: Importance of mechanisms and processes of the stabilisation of soil organic matter for modelling carbon turnover, Funct. Plant Biol., 30, 207–222, https://doi.org/10.1071/fp02085, 2003.
Li, D., Niu, S., and Luo, Y.: Global patterns of the dynamics of soil carbon and nitrogen stocks following afforestation: a meta-analysis, New Phytol., 195, 172–181, https://doi.org/10.1111/j.1469-8137.2012.04150.x, 2012.
Liljedahl, A. K., Boike, J., Daanen, R. P., Fedorov, A. N., Frost, G. V., Grosse, G., Hinzman, L. D., Iijma, Y., Jorgenson, J. C., Matveyeva, N., Necsoiu, M., Raynolds, M. K., Romanovsky, V. E., Schulla, J., Tape, K. D., Walker, D. A., Wilson, C. J., Yabuki, H., and Zona, D.: Pan-Arctic ice-wedge degradation in warming permafrost and its influence on tundra hydrology, Nat. Geosci., 9, 312–318, https://doi.org/10.1038/ngeo2674, 2016.
Liu, F., Wu, H., Zhao, Y., Li, D., Yang, J.-L., Song, X., Shi, Z., Zhu, A.-X., and Zhang, G.-L.: Mapping high resolution National Soil Information Grids of China, Sci. Bull., 67, 328–340, https://doi.org/10.1016/j.scib.2021.10.013, 2022.
Luo, Z., Feng, W., Luo, Y., Baldock, J., and Wang, E.: Soil organic carbon dynamics jointly controlled by climate, carbon inputs, soil properties and soil carbon fractions, Glob. Change Biol., 23, 4430–4439, https://doi.org/10.1111/gcb.13767, 2017.
Luo, Z., Wang, G., and Wang, E.: Global subsoil organic carbon turnover times dominantly controlled by soil properties rather than climate, Nat. Commun., 10, 3688, https://doi.org/10.1038/s41467-019-11597-9, 2019.
Lützow, M. v., Kögel-Knabner, I., Ekschmitt, K., Matzner, E., Guggenberger, G., Marschner, B., and Flessa, H.: Stabilization of organic matter in temperate soils: mechanisms and their relevance under different soil conditions – a review, Eur. J. Soil Sci., 57, 426–445, https://doi.org/10.1111/j.1365-2389.2006.00809.x, 2006.
Ma, H., Mo, L., Crowther, T. W., Maynard, D. S., van den Hoogen, J., Stocker, B. D., Terrer, C., and Zohner, C. M.: The global distribution and environmental drivers of aboveground versus belowground plant biomass, Nat. Ecol. Evol., 5, 1110–1122, https://doi.org/10.1038/s41559-021-01485-1, 2021.
Malone, B. P., McBratney, A. B., Minasny, B., and Laslett, G. M.: Mapping continuous depth functions of soil carbon storage and available water capacity, Geoderma, 154, 138–152, https://doi.org/10.1016/j.geoderma.2009.10.007, 2009.
Malone, B. P., McBratney, A. B., and Minasny, B.: Empirical estimates of uncertainty for mapping continuous depth functions of soil attributes, Geoderma, 160, 614–626, https://doi.org/10.1016/j.geoderma.2010.11.013, 2011.
Mathieu, J. A., Hatté, C., Balesdent, J., and Parent, É.: Deep soil carbon dynamics are driven more by soil type than by climate: a worldwide meta-analysis of radiocarbon profiles, Glob. Change Biol., 21, 4278–4292, https://doi.org/10.1111/gcb.13012, 2015.
Meinshausen, N.: Quantile Regression Forests, J. Mach. Learn. Res., 7, 983–999, 2006.
Mishra, U., Hugelius, G., Shelef, E., Yang, Y., Strauss, J., Lupachev, A., Harden, J. W., Jastrow, J. D., Ping, C.-L., Riley, W. J., Schuur, E. A. G., Matamala, R., Siewert, M., Nave, L. E., Koven, C. D., Fuchs, M., Palmtag, J., Kuhry, P., Treat, C. C., Zubrzycki, S., Hoffman, F. M., Elberling, B., Camill, P., Veremeeva, A., and Orr, A.: Spatial heterogeneity and environmental predictors of permafrost region soil organic carbon stocks, Sci. Adv., 7, eaaz5236, https://doi.org/10.1126/sciadv.aaz5236, 2021.
Oleson, K., Lawrence, D., Bonan, G., Drewniak, B., Huang, M., Koven, C., Levis, S., Li, F., Riley, W., Subin, Z., Swenson, S., Thornton, P., Bozbiyik, A., Fisher, R., Heald, C., Kluzek, E., Lamarque, J.-F., Lawrence, P., Leung, L., Lipscomb, W., Muszala, S., Ricciuto, D., Sacks, W., Sun, Y., Tang, J., and Yang, Z.-L.: Technical description of version 4.5 of the Community Land Model (CLM), NCAR, https://doi.org/10.5065/D6RR1W7M, 2013.
Poggio, L., de Sousa, L. M., Batjes, N. H., Heuvelink, G. B. M., Kempen, B., Ribeiro, E., and Rossiter, D.: SoilGrids 2.0: producing soil information for the globe with quantified spatial uncertainty, SOIL, 7, 217–240, https://doi.org/10.5194/soil-7-217-2021, 2021.
Porras, R. C., Hicks Pries, C. E., McFarlane, K. J., Hanson, P. J., and Torn, M. S.: Association with pedogenic iron and aluminum: effects on soil organic carbon storage and stability in four temperate forest soils, Biogeochemistry, 133, 333–345, https://doi.org/10.1007/s10533-017-0337-6, 2017.
Qin, S., Chen, L., Fang, K., Zhang, Q., Wang, J., Liu, F., Yu, J., and Yang, Y.: Temperature sensitivity of SOM decomposition governed by aggregate protection and microbial communities, Sci. Adv., 5, eaau1218, https://doi.org/10.1126/sciadv.aau1218, 2019.
Reichstein, M., Baldocchi, D., Running, S., Tenhunen, J., Valentini, R., Rambal, S., Ourcival, J., Granier, A., Bouriaud, O., Bernhofer, C., and Gruenwald, T.: Validation Effort of MODIS LAI/GPP/NPP Products at FLUXNET Sites, in: AGU Fall Meeting, https://ui.adsabs.harvard.edu/abs/2002AGUFM.B61B0728R (last access: 1 January 2025), 2002.
Rousk, J., Bååth, E., Brookes, P. C., Lauber, C. L., Lozupone, C., Caporaso, J. G., Knight, R., and Fierer, N.: Soil bacterial and fungal communities across a pH gradient in an arable soil, ISME J., 4, 1340–1351, https://doi.org/10.1038/ismej.2010.58, 2010.
Rumpel, C. and Kögel-Knabner, I.: Deep soil organic matter – a key but poorly understood component of terrestrial C cycle, Plant Soil, 338, 143–158, https://doi.org/10.1007/s11104-010-0391-5, 2011.
Running, S. and Zhao, M.: MOD17A3HGF MODIS/Terra Net Primary Production Gap-Filled Yearly L4 Global 500 m SIN Grid V006, https://doi.org/10.5067/MODIS/MOD17A3HGF.006, 2019.
Schenk, H. J. and Jackson, R. B.: The Global Biogeography of Roots, Ecol. Monogr., 72, 311–328, https://doi.org/10.1890/0012-9615(2002)072[0311:TGBOR]2.0.CO;2, 2002.
Schenk, H. J. and Jackson, R. B.: Mapping the global distribution of deep roots in relation to climate and soil characteristics, Geoderma, 126, 129–140, https://doi.org/10.1016/j.geoderma.2004.11.018, 2005.
Schimel, D. S.: Terrestrial ecosystems and the carbon cycle, Glob. Change Biol., 1, 77–91, https://doi.org/10.1111/j.1365-2486.1995.tb00008.x, 1995.
Schimel, D. S., Braswell, B. H., Holland, E. A., McKeown, R., Ojima, D. S., Painter, T. H., Parton, W. J., and Townsend, A. R.: Climatic, edaphic, and biotic controls over storage and turnover of carbon in soils, Global Biogeochem. Cy., 8, 279–293, https://doi.org/10.1029/94GB00993, 1994.
Schmidinger, J. and Heuvelink, G. B. M.: Validation of uncertainty predictions in digital soil mapping, Geoderma, 437, 116585, https://doi.org/10.1016/j.geoderma.2023.116585, 2023.
Schmidt, M. W. I., Torn, M. S., Abiven, S., Dittmar, T., Guggenberger, G., Janssens, I. A., Kleber, M., Kögel-Knabner, I., Lehmann, J., Manning, D. A. C., Nannipieri, P., Rasse, D. P., Weiner, S., and Trumbore, S. E.: Persistence of soil organic matter as an ecosystem property, Nature, 478, 49–56, https://doi.org/10.1038/nature10386, 2011.
Schuur, E. A. G., Bockheim, J., Canadell, J. G., Euskirchen, E., Field, C. B., Goryachkin, S. V., Hagemann, S., Kuhry, P., Lafleur, P. M., Lee, H., Mazhitova, G., Nelson, F. E., Rinke, A., Romanovsky, V. E., Shiklomanov, N., Tarnocai, C., Venevsky, S., Vogel, J. G., and Zimov, S. A.: Vulnerability of Permafrost Carbon to Climate Change: Implications for the Global Carbon Cycle, BioScience, 58, 701–714, https://doi.org/10.1641/B580807, 2008.
Shi, Y., Tang, X., Yu, P., Xu, L., Chen, G., Cao, L., Song, C., Cai, C., and Li, J.: Subsoil organic carbon turnover is dominantly controlled by soil properties in grasslands across China, CATENA, 207, 105654, https://doi.org/10.1016/j.catena.2021.105654, 2021.
Shi, Z., Allison, S. D., He, Y., Levine, P. A., Hoyt, A. M., Beem-Miller, J., Zhu, Q., Wieder, W. R., Trumbore, S., and Randerson, J. T.: The age distribution of global soil carbon inferred from radiocarbon measurements, Nat. Geosci., 13, 555–559, https://doi.org/10.1038/s41561-020-0596-z, 2020.
Sierra, C. A., Müller, M., Metzler, H., Manzoni, S., and Trumbore, S. E.: The muddle of ages, turnover, transit, and residence times in the carbon cycle, Glob. Change Biol., 23, 1763–1773, https://doi.org/10.1111/gcb.13556, 2017.
Sierra, C. A., Ahrens, B., Bolinder, M. A., Braakhekke, M. C., von Fromm, S., Kätterer, T., Luo, Z., Parvin, N., and Wang, G.: Carbon sequestration in the subsoil and the time required to stabilize carbon for climate change mitigation, Glob. Change Biol., 30, e17153, https://doi.org/10.1111/gcb.17153, 2024.
Six, J. and Jastrow, J.: Organic Matter Turnover, in: Encyclopedia of Soil Science, Marcel Dekker, New York, 936–942, ISBN 9780429110757, 2002.
Slessarev, E. W., Lin, Y., Bingham, N. L., Johnson, J. E., Dai, Y., Schimel, J. P., and Chadwick, O. A.: Water balance creates a threshold in soil pH at the global scale, Nature, 540, 567–569, https://doi.org/10.1038/nature20139, 2016.
Slot, M. and Winter, K.: The Effects of Rising Temperature on the Ecophysiology of Tropical Forest Trees, in: Tropical Tree Physiology: Adaptations and Responses in a Changing Environment, edited by: Goldstein, G. and Santiago, L. S., Springer International Publishing, Cham, 385–412, https://doi.org/10.1007/978-3-319-27422-5_18, 2016.
Smith, P., Poch, R. M., Lobb, D. A., Bhattacharyya, R., Alloush, G., Eudoxie, G. D., Anjos, L. H. C., Castellano, M., Ndzana, G. M., Chenu, C., Naidu, R., Vijayanathan, J., Muscolo, A. M., Studdert, G. A., Eugenio, N. R., Calzolari, M. C., Amuri, N., and Hallett, P.: Status of the World's Soils, Annu. Rev. Env. Resour., 49, 73–104, https://doi.org/10.1146/annurev-environ-030323-075629, 2024.
Soong, J. L., Castanha, C., Hicks Pries, C. E., Ofiti, N., Porras, R. C., Riley, W. J., Schmidt, M. W. I., and Torn, M. S.: Five years of whole-soil warming led to loss of subsoil carbon stocks and increased CO2 efflux, Sci. Adv., 7, eabd1343, https://doi.org/10.1126/sciadv.abd1343, 2021.
Spawn, S. A., Sullivan, C. C., Lark, T. J., and Gibbs, H. K.: Harmonized global maps of above and belowground biomass carbon density in the year 2010, Sci. Data, 7, 112, https://doi.org/10.1038/s41597-020-0444-4, 2020.
Todd-Brown, K. E. O., Randerson, J. T., Post, W. M., Hoffman, F. M., Tarnocai, C., Schuur, E. A. G., and Allison, S. D.: Causes of variation in soil carbon simulations from CMIP5 Earth system models and comparison with observations, Biogeosciences, 10, 1717–1736, https://doi.org/10.5194/bg-10-1717-2013, 2013.
Torn, M. S., Trumbore, S. E., Chadwick, O. A., Vitousek, P. M., and Hendricks, D. M.: Mineral control of soil organic carbon storage and turnover, Nature, 389, 170–173, https://doi.org/10.1038/38260, 1997.
Torn, M. S., Swanston, C. W., Castanha, C., and Trumbore, S. E.: Storage and Turnover of Organic Matter in Soil, in: Biophysico-Chemical Processes Involving Natural Nonliving Organic Matter in Environmental Systems, John Wiley & Sons, Ltd, 219–272, https://doi.org/10.1002/9780470494950.ch6, 2009.
Tumber-Dávila, S. J., Schenk, H. J., Du, E., and Jackson, R. B.: Plant sizes and shapes above and belowground and their interactions with climate, New Phytol., 235, 1032–1056, https://doi.org/10.1111/nph.18031, 2022.
van den Hoogen, J., Geisen, S., Routh, D., Ferris, H., Traunspurger, W., Wardle, D. A., de Goede, R. G. M., Adams, B. J., Ahmad, W., Andriuzzi, W. S., Bardgett, R. D., Bonkowski, M., Campos-Herrera, R., Cares, J. E., Caruso, T., de Brito Caixeta, L., Chen, X., Costa, S. R., Creamer, R., Mauro da Cunha Castro, J., Dam, M., Djigal, D., Escuer, M., Griffiths, B. S., Gutiérrez, C., Hohberg, K., Kalinkina, D., Kardol, P., Kergunteuil, A., Korthals, G., Krashevska, V., Kudrin, A. A., Li, Q., Liang, W., Magilton, M., Marais, M., Martín, J. A. R., Matveeva, E., Mayad, E. H., Mulder, C., Mullin, P., Neilson, R., Nguyen, T. A. D., Nielsen, U. N., Okada, H., Rius, J. E. P., Pan, K., Peneva, V., Pellissier, L., Carlos Pereira da Silva, J., Pitteloud, C., Powers, T. O., Powers, K., Quist, C. W., Rasmann, S., Moreno, S. S., Scheu, S., Setälä, H., Sushchuk, A., Tiunov, A. V., Trap, J., van der Putten, W., Vestergård, M., Villenave, C., Waeyenberge, L., Wall, D. H., Wilschut, R., Wright, D. G., Yang, J., and Crowther, T. W.: Soil nematode abundance and functional group composition at a global scale, Nature, 572, 194–198, https://doi.org/10.1038/s41586-019-1418-6, 2019.
van Groenigen, K. J., Osenberg, C. W., Terrer, C., Carrillo, Y., Dijkstra, F. A., Heath, J., Nie, M., Pendall, E., Phillips, R. P., and Hungate, B. A.: Faster turnover of new soil carbon inputs under increased atmospheric CO2, Glob. Change Biol., 23, 4420–4429, https://doi.org/10.1111/gcb.13752, 2017.
Varney, R. M., Chadburn, S. E., Burke, E. J., and Cox, P. M.: Evaluation of soil carbon simulation in CMIP6 Earth system models, Biogeosciences, 19, 4671–4704, https://doi.org/10.5194/bg-19-4671-2022, 2022.
Viscarra Rossel, R. A., Lee, J., Behrens, T., Luo, Z., Baldock, J., and Richards, A.: Continental-scale soil carbon composition and vulnerability modulated by regional environmental controls, Nat. Geosci., 12, 547–552, https://doi.org/10.1038/s41561-019-0373-z, 2019.
Wadoux, A. M. J. C.: Using deep learning for multivariate mapping of soil with quantified uncertainty, Geoderma, 351, 59–70, https://doi.org/10.1016/j.geoderma.2019.05.012, 2019.
Wang, J., Sun, J., Xia, J., He, N., Li, M., and Niu, S.: Soil and vegetation carbon turnover times from tropical to boreal forests, Funct. Ecol., 32, 71–82, https://doi.org/10.1111/1365-2435.12914, 2018.
Wright, M. N. and Ziegler, A.: ranger: A Fast Implementation of Random Forests for High Dimensional Data in C++ and R, J. Stat. Softw., 77, 1–17, https://doi.org/10.18637/jss.v077.i01, 2017.
Wu, D., Liu, D., Wang, T., Ding, J., He, Y., Ciais, P., Zhang, G., and Piao, S.: Carbon turnover times shape topsoil carbon difference between Tibetan Plateau and Arctic tundra, Sci. Bull., 66, 1698–1704, https://doi.org/10.1016/j.scib.2021.04.019, 2021.
Xiang, D., Wang, G., Tian, J., and Li, W.: Global patterns and edaphic-climatic controls of soil carbon decomposition kinetics predicted from incubation experiments, Nat. Commun., 14, 2171, https://doi.org/10.1038/s41467-023-37900-3, 2023.
Xiao, L., Wang, G., Wang, M., Zhang, S., Sierra, C. A., Guo, X., Chang, J., Shi, Z., and Luo, Z.: Younger carbon dominates global soil carbon efflux, Glob. Change Biol., 28, 5587–5599, https://doi.org/10.1111/gcb.16311, 2022.
Xiao, L., Wang, G., Chang, J., Chen, Y., Guo, X., Mao, X., Wang, M., Zhang, S., Shi, Z., Luo, Y., Cheng, L., Yu, K., Mo, F., and Luo, Z.: Global depth distribution of belowground net primary productivity and its drivers, Global Ecol. Biogeogr., 32, 1435–1451, https://doi.org/10.1111/geb.13705, 2023.
Yang, S., Jansen, B., Absalah, S., Kalbitz, K., Chunga Castro, F. O., and Cammeraat, E. L. H.: Soil organic carbon content and mineralization controlled by the composition, origin and molecular diversity of organic matter: A study in tropical alpine grasslands, Soil Till. Res., 215, 105203, https://doi.org/10.1016/j.still.2021.105203, 2022.
Zeng, X.: Global Vegetation Root Distribution for Land Modeling, J. Hydrometeorol., 2, 525–530, https://doi.org/10.1175/1525-7541(2001)002<0525:GVRDFL>2.0.CO;2, 2001.
Zhang, G., Wan, Q., Zhang, F., Wu, K., Cai, C., Zhang, M., Li, D., Zhao, Y., and Yang, J.: Criteria for establishment of soil family and soil series in Chinese Soil Taxonomy, Acta Pedologica Sinica, 50, 826–834, https://doi.org/10.11766/trxb201303180124, 2013.
Zhang, L.: Global maps of top- and subsoil organic carbon turnover times, Zenodo [data set], https://doi.org/10.5281/zenodo.14560239, 2025a.
Zhang, L.: Code for paper “Mapping global distributions, environmental controls, and uncertainties of apparent topsoil and subsoil organic carbon turnover times”, Zenodo [code], https://doi.org/10.5281/zenodo.15636310, 2025b. (code available at: https://github.com/leizhang-geo/global_soil_carbon_turnover_time.git, last access: 11 June 2025)
Zhang, L., Yang, L., Ma, T., Shen, F., Cai, Y., and Zhou, C.: A self-training semi-supervised machine learning method for predictive mapping of soil classes with limited sample data, Geoderma, 384, 114809, https://doi.org/10.1016/j.geoderma.2020.114809, 2021.
Zhou, Z., Sun, O. J., Huang, J., Li, L., Liu, P., and Han, X.: Soil carbon and nitrogen stores and storage potential as affected by land-use in an agro-pastoral ecotone of northern China, Biogeochemistry, 82, 127–138, https://doi.org/10.1007/s10533-006-9058-y, 2007.
Zosso, C. U., Ofiti, N. O. E., Torn, M. S., Wiesenberg, G. L. B., and Schmidt, M. W. I.: Rapid loss of complex polymers and pyrogenic carbon in subsoils under whole-soil warming, Nat. Geosci., 16, 344–348, https://doi.org/10.1038/s41561-023-01142-1, 2023.