the Creative Commons Attribution 4.0 License.
the Creative Commons Attribution 4.0 License.
 | 12 Jun 2025
WetCH4: a machine-learning-based upscaling of methane fluxes of northern wetlands during 2016–2022
Qing Ying
Benjamin Poulter
Jennifer D. Watts
Kyle A. Arndt
Anna-Maria Virkkala
Lori Bruhwiler
Youmi Oh
Brendan M. Rogers
Susan M. Natali
Hilary Sullivan
Amanda Armstrong
Eric J. Ward
Luke D. Schiferl
Clayton D. Elder
Olli Peltola
Annett Bartsch
Ankur R. Desai
Eugénie Euskirchen
Mathias Göckede
Bernhard Lehner
Mats B. Nilsson
Matthias Peichl
Oliver Sonnentag
Eeva-Stiina Tuittila
Torsten Sachs
Aram Kalhori
Masahito Ueyama
Wetlands are the largest natural source of methane (CH4) emissions globally. Northern wetlands (>45° N), accounting for 42 % of global wetland area, are increasingly vulnerable to carbon loss, especially as CH4 emissions may accelerate under intensified high-latitude warming. However, the magnitude and spatial patterns of high-latitude CH4 emissions remain relatively uncertain. Here, we present estimates of daily CH4 fluxes obtained using a new machine learning-based wetland CH4 upscaling framework (WetCH4) that combines the most complete database of eddy-covariance (EC) observations available to date with satellite remote-sensing-informed observations of environmental conditions at 10 km resolution. The most important predictor variables included near-surface soil temperatures (top 40 cm), vegetation spectral reflectance, and soil moisture. Our results, modeled from 138 site years across 26 sites, had relatively strong predictive skill, with a mean R2 of 0.51 and 0.70 and a mean absolute error (MAE) of 30 and 27 nmol m−2 s−1 for daily and monthly fluxes, respectively. Based on the model results, we estimated an annual average of 22.8±2.4 Tg CH4 yr−1 for the northern wetland region (2016–2022), and total budgets ranged from 15.7 to 51.6 Tg CH4 yr−1, depending on wetland map extents. Although 88 % of the estimated CH4 budget occurred during the May–October period, a considerable amount (2.6±0.3 Tg CH4) occurred during winter. Regionally, the Western Siberian wetlands accounted for a majority (51 %) of the interannual variation in domain CH4 emissions. Overall, our results provide valuable new high-spatiotemporal-resolution information on the wetland emissions in the high-latitude carbon cycle. However, many key uncertainties remain, including those driven by wetland extent maps and soil moisture products and the incomplete spatial and temporal representativeness in the existing CH4 flux database; e.g., only 23 % of the sites operate outside of summer months, and flux towers do not exist or are greatly limited in many wetland regions. These uncertainties will need to be addressed by the science community to remove the bottlenecks currently limiting progress in CH4 detection and monitoring. The dataset can be found at https://doi.org/10.5281/zenodo.10802153 (Ying et al., 2024).
- Article
(6773 KB) - Full-text XML
-
Supplement
(7494 KB) - BibTeX
- EndNote


Methane (CH4) is the second most important greenhouse gas after carbon dioxide (CO2) and has contributed to around one-third of anthropogenic warming (IPCC, 2024). Wetlands are the largest natural source of CH4 emissions. Northern freshwater wetlands (>45° N) account for roughly 40 % of global wetland area (ranging from 1.3×10⁶ to 8.7×10⁶ km2; Zhang et al., 2021), yet the amount of CH4 emissions from this region is highly uncertain – currently estimated to be 22–49.5 Tg CH4 yr−1 (Aydin et al., 2011; Baray et al., 2021; Heimann, 2011; Kirschke et al., 2013; Peltola et al., 2019; Saunois et al., 2020; Treat et al., 2018; Watts et al., 2023). The uncertainties in the estimates of wetland CH4 emissions are primarily attributed to challenges in mapping vegetated wetlands versus open water, leading to double-counting (Thornton et al., 2016); seasonal wetland dynamics; and uncertainties in estimates on flux rates.
Characterized by nutrient, moisture, and hydrodynamic conditions, northern freshwater wetlands are classified as wet tundra in treeless permafrost areas, peat-forming bogs and fens in boreal and temperate biomes, and permafrost bogs (Kuhn et al., 2021; Olefeldt et al., 2021). Bogs were estimated to cover the largest area (1.38×10⁶–2.41×10⁶ km2) in the northern high latitudes, followed by fens (0.76×10⁶–1.14×10⁶ km2) and wet tundra (0.31×10⁶–0.53×10⁶ km2) (Olefeldt et al., 2021). Climate change poses significant threats to these wetlands, affecting their extent and the duration of conditions suitable for wetland formation in permafrost zones (Avis et al., 2011). The rates of CH4 emissions may increase quickly because of intensified warming at the northern high latitudes (Masson-Delmotte et al., 2021; Rawlins et al., 2010; Rößger et al., 2022; Walsh, 2014; Zhang et al., 2023).
Reflecting the CH4 response to warming, northern wetlands may account for a high portion (∼78.5 %) of the global surface emission anomaly of CH4 in 2020 relative to 2019 (6.0±2.3 Tg CH4 yr−1) (Peng et al., 2022; Zhang et al., 2023). This is concerning, as the responses of high-latitude CH4 emissions to a warming and possibly wetting climate could produce a positive carbon–climate feedback (McGuire et al., 2009; Natali et al., 2019). However, the ability of models to account for and predict the spatiotemporal variability in high-latitude wetland CH4 emission rates remains very limited (Treat et al., 2024).
Field observations of gas fluxes typically measure CH4 exchange between the land and atmosphere at sub-meter to ecosystem (hundreds of meters to kilometers) scales (Bansal et al., 2023; Chu et al., 2021). Tower eddy-covariance (EC) methods provide near-continuous measurements over ecosystem-scale footprints (5×10³–100×103 m2), the size of which matches fine- to medium-resolution satellite remote sensing. Typical EC measurement system records include carbon, water, and energy fluxes along with environmental conditions at half-hourly intervals. Long-term EC datasets can support the analysis of daily, monthly, seasonal, or interannual patterns and drivers of carbon fluxes (Baldocchi, 2003). Chambers can also measure CH4 fluxes, although at sub-meter resolution and with low spatial coverage (Bansal et al., 2023; Kuhn et al., 2021). Most chamber studies have a limited temporal sampling period. To avoid footprint disagreement between EC and chamber measurement techniques, we focused on EC-based CH4 upscaling in this study.
Data-driven upscaling uses empirical models (Bodesheim et al., 2018; Jung et al., 2011), including machine learning (ML) approaches, to compute CH4 fluxes. It provides independent estimates to those from process-based models and atmospheric inversions (Bergamaschi et al., 2013; Spahni et al., 2011). These approaches have been used to estimate CH4 fluxes from various ecosystems, such as northern wetlands (Peltola et al., 2019; Virkkala et al., 2024; Yuan et al., 2024), global reservoirs (Johnson et al., 2021), and global aquatic ecosystems (Rosentreter et al., 2021).
Two types of methods are generally used for data-driven upscaling. The first uses a look-up table approach and applies emission rates or emission factors via data synthesis to the corresponding land surface areas, or activity data, over the study region. Emission rates from field observations are associated with environmental drivers that have been spatially characterized and are then applied to the land covers with the same environmental drivers. For example, Rosentreter et al. (2021) collected 2601 CH4 flux records measured using various methods through a literature review and characterized emission rates over 15 aquatic ecosystem types to upscale global aquatic CH4 emissions. The study provided estimates of total and per-ecosystem emissions but did not produce spatial distributions and was unable to estimate temporal changes. A similar method was applied for the northern permafrost region, where statistical CH4 flux rates from the Boreal–Arctic Wetland and Lake CH4 Dataset (BAWLD-CH4) were analyzed for emission estimation by wetland type (Kuhn et al., 2021; Ramage et al., 2024). This method favors homogeneous ecosystems and static environments, and the results may be biased for large-scale studies where spatial heterogeneity is prevalent.
Another approach uses ML methods to upscale fluxes (Bodesheim et al., 2018; Tramontana et al., 2016; Yuan et al., 2024). ML models are developed with large training datasets. Generally, ML models can learn from high-dimensional data by optimizing many statistical parameters and identifying variables that are closely associated with spatiotemporally varying CH4 emissions. The efficient computational cost makes it easier to apply the models over large regions at higher spatial resolutions. Among ML methods, decision-tree-based algorithms have been widely used in upscaling for computational efficiency and predictive performance (Beaulieu et al., 2020; Jung et al., 2020; Virkkala et al., 2021; Zhang et al., 2020). Specifically, random forest (RF) algorithms have been utilized in regional to global wetland CH4 upscaling (Davidson et al., 2017; Feron et al., 2024; McNicol et al., 2023; Peltola et al., 2019) due to their robustness and the prevention of overfitting to noise in the input data. For example, Peltola et al. (2019) used RF and EC measurements to upscale monthly CH4 fluxes from the northern wetlands at 0.25–0.5° spatial resolution over the 2013–2014 period.
ML-based upscaling studies usually incorporate information from remote sensing to inform wetland extent, changes in vegetation, and other surface biophysical properties (Davidson et al., 2017; Virkkala et al., 2024; Watts et al., 2014, 2023). For example, recent ML-based large-scale upscaling approaches used the Moderate Resolution Imaging Spectroradiometer (MODIS) land surface temperature (LST) at night, the enhanced vegetation index (EVI), the vegetation canopy height, and ancillary environmental variables from remote-sensing products (McNicol et al., 2023; Ouyang et al., 2023; Peltola et al., 2019). (See Sect. S1 and Table S1 in the Supplement for the detailed predictive variables used in existing ML-based wetland CH4 upscaling products.) However, soil moisture and soil temperature, two controlling factors of wetland CH4 fluxes (Knox et al., 2021; Yuan et al., 2022), were missing in previous ML-based regional to global upscaling studies. Soil moisture has been identified as one of the important controlling factors for freshwater wetland CH4 fluxes (Euskirchen et al., 2024; Voigt et al., 2023). This is the first ML-based study that incorporates remote-sensing constraints from Soil Moisture Active Passive (SMAP) microwave-sensed soil moisture and MODIS Nadir Bidirectional Reflectance Distribution Function (BRDF)-Adjusted Reflectance (MODIS NBAR) data. Surface reflectance provides information on (1) vegetation properties that affect the production and transport of CH4 to the atmosphere and (2) ecosystem wetness (Alonso et al., 2020; Chen et al., 2013; Entekhabi et al., 2010; Houborg et al., 2007; Murray-Hudson et al., 2015; Wang et al., 2018).
The goal of this study is to develop a scalable framework to upscale daily CH4 fluxes from EC observations to northern-latitude wetlands (>45° N) using the ensemble RF ML approach with a suite of reanalysis and remote-sensing products representing spatiotemporal environmental conditions. Our specific objectives are as follows:
-
compile an updated EC-based CH4 flux dataset that extends the temporal and spatial coverage of the FLUXNET-CH4 database (Delwiche et al., 2021) for the northern high latitudes;
-
build RF models of CH4 fluxes at the site level based on physical variables that are measured in situ, thereby allowing us to prioritize the selection of gridded variables for upscaling, and then build ensemble RF models at the grid level using gridded reanalysis inputs and constraints from satellite remote sensing; and
-
apply grid-level models to produce a 10 km gridded daily distribution of the CH4 flux product for the northern high-latitude wetlands using bootstrapped models and their derived uncertainties (Table S1).
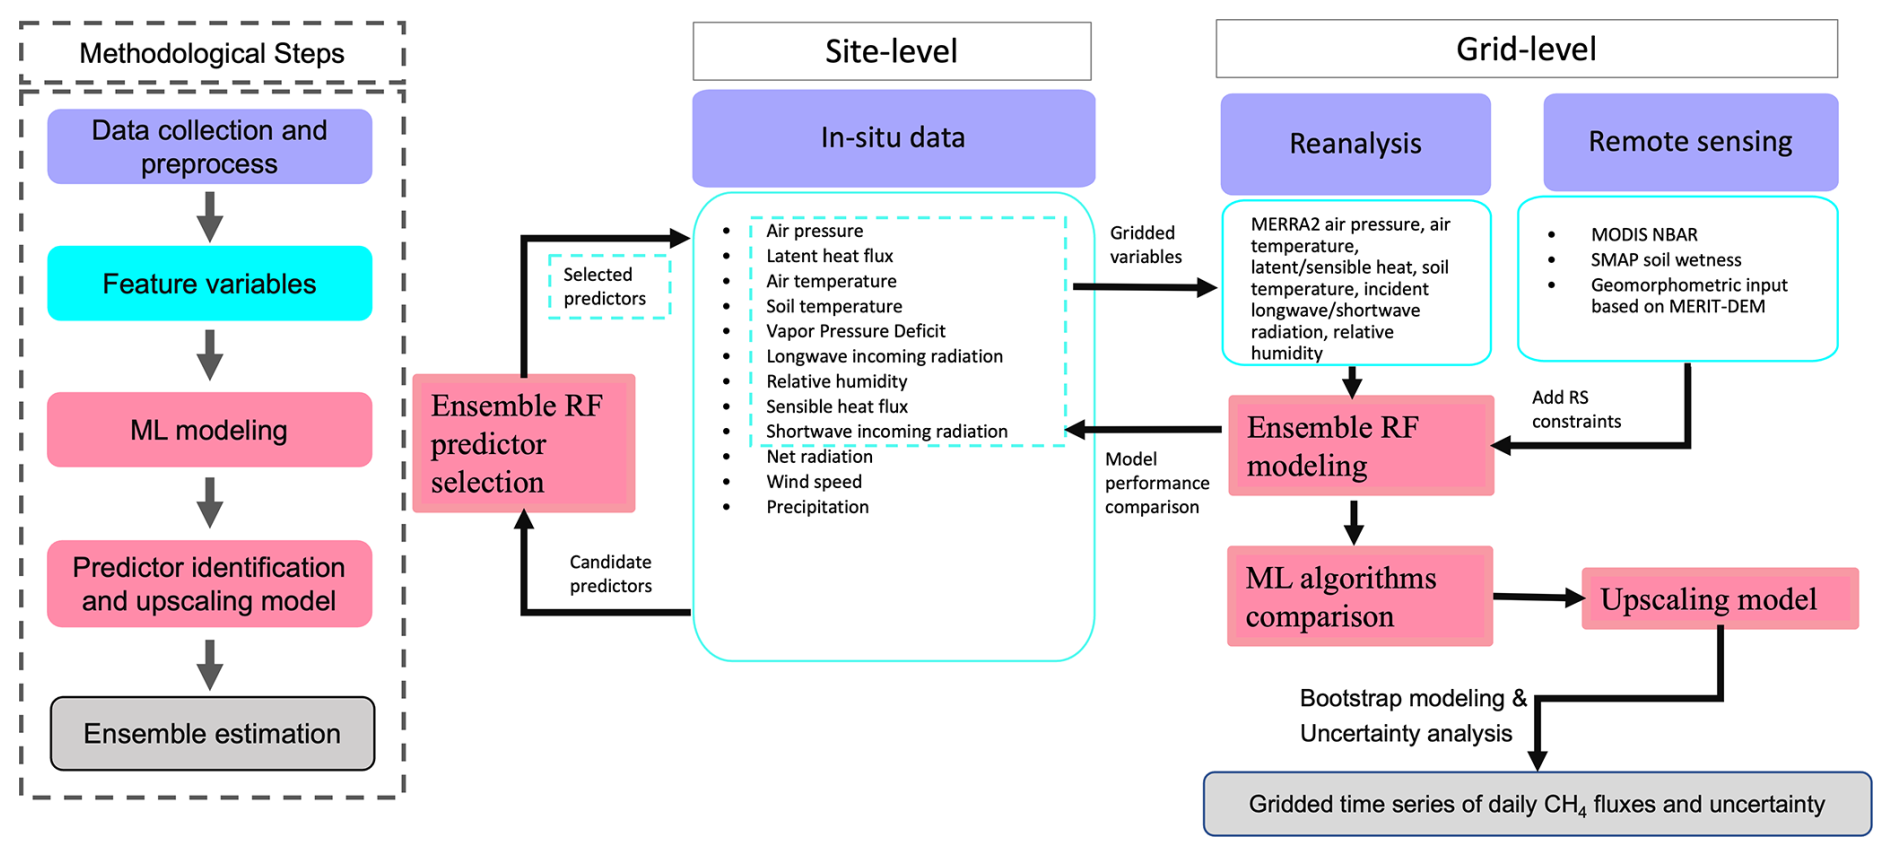
Figure 1Workflow and experimental design: abstract methodological steps are integrated in the dashed box on the left, while a detailed experimental design is described on the right. Colors on the right match the associated step on the left.
2.1 Overview
The scalable framework of upscaling CH4 fluxes from EC observations for wetlands (hereafter referred to as WetCH4), which selects physical predictors at the site level and constructs upscaling models at a grid level, is illustrated in Fig. 1. In situ, reanalysis, and remote-sensing products were compiled as candidate predictors for modeling (Fig. 1, purple boxes; see Sect. 2.2 for details). We first ran a feature selection, which uses ensemble RF models to choose important predictors from an extensive list of in situ variables available from the flux tower sites. Gridded versions of selected site variables were taken from version 2 of the Modern-Era Retrospective analysis for Research and Applications (MERRA-2) reanalysis (Gelaro et al., 2017) to model with RF at the grid level. We then added remote-sensing-based products from MODIS NBAR and SMAP soil wetness, as well as topographic data, to strengthen the model and provide a finer delineation of environmental gradients based on the literature and expert knowledge (Poulter et al., 2023; Sturtevant et al., 2012). The predictive performance of grid-level models with input variables at their native spatial resolution (except for MERRA-2 variables, which were interpolated to 10 km resolution) was then evaluated. We also compared model performance with those from two additional ML algorithms: support vector machine (SVM) and an artificial neural network (ANN) (Fig. 1, pink boxes). The RF algorithm modeled on all gridded input variables gained the highest mean R2 and lowest daily median errors with respect to model predictive performance and was selected for bootstrap modeling and upscaling the 0.098° (∼10 km along the latitudinal length) gridded time series of daily CH4 fluxes and ensemble uncertainty estimation (Fig. 1, gray boxes).
2.2 Data
2.2.1 Eddy-covariance measurements
The base of our EC data collection stems from a publicly available global synthesis coordination of FLUXNET-CH4 (Delwiche et al., 2021; Knox et al., 2019), which includes 79 EC tower sites (42 of which are freshwater wetland sites) and 293 site years of data. FLUXNET-CH4 represents a first compilation of global CH4 fluxes measured by EC towers (Delwiche et al., 2021; Knox et al., 2019), although more EC data exist outside of the network. We collected both daily and half-hourly data from 44 sites in the northern high latitudes (>45° N), accounting for 167 site years as our base dataset, to which we added data from 6 new sites (31 site years) and additional data to 9 existing sites (21 site years) contributed by principal investigators (PIs; Table S2). In total, we assembled data from 50 EC tower sites in northern latitudes (219 site years), of which 33 are from wetlands (155 site years), with 13 wet tundra sites, 11 fens, and 9 bogs. Data entries with missing data in gridded predictors were excluded, including five wetland sites (FI-LOM, DE-SFN, RU-SAM, RU-VRK, and SE-ST1) where data were collected before SMAP data were available. Another two sites (CA-BOU and RU-COK) were excluded after quality control revealed an instrument anomaly that affected the measurements. As a result, daily and half-hourly EC data from the 26 wetland sites were compiled for analysis from 22 sites in FLUXNET-CH4 (of which 8 were sites with updated data to recent years, including US-ATQ, US-BEO, US-BES, US-BRW, US-IVO, US-NGB, US-NGC, and US-UAF) and 4 additional sites using information provided directly by PIs (including CA-ARB, CA-ARF, CA-PB1, and CA-PB2), consisting of 138 site years of data in total and representing the largest high-latitude EC data compilation for CH4 to date (Table S2; see Sect. S2). The sites were distributed among wetland types, including 9 fens, 7 bogs, and 10 wet tundra sites (Fig. 2). RU-CHE and RU-CH2 were two Chersky sites in Eastern Siberian Russia that were located about 600 m from each other to form a paired disturbance experiment. RU-CH2 was a control tower over an undisturbed wetland, whereas RU-CHE was a tower affected by artificial drainage. The aboveground conditions at the two sites were virtually identical, but soil temperature and moisture were different. Drainage caused lower CH4 fluxes at RU-CHE compared to those at RU-CH2. However, the SMAP data could not discern the drainage impact on soil moisture at the RU-CHE site due to a coarser spatial resolution; thus, the RU-CHE site was excluded from grid-level modeling.
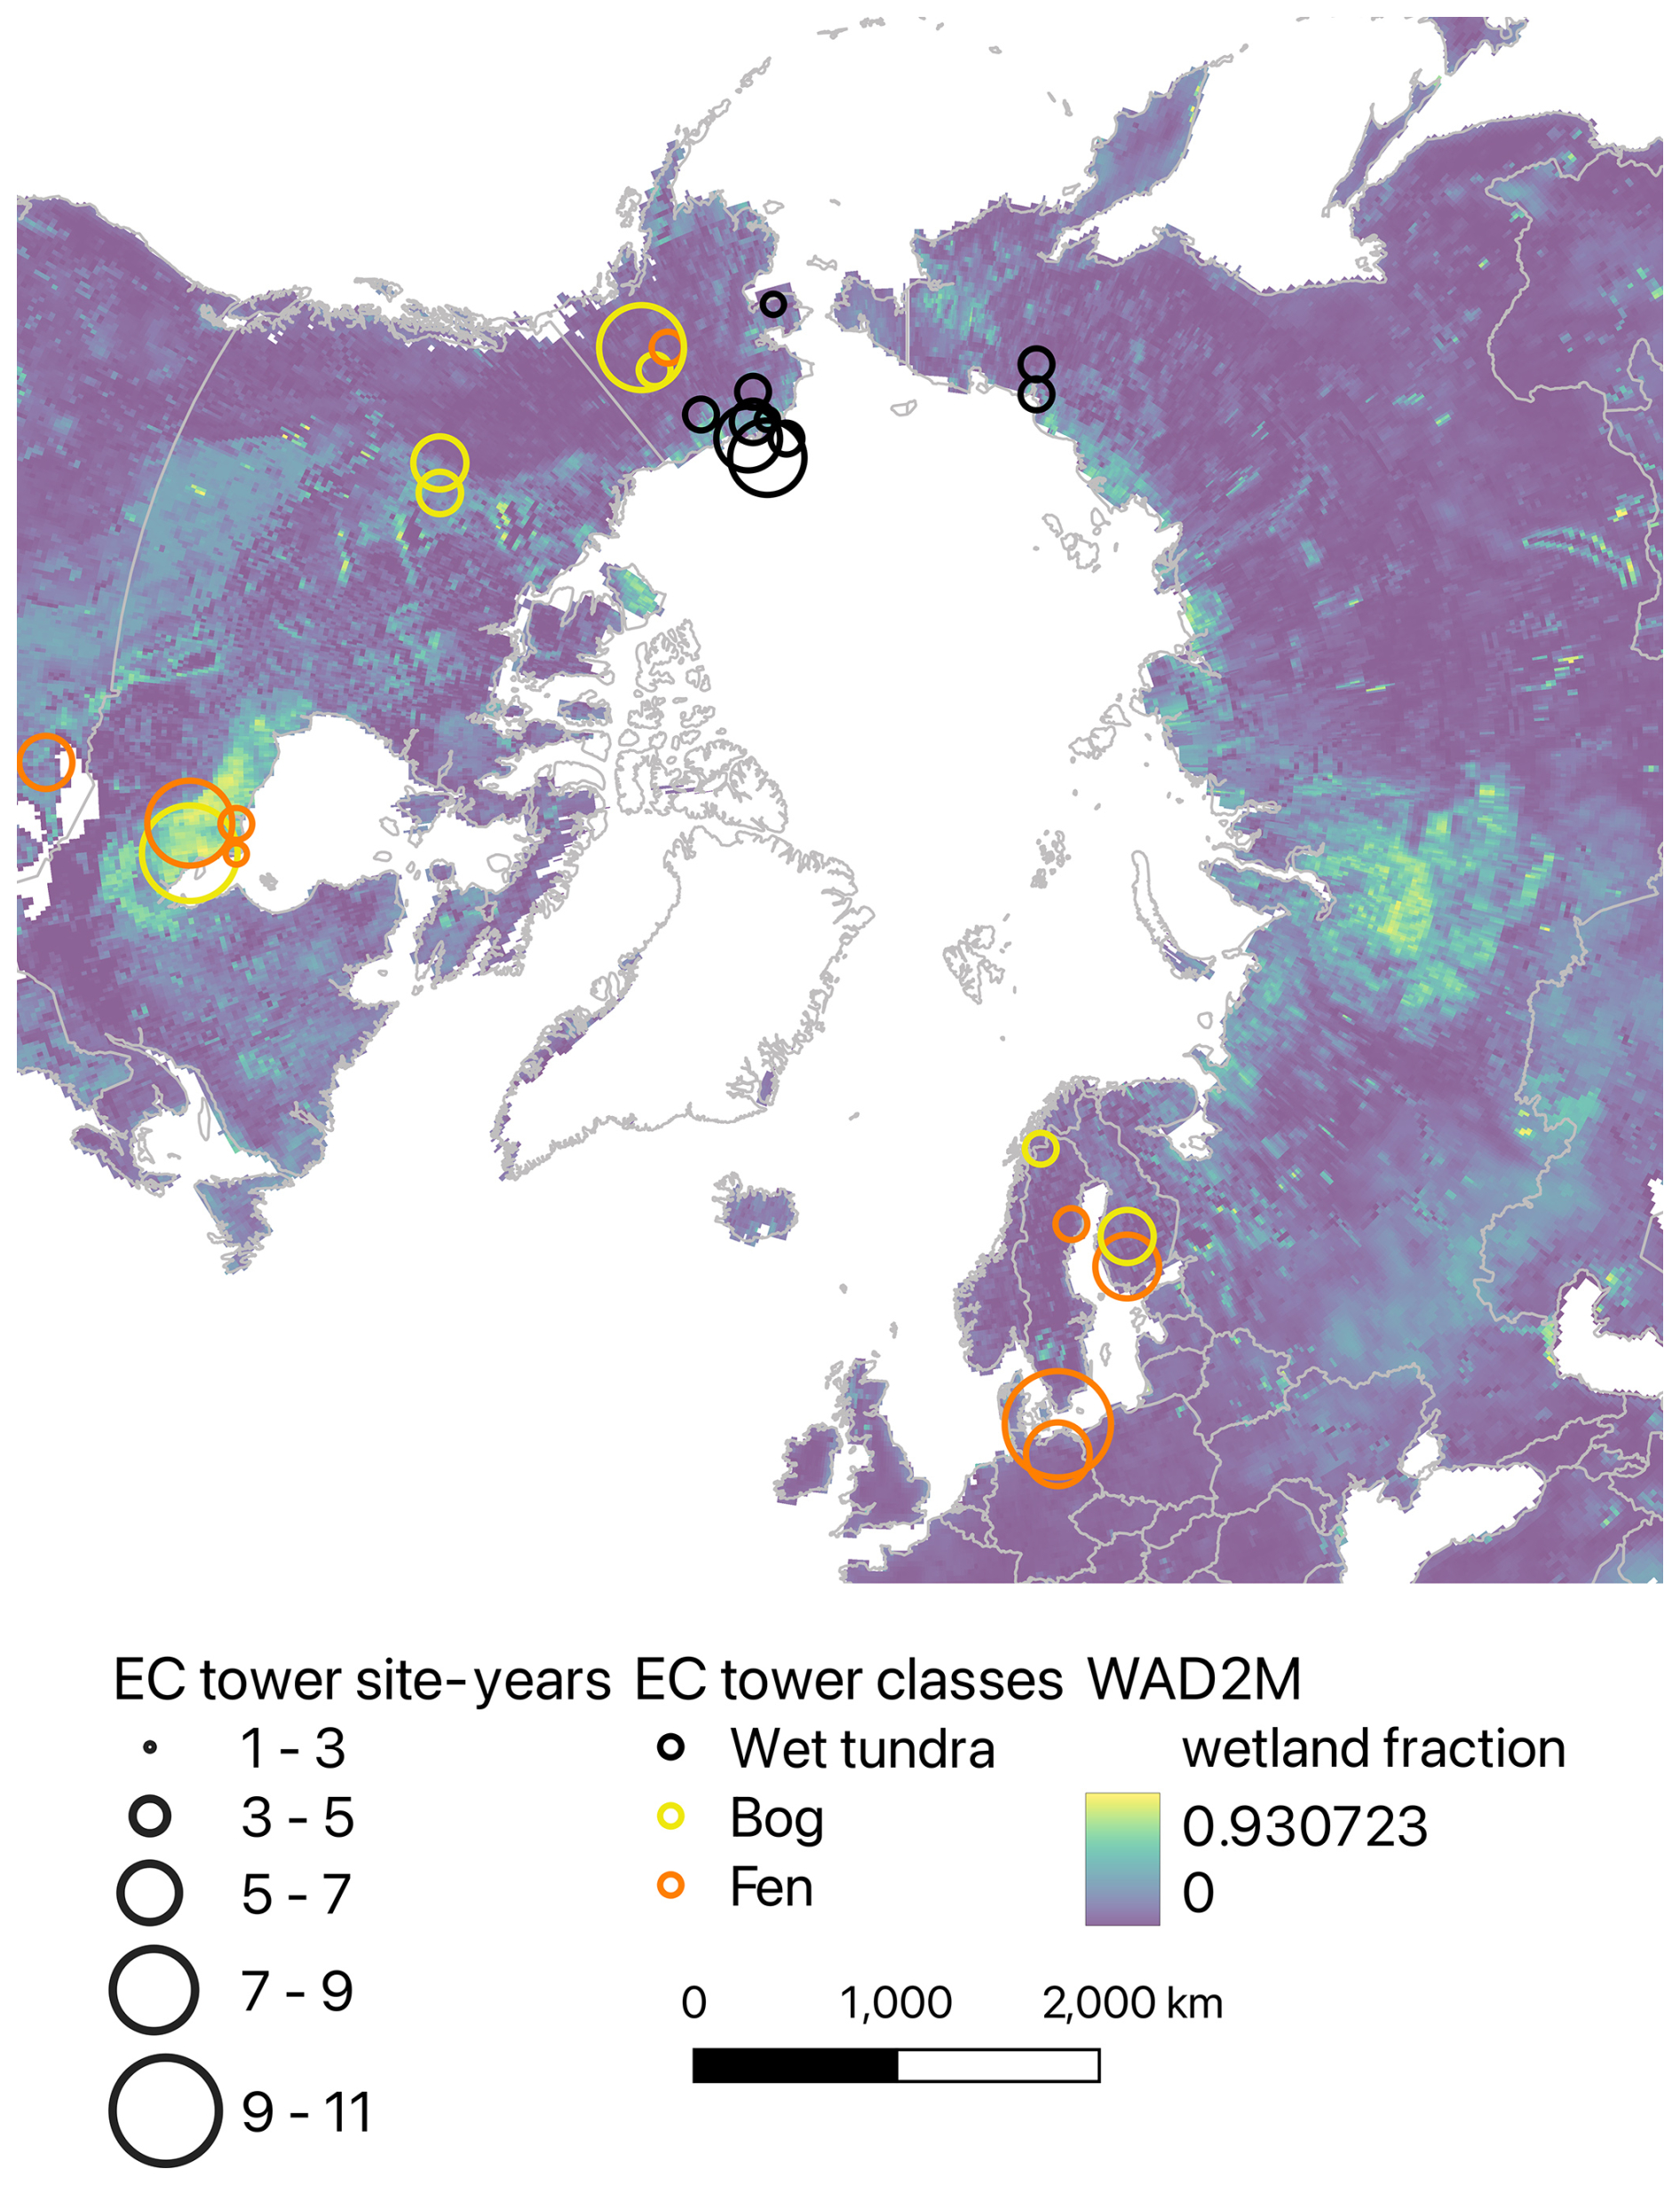
Figure 2Eddy-covariance tower sites: distribution (>45° N), class, and data size (site years) used in WetCH4. Colored circles represent EC tower locations and land cover classes, with wetland sites in cyan (wet tundra), yellow (bog), and orange (fen). The circle sizes represent observation years (n) of available CH4 fluxes at the site (e.g., 1–3 stands for ). The background image shows the estimated maximum annual fractions of wetland cover in 2011–2020 from WAD2M (Zhang et al., 2021).
Half-hourly fluxes acquired from FLUXNET-CH4 were already gap-filled (see Sect. S2; Irvin et al., 2021). Additional half-hourly fluxes acquired from site PIs were not gap-filled; therefore, we performed per-site gap filling following the FLUXNET-CH4 approach (Irvin et al., 2021; Knox et al., 2019). Gap-filled fluxes were temporally consistent and agreed with validation data (mean R2=0.68 and mean RMSE = 6 nmol m−2 s−1; see Sect. S2).
The mean difference in daily mean fluxes between the gap-filled data and the original data converged to −0.2 nmol m−2 s−1 when there were more than 11 half-hourly EC tower observations in a day but showed substantial bias and larger differences when including days with less than 11 half-hourly observations (Fig. S1 in the Supplement). Therefore, daily data entries were only kept when the number of half-hourly EC tower observations per day was greater than 11. All data were retained for four sites where only daily, quality-filtered data were provided by site PIs (Table S2). As a result, we identified 12 784 daily data entries for upscaling models (Table S2), spanning from 2015 to 2021 with seasonal observation distributions of 44.0 % in June–July–August (JJA), 29.0 % in March–April–May (MAM), 24.5 % in September–October–November (SON), and 2.5 % in December–January–February (DJF) (Fig. S2).
Site-level candidate predictors were identified by their known influences on CH4 fluxes at multiday to seasonal scales from field control experiments, in situ flux synthesis, and process-based modeling (Bloom et al., 2010, 2017; Knox et al., 2021; Olefeldt et al., 2013, 2017). Only physical variables measured in situ were considered candidate predictors for site-level modeling. In situ candidate predictors that were gap-filled and available in FLUXNET-CH4 included daily averages of air temperature, soil temperature, air pressure, vapor pressure deficit, relative humidity, latent heat flux, sensible heat flux, longwave incoming radiation, shortwave incoming radiation, net radiation, wind speed, and daily total precipitation (Fig. 1, site-level model solid blue box). We were unable to include water table depth (WTD) or soil water content (SWC) in our site-level model, as they were not available at many sites. However, we explored ML results that included WTD or SWC for a subset of individual sites (36 % of total) where these variables were available (see Sect. S2 for more details).
2.2.2 Reanalysis data and satellite data products
Reanalysis data were used as the gridded input to replace selected predictors at the site level for training the grid-level models and upscaling. These data provided long-term, continuous estimates of nearly all of the candidate predictors of the variables measured in situ (Fig. 1). MERRA-2 is an atmospheric reanalysis of the modern satellite era produced by NASA's Global Modeling and Assimilation Office (Gelaro et al., 2017). We calculated daily means for air pressure, surface air temperature, latent heat flux, sensible heat flux, downward incoming shortwave radiation, downward incoming longwave radiation, and soil temperature at three depths (9.88, 19.52, and 38.59 cm) (Jiao et al., 2023) as well as the relative humidity using the hourly average of surface flux diagnostics, land surface diagnostics, and land surface forcings. The original 0.5°×0.625° resolution data were resampled to 0.5° grids using a bilinear interpolation method in the NASA MERRA-2 web service tool available from the Goddard Earth Sciences Data and Information Services Center (GES DISC). The MERRA-2 data were further bilinearly interpolated from 0.5 to 0.098° grids weighted by the multiple-error-removed improved-terrain digital elevation model (MERIT-DEM) at 90 m resolution that significantly improves elevation estimates in flat terrain over previous DEM products (Yamazaki et al., 2017). Daily time series of the nearest 0.098° grid to each EC location were extracted for grid-level modeling, whereas daily grids were input for the 10 km upscaling products.
To improve the predictive performance of grid-level models, we added remotely sensed biophysical variables, including SMAP soil wetness, MODIS NBAR bands, and topographic data (Fig. 1, Table 1). All remote-sensing products were extracted at daily time steps and their native spatial resolutions at EC tower sites for modeling and were aggregated to 0.098° grids over the study domain for upscaling using Google Earth Engine. We filtered out data gaps in SMAP and MODIS NBAR time series extracted at the native spatial resolution during model training and validation. Gaps in MODIS NBAR were negligible when aggregated from 500 m to 0.098° grids. Gaps in winter SMAP data were filled with zero values to represent frozen soils for upscaling.
Table 1Description of input variables for grid-level upscaling model.
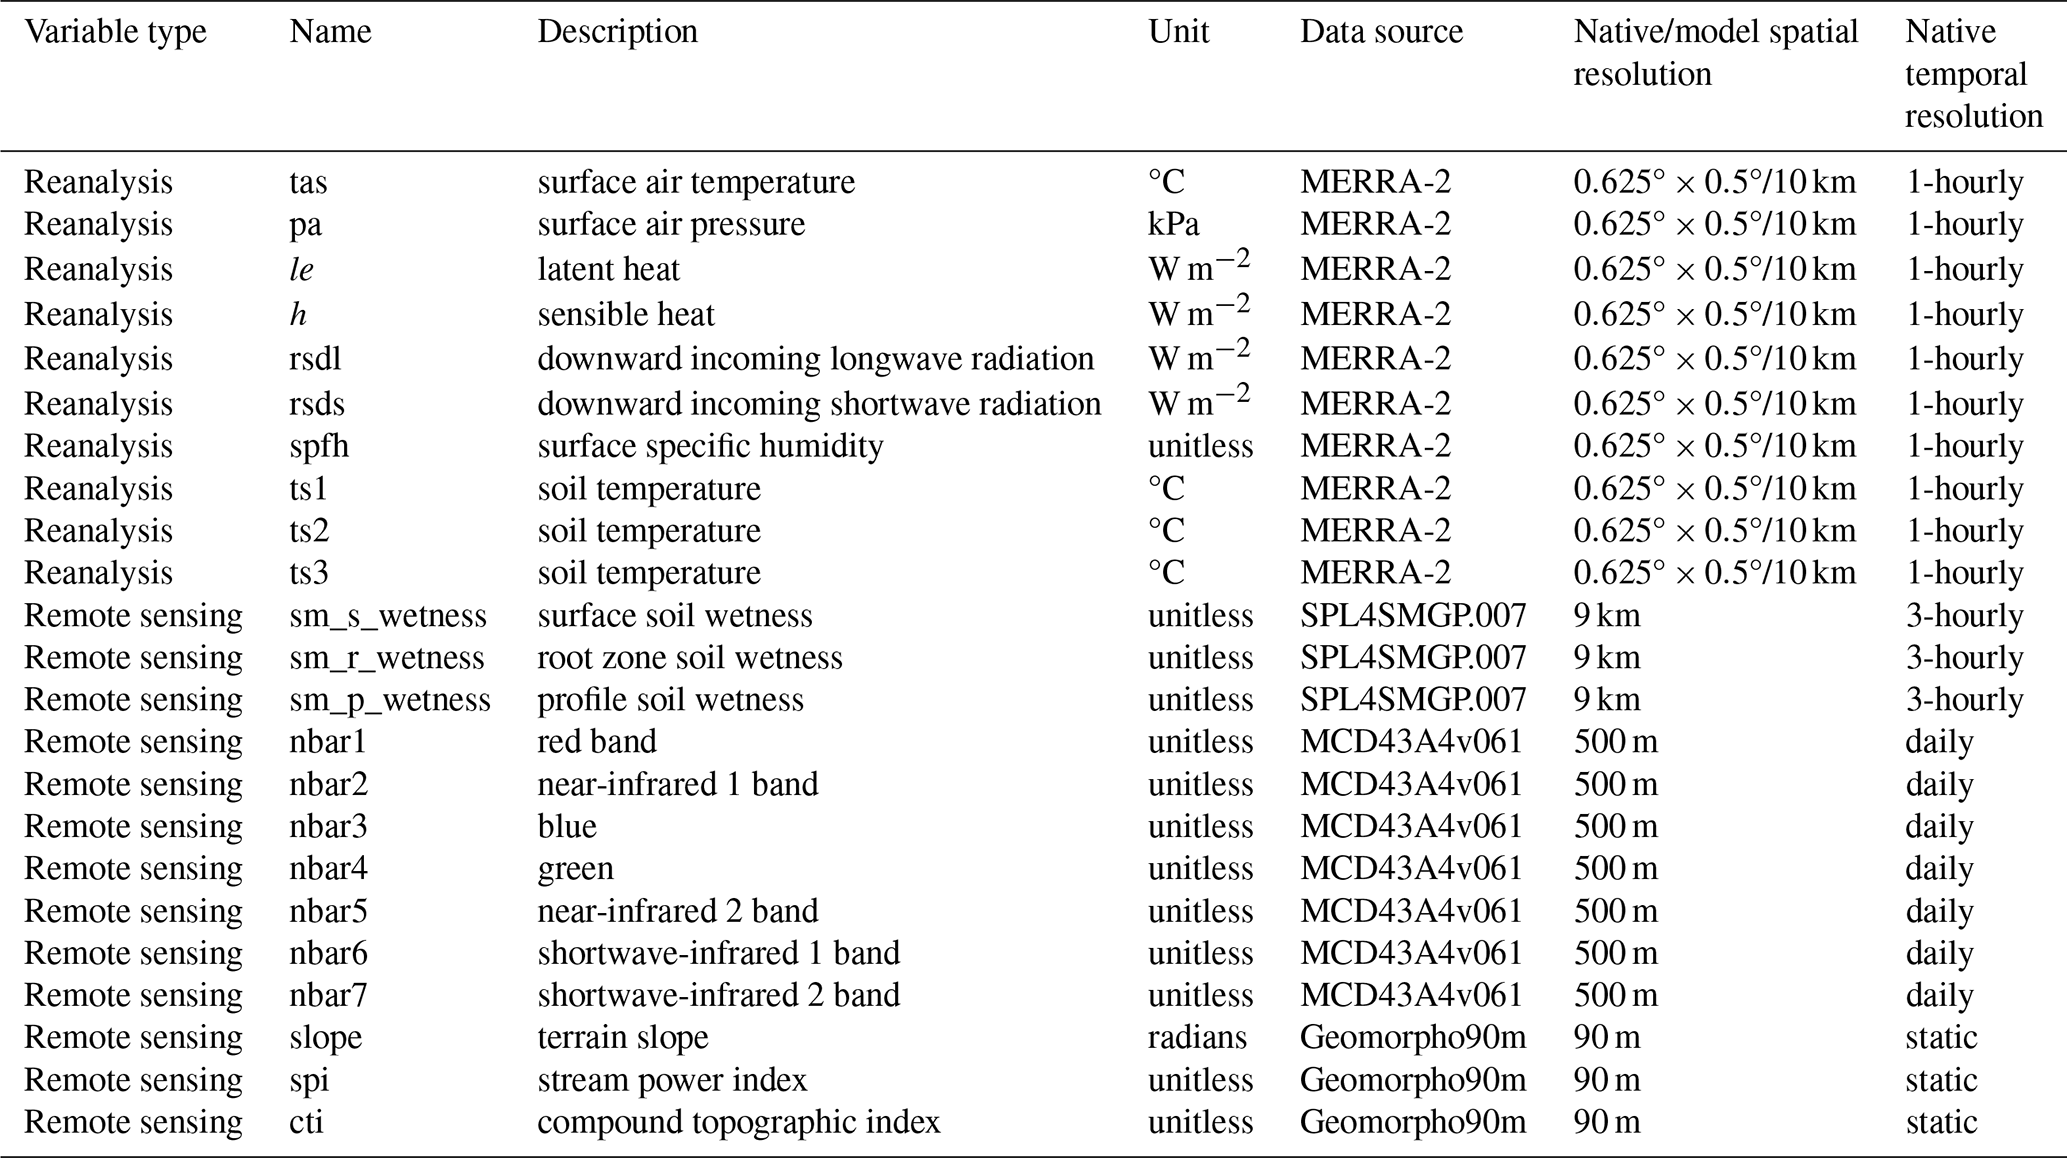
The SMAP soil moisture product is generated using passive-microwave-radiometer-measured brightness temperature merged with estimates from the GEOS Catchment Land Surface and Microwave Radiative Transfer Model in a soil moisture data assimilation system, providing global products of surface and root zone soil moisture (Reichle et al., 2017). For soil moisture, we employed Level-4 daily soil wetness products (SPL4SMGP.007) from the SMAP mission as proxies for water table depth in the grid-level model (Reichle et al., 2017). Surface, root zone, and soil profile wetness are dimensionless variables that indicate relative saturation for top-layer soil (0–5 cm), root zone soil (0–100 cm), and total profile soil (0 cm to model bedrock depth), respectively. These three variables are originally 3-hourly data at 9 km resolution and were converted to daily means.
Static topographic variables were added as additional attributes in the grid-level model. We used the topographic slope and indices that represent the water flow from the MERIT-DEM based on Geomorpho90m (Amatulli et al., 2020). Two topographic indices were applied: the compound topographic index (cti), which is considered a proxy for the long-term soil moisture availability, and the stream power index (spi, https://gee-community-catalog.org/projects/geomorpho90/, last access: 20 March 2023), which reflects the erosive power of the flow and the tendency of gravitational forces to move water downstream. We tested the impact of elevation on model performance in explaining the inter-site variability in CH4 upon the current locations of wetland EC sites (see Sect. S6). However, elevation was not considered an ecologically controlling factor for wetland CH4 fluxes; hence, it was excluded from the input variable importance analysis that ranked the importance of predictors to the prediction accuracy in RF models.
We included MODIS NBAR (MCD43A4v061) products as predictor variables to represent the vegetation productivity in the grid-level model in order to enhance our model predictive performance in vegetated wetlands. The seven NBAR bands (including red, green, and blue bands; two near-infrared bands; and two shortwave-infrared bands) are developed daily at 500 m spatial resolution, using 16 d of Terra and Aqua data to remove view angle effects, and are temporally weighted to the ninth day as the best local solar-noon reflectance (Schaaf et al., 2002; Wang et al., 2018). We did not explicitly include a vegetation productivity variable, as such information is retained in MODIS NBAR, which is used to produce vegetation indices (e.g., EVI) and gross primary production (GPP). Emergent aerenchymous vegetation is another important component in the plant-mediated pathway of CH4 transport, although it is less represented in existing upscaling models (Table S1).
2.3 Machine learning model
2.3.1 General model design
We used an RF regression algorithm to train site-level and grid-level ML models (Kim et al., 2020). RF regression builds an assembly of independent trees, each of which is trained from a random subset of input data and tested against the rest of the data (Breiman, 2001). A tree grows two leaves when a random selection of subset features reduces the mean-squared error (MSE) of predictions after splitting at a leaf node. Each tree is trained on a bootstrap sample of input data. Trees constructed in this way are less correlated in the ensemble. The generalization error converges as the forest grows to a limit to avoid overfitting. Compared to other ML algorithms, RF has been shown to have better accuracy and lower uncertainty (Irvin et al., 2021; Kim et al., 2020). This approach has been previously applied to upscaling CH4 fluxes in wetlands and rice paddies across multiple ecosystems (Davidson et al., 2017; Feron et al., 2024; McNicol et al., 2023; Ouyang et al., 2023; Peltola et al., 2019).
A grid search hyperparameter tuning for daily models was performed before predictor selection. We carried out analyses in Python (version 3.6) with the ensemble RF regressor in the “scikit-learn” package (Pedregosa et al., 2011). With all of the predictors and data, hyperparameters were set after tuning for optimized model performance, including the number of trees (n_estimators = 100), number of variables to consider when looking for the best split (max_features = “sqrt”, meaning the square root of the total number of feature variables), the maximum depth of the tree (max_depth = 10), the minimum number of samples required to split a node (min_sample_split = 10), and the minimum number of samples at a leaf node (min_samples_leaf = 4).
For predictor selection and comparisons between the site-level model using in situ variables and the grid-level model using gridded versions of in situ variables, we built the model across all sites and adopted 5-fold cross-validation and “out-of-bag” scores from ensemble trees to evaluate model performance, because, at this stage, we aimed to find physically reasonable variables from in situ measurements and to compare how the differences in scales and measuring methods between in situ predictors and gridded proxies affect the model-learned temporal variability in CH4 fluxes. A subset of the data were bagged to train each tree in the RF model, with the remaining out-of-bag data used as independent validation data to evaluate the prediction accuracy of each tree, resulting in the average out-of-bag scores of all of the trees in the model. Cross-validation was applied to daily predictions to select variables that can best predict the daily variability in CH4 fluxes within sites. The changes in model performance after predictor selection and after switching from site-level variables (in situ measurements) to grid-level proxies (reanalysis data) were assessed, which helped quantify differences in model performance when modeling on in situ predictor variables versus modeling on substitute variables at the grid level. Because the data sources of model input from in situ versus from gridded variables were different, we separated site-level and grid-level modeling to ensure that the importance of input features was comparable within a model. The feature importance reflects the relative importance of each input variable in an RF model. It also pertains to the input data distribution and model structure. Therefore, the feature importance by site models can help us identify controlling physical variables but would not necessarily translate to the same rank in the feature importance of grid models, especially when additional gridded variables from remote-sensing products were added to complement the missing controllers from site models.
A summary of input variables for grid-level modeling is provided in Table 1. Although RF can enhance model robustness when collinearity presents in input variables, the collinearity could affect the interpretation of feature importance measured by the impurity decrease in RF models. Therefore, we first built a baseline grid-level model with independent variables after a pairwise Pearson correlation test (Table S3) to exclude covariates. We grouped significantly correlated variables (p<0.001, r>0.8; white grids except for those on the diagonal line in Table S3), thereby forming three groups: SMAP soil moisture variables in group 1 (we also included surface soil moisture that was significantly correlated with the other two soil moisture variables and r>0.7); air temperature (tas), downward longwave radiation (rsdl), spfh, and soil temperatures (ts1, ts2, and ts3) in group 2; downward shortwave radiation (rsds) and latent heat (le) in group 3. We then selected the one most important variable in each group for the baseline models according to the feature importance of modeling on all predictor variables (Fig. S14). The rest of the variables out of the groups were included in the baseline features. The resulting baseline features included air pressure (pa), latent heat flux (le), sensible heat flux (h), soil temperature (ts2), root zone soil wetness (sm_r_wetness), slope, spi, and cti. Then, we designed four additional different model settings by changing predictor variables, including (1) baseline variables plus covariates, (2) only variables from MODIS NBAR, (3) baseline variables plus NBAR bands, and (4) all predictor variables. In this forward feature selection process, we evaluated the impacts of adding constraint variables from remote-sensing products on model performance.
Model predictive performance evaluates the accuracy of a model to predict at a new site without any prior knowledge. For the spatial predictive performance evaluation of grid-level ML models, we used a nested leave-one-site-out cross-validation scheme (hereafter referred to as LOOCV). Such a scheme selects one site to use as independent validation data to evaluate models trained and tested with data from the remaining sites, repeating the process for all sites. Without any prior knowledge of the validation site added to a model, the LOOCV scheme can (1) assess the predictive ability of the model in a new place and (2) evaluate the uniqueness of a site in the dataset. Similar forms of spatial LOOCV have been used to evaluate upscaling models for global or regional CO2 and CH4 (McNicol et al., 2023; Peltola et al., 2019; Virkkala et al., 2021). The validation of the upscaling model was not only performed with respect to daily predictions but also on monthly means. The predictive performance of the upscaling model on the monthly variability in CH4 fluxes and spatial variability across sites is important for studies that vary with respect to their temporal and spatial scales.
Model predictive performance was assessed using three evaluation metrics: mean absolute error (MAE), root-mean-square error (RMSE), and R2 score. Daily modeled CH4 fluxes were compared to EC observations at each validation site. The evaluation metrics were calculated at daily and monthly scales for each site separately to examine the model performance by general wetland types and for all sites pooled together to evaluate the overall performance and undertake a comparison with existing studies. Squared error metrics are more sensitive to outliers and highly skewed data, which is often the case with CH4 fluxes. Therefore, we selected both the MAE and RMSE to quantify the errors. The mean error (ME) between model predictions and validation data was calculated, representing the systematic bias in predicted fluxes. The standard deviation of model residuals was also included to measure the spread of the residuals. This matches the RMSE when the ME equals zero.
Two additional ML algorithms were compared with RF: SVM and ANN. SVM is efficient with sparse data where the dimension of the input space is greater than the number of training samples (Kuter, 2021). While the training process of ANN is expensive and time-consuming, it can develop deep networks with growing training data which may increase predictive performance (Saikia et al., 2020). We used support vector regression to model CH4 fluxes with the same predictor variables and dataset as used in the ensemble RF regressions. Multilayer perceptron regressor is an implementation of an ANN model that adjusts the weights of neurons using backpropagation to improve prediction accuracy. It uses the square error as the loss function and a stochastic gradient-based optimizer “Adam” for weight optimization. We used two hidden layers in the ANN model, each with 50 neurons. Data from all variables were normalized to achieve the best model performance for SVM and ANN.
2.3.2 CH4 flux upscaling
We trained 500 ensemble RF models with all gridded predictors of the grid-level models from the general model design and with data from all sites for upscaling daily CH4 fluxes. Each RF model was trained with the same optimized hyperparameters and different bootstrap samples. Ensemble models were then applied to 0.098° gridded predictors to produce the upscaling CH4 flux intensities from the means of the 500 predictions and the prediction uncertainty from the standard deviations. Given that the CH4 fluxes were modeled with data from the wetland EC sites, a wetland extent map was also needed to constrain the areas when scaling grid emissions (see Sect. 2.4). Final CH4 emission and uncertainty maps associated with wetland extents were the result of multiplying the predicted means and standard deviations of flux intensities by wetland areas. All wetland maps were resampled to 0.098°×0.098° resolution with a conservative remapping method for producing the emission products.
2.4 Wetland extent maps and benchmark estimates of wetland CH4 emissions
Wetland extent maps were applied to scale the modeled CH4 flux intensities to the region. The Wetland Area and Dynamics for CH4 Modeling (WAD2Mv2) product, representing spatiotemporal patterns of inundated vegetated wetlands at 0.25° resolution, was selected as the reference for dynamic wetland areas in this study (Zhang et al., 2021). Active- and passive-microwave-detected inundation data combined with static wetlands were used to delineate the monthly dynamics of wetland inundation between 2000 and 2020. Open waterbodies such as lakes, rivers, reservoirs, coastal wetlands, and rice paddies were excluded. We used monthly mean WAD2M fractions between 2010 and 2020 to represent seasonal wetland dynamics. Emission estimations are subject to differences in the wetland extent between maps (Saunois et al., 2020). We used monthly means of the Global Inundation Extent from Multi-Satellites (GIEMS2) product (Prigent et al., 2020) to represent temporal patterns in the restricted wetland extents at 0.25° resolution. The coarse-resolution maps were resampled to 0.098°×0.098° grids using the nearest-neighbor method. The static Global Lakes and Wetlands Database version 1 (GLWDv1) Level-3 1 km resolution map excluding the lakes, rivers, and reservoirs classes (Lehner and Döll, 2004) was included to quantify the upper limit of wetland cover. For all explicit GLWDv1 wetland classes, we assumed a 100 % wetland coverage in the original pixels, except for “intermittent wetland/lake” for which we assumed a 50 % coverage; for GLWDv1 classes represented as extent ranges, we used the average value of the range (i.e., 75 % for 50 %–100 % wetland, 37 % for 25 %–50 % wetland, and 12 % for 0 %–25 % wetland). To support domain emission comparisons, wetland cover was also extracted from the updated GLWD version 2 dataset (GLWD v2; Lehner et al., 2025) which provides the spatial extent of 33 waterbody and wetland classes at 500 m spatial resolution. All freshwater wetland classes that occur in our study area (classes 8–25) from GLWD v2 were included (i.e., excluding rivers, lakes, reservoirs, and other permanent open-water bodies as well as coastal saline/brackish wetlands). The original wetland areas per GLWD v2 pixel were summed across all included classes to derive a total wetland area per pixel. Furthermore, a regional freshwater wetland distribution dataset was calculated from a permafrost-region-specific land cover map (CALU – circum-Arctic land cover units) which classified 23 land covers including 3 wetland classes and 10 moist to wet tundra classes at 10 m resolution and aggregated to 1 km with the majority class (Bartsch et al., 2024). This regional wetland map was applied for CH4 emission estimation in the North Slope region of Alaska to assess the impacts of different wetland maps on emission estimates in this area when compared against airborne measurements. Wetland areas from the finer-resolution maps were aggregated to 0.098°×0.098° grids for emission calculations.
We compared WetCH4 emissions with benchmark domain or regional estimates from bottom-up process models, top-down atmospheric-observation-based inversions, and existing upscaling studies. We acquired data for the study domain from the ensemble mean of bottom-up process-based models from the Global Carbon Project (GCP) (Zhang et al., 2025) and the extended ensemble of wetland CH4 estimates that were priors for the top-down GEOS-Chem atmospheric chemical and transport model (WetCHARTs) (Bloom et al., 2017; Friedlingstein et al., 2022). We also included the atmospheric inversions of northern high latitudes from an assimilation CarbonTracker-CH4 system (Bruhwiler et al., 2014; update at https://gml.noaa.gov/ccgg/carbontracker-ch4/carbontracker-ch4-2023/, last access: 16 May 2023). We compared WetCH4 with existing upscaled products of monthly CH4 wetland fluxes based on Peltola et al. (2019) for the study domain. For regional wetland hotspots, CH4 flux estimates were obtained from Carbon in Arctic Reservoirs Vulnerability Experiment (CARVE), which measured total atmospheric columns of CO2, CH4, and carbon monoxide over northern Alaska in spring, summer, and early fall between 2012 and 2014 (Chang et al., 2014; Miller et al., 2016). These were used to verify our seasonal emission estimates over the North Slope region (Zona et al., 2016).
3.1 Model validation
3.1.1 Site-level modeling
Site-level modeling used all wetland sites to build an RF model and identified the 10 most important variables measured in situ that, if left out, decreased the valuation score of the model by more than 90 % based on the mean decrease in impurity (Fig. S3). With bootstrap sampling and using all candidate predictors (Fig. 1) in the model, the out-of-bag RMSE of the site-level model was 30.22 nmol m−2 s−1, and the out-of-bag R2 between observed daily means of CH4 fluxes and prediction was 0.73. Modeling with the 10 most important variables at the site level resulted in similar model performance, with an out-of-bag RMSE of 30.43 nmol m−2 s−1 and an out-of-bag R2 of 0.73. Site-level model performance converged as the increment of predictor variables ordered by the importance rank (Fig. S4). We then tested building separate models according to wetland types because distinct CH4 fluxes have been observed from wet tundra (Fig. S5; mean ± standard deviation: 13±14 nmol m−2 s−1), bogs (22±26 nmol m−2 s−1), and fens (56±88 nmol m−2 s−1). The out-of-bag R2 (RMSE) was 0.85 (7.2 nmol m−2 s−1) for bogs, 0.84 (27.7 nmol m−2 s−1) for fens, and 0.57 (34.3 nmol m−2 s−1) for wet tundra. Modeling with the selected 10 predictors resulted in an out-of-bag R2 (RMSE) of 0.84 (7.6 nmol m−2 s−1) for bogs, 0.84 (27.9 nmol m−2 s−1) for fens, and 0.53 (36.3 nmol m−2 s−1) for wet tundra. Next, we tested whether the inclusion of non-wetland sites (upland and rice sites) would affect model performance. This resulted in an out-of-bag R2 decrease to 0.56 and an RMSE increase to 38.86 nmol m−2 s−1, suggesting that a generalized ML model over all land cover classes is not practical to reliably predict CH4 fluxes with the current set of predictors and available data. This is most likely due to the distinctive features of CH4 emissions between wetland and non-wetland classes (Fig. S5).
3.1.2 Grid-level modeling and remote-sensing constraints
Substituting in situ measurements of selected predictor variables with gridded MERRA-2 variables slightly reduced model accuracy. The out-of-bag R2 decreased by 9.6 % to 0.65 and the RMSE increased by 15 % to 34.9 nmol m−2 s−1 compared to the site-level model. The coarse-resolution MERRA-2 reanalysis data capture less spatial variability in the selected physical variables and are less accurate at the grid level compared to in situ EC measurements.
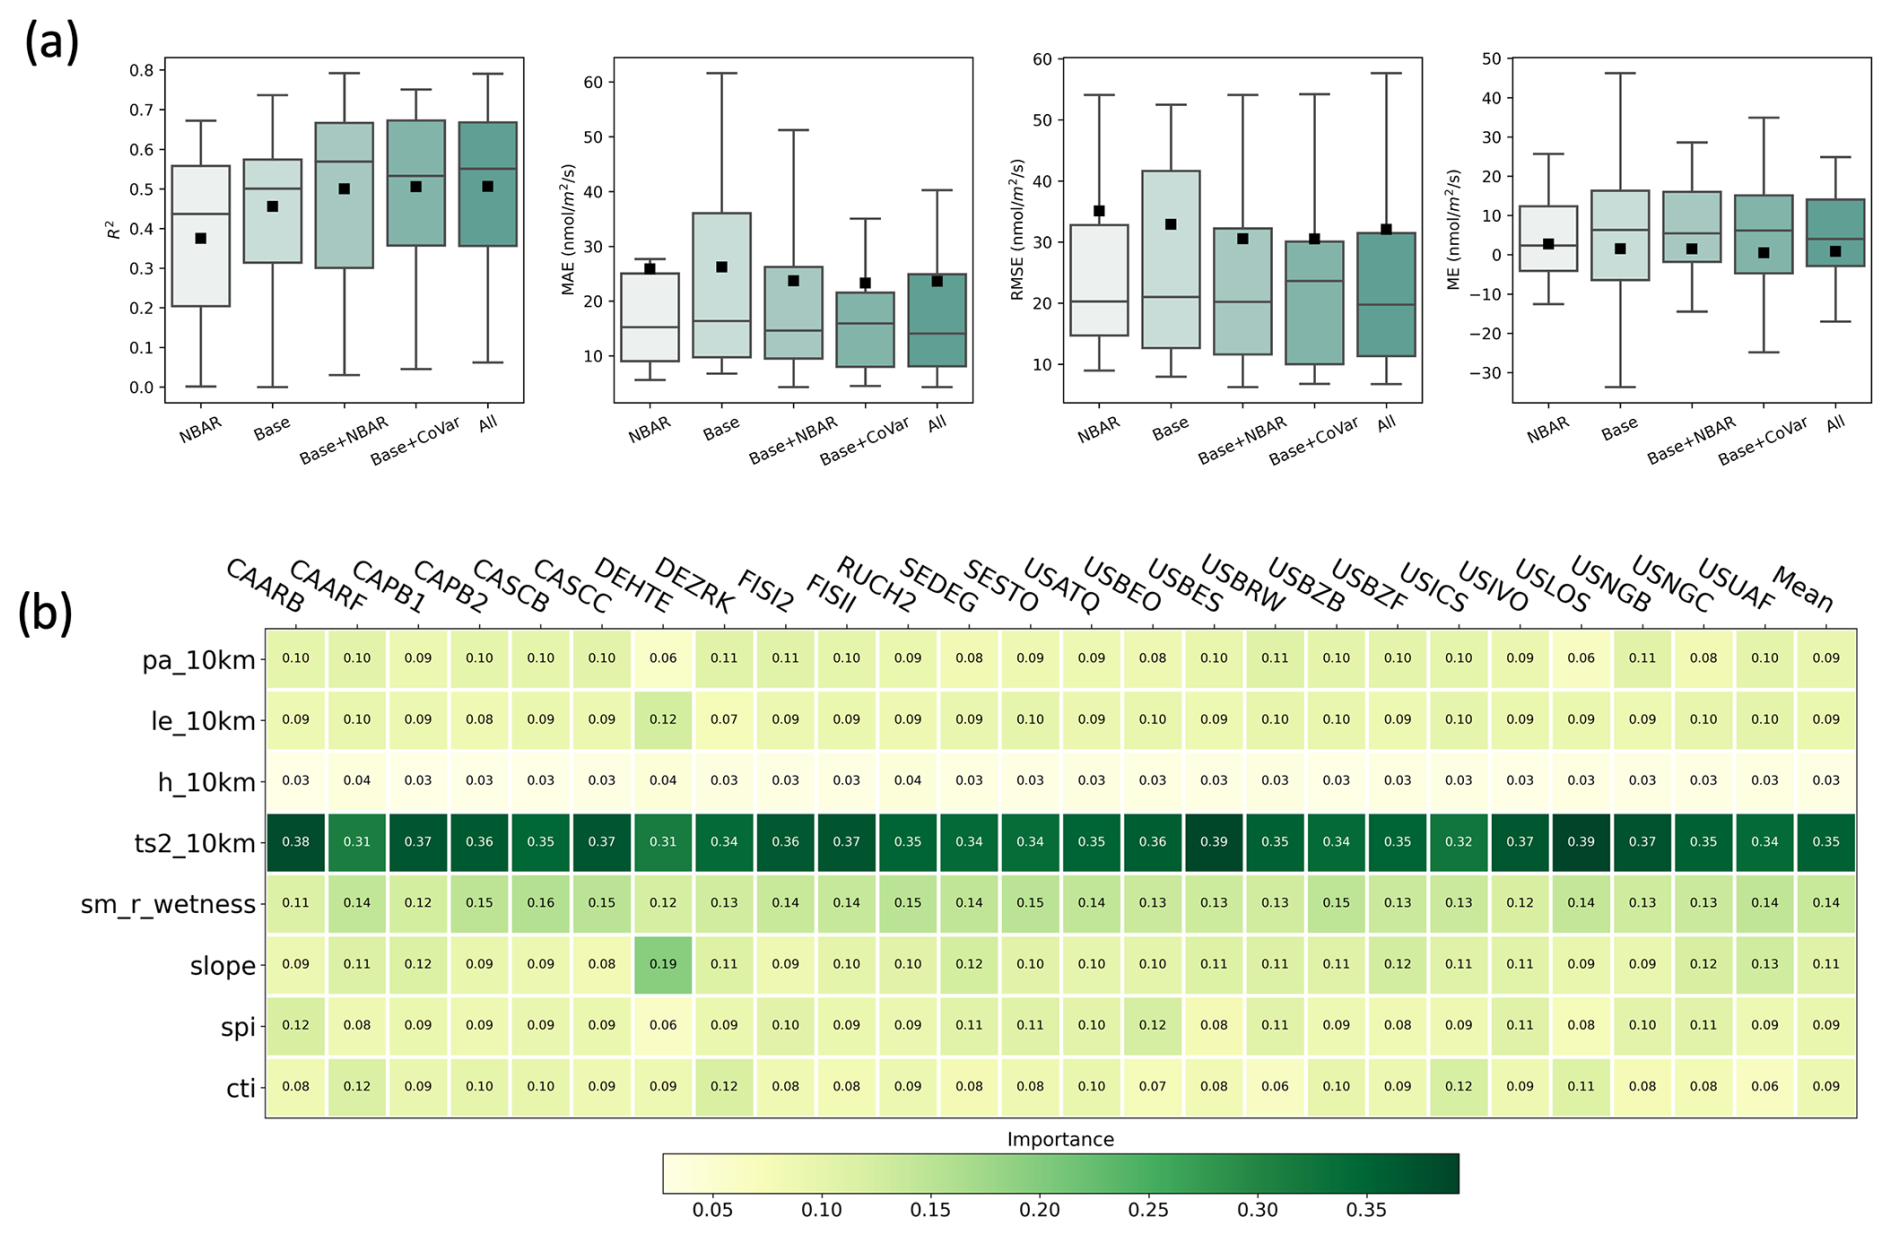
Figure 3Grid-level modeling. Panel (a) presents the distribution of the R2, MAE, RMSE, and ME for all sites (size = 25) in a LOOCV scheme based on gridded data using five model settings: RF modeled using only MODIS NBAR bands, baseline features (MERRA-2 air pressure, latent heat flux, sensible heat flux, soil temperature, SMAP root zone soil wetness, topographic slope, spi, and cit), baseline features plus MODIS NBAR bands, baseline features plus correlated variables within the MERRA-2 and SMAP dataset, and all gridded input variables together. The model settings are ranked by the mean R2, from lowest (left) to highest (right). Panel (b) shows the mean variable importance of baseline models (last column) in the LOOCV scheme and at each site (columns labeled with validation site ID). The values in each column are the means of the accumulation of the impurity decrease when a variable was taken out in the trees of an RF model, representing the importance of such variable to the model. The variable names and descriptions refer to Table 1.
Adding remote-sensing constraints to the gridded variables can improve the model predictive performance and reduce errors. Modeling on baseline features explained, on average, 46 % of daily CH4 fluxes' variability at validation sites with the largest range of errors (Fig. 3a). The medians in the baseline model of the R2, MAE, RMSE, and ME under the LOOCV scheme were 0.5, 16.4, 21.0, and 6.4 nmol m−2 s−1, respectively. Adding NBAR or covariates from MERRA-2 and SMAP input variables returned a higher mean R2 or slightly lower mean errors than the baseline model, whereas modeling with all gridded input variables (the “all” model setting) achieved the highest mean R2 of 0.51 with a comparable mean MAE (23.6 nmol m−2 s−1), RMSE (32.1 nmol m−2 s−1), and ME (0.9 nmol m−2 s−1) (Table S4). Although modeling with baseline features and covariates (the “base + CoVar” setting) received a comparable mean R2 to modeling all variables, the latter had a higher median R2 (0.53) and lower median errors (MA = 14.1 nmol m−2 s−1, RMSE = 19.8 nmol m−2 s−1, and ME = 4.0 nmol m−2 s−1). Our results suggest that including remote-sensing constraints or covariates improved the models' ability to predict spatial variability in wetland CH4 fluxes and reduced prediction errors. These results confirm our selection of predictor variables for the upscaling model (Table 1).
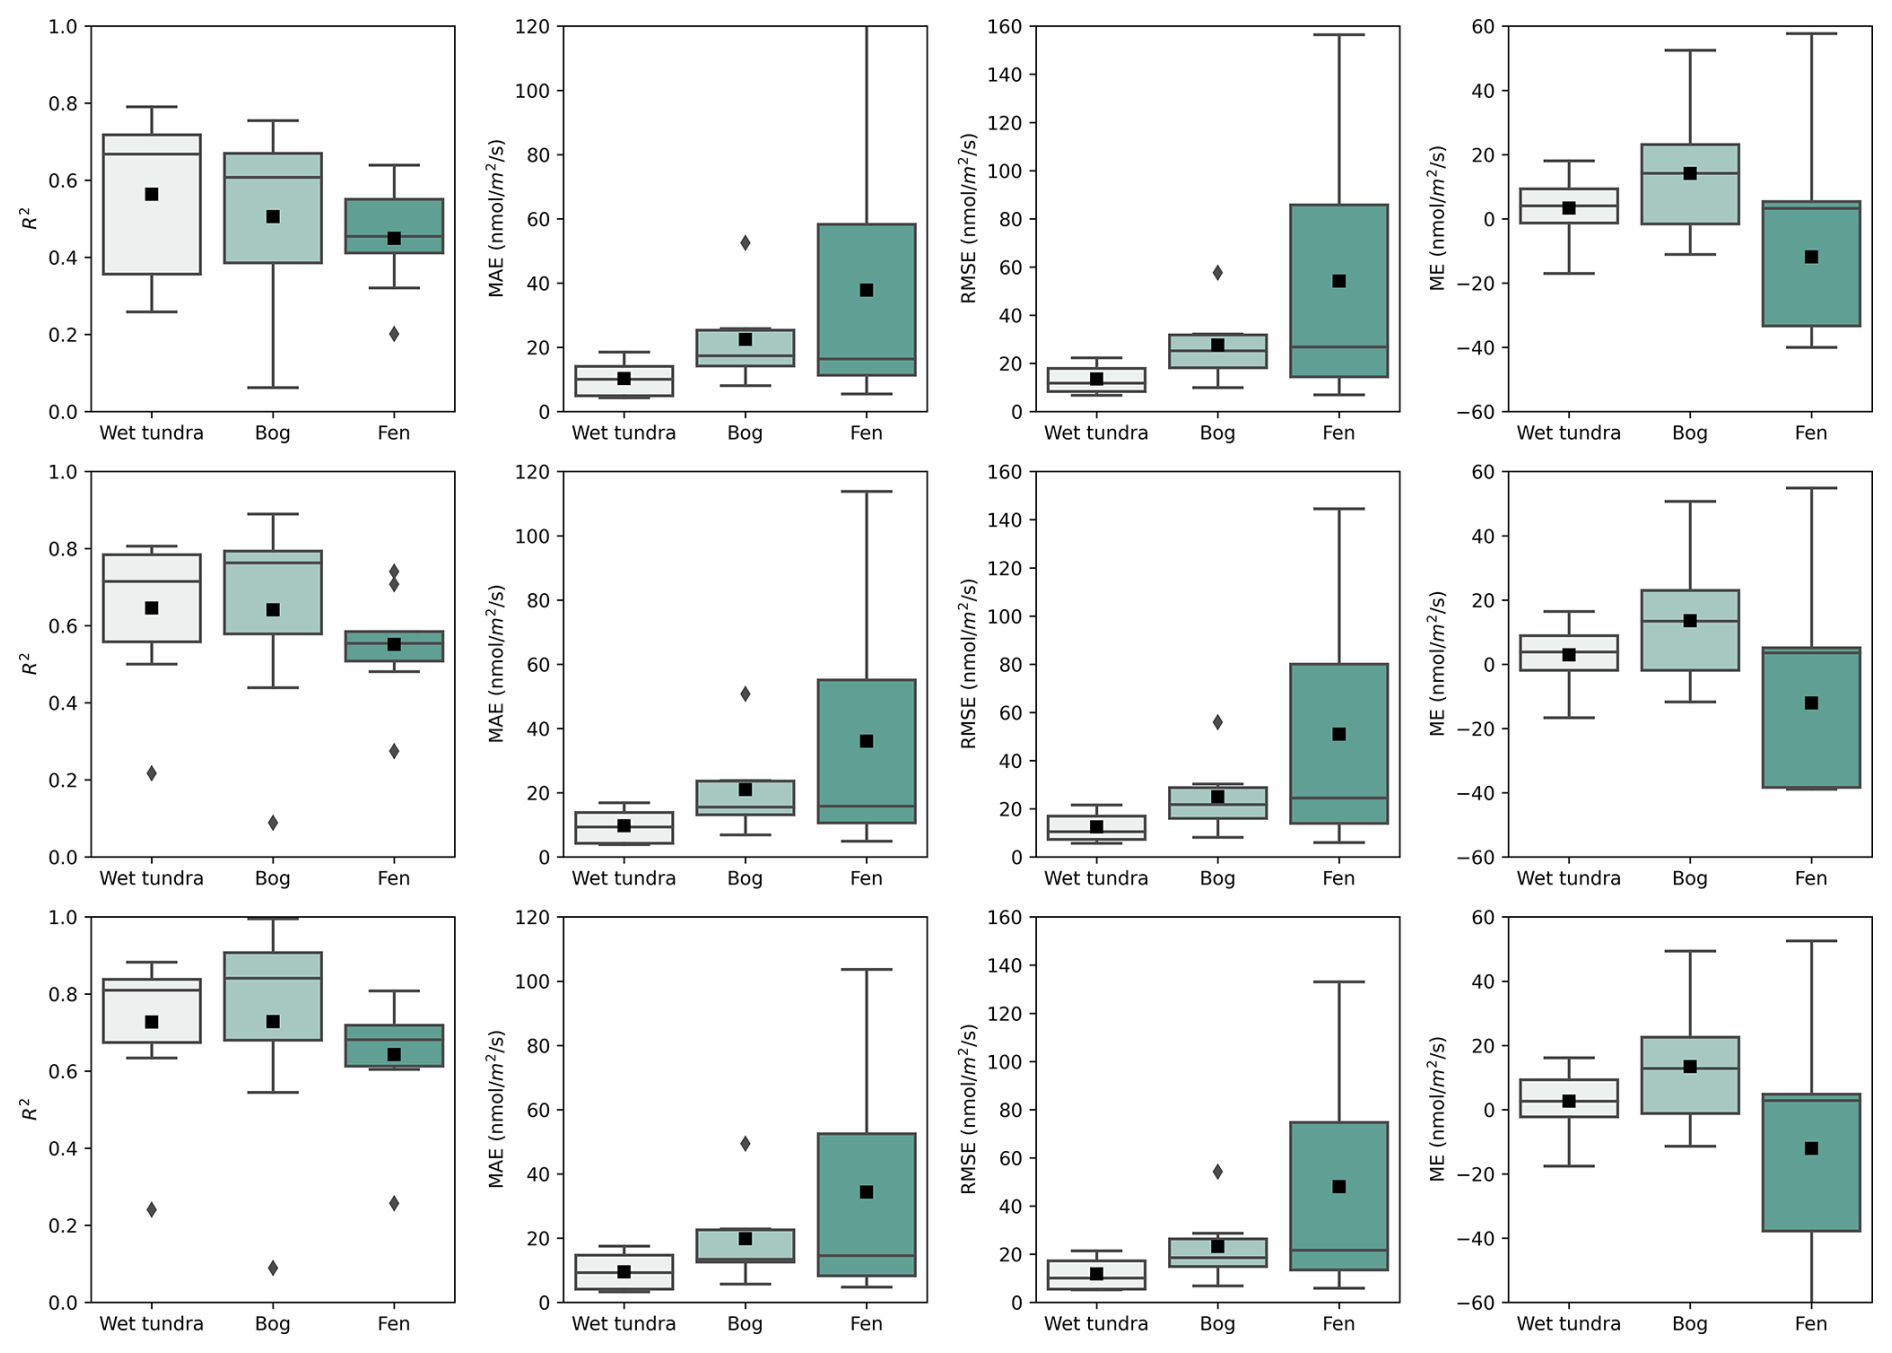
Figure 4Model predictive performance evaluation on RF-modeled CH4 fluxes at the grid level under the LOOCV scheme: box plots of R2, MAE, RMSE, and ME across validation sites by wetland types with mean values denoted using black squares at daily, weekly, and monthly (top, middle, and bottom panel, respectively) time steps.
The average importance of the baseline features shows their influence on the grid-level model predictive performance (Fig. 3b). The importance of independent predictors under the LOOCV scheme, although slightly varied between models, agreed with respect to selecting the MERRA-2 soil temperature (ts2) as the primary driver in predicting daily CH4 fluxes in northern wetlands, followed by the SMAP root zone wetness (sm_r_wetness). The eight baseline features accounted for a 99 % reduction in the mean validation score of the baseline models. The average importance of all gridded variables used for upscaling (Fig. S14) was consistent with baseline models, emphasizing the importance of soil temperatures and root zone wetness. Additionally, air pressure and topography also contributed to explaining the daily variability in CH4 fluxes. Nevertheless, all variables contributed to predicting variability in CH4 fluxes, showing the complexity of environmental factors that would affect the rates of CH4 production and the process of gas exchange.
Daily mean CH4 fluxes exhibited great variability in wetlands across space and time (mean = 35 nmol m−2 s−1, σ=65 nmol m−2 s−1; Fig. S3). The model predictive performance (Fig. 4) was calculated for each site, and the average performance with respect to the daily variability in CH4 fluxes was best at wet tundra sites with a mean R2 of 0.56, followed by bog sites (0.51) and fen sites (0.45). Due to the large variability in fen daily fluxes, errors in daily predictions were highest for fen sites (mean RMSE = 54.2 nmol m−2 s−1 and mean MAE = 37.8 nmol m−2 s−1), followed by bog sites (mean RMSE = 27.6 nmol m−2 s−1 and mean MAE = 22.5 nmol m−2 s−1), whereas they were lowest for wet tundra sites (mean RMSE = 13.5 nmol m−2 s−1 and mean MAE = 10.3 nmol m−2 s−1). Our slight model overestimation of daily fluxes (mean ME = 0.9 nmol m−2 s−1) was driven by an underestimation of fen sites (mean ME = −12 nmol m−2 s−1) versus an overestimation of bog (mean ME = 14 nmol m−2 s−1) and wet tundra (mean ME = 3 nmol m−2 s−1) sites.
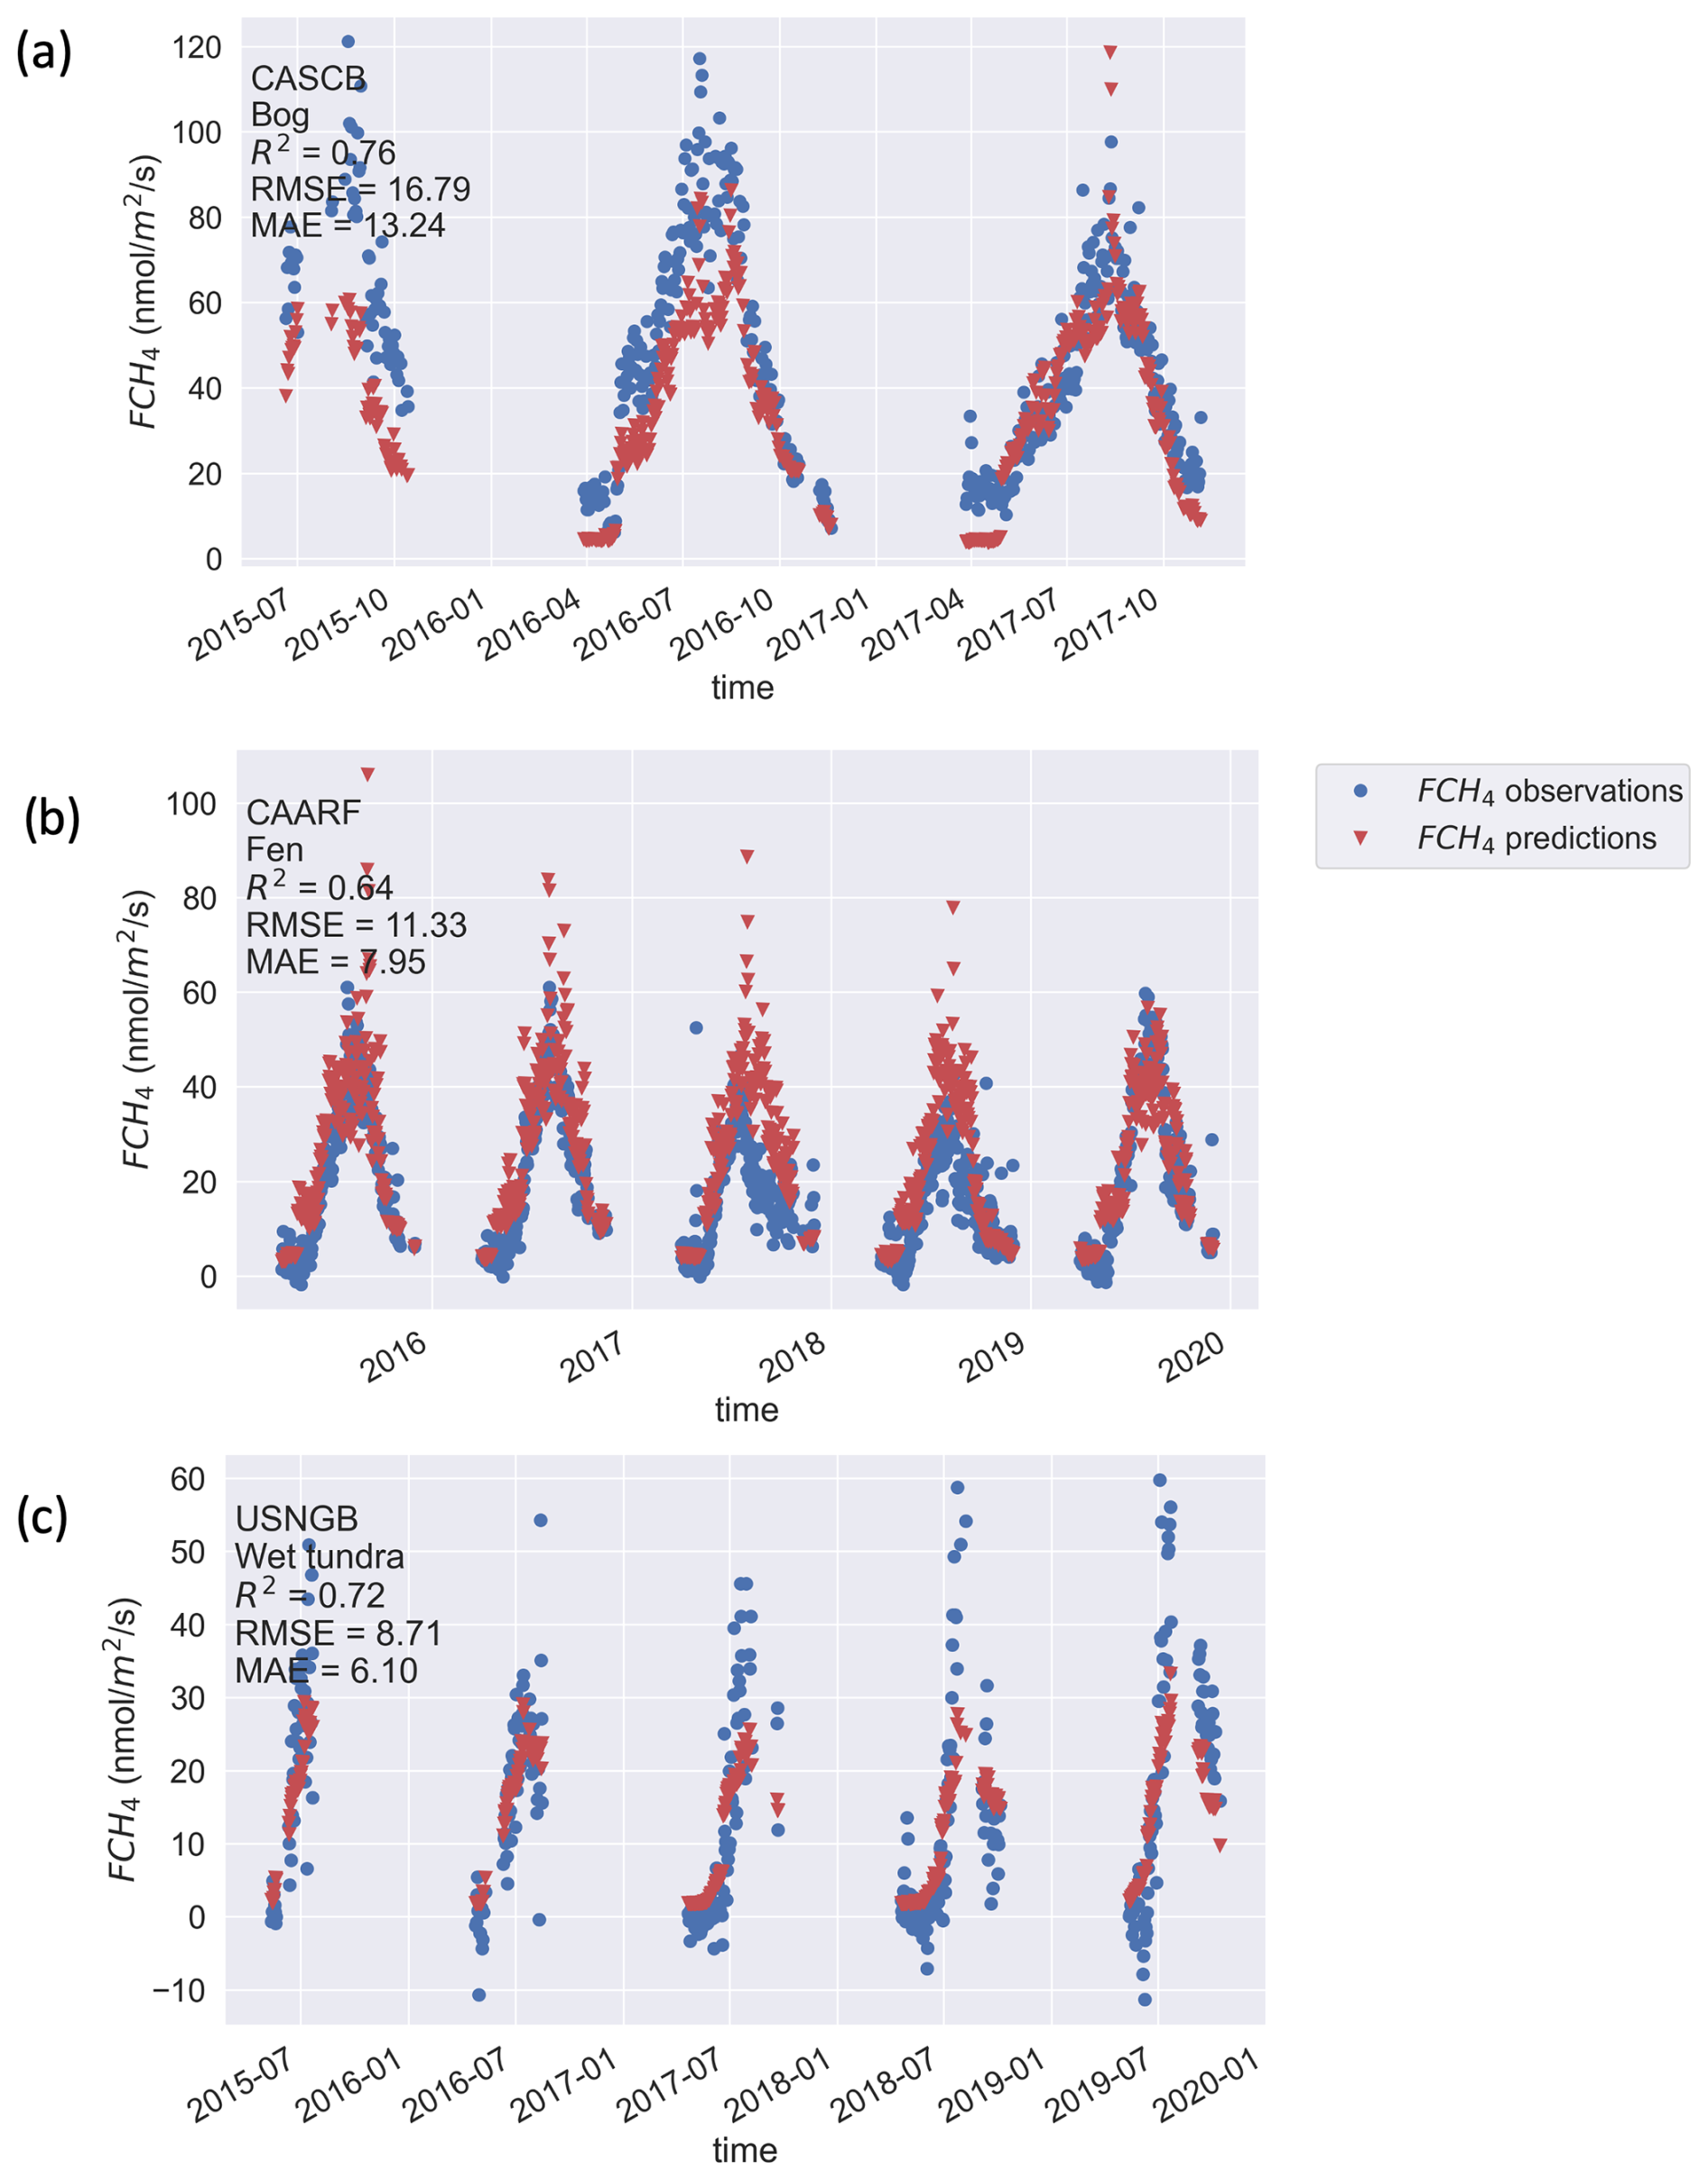
Figure 5Example model predictive performance for seasonal cycles of daily FCH4 at the validation sites of CA-SCB, CA-ARF, and US-NGB, representing bog, fen, and wet tundra, respectively.
Model predictive performance on aggregated monthly means of CH4 fluxes increased by 37 % compared with daily means (mean R2=0.70; Fig. 4, Table S4). This improvement may be attributed to a better representation of the environmental conditions' average state over a month by the input variables compared to the daily variability. Performance was higher for wet tundra (mean R2=0.73) and bogs (mean R2=0.73), whereas it was lower for fen sites (mean R2=0.64, Fig. 4). Mean errors in monthly mean predictions were as follows: RMSE = 28.1 nmol m−2 s−1, MAE = 21.4 nmol m−2 s−1, and ME = 0.37 nmol m−2 s−1 (Table S4). Prediction residuals of daily and monthly CH4 fluxes (Fig. S6) showed normal distributions for wet tundra sites, indicating that the spread of residuals resulted from random errors that increased with the flux magnitude. The residuals had a skewed normal distribution for bog sites, indicating likely overestimation. The long left-hand tails in the prediction residuals indicated that the intense emission fluxes from fens during summer peaks were underestimated (Fig. S6).
Site-by-site validation of daily flux predictions varied greatly between individual sites (Figs. 5 and S7). For example, US-UAF, an EC site in Interior Alaska with mature black spruce cover and full understory vegetation and mosses over permafrost (Ueyama et al., 2023a), which is the only one of the five forest bog sites in our dataset that had low CH4 fluxes and weak seasonal cycles (less than 10 nmol m−2 s−1), was significantly overestimated by our model (RMSE = 58 nmol m−2 s−1 and MAE = 53 nmol m−2 s−1). Permafrost presence and groundwater below the soil surface may explain the low fluxes at this site (Iwata et al., 2015; Ueyama et al., 2023b).
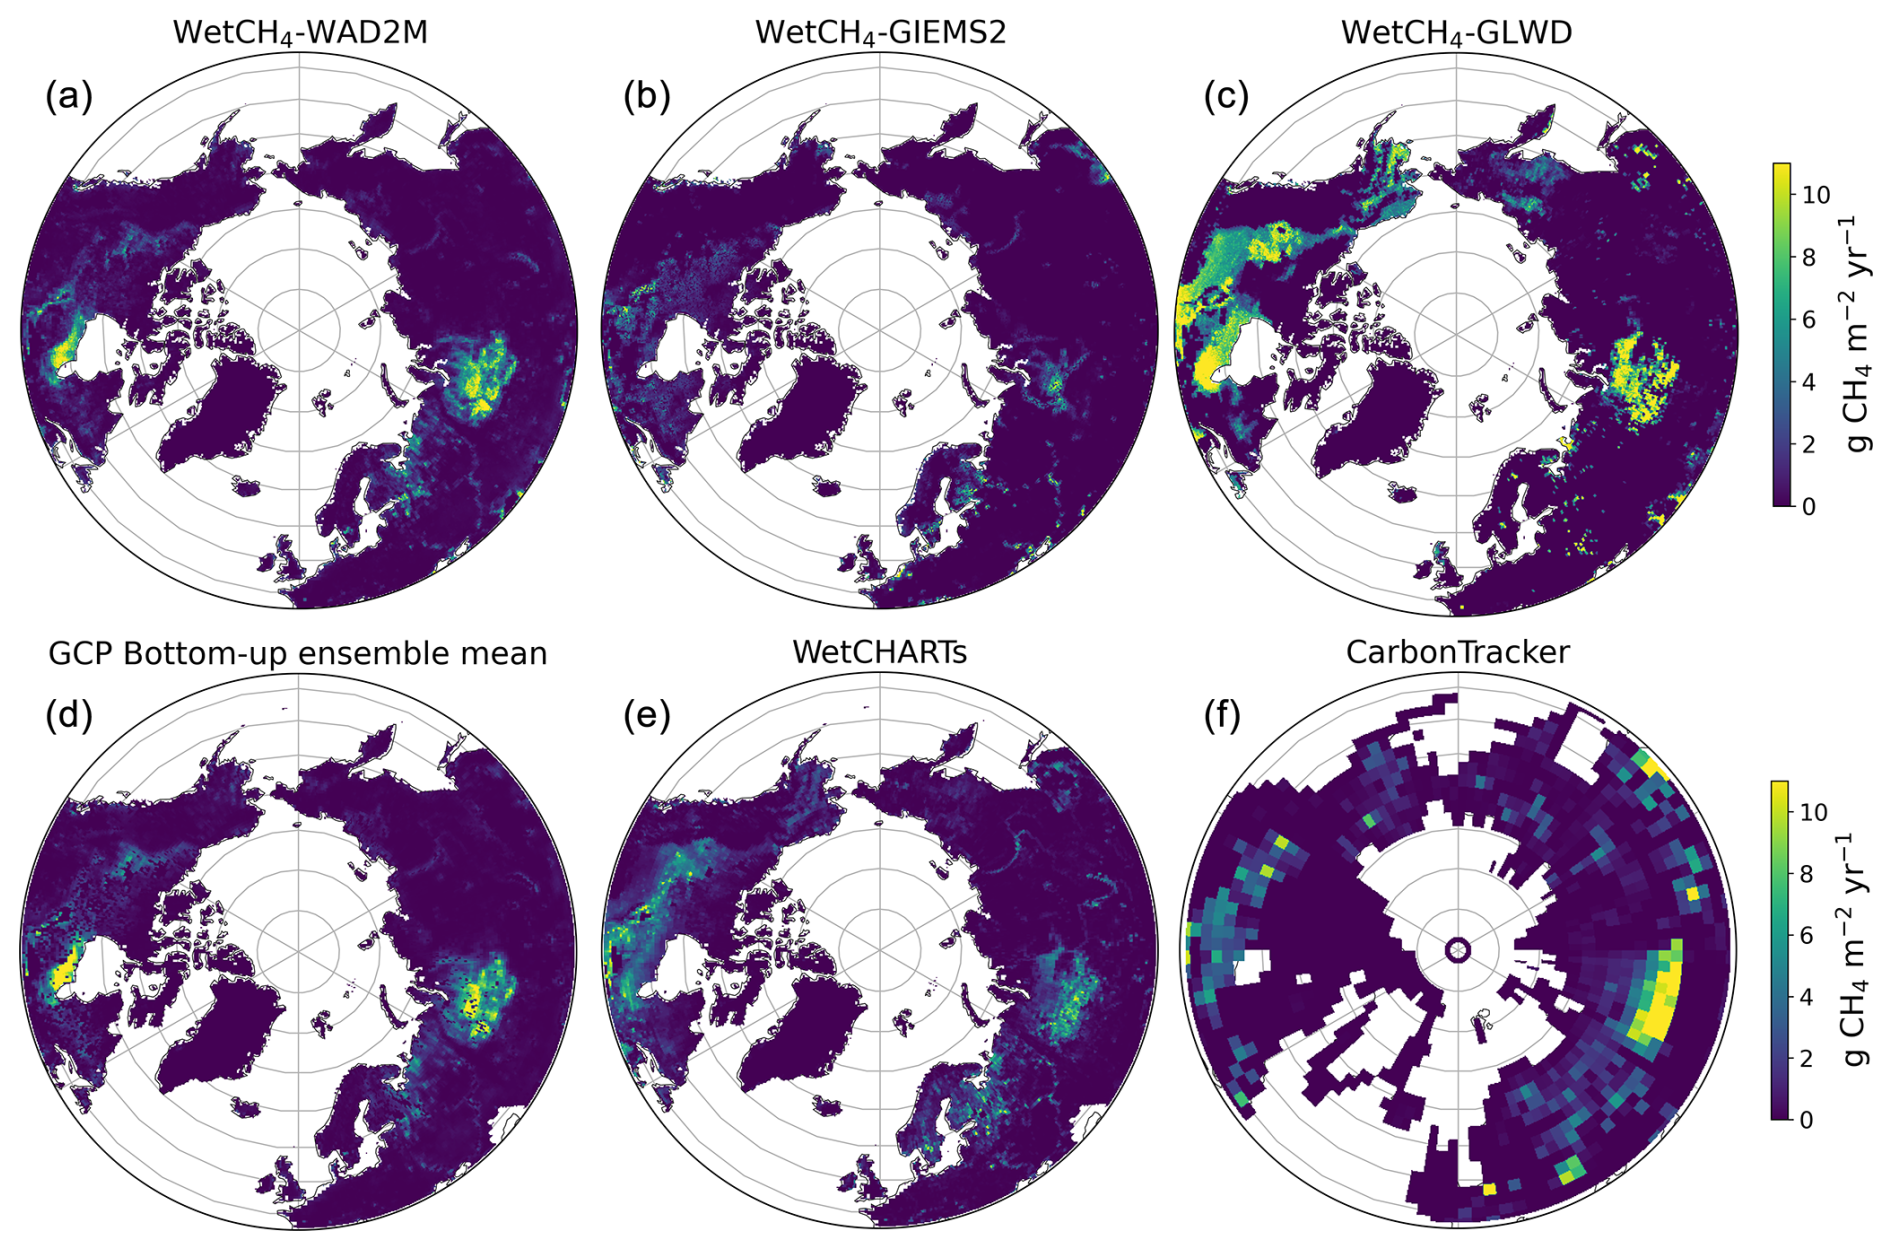
Figure 6Mean annual wetland CH4 fluxes: panels (a)–(c) contain WetCH4 upscaled fluxes between 2016 and 2022 weighted by wetland fractions for three wetland maps – WAD2Mv2, GIEMS2, and GLWDv1; panels (d)–(f) contain the bottom-up GCP ensemble mean, WetCHARTs, and top-down estimates of CarbonTracker-CH4 natural microbial emissions.
3.2 Upscaled wetland CH4 emissions
3.2.1 Wetland-area-weighted CH4 emissions
Upscaled daily CH4 fluxes were weighted by wetland fraction to estimate gridded daily CH4 fluxes from northern wetlands based on WAD2Mv2, GIEMS2, and GLWDv1 between 2016 and 2022 (Fig. 6) and on GLWD v2 for comparison. The mean annual emissions and the RF-model-associated uncertainties are summarized with different wetland maps in Table S5. The estimate from WetCH4 with WAD2Mv2 was 22.8±2.4 Tg CH4 yr−1, comparable to UpCH4 (23.5±5.8 Tg CH4 yr−1). With GIEMS2, WetCH4 estimated a minimum annual emission of 15.7±1.8 Tg CH4 yr−1. With GLWDv1 and GLWD v2, WetCH4 estimated potential annual emissions of 46.0±5.1 Tg CH4 yr−1 and 51.6±2.2 Tg CH4 yr−1 for 2016–2022, respectively. The spatial patterns were similar to the post-2016 mean annual fluxes from the GCP process-based model ensemble means (28.6±21.6 Tg CH4 yr−1 for 2016–2020), WetCHARTs (29.5±30.0 Tg CH4 yr−1 for 2016–2019), and atmospheric inversions of CarbonTracker-CH4 (40.9 Tg CH4 yr−1 for 2016–2022), highlighting the high-emission areas in the Hudson Bay Lowlands and Western Siberian Lowlands. The emissions from WetCH4-GIEMS2 were lower in these two hotspots than other estimates. Differences in the distribution of CH4 emissions between wetland products reflect the influence of wetland dynamics. Mean monthly wetland inundations are provided by WAD2Mv2 and GIEMS2, which set the dynamic limits for the wetland boundaries of the CH4-emitting surface. While emissions resulting from inundation were captured, it appeared that saturated or wet subsoil conditions were not well represented by WAD2M and GIEMS2, resulting in low emissions in wet but non-inundated tundra (i.e., the Alaskan North Slope). To address this, we incorporated wetland fractions from the CALU high-resolution wetland map (Bartsch et al., 2024) that was specifically produced for the permafrost region in order to estimate Alaskan North Slope emissions. Wetland fractions from GLWD (both v1 and v2) represent a static maximum wetland distribution throughout time. Thus, estimates from GLWD may represent the upper bounds for all northern wetlands under contemporary conditions.
We compared spatial distributions of our upscaled fluxes (WetCH4) with two alternative upscaled datasets. Using the same wetland weights, our product showed similar spatial patterns to UpCH4 (McNicol et al., 2023) and the upscaled fluxes from Peltola et al. (2019) (Fig. S9). Spatially, the maximum mean flux for WetCH4 with WAD2Mv2 for 2016–2022 was 69 mg CH4 m−2 d−1, whereas UpCH4 produced a maximum mean flux of 88 mg CH4 m−2 d−1 between 2016 and 2018. While all three products predicted concentrated CH4 exchange in the Hudson Bay Lowlands and Western Siberian Lowlands and low fluxes in the Western Canadian Arctic tundra, WetCH4 predicted lower fluxes in the forested wetlands of Western Canada compared with UpCH4 (Fig. S9a and b). With GLWDv1, WetCH4 predicted similar fluxes to those of Peltola et al. (2019), with the exception of a number of potent emitting grids in the Western Siberian Lowlands (Fig. S9c and d) and a maximum mean flux of 132 mg CH4 m−2 d−1 from WetCH4.
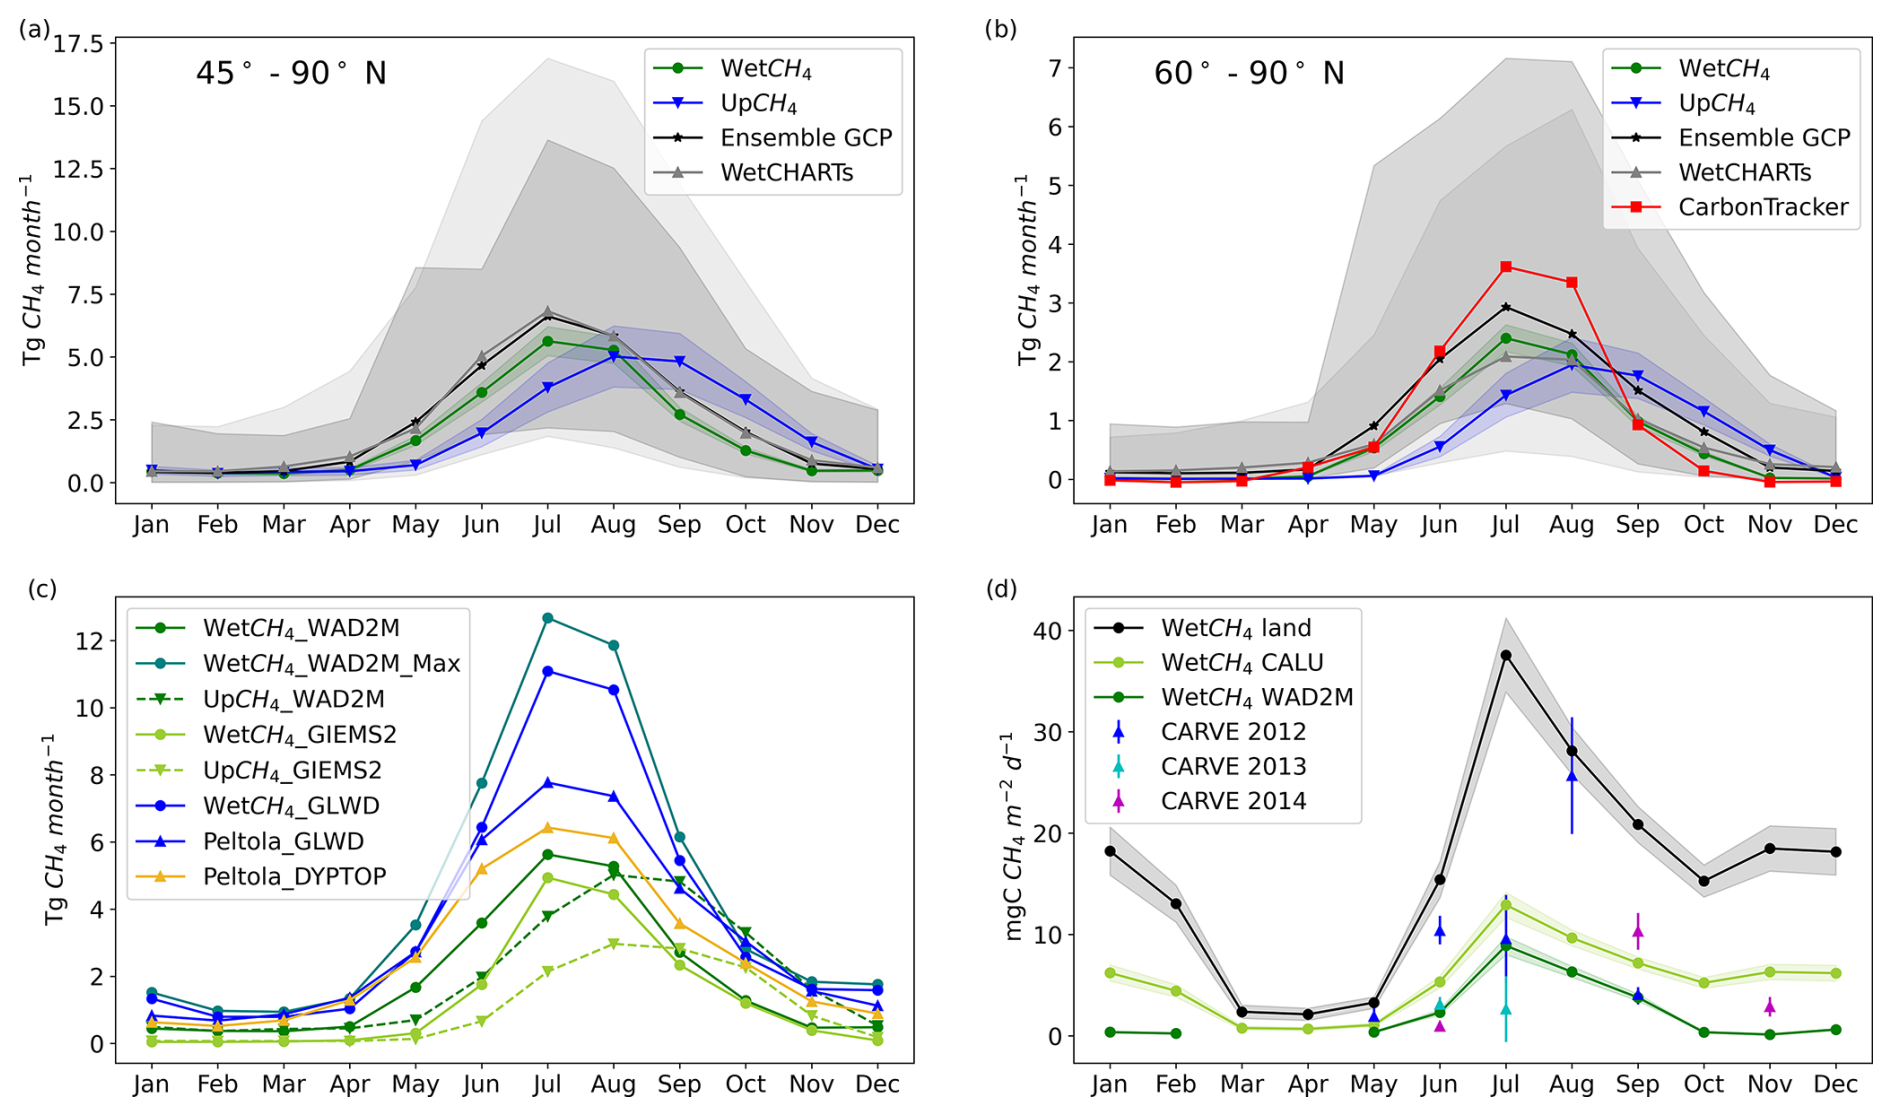
Figure 7Multiyear average seasonal cycles of wetland CH4 emissions. Panel (a) presents a comparison of ML upscaled mean seasonal cycles in reference wetland areas (WAD2Mv2) with the cycles from process-based models in the northern mid-high latitudes (45–90° N). Panel (b) shows the same comparison for northern high latitudes (60–90° N) and the addition of atmospheric CarbonTracker-CH4-attributed microbial emissions (2016–2022). Panel (c) presents a comparison of three ML upscaled mean seasonal cycles of CH4 emissions with different wetland area maps (WAD2Mv2, WAD2Mv2 maximum extent, GIEMS2, and GLWDv1). Panel (d) shows a comparison of WetCH4 mean seasonal cycles over land (black line), WetCH4 weighted by wetland from the CALU map (light-green line), or WetCH4 weighted by fractions from WAD2Mv2 (dark-green line), with estimates of CH4 fluxes in growing seasons from CARVE retrievals in the North Slope area of Alaska (Zona et al., 2016).
3.2.2 Seasonal cycles of wetland CH4 emissions
Mean seasonal cycles of wetland CH4 emissions were consistent with bottom-up estimates in the domain and top-down inversions in high latitudes (Fig. 7). The amplitudes of two ML-based estimates agreed in the domain (WetCH4 and UpCH4 both within WAD2Mv2 wetland areas) and were lower than the ensemble means of GCP or WetCHARTs estimates during the growing season (Fig. 7a). In the northern high latitudes (60–90° N), the amplitudes of this study closely agree with WetCHARTs, and both amplitudes were lower than the ensemble means of GCP in the growing season (Fig. 7b). Our emissions in JJA were lower than the emissions attributed by the atmospheric inversion of CarbonTracker-CH4, which does not discriminate between wetland and open-water sources. We did not use comparisons with CarbonTracker-CH4 for 45–90° due to likely considerable contributions from aquatic systems and other non-wetland factors in the inversion estimates. Notably, uncertainties between ML-based approaches with the same wetland extents showed less variation than those between process-based models, especially during the growing season. The phase of our estimates (WetCH4) agreed with bottom-up and top-down models, peaking in July followed by August (Fig. 7a and b), whereas UpCH4 showed a month lag, probably due to the 2- or 3-week lag of the predictor variables selected in UpCH4 (McNicol et al., 2023). Peak fluxes in July and August were commonly seen in tower measurements.
The seasonality in upscaled wetland CH4 emissions corresponded to the intensities of fluxes and dynamics of wetland areas. We compared mean seasonal cycles of upscaled products with different dynamic or static wetland maps to constrain the impacts of wetland areas (Fig. 7c). As observed in spatial distributions (Fig. 7a and c), emissions from the potential emitting surface (WetCH4_GLWDv1) were 95 % higher than those from reference inundated wetlands (WetCH4_WAD2Mv2) during the growing season, and they doubled in winter. Within the GLWDv1 emitting surface, WetCH4 predicted higher emissions than Peltola et al. (2019) in July (43 %), August (43 %), December (41 %), and January (61 %), but it predicted 15 % lower emissions in October. We decoupled the mean annual seasonal cycle for WAD2M from the emission seasonality using a fixed maximum WAD2M extent. The addition of maximum annual wetland extent further constrains the limitations of seasonal WAD2M extents in underestimating the CH4-emitting surface for northern high-latitude wetlands, especially in the cold seasons. The resulting seasonal emissions, primarily driven by soil temperatures and moisture, manifested elevated emissions in all months and an intensified seasonal cycle. Reported emissions (Zona et al., 2016) and large bursts (Mastepanov et al., 2008) from the freezing active layer in permafrost areas in October (zero-curtain period) may not be well captured by our ML model. The differences in wetland areas between the two dynamic products (WAD2Mv2 and GIEMS2) mostly affected emissions in May and June in WetCH4, but they significantly affected emission magnitudes in UpCH4. Despite the differences in wetland areas, the phases of emissions cycles of WetCH4 were consistent with those from Peltola et al. (2019), whereas UpCH4 again lagged by a month.
We compared upscaled seasonal cycles with CH4 fluxes estimated from regional airborne measurements taken during CARVE campaigns over the Alaskan North Slope (Fig. 7d). Given that the wetland area in this region is uncertain (Miller et al., 2016), we computed mean seasonal cycles over land assuming that all land in this area is water-saturated in the soil, over freshwater wetlands of CALU, and over WAD2M and HydroLAKES, representing three different scenarios. In the lowland area of the North Slope (74 295 km2 spanning between 69.8 and 71.4° N and between 164.4 and 152.7° W), the wetland area was estimated at 10 611 km2 from CALU, 4800 km2 from GLWD v2, and 4049 km2 from the maximum extent month in July of WAD2Mv2, respectively. The range of our upscaled estimates aligned with regional emissions derived from CARVE measurements. Chang et al. (2014) estimated 7±2 mg CH4 m−2 d−1 of mean CH4 fluxes during the growing season in the North Slope region from the column analysis of CARVE data. The mean fluxes (May–September) of WetCH4 with CALU were estimated at 7.3±0.8 mg CH4 m−2 d−1 (5.5±0.6 mgC CH4 m−2 d−1), which is within the range of various CARVE estimations (Miller et al., 2016). The landscape is in the biome of the Arctic coastal tundra and is covered by sedges, grasses, mosses, and dwarf shrubs. A large number of lakes and freshwater ponds are scattered across the area. Studies carried out on the western Alaska lowland of the Yukon–Kuskokwim Delta found aquatic fluxes that were about 10 times higher than in wet tundra during September (Ludwig et al., 2023), suggesting that a major source of the airborne fluxes missing in WetCH4 in the late growing season can be attributed to open-water fluxes. Remarkable increases could occur in summer and winter if we assume wetland over this region, as indicated by the range between the green and black lines in Fig. 8d. However, future emissions due to permafrost thaw still depend on the hydrological changes in the landscape.
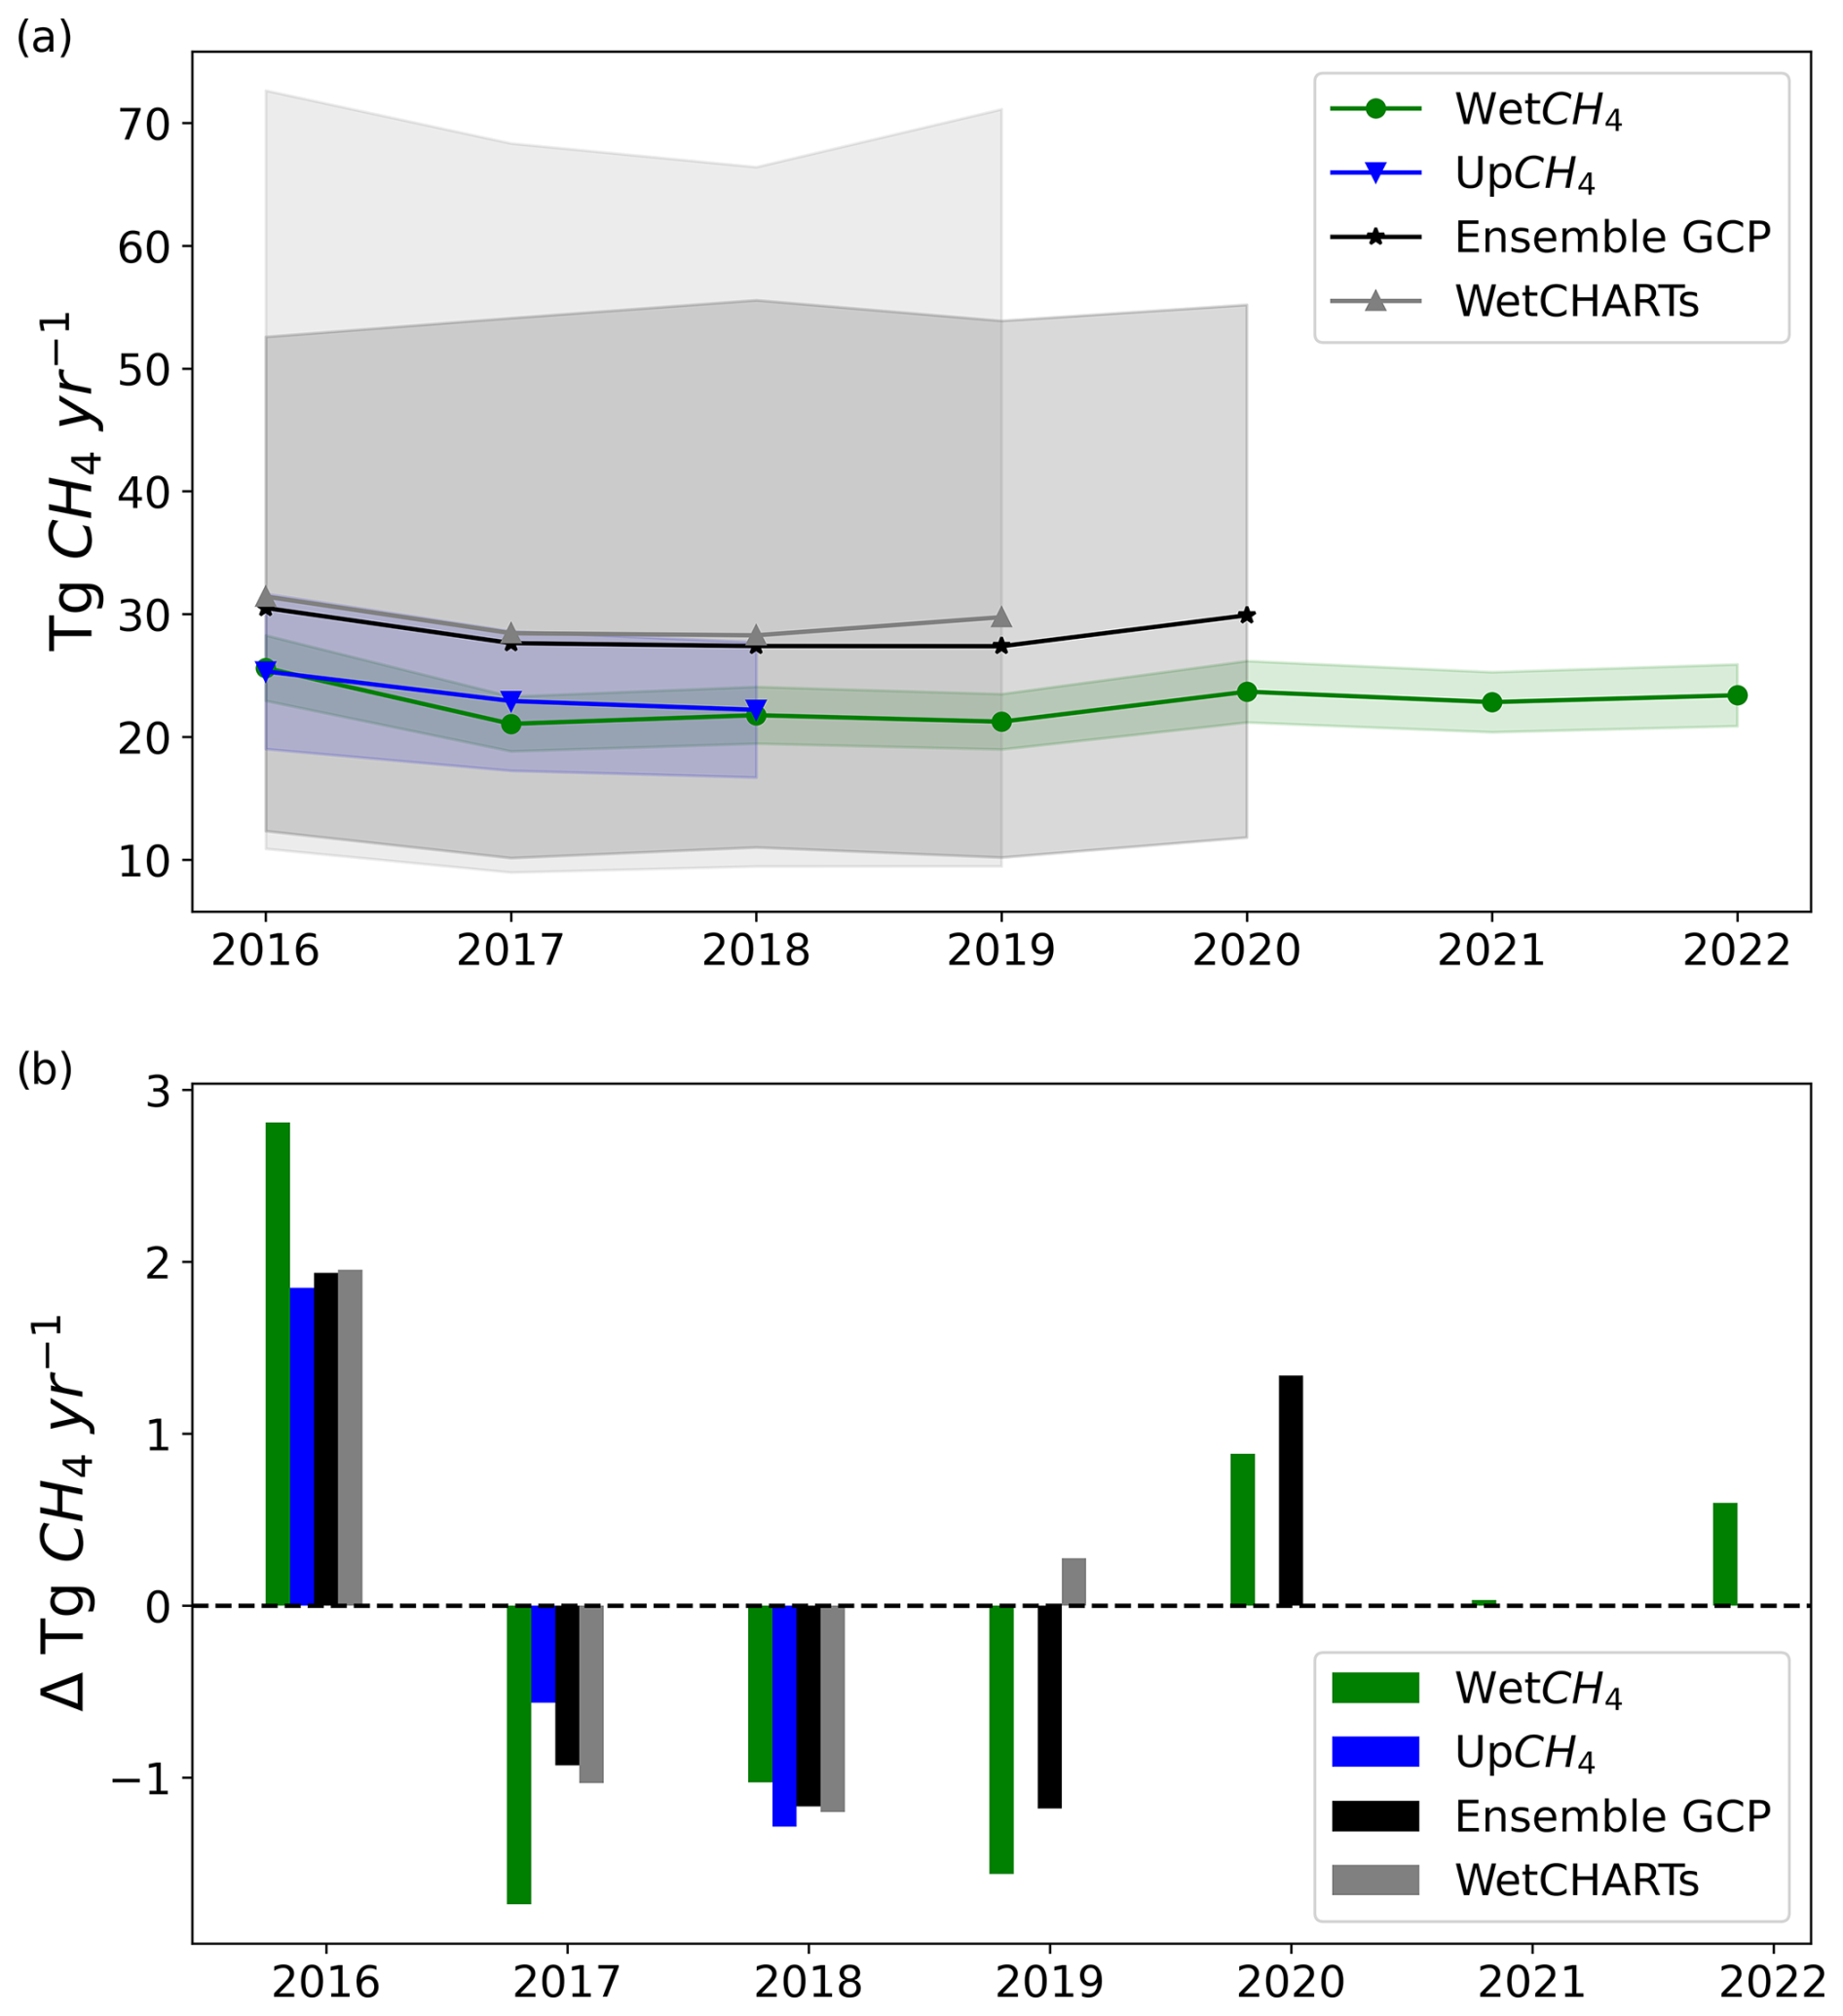
Figure 8Wetland CH4 (a) annual emissions and associated uncertainties (colored shades) and (b) variations relative to multiyear means in the research domain (45–90° N). Wetland area data applied in WetCH4 and UpCH4 were WAD2Mv2. The time periods of the multiyear means are as follows: WetCH4 (2016–2022), UpCH4 (2016–2018), GCP bottom-up ensemble mean (2016–2020), and WetCHARTs (2016–2019).
3.2.3 Interannual variations in wetland CH4 emissions
The mean annual emissions from ML-based estimates with WAD2M were lower than the GCP bottom-up ensemble mean and WetCHARTs over different years from 2016 forward in time (Fig. 8a). All products demonstrated similar emission patterns for the domain in the interannual trends and variations, which were highest in 2016 and lower for the 3 years from 2017 to 2019 (Fig. 8). The interannual variations in WetCH4 were driven by the interannual variability in the upscaled fluxes, as only multiyear mean seasonal dynamics from WAD2Mv2 were used. All products identified intensified emissions in 2016, as indicated by the variations relative to period means (Fig. 8b). Higher-than-period-average emissions in 2020 were also modeled by WetCH4 and the ensemble GCP.
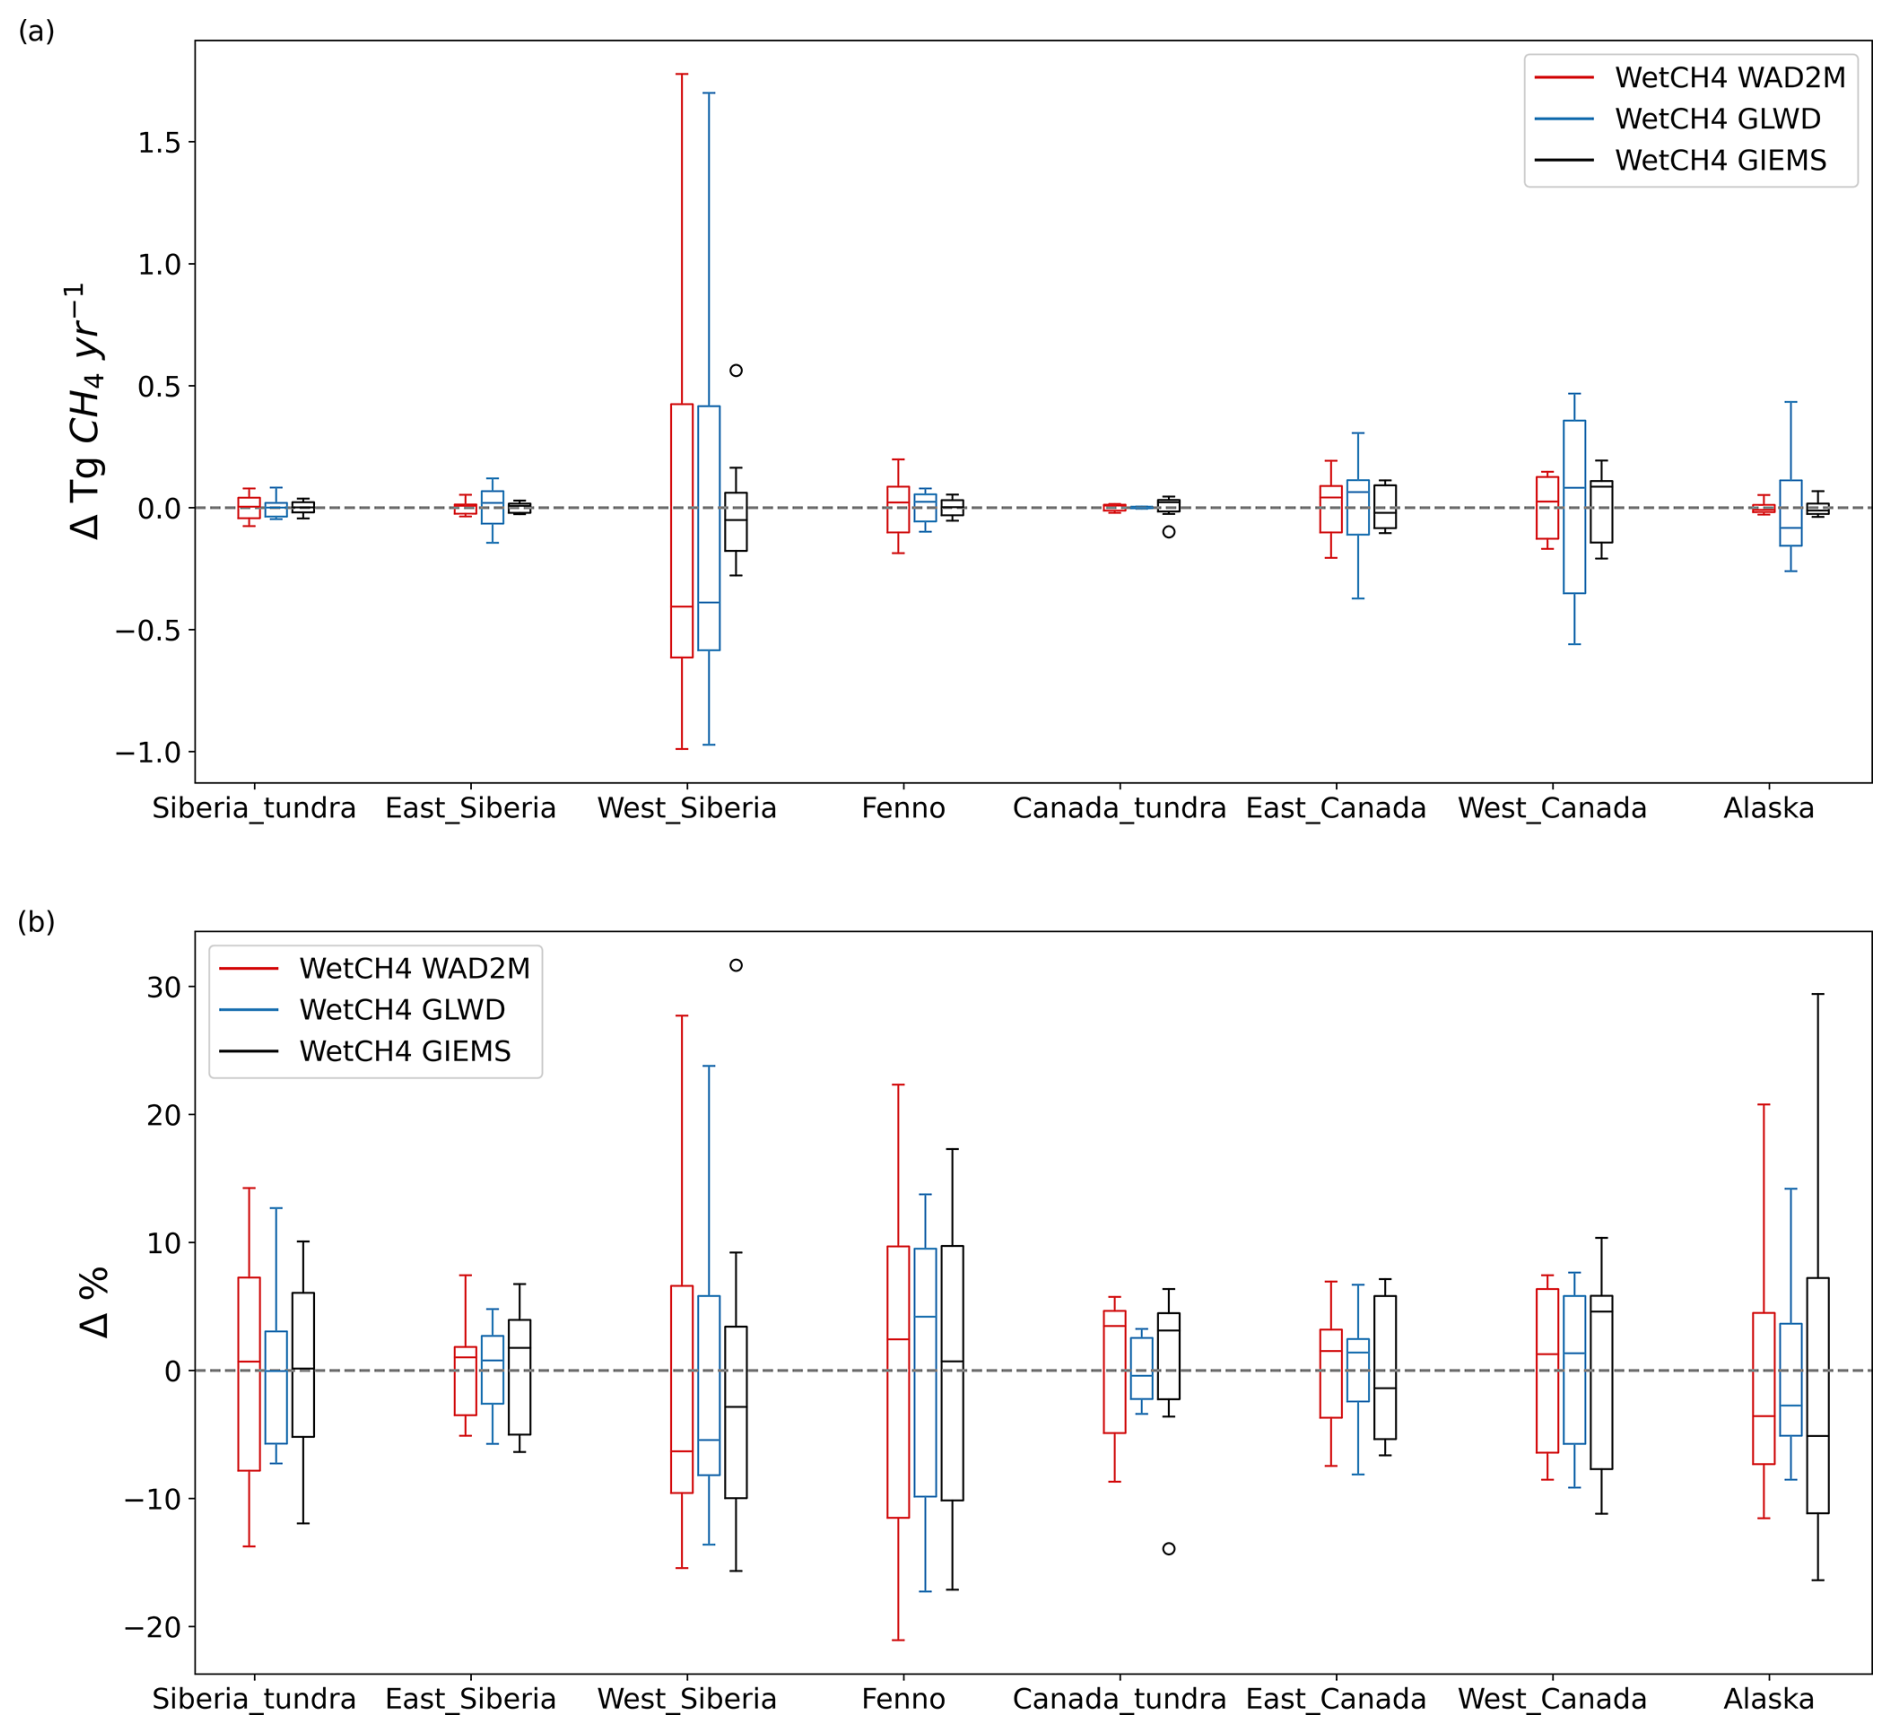
Figure 9Interannual variations and variability in subregions predicted by WetCH4 with WAD2Mv2, GLWDv1, and GIEMS2, respectively: (a) interannual variations with respect to period means (2016–2022); (b) relative variability as the percentage of its period mean. Delta on the y axis denotes the annual emissions minus mean annual emissions in the 2016–2022 period. The box plots show the first quartile, the median, and the third quartile of the data, with the whiskers denoting 1.5× the interquartile range below or above the first or third quartile, respectively.
Subregional annual emissions and interannual variability (Fig. 9) for WetCH4 were calculated for eight subregions in the northern high latitudes (Fig. S11): Siberian tundra, Eastern Siberia, Western Siberia, Fennoscandia, Canadian tundra, Eastern Canada, Western Canada, and Alaska. The main differences in WetCH4-estimated emissions between WAD2Mv2 and GLWDv1 occurred in the Eastern Siberia, Eastern Canada, Western Canada, and Alaska subregions. However, interannual variabilities were similar. Interannual variation from Western Siberia accounted for 51 % of the variation in domain emissions (Fig. 9a). The positive change in Eastern Canada canceled the negative change in Western Siberia in 2021, resulting in low variability in the domain emissions for that year (Fig. 8). The relative interannual variability, which was calculated as the percentage of a subregional variation to its period mean emission, was attributed to variability from Western Siberia, Fennoscandia, Western Canada, and Alaska (Fig. 9b).
This study provides new estimates of daily-scale 10 km wetland CH4 fluxes for the northern terrestrial wetland region, upscaled from EC data. The upscaling framework was driven by MERRA-2 meteorological variables and soil temperatures and constrained by satellite products from SMAP soil moisture and MODIS NBAR, resulting in a good prediction accuracy (mean R2=0.70 and mean MAE = 27 nmol m−2 s−1) for monthly mean fluxes. Model agreement worsened at daily and weekly time steps due to higher variability in CH4 fluxes at finer temporal resolutions. In our framework, we applied a rigorous criterion on the counts of half-hourly observations to control the selection quality of daily gap-filled data, which may filter out errors introduced by the gap-filling process or lack of observations for calculating daily means. The improvement in model performance can be partly attributed to the inclusion of soil temperature, satellite assimilation of soil moisture, and MODIS vegetation reflectance in the framework that represents controlling factors or proxies for CH4 fluxes recognized in field experiments and synthesis studies (Fig. 3).
4.1 Important drivers to improve RF model predictive performance
Soil temperature plays an important role in microbial growth and dormancy (Chadburn et al., 2020) and exponentially affects microbial CH4 emission rates, although the temperature sensitivity varies across space and time (van Hulzen et al., 1999; Knox et al., 2021). In northern wetlands, soil temperature is often more spatially variable relative to air temperature due to snow insulation and the active-layer depth (Smith et al., 2022; Wang et al., 2016; Yuan et al., 2022); thus, it should be considered in upscaling models. Compared to air temperature or land surface temperature, which have been used in previous upscaling studies (McNicol et al., 2023; Peltola et al., 2019), the inclusion of MERRA-2 soil temperatures in WetCH4 likely contributed to a higher model predictive performance, although the impacts of the scale mismatch between the native MERRA-2 spatial resolution and the local footprints on the upscaled fluxes were not quantified. Independent validation studies found significant correlations in the temporal trend and seasonal cycles between MERRA-2 soil temperatures and in situ observations (Li et al., 2020; Ma et al., 2021) in the US and midlatitude Eurasia. However, lower correlations and overestimated monthly variability were found in the cold season throughout the Arctic (Herrington et al., 2024). This suggests that the impact of the uncertainty in MERRA-2 soil temperatures was concentrated in the cold season, when CH4 fluxes were low. The agreement between the ensemble means of soil temperatures from eight reanalysis and land data assimilation system products and station measurements improved in the pan-Arctic region (Herrington et al., 2024), suggesting the potential to reduce upscaling uncertainty forced by the ensemble mean of reanalysis datasets.
Emergent vegetation with aerenchyma affects the recent substrate availability and the plant-mediated transport of CH4 (Kyzivat et al., 2022; Melack and Hess, 2023). We used the full land bands of the MODIS NBAR product, rather than the derived vegetation indices employed in previous upscaling studies, as signals indicating that wetland vegetation functional characteristics may be lost when merging bands to derive simple vegetation indices (Chen et al., 2013). In our study, the near-infrared and shortwave-infrared bands (NBAR bands 2, 5, and 7) presented relatively high importance in the RF model due to their associations with vegetation characteristics and water table dynamics in northern peatlands (Baskaran et al., 2022; Burdun et al., 2023). Satellite inputs provide high-spatial-resolution constraints on the environmental variability and help reduce spatial model predictive errors (Fig. 3), indicating the requirement for high-spatial-resolution driving input to accurately model wetland CH4 fluxes (Elder et al., 2021).
Surface and root zone soil moisture are important controls on ecosystem anaerobic metabolism. Low soil moisture implies aerobic conditions and allows methanotrophic bacteria to consume CH4, whereas high soil moisture enables CH4 production and suppresses consumption (Liebner et al., 2011; Olefeldt et al., 2013; Spahni et al., 2011). Soil wetness estimated in the root zone and the profile from SMAP measurements may be able to capture water table dynamics; hence, it ranked as important with respect to the WetCH4 model performance. Validation of the SMAP Level-4 soil moisture data assimilation product has shown that it meets the performance requirement of an unbiased root-mean-square error < 0.04 m3 m−3 (Colliander et al., 2022). However, the validation sites are mostly located in North American grassland, cropland, and shrubland, requiring more in situ soil moisture observations in high-latitude tundra and peatland. Regional validation studies suggested that uncertainties in satellite-derived soil moisture including SMAP at high latitudes were high (Högström et al., 2018; Wrona et al., 2017) and remained to be addressed.
Underground processes of CH4 production and oxidation are difficult to model (Ueyama et al., 2023b), especially for seasonal cycles in the northern high latitudes. A hysteresis effect that manifests intra-seasonal variability in the dependence of CH4 fluxes on temperature has been observed at EC sites (Chang et al., 2021), but it was not reproduced in WetCH4. Positive hysteresis and the difference in frozen status from topsoil to deep soil during the fall freeze results in zero-curtain periods that have been observed in high-latitude tundra (Bao et al., 2021; Zona et al., 2016), the occurrence of which was subsequently underestimated in our model.
The amount of additional substrate available for methanogenesis due to soil freezing/thawing, missing in our framework, could be a controlling factor on the occurrence of this phenomenon. Higher substrate availability elevates methanogen abundance and activities during the fall freeze (Bao et al., 2021). However, spatially explicit substrate data are not available. Using proxies such as net primary production or the EVI for substrate availability might be oversimplified (Larmola et al., 2010; Li et al., 2016; Peltola et al., 2019). In addition, the uncertainty in the deep-soil temperature of training inputs in late fall may hinder the model's ability to capture patterns of high emissions during zero-curtain periods observed in the Alaskan tundra (Fig. S10). More temporally accurate soil temperature data are needed to delineate the soil freezing progress and properly constrain predictions of CH4 emission during the cold season (Arndt et al., 2019). The UpCH4 results (McNicol et al., 2023) also suggest that simply imposing lags on temporal predictors in RF cannot capture complex intra-seasonal variability due to the complicated lag effects interacting with the water table depth (Turner et al., 2021). Without timestamps for predictors, RF treats time series' fluxes independently, which may limit its predictive performance. Deep learning models designed to account for temporal progress in data, such as long short-term memory (LSTM) neural networks, may improve the modeling accuracy of seasonal cycles (Reichstein et al., 2019; Yuan et al., 2022).
4.2 Data limitations in current EC CH4 observations
Data deficiency in EC CH4 flux observations in winter and in underrepresented areas limited the RF model's extrapolation ability. Data abundance and representativeness across space, time, and wetland types drives model performance and the ability to extrapolate for the data-driven approach. The 26 wetland EC sites included in this study are largely located in Fennoscandia, Eastern Canada, and Alaska (Fig. 2), leaving some regional emission hotspots underrepresented. For instance, the Western Siberian Lowlands, a large wetland complex and a major contributor of interannual variation in CH4 in the region, comprise a region with little data. The nearest site (RU-VRK, not included in this study due to the fact that observations occurred before our study period) is situated on the western side of the Ural Mountains, within the Usa River depression. Cold-season emissions could contribute a substantial fraction of the annual Arctic tundra CH4 budget (Mastepanov et al., 2008; Mavrovic et al., 2024; Zona et al., 2016). However, after filtering, 23 % of the EC data in high latitudes (>60° N) were recorded between November and March, which could be insufficient for accurately modeling and upscaling zero-curtain-period fluxes.
A total of 10 bog and fen sites used for modeling contain all-season daily flux records with more than 11 half-hourly observations per day, all from Fennoscandia and Canada. Although Alaska is represented by 11 wetland sites, sufficient winter observations with good quality are still needed. The Western Siberian Lowlands are underrepresented by EC CH4 sites. Missing data in MODIS NBAR due to snow cover or gaps in SMAP reduced training data by 31 % and 48 % in the study domain, respectively. Filling data of MODIS NBAR to account for snow cover information and gap-filling SMAP soil moisture products can make full use of available EC observations and help improve model performance in the cold seasons. As gaps in winter SMAP data were filled with zero values, our approach has limitations with respect to the estimation of winter soil moisture gaps in areas where the zero-curtain period and talik were not represented by our interpolated soil temperatures (e.g., in coastal areas).
Many wetland sites in the study are located in areas with peatland presence, with 35 % of sites in peatland-rich areas with >50 % peatland cover (Hugelius et al., 2020). Mineral soil (soil containing less than 12 % organic carbon by weight) marshes, although covering only 5 % of the total wetland area in the northern high latitudes, need to be considered when deploying new EC sites due to their high CH4 emissions (Kuhn et al., 2021; Olefeldt et al., 2021). This study identified regional CH4 emission hotspots and areas undergoing strong interannual variations that are yet not part of the current FLUXNET network. However, the 10 km resolution of the RF estimates prohibits the identification of local hotspots that may occur at <1–10 m scales (Elder et al., 2021). The wall-to-wall flux maps also provide spatially continuous information to effectively further develop the CH4 flux tower network.
4.3 Budget comparison
WetCH4 estimated annual and seasonal mean emissions that were comparable to existing data-driven products in the study domain (Table S5). With the dynamic WAD2Mv2 map, our estimation was 0.7 Tg CH4 yr−1 smaller than UpCH4 due to the mean seasonal cycles between 2010 and 2020 from WAD2M applied in our estimation. With the same static GLWDv1 map, our estimation was about 22 % larger than the estimate from Peltola et al. (2019) (37.5±12 Tg CH4 yr−1 for 2013–2014), despite the different periods. This is attributed to higher fluxes estimated by WetCH4 in the DJF and JJA seasons. With two versions of the static GLWD maps, we estimated potential annual emissions of between 46.0 and 51.6 Tg CH4 yr−1. Compared to GLWDv1, version 2 of GLWD mapped smaller wetland fractions in the Hudson Bay Lowlands with intense CH4 fluxes and more wetlands in the northwest of the Ural Mountains, Eastern Siberia, and the Sanjiang Plain, where CH4 intensities were weaker, resulting in a larger estimate of the annual emission (Fig. S13). The wide range of data-driven estimates stemmed from the differences in wetland maps. While WAD2M provides crucial information on wetland inundation dynamics controlling interannual and inter-seasonal changes in CH4-emitting areas, areas with saturated soil in the Arctic tundra are likely severely underestimated (Fig. 7d), requiring more accurate maps delineating wet tundra communities at higher spatial resolution (e.g., <1 km). Incorporating wetland fractions derived from high-resolution thematic maps (e.g., CALU) can improve the use of WAD2M in cold regions. Development or improvement of higher-resolution microwave remote-sensing products capable of tracking dynamic changes in local soil moisture conditions is also needed. Together, these two components likely currently yield the largest sources of uncertainty in high-latitude terrestrial CH4 budgets.
Bottom-up estimates of wetland CH4 emissions from data-driven GCP ensemble means and WetCHARTs are smaller than the top-down CarbonTracker-CH4 estimate of natural microbial emissions, as the latter includes emissions from aquatic systems. Aquatic CH4 emissions for this region have been estimated at 5.5 Tg CH4 yr−1 from rivers and streams (Rocher-Ros et al., 2023) and at 16.6 Tg CH4 yr−1 from lakes (Johnson et al., 2022). The total emission budget for wetlands and open water, based on this study and the aquatic estimates, is about 44.9 Tg CH4 yr−1, which is 4 Tg CH4 yr−1 more than the CarbonTracker-CH4 estimate. The amplitudes of the WetCH4 seasonal mean fluxes align with bottom-up and top-down estimates. Differences in the seasonal dynamics of wetland maps are the major source of upscaling uncertainty and result in various uncertainties between regional estimates. While atmospheric inversion models need bottom-up estimates as priors, data-driven, upscaled CH4 products offer alternatives to process-based estimates to assist with inversion models in regions where data-driven models perform well (Bloom et al., 2017; Melton et al., 2013).
4.4 Future directions
Future development of EC networks in the northern high latitudes is urgently required to provide the additional observations needed to improve the model-based upscaling of CH4 flux budgets and to address current gaps in the ecosystem- and regional-scale representation. Deploying new sites in underrepresented areas will not only benefit flux upscaling efforts but also our understanding of how ecosystem metabolism responds to the changing climate (Baldocchi, 2020; Pallandt et al., 2022; Villarreal and Vargas, 2021). With the availability of long-term predictor variable data, it is possible to expand upscaling frameworks over longer periods (e.g., 2000 to the present), when adequate flux observations in 2000–2010 from chambers are compiled, as 96 % of the data in FLUXNET-CH4 were recorded after 2010 (McNicol et al., 2023).
Several data products exist for the meteorological predictor variables. Quantification of the measurement uncertainties between products of predictor variables and how the uncertainties propagate to upscaling products need to be addressed in future work. The mismatch of spatial scales between tower footprints and predictor variables may cause the underestimation of abruptly high fluxes measured in tower landscapes when environmental conditions are averaged over 0.5° grids (Chu et al., 2021; McNicol et al., 2023). Therefore, downscaling predictor variables to develop higher-resolution products is needed, especially for the Arctic region, where thermokarst development is shaping permafrost landscapes with fragments of wetlands, thermokarst ponds, and forests (Miner et al., 2022; Osterkamp et al., 2000; Wik et al., 2016). For example, Fang et al. (2022) downscaled global SMAP surface soil moisture to 1 km resolution, and optical/thermal and microwave fusion methods have been developed to downscale soil moisture (Peng et al., 2017). Nevertheless, downscaled products for root zone or profile soil moisture are needed for upscaling CH4 fluxes, as are soil temperature products.
Beyond the ML-based upscaling framework, hybrid modeling of the data-driven approach and process-based models is a promising but challenging direction of future study (Reichstein et al., 2019). One practice constrained regional data-driven fluxes with top-down estimates via auto-learned weights on per-pixel fluxes in a region (Upton et al., 2024). Another practice pretrained a time-dependent ML algorithm with initialization from process-based synthetic data and then fine-tuned the model with observations (Liu et al., 2022). Finally, leveraging physical constraints to increase the interpretability of data-driven models and computational efficiency is still an important factor to consider in all hybrid modeling.
The daily CH4 flux intensities in the northern wetlands at a spatial resolution of 0.098°×0.098° and the associated uncertainties, along with daily emissions weighted by WAD2M, GIEMS2, and GLWDv1, can be accessed at https://doi.org/10.5281/zenodo.10802153 (Ying et al., 2024). The source code for the ML modeling and upscaling is publicly available at https://doi.org/10.5281/zenodo.10882613 (Ying, 2024).
We developed an ML framework (WetCH4) to upscale daily wetland CH4 fluxes of mid-high northern latitudes at 10 km spatial resolution that combines EC tower measurements with satellite observations and climate reanalysis. WetCH4 is novel in that it is the first upscaling framework to introduce SMAP soil moisture and MODIS reflectance in modeling wetland CH4 fluxes to improve accuracy (mean R2=0.70). The remote-sensing products provided high-spatial-resolution constraints associated with the abiotic controllers of CH4 fluxes, indicating the importance of using high-spatial-resolution inputs in models for accurately simulating the spatiotemporally variable CH4 emissions from heterogeneous northern wetland landscapes. The framework highlights the importance of soil temperature, vegetation, and soil moisture for modeling CH4 fluxes with a data-driven approach. Using WetCH4, an average annual CH4 emissions of 22.8±2.4 Tg CH4 yr−1 with WAD2Mv2 was estimated and ranged between 15.7±1.8 Tg CH4 yr−1 with GIEMS2 and 51.6±2.2 Tg CH4 yr−1with GLWD v2 from vegetated wetlands (>45° N) for 2016–2022, approximately 14 %–32 % of the global wetland CH4 budget (Saunois et al., 2020). Differences in estimates of wetland CH4 emissions due to different wetland maps applied, highlighting the need for high-resolution wetland maps and the accurate delineation of wet soil dynamics. Emissions were relatively lower in 2017–2019 and intensified in 2016, 2020, and 2022, with the largest interannual variations coming from Western Siberia. Spatiotemporal distributions of CH4 fluxes find emission hotspots and regions of intensified interannual variations that are not currently measured with EC. Based on a comparison with current EC sites, we suggest the need for tower observations in the wetlands of Western Siberia and Western Canada and diversified observations across wetland types. More site observations of soil-water-related variables are needed to improve the understanding of flux controls in northern wetland ecosystems. Future wetland CH4 upscaling work could benefit from improved soil moisture products and hybrid modeling.
The supplement related to this article is available online at https://doi.org/10.5194/essd-17-2507-2025-supplement.
QY, ZZ, and BP designed the study. QY conducted data processing, model development, and wrote the draft of the manuscript. QY, ZZ, JW, KA, AV, BR, LB, YO, and BP performed data analysis. All authors contributed to the analysis of results and writing the manuscript.
The contact author has declared that none of the authors has any competing interests.
The statements, findings, conclusions, and recommendations are those of the author(s) and do not necessarily reflect the views of NOAA or the US Department of Commerce.
Publisher's note: Copernicus Publications remains neutral with regard to jurisdictional claims made in the text, published maps, institutional affiliations, or any other geographical representation in this paper. While Copernicus Publications makes every effort to include appropriate place names, the final responsibility lies with the authors.
Resources supporting this work were provided by the NASA High-End Computing (HEC) program through the NASA Center for Climate Simulation (NCCS) at Goddard Space Flight Center. We thank Sara Knox and Gavin McNicol for their helpful suggestions in the early stages of the compilation of EC CH4 fluxes and the development of the upscaling product, respectively. We thank Frans-Jan Parmentier and the anonymous reviewer for their helpful review comments that improved the paper. We would also like to acknowledge the research teams contributing to the FLUXNET-CH4 and in situ data used in this study.
This work was supported by funding catalyzed by the TED Audacious Project (Permafrost Pathways). Ben Poulter acknowledges support from the NASA Terrestrial Ecology program. Aram Kalhori was supported by the European Union's Horizon Europe program (grant no. 101056848). Youmi Oh was supported by NOAA cooperative agreement no. NA22OAR4320151. Olli Peltola was supported by the Research Council of Finland (grant no. 354298). Mathias Göckede and Annett Bartsch were supported by ERC Q-Arctic (grant no. 951288) and ESA AMPAC-Net (grant no. 4000137912/22/I-DT). Eugénie Euskirchen acknowledges support to the flux towers (US-BZF and US-BZB) from NSF grant nos. DEB LTREB 1354370, DEB LTREB 2011257, DEB-0425328, DEB-0724514, and DEB-0830997. The US Geological Survey also provided funding through the Climate R&D Program. The US-ICS tower is supported by NSF Arctic Observatory Network grant nos. 1936752, 1503912, and 1107892.
This paper was edited by Andrea Popp and reviewed by Frans-Jan W. Parmentier and one anonymous referee.
Alonso, A., Muñoz-Carpena, R., and Kaplan, D.: Coupling high-resolution field monitoring and MODIS for reconstructing wetland historical hydroperiod at a high temporal frequency, Remote Sens. Environ., 247, 111807, https://doi.org/10.1016/j.rse.2020.111807, 2020.
Amatulli, G., McInerney, D., Sethi, T., Strobl, P., and Domisch, S.: Geomorpho90m, empirical evaluation and accuracy assessment of global high-resolution geomorphometric layers, Sci. Data, 7, 162, https://doi.org/10.1038/s41597-020-0479-6, 2020.
Arndt, K. A., Oechel, W. C., Goodrich, J. P., Bailey, B. A., Kalhori, A., Hashemi, J., Sweeney, C., and Zona, D.: Sensitivity of Methane Emissions to Later Soil Freezing in Arctic Tundra Ecosystems, J. Geophys. Res.-Biogeo., 124, 2595–2609, https://doi.org/10.1029/2019JG005242, 2019.
Avis, C. A., Weaver, A. J., and Meissner, K. J.: Reduction in areal extent of high-latitude wetlands in response to permafrost thaw, Nat. Geosci., 4, 444–448, https://doi.org/10.1038/ngeo1160, 2011.
Aydin, M., Verhulst, K. R., Saltzman, E. S., Battle, M. O., Montzka, S. A., Blake, D. R., Tang, Q., and Prather, M. J.: Recent decreases in fossil-fuel emissions of ethane and methane derived from firn air, Nature, 476, 198–201, https://doi.org/10.1038/nature10352, 2011.
Baldocchi, D. D.: Assessing the eddy covariance technique for evaluating carbon dioxide exchange rates of ecosystems: past, present and future, Global Change Biol., 9, 479–492, https://doi.org/10.1046/j.1365-2486.2003.00629.x, 2003.
Baldocchi, D. D.: How eddy covariance flux measurements have contributed to our understanding of Global Change Biology, Global Change Biol., 26, 242–260, https://doi.org/10.1111/gcb.14807, 2020.
Bansal, S., Post van der Burg, M., Fern, R. R., Jones, J. W., Lo, R., McKenna, O. P., Tangen, B. A., Zhang, Z., and Gleason, R. A.: Large increases in methane emissions expected from North America's largest wetland complex, Sci. Adv., 9, eade1112, https://doi.org/10.1126/sciadv.ade1112, 2023.
Bao, T., Xu, X., Jia, G., Billesbach, D. P., and Sullivan, R. C.: Much stronger tundra methane emissions during autumn freeze than spring thaw, Global Change Biol., 27, 376–387, https://doi.org/10.1111/gcb.15421, 2021.
Baray, S., Jacob, D. J., Maasakkers, J. D., Sheng, J.-X., Sulprizio, M. P., Jones, D. B. A., Bloom, A. A., and McLaren, R.: Estimating 2010–2015 anthropogenic and natural methane emissions in Canada using ECCC surface and GOSAT satellite observations, Atmos. Chem. Phys., 21, 18101–18121, https://doi.org/10.5194/acp-21-18101-2021, 2021.
Bartsch, A., Efimova, A., Widhalm, B., Muri, X., von Baeckmann, C., Bergstedt, H., Ermokhina, K., Hugelius, G., Heim, B., and Leibman, M.: Circumarctic land cover diversity considering wetness gradients, Hydrol. Earth Syst. Sci., 28, 2421–2481, https://doi.org/10.5194/hess-28-2421-2024, 2024.
Baskaran, L., Elder, C., Bloom, A. A., Ma, S., Thompson, D., and Miller, C. E.: Geomorphological patterns of remotely sensed methane hot spots in the Mackenzie Delta, Canada, Environ. Res. Lett., 17, 015009, https://doi.org/10.1088/1748-9326/ac41fb, 2022.
Beaulieu, J. J., Waldo, S., Balz, D. A., Barnett, W., Hall, A., Platz, M. C., and White, K. M.: Methane and Carbon Dioxide Emissions From Reservoirs: Controls and Upscaling, J. Geophys. Res.-Biogeo., 125, e2019JG005474, https://doi.org/10.1029/2019JG005474, 2020.
Bergamaschi, P., Houweling, S., Segers, A., Krol, M., Frankenberg, C., Scheepmaker, R. A., Dlugokencky, E., Wofsy, S. C., Kort, E. A., Sweeney, C., Schuck, T., Brenninkmeijer, C., Chen, H., Beck, V., and Gerbig, C.: Atmospheric CH4 in the first decade of the 21st century: Inverse modeling analysis using SCIAMACHY satellite retrievals and NOAA surface measurements, J. Geophys. Res.-Atmos., 118, 7350–7369, https://doi.org/10.1002/jgrd.50480, 2013.
Bloom, A. A., Palmer, P. I., Fraser, A., Reay, D. S., and Frankenberg, C.: Large-Scale Controls of Methanogenesis Inferred from Methane and Gravity Spaceborne Data, Science, 327, 322–325, https://doi.org/10.1126/science.1175176, 2010.
Bloom, A. A., Bowman, K. W., Lee, M., Turner, A. J., Schroeder, R., Worden, J. R., Weidner, R., McDonald, K. C., and Jacob, D. J.: A global wetland methane emissions and uncertainty dataset for atmospheric chemical transport models (WetCHARTs version 1.0), Geosci. Model Dev., 10, 2141–2156, https://doi.org/10.5194/gmd-10-2141-2017, 2017.
Bodesheim, P., Jung, M., Gans, F., Mahecha, M. D., and Reichstein, M.: Upscaled diurnal cycles of land–atmosphere fluxes: a new global half-hourly data product, Earth Syst. Sci. Data, 10, 1327–1365, https://doi.org/10.5194/essd-10-1327-2018, 2018.
Breiman, L.: Random Forests, Mach. Learn., 45, 5–32, https://doi.org/10.1023/A:1010933404324, 2001.
Bruhwiler, L., Dlugokencky, E., Masarie, K., Ishizawa, M., Andrews, A., Miller, J., Sweeney, C., Tans, P., and Worthy, D.: CarbonTracker-CH4: an assimilation system for estimating emissions of atmospheric methane, Atmos. Chem. Phys., 14, 8269–8293, https://doi.org/10.5194/acp-14-8269-2014, 2014.
Burdun, I., Bechtold, M., Aurela, M., De Lannoy, G., Desai, A. R., Humphreys, E., Kareksela, S., Komisarenko, V., Liimatainen, M., Marttila, H., Minkkinen, K., Nilsson, M. B., Ojanen, P., Salko, S.-S., Tuittila, E.-S., Uuemaa, E., and Rautiainen, M.: Hidden becomes clear: Optical remote sensing of vegetation reveals water table dynamics in northern peatlands, Remote Sens. Environ., 296, 113736, https://doi.org/10.1016/j.rse.2023.113736, 2023.
Chadburn, S. E., Aalto, T., Aurela, M., Baldocchi, D., Biasi, C., Boike, J., Burke, E. J., Comyn-Platt, E., Dolman, A. J., Duran-Rojas, C., Fan, Y., Friborg, T., Gao, Y., Gedney, N., Göckede, M., Hayman, G. D., Holl, D., Hugelius, G., Kutzbach, L., Lee, H., Lohila, A., Parmentier, F.-J. W., Sachs, T., Shurpali, N. J., and Westermann, S.: Modeled Microbial Dynamics Explain the Apparent Temperature Sensitivity of Wetland Methane Emissions, Global Biogeochem. Cy., 34, e2020GB006678, https://doi.org/10.1029/2020GB006678, 2020.
Chang, K.-Y., Riley, W. J., Knox, S. H., Jackson, R. B., McNicol, G., Poulter, B., Aurela, M., Baldocchi, D., Bansal, S., Bohrer, G., Campbell, D. I., Cescatti, A., Chu, H., Delwiche, K. B., Desai, A. R., Euskirchen, E., Friborg, T., Goeckede, M., Helbig, M., Hemes, K. S., Hirano, T., Iwata, H., Kang, M., Keenan, T., Krauss, K. W., Lohila, A., Mammarella, I., Mitra, B., Miyata, A., Nilsson, M. B., Noormets, A., Oechel, W. C., Papale, D., Peichl, M., Reba, M. L., Rinne, J., Runkle, B. R. K., Ryu, Y., Sachs, T., Schäfer, K. V. R., Schmid, H. P., Shurpali, N., Sonnentag, O., Tang, A. C. I., Torn, M. S., Trotta, C., Tuittila, E.-S., Ueyama, M., Vargas, R., Vesala, T., Windham-Myers, L., Zhang, Z., and Zona, D.: Substantial hysteresis in emergent temperature sensitivity of global wetland CH4 emissions, Nat. Commun., 12, 2266, https://doi.org/10.1038/s41467-021-22452-1, 2021.
Chang, R. Y.-W., Miller, C. E., Dinardo, S. J., Karion, A., Sweeney, C., Daube, B. C., Henderson, J. M., Mountain, M. E., Eluszkiewicz, J., Miller, J. B., Bruhwiler, L. M. P., and Wofsy, S. C.: Methane emissions from Alaska in 2012 from CARVE airborne observations, P. Natl. Acad. Sci. USA, 111, 16694–16699, https://doi.org/10.1073/pnas.1412953111, 2014.
Chen, Y., Huang, C., Ticehurst, C., Merrin, L., and Thew, P.: An Evaluation of MODIS Daily and 8-day Composite Products for Floodplain and Wetland Inundation Mapping, Wetlands, 33, 823–835, https://doi.org/10.1007/s13157-013-0439-4, 2013.
Chu, H., Luo, X., Ouyang, Z., Chan, W. S., Dengel, S., Biraud, S. C., Torn, M. S., Metzger, S., Kumar, J., Arain, M. A., Arkebauer, T. J., Baldocchi, D., Bernacchi, C., Billesbach, D., Black, T. A., Blanken, P. D., Bohrer, G., Bracho, R., Brown, S., Brunsell, N. A., Chen, J., Chen, X., Clark, K., Desai, A. R., Duman, T., Durden, D., Fares, S., Forbrich, I., Gamon, J. A., Gough, C. M., Griffis, T., Helbig, M., Hollinger, D., Humphreys, E., Ikawa, H., Iwata, H., Ju, Y., Knowles, J. F., Knox, S. H., Kobayashi, H., Kolb, T., Law, B., Lee, X., Litvak, M., Liu, H., Munger, J. W., Noormets, A., Novick, K., Oberbauer, S. F., Oechel, W., Oikawa, P., Papuga, S. A., Pendall, E., Prajapati, P., Prueger, J., Quinton, W. L., Richardson, A. D., Russell, E. S., Scott, R. L., Starr, G., Staebler, R., Stoy, P. C., Stuart-Haëntjens, E., Sonnentag, O., Sullivan, R. C., Suyker, A., Ueyama, M., Vargas, R., Wood, J. D., and Zona, D.: Representativeness of Eddy-Covariance flux footprints for areas surrounding AmeriFlux sites, Agr. Forest Meteorol., 301–302, 108350, https://doi.org/10.1016/j.agrformet.2021.108350, 2021.
Colliander, A., Reichle, R. H., Crow, W. T., Cosh, M. H., Chen, F., Chan, S., Das, N. N., Bindlish, R., Chaubell, J., Kim, S., Liu, Q., O'Neill, P. E., Dunbar, R. S., Dang, L. B., Kimball, J. S., Jackson, T. J., Al-Jassar, H. K., Asanuma, J., Bhattacharya, B. K., Berg, A. A., Bosch, D. D., Bourgeau-Chavez, L., Caldwell, T., Calvet, J.-C., Collins, C. H., Jensen, K. H., Livingston, S., Lopez-Baeza, E., Martínez-Fernández, J., McNairn, H., Moghaddam, M., Montzka, C., Notarnicola, C., Pellarin, T., Greimeister-Pfeil, I., Pulliainen, J., Ramos Hernández, J. Gpe., Seyfried, M., Starks, P. J., Su, Z., van der Velde, R., Zeng, Y., Thibeault, M., Vreugdenhil, M., Walker, J. P., Zribi, M., Entekhabi, D., and Yueh, S. H.: Validation of Soil Moisture Data Products From the NASA SMAP Mission, IEEE J. Select. Top. Appl. Earth Obs. Remote Sens., 15, 364–392, https://doi.org/10.1109/JSTARS.2021.3124743, 2022.
Davidson, S. J., Santos, M. J., Sloan, V. L., Reuss-Schmidt, K., Phoenix, G. K., Oechel, W. C., and Zona, D.: Upscaling CH4 Fluxes Using High-Resolution Imagery in Arctic Tundra Ecosystems, Remote Sens., 9, 1227, https://doi.org/10.3390/rs9121227, 2017.
Delwiche, K. B., Knox, S. H., Malhotra, A., Fluet-Chouinard, E., McNicol, G., Feron, S., Ouyang, Z., Papale, D., Trotta, C., Canfora, E., Cheah, Y.-W., Christianson, D., Alberto, M. C. R., Alekseychik, P., Aurela, M., Baldocchi, D., Bansal, S., Billesbach, D. P., Bohrer, G., Bracho, R., Buchmann, N., Campbell, D. I., Celis, G., Chen, J., Chen, W., Chu, H., Dalmagro, H. J., Dengel, S., Desai, A. R., Detto, M., Dolman, H., Eichelmann, E., Euskirchen, E., Famulari, D., Fuchs, K., Goeckede, M., Gogo, S., Gondwe, M. J., Goodrich, J. P., Gottschalk, P., Graham, S. L., Heimann, M., Helbig, M., Helfter, C., Hemes, K. S., Hirano, T., Hollinger, D., Hörtnagl, L., Iwata, H., Jacotot, A., Jurasinski, G., Kang, M., Kasak, K., King, J., Klatt, J., Koebsch, F., Krauss, K. W., Lai, D. Y. F., Lohila, A., Mammarella, I., Belelli Marchesini, L., Manca, G., Matthes, J. H., Maximov, T., Merbold, L., Mitra, B., Morin, T. H., Nemitz, E., Nilsson, M. B., Niu, S., Oechel, W. C., Oikawa, P. Y., Ono, K., Peichl, M., Peltola, O., Reba, M. L., Richardson, A. D., Riley, W., Runkle, B. R. K., Ryu, Y., Sachs, T., Sakabe, A., Sanchez, C. R., Schuur, E. A., Schäfer, K. V. R., Sonnentag, O., Sparks, J. P., Stuart-Haëntjens, E., Sturtevant, C., Sullivan, R. C., Szutu, D. J., Thom, J. E., Torn, M. S., Tuittila, E.-S., Turner, J., Ueyama, M., Valach, A. C., Vargas, R., Varlagin, A., Vazquez-Lule, A., Verfaillie, J. G., Vesala, T., Vourlitis, G. L., Ward, E. J., Wille, C., Wohlfahrt, G., Wong, G. X., Zhang, Z., Zona, D., Windham-Myers, L., Poulter, B., and Jackson, R. B.: FLUXNET-CH4: a global, multi-ecosystem dataset and analysis of methane seasonality from freshwater wetlands, Earth Syst. Sci. Data, 13, 3607–3689, https://doi.org/10.5194/essd-13-3607-2021, 2021.
Elder, C. D., Thompson, D. R., Thorpe, A. K., Chandanpurkar, H. A., Hanke, P. J., Hasson, N., James, S. R., Minsley, B. J., Pastick, N. J., Olefeldt, D., Walter Anthony, K. M., and Miller, C. E.: Characterizing Methane Emission Hotspots From Thawing Permafrost, Global Biogeochem. Cy., 35, e2020GB006922, https://doi.org/10.1029/2020GB006922, 2021.
Entekhabi, D., Njoku, E. G., O'Neill, P. E., Kellogg, K. H., Crow, W. T., Edelstein, W. N., Entin, J. K., Goodman, S. D., Jackson, T. J., Johnson, J., Kimball, J., Piepmeier, J. R., Koster, R. D., Martin, N., McDonald, K. C., Moghaddam, M., Moran, S., Reichle, R., Shi, J. C., Spencer, M. W., Thurman, S. W., Tsang, L., and Van Zyl, J.: The Soil Moisture Active Passive (SMAP) Mission, Proc. IEEE, 98, 704–716, https://doi.org/10.1109/JPROC.2010.2043918, 2010.
Euskirchen, E. S., Edgar, C. W., Kane, E. S., Waldrop, M. P., Neumann, R. B., Manies, K. L., Douglas, T. A., Dieleman, C., Jones, M. C., and Turetsky, M. R.: Persistent net release of carbon dioxide and methane from an Alaskan lowland boreal peatland complex, Global Change Biol., 30, e17139, https://doi.org/10.1111/gcb.17139, 2024.
Fang, B., Lakshmi, V., Cosh, M., Liu, P.-W., Bindlish, R., and Jackson, T. J.: A global 1-km downscaled SMAP soil moisture product based on thermal inertia theory, Vadose Zone J., 21, e20182, https://doi.org/10.1002/vzj2.20182, 2022.
Feron, S., Malhotra, A., Bansal, S., Fluet-Chouinard, E., McNicol, G., Knox, S. H., Delwiche, K. B., Cordero, R. R., Ouyang, Z., Zhang, Z., Poulter, B., and Jackson, R. B.: Recent increases in annual, seasonal, and extreme methane fluxes driven by changes in climate and vegetation in boreal and temperate wetland ecosystems, Global Change Biol., 30, e17131, https://doi.org/10.1111/gcb.17131, 2024.
Friedlingstein, P., Jones, M. W., O'Sullivan, M., Andrew, R. M., Bakker, D. C. E., Hauck, J., Le Quéré, C., Peters, G. P., Peters, W., Pongratz, J., Sitch, S., Canadell, J. G., Ciais, P., Jackson, R. B., Alin, S. R., Anthoni, P., Bates, N. R., Becker, M., Bellouin, N., Bopp, L., Chau, T. T. T., Chevallier, F., Chini, L. P., Cronin, M., Currie, K. I., Decharme, B., Djeutchouang, L. M., Dou, X., Evans, W., Feely, R. A., Feng, L., Gasser, T., Gilfillan, D., Gkritzalis, T., Grassi, G., Gregor, L., Gruber, N., Gürses, Ö., Harris, I., Houghton, R. A., Hurtt, G. C., Iida, Y., Ilyina, T., Luijkx, I. T., Jain, A., Jones, S. D., Kato, E., Kennedy, D., Klein Goldewijk, K., Knauer, J., Korsbakken, J. I., Körtzinger, A., Landschützer, P., Lauvset, S. K., Lefèvre, N., Lienert, S., Liu, J., Marland, G., McGuire, P. C., Melton, J. R., Munro, D. R., Nabel, J. E. M. S., Nakaoka, S.-I., Niwa, Y., Ono, T., Pierrot, D., Poulter, B., Rehder, G., Resplandy, L., Robertson, E., Rödenbeck, C., Rosan, T. M., Schwinger, J., Schwingshackl, C., Séférian, R., Sutton, A. J., Sweeney, C., Tanhua, T., Tans, P. P., Tian, H., Tilbrook, B., Tubiello, F., van der Werf, G. R., Vuichard, N., Wada, C., Wanninkhof, R., Watson, A. J., Willis, D., Wiltshire, A. J., Yuan, W., Yue, C., Yue, X., Zaehle, S., and Zeng, J.: Global Carbon Budget 2021, Earth Syst. Sci. Data, 14, 1917–2005, https://doi.org/10.5194/essd-14-1917-2022, 2022.
Gelaro, R., McCarty, W., Suárez, M. J., Todling, R., Molod, A., Takacs, L., Randles, C. A., Darmenov, A., Bosilovich, M. G., Reichle, R., Wargan, K., Coy, L., Cullather, R., Draper, C., Akella, S., Buchard, V., Conaty, A., da Silva, A. M., Gu, W., Kim, G.-K., Koster, R., Lucchesi, R., Merkova, D., Nielsen, J. E., Partyka, G., Pawson, S., Putman, W., Rienecker, M., Schubert, S. D., Sienkiewicz, M., and Zhao, B.: The Modern-Era Retrospective Analysis for Research and Applications, Versio 2 (MERRA-2), J. Climate, 30, 5419–5454, https://doi.org/10.1175/JCLI-D-16-0758.1, 2017.
Heimann, M.: Enigma of the recent methane budget, Nature, 476, 157–158, https://doi.org/10.1038/476157a, 2011.
Herrington, T. C., Fletcher, C. G., and Kropp, H.: Validation of pan-Arctic soil temperatures in modern reanalysis and data assimilation systems, The Cryosphere, 18, 1835–1861, https://doi.org/10.5194/tc-18-1835-2024, 2024.
Högström, E., Heim, B., Bartsch, A., Bergstedt, H., and Pointner, G.: Evaluation of a MetOp ASCAT-Derived Surface Soil Moisture Product in Tundra Environments, J. Geophys. Res.-Earth, 123, 3190–3205, https://doi.org/10.1029/2018JF004658, 2018.
Houborg, R., Soegaard, H., and Boegh, E.: Combining vegetation index and model inversion methods for the extraction of key vegetation biophysical parameters using Terra and Aqua MODIS reflectance data, Remote Sens. Environ., 106, 39–58, https://doi.org/10.1016/j.rse.2006.07.016, 2007.
Hugelius, G., Loisel, J., Chadburn, S., Jackson, R. B., Jones, M., MacDonald, G., Marushchak, M., Olefeldt, D., Packalen, M., Siewert, M. B., Treat, C., Turetsky, M., Voigt, C., and Yu, Z.: Large stocks of peatland carbon and nitrogen are vulnerable to permafrost thaw, P. Natl. Acad. Sci. USA, 117, 20438–20446, https://doi.org/10.1073/pnas.1916387117, 2020.
IPCC: AR6 Synthesis Report: Climate Change 2023 – IPCC, https://www.ipcc.ch/report/sixth-assessment-report-cycle/ (last access: 20 February 2024), 2024.
Irvin, J., Zhou, S., McNicol, G., Lu, F., Liu, V., Fluet-Chouinard, E., Ouyang, Z., Knox, S. H., Lucas-Moffat, A., Trotta, C., Papale, D., Vitale, D., Mammarella, I., Alekseychik, P., Aurela, M., Avati, A., Baldocchi, D., Bansal, S., Bohrer, G., Campbell, D. I., Chen, J., Chu, H., Dalmagro, H. J., Delwiche, K. B., Desai, A. R., Euskirchen, E., Feron, S., Goeckede, M., Heimann, M., Helbig, M., Helfter, C., Hemes, K. S., Hirano, T., Iwata, H., Jurasinski, G., Kalhori, A., Kondrich, A., Lai, D. Y., Lohila, A., Malhotra, A., Merbold, L., Mitra, B., Ng, A., Nilsson, M. B., Noormets, A., Peichl, M., Rey-Sanchez, A. C., Richardson, A. D., Runkle, B. R., Schäfer, K. V., Sonnentag, O., Stuart-Haëntjens, E., Sturtevant, C., Ueyama, M., Valach, A. C., Vargas, R., Vourlitis, G. L., Ward, E. J., Wong, G. X., Zona, D., Alberto, M. C. R., Billesbach, D. P., Celis, G., Dolman, H., Friborg, T., Fuchs, K., Gogo, S., Gondwe, M. J., Goodrich, J. P., Gottschalk, P., Hörtnagl, L., Jacotot, A., Koebsch, F., Kasak, K., Maier, R., Morin, T. H., Nemitz, E., Oechel, W. C., Oikawa, P. Y., Ono, K., Sachs, T., Sakabe, A., Schuur, E. A., Shortt, R., Sullivan, R. C., Szutu, D. J., Tuittila, E.-S., Varlagin, A., Verfaillie, J. G., Wille, C., Windham-Myers, L., Poulter, B., and Jackson, R. B.: Gap-filling eddy covariance methane fluxes: Comparison of machine learning model predictions and uncertainties at FLUXNET-CH4 wetlands, Agr. Forest Meteorol., 308–309, 108528, https://doi.org/10.1016/j.agrformet.2021.108528, 2021.
Iwata, H., Harazono, Y., Ueyama, M., Sakabe, A., Nagano, H., Kosugi, Y., Takahashi, K., and Kim, Y.: Methane exchange in a poorly-drained black spruce forest over permafrost observed using the eddy covariance technique, Agr. Forest Meteorol., 214–215, 157–168, https://doi.org/10.1016/j.agrformet.2015.08.252, 2015.
Jiao, M., Zhao, L., Wang, C., Hu, G., Li, Y., Zhao, J., Zou, D., Xing, Z., Qiao, Y., Liu, G., Du, E., Xiao, M., and Hou, Y.: Spatiotemporal Variations of Soil Temperature at 10 and 50 cm Depths in Permafrost Regions along the Qinghai-Tibet Engineering Corridor, Remote Sens., 15, 455, https://doi.org/10.3390/rs15020455, 2023.
Johnson, M. S., Matthews, E., Bastviken, D., Deemer, B., Du, J., and Genovese, V.: Spatiotemporal Methane Emission From Global Reservoirs, J. Geophys. Res.-Biogeo., 126, e2021JG006305, https://doi.org/10.1029/2021JG006305, 2021.
Johnson, M. S., Matthews, E., Du, J., Genovese, V., and Bastviken, D.: Methane Emission From Global Lakes: New Spatiotemporal Data and Observation-Driven Modeling of Methane Dynamics Indicates Lower Emissions, J. Geophys. Res.-Biogeo., 127, e2022JG006793, https://doi.org/10.1029/2022JG006793, 2022.
Jung, M., Reichstein, M., Margolis, H. A., Cescatti, A., Richardson, A. D., Arain, M. A., Arneth, A., Bernhofer, C., Bonal, D., Chen, J., Gianelle, D., Gobron, N., Kiely, G., Kutsch, W., Lasslop, G., Law, B. E., Lindroth, A., Merbold, L., Montagnani, L., Moors, E. J., Papale, D., Sottocornola, M., Vaccari, F., and Williams, C.: Global patterns of land-atmosphere fluxes of carbon dioxide, latent heat, and sensible heat derived from eddy covariance, satellite, and meteorological observations, J. Geophys. Res.-Biogeo., 116, G00J07, https://doi.org/10.1029/2010JG001566, 2011.
Jung, M., Schwalm, C., Migliavacca, M., Walther, S., Camps-Valls, G., Koirala, S., Anthoni, P., Besnard, S., Bodesheim, P., Carvalhais, N., Chevallier, F., Gans, F., Goll, D. S., Haverd, V., Köhler, P., Ichii, K., Jain, A. K., Liu, J., Lombardozzi, D., Nabel, J. E. M. S., Nelson, J. A., O'Sullivan, M., Pallandt, M., Papale, D., Peters, W., Pongratz, J., Rödenbeck, C., Sitch, S., Tramontana, G., Walker, A., Weber, U., and Reichstein, M.: Scaling carbon fluxes from eddy covariance sites to globe: synthesis and evaluation of the FLUXCOM approach, Biogeosciences, 17, 1343–1365, https://doi.org/10.5194/bg-17-1343-2020, 2020.
Kim, Y., Johnson, M. S., Knox, S. H., Black, T. A., Dalmagro, H. J., Kang, M., Kim, J., and Baldocchi, D.: Gap-filling approaches for eddy covariance methane fluxes: A comparison of three machine learning algorithms and a traditional method with principal component analysis, Global Change Biol., 26, 1499–1518, https://doi.org/10.1111/gcb.14845, 2020.
Kirschke, S., Bousquet, P., Ciais, P., Saunois, M., Canadell, J. G., Dlugokencky, E. J., Bergamaschi, P., Bergmann, D., Blake, D. R., Bruhwiler, L., Cameron-Smith, P., Castaldi, S., Chevallier, F., Feng, L., Fraser, A., Heimann, M., Hodson, E. L., Houweling, S., Josse, B., Fraser, P. J., Krummel, P. B., Lamarque, J.-F., Langenfelds, R. L., Le Quéré, C., Naik, V., O'Doherty, S., Palmer, P. I., Pison, I., Plummer, D., Poulter, B., Prinn, R. G., Rigby, M., Ringeval, B., Santini, M., Schmidt, M., Shindell, D. T., Simpson, I. J., Spahni, R., Steele, L. P., Strode, S. A., Sudo, K., Szopa, S., van der Werf, G. R., Voulgarakis, A., van Weele, M., Weiss, R. F., Williams, J. E., and Zeng, G.: Three decades of global methane sources and sinks, Nat. Geosci., 6, 813–823, https://doi.org/10.1038/ngeo1955, 2013.
Knox, S. H., Jackson, R. B., Poulter, B., McNicol, G., Fluet-Chouinard, E., Zhang, Z., Hugelius, G., Bousquet, P., Canadell, J. G., Saunois, M., Papale, D., Chu, H., Keenan, T. F., Baldocchi, D., Torn, M. S., Mammarella, I., Trotta, C., Aurela, M., Bohrer, G., Campbell, D. I., Cescatti, A., Chamberlain, S., Chen, J., Chen, W., Dengel, S., Desai, A. R., Euskirchen, E., Friborg, T., Gasbarra, D., Goded, I., Goeckede, M., Heimann, M., Helbig, M., Hirano, T., Hollinger, D. Y., Iwata, H., Kang, M., Klatt, J., Krauss, K. W., Kutzbach, L., Lohila, A., Mitra, B., Morin, T. H., Nilsson, M. B., Niu, S., Noormets, A., Oechel, W. C., Peichl, M., Peltola, O., Reba, M. L., Richardson, A. D., Runkle, B. R. K., Ryu, Y., Sachs, T., Schäfer, K. V. R., Schmid, H. P., Shurpali, N., Sonnentag, O., Tang, A. C. I., Ueyama, M., Vargas, R., Vesala, T., Ward, E. J., Windham-Myers, L., Wohlfahrt, G., and Zona, D.: FLUXNET-CH4 Synthesis Activity: Objectives, Observations, and Future Directions, B. Am. Meteorol. Soc., 100, 2607–2632, https://doi.org/10.1175/BAMS-D-18-0268.1, 2019.
Knox, S. H., Bansal, S., McNicol, G., Schafer, K., Sturtevant, C., Ueyama, M., Valach, A. C., Baldocchi, D., Delwiche, K., Desai, A. R., Euskirchen, E., Liu, J., Lohila, A., Malhotra, A., Melling, L., Riley, W., Runkle, B. R. K., Turner, J., Vargas, R., Zhu, Q., Alto, T., Fluet-Chouinard, E., Goeckede, M., Melton, J. R., Sonnentag, O., Vesala, T., Ward, E., Zhang, Z., Feron, S., Ouyang, Z., Alekseychik, P., Aurela, M., Bohrer, G., Campbell, D. I., Chen, J., Chu, H., Dalmagro, H. J., Goodrich, J. P., Gottschalk, P., Hirano, T., Iwata, H., Jurasinski, G., Kang, M., Koebsch, F., Mammarella, I., Nilsson, M. B., Ono, K., Peichl, M., Peltola, O., Ryu, Y., Sachs, T., Sakabe, A., Sparks, J. P., Tuittila, E.-S., Vourlitis, G. L., Wong, G. X., Windham-Myers, L., Poulter, B., and Jackson, R. B.: Identifying dominant environmental predictors of freshwater wetland methane fluxes across diurnal to seasonal time scales, Global Change Biol., 27, 3582–3604, https://doi.org/10.1111/gcb.15661, 2021.
Kuhn, M. A., Varner, R. K., Bastviken, D., Crill, P., MacIntyre, S., Turetsky, M., Walter Anthony, K., McGuire, A. D., and Olefeldt, D.: BAWLD-CH4: a comprehensive dataset of methane fluxes from boreal and arctic ecosystems, Earth Syst. Sci. Data, 13, 5151–5189, https://doi.org/10.5194/essd-13-5151-2021, 2021.
Kuter, S.: Completing the machine learning saga in fractional snow cover estimation from MODIS Terra reflectance data: Random forests versus support vector regression, Remote Sens. Environ., 255, 112294, https://doi.org/10.1016/j.rse.2021.112294, 2021.
Kyzivat, E. D., Smith, L. C., Garcia-Tigreros, F., Huang, C., Wang, C., Langhorst, T., Fayne, J. V., Harlan, M. E., Ishitsuka, Y., Feng, D., Dolan, W., Pitcher, L. H., Wickland, K. P., Dornblaser, M. M., Striegl, R. G., Pavelsky, T. M., Butman, D. E., and Gleason, C. J.: The Importance of Lake Emergent Aquatic Vegetation for Estimating Arctic-Boreal Methane Emissions, J. Geophys. Res.-Biogeo., 127, e2021JG006635, https://doi.org/10.1029/2021JG006635, 2022.
Larmola, T., Tuittila, E.-S., Tiirola, M., Nykänen, H., Martikainen, P. J., Yrjälä, K., Tuomivirta, T., and Fritze, H.: The role of Sphagnum mosses in the methane cycling of a boreal mire, Ecology, 91, 2356–2365, https://doi.org/10.1890/09-1343.1, 2010.
Lehner, B. and Döll, P.: Development and validation of a global database of lakes, reservoirs and wetlands, J. Hydrol., 296, 1–22, https://doi.org/10.1016/j.jhydrol.2004.03.028, 2004.
Lehner, B., Anand, M., Fluet-Chouinard, E., Tan, F., Aires, F., Allen, G. H., Bousquet, P., Canadell, J. G., Davidson, N., Ding, M., Finlayson, C. M., Gumbricht, T., Hilarides, L., Hugelius, G., Jackson, R. B., Korver, M. C., Liu, L., McIntyre, P. B., Nagy, S., Olefeldt, D., Pavelsky, T. M., Pekel, J.-F., Poulter, B., Prigent, C., Wang, J., Worthington, T. A., Yamazaki, D., Zhang, X., and Thieme, M.: Mapping the world's inland surface waters: an upgrade to the Global Lakes and Wetlands Database (GLWD v2), Earth Syst. Sci. Data, 17, 2277–2329, https://doi.org/10.5194/essd-17-2277-2025, 2025.
Li, M., Wu, P., and Ma, Z.: A comprehensive evaluation of soil moisture and soil temperature from third-generation atmospheric and land reanalysis data sets, Int. J. Climatol., 40, 5744–5766, https://doi.org/10.1002/joc.6549, 2020.
Li, T., Raivonen, M., Alekseychik, P., Aurela, M., Lohila, A., Zheng, X., Zhang, Q., Wang, G., Mammarella, I., Rinne, J., Yu, L., Xie, B., Vesala, T., and Zhang, W.: Importance of vegetation classes in modeling CH4 emissions from boreal and subarctic wetlands in Finland, Sci. Total Environ., 572, 1111–1122, https://doi.org/10.1016/j.scitotenv.2016.08.020, 2016.
Liebner, S., Zeyer, J., Wagner, D., Schubert, C., Pfeiffer, E.-M., and Knoblauch, C.: Methane oxidation associated with submerged brown mosses reduces methane emissions from Siberian polygonal tundra, J. Ecol., 99, 914–922, https://doi.org/10.1111/j.1365-2745.2011.01823.x, 2011.
Liu, L., Xu, S., Tang, J., Guan, K., Griffis, T. J., Erickson, M. D., Frie, A. L., Jia, X., Kim, T., Miller, L. T., Peng, B., Wu, S., Yang, Y., Zhou, W., Kumar, V., and Jin, Z.: KGML-ag: a modeling framework of knowledge-guided machine learning to simulate agroecosystems: a case study of estimating N2O emission using data from mesocosm experiments, Geosci. Model Dev., 15, 2839–2858, https://doi.org/10.5194/gmd-15-2839-2022, 2022.
Ludwig, S. M., Natali, S. M., Schade, J. D., Powell, M., Fiske, G., Schiferl, L. D., and Commane, R.: Scaling waterbody carbon dioxide and methane fluxes in the arctic using an integrated terrestrial-aquatic approach, Environ. Res. Lett., 18, 064019, https://doi.org/10.1088/1748-9326/acd467, 2023.
Ma, H., Zeng, J., Zhang, X., Fu, P., Zheng, D., Wigneron, J.-P., Chen, N., and Niyogi, D.: Evaluation of six satellite- and model-based surface soil temperature datasets using global ground-based observations, Remote Sens. Environ., 264, 112605, https://doi.org/10.1016/j.rse.2021.112605, 2021.
Masson-Delmotte, V., Zhai, P., Pirani, A., Connors, S. L., Péan, C., Berger, S., Caud, N., Chen, Y., Goldfarb, L., and Gomis, M. I.: Climate change 2021: the physical science basis, Contrib. Work. Group Sixth Assess. Rep. Intergov. Panel Clim. Change, Cambridge University Press, Cambridge, UK and New York, NY, USA, 2391 pp., https://doi.org/10.1017/9781009157896, 2021.
Mastepanov, M., Sigsgaard, C., Dlugokencky, E. J., Houweling, S., Ström, L., Tamstorf, M. P., and Christensen, T. R.: Large tundra methane burst during onset of freezing, Nature, 456, 628–630, https://doi.org/10.1038/nature07464, 2008.
Mavrovic, A., Sonnentag, O., Lemmetyinen, J., Voigt, C., Aurela, M., and Roy, A.: Winter methane fluxes over boreal and Arctic environments, ESS Open Archive [preprint], https://doi.org/10.22541/essoar.170542245.58670859/v1, 2024.
McGuire, A. D., Anderson, L. G., Christensen, T. R., Dallimore, S., Guo, L., Hayes, D. J., Heimann, M., Lorenson, T. D., Macdonald, R. W., and Roulet, N.: Sensitivity of the carbon cycle in the Arctic to climate change, Ecol. Monogr., 79, 523–555, https://doi.org/10.1890/08-2025.1, 2009.
McNicol, G., Fluet-Chouinard, E., Ouyang, Z., Knox, S., Zhang, Z., Aalto, T., Bansal, S., Chang, K.-Y., Chen, M., Delwiche, K., Feron, S., Goeckede, M., Liu, J., Malhotra, A., Melton, J. R., Riley, W., Vargas, R., Yuan, K., Ying, Q., Zhu, Q., Alekseychik, P., Aurela, M., Billesbach, D. P., Campbell, D. I., Chen, J., Chu, H., Desai, A. R., Euskirchen, E., Goodrich, J., Griffis, T., Helbig, M., Hirano, T., Iwata, H., Jurasinski, G., King, J., Koebsch, F., Kolka, R., Krauss, K., Lohila, A., Mammarella, I., Nilson, M., Noormets, A., Oechel, W., Peichl, M., Sachs, T., Sakabe, A., Schulze, C., Sonnentag, O., Sullivan, R. C., Tuittila, E.-S., Ueyama, M., Vesala, T., Ward, E., Wille, C., Wong, G. X., Zona, D., Windham-Myers, L., Poulter, B., and Jackson, R. B.: Upscaling Wetland Methane Emissions From the FLUXNET-CH4 Eddy Covariance Network (UpCH4 v1.0): Model Development, Network Assessment, and Budget Comparison, AGU Adv., 4, e2023AV000956, https://doi.org/10.1029/2023AV000956, 2023.
Melack, J. M. and Hess, L. L.: Areal extent of vegetative cover: A challenge to regional upscaling of methane emissions, Aquat. Bot., 184, 103592, https://doi.org/10.1016/j.aquabot.2022.103592, 2023.
Melton, J. R., Wania, R., Hodson, E. L., Poulter, B., Ringeval, B., Spahni, R., Bohn, T., Avis, C. A., Beerling, D. J., Chen, G., Eliseev, A. V., Denisov, S. N., Hopcroft, P. O., Lettenmaier, D. P., Riley, W. J., Singarayer, J. S., Subin, Z. M., Tian, H., Zürcher, S., Brovkin, V., van Bodegom, P. M., Kleinen, T., Yu, Z. C., and Kaplan, J. O.: Present state of global wetland extent and wetland methane modelling: conclusions from a model inter-comparison project (WETCHIMP), Biogeosciences, 10, 753–788, https://doi.org/10.5194/bg-10-753-2013, 2013.
Miller, S. M., Miller, C. E., Commane, R., Chang, R. Y.-W., Dinardo, S. J., Henderson, J. M., Karion, A., Lindaas, J., Melton, J. R., Miller, J. B., Sweeney, C., Wofsy, S. C., and Michalak, A. M.: A multiyear estimate of methane fluxes in Alaska from CARVE atmospheric observations, Global Biogeochem. Cy., 30, 1441–1453, https://doi.org/10.1002/2016GB005419, 2016.
Miner, K. R., Turetsky, M. R., Malina, E., Bartsch, A., Tamminen, J., McGuire, A. D., Fix, A., Sweeney, C., Elder, C. D., and Miller, C. E.: Permafrost carbon emissions in a changing Arctic, Nat. Rev. Earth Environ., 3, 55–67, https://doi.org/10.1038/s43017-021-00230-3, 2022.
Murray-Hudson, M., Wolski, P., Cassidy, L., Brown, M. T., Thito, K., Kashe, K., and Mosimanyana, E.: Remote Sensing-derived hydroperiod as a predictor of floodplain vegetation composition, Wetl. Ecol. Manage., 23, 603–616, https://doi.org/10.1007/s11273-014-9340-z, 2015.
Natali, S. M., Watts, J. D., Rogers, B. M., Potter, S., Ludwig, S. M., Selbmann, A.-K., Sullivan, P. F., Abbott, B. W., Arndt, K. A., Birch, L., Björkman, M. P., Bloom, A. A., Celis, G., Christensen, T. R., Christiansen, C. T., Commane, R., Cooper, E. J., Crill, P., Czimczik, C., Davydov, S., Du, J., Egan, J. E., Elberling, B., Euskirchen, E. S., Friborg, T., Genet, H., Göckede, M., Goodrich, J. P., Grogan, P., Helbig, M., Jafarov, E. E., Jastrow, J. D., Kalhori, A. A. M., Kim, Y., Kimball, J. S., Kutzbach, L., Lara, M. J., Larsen, K. S., Lee, B.-Y., Liu, Z., Loranty, M. M., Lund, M., Lupascu, M., Madani, N., Malhotra, A., Matamala, R., McFarland, J., McGuire, A. D., Michelsen, A., Minions, C., Oechel, W. C., Olefeldt, D., Parmentier, F.-J. W., Pirk, N., Poulter, B., Quinton, W., Rezanezhad, F., Risk, D., Sachs, T., Schaefer, K., Schmidt, N. M., Schuur, E. A. G., Semenchuk, P. R., Shaver, G., Sonnentag, O., Starr, G., Treat, C. C., Waldrop, M. P., Wang, Y., Welker, J., Wille, C., Xu, X., Zhang, Z., Zhuang, Q., and Zona, D.: Large loss of CO2 in winter observed across the northern permafrost region, Nat. Clim. Change, 9, 852–857, https://doi.org/10.1038/s41558-019-0592-8, 2019.
Olefeldt, D., Turetsky, M. R., Crill, P. M., and McGuire, A. D.: Environmental and physical controls on northern terrestrial methane emissions across permafrost zones, Global Change Biol., 19, 589–603, https://doi.org/10.1111/gcb.12071, 2013.
Olefeldt, D., Euskirchen, E. S., Harden, J., Kane, E., McGuire, A. D., Waldrop, M. P., and Turetsky, M. R.: A decade of boreal rich fen greenhouse gas fluxes in response to natural and experimental water table variability, Global Change Biol., 23, 2428–2440, https://doi.org/10.1111/gcb.13612, 2017.
Olefeldt, D., Hovemyr, M., Kuhn, M. A., Bastviken, D., Bohn, T. J., Connolly, J., Crill, P., Euskirchen, E. S., Finkelstein, S. A., Genet, H., Grosse, G., Harris, L. I., Heffernan, L., Helbig, M., Hugelius, G., Hutchins, R., Juutinen, S., Lara, M. J., Malhotra, A., Manies, K., McGuire, A. D., Natali, S. M., O'Donnell, J. A., Parmentier, F.-J. W., Räsänen, A., Schädel, C., Sonnentag, O., Strack, M., Tank, S. E., Treat, C., Varner, R. K., Virtanen, T., Warren, R. K., and Watts, J. D.: The Boreal–Arctic Wetland and Lake Dataset (BAWLD), Earth Syst. Sci. Data, 13, 5127–5149, https://doi.org/10.5194/essd-13-5127-2021, 2021.
Osterkamp, T. E., Viereck, L., Shur, Y., Jorgenson, M. T., Racine, C., Doyle, A., and Boone, R. D.: Observations of Thermokarst and Its Impact on Boreal Forests in Alaska, U.S.A., Arct. Antarct. Alp. Res., 32, 303–315, https://doi.org/10.1080/15230430.2000.12003368, 2000.
Ouyang, Z., Jackson, R. B., McNicol, G., Fluet-Chouinard, E., Runkle, B. R. K., Papale, D., Knox, S. H., Cooley, S., Delwiche, K. B., Feron, S., Irvin, J. A., Malhotra, A., Muddasir, M., Sabbatini, S., Alberto, Ma. C. R., Cescatti, A., Chen, C.-L., Dong, J., Fong, B. N., Guo, H., Hao, L., Iwata, H., Jia, Q., Ju, W., Kang, M., Li, H., Kim, J., Reba, M. L., Nayak, A. K., Roberti, D. R., Ryu, Y., Swain, C. K., Tsuang, B., Xiao, X., Yuan, W., Zhang, G., and Zhang, Y.: Paddy rice methane emissions across Monsoon Asia, Remote Sens. Environ., 284, 113335, https://doi.org/10.1016/j.rse.2022.113335, 2023.
Pallandt, M. M. T. A., Kumar, J., Mauritz, M., Schuur, E. A. G., Virkkala, A.-M., Celis, G., Hoffman, F. M., and Göckede, M.: Representativeness assessment of the pan-Arctic eddy covariance site network and optimized future enhancements, Biogeosciences, 19, 559–583, https://doi.org/10.5194/bg-19-559-2022, 2022.
Pedregosa, F., Varoquaux, G., Gramfort, A., Michel, V., Thirion, B., Grisel, O., Blondel, M., Prettenhofer, P., Weiss, R., and Dubourg, V.: Scikit-learn: Machine learning in Python, J. Mach. Learn. Res., 12, 2825–2830, 2011.
Peltola, O., Vesala, T., Gao, Y., Räty, O., Alekseychik, P., Aurela, M., Chojnicki, B., Desai, A. R., Dolman, A. J., Euskirchen, E. S., Friborg, T., Göckede, M., Helbig, M., Humphreys, E., Jackson, R. B., Jocher, G., Joos, F., Klatt, J., Knox, S. H., Kowalska, N., Kutzbach, L., Lienert, S., Lohila, A., Mammarella, I., Nadeau, D. F., Nilsson, M. B., Oechel, W. C., Peichl, M., Pypker, T., Quinton, W., Rinne, J., Sachs, T., Samson, M., Schmid, H. P., Sonnentag, O., Wille, C., Zona, D., and Aalto, T.: Monthly gridded data product of northern wetland methane emissions based on upscaling eddy covariance observations, Earth Syst. Sci. Data, 11, 1263–1289, https://doi.org/10.5194/essd-11-1263-2019, 2019.
Peng, J., Loew, A., Merlin, O., and Verhoest, N. E. C.: A review of spatial downscaling of satellite remotely sensed soil moisture, Rev. Geophys., 55, 341–366, https://doi.org/10.1002/2016RG000543, 2017.
Peng, S., Lin, X., Thompson, R. L., Xi, Y., Liu, G., Hauglustaine, D., Lan, X., Poulter, B., Ramonet, M., Saunois, M., Yin, Y., Zhang, Z., Zheng, B., and Ciais, P.: Wetland emission and atmospheric sink changes explain methane growth in 2020, Nature, 612, 477–482, https://doi.org/10.1038/s41586-022-05447-w, 2022.
Poulter, B., Adams-Metayer, F. M., Amaral, C., Barenblitt, A., Campbell, A., Charles, S. P., Roman-Cuesta, R. M., D'Ascanio, R., Delaria, E. R., Doughty, C., Fatoyinbo, T., Gewirtzman, J., Hanisco, T. F., Hull, M., Kawa, S. R., Hannun, R., Lagomasino, D., Lait, L., Malone, S. L., Newman, P. A., Raymond, P., Rosentreter, J. A., Thomas, N., Vaughn, D., Wolfe, G. M., Xiong, L., Ying, Q., and Zhang, Z.: Multi-scale observations of mangrove blue carbon ecosystem fluxes: The NASA Carbon Monitoring System BlueFlux field campaign, Environ. Res. Lett., 18, 075009, https://doi.org/10.1088/1748-9326/acdae6, 2023.
Prigent, C., Jimenez, C., and Bousquet, P.: Satellite-Derived Global Surface Water Extent and Dynamics Over the Last 25 Years (GIEMS-2), J. Geophys. Res.-Atmos., 125, e2019JD030711, https://doi.org/10.1029/2019JD030711, 2020.
Ramage, J., Kuhn, M., Virkkala, A.-M., Voigt, C., Marushchak, M. E., Bastos, A., Biasi, C., Canadell, J. G., Ciais, P., López-Blanco, E., Natali, S. M., Olefeldt, D., Potter, S., Poulter, B., Rogers, B. M., Schuur, E. A. G., Treat, C., Turetsky, M. R., Watts, J., and Hugelius, G.: The Net GHG Balance and Budget of the Permafrost Region (2000–2020) From Ecosystem Flux Upscaling, Global Biogeochem. Cy., 38, e2023GB007953, https://doi.org/10.1029/2023GB007953, 2024.
Rawlins, M. A., Steele, M., Holland, M. M., Adam, J. C., Cherry, J. E., Francis, J. A., Groisman, P. Y., Hinzman, L. D., Huntington, T. G., Kane, D. L., Kimball, J. S., Kwok, R., Lammers, R. B., Lee, C. M., Lettenmaier, D. P., McDonald, K. C., Podest, E., Pundsack, J. W., Rudels, B., Serreze, M. C., Shiklomanov, A., Skagseth, Ø., Troy, T. J., Vörösmarty, C. J., Wensnahan, M., Wood, E. F., Woodgate, R., Yang, D., Zhang, K., and Zhang, T.: Analysis of the Arctic System for Freshwater Cycle Intensification: Observations and Expectations, J. Climate, 23, 5715–5737, https://doi.org/10.1175/2010JCLI3421.1, 2010.
Reichle, R. H., Lannoy, G. J. M. D., Liu, Q., Koster, R. D., Kimball, J. S., Crow, W. T., Ardizzone, J. V., Chakraborty, P., Collins, D. W., Conaty, A. L., Girotto, M., Jones, L. A., Kolassa, J., Lievens, H., Lucchesi, R. A., and Smith, E. B.: Global Assessment of the SMAP Level-4 Surface and Root-Zone Soil Moisture Product Using Assimilation Diagnostics, J. Hydrometeorol., 18, 3217–3237, https://doi.org/10.1175/JHM-D-17-0130.1, 2017.
Reichstein, M., Camps-Valls, G., Stevens, B., Jung, M., Denzler, J., Carvalhais, N., and Prabhat: Deep learning and process understanding for data-driven Earth system science, Nature, 566, 195–204, https://doi.org/10.1038/s41586-019-0912-1, 2019.
Rocher-Ros, G., Stanley, E. H., Loken, L. C., Casson, N. J., Raymond, P. A., Liu, S., Amatulli, G., and Sponseller, R. A.: Global methane emissions from rivers and streams, Nature, 621, 530–535, https://doi.org/10.1038/s41586-023-06344-6, 2023.
Rosentreter, J. A., Borges, A. V., Deemer, B. R., Holgerson, M. A., Liu, S., Song, C., Melack, J., Raymond, P. A., Duarte, C. M., Allen, G. H., Olefeldt, D., Poulter, B., Battin, T. I., and Eyre, B. D.: Half of global methane emissions come from highly variable aquatic ecosystem sources, Nat. Geosci., 14, 225–230, https://doi.org/10.1038/s41561-021-00715-2, 2021.
Rößger, N., Sachs, T., Wille, C., Boike, J., and Kutzbach, L.: Seasonal increase of methane emissions linked to warming in Siberian tundra, Nat. Clim. Change, 12, 1031–1036, https://doi.org/10.1038/s41558-022-01512-4, 2022.
Saikia, P., Baruah, R. D., Singh, S. K., and Chaudhuri, P. K.: Artificial Neural Networks in the domain of reservoir characterization: A review from shallow to deep models, Comput. Geosci., 135, 104357, https://doi.org/10.1016/j.cageo.2019.104357, 2020.
Saunois, M., Stavert, A. R., Poulter, B., Bousquet, P., Canadell, J. G., Jackson, R. B., Raymond, P. A., Dlugokencky, E. J., Houweling, S., Patra, P. K., Ciais, P., Arora, V. K., Bastviken, D., Bergamaschi, P., Blake, D. R., Brailsford, G., Bruhwiler, L., Carlson, K. M., Carrol, M., Castaldi, S., Chandra, N., Crevoisier, C., Crill, P. M., Covey, K., Curry, C. L., Etiope, G., Frankenberg, C., Gedney, N., Hegglin, M. I., Höglund-Isaksson, L., Hugelius, G., Ishizawa, M., Ito, A., Janssens-Maenhout, G., Jensen, K. M., Joos, F., Kleinen, T., Krummel, P. B., Langenfelds, R. L., Laruelle, G. G., Liu, L., Machida, T., Maksyutov, S., McDonald, K. C., McNorton, J., Miller, P. A., Melton, J. R., Morino, I., Müller, J., Murguia-Flores, F., Naik, V., Niwa, Y., Noce, S., O'Doherty, S., Parker, R. J., Peng, C., Peng, S., Peters, G. P., Prigent, C., Prinn, R., Ramonet, M., Regnier, P., Riley, W. J., Rosentreter, J. A., Segers, A., Simpson, I. J., Shi, H., Smith, S. J., Steele, L. P., Thornton, B. F., Tian, H., Tohjima, Y., Tubiello, F. N., Tsuruta, A., Viovy, N., Voulgarakis, A., Weber, T. S., van Weele, M., van der Werf, G. R., Weiss, R. F., Worthy, D., Wunch, D., Yin, Y., Yoshida, Y., Zhang, W., Zhang, Z., Zhao, Y., Zheng, B., Zhu, Q., Zhu, Q., and Zhuang, Q.: The Global Methane Budget 2000–2017, Earth Syst. Sci. Data, 12, 1561–1623, https://doi.org/10.5194/essd-12-1561-2020, 2020.
Schaaf, C. B., Gao, F., Strahler, A. H., Lucht, W., Li, X., Tsang, T., Strugnell, N. C., Zhang, X., Jin, Y., Muller, J.-P., Lewis, P., Barnsley, M., Hobson, P., Disney, M., Roberts, G., Dunderdale, M., Doll, C., d'Entremont, R. P., Hu, B., Liang, S., Privette, J. L., and Roy, D.: First operational BRDF, albedo nadir reflectance products from MODIS, Remote Sens. Environ., 83, 135–148, https://doi.org/10.1016/S0034-4257(02)00091-3, 2002.
Smith, S. L., O'Neill, H. B., Isaksen, K., Noetzli, J., and Romanovsky, V. E.: The changing thermal state of permafrost, Nat. Rev. Earth Environ., 3, 10–23, https://doi.org/10.1038/s43017-021-00240-1, 2022.
Spahni, R., Wania, R., Neef, L., van Weele, M., Pison, I., Bousquet, P., Frankenberg, C., Foster, P. N., Joos, F., Prentice, I. C., and van Velthoven, P.: Constraining global methane emissions and uptake by ecosystems, Biogeosciences, 8, 1643–1665, https://doi.org/10.5194/bg-8-1643-2011, 2011.
Sturtevant, C. S., Oechel, W. C., Zona, D., Kim, Y., and Emerson, C. E.: Soil moisture control over autumn season methane flux, Arctic Coastal Plain of Alaska, Biogeosciences, 9, 1423–1440, https://doi.org/10.5194/bg-9-1423-2012, 2012.
Thornton, B. F., Wik, M., and Crill, P. M.: Double-counting challenges the accuracy of high-latitude methane inventories, Geophys. Res. Lett., 43, 12569–12577, https://doi.org/10.1002/2016GL071772, 2016.
Tramontana, G., Jung, M., Schwalm, C. R., Ichii, K., Camps-Valls, G., Ráduly, B., Reichstein, M., Arain, M. A., Cescatti, A., Kiely, G., Merbold, L., Serrano-Ortiz, P., Sickert, S., Wolf, S., and Papale, D.: Predicting carbon dioxide and energy fluxes across global FLUXNET sites with regression algorithms, Biogeosciences, 13, 4291–4313, https://doi.org/10.5194/bg-13-4291-2016, 2016.
Treat, C. C., Bloom, A. A., and Marushchak, M. E.: Nongrowing season methane emissions–a significant component of annual emissions across northern ecosystems, Global Change Biol., 24, 3331–3343, https://doi.org/10.1111/gcb.14137, 2018.
Treat, C. C., Virkkala, A.-M., Burke, E., Bruhwiler, L., Chatterjee, A., Fisher, J. B., Hashemi, J., Parmentier, F.-J. W., Rogers, B. M., Westermann, S., Watts, J. D., Blanc-Betes, E., Fuchs, M., Kruse, S., Malhotra, A., Miner, K., Strauss, J., Armstrong, A., Epstein, H. E., Gay, B., Goeckede, M., Kalhori, A., Kou, D., Miller, C. E., Natali, S. M., Oh, Y., Shakil, S., Sonnentag, O., Varner, R. K., Zolkos, S., Schuur, E. A. G., and Hugelius, G.: Permafrost Carbon: Progress on Understanding Stocks and Fluxes Across Northern Terrestrial Ecosystems, J. Geophys. Res.-Biogeo., 129, e2023JG007638, https://doi.org/10.1029/2023JG007638, 2024.
Turner, J., Desai, A. R., Thom, J., and Wickland, K. P.: Lagged Wetland CH4 Flux Response in a Historically Wet Year, J. Geophys. Res.-Biogeo., 126, e2021JG006458, https://doi.org/10.1029/2021JG006458, 2021.
Ueyama, M., Iwata, H., Endo, R., and Harazono, Y.: Methane and carbon dioxide emissions from the forest floor of a black spruce forest on permafrost in interior Alaska, Polar Sci., 35, 100921, https://doi.org/10.1016/j.polar.2022.100921, 2023a.
Ueyama, M., Knox, S. H., Delwiche, K. B., Bansal, S., Riley, W. J., Baldocchi, D., Hirano, T., McNicol, G., Schafer, K., Windham-Myers, L., Poulter, B., Jackson, R. B., Chang, K.-Y., Chen, J., Chu, H., Desai, A. R., Gogo, S., Iwata, H., Kang, M., Mammarella, I., Peichl, M., Sonnentag, O., Tuittila, E.-S., Ryu, Y., Euskirchen, E. S., Göckede, M., Jacotot, A., Nilsson, M. B., and Sachs, T.: Modeled production, oxidation, and transport processes of wetland methane emissions in temperate, boreal, and Arctic regions, Global Change Biol., 29, 2313–2334, https://doi.org/10.1111/gcb.16594, 2023b.
Upton, S., Reichstein, M., Gans, F., Peters, W., Kraft, B., and Bastos, A.: Constraining biospheric carbon dioxide fluxes by combined top-down and bottom-up approaches, Atmos. Chem. Phys., 24, 2555–2582, https://doi.org/10.5194/acp-24-2555-2024, 2024.
van Hulzen, J. B., Segers, R., van Bodegom, P. M., and Leffelaar, P. A.: Temperature effects on soil methane production: an explanation for observed variability, Soil Biol. Biochem., 31, 1919–1929, https://doi.org/10.1016/S0038-0717(99)00109-1, 1999.
Villarreal, S. and Vargas, R.: Representativeness of FLUXNET Sites Across Latin America, J. Geophys. Res.-Biogeo., 126, e2020JG006090, https://doi.org/10.1029/2020JG006090, 2021.
Virkkala, A.-M., Aalto, J., Rogers, B. M., Tagesson, T., Treat, C. C., Natali, S. M., Watts, J. D., Potter, S., Lehtonen, A., Mauritz, M., Schuur, E. A. G., Kochendorfer, J., Zona, D., Oechel, W., Kobayashi, H., Humphreys, E., Goeckede, M., Iwata, H., Lafleur, P. M., Euskirchen, E. S., Bokhorst, S., Marushchak, M., Martikainen, P. J., Elberling, B., Voigt, C., Biasi, C., Sonnentag, O., Parmentier, F.-J. W., Ueyama, M., Celis, G., St. Louis, V. L., Emmerton, C. A., Peichl, M., Chi, J., Järveoja, J., Nilsson, M. B., Oberbauer, S. F., Torn, M. S., Park, S.-J., Dolman, H., Mammarella, I., Chae, N., Poyatos, R., López-Blanco, E., Christensen, T. R., Kwon, M. J., Sachs, T., Holl, D., and Luoto, M.: Statistical upscaling of ecosystem CO2 fluxes across the terrestrial tundra and boreal domain: Regional patterns and uncertainties, Global Change Biol., 27, 4040–4059, https://doi.org/10.1111/gcb.15659, 2021.
Virkkala, A.-M., Niittynen, P., Kemppinen, J., Marushchak, M. E., Voigt, C., Hensgens, G., Kerttula, J., Happonen, K., Tyystjärvi, V., Biasi, C., Hultman, J., Rinne, J., and Luoto, M.: High-resolution spatial patterns and drivers of terrestrial ecosystem carbon dioxide, methane, and nitrous oxide fluxes in the tundra, Biogeosciences, 21, 335–355, https://doi.org/10.5194/bg-21-335-2024, 2024.
Voigt, C., Virkkala, A.-M., Hould Gosselin, G., Bennett, K. A., Black, T. A., Detto, M., Chevrier-Dion, C., Guggenberger, G., Hashmi, W., Kohl, L., Kou, D., Marquis, C., Marsh, P., Marushchak, M. E., Nesic, Z., Nykänen, H., Saarela, T., Sauheitl, L., Walker, B., Weiss, N., Wilcox, E. J., and Sonnentag, O.: Arctic soil methane sink increases with drier conditions and higher ecosystem respiration, Nat. Clim. Change, 13, 1095–1104, https://doi.org/10.1038/s41558-023-01785-3, 2023.
Walsh, J. E.: Intensified warming of the Arctic: Causes and impacts on middle latitudes, Global Planet. Change, 117, 52–63, https://doi.org/10.1016/j.gloplacha.2014.03.003, 2014.
Wang, W., Rinke, A., Moore, J. C., Ji, D., Cui, X., Peng, S., Lawrence, D. M., McGuire, A. D., Burke, E. J., Chen, X., Decharme, B., Koven, C., MacDougall, A., Saito, K., Zhang, W., Alkama, R., Bohn, T. J., Ciais, P., Delire, C., Gouttevin, I., Hajima, T., Krinner, G., Lettenmaier, D. P., Miller, P. A., Smith, B., Sueyoshi, T., and Sherstiukov, A. B.: Evaluation of air–soil temperature relationships simulated by land surface models during winter across the permafrost region, The Cryosphere, 10, 1721–1737, https://doi.org/10.5194/tc-10-1721-2016, 2016.
Wang, Z., Schaaf, C. B., Sun, Q., Shuai, Y., and Román, M. O.: Capturing rapid land surface dynamics with Collection V006 MODIS BRDF/NBAR/Albedo (MCD43) products, Remote Sens. Environ., 207, 50–64, https://doi.org/10.1016/j.rse.2018.02.001, 2018.
Watts, J. D., Kimball, J. S., Bartsch, A., and McDonald, K. C.: Surface water inundation in the boreal-Arctic: potential impacts on regional methane emissions, Environ. Res. Lett., 9, 075001, https://doi.org/10.1088/1748-9326/9/7/075001, 2014.
Watts, J. D., Farina, M., Kimball, J. S., Schiferl, L. D., Liu, Z., Arndt, K. A., Zona, D., Ballantyne, A., Euskirchen, E. S., Parmentier, F.-J. W., Helbig, M., Sonnentag, O., Tagesson, T., Rinne, J., Ikawa, H., Ueyama, M., Kobayashi, H., Sachs, T., Nadeau, D. F., Kochendorfer, J., Jackowicz-Korczynski, M., Virkkala, A., Aurela, M., Commane, R., Byrne, B., Birch, L., Johnson, M. S., Madani, N., Rogers, B., Du, J., Endsley, A., Savage, K., Poulter, B., Zhang, Z., Bruhwiler, L. M., Miller, C. E., Goetz, S., and Oechel, W. C.: Carbon uptake in Eurasian boreal forests dominates the high-latitude net ecosystem carbon budget, Global Change Biol., 29, 1870–1889, https://doi.org/10.1111/gcb.16553, 2023.
Wik, M., Varner, R. K., Anthony, K. W., MacIntyre, S., and Bastviken, D.: Climate-sensitive northern lakes and ponds are critical components of methane release, Nat. Geosci., 9, 99–105, https://doi.org/10.1038/ngeo2578, 2016.
Wrona, E., Rowlandson, T. L., Nambiar, M., Berg, A. A., Colliander, A., and Marsh, P.: Validation of the Soil Moisture Active Passive (SMAP) satellite soil moisture retrieval in an Arctic tundra environment, Geophys. Res. Lett., 44, 4152–4158, https://doi.org/10.1002/2017GL072946, 2017.
Yamazaki, D., Ikeshima, D., Tawatari, R., Yamaguchi, T., O'Loughlin, F., Neal, J. C., Sampson, C. C., Kanae, S., and Bates, P. D.: A high-accuracy map of global terrain elevations, Geophys. Res. Lett., 44, 5844–5853, https://doi.org/10.1002/2017GL072874, 2017.
Ying, Q.: WetCH4: An Ml-based Modeling and Upscaling Framework for Wetland Methane Fluxes, Zenodo [code], https://doi.org/10.5281/zenodo.10882613, 2024.
Ying, Q., Poulter, B., Watts, J. D., Arndt, K. A., Virkkala, A.-M., Bruhwiler, L., Oh, Y., Rogers, B. M., Natali, S. M., Sullivan, H., Schiferl, L. D., Elder, C., Peltola, O., Bartsch, A., Armstrong, A., Desai, A. R., Euskirchen, E., Göckede, M., Lehner, B., Nilsson, M. B., Peichl, M., Sonnentag, O., Tuittila, E.-S., Sachs, T., Kalhori, A., Ueyama, M., and Zhang, Z.: WetCH4: A Machine Learning-based Upscaling of Methane Fluxes of Northern Wetlands during 2016–2022, Zenodo [data set], https://doi.org/10.5281/zenodo.10802153, 2024.
Yuan, K., Zhu, Q., Li, F., Riley, W. J., Torn, M., Chu, H., McNicol, G., Chen, M., Knox, S., Delwiche, K., Wu, H., Baldocchi, D., Ma, H., Desai, A. R., Chen, J., Sachs, T., Ueyama, M., Sonnentag, O., Helbig, M., Tuittila, E.-S., Jurasinski, G., Koebsch, F., Campbell, D., Schmid, H. P., Lohila, A., Goeckede, M., Nilsson, M. B., Friborg, T., Jansen, J., Zona, D., Euskirchen, E., Ward, E. J., Bohrer, G., Jin, Z., Liu, L., Iwata, H., Goodrich, J., and Jackson, R.: Causality guided machine learning model on wetland CH4 emissions across global wetlands, Agr. Forest Meteorol., 324, 109115, https://doi.org/10.1016/j.agrformet.2022.109115, 2022.
Yuan, K., Li, F., McNicol, G., Chen, M., Hoyt, A., Knox, S., Riley, W. J., Jackson, R., and Zhu, Q.: Boreal–Arctic wetland methane emissions modulated by warming and vegetation activity, Nat. Clim. Change, 14, 282–288, https://doi.org/10.1038/s41558-024-01933-3, 2024.
Zhang, C., Comas, X., and Brodylo, D.: A Remote Sensing Technique to Upscale Methane Emission Flux in a Subtropical Peatland, J. Geophys. Res.-Biogeo., 125, e2020JG006002, https://doi.org/10.1029/2020JG006002, 2020.
Zhang, Z., Fluet-Chouinard, E., Jensen, K., McDonald, K., Hugelius, G., Gumbricht, T., Carroll, M., Prigent, C., Bartsch, A., and Poulter, B.: Development of the global dataset of Wetland Area and Dynamics for Methane Modeling (WAD2M), Earth Syst. Sci. Data, 13, 2001–2023, https://doi.org/10.5194/essd-13-2001-2021, 2021.
Zhang, Z., Poulter, B., Feldman, A. F., Ying, Q., Ciais, P., Peng, S., and Li, X.: Recent intensification of wetland methane feedback, Nat. Clim. Change, 13, 430–433, https://doi.org/10.1038/s41558-023-01629-0, 2023.
Zhang, Z., Poulter, B., Melton, J. R., Riley, W. J., Allen, G. H., Beerling, D. J., Bousquet, P., Canadell, J. G., Fluet-Chouinard, E., Ciais, P., Gedney, N., Hopcroft, P. O., Ito, A., Jackson, R. B., Jain, A. K., Jensen, K., Joos, F., Kleinen, T., Knox, S. H., Li, T., Li, X., Liu, X., McDonald, K., McNicol, G., Miller, P. A., Müller, J., Patra, P. K., Peng, C., Peng, S., Qin, Z., Riggs, R. M., Saunois, M., Sun, Q., Tian, H., Xu, X., Yao, Y., Xi, Y., Zhang, W., Zhu, Q., Zhu, Q., and Zhuang, Q.: Ensemble estimates of global wetland methane emissions over 2000–2020, Biogeosciences, 22, 305–321, https://doi.org/10.5194/bg-22-305-2025, 2025.
Zona, D., Gioli, B., Commane, R., Lindaas, J., Wofsy, S. C., Miller, C. E., Dinardo, S. J., Dengel, S., Sweeney, C., Karion, A., Chang, R. Y.-W., Henderson, J. M., Murphy, P. C., Goodrich, J. P., Moreaux, V., Liljedahl, A., Watts, J. D., Kimball, J. S., Lipson, D. A., and Oechel, W. C.: Cold season emissions dominate the Arctic tundra methane budget, P. Natl. Acad. Sci. USA, 113, 40–45, https://doi.org/10.1073/pnas.1516017113, 2016.