the Creative Commons Attribution 4.0 License.
the Creative Commons Attribution 4.0 License.
 | 06 Jun 2025
Nineteenth- and twentieth-century semi-quantitative surface ozone along subtropical European to tropical Africa Atlantic coasts
Juan-Carlos Antuña-Marrero
Antonio Cid Samamed
Celia Pérez-Souto
Laura de la Torre
Maria Antonia Valente
Yuri Brugnara
Alfonso Saiz-Lopez
Luis Gimeno
Tropospheric ozone (O3) plays a key role in the climate system. Studying pre-industrial tropospheric O3 implies two important challenges: (i) the lack of observational records prior to the late 19th century, which hampers the understanding of long-term climate trends (given the crucial role of O3), and (ii) and the uncertainties in quantitative tropospheric O3 values in a non-polluted atmosphere across the planet. The ozonoscope was the first instrument used to measure ozone. It offered semi-quantitative estimates of surface O3 when no other measurements were available. Despite their potential value, the digitization, curation, and publication of ozonoscope data remain largely unexplored. In this work, we initiate an effort to rescue surface O3 ozonoscope records by compiling them in a new data collection. We include data from 23 observatories covering Portugal and the African Atlantic regions, providing a latitudinal span from the extratropics in the Northern Hemisphere to the tropics in the Southern Hemisphere. This record represents the most extensive ozonoscope data series to date, spanning 50 years of daily data and 58 years of monthly data, from 1855 to 1913. This record represents the most extensive ozonoscope data series to date, spanning 50 years of daily data and 58 years of monthly data, from 1855 to 1913. The data series is available from https://doi.org/10.1594/PANGAEA.969259 (Añel et al., 2024a) and https://doi.org/10.1594/PANGAEA.969241 (Añel et al., 2024b), respectively.
- Article
(1912 KB) - Full-text XML
-
Supplement
(1648 KB) - BibTeX
- EndNote


Tropospheric ozone (O3) records for our planet before the end of the 19th century are rare and sparse. This is not surprising given that O3 was discovered by Schönbein in 1839 (Schönbein, 1840a, b) and got little attention during the decades following its discovery. After the 1860s, measuring O3 became common at meteorological stations. However, O3 is a transcendental chemical with respect to the understanding and study of the atmosphere. Tropospheric O3 is a greenhouse gas and, at elevated concentrations, a pollutant harmful to human health; moreover, it affects crops and ecosystem productivity (U.S. EPA, 2020). However, the study of tropospheric O3 faces two important challenges: (i) the lack of observational records prior to the late 19th century, which hampers the understanding of long-term climate trends, (ii) and the uncertainties in quantitative O3 values in a non-polluted atmosphere.
The first phase of the Tropospheric Ozone Assessment Report (TOAR) project (Schultz et al., 2017; Tarasick et al., 2019) developed a web-accessible database of surface O3 observations that consisted of two main periods: the modern period, beginning around 1975 and spanning to the present, defined by the widespread availability of sensitive ultraviolet (UV) photometers for surface O3 measurements, and the historical period, covering the period from 1877 to 1975, defined by the use of other techniques and the lack of UV photometers. The records available for the period prior to 1975 were evaluated using a set of four criteria to minimize uncertainties and biases between the measurement techniques available at that time and the contemporary UV absorption standard. These criteria are as follows: the relationship of the measurement technique to the modern UV absorption standard, the absence of interfering pollutants, the representativeness of the well-mixed boundary layer, and expert judgement of their trustworthiness. The earliest surface O3 measurements, corresponding to the 19th century and extending until the early 20th century using the test paper method, also called “ozonoscope” measurements, were among those disregarded (Tarasick et al., 2019).
Considering the scientific questions motivating the TOAR project, associated with the global distribution and trends of surface O3 pollution (Gaudel et al., 2018), the decision not to include the 19th-century semi-quantitative O3 measurements in the TOAR database is grounded. However, there are other scientific questions and uncertainties related to the global distribution of O3 and to surface O3 pollution during the pre-industrial era, such as the atmospheric concentration in non-polluted areas and the evaluation of the assumed O3 concentrations, the study of local sources of O3, and the understanding of the role of such O3 levels in the radiative balance. Clarification of the abovementioned questions and uncertainties could benefit from the combined use of quantitative surface O3 observations and semi-quantitative O3 observations from ozonoscopes. Although ozonoscope measurements are vulnerable to the influence of humidity and oxidants in the air, these O3 observations will enable us to semi-quantitatively study climate variables under conditions comprising very low (or no) exposure to anthropogenic activity during a period for which no other measurements are available (Bojkov, 1986), thereby filling a gap in our knowledge of surface O3 in the 19th century.
Efforts to recover some of these O3 measurements have been performed in the past (Bojkov, 1986; Linvill et al., 1980; Anfossi et al., 1991; Sandroni et al., 1992; Sandroni and Anfossi, 1994; Marenco et al., 1994; Cartalis and Varotsos, 1994; Nolle et al., 2005); however, to our knowledge, only a single sample of these surface O3 datasets has been digitized and published in a public data repository, and this was done during data recovery efforts focused on something other than O3 or atmospheric composition (Vaquero et al., 2022).
Here, we introduce the rescued surface O3 ozonoscope records covering Portugal and the African Atlantic oceanic sector from 23 observatories in four countries, as shown in Fig. 1. The semi-quantitative O3 observations provide a latitudinal coverage from the extratropics in the Northern Hemisphere to the tropics in the Southern Hemisphere. The observations were conducted following a standardized procedure with the same type of test paper (Schönbein, 1850; Bérigny, 1858). The series of daily and monthly means of surface O3 and humidity, as well as their corresponding metadata, have been digitized from the original documentary sources. They are representative of very different regions of the planet, such as the tropics, oceans, and coastal areas. One of them, from the Infante D. Luiz Observatory, located in Lisbon, Portugal, provides almost 50 years of continuous daily data for the period from 1863 to 1913 and nearly 58 years of monthly means for the period from 1855 to 1913, thereby constituting the most extensive and earliest surface O3 ozonoscope data series known to date. Before this work, the longest and earliest reported series was the 31-year Montsouris Observatory O3 ozonoscope data series, which began in 1876 (Bojkov, 1986). Additionally, another 10 of the daily records recovered here cover between 12 and 17 years of data, while 4 monthly mean records extend between 33 and 42 years. The difficulty involved with finding records of meteorological variables covering oceanic regions for the pre-industrial era, in particular surface O3 datasets, makes this contribution one of the most relevant features of the datasets recovered here, as it contains six datasets from islands in the eastern Atlantic (two from the Azores, one from Madeira, two from Cabo Verde, and one from Sao Tome and Principe). The data series have been tested for break points and inhomogeneities, although few were found. Unfortunately, we have discovered scarce metadata that allow us to provide context for the existing break points; however, in several cases, a change in the location of the observatory or instruments seems like a plausible explanation.
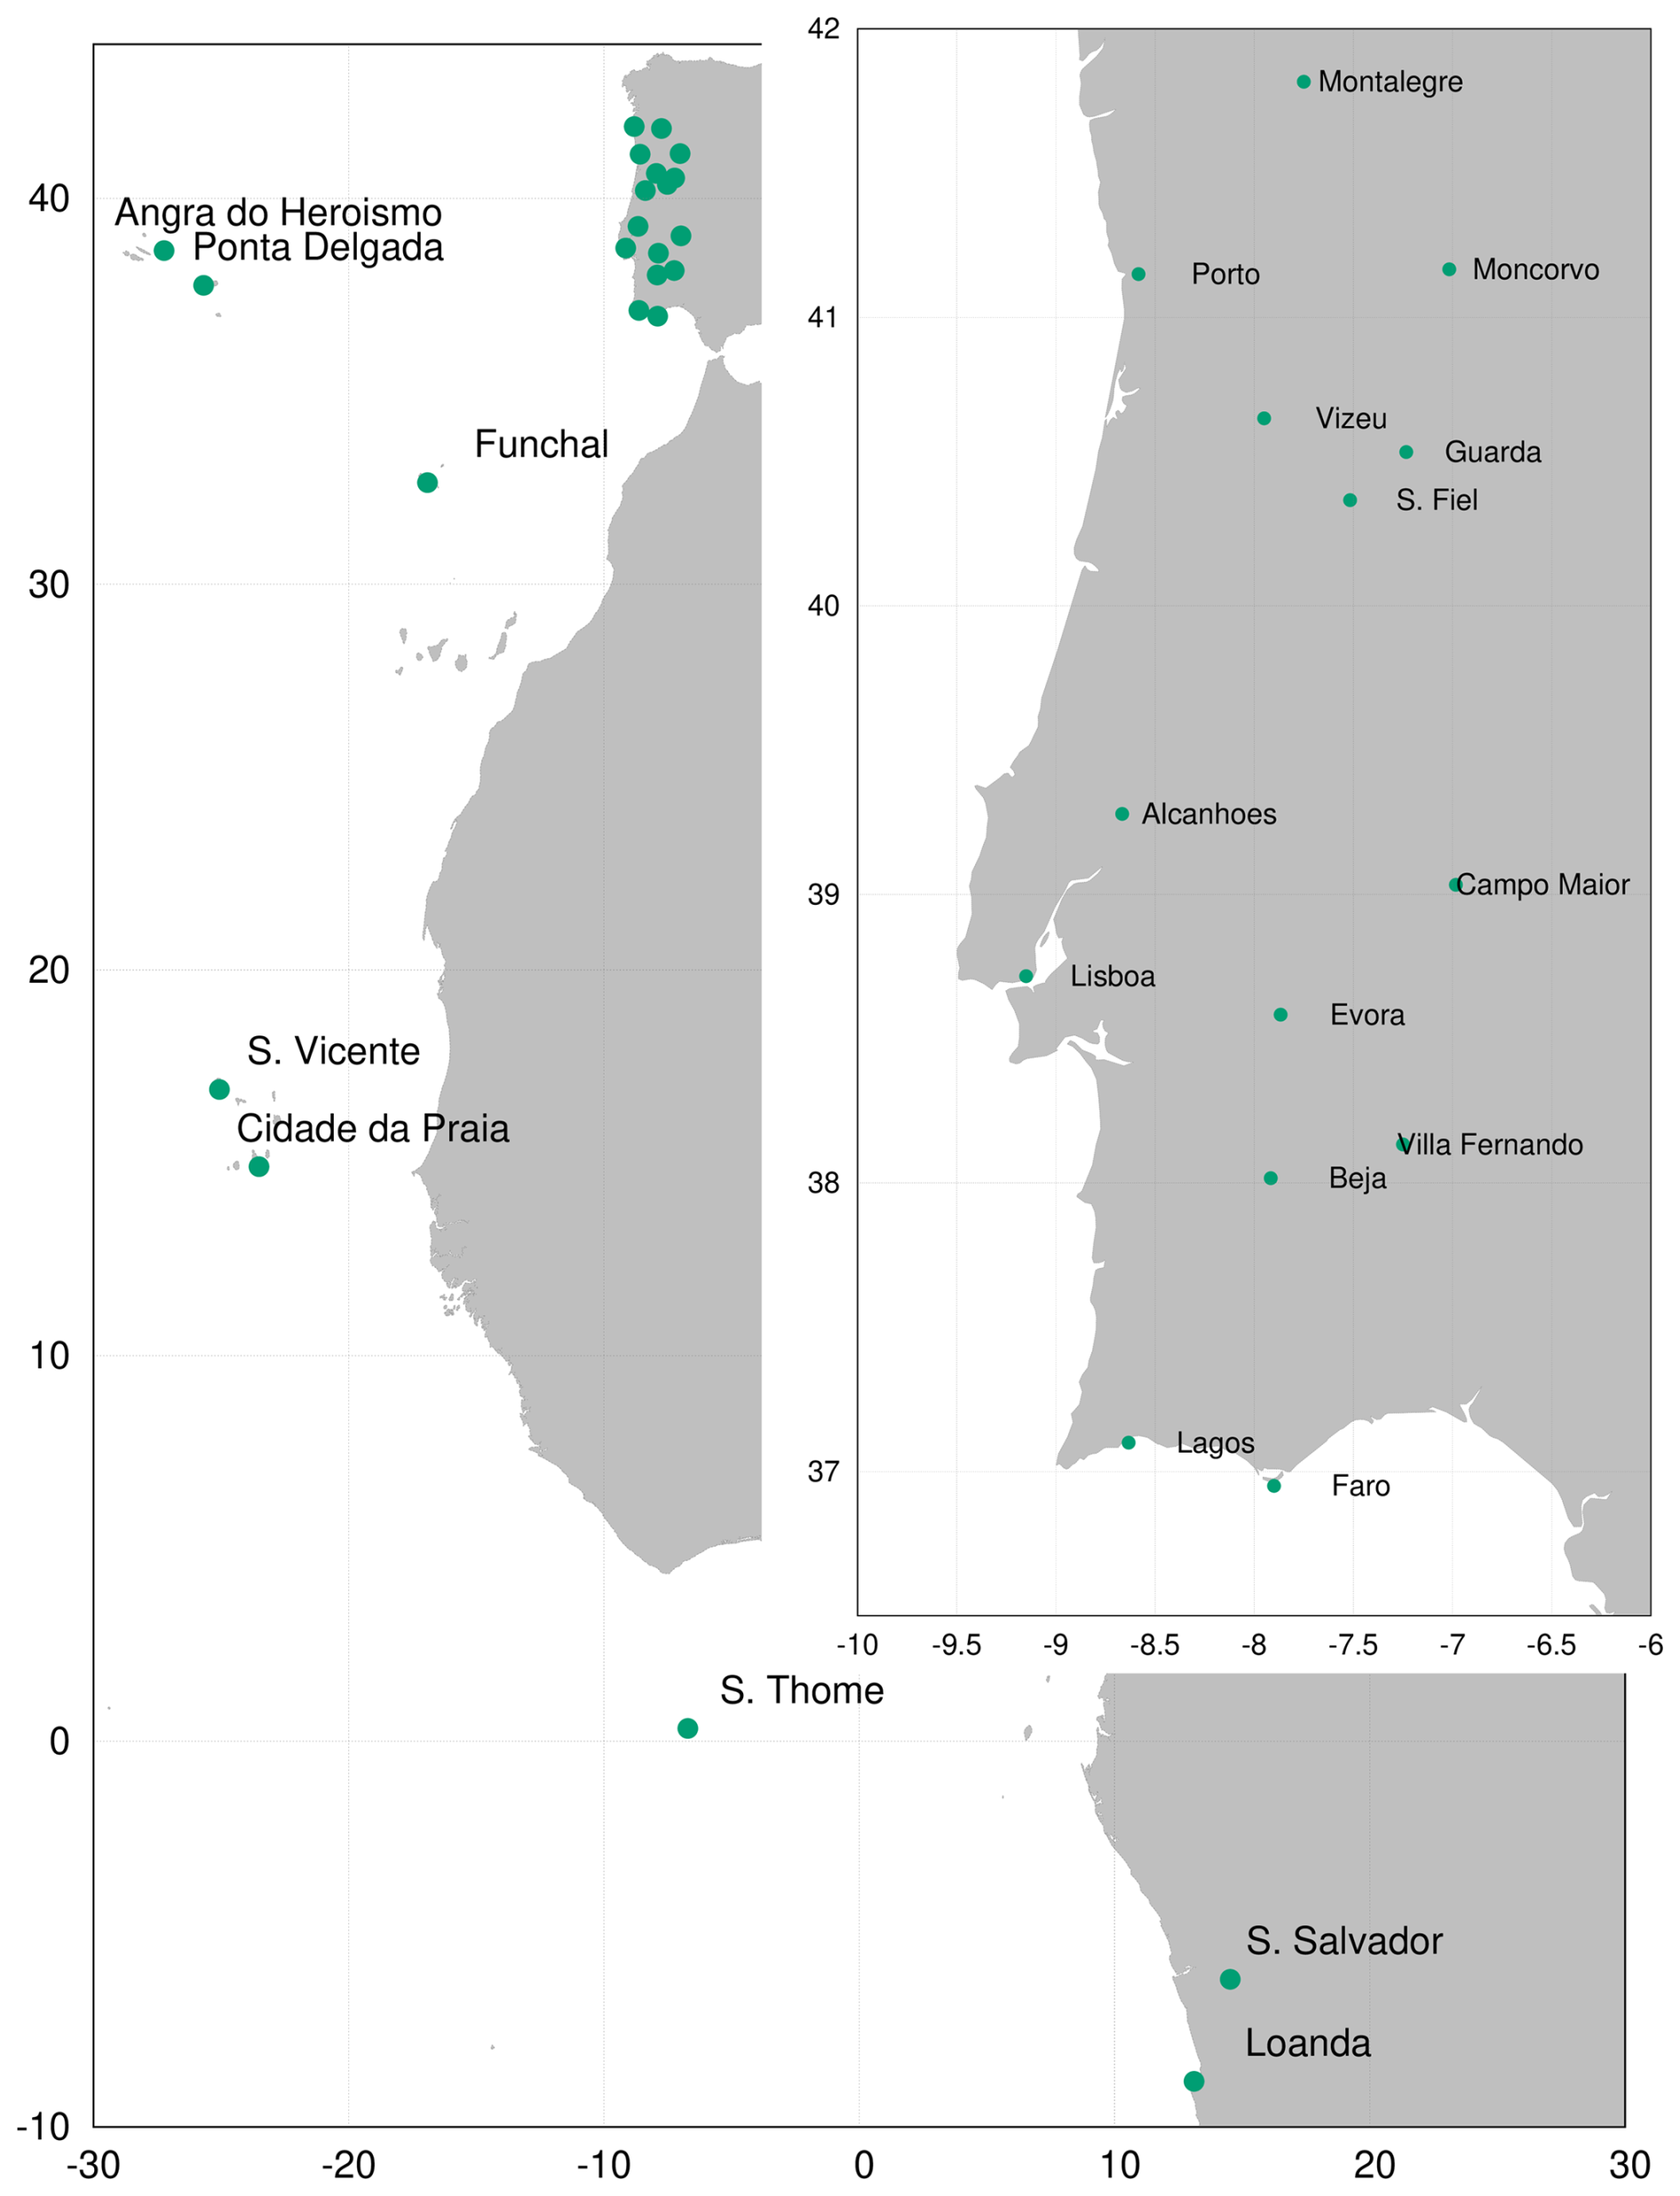
Figure 1Map showing the location of the observatories for which data have been recovered.
In the next section, the Schönbein test paper method and its further improvement by Bérigny are briefly described, followed by a description of the data sources. Then, in Sect. 3, we describe the main features of the recovered datasets, both for the daily and monthly means of the Infante D. Luiz Observatory and the other 22 observatories. Section 4 explains the homogeneity tests applied.
2.1 The test paper method
The test paper measurement method was based on the colour change of an indicator test paper. A strip of blotting paper was coated with starched potassium iodide and then exposed to air for between 8 and 24 h (while protected from solar radiation and rain). After exposure, the strip was moistened and developed a bluish colour associated with the formation of a complex between starch and iodide, produced by the reaction between O3 and iodide. The colouration depends on the O3 concentration. Finally, the observed colour was compared with a standard chromatic scale, graduated by Schönbein from 0 to 10, proportional to the O3 content in the air (Schönbein, 1850; Ramirez-Gonzalez et al., 2020).
The method was criticized after it began to be used because the paper strip changes colour depending on the extent of the iodide reaction with not only ozone but also humidity and other atmospheric oxidants (Houzeau, 1857; Fox, 1873). When air reaches water vapour saturation, it causes the pre-dried paper to humidify, thereby increasing the rate of O3 absorption (Kley et al., 1988; Volz and Kley, 1988). These are the reasons for a non-linear correlation between the colour changes and the ozone concentration.
Bérigny introduced the Schönbein method in France in 1856 (Bérigny, 1856a, b, 1857). He also improved the method, defining the operating procedure, presenting a more precise chromatic scale graduated from 0 to 21 (Bérigny, 1858), and selecting the best-quality impregnated paper (Berzelius paper, manufactured by Jame, a chemist in Sedan, France) (Marenco et al., 1994). This scale was often referred to in logbooks containing measurements as “Jame de Sedan”.
In the more than 150 years since the test paper method was introduced, numerous research has been conducted to understand the physical–chemical processes involved in the method and to deal with the associated interference problems (Marenco et al., 1994). These studies, for example, estimated that the O3 levels for 1880–1900 were approximately 10 ppb in the Great Lakes area of North America, with an annual cycle maximum in April–June and a minimum in October–November (Bojkov, 1986). Another study using observations from Montevideo in Uruguay (1883–1885) and Cordoba in Argentina (1886–1892) also showed O3 levels of the order of 5–10 ppb (Sandroni et al., 1992). It is beyond the scope of this article to discuss all of the reported studies; thus, we refer readers to the review conducted by Marenco et al. (1994). Among the cited interferences present in the Schönbein method, the interference caused by humidity has been the focus of multiple studies (Fox, 1873; Houzeau, 1857; Linvill et al., 1980; Bojkov, 1986; Marenco et al., 1994; Ramirez-Gonzalez et al., 2020). For this reason (the dependence of the ozonosonde values on humidity), we also compile daily humidity values for the same days that the O3 observations were conducted at each site.
All 23 sites with O3 observations reported here followed a standardized procedure and used the same test paper. The O3 observations were conducted following the Schönbein method with the improvements introduced by Bérigny and using Jame (de Sedan) paper. However, observations in the Bérigny scale were converted to the decimal Schönbein scale for processing and reporting (Fradesso da Silveira, 1865). For most of the observatories, two strips of paper were exposed over a period of 24 h, reporting measurements each 12 h. However, at some of the observatories, only one strip of paper was exposed for 24 h, resulting in one daily observation. Further details on the exposure methods used at each observatory are described below.
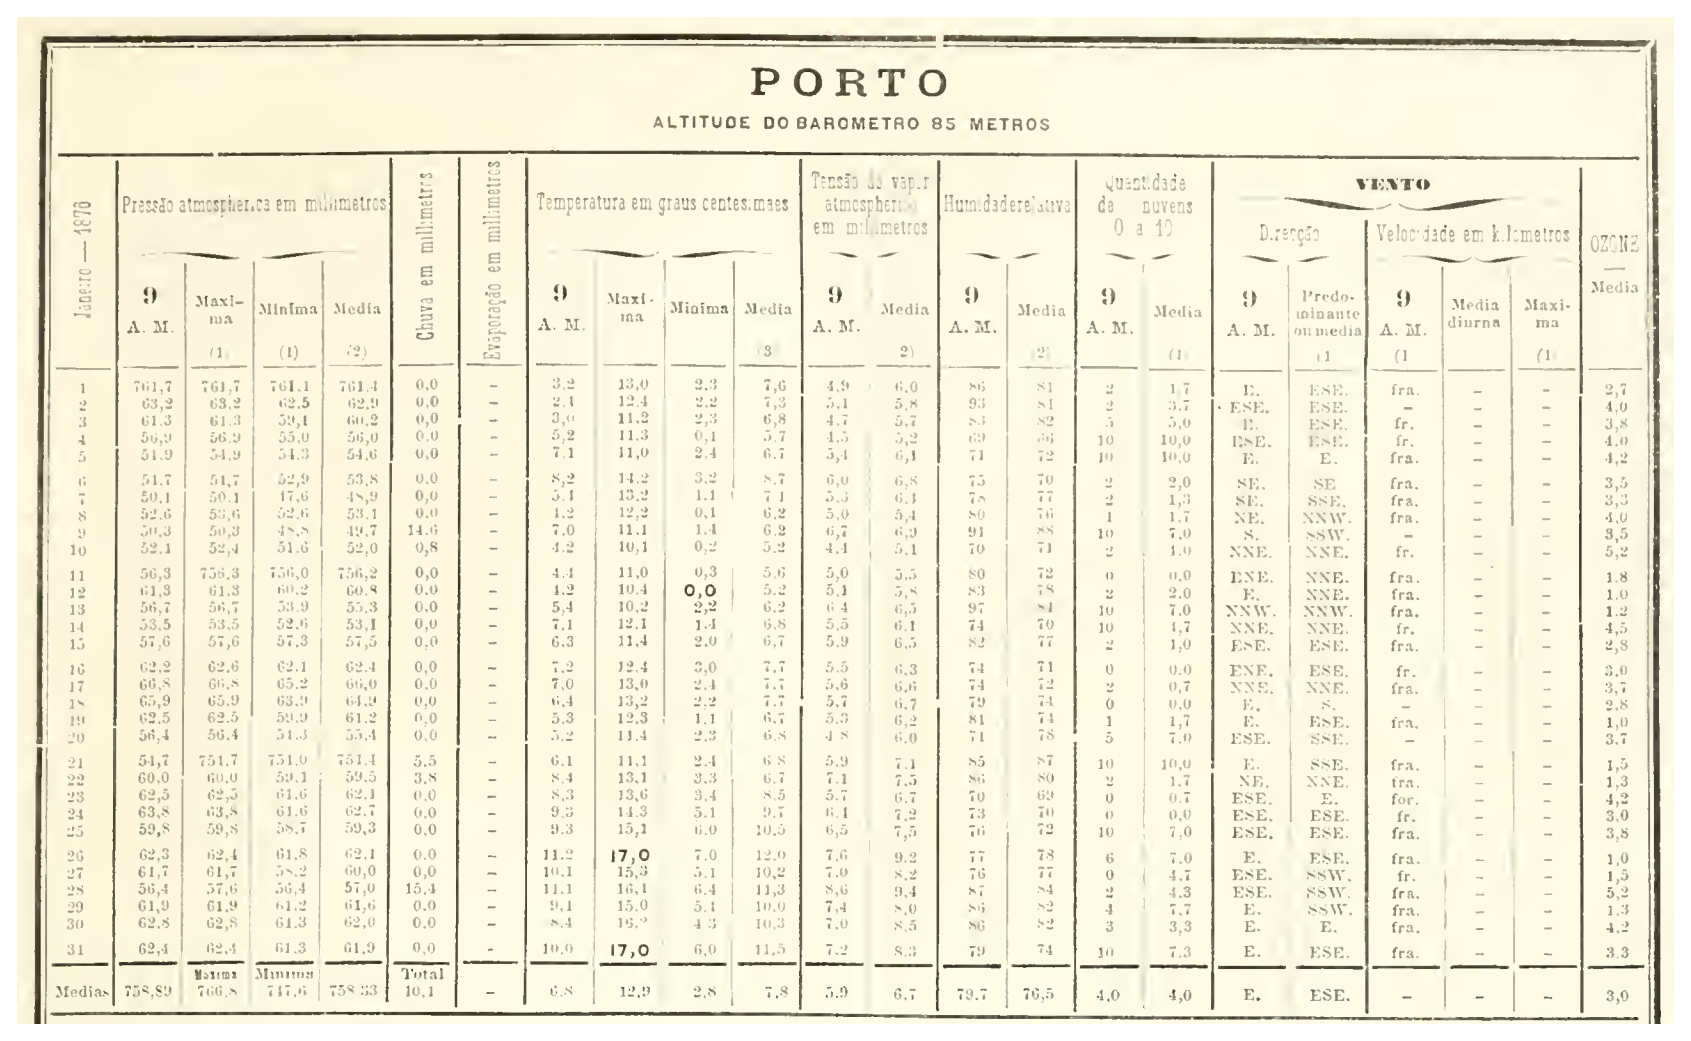
Figure 2Example of the original tables from the Annaes do Observatorio do Infante D. Luiz (AOIDL; source: Brito Capello, 1877). The recovered O3 values are shown in the right-hand column.
2.2 Data source: Annaes do Observatorio do Infante D. Luiz
Available information on the meteorological and magnetic observations conducted at the Infante D. Luiz Observatory and its 22 associated observatories consists of climatological tables reporting daily, monthly, and seasonal means of the observed variables, usually consisting of reports of atmospheric pressure, rain, evaporation, temperature, vapour pressure, humidity, cloud coverage, and wind direction and speed. Moreover, O3 observations were included, published for the first time in 1863, beginning the series of Annaes do Observatorio do Infante D. Luiz (hereinafter AOIDL) reports (see Fig. 2 for an example) (Brito Capello, 1863). Only O3 and humidity data were digitized in the context of the work presented here. O3 observations were reported in that first volume for the Infante D. Luiz Observatory alone, consisting of the monthly and seasonal means of the diurnal, nightly, and daily mean, from December 1855 to November 1863. The second volume, the following year, began to include daily diurnal and nightly O3 observations at Infante D. Luiz Observatory from December 1863 to November 1864 (Fradesso da Silveira, 1864). The subsequent volumes of the AOIDL continued to include daily diurnal and nightly O3 observations at Infante D. Luiz Observatory until November 1913 (De Almeida Lima, 1913). The reports from 1914 for the Infante D. Luiz Observatory still contained the diurnal and nightly daily observations for all of the variables, but the columns for O3 were filled with 0.0 or “– ” (De Almeida Lima, 1914). No information was found for the end of the O3 observations in 1913 at this observatory.
In addition to the Infante D. Luiz Observatory O3 diurnal observations, the second volume published in 1864 included decadal, monthly, and annual O3 means from other observatories. The following volumes of the AOIDL continued reporting the monthly and seasonal means of the diurnal, nightly, and daily mean for the Infante D. Luiz Observatory (De Almeida Lima, 1913). Again, no information has been found with respect to the interruption in the O3 observations.
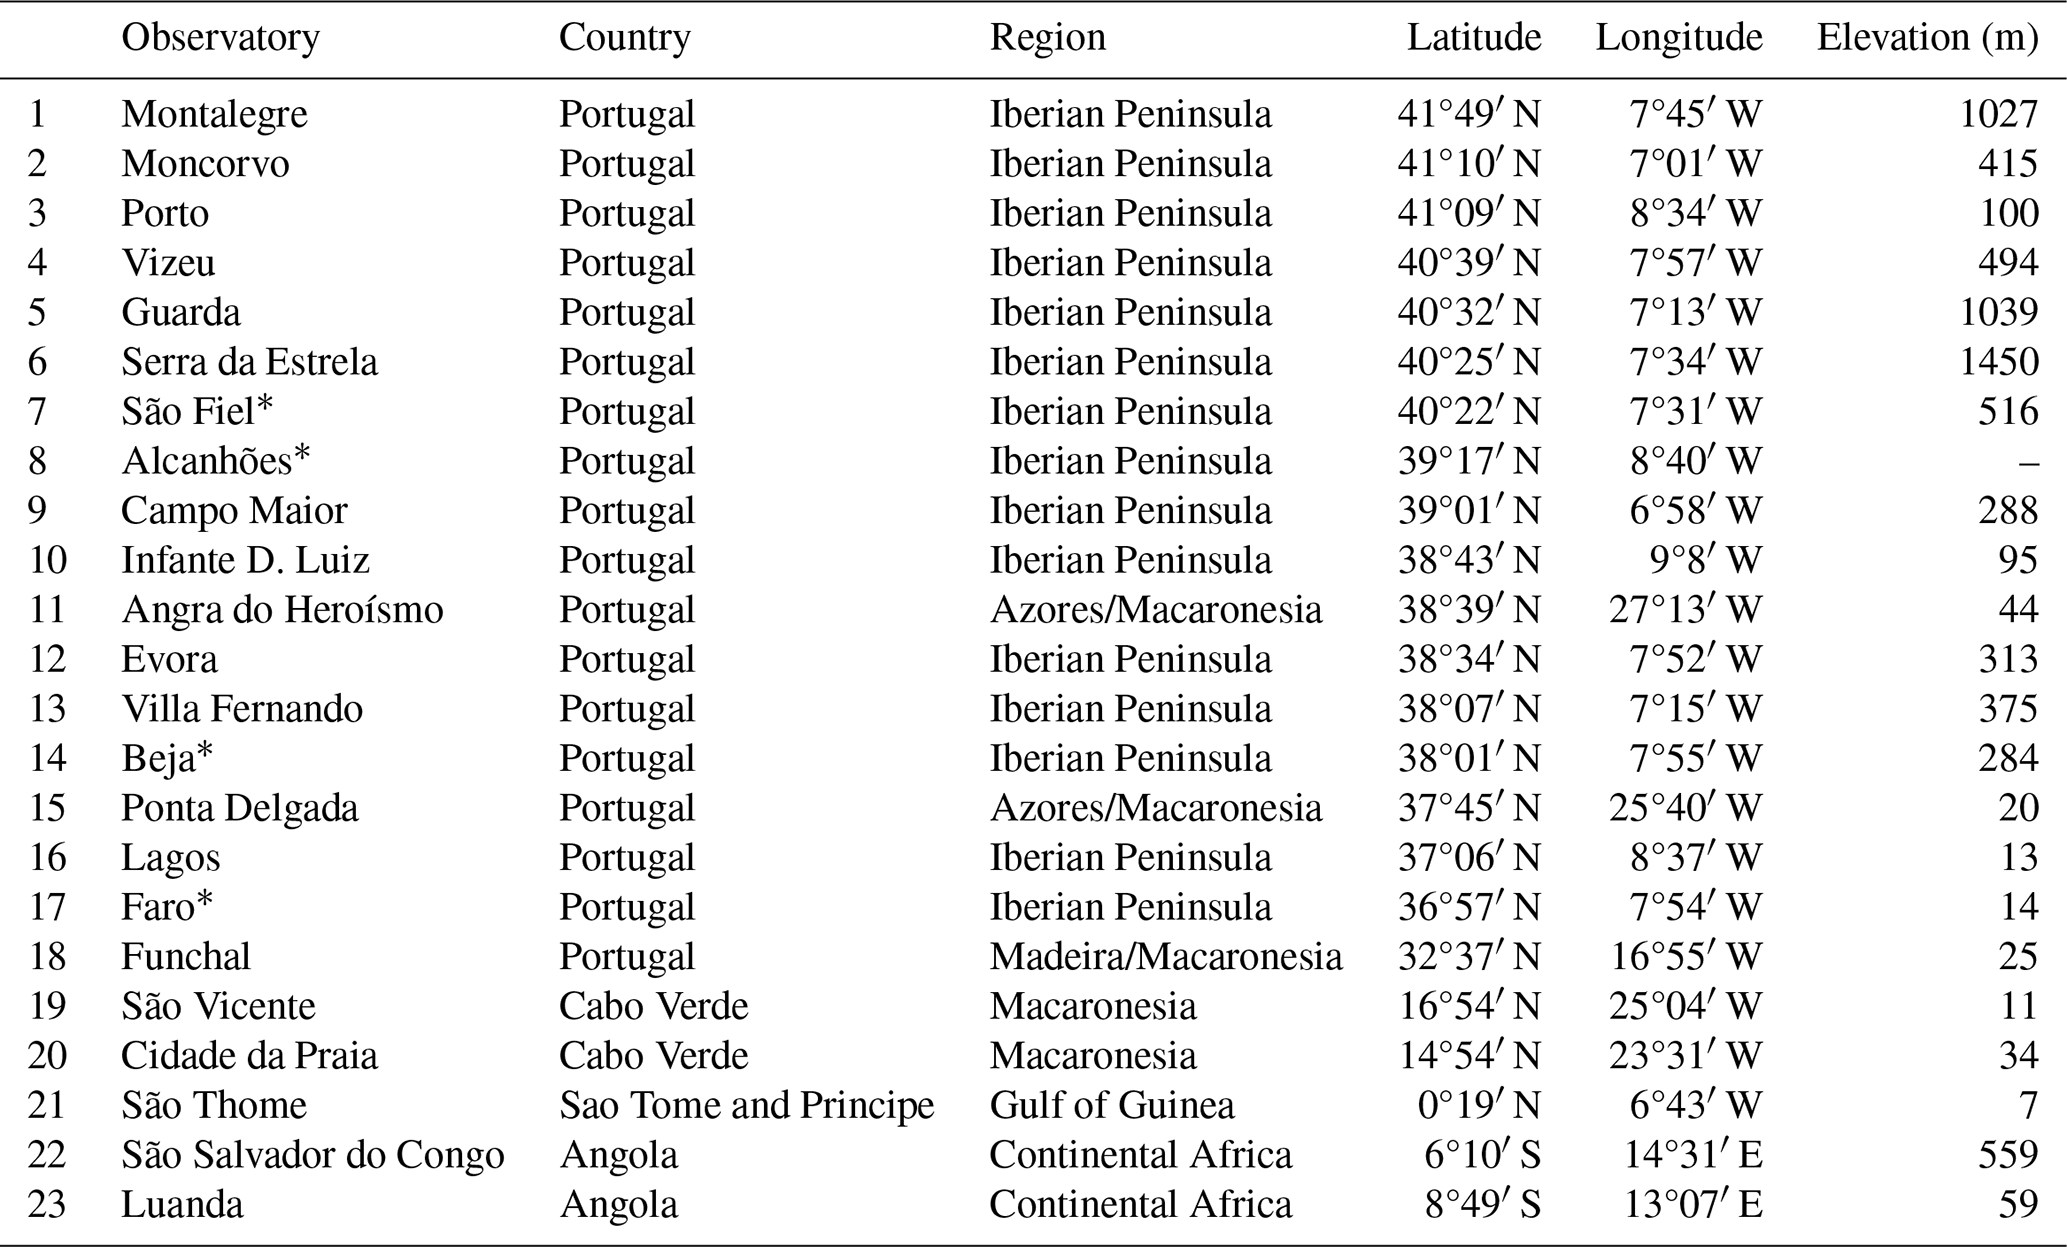
Table 1List of observatories, including the country, region, latitude, longitude, and elevation. Observatories are listed in order of decreasing latitude. Only monthly mean O3 series are available for the four stations flagged with an asterisk (*).
The reports of the decadal and monthly O3 means at the associated 22 observatories continued after 1864, until 1905 (De Lina Vidal, 1905). Daily O3 observations from some of these observatories became intermittent in December 1872, at least in the records that we have found (in volume 11, corresponding to 1873) (Fradesso da Silveira, 1873). In the available AOIDL reports, we found that daily observations for some of the observatories ended in 1887, although the decadal and monthly means continued to be reported. No reason was found for the interruption in the reports, although we speculate that the cost of publishing them could be a cause, as this is a common reason in many cases. The rescued metadata mainly come from several sections (e.g. “Introduction” and “Advertency”) included randomly in the AOIDL (Brito Capello, 1863).
An advantage of this work is that all of the ozonoscopes of the different observatories were calibrated at the Infante D. Luiz Observatory. Figure 1 shows the geographical distribution of the observatories, and Table 1 lists them, along with their geographical coordinates and their altitude, in order of decreasing latitude to facilitate their identification in Fig. 1. Figure 2 provides an example of the tables in the AOIDL containing the recovered O3 data.
3.1 Daily and monthly mean O3 series from Infante D. Luiz Observatory
The O3 observations at the Infante D. Luiz Observatory began in January 1855, along with a set of meteorological observations (Silvestre, 1881), and continued uninterrupted until 13 October 1913 (De Almeida Lima, 1914). Between 1853 and September 1863, the station was situated in a building located at 38°43′13′′ N, 9°8′20′′ W. The station was moved to a different building in October 1863 (at 38°42′59′′ N, 9°8′56′′ W), where it remained until 1 January 1941 (De Almeida Lima, 1918; Mendes Víctor, 2001); on 1 January 1941, the meteorological instruments were moved from the top of the main building to a new meteorological park next to this building, officially maintaining the same geographical coordinates. However, measurements at this new location were first conducted in 1879 and were first reported in 1881 (Brito Capello, 1881). No further changes were reported, at least until the end of the data series considered here. Therefore, we have assumed the last reported coordinates for the measurements conducted after October 1863.
Table 2Temporal coverage of the rescued daily O3 observations for each of the 19 observatories (Infante D. Luiz Observatory and the other associated observatories). The stations are listed in decreasing order based on the available number of years with data. Blue cells correspond to the years with data rescued. The numbers inside the cells represent the number of observations conducted daily. One daily observation (1) consisted of a 24 h strip exposure, from 15:00 to 15:00 LT (local time) of the following day. Two daily observations (2) consisted of one 12 h strip exposure from 09:00 to 21:00 LT and another exposure from 21:00 to 09:00 LT of the following day. Blue cells without a number indicate that no information was found about the number of daily observations.
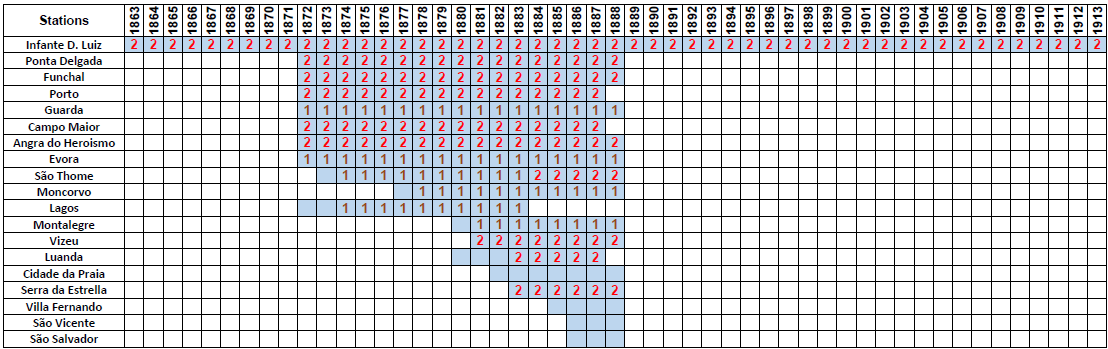
Table 2 shows the yearly coverage of the rescued daily series, consisting of almost 50 years of data from 1863 to 1913. The daily observations from 1855 to 1862 were not included in the first AOIDL volume (Brito Capello, 1863); however, the monthly means of observations were included, as shown in Table 3. This is the reason for the difference between the number of years of data rescued for the daily and monthly means for the Infante D. Luiz Observatory. Both series are, by far, the longest reported in the literature. They are also among the earliest.
3.2 Daily and monthly mean O3 series from the other 22 observatories
For four of the stations reported in the AOIDL reports, Alcanhões, Beja, Faro, and São Fiel, from 1863 to 1914, we found only monthly mean values. This is why 19 stations are listed in Table 2 (daily data), whereas 23 are listed in Table 3 (monthly data). Furthermore, Table 2 shows that, although two daily O3 observations were conducted at at least nine observatories, only the two daily observations at the Infante D. Luiz Observatory were included in the cited AOIDL reports.
Table 3Temporal coverage of the rescued monthly mean O3 observations for each of the observatories, outlining the period rescued and the available data. Brown cells correspond to the years with data rescued. The numbers inside the cells represent the number of monthly means available per year.
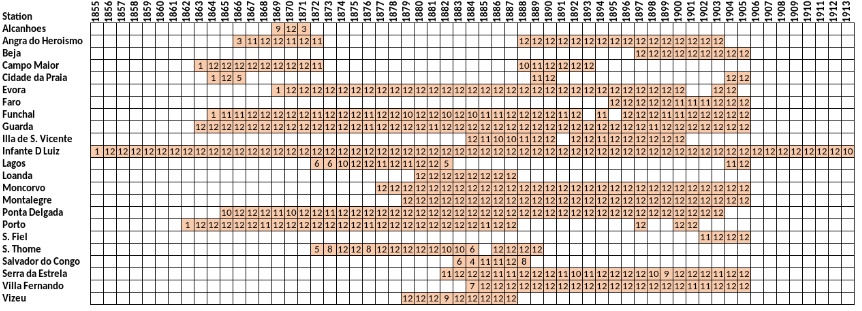
In the existing literature, daily and monthly mean O3 observations at Campo Maior have been recovered (Vaquero et al., 2022) and stored in the PANGAEA open-access dataset repository (Vaquero et al., 2021). The monthly mean series reported here match the one that they reported. However, the daily O3 observations (Brito Capello, 1877) did not contain the observations for the period from 1863 to 1872, which we include in the recovered observations reported here. Moreover, daily mean O3 observations at the Porto Observatory from 1861 to 1897 were reported (without making the dataset available) (Alvim-Ferraz et al., 2006). Table 2 shows that we were only able to find and recover daily mean O3 observations from Porto between 1872 and 1887; however, we were more successful regarding the monthly mean O3 observations, as shown in Table 2, recovering the period from 1862 to 1877 and the years 1897, 1900, and 1901. Daily mean O3 observations from the Luanda Observatory between 1890 and 1895 were used (again without making the dataset available) (Pavelin et al., 1999). In addition to these observations, we were able to recover 8 additional years of daily and monthly mean O3 observations from the Luanda Observatory, from 1880 to 1887. Neither the Porto nor the Luanda O3 datasets described here had been reported or published in data repositories.
4.1 Quality control of the recovered datasets
Using the so-called limit test, each variable from the datasets was checked, assuring that it was in the range of its respective physically plausible magnitudes (Vaquero et al., 2022); thus, the consistency of its recorded values was also examined.
The homogeneity of the recovered data was tested using the Climatol software (version 4.0.0; Guijarro, 2023), which is based on the standard normal homogeneity test (SNHT) (Alexandersson, 1986). Climatol reconstructs each time series using the data from the neighbouring stations, and it employs the reconstructed series as a reference to check homogeneity. Among the parameters that are set by the user, two are particularly relevant: (1) the distance at which the weight of the reference stations is halved and (2) the threshold of the SNHT statistic above which an inhomogeneity is considered significant. The former parameter was set at 1000 km, and the latter was set at 25 (the default value) for O3 and 15 for RH. The measurements taken in Lisbon before 1863 and after 1905 were not checked because of the absence of reference stations. The full results of the homogeneity test are provided in the Supplement.
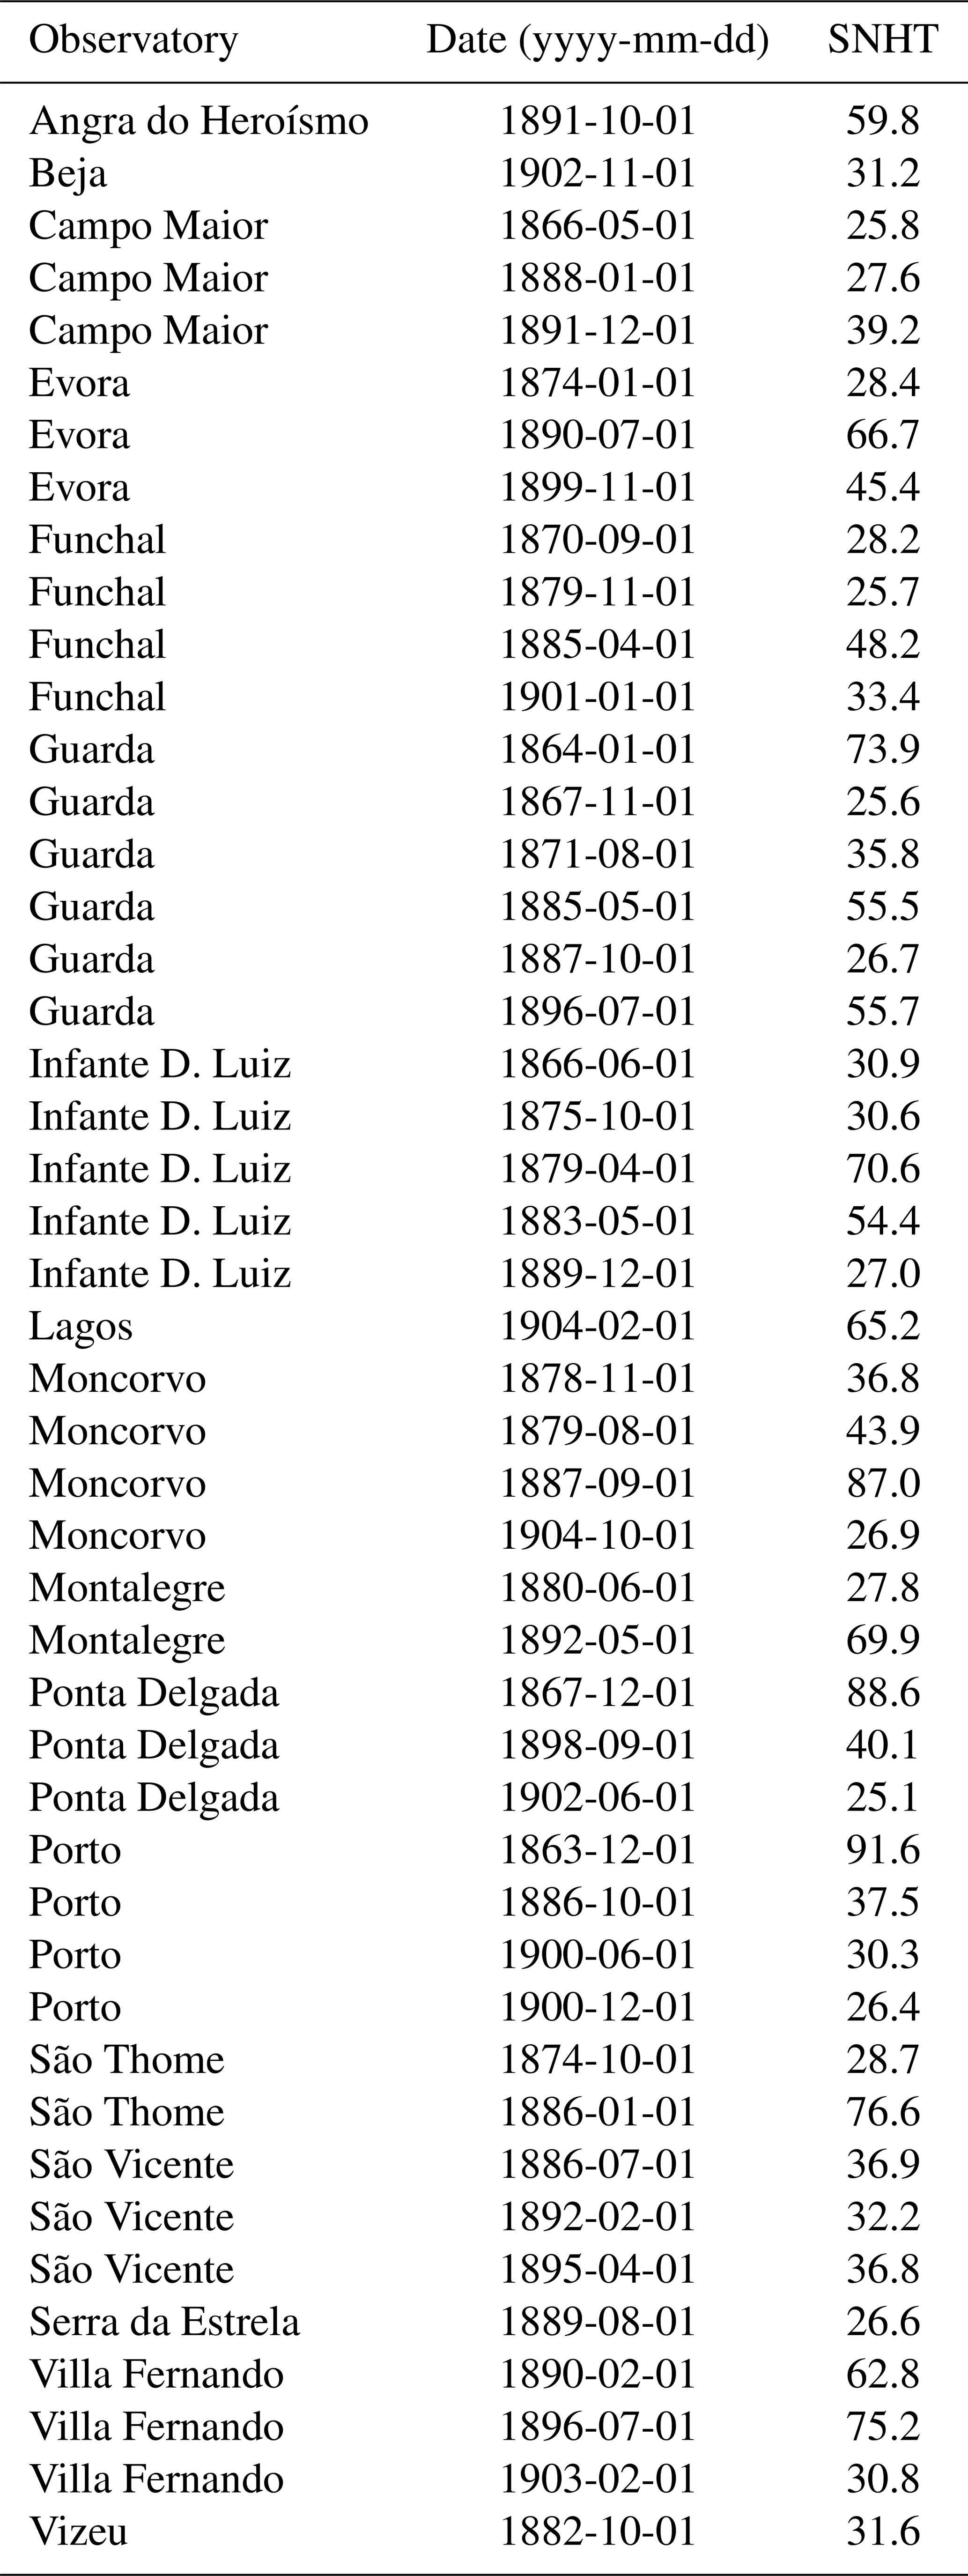
Table 4Observatory, date, and SNHT value for the O3 break points.
4.2 Break points
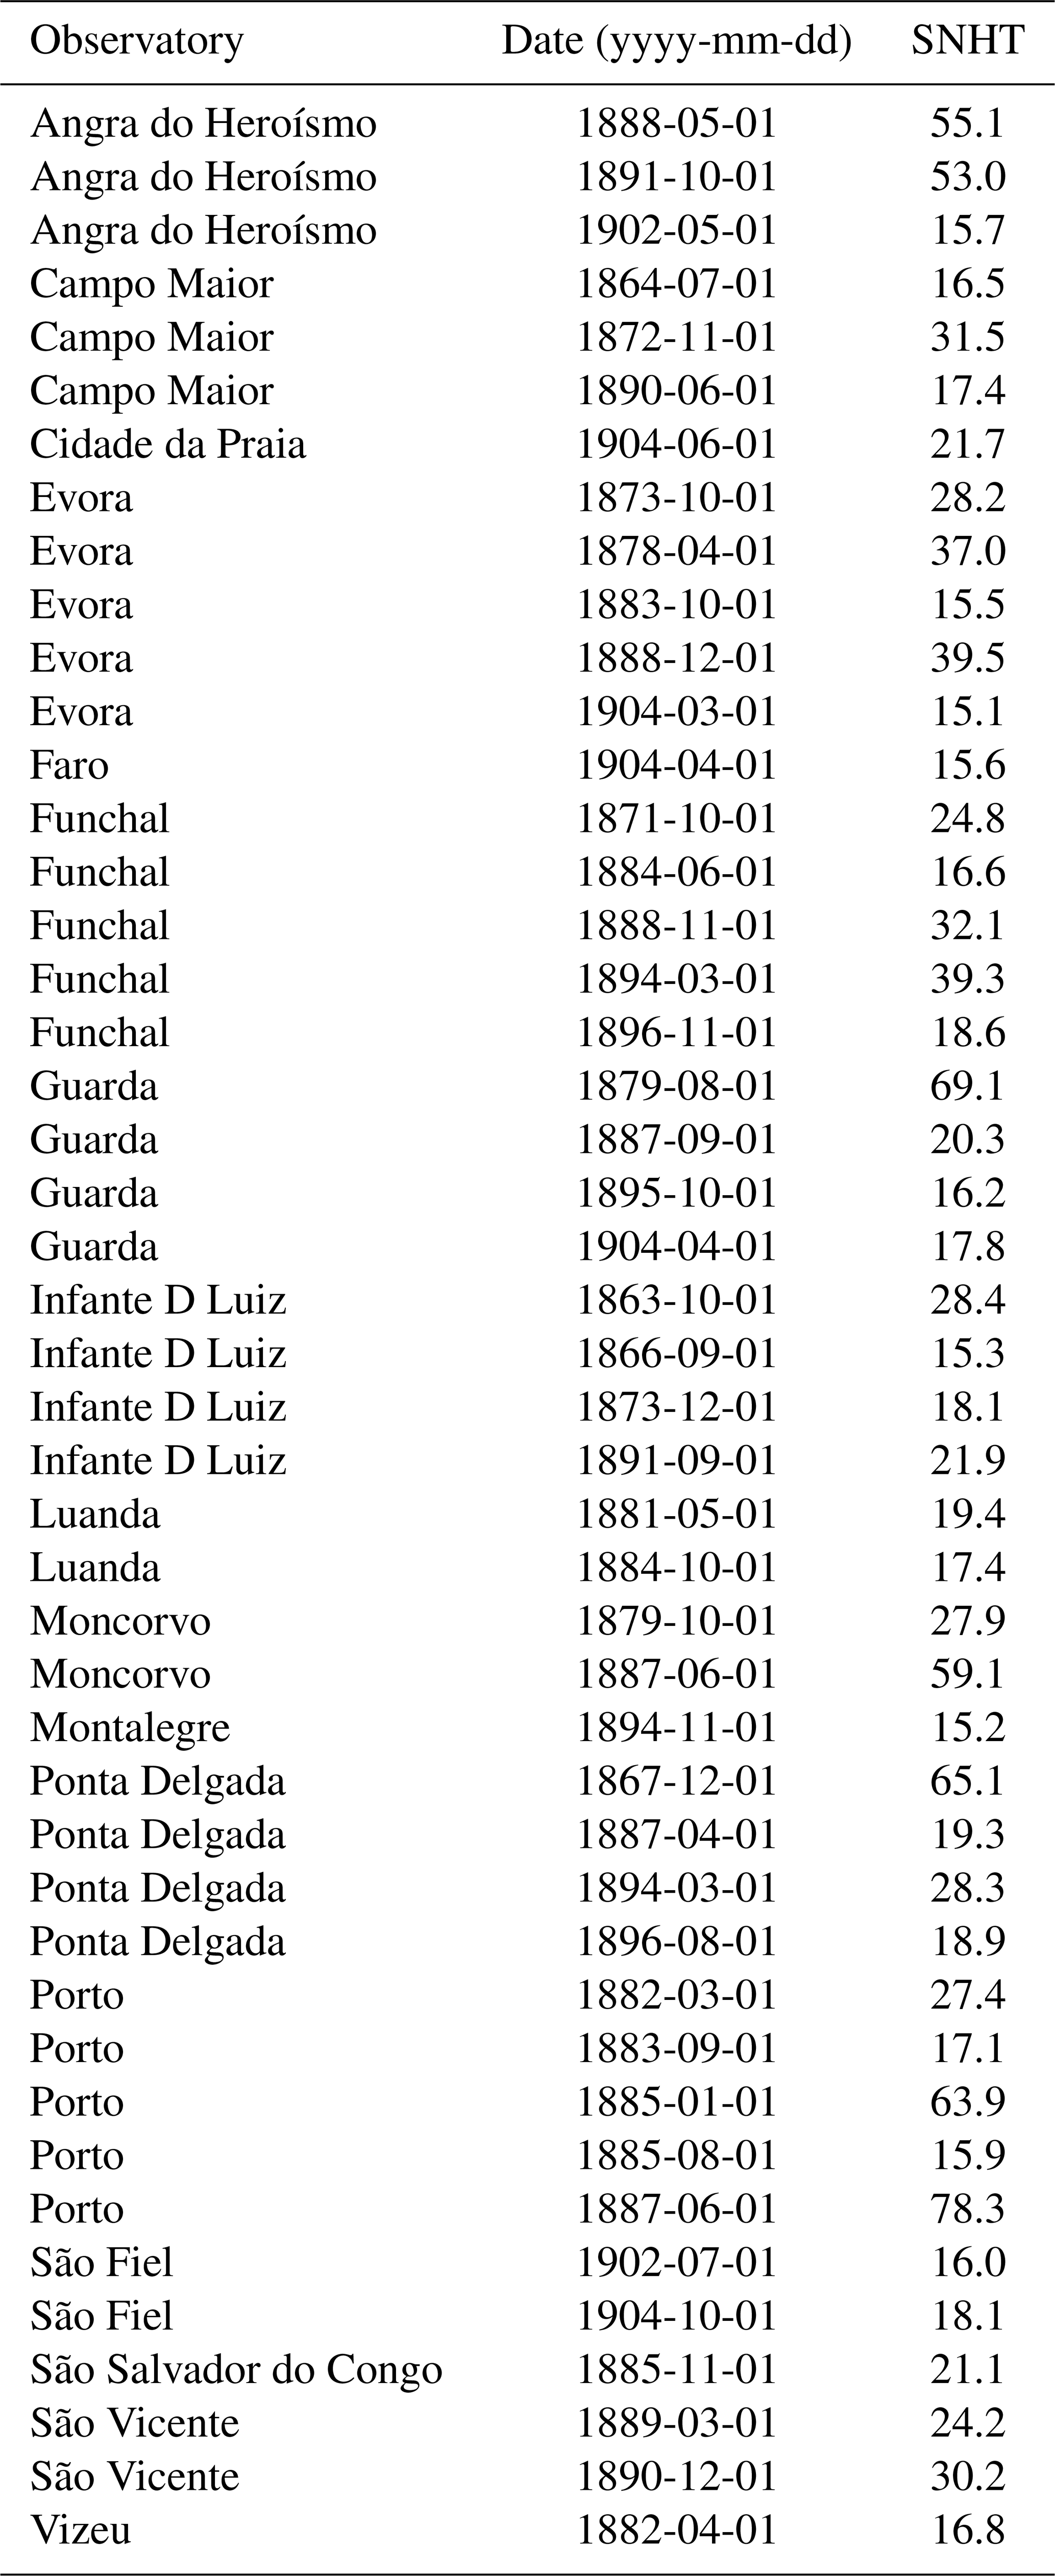
A total of 47 break points were identified in the O3 series, while 46 break points were identified in the RH series (at 17 stations). Six break points in the O3 series coincide with those in the RH series. Additionally, at four of these stations, the O3 break points happen later in the series than those of RH, within an interval of 6 months with respect to the RH observations (see Tables 4 and 5).
It is noteworthy that the O3 and RH break points coincide in the same month for Angra de Heroísmo (on 1 October 1891) and Ponta Delgada (on 1 December 1867).
Table 5Observatory, date, and SNHT value for the RH break points.
The Montecorvo series has two simultaneous break points for O3 and RH, with a difference of 8 years. However, in the first, the RH break point (on 1 October 1879) precedes that of O3. The other O3 break point (on 1 September 1887) happens after the RH break point (on 1 June 1887).
In three of these cases, the coincidence of the interval between O3 and RH is reduced to 1 or 2 months: Angra de Heroísmo, Ponta Delgada, and Villa Fernando, which could point to a similar condition (e.g. moving the observatory or instruments) between both changes.
Despite the lack of metadata supporting it, simultaneous break points in both the O3 and RH series could point to a change in the location of the station, as two independent instruments and data series simultaneously suffer alterations. We searched the AOIDL for information to identify the possible causes of the break points, but we only found information about the Luanda Observatory, which is speculated to have been moved in 1881 (Raposo, 2017), when its RH data show two break points. For the remainder, we did not find anything. There was a slight change in the geographical coordinates of the Infante D. Luiz Observatory in 1879, as already described above, but it is unlikely that it was a change in the site location. The only changes in the observations were found at São Tome: initial 24 h strip exposure (from 15:00 LT to 15:00 LT on consecutive days, where LT denotes local time) observations were reported from March 1873 to January 1882; however, in the February report the same year, observations changed to 12 h strip exposures (from 09:00 to 21:00 LT and from 21:00 to 09:00 LT of the following day), as depicted on Table 2. At this site, two break points in the O3 series were detected – in October 1874 and January 1886. No RH break points were reported.
The semi-quantitative monthly (Añel et al., 2024b) and daily (Añel et al., 2024a) surface O3 datasets recovered and reported here have been deposited at PANGAEA and are available at https://doi.org/10.1594/PANGAEA.969241 (Añel et al., 2024b) and https://doi.org/10.1594/PANGAEA.969259 (Añel et al., 2024a), respectively.
The Climatol (version 4.0.0; Guijarro, 2023) software (https://doi.org/10.5281/zenodo.12786077, Guijarro and Añel, 2024) was used for the homogeneity test. For computational reproducibility (Añel, 2011, 2017), it is distributed as free software under the GPLv3 licence and stored in a permanent Zenodo repository (https://doi.org/10.5281/zenodo.12786077, Guijarro and Añel, 2024).
We have recovered semi-quantitative surface O3 ozonoscope records from the 19th century and the beginning of the 20th century and compiled them in a new data collection. We include data from 23 observatories covering Portugal and the African Atlantic regions, providing a latitudinal span from the extratropics in the Northern Hemisphere to the tropics in the Southern Hemisphere. This record represents the most extensive ozonoscope data series recovered to date, spanning 50 years of daily data and 58 years of monthly data, from 1855 to 1913. Moreover, with the small exception of part of an observatory series, the existence of the observations recovered here has not been previously noted in the literature. This dataset presents only a small number of inhomogeneities and has the potential to eventually provide invaluable information on pre-industrial O3. For example, the fact that it includes daily nightly and diurnal observations may present an opportunity to apply our understanding of ozone chemistry and surface ozone variability, which is still developing, to earlier time periods (Monks et al., 2021). Plenty of data that could be recovered from other observatories exist in logbooks (Bojkov, 1986; Möller, 2022), and such data and the work published here can contribute to a better understanding of pre-industrial O3 and be employed in future research.
The supplement related to this article is available online at https://doi.org/10.5194/essd-17-2437-2025-supplement.
JAA devised the research, with help from LG and ASL. JAA researched the books containing the datasets, with help from JCAM, LG, and MAV. The datasets were digitized by JAA, JCAM, and CPS. Quality control of the data, including homogenization, was performed by JAA, JCAM, ACS, LdlT, and YB. JAA, LdlT, and LG secured the funding. JAA and JCAM wrote the original manuscript draft. All authors have read and agreed upon the published version of the paper.
The contact author has declared that none of the authors has any competing interests.
Publisher's note: Copernicus Publications remains neutral with regard to jurisdictional claims made in the text, published maps, institutional affiliations, or any other geographical representation in this paper. While Copernicus Publications makes every effort to include appropriate place names, the final responsibility lies with the authors.
The authors wish to thank Stefan Brönnimann and Renate Varga (Auchmann), from the University of Bern, and Ricardo García-Herrera, from the Universidad Complutense de Madrid, for comments on early versions of this work and paper, especially Ricardo García-Herrera for making us aware of the first meteorological records that kicked off this research. Moreover, we would like to thank Amelie Driemel (from PANGAEA), for all of the work related to the curation and publication of the datasets, and PANGAEA, for storing and publishing the datasets. This work was supported by the Government of Galicia within the framework of the DOPPLER project (grant no. ED431F 2016/15). Juan A. Añel was supported by a grant from the “Programa de Recualificación del Profesorado Universitario” of the Spanish Ministry of Universities. Celia Pérez-Souto is supported by the Government of Galicia under grant no. ED481A-2024-246. Antonio Cid Samamed is grateful for support from an action financed by the Ministry of Universities (under application no. 33.50.460A.752) and from the European Union Next Generation EU/PRTR (through a “María Zambrano” contract from the Universidade de Vigo, belonging to the launch of a European Recovery Instrument (“Next Generation EU”), aimed at re-qualifying the Spanish university system, specifically for teachers and to attract international talent). The EPhysLab is supported by the Government of Galicia (grant no. ED431C 2021/44).
This research has been supported by the Consellería de Cultura, Educación e Ordenación Universitaria, Xunta de Galicia (grant nos. ED431F 2016/15 and ED431C 2021/44), and by the Ministerio de Universidades (grant no. 33.50.460A.752).
This paper was edited by Graciela Raga and reviewed by two anonymous referees.
Alexandersson, H.: A homogeneity test applied to precipitation data, J. Climatol., 6, 661–675, https://doi.org/10.1002/joc.3370060607, 1986.
Alvim-Ferraz, M. C. M., Sousa, S. I. V., Pereira, M. C., and Martins, F. G.: Contribution of anthropogenic pollutants to the increase of tropospheric ozone levels in the Oporto Metropolitan Area, Portugal since the 19th century, Environ. Pollut., 140, 516–524, 2006.
Añel, J. A.: The importance of reviewing the code, Commun. ACM, 54, 40–41, https://doi.org/10.1145/1941487.1941502, 2011.
Añel, J. A.: Comment on “Most computational hydrology is not reproducible, so is it really science?” by Hutton et al., Water Resour. Res., 53, 2572–2574, https://doi.org/10.1002/2016WR020190, 2017.
Añel, J. A., Gimeno, L., Samamed, A. C., Pérez-Souto, C., Torre, L. de la, Valente, M. A., Saiz-Lopez, A., Brugnara, Y., and Antuña-Marrero, J. C.: Pre-industrial semiquantitative daily mean surface ozone data, PANGAEA, https://doi.org/10.1594/PANGAEA.969259, 2024a.
Añel, J. A., Gimeno, L., Samamed, A. C., Pérez-Souto, C., Torre, L. de la, Valente, M. A., Saiz-Lopez, A., Brugnara, Y., and Antuña-Marrero, J. C.: Pre-industrial semiquantitative monthly mean surface ozone data, PANGAEA, https://doi.org/10.1594/PANGAEA.969241, 2024b.
Anfossi, D., Sandroni, S., and Viarengo, S.: Tropospheric ozone in the nineteenth century: The Moncalieri series, J. Geophys. Res., 96, 17349–17352, 1991.
Bérigny, A.: Observations faites à Versailles avec le papier dit ozonométrique (séance du 8 Avril 1856), Ann. Soc. Meteorol. Paris, 4, 79–81, 1856a.
Bérigny, A.: Observations ozonométriques faites avec le papier Schöenbein à la caseme Saint-Cloud (séance du 13 Mai 1856), Ann. Soc. Meteorol. Paris, 4, 84–97, 1856b.
Bérigny, A.: Recherches et observations pratiques sur le papier ozonométrique (séance du 9 Juin 1857), Annu. Société Météorologique Fr., 5, 149–156, 1857.
Bérigny, A.: Gamme chromatique pour l'ozonomètre (séance du 9 Mars 1858), Ann. Soc. Meteorol. Paris, 6, 25–29, 1858.
Bojkov, R. D.: Surface Ozone During the Second Half of the Nineteenth Century, J. Clim. Appl. Meteorol., 25, 343–352, 1986.
Brito Capello, J. C.: Annaes do Observatorio do Infante D. Luiz, 1856–1863, 129 pp., 1863.
Brito Capello, J. C.: Postos Meteorologicos 1876, Primeiro Semestre, Anexo ao Volume XIV dos Annaes do Observatorio do Infante D. Luiz, 34 pp., 1877.
Cartalis, C. and Varotsos, C.: Surface ozone in Athens, Greece, at the beginning and at the end of the twentieth century, Atmos Env., 28, 3–8, 1994.
De Almeida Lima, J. A.: Annaes do Observatorio do Infante D. Luiz, 1913, 261 pp., , 1913.
De Almeida Lima, J. A.: Annaes do Observatorio do Infante D. Luiz, 1914, 260 pp., 1914.
De Almeida Lima, J. A.: Annaes do Observatorio do Infante D. Luiz, 1915, 269 pp., 1918.
De Lina Vidal, A. A.: Annaes do Observatorio do Infante D. Luiz, 1905, 126 pp., 1905.
Fox, C. B.: Ozone and Antozone, Their History and Nature When, Where, Why, how is Ozone Observed in the Atmosphere?, Churchill, 1873.
Fradesso da Silveira, J. H.: Annaes do Observatorio do Infante D. Luiz, 1864, 223 pp., 1864.
Fradesso da Silveira, J. H.: Annaes do Observatorio do Infante D. Luiz, 1865, 237 pp., 1865.
Fradesso da Silveira, J. H.: Annaes do Observatorio do Infante D. Luiz, 1873, 26 pp., 1873.
Gaudel, A., Cooper, O. R., Ancellet, G., Barret, B., Boynard, A., Burrows, J. P., Clerbaux, C., Coheur, P.-F., Cuesta, J., Cuevas, E., Doniki, S., Dufour, G., Ebojie, F., Foret, G., Garcia, O., Granados-Muñoz, M. J., Hannigan, J. W., Hase, F., Hassler, B., Huang, G., Hurtmans, D., Jaffe, D., Jones, N., Kalabokas, P., Kerridge, B., Kulawik, S., Latter, B., Leblanc, T., Le Flochmoën, E., Lin, W., Liu, J., Liu, X., Mahieu, E., McClure-Begley, A., Neu, J. L., Osman, M., Palm, M., Petetin, H., Petropavlovskikh, I., Querel, R., Rahpoe, N., Rozanov, A., Schultz, M. G., Schwab, J., Siddans, R., Smale, D., Steinbacher, M., Tanimoto, H., Tarasick, D. W., Thouret, V., Thompson, A. M., Trickl, T., Weatherhead, E., Wespes, C., Worden, H. M., Vigouroux, C., Xu, X., Zeng, G., and Ziemke, J.: Tropospheric Ozone Assessment Report: Present-day distribution and trends of tropospheric ozone relevant to climate and global atmospheric chemistry model evaluation, Elem. Sci. Anth., 6, 39, https://doi.org/10.1525/elementa.291, 2018.
Guijarro, J. A.: User's guide of the climatol R Package (version 4.1.1), 2023.
Guijarro, J. A. and Añel, J. A.: Climatol 4.0.0 (4.0.0), Zenodo [data set], https://doi.org/10.5281/zenodo.12786077, 2024.
Houzeau, A.: Observations sur la valeur du papier dit ozonométrique et exposition d'une nouvelle méthode analytique pour reconnaitre et doser l'ozone (seance du 10 Mars 1857), Ann. Soc. Meteorol. Paris, 5, 43–53, 1857.
Kley, D., Volz, A., and Mülheims, F.: Ozone Measurements in Historic Perspective, in: Tropospheric Ozone: Regional and Global Scale Interactions, edited by: Isaksen, I. S. A., Springer Netherlands, Dordrecht, 63–72, https://doi.org/10.1007/978-94-009-2913-5_4, 1988.
Linvill, D. E., Hooker, W. J., and Olson, B.: Ozone in Michigan's Environment 1876–1880, Mon. Weather Rev., 108, 1883–1891, 1980.
Marenco, A., Gouget, H., Nédélec, P., Pagés, J.-P., and Karcher, F.: Evidence of a long-term increase in tropospheric ozone from Pic du Midi data series: Consequences: Positive radiative forcing, J. Geophys. Res., 99, 16617–16632, 1994.
Mendes Víctor, L. A.: Anais do Instituto Geofísico do Infante D. Luís 1999, 65 pp., 2001.
Möller, D.: Atmospheric Chemistry: A Critical Voyage Through the History, De Gruyter, ISBN 978-3-11-073739-4, 2022.
Monks, P. S., Ravishankara, A. R., von Schneidemesser, E., and Sommariva, R.: Opinion: Papers that shaped tropospheric chemistry, Atmos. Chem. Phys., 21, 12909–12948, https://doi.org/10.5194/acp-21-12909-2021, 2021.
Nolle, M., Ellul, R., Ventura, F., and Güsten, H.: A study of historical surface ozone measurements (1884–1900) on the island of Gozo in the central Mediterranean, Atmos. Environ., 39, 5608–5618, 2005.
Pavelin, E. G., Johnson, C. E., Rughooputh, S., and Toumi, R.: Evaluation of pre-industrial surface ozone measurements made using Schönbein's method, Atmos Environ., 33, 919–929, 1999.
Ramirez-Gonzalez, I. A., Añel, J. A., and Cid Samamed, A.: Ozone measurement practice in the laboratory using Schönbein's method, Geosci. Commun., 3, 99–108, https://doi.org/10.5194/gc-3-99-2020, 2020.
Raposo, P. M. P.: Meteorology, Timekeeping and “Scientific Occupation”: Colonial Observatories in the Third Portuguese Empire, Cah. Fr. Viète, III, 139–168, 2017.
Sandroni, S. and Anfossi, D.: Historical data of surface ozone at tropical latitudes, Sci. Total Environ., 148, 23–29, 1994.
Sandroni, S., Anfossi, D., and Viarengo, S.: Surface ozone levels at the end of the nineteenth century in South America, J. Geophys. Res., 97, 2535–2539, 1992.
Schönbein, C.: Recherche sur la nature de l'odeur qui se manifeste dans certaines actions chimiquies, Comptes Redus Seances París, 10, 706–710, 1840a.
Schönbein, C. F.: Beobachtungen über den bei der Elektrolyse des Wassers und dem Ausströmen der gewöhnlichen Elektricität aus Spitzen sich entwickelnden Geruch, Ann. Phys. Chim. Poggendorfs Ann., 50, 258–278, 1840b.
Schönbein, C. F.: Über das Ozon, J. Prakt. Chim., 51, https://doi.org/10.1002/prac.18500510147, 1850.
Schultz, M. G., Schröder, S., Lyapina, O., Cooper, O. R., Galbally, I., Petropavlovskikh, I., Von Schneidemesser, E., Tanimoto, H., Elshorbany, Y., Naja, M., Seguel, R. J., Dauert, U., Eckhardt, P., Feigenspan, S., Fiebig, M., Hjellbrekke, A.-G., Hong, Y.-D., Kjeld, P. C., Koide, H., Lear, G., Tarasick, D., Ueno, M., Wallasch, M., Baumgardner, D., Chuang, M.-T., Gillett, R., Lee, M., Molloy, S., Moolla, R., Wang, T., Sharps, K., Adame, J. A., Ancellet, G., Apadula, F., Artaxo, P., Barlasina, M. E., Bogucka, M., Bonasoni, P., Chang, L., Colomb, A., Cuevas-Agulló, E., Cupeiro, M., Degorska, A., Ding, A., Fröhlich, M., Frolova, M., Gadhavi, H., Gheusi, F., Gilge, S., Gonzalez, M. Y., Gros, V., Hamad, S. H., Helmig, D., Henriques, D., Hermansen, O., Holla, R., Hueber, J., Im, U., Jaffe, D. A., Komala, N., Kubistin, D., Lam, K.-S., Laurila, T., Lee, H., Levy, I., Mazzoleni, C., Mazzoleni, L. R., McClure-Begley, A., Mohamad, M., Murovec, M., Navarro-Comas, M., Nicodim, F., Parrish, D., Read, K. A., Reid, N., Ries, L., Saxena, P., Schwab, J. J., Scorgie, Y., Senik, I., Simmonds, P., Sinha, V., Skorokhod, A. I., Spain, G., Spangl, W., Spoor, R., R. Springston, S., Steer, K., Steinbacher, M., Suharguniyawan, E., Torre, P., Trickl, T., Weili, L., Weller, R., Xiaobin, X., Xue, L., and Zhiqiang, M.: Tropospheric Ozone Assessment Report: Database and metrics data of global surface ozone observations, Elem. Sci. Anth., 5, 58, https://doi.org/10.1525/elementa.244, 2017.
Silvestre, J.: Historia dos estabelecimentos scientificos litterarios e artisticos de Portugal nos successsivos reinados da monarchia, 493 pp., 1881.
Tarasick, D., Galbally, I. E., Cooper, O. R., Schultz, M. G., Ancellet, G., Leblanc, T., Wallington, T. J., Ziemke, J., Liu, X., Steinbacher, M., Staehelin, J., Vigouroux, C., Hannigan, J. W., García, O., Foret, G., Zanis, P., Weatherhead, E., Petropavlovskikh, I., Worden, H., Osman, M., Liu, J., Chang, K.-L., Gaudel, A., Lin, M., Granados-Muñoz, M., Thompson, A. M., Oltmans, S. J., Cuesta, J., Dufour, G., Thouret, V., Hassler, B., Trickl, T., and Neu, J. L.: Tropospheric Ozone Assessment Report: Tropospheric ozone from 1877 to 2016, observed levels, trends and uncertainties, Elem. Sci. Anthr., 7, 39, https://doi.org/10.1525/elementa.376, 2019.
U.S. EPA: Integrated science assessment for ozone and related photochemical oxidants, U.S. Environmental Protection Agency, Research Triangle Park, NC, USA, https://assessments.epa.gov/risk/document/&deid=348522 (last access: 26 May 2025), 2020.
Vaquero, J. M., Bravo-Paredes, N., Obregón, M. A., Sánchez-Carrasco, V. M., Valente, M. A., Trigo, R. M., Domínguez-Castro, F., Montero-Martín, J., Vaquero-Martínez, J., Antón, M., García, J. A., and Gallego, M. C.: Early meteorological records from Extremadura region, SW Iberia (CliPastExtrem), PANGAEA, https://doi.org/10.1594/PANGAEA.928037, 2021.
Vaquero, J. M., Bravo-Paredes, N., Obregón, M. A., Carrasco, V. M. S., Valente, M. A., Trigo, R. M., Domínguez-Castro, F., Montero-Martín, J., Vaquero-Martínez, J., Antón, M., García, J. A., and Gallego, M. C.: Recovery of early meteorological records from Extremadura region (SW Iberia): The `CliPastExtrem' (v1.0) database, Geosci. Data J., 9, 207–220, https://doi.org/10.1002/gdj3.131, 2022.
Volz, A. and Kley, D.: Evaluation of the Montsouris series of ozone measurements made in the nineteenth century, Nature, 332, 240–242, https://doi.org/10.1038/332240a0, 1988.