the Creative Commons Attribution 4.0 License.
the Creative Commons Attribution 4.0 License.
 | 27 May 2025
One year of high-frequency monitoring of groundwater physico-chemical parameters in the Weierbach experimental catchment, Luxembourg
Karl Nicolaus van Zweel
Laurent Gourdol
Jean François Iffly
Loïc Léonard
François Barnich
Laurent Pfister
Erwin Zehe
Christophe Hissler
The critical zone (CZ) is the skin of the Earth, where rock, water, air, and life interact, playing a pivotal role in sustaining ecological processes and life-supporting resources. Understanding these interactions, especially in forested headwater catchments, is essential to manage water resources, predict environmental responses, and assess human impacts. Here, we present a novel dataset from the Weierbach experimental catchment in Luxembourg, derived from a year-long high-frequency monitoring campaign focused on groundwater physico-chemical parameters.
Through rigorous data collection and quality control, parameters such as electrical conductivity, dissolved oxygen, oxidation–reduction potential, and pH were measured, providing insights into the CZ's hydrological and biogeochemical dynamics. Although the 1-year dataset offers valuable observations, it represents an initial step toward understanding long-term patterns. The data highlight the interaction between redox reactions, pH, and seasonal hydrological variability, although these interpretations are limited by the temporal scope of the study.
By offering a detailed snapshot of the response of the catchment to hydrological variations, this dataset contributes to addressing key gaps in CZ research and serves as a foundation for advancing our understanding of hydro-biogeochemical processes at the catchment scale. Despite the limited observation period, the dataset provides insights that can be integrated with long-term monitoring efforts. Researchers and practitioners can use these data to refine models, inform land management decisions, and improve our understanding of the biogeochemistry of the catchment. Researchers and practitioners can use these data to refine models, inform land management decisions, and improve our understanding of the biogeochemistry of the catchment. The dataset is available at https://doi.org/10.5281/zenodo.10869166 (Hissler et al., 2024).
- Article
(4712 KB) - Full-text XML
- BibTeX
- EndNote


The critical zone (CZ) is the interface where rock, water, air, and living organisms interact, playing a vital role in supporting ecological processes and providing essential resources (Amundson et al., 2007; Anderson et al., 2012; Brantley et al., 2007). The dynamics within this “skin of the Earth” are fundamental for managing water resources, predicting environmental responses to disturbances, and assessing the impacts of human activities, especially against the backdrop of climate change. Within the CZ, the fields of hydrology and biogeochemistry interconnect deeply, offering insights into ecological sustainability and resource management (Wymore et al., 2022).
The subsurface properties, especially the variations in permeability with depth, exert a significant control on the vertical connectivity within the CZ, affecting the water flow and chemical interactions. For example, in systems where vertical permeability decreases sharply, most water travels through only the upper layers of the subsurface, limiting its interaction with deeper, reactive rock formations (Xiao et al., 2021). This results in a pronounced chemical contrast between shallow and deep waters, where shallow water, often younger and flowing rapidly through high-permeability soil layers, carries fewer geogenic solutes compared to older, deeper water that has interacted more extensively with bedrock (Welch and Allen, 2014; Jin et al., 2010; Brantley et al., 2013). These differences are highly relevant as they shape the solute export patterns observed at the catchment outlets, influencing the concentration vs. discharge (c–Q) relationships. Understanding these subsurface interactions is important because they not only determine stream chemistry but also provide insights into hydro-biogeochemical processes, which are essential to assess ecological sustainability and effectively manage water resources.
One of the most accessible methods for understanding the interactions occurring within the CZ is to observe the catchment outlets. Streams, acting as integrators of all processes within the CZ, reveal the cumulative effects of these interactions on the behaviour of the stream and the hydrochemical composition, thus serving as a window into the overall dynamics of the CZ (Brantley et al., 2017; Li et al., 2017; Riebe et al., 2017). This approach underpins the importance of analysing concentration vs. discharge (c–Q) patterns, which have been a focal point of research, providing information on the hydrological and biogeochemical functioning of the catchments (Brooks et al., 2015; Zhi et al., 2019; Stewart et al., 2022). This line of inquiry underscores the complex interplay of hydro-biogeochemical processes within the CZ, often masked by spatial heterogeneities. Despite advancements, field measurements and their interpretations remain challenging, with water physico-chemistry data reflecting convoluted signatures that obscure direct cause-and-effect relationships (Weiler and McDonnell, 2006). Recent consensus, emerging from diverse measurements and observations, points towards the determination of stream chemistry by the properties of source waters, predominantly from shallow subsurface and/or deeper regolith and fractured bedrock flow paths. The contrasting chemical properties of these source waters are pivotal in shaping the solute export patterns (Stewart et al., 2022).
Given the complexity of interactions within the CZ, direct data supporting the nuanced understanding of subsurface and stream physico-chemical interactions are rare. This research gap emphasises the need for detailed datasets that can capture the intricacies of CZ dynamics (Stewart et al., 2022).
Our study complements existing critical-zone research efforts across Europe and beyond. Various observatories, such as the TERENO Wüstebach catchment in Germany, have advanced our understanding of soil moisture dynamics, land–atmosphere exchange, and hydrological processes through dense sensor networks (Heistermann et al., 2021). Similarly, the SoilTrEC network of observatories across Switzerland, Austria, Greece, and the Czech Republic focuses on soil transformation, biogeochemical cycling, and the impacts of land use (Guo and Lin, 2016). The Calhoun Critical Zone Observatory (CZO) in the USA provides insights into deep soil biogeochemical processes, particularly carbon cycling and hydrological connectivity (Lee et al., 2023).
Our dataset from the Weierbach experimental catchment (WEC) provides high-resolution temporal data on groundwater physico-chemical parameters, with a particular focus on redox dynamics and pH fluctuations. Although many observatories investigate both surface and subsurface processes, high-frequency monitoring of subsurface redox dynamics zonation remains limited. Our study offers initial insights into vertical biogeochemical dynamics within the subsurface, contributing to a better understanding of redox zonation, subsurface hydrological pathways, and the interplay between hydrological variability and biogeochemical processes in temperate forested catchments.
To address this gap, we present a novel dataset from the WEC in Luxembourg. With extensive prior research and its status as a CZ observatory, the WEC provides a valuable opportunity to examine subsurface hydrological and biogeochemical processes shaping the CZ (Hissler et al., 2021).
This paper introduces our methodology for data collection, focussing on the importance of understanding subsurface architecture and the exploration of hydrological dynamics through the dataset. By presenting this dataset, we aim to contribute to a broader understanding of complex hydro-biogeochemical processes within the CZ at specific subsurface locations within a long-term experimental catchment. This effort not only improves our understanding of the dynamics of water resources but also highlights the importance of integrating hydrological and biogeochemical data for environmental monitoring and management.
The catchment is located in the northwestern region of Luxembourg (lat 49.8273, long 5.7956) and has an area of 45 ha. The WEC is a forested headwater catchment within the Alzette River basin (Pfister et al., 2017). The catchment is located in the Ardennes massif, which is distinguished by an elevated subhorizontal plateau and deep V-shaped valleys. It is subdivided into three landscape units (Fig. 1). The plateau area is about 31 ha and has slopes between 0 and 5°. The hillslope area is about 14 ha and has slopes between 5 and 44° (Martínez-Carreras et al., 2016). The riparian area represents about 0.4 ha. The catchment's stream network consists of three tributaries that converge into a single stream and is bordered by a highly dynamic riparian zone composed primarily of litter degradation material and colluvium from the hillslopes (Antonelli et al., 2020a, b). The riparian area in the catchment is narrow, flat, and well defined, with some areas where the riparian zone widens.
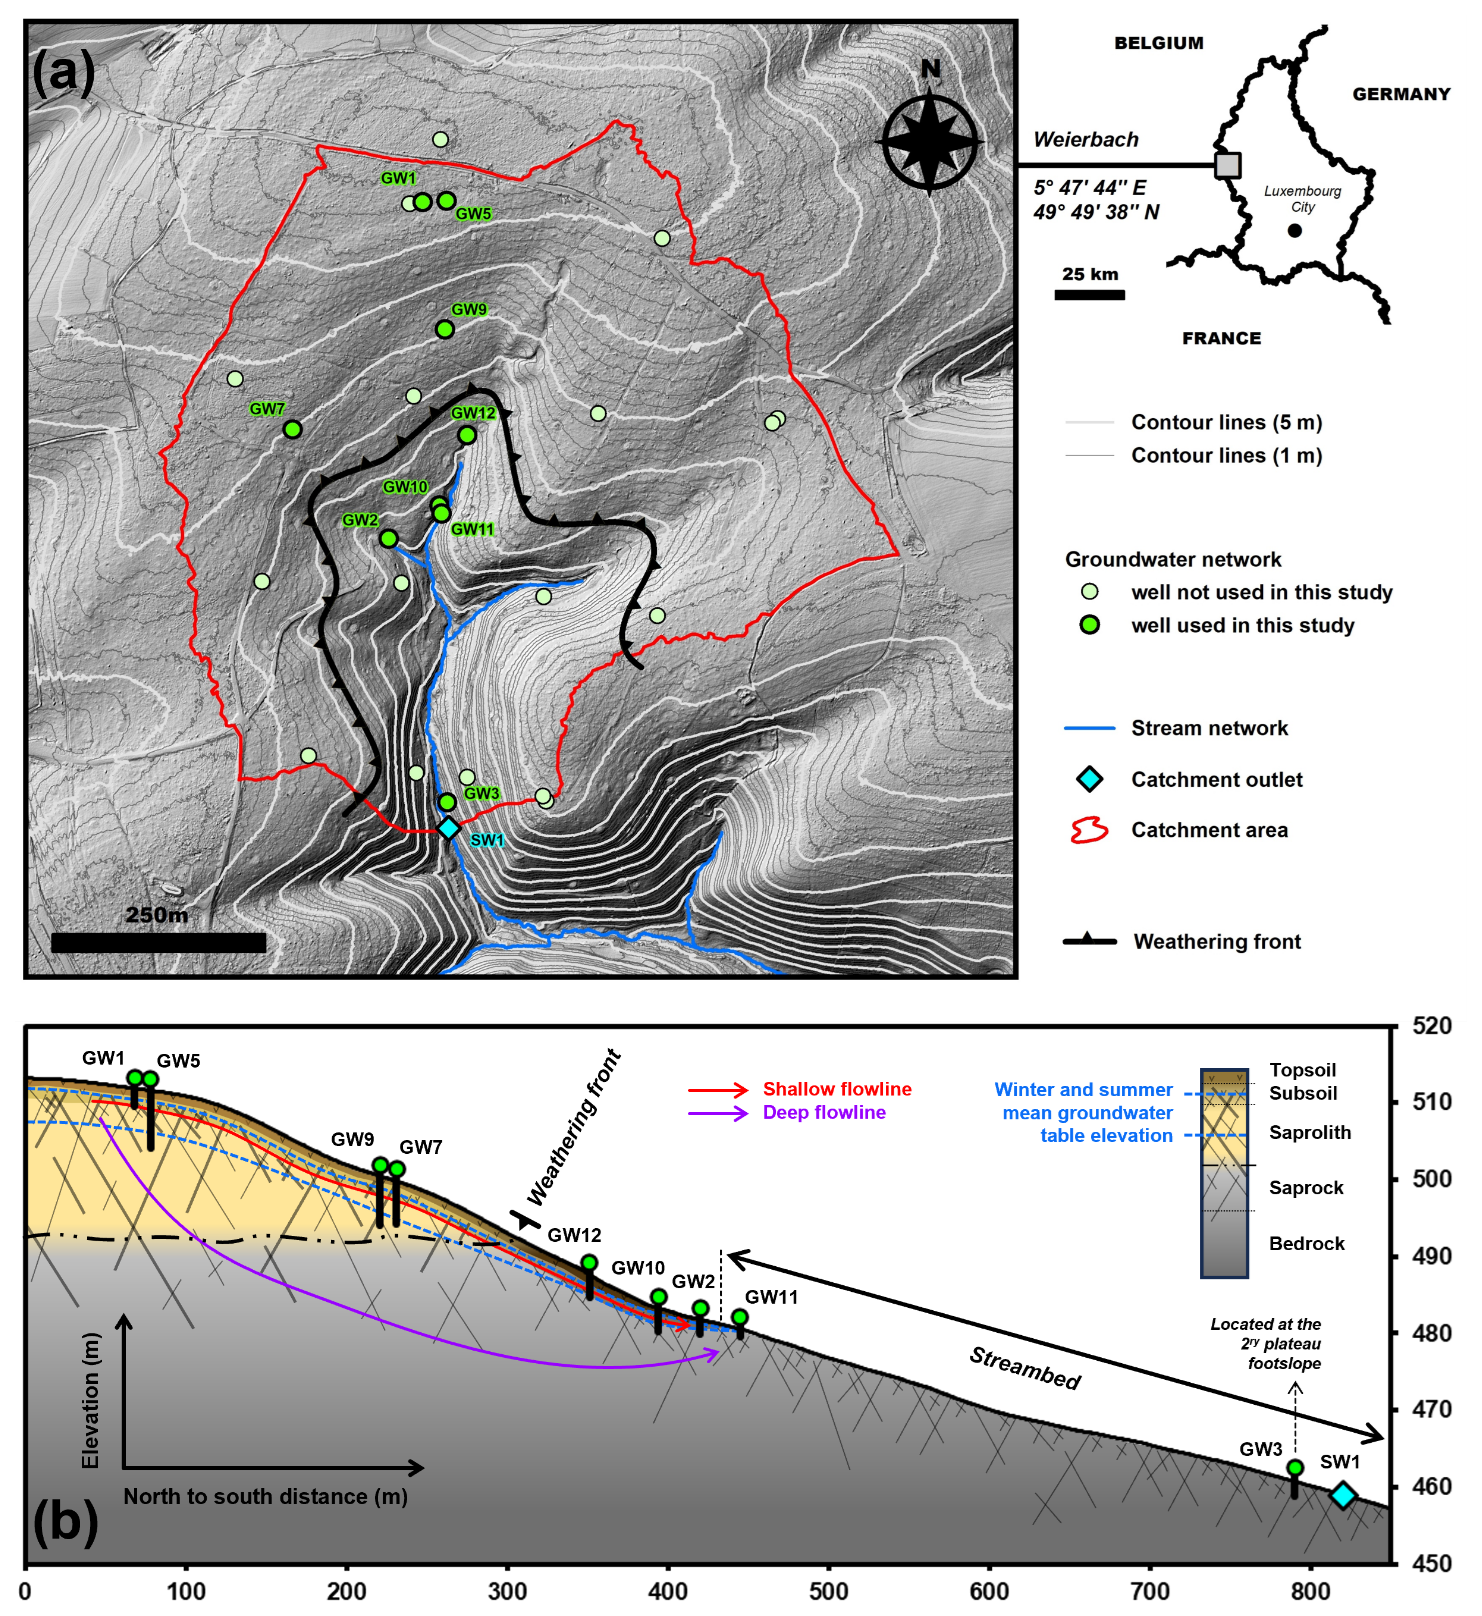
Figure 1Presentation of the Weierbach experimental catchment. (a) Topography with water-sampling locations, including contour lines representing 5 m elevation intervals (altitudinal values not labelled; catchment elevation ranges from 450 to 500 m) and (b) regolith structure. The black contour line in (a) marks the chemical weathering front basement, derived from electrical resistivity tomography (ERT) surveys and core drillings (Gourdol et al., 2021).
The forest structure of the Weierbach experimental catchment (WEC) is shaped by past and current management practices. Oak trees are evenly distributed, while beech tree density increases from the plateau to the foot slope. The primary plateau hosts a dense mixed forest composed of 78 % Fagus sylvatica and 22 % Quercus petraea and Q. robur (Fabiani et al., 2022). The understorey is dominated by Vaccinium myrtillus, while the riparian zone features various short plants (Martínez-Carreras et al., 2015). The secondary plateau is primarily composed of Picea abies and Pseudotsuga menziesii. A detailed analysis of forest structure, including tree density and ecohydrological interactions, can be found in Fabiani et al. (2022, 2024).
The WEC experiences a semi-marine climate with a uniform distribution of precipitation throughout the year, averaging 953 mm annually (2006–2014; Pfister et al., 2017). Streamflow varies with seasons, with lower base flow during July to September due to higher evapotranspiration losses (annual average potential evapotranspiration (PET) of 593 mm for the period 2006–2014, from Pfister et al., 2017, 2023). In dry conditions, intermittent streamflow occurs from upstream to downstream, characterised by sharp, short-lasting discharge peaks (Wrede et al., 2015). In wet conditions, double-peak behaviour is observed, with a rapid discharge peak shortly after rainfall, followed by a broad and long-lasting second peak that outweighs the first peak in volume (Martínez-Carreras et al., 2016; Scaini et al., 2018). Figure 2 displays the total daily precipitation in the WEC and the mean daily discharge in SW1 from late 2006 to 2022.
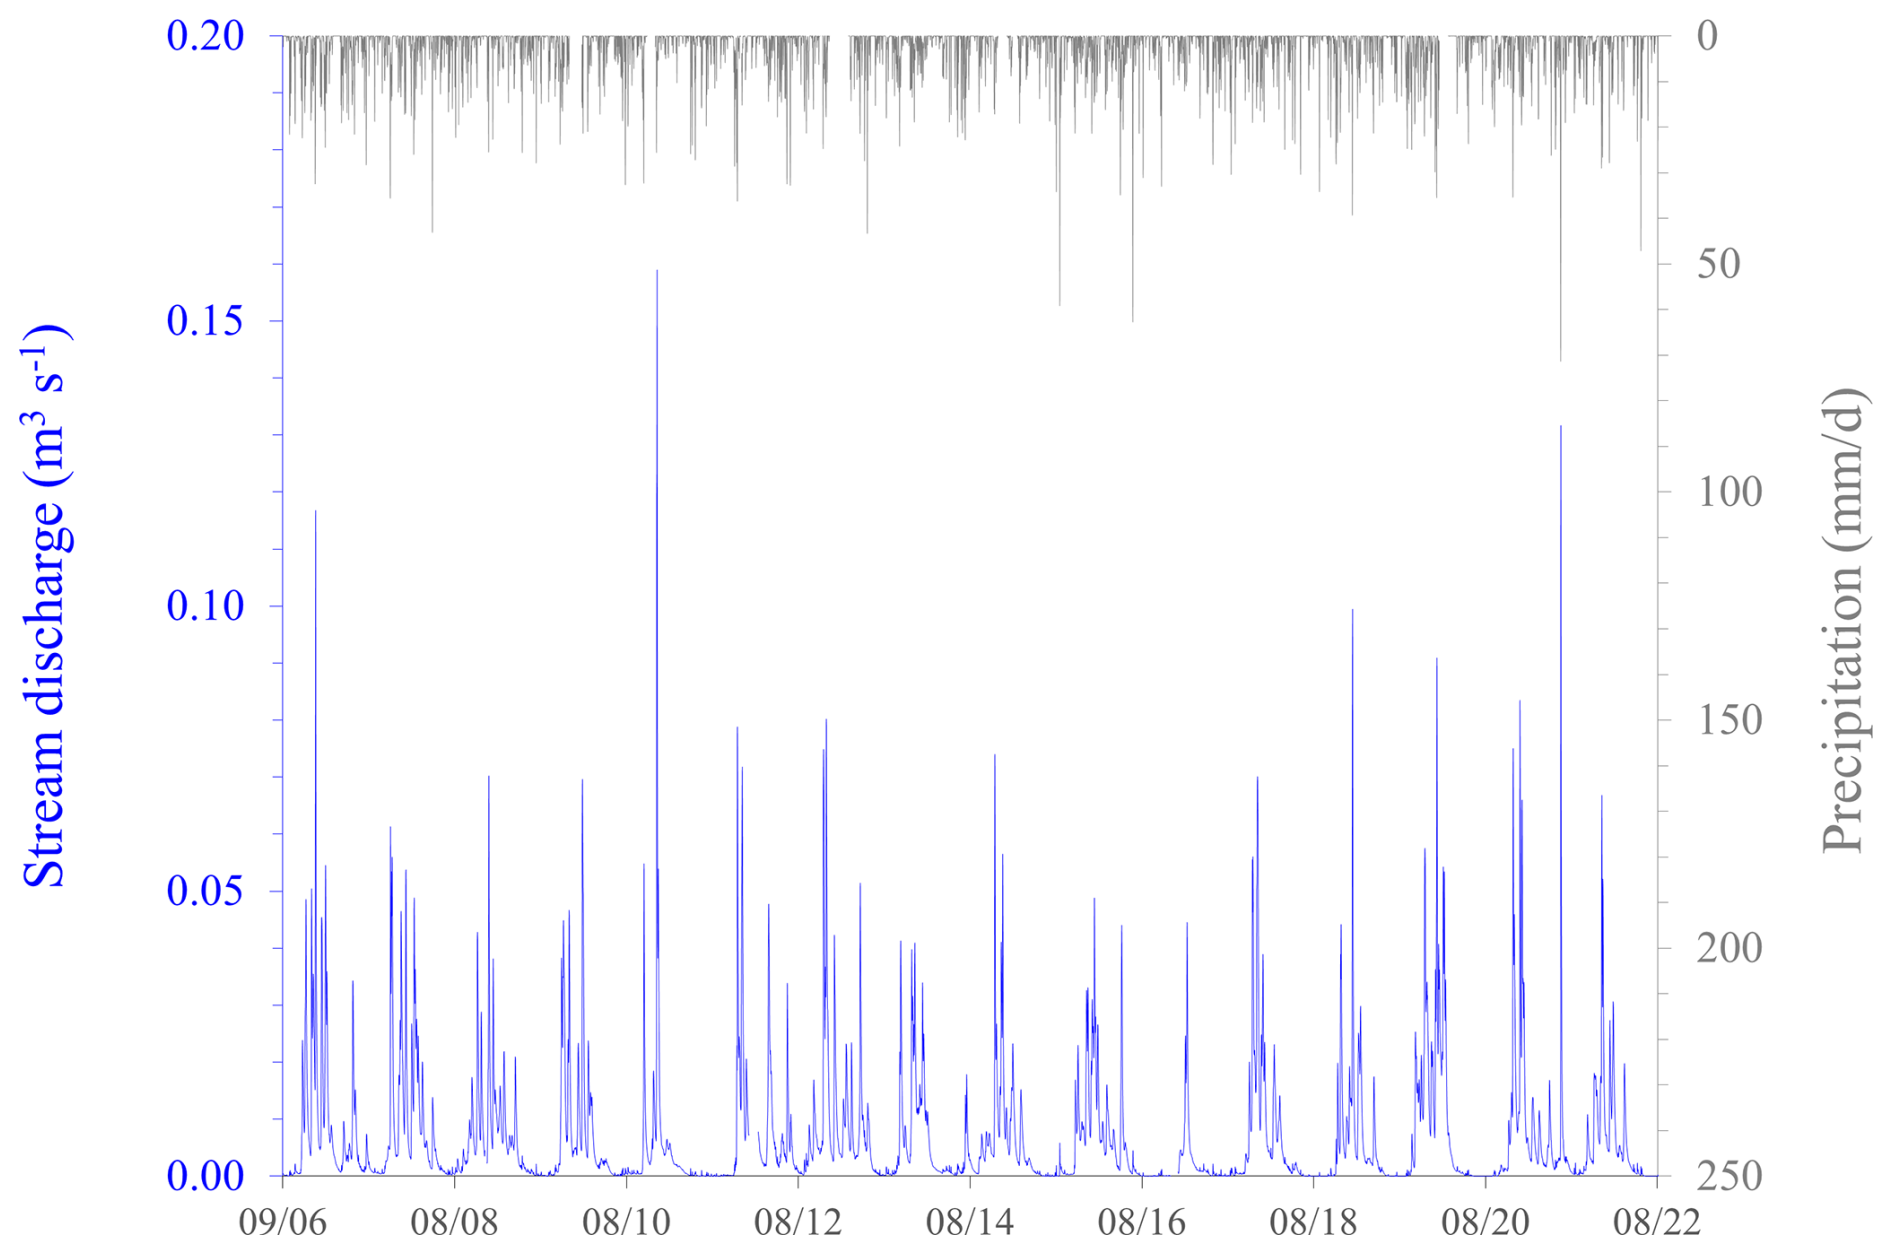
Figure 2Daily total precipitation in the Weierbach experimental catchment and the daily mean discharge at the catchment outlet from 2006 to 2022.
The WEC regolith is made up of two parts called the solum, where pedogenic processes dominate and the biota play an important role, and the subsolum, where the original rock structure or the fabric of the bedrock is preserved (Juilleret et al., 2016). The structure of these two parts evolved according to the topography. The WEC's solum between 0 and 70 cm consists of a stony silt loam soil derived from periglacial solifluction deposits overlain on a weathered Devonian slate substratum. From the surface, a thin, dark organic surface horizon (O to A horizon, 0–8 cm on average) is followed by a Cambic horizon (B horizon, 8–40 cm on average) with a well-developed angular blocky soil structure. The texture of the silt loam is inherited from the loess deposit and was mixed with slate clasts via solifluction, with the quantity of clasts increasing with depth. The subsolum is composed of slates, phyllites, and quartz of Devonian age (Moragues-Quiroga et al., 2017). During the last 10 years, extensive drilling and geophysics (Gourdol et al., 2021) campaigns have been conducted. The deep subsurface exploration of the WEC yielded more detail than is currently known. The upper part of the catchment can be subdivided between a primary plateau where the solum developed over a deep yellow-white slate saprolite and a secondary plateau where the solum directly developed over the black fractured-slate bedrock. These distinct landscape units are separated by the black line in Fig. 1, which represents the weathering front. The spatial occurrence of these two distinct regolith structures was observed using combined core-drilling descriptions and electrical resistivity surveys (Gourdol et al., 2021). In the hillslope and riparian areas, the subsolum is composed of fractured and/or fresh bedrock below the solum. A mineralogical and geochemical characterisation of the WEC's regolith was conducted to gain a deeper understanding of the primary plateau regolith characteristics and evolution. This study allowed for the observation of three distinct compartments that have different geochemical and mineralogical characteristics as a function of contrasting evolutions. These respective processes are related to different atmospheric deposition events, weathering ages, and seasonal water saturation dynamics (Moragues-Quiroga et al., 2017).
2.1 Data description
2.1.1 Fifteen years of groundwater monitoring
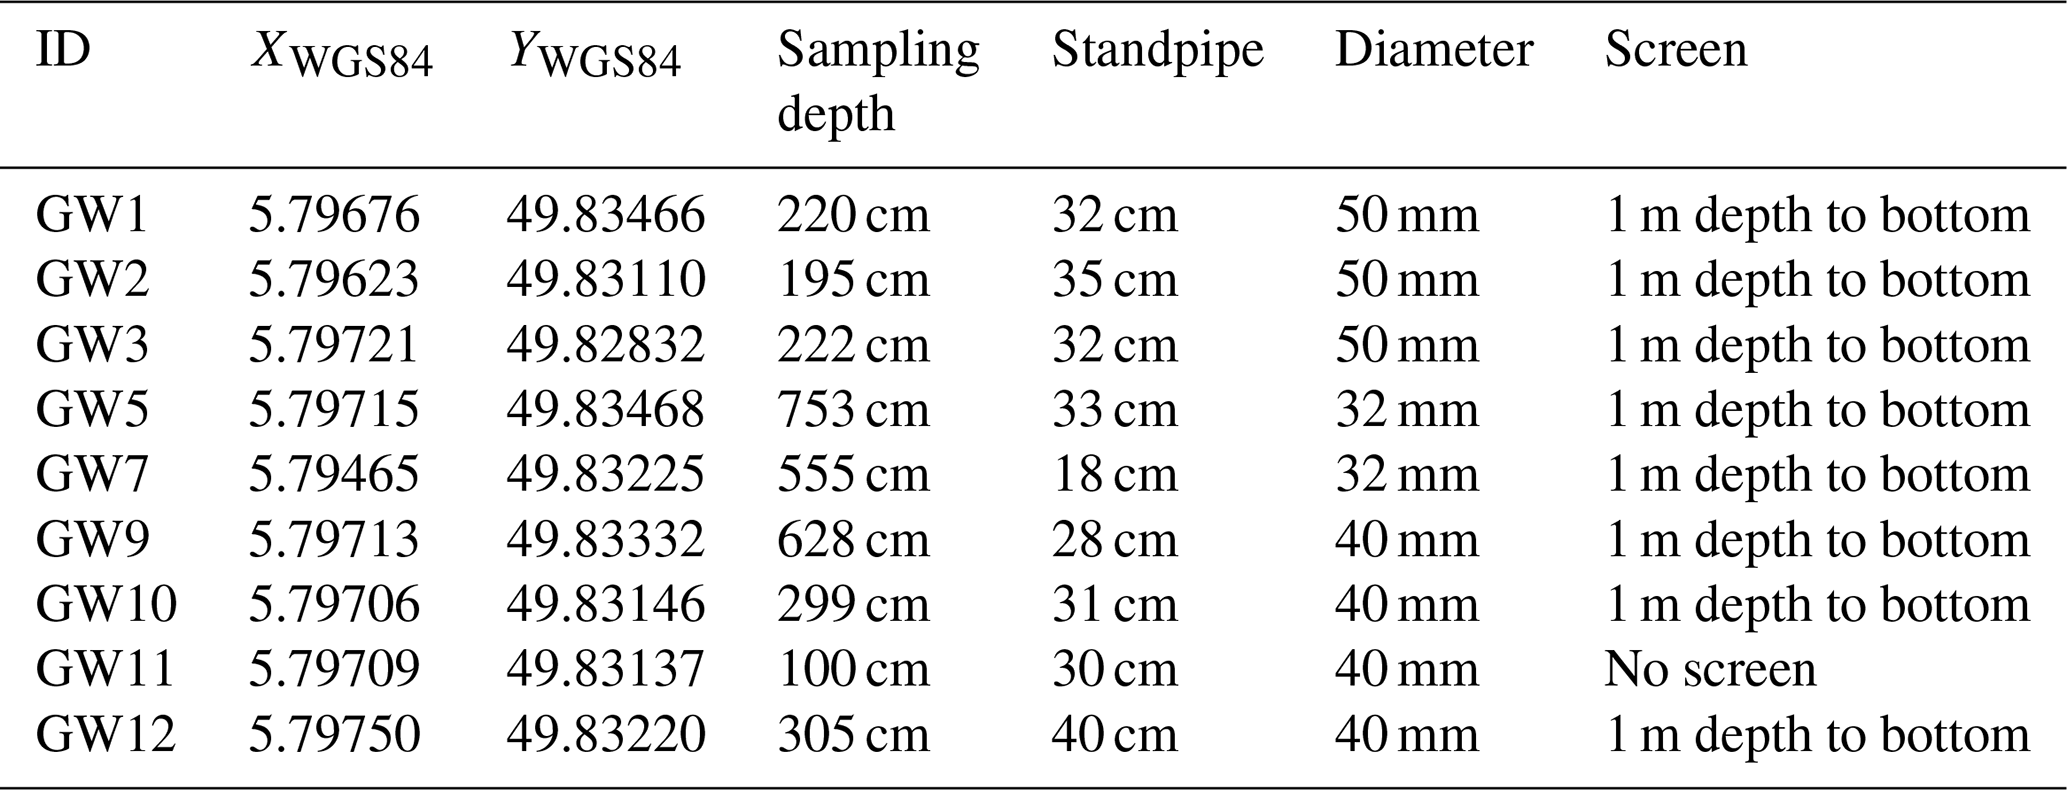
The WEC has been thoroughly equipped to continuously monitor water fluxes and physico-chemical parameters within various CZ compartments. In addition, these compartments are sampled every 2 weeks at different locations to analyse the δ18O and δ2H isotopic composition of water, as well as its chemical composition, including rainfall, throughfall, groundwater, and stream water. Some of these datasets have already been published (Hissler et al., 2021). The WEC monitoring infrastructure is continuously expanded and now encompasses an extensive network of 26 monitoring boreholes with varying depths, ranging from 1.95 m to as deep as 40 m below the surface. All the boreholes are spatially distributed throughout the catchment (Fig. 1) and have screens that cover the range of 1 km below the surface to the bottom. For this study, nine boreholes were selected along one hillslope catena, representing one unique vegetation type but several hydrogeological positions. The chosen boreholes include locations on the primary plateau (GW1 and GW5), in the middle of the hillslope (GW7 and GW9), and at low hillslope positions (GW2, GW10–12, and GW3). Groundwater levels in these boreholes are automatically recorded every 15 min using OTT Orphimedes and CTD (conductivity, temperature, and depth) (OTT, Aix-en-Provence, France). The relevant data are shown in Table 1. The depth reference for the water sampling is the top of the pipe, while it is the surface of the soil for the screen of the pipe. The standpipe represents the difference between the top of the pipe and the surface of the soil.
Table 1Characteristics of the boreholes selected for the monitoring of the groundwater physico-chemical parameters during this study.
2.1.2 One year of physico-chemical parameters monitoring
A weekly frequency monitoring campaign was designed with the objective of achieving a higher resolution representation of the potential key processes expected to occur in the subsurface of the catchment. The duration of the campaign spanned from 2 March 2021 to 14 March 2022, during which sampling was conducted at weekly intervals. The parameters measured during each sampling event included electrical conductivity (EC); dissolved oxygen (DO); oxidation–reduction potential (ORP), corrected for probe bias to Eh, measuring the redox potential of water using a platinum electrode and commonly expressed relative to the standard hydrogen electrode (SHE) for comparison; and pH, all of which were analysed using a flow cell system (Fig. 3). The four parameters were recorded using two WTW® Multi 3630 IDS data loggers connected to the specific probes: the WTW® TetraCon® 925 probe for EC, the WTW® FDO® 925 probe for DO, the WTW® SenTix® ORP-T 900 probe for ORP, and the WTW® SenTix® 940 probe for pH. The pH probe was calibrated in the field at each sampling event using Hach Singlet™ Solution Packs for a two-point calibration process (pH1=4.01 and pH2=7.00). In addition to the four parameters, the study also recorded pumping time, water level before and after pumping, and the quantity of water extracted from the well.
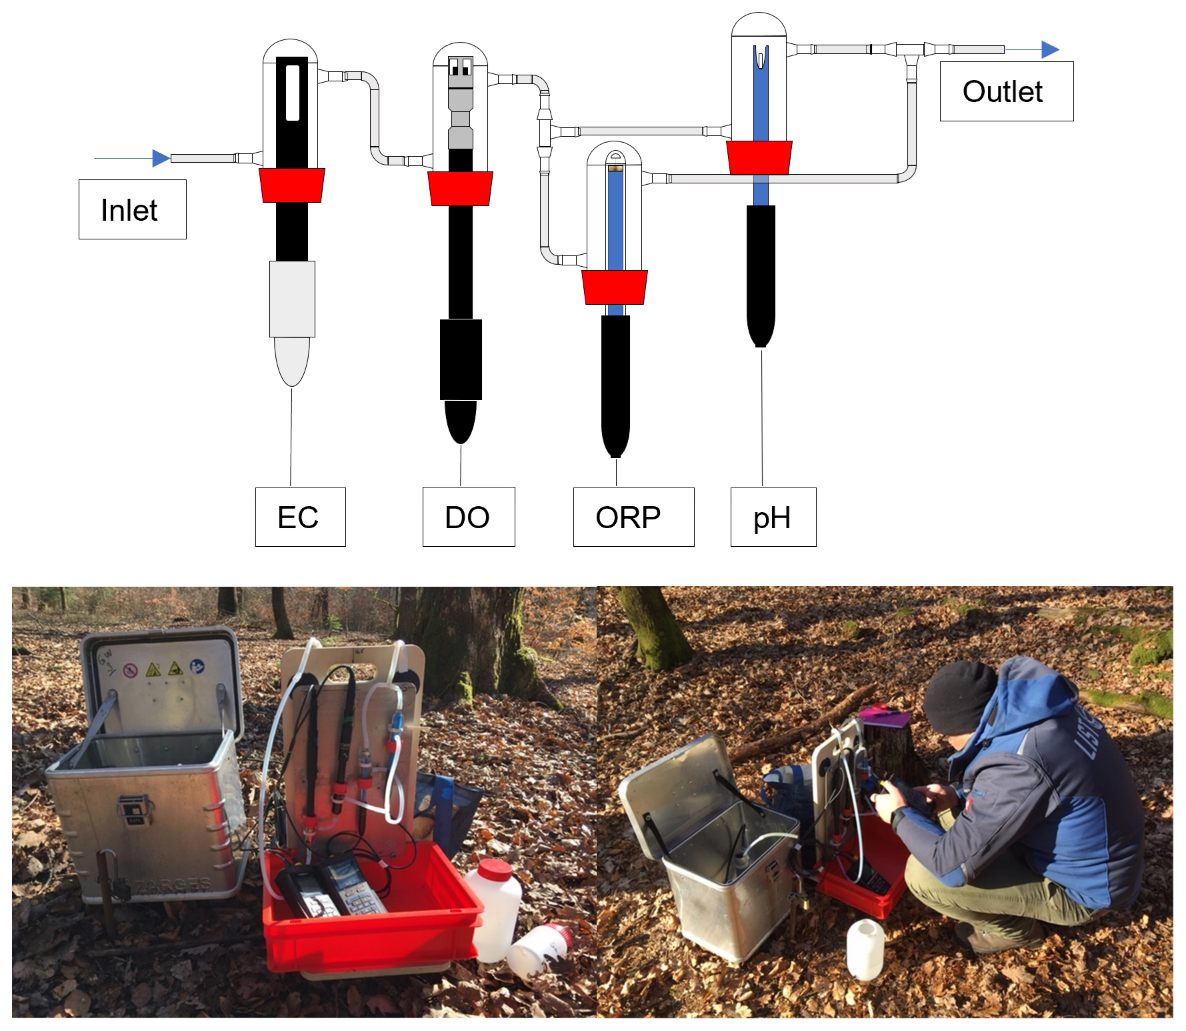
Figure 3The schematic at the top illustrates the flow-through cell used to measure in situ electrical conductivity (EC), dissolved oxygen (DO), oxidation–reduction potential (ORP), and pH. The ORP and pH probes were placed in parallel to avoid interference. Two WTW® Multi 3630 IDS data loggers were used to automatically record the probe data. The two photos in the bottom left and bottom right show the setup used in the Weierbach experimental catchment and its field application.
Before measuring the parameters and sampling a well, the system was flushed with 1 L demineralised Milli-Q water to remove potential contaminants. The probes were then allowed a 5 min period to record the EC reading, which ranged from 0.1 to 1.7 µS cm−1. Subsequently, the borehole was pumped, and the four parameters were continuously recorded at increments of 1 min. A groundwater sample was collected when the EC reading remained stable for several minutes, under the assumption that the borehole demonstrated homogeneity. Measurements were conducted in-line to minimise atmospheric contact and temperature changes. After collecting the water sample, a 20 min equilibration period was implemented, in which the flow-through system was sealed and the probes were allowed to equilibrate with the solution in the cells. The final readings for EC, DO, ORP, and pH were then obtained. The physico-chemical database consists of three subsets:
-
The first subset includes a high-frequency continuous pumping test in GW5 (Fig. 1 and Table 1). These tests were carried out twice, once during the winter and again during the summer, covering both wet and dry seasons. During these tests, the four physical parameters (EC, DO, ORP, and pH) were measured at 10 s intervals, while water samples were taken every minute to measure hydrochemistry.
-
The second subset comprises time series data that represent the four parameters obtained from weekly sampling events. In this dataset, each sample site is evaluated weekly for four physico-chemical parameters: pH, EC, ORP, and DO. The alignment of the time series data for all physico-chemical parameters was based on the EC values. Consequently, the peaks in the EC for each time trend, corresponding to their respective sample sites, may not always align due to variations in the time required for the probes to reach equilibrium after flushing the flow-through cell setup with the demineralised Milli-Q water. To standardise the data across various sampling sites, a centring process was used. This process involved identifying the highest EC value within each time series. Upon finding this maximal EC value, the timescale of the dataset was subsequently adjusted. Specifically, the time series was reconfigured such that the instance corresponding to this peak EC value now serves as the reference starting point for each series. This adjustment ensures consistency in the time frame for all measurements, thus facilitating more precise comparisons and analyses of data trends.
-
The third subset comprises weekly physical parameters, which were measured after a 20 min EC equilibration time. It also contains related chemical analysis data from the water samples collected during these weekly events, along with additional metadata recorded during the sampling process. These metadata include information such as the water level of the well before pumping, the water level of the well after pumping, the drawdown, and the volume of water removed during each pumping event. Furthermore, this subset includes the daily mean water level obtained from the level logger data.
2.1.3 Water sample preparation and analysis
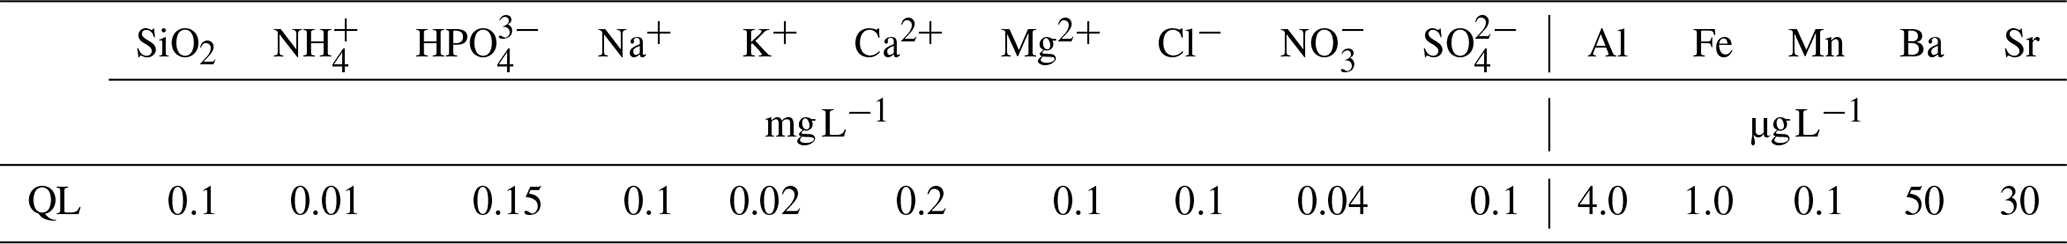
All water samples were stored at 4 °C before being prepared for the different chemical analyses. They were filtered in the laboratory during the day after collection. A vacuum system and 0.45 µm cellulose acetate membrane filters, manufactured by Sartorius (type 111, 47 mm in diameter), were used. During preprocessing of the samples, the EC was also measured in the laboratory using a TetraCon® 925 probe. From the filtered water samples, the pH and alkalinity were measured using METTLER TOLEDO equipment with 0.01NHCl up to pH 4.5; the dissolved silica (SiO2), the ammonium (), and the orthophosphate () concentrations and the absorbance at 254 nm (Abs254) were measured using spectrophotometry with a Skalar© continuous flow analyser, SAN++; the major cation (Na+, K+, Ca2+, Mg2+) and anion (Cl−, , ) concentrations were analysed using ionic chromatography (Dionex ICS-5000 dual channel). From the filtered and acidified (1 % HNO3) water samples, the total contents of major metals (Al, Fe, Mn, Ba, Sr) were analysed with a Quadrupole ICP-MS (Agilent 7900) associated with an ISIS 3 (Agilent) injection system. The analyses were conducted in He mode, and 103Rh and 185Re were used as internal standards. The calibration standards were prepared with multi-element ICP standard solutions (Chem-Lab Analytical) diluted in 1 % HNO3. The analytical blank values were less than 1 % of the lowest sample concentrations for all elements. For all analyses, the quantification limits are given in Table 2.
Table 2Quantification limit (QL) of the chemical parameters considered in this study.
2.1.4 Data quality
This study implements a comprehensive data quality control approach throughout its year-long physico-chemical monitoring campaign, ensuring the reliability and accuracy of the collected data. Parameters such as EC, DO, ORP, and pH were precisely measured using standardised instrumentation, adhering to established protocols for environmental monitoring. Regular calibration of our equipment was performed before each data collection to ensure the accuracy of the measurements. This involved both factory standards and field adjustments to account for environmental variables specific to the WEC. Meticulous sampling procedures were followed, complemented by established analytical techniques, to maintain methodological integrity. The structured organisation of the dataset, complete with detailed metadata, enhances its transparency and usability for further research. Recognising potential data variability challenges, such as probe equilibration times, which could be influenced by seasonal changes, we implemented procedures to ensure consistency across all measurements. We invite data users to engage with us for the validation of specific data subsets and to discuss any discrepancies, a step critical for maintaining the dataset's quality and integrity. These protocols collectively underscore the robustness of the dataset, advocating for its proper citation and use in line with the highest standards of scientific inquiry.
2.1.5 Data usage and applications
Understanding c–Q patterns in forested headwater catchments requires insight into the biogeochemical processes occurring in shallow subsurface horizons, such as redox reactions and ion exchange. The variability in c–Q relationships across catchments can often be linked to shifts in the dominance of different end-member source waters, shaped by subsurface biogeochemical heterogeneity (Zhi et al., 2019; Stewart et al., 2022).
Our dataset provides an opportunity to explore the contributions of shallow and deep flow paths during borehole pumping. We propose that purging a borehole until the extracted water stabilises reflects the natural mixing processes that occur when groundwater discharges into streams. By conducting pumping tests under varying hydrological conditions and at multiple locations, we aim to investigate whether this approach can provide insights into the depth and spatial distribution of redox zones, which we hypothesise to be influenced by vertical permeability.
Since the succession of electron acceptors drives the stratification of the redox zone (McMahon and Chapelle, 2008), the redox potential of extracted water (Eh) may offer clues about the relative contributions of different flow paths. Although our dataset does not provide a direct map of redox zones, it offers high-resolution observations that may help assess their role in shaping groundwater chemistry and, by extension, stream composition.
The following section outlines how this dataset can potentially address key gaps in understanding redox processes, their influence on c–Q relationships, and the broader implications for hydro-biogeochemical research.
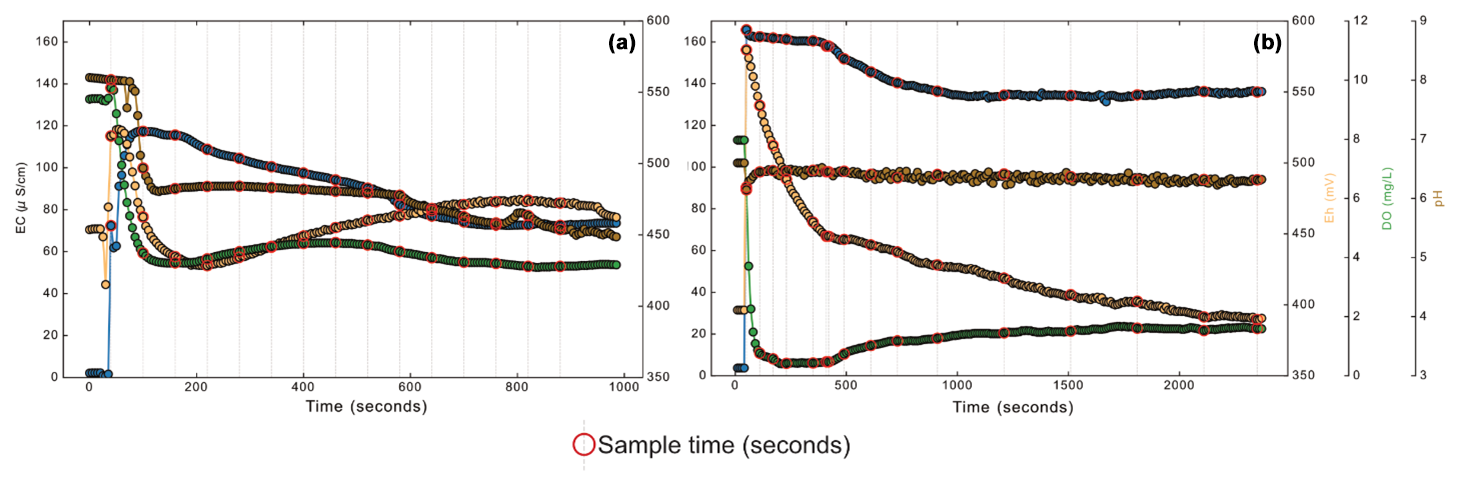
Figure 4High-frequency time series of the physico-chemical parameters recorded at GW5 on 24 March 2021 (a) and 2 August 2022 (b).
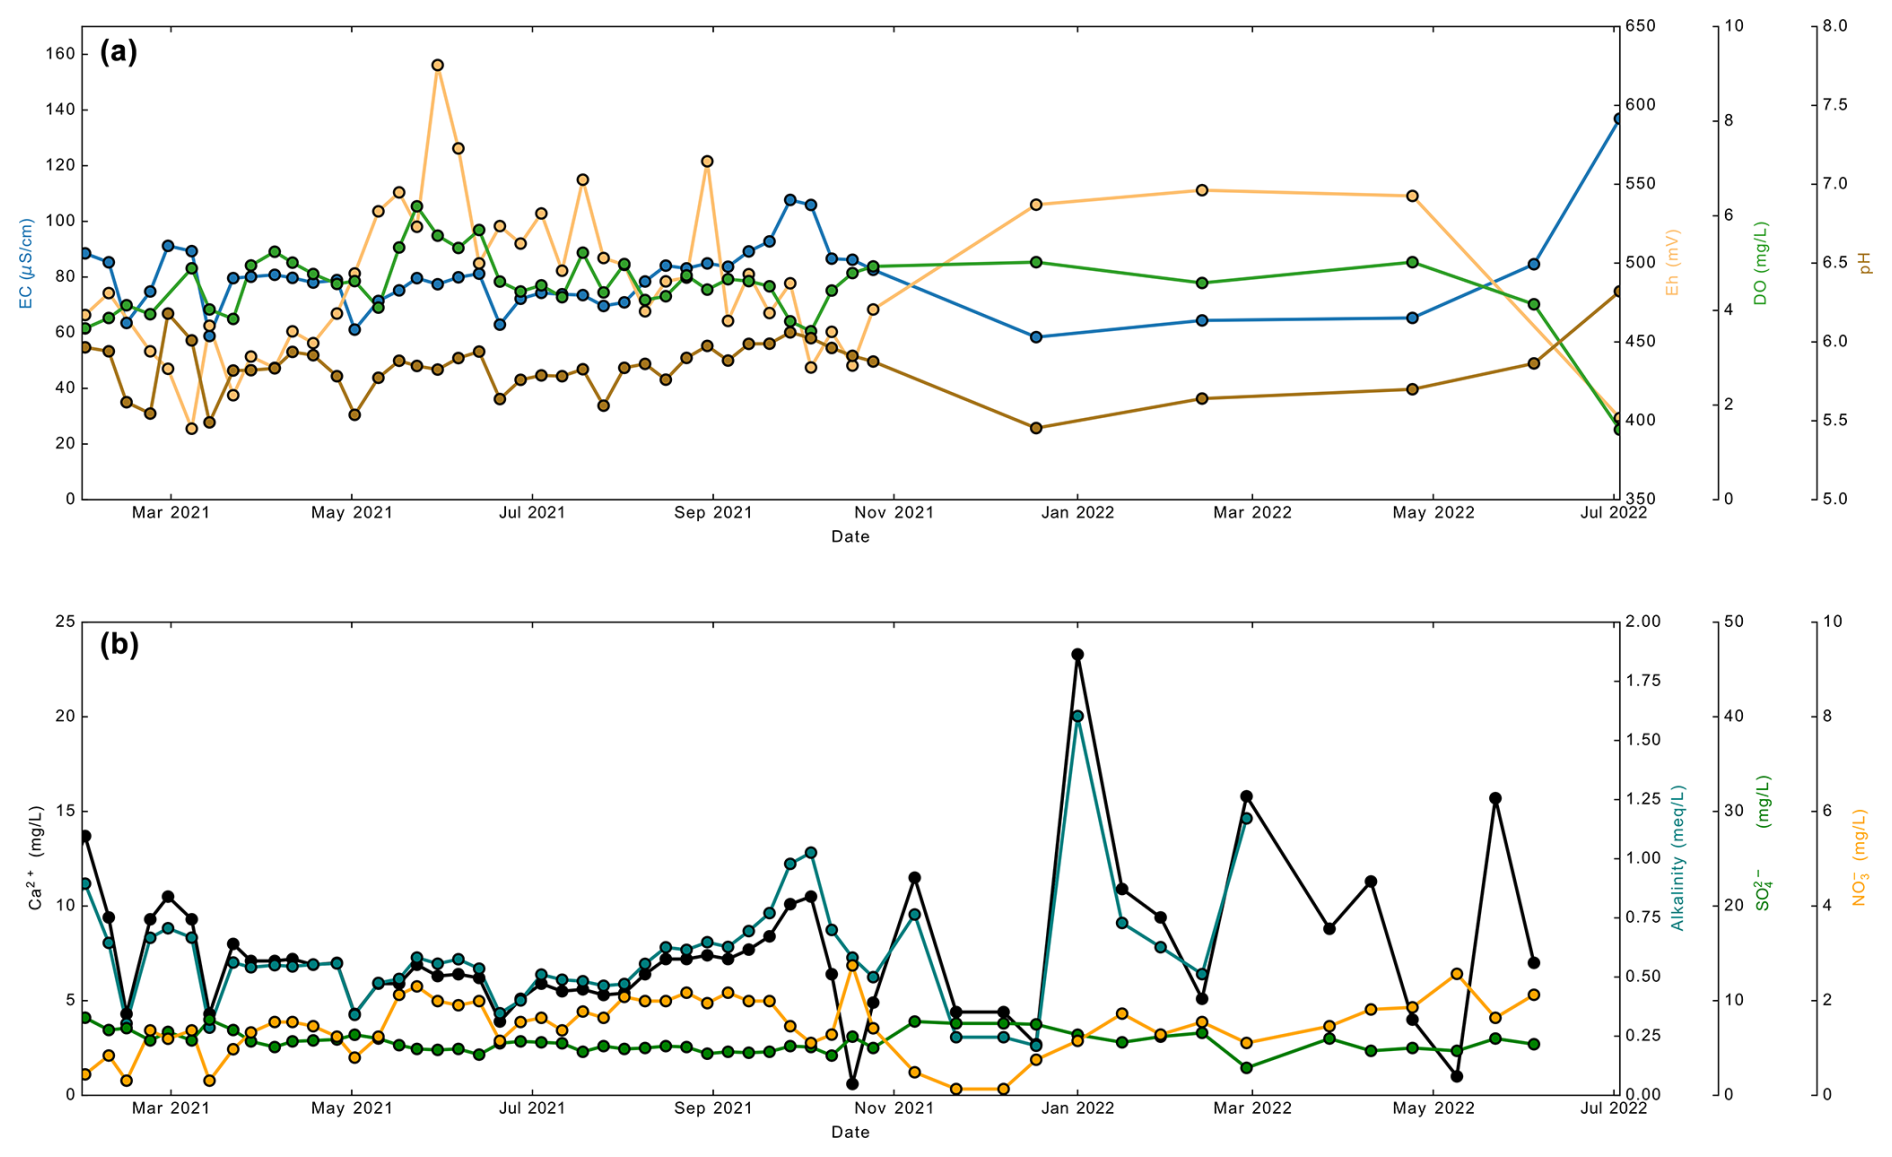
Figure 5Time series of the physico-chemical parameters (a) and the related solute concentrations (b) at GW5, collected during the weekly sampling campaigns from March 2021 to June 2022.
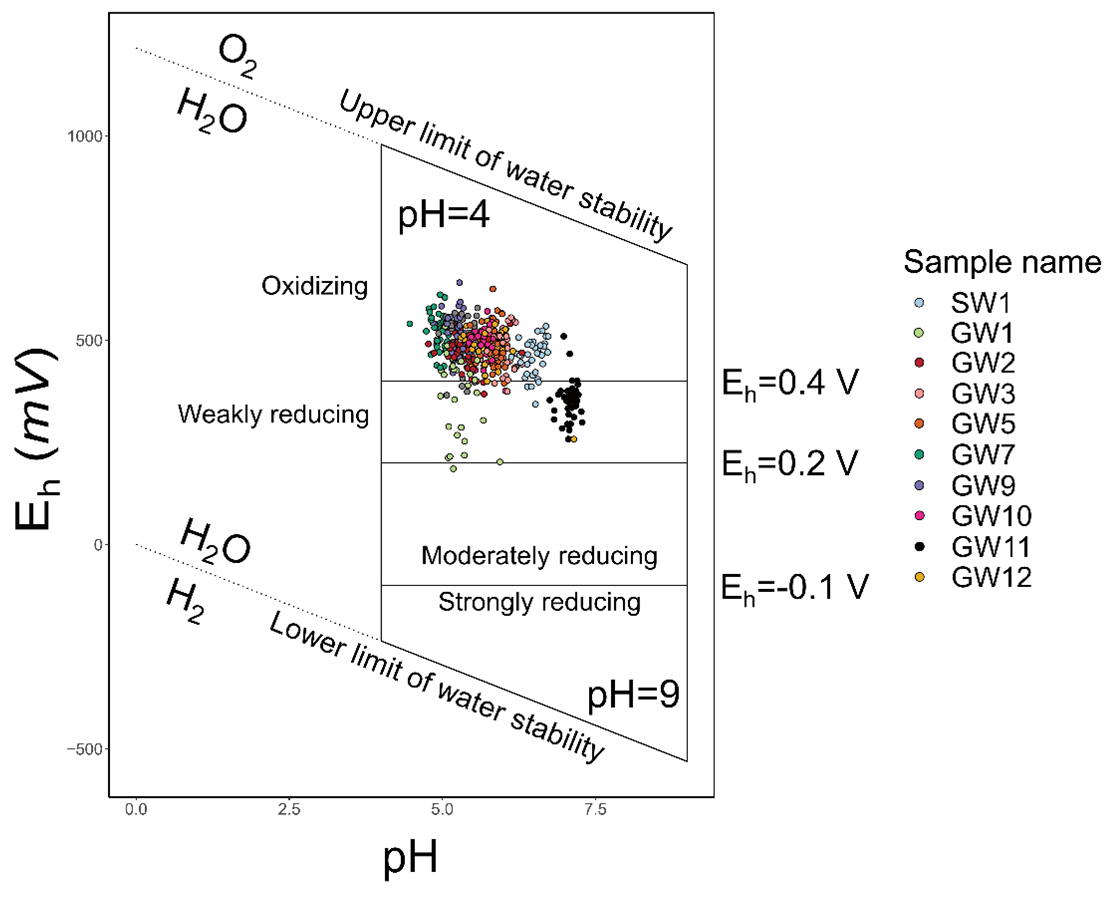
Figure 6Eh–pH diagram depicting weekly in situ field observations collected over the course of a year. The zones depicted on the graph are adapted from Zhang and Furman (2021). The upper and lower bounds represent the Eh and pH stability ranges for water in natural environments. Adapted from Zhang and Furman (2021).
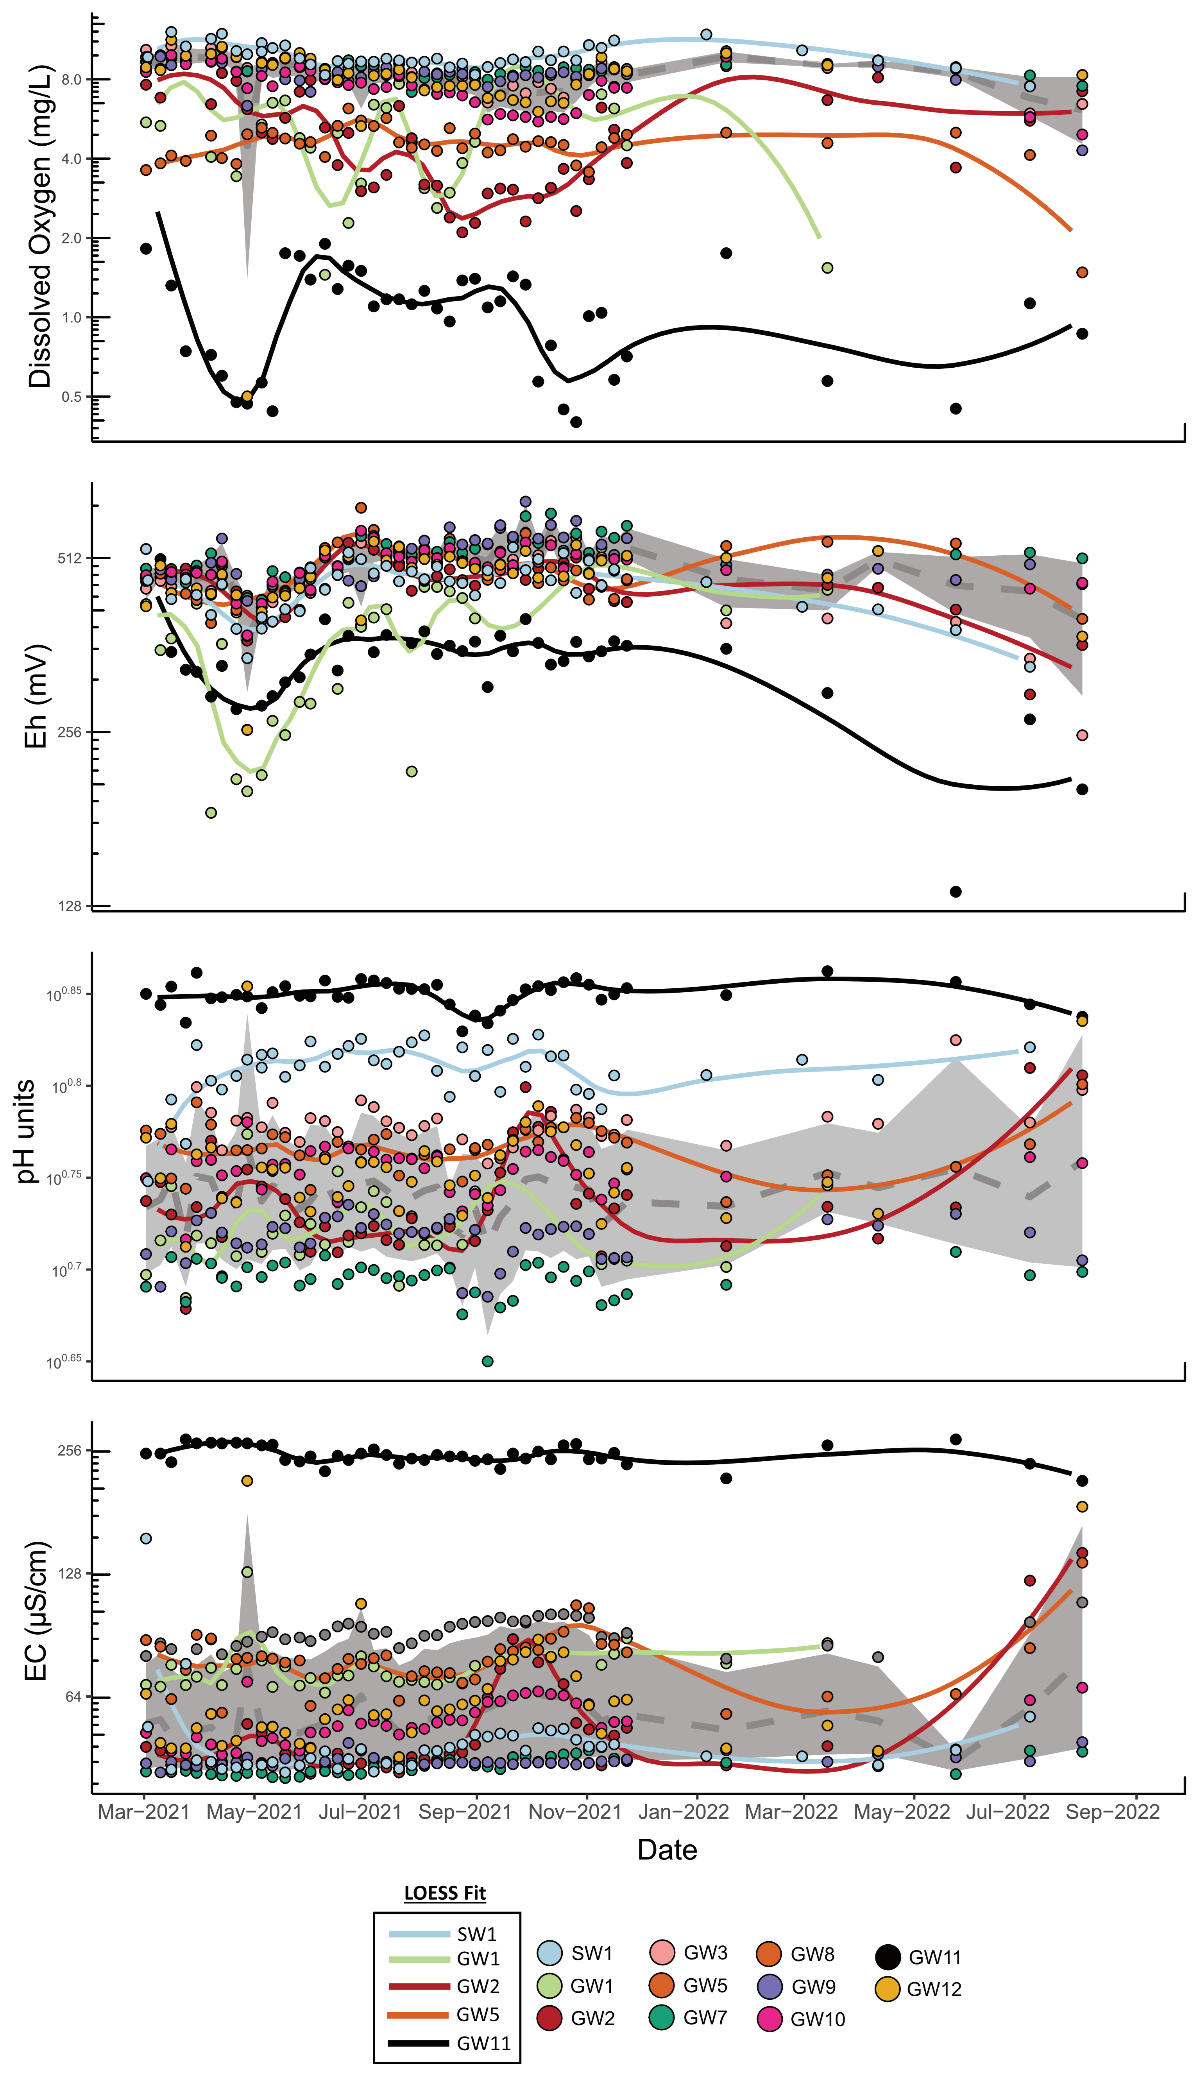
Figure 7Time series of dissolved oxygen (DO), Eh, pH, and electrical conductivity (EC) from March 2021 to August 2022 for boreholes in the Weierbach experimental catchment. The dashed grey line and shaded area denote the median and 5 %–95 % bounds for the “shallow-flowline” group, including GW3, GW7, GW9, GW10, and GW12. Loess fits for SW1, GW1, GW2, GW5, and GW11 illustrate the variation in parameter trends across different locations within the catchment, highlighting differences between shallow and deep flowlines. GW11, located in the streambed, represents the deep flowline and the catchment's deepest point.
-
High-resolution monitoring. Although previous studies have explored c–Q relationships and the influence of various water sources on stream chemistry, this dataset provides high-resolution monitoring with a focus on capturing redox zone dynamics over space and time. By measuring four key parameters at weekly intervals, it offers a detailed perspective on these processes, complementing existing datasets that often emphasise other biogeochemical aspects. While not entirely novel in its approach, the dataset adds valuable insight into the spatiotemporal variability of redox conditions in forested catchments. The temporal behaviour observed in GW5 on different timescales is shown to illustrate the dynamic interplay between shallow and deep flowlines and how this influences the solute behaviour observed in groundwater (Figs. 4 and 5). This borehole was investigated in more detail and at a higher frequency during two sequential sampling experiments conducted during high-flow and low-flow periods. It can be observed from these two graphs that the mixing ratio between the two flowlines (shallow and deep) changes as a function of the season in the catchment. The relationship between parameters that drive biogeochemical processes (EC, DO, ORP, Eh, and pH – top of Fig. 5) and solute concentration (Ca2+, alkalinity, , and – bottom of Fig. 5) can also be inferred and is useful for new hydrological and biogeochemical modelling approaches.
-
Quantifying redox reactions. The dataset contributes to addressing gaps in understanding redox reactions in shallow forested catchments, as noted by Arora et al. (2022), where “hotspots” and “hot moments” introduce significant variability. While the dataset provides empirical observations to inform future modelling efforts, it represents a step toward capturing this complexity rather than a definitive resolution of existing knowledge gaps. As an example, understanding how dissolved organic carbon (DOC), precipitation, and subsequent redox reactions affect the catchment's chemical composition represents a substantial advancement (Lazareva et al., 2022). In natural shallow systems, water can only be oxidised or reduced under extremely oxidising or reducing conditions, and the actual lower and upper Eh boundaries are governed by CO2 reduction to CH4 and the presence of O2, respectively. Using Eh values, one can determine the dominant redox couple in a system. Because multiple electron donors can drive multiple redox reactions at the same time, systems rarely have strict redox boundaries in practice. The redox state of the soil and the unsaturated zone can vary greatly (Mansfeldt, 2003). It can be oxidising, weakly reducing, moderately reducing, or strongly reducing (≥400, 200–400, 100–200, and −100 mV, respectively). Figure 6 shows the in situ pH vs. Eh measurements taken throughout the 1-year weekly campaign in the different boreholes. The defined zones, based on the redox zoning in soils (Zhang and Furman, 2021), indicate how the redox state of the soil and the unsaturated zone can vary greatly. Only boreholes GW1 and GW11 are seen to exhibit weakly reducing behaviour, with GW1 exhibiting a preference for moderately reducing conditions during the summer period. This behaviour can be understood considering the fact that GW11 represents the deepest currently observable flowline in the system (Fig. 1-b), while GW1 corresponds to shallow groundwater on the plateau. GW1 represents vertically infiltrating water, influenced by redox processes associated with shallow and biologically active zones in the system.
-
Influence on pH and ion exchange. The dataset provides high-resolution observations that can help identify the patterns of redox zone development and their potential influence on pH dynamics in shallow groundwater, as highlighted by Lazareva et al. (2022). While it does not fully resolve these interactions, its spatial and temporal coverage could provide context for understanding how changes in water composition, such as acidification or vegetation shifts, impact groundwater chemistry through ion exchange processes. When the composition of the water changes due to acidification or a change in vegetation influence, the cation exchanger readjusts its composition to the new groundwater concentrations. As a result, the exchanger serves as a temporary buffer that can completely change the concentrations in water via a process known as ion chromatography (Appelo and Postma, 2004). The main sources of acidity in the most near-surface environments are CO2 from the atmosphere and organic acids formed by decaying DOC, resulting in an acid pH range of 5–6. Acid sulfate soils have lower pH values, with values as low as 4 occasionally being recorded (DeLaune and Reddy, 2005). The lower bound for pH in natural shallow environments can then be assumed to be this low pH value.
-
Seasonal variability and flowline dynamics. The dataset contributes to ongoing efforts to understand seasonal variability and flowline interactions within catchments, adding to the work of previous studies that have monitored these dynamics. While high-spatiotemporal-resolution datasets exist, this dataset provides complementary observations that may help identify shifts in flowline dominance under varying hydrological conditions. Its focus on capturing redox zone development across different spatial and temporal scales offers an additional perspective on groundwater flow and chemistry in forested catchments. In Fig. 7, boreholes GW3, GW7, GW9, GW10, and GW12 are grouped together as representing shallow flowlines. The shaded area in the graphs reflects the median trend of field parameters (indicated by the dashed grey line), along with the 95 % confidence interval derived from these five boreholes (depicted as a shaded grey area). On the other hand, the black line represents the deep flowline (GW11). The behaviour of both GW5 and GW2 is also depicted individually. It is evident that the dominance of one flowline over the other changes depending on the hydrological state of the system. Lastly, the behaviour of GW1 is also presented. It is apparent that this borehole is primarily influenced by chemical processes related to the consumption of dissolved oxygen and subsequent changes in redox conditions.
-
Practical implications. Our findings on the relationship between stream chemistry and subsurface water chemistry have practical implications. It is suggested that stream chemistry can serve as a valuable proxy for assessing and monitoring subsurface water chemistry. This bridges a gap in the current state of the art by highlighting the potential utility of readily available stream chemistry data for inferring subsurface conditions. To illustrate the respective influences of the shallow and deep flowlines on the temporal trend in the stream water at the outlet (labelled SW1 in Fig. 1), a graph has been provided in Fig. 6, where these influences are depicted in blue. This visual representation helps clarify how different flowlines contribute to changes in the chemistry of stream water over time.
-
Limitations and future work. Although this high-frequency campaign spanned only 1 year, we captured two contrasting hydrological extremes, an exceptionally wet period and a severe drought, and therefore covered a broad segment of the typical flow range of the catchment. However, these data cannot fully represent all possible interannual variability. To mitigate this limitation, we placed the 1-year record in the context of our longer 10-year bi-weekly monitoring programme. This complementary dataset broadens the temporal scope and will enable future analyses to assess how often similar hydro-biogeochemical conditions recur and to detect potential shifts under changing climatic drivers.
In addition, while in situ measurements of redox potential and dissolved oxygen offer valuable near-real-time insights, sensor drift remains a concern, particularly during prolonged deployment in varying temperature and flow regimes. We performed regular calibrations and spot checks to minimise errors, but subtle changes may still occur over time. Users of this dataset are encouraged to consider possible sensor bias when interpreting short-term fluctuations. Finally, weekly sampling, although substantially more frequent than traditional approaches, may still miss very rapid or localised events. Expanding the temporal resolution during peak flow periods or employing automated samplers at multiple depths could help capture episodic phenomena and refine our understanding of the full biogeochemical complexity of the catchment.
The database related to this paper is publicly available at https://doi.org/10.5281/zenodo.10869166 (Hissler et al., 2024). All datasets are cleaned, with outliers removed. A detailed description of all monitoring and sampling sites, including physiographic characteristics, field equipment details, and sampling procedures, is presented in all shared .xlsx files. The hydrological time series for each borehole and the discharge at the outlet are given in a separate file. Weekly time series of EC, DO, ORP, and pH and sample hydrochemistry are given in separate files. For more information on the available dataset, please contact the corresponding author (christophe.hissler@list.lu).
The 1-year monitoring campaign conducted within the WEC provides a dataset that contributes to ongoing efforts to understand the interactions between hydrological and biogeochemical processes in shallow groundwater. While similar datasets exist, this study adds to the existing body of work by offering high-resolution observations that may help to explore seasonal variability, flowline interactions, and redox zone development. The dataset does not provide a comprehensive understanding of these processes but offers empirical data that could support future research into the influence of redox reactions on pH dynamics and ion exchange in forested catchments. These insights, though limited to a 1-year period, provide a basis for considering key processes that can influence the hydro-biogeochemical behaviour of the catchment, as illustrated by the following aspects.
-
Modelling redox reactions within shallow horizons. The dataset provides parameters that may be useful for investigating redox reactions within shallow horizons, including observations related to DOC dynamics during precipitation events. The data capture processes such as DOC oxidation, the subsequent release of CO2, the formation of carbonic acid, and the dissolution of bicarbonate minerals, which could help explore the catchment's chemical responses to rainfall. While the dataset alone does not provide a comprehensive view of these processes, it may support further studies into the biogeochemical dynamics at play.
-
Influence of redox reactions on pH and ion exchange. This dataset provides observations that may help to explore potential relationships between redox reactions and pH variability in shallow groundwater. While the data are limited in scope and duration, they offer a foundation for investigating how changes in redox conditions might influence ion exchange processes and, consequently, solute concentrations. These observations contribute to ongoing efforts to better understand groundwater chemistry in forested catchments.
-
Hydrological variability and flowline interactions. The dataset provides observations that can help investigate seasonal variability in the catchment, including potential differences in the dynamics between shallow and deep flowlines and their role in solute distribution. The temporal patterns observed offer a basis for exploring how interactions between these flowlines might evolve in response to seasonal variations, contributing to a broader understanding of hydrological patterns and solute transport mechanisms in the catchment.
In conclusion, while this high-frequency campaign lasted just 1 year, it included both a severe drought and an exceptionally wet period, effectively capturing two major flow extremes in the catchment. When combined with our ongoing 10-year bi-weekly dataset, these data offer a more complete picture of the hydrological range and provide valuable insights into redox processes, pH dynamics, and seasonal flowline interactions. We believe these findings will help researchers refine predictive models, guide land management decisions, and improve understanding of groundwater-driven ecosystem health.
KNvZ collected the majority of the field data as part of his PhD research and contributed to the writing of the paper. LG and CH provided significant assistance in the data collection and paper preparation. All three of the authors participated in data processing. JFI was responsible for the field installations of the equipment and provided additional data. LL conducted laboratory analyses and data capturing, with guidance from FB. LP and EZ offered technical inputs, reviewed the paper, and contributed to its writing. The collaborative efforts of all the authors were invaluable in the completion of this paper.
The contact author has declared that none of the authors has any competing interests.
Publisher's note: Copernicus Publications remains neutral with regard to jurisdictional claims made in the text, published maps, institutional affiliations, or any other geographical representation in this paper. While Copernicus Publications makes every effort to include appropriate place names, the final responsibility lies with the authors.
This work is part of the HYDRO-CSI project. We thank Jérôme Juilleret and Viola Huck for their contributions to the water sample preparation.
This research has been supported by the Luxembourg National Research Fund (FNR) through the FNR/PRIDE research programme (grant no. PRIDE15/10623093/HYDRO-CSI/Pfister).
This paper was edited by Achim A. Beylich and reviewed by three anonymous referees.
Amundson, R., Richter, D. D., Humphreys, G. S., Jobbágy, E. G., and Gaillardet, J.: Coupling between biota and earth materials in the critical zone, Elements, 3, 327–332, 2007. a
Anderson, S. P., Anderson, R. S., and Tucker, G. E.: Landscape scale linkages in critical zone evolution, C. R. Geosci., 344, 586–596, 2012. a
Antonelli, M., Glaser, B., Teuling, A. J., Klaus, J., and Pfister, L.: Saturated areas through the lens: 1. Spatio-temporal variability of surface saturation documented through thermal infrared imagery, Hydrol. Process., 34, 1310–1332, 2020a. a
Antonelli, M., Glaser, B., Teuling, A. J., Klaus, J., and Pfister, L.: Saturated areas through the lens: 2. Spatio-temporal variability of streamflow generation and its relationship with surface saturation, Hydrol. Process., 34, 1333–1349, 2020b. a
Appelo, C. A. J. and Postma, D.: Geochemistry, Groundwater and Pollution, CRC press, https://doi.org/10.1201/9781439833544, 2004. a
Arora, B., Briggs, M. A., Zarnetske, J. P., Stegen, J., Gomez-Velez, J. D., Dwivedi, D., and Steefel, C.: Hot spots and hot moments in the critical zone: identification of and incorporation into reactive transport models, in: Biogeochemistry of the Critical Zone, 9–47, Springer, https://doi.org/10.1007/978-3-030-95921-0, 2022. a
Brantley, S. L., Goldhaber, M. B., and Ragnarsdottir, K. V.: Crossing disciplines and scales to understand the critical zone, Elements, 3, 307–314, 2007. a
Brantley, S. L., Holleran, M. E., Jin, L., and Bazilevskaya, E.: Probing deep weathering in the Shale Hills Critical Zone Observatory, Pennsylvania (USA): the hypothesis of nested chemical reaction fronts in the subsurface, Earth Surf. Proc. Land., 38, 1280–1298, 2013. a
Brantley, S. L., McDowell, W. H., Dietrich, W. E., White, T. S., Kumar, P., Anderson, S. P., Chorover, J., Lohse, K. A., Bales, R. C., Richter, D. D., Grant, G., and Gaillardet, J.: Designing a network of critical zone observatories to explore the living skin of the terrestrial Earth, Earth Surf. Dynam., 5, 841–860, https://doi.org/10.5194/esurf-5-841-2017, 2017. a
Brooks, P. D., Chorover, J., Fan, Y., Godsey, S. E., Maxwell, R. M., McNamara, J. P., and Tague, C.: Hydrological partitioning in the critical zone: Recent advances and opportunities for developing transferable understanding of water cycle dynamics, Water Resour. Res., 51, 6973–6987, 2015. a
DeLaune, R. and Reddy, K.: Redox Potential, Encyclopedia of Soils in the Environment, CRC press, 366–371, https://doi.org/10.1201/9780429155833, 2005. a
Fabiani, G., Schoppach, R., Penna, D., and Klaus, J.: Transpiration patterns and water use strategies of beech and oak trees along a hillslope, Ecohydrology, 15, e2382, https://doi.org/10.1002/eco.2382, 2022. a, b
Fabiani, G., Klaus, J., and Penna, D.: The influence of hillslope topography on beech water use: a comparative study in two different climates, Hydrol. Earth Syst. Sci., 28, 2683–2703, https://doi.org/10.5194/hess-28-2683-2024, 2024. a
Gourdol, L., Clément, R., Juilleret, J., Pfister, L., and Hissler, C.: Exploring the regolith with electrical resistivity tomography in large-scale surveys: electrode spacing-related issues and possibility, Hydrol. Earth Syst. Sci., 25, 1785–1812, https://doi.org/10.5194/hess-25-1785-2021, 2021. a, b, c
Guo, L. and Lin, H.: Critical zone research and observatories: Current status and future perspectives, Vadose Zone J., 15, 1–14 https://doi.org/10.2136/vzj2016.06.0050, 2016. a
Heistermann, M., Bogena, H., Francke, T., Güntner, A., Jakobi, J., Rasche, D., Schrön, M., Döpper, V., Fersch, B., Groh, J., Patil, A., Pütz, T., Reich, M., Zacharias, S., Zengerle, C., and Oswald, S.: Soil moisture observation in a forested headwater catchment: combining a dense cosmic-ray neutron sensor network with roving and hydrogravimetry at the TERENO site Wüstebach, Earth Syst. Sci. Data, 14, 2501–2519, https://doi.org/10.5194/essd-14-2501-2022, 2022. a
Hissler, C., Martínez-Carreras, N., Barnich, F., Gourdol, L., Iffly, J. F., Juilleret, J., Klaus, J., and Pfister, L.: The Weierbach experimental catchment in Luxembourg: A decade of critical zone monitoring in a temperate forest-from hydrological investigations to ecohydrological perspectives, Hydrol. Process., 35, e14140, https://doi.org/10.1002/hyp.14140, 2021. a, b
Hissler, C., van Zweel, N., Gourdol, L., and Leonard, L.: One year of high frequency monitoring of groundwater physico-chemical parameters in the Weierbach Experimental Catchment, Luxembourg, Zenodo [data set], https://doi.org/10.5281/zenodo.10869166, 2024. a, b
Jin, L., Siegel, D. I., Lautz, L. K., Mitchell, M. J., Dahms, D. E., and Mayer, B.: Calcite precipitation driven by the common ion effect during groundwater–surface-water mixing: a potentially common process in streams with geologic settings containing gypsum, Geol. Soc. Am. Bull., 122, 1027–1038, https://doi.org/10.1130/B30011.1, 2010. a
Juilleret, J., Dondeyne, S., Vancampenhout, K., Deckers, J., and Hissler, C.: Mind the gap: a classification system for integrating the subsolum into soil surveys, Geoderma, 264, 332–339, 2016. a
Lazareva, O., Kan, J., Chen, C., and Sparks, D. L.: Coupled dynamics of aqueous biogeochemistry in contrasting floodplain environments: implications for Critical Zone carbon sequestration along redox gradients, Appl. Geochem., 145, 105413, https://doi.org/10.1016/j.apgeochem.2022.105413, 2022. a, b
Lee, R. M., Shoshitaishvili, B., Wood, R. L., Bekker, J., and Abbott, B. W.: The meanings of the Critical Zone, Anthropocene, 42, 100377, https://doi.org/10.1016/j.ancene.2023.100377, 2023. a
Li, L., Bao, C., Sullivan, P. L., Brantley, S., Shi, Y., and Duffy, C.: Understanding watershed hydrogeochemistry: 2. Synchronized hydrological and geochemical processes drive stream chemostatic behavior, Water Resour. Res., 53, 2346–2367, 2017. a
Mansfeldt, T.: In situ long-term redox potential measurements in a dyked marsh soil, J. Plant Nutr. Soil Sc., 166, 210–219, 2003. a
Martínez-Carreras, N., Wetzel, C. E., Frentress, J., Ector, L., McDonnell, J. J., Hoffmann, L., and Pfister, L.: Hydrological connectivity inferred from diatom transport through the riparian-stream system, Hydrol. Earth Syst. Sci., 19, 3133–3151, https://doi.org/10.5194/hess-19-3133-2015, 2015. a
Martínez-Carreras, N., Hissler, C., Gourdol, L., Klaus, J., Juilleret, J., Iffly, J. F., and Pfister, L.: Storage controls on the generation of double peak hydrographs in a forested headwater catchment, J. Hydrol., 543, 255–269, 2016. a, b
McMahon, P. and Chapelle, F.: Redox processes and water quality of selected principal aquifer systems, Groundwater, 46, 259–271, 2008. a
Moragues-Quiroga, C., Juilleret, J., Gourdol, L., Pelt, E., Perrone, T., Aubert, A., Morvan, G., Chabaux, F., Legout, A., Stille, P., and Hissler, C.: Genesis and evolution of regoliths: evidence from trace and major elements and Sr-Nd-Pb-U isotopes, Catena, 149, 185–198, 2017. a, b
Pfister, L., Martínez-Carreras, N., Hissler, C., Klaus, J., Carrer, G. E., Stewart, M. K., and McDonnell, J. J.: Bedrock geology controls on catchment storage, mixing, and release: a comparative analysis of 16 nested catchments, Hydrol. Process., 31, 1828–1845, 2017. a, b, c
Pfister, L., Bonanno, E., Fabiani, G., Gourdol, L., Hissler, C., Huck, V., Iffly, J. F., Keim, R., Martínez‐Carreras, N., Mestdagh, X., and Montemagno, A.: Fast motion view of a headwater creek – A hydrological year seen through time-lapse photography, Hydrol. Process., 37, e15026, https://doi.org/10.1002/hyp.15026, 2023. a
Riebe, C. S., Hahm, W. J., and Brantley, S. L.: Controls on deep critical zone architecture: a historical review and four testable hypotheses, Earth Surf. Proc. Land., 42, 128–156, 2017. a
Scaini, A., Hissler, C., Fenicia, F., Juilleret, J., Iffly, J. F., Pfister, L., and Beven, K.: Hillslope response to sprinkling and natural rainfall using velocity and celerity estimates in a slate-bedrock catchment, J. Hydrol., 558, 366–379, 2018. a
Stewart, B., Shanley, J. B., Kirchner, J. W., Norris, D., Adler, T., Bristol, C., Harpold, A. A., Perdrial, J. N., Rizzo, D. M., Sterle, G., and Underwood, K.L.: Streams as mirrors: Reading subsurface water chemistry from stream chemistry, Water Resour. Res., 58, e2021WR029931, https://doi.org/10.1029/2021WR029931, 2022. a, b, c, d
Weiler, M. and McDonnell, J. J.: Testing nutrient flushing hypotheses at the hillslope scale: a virtual experiment approach, J. Hydrol., 319, 339–356, 2006. a
Welch, L. and Allen, D.: Hydraulic conductivity characteristics in mountains and implications for conceptualizing bedrock groundwater flow, Hydrogeol. J., 22, 1003, https://doi.org/10.1007/s10040-014-1121-5, 2014. a
Wrede, S., Fenicia, F., Martínez-Carreras, N., Juilleret, J., Hissler, C., Krein, A., Savenije, H. H., Uhlenbrook, S., Kavetski, D., and Pfister, L.: Towards more systematic perceptual model development: a case study using 3 Luxembourgish catchments, Hydrol. Process., 29, 2731–2750, 2015. a
Wymore, A. S., Yang, W. H., Silver, W. L., McDowell, W. H., and Chorover, J.: Biogeochemistry of the Critical Zone, Springer, https://doi.org/10.1007/978-3-030-95921-0, 2022. a
Xiao, D., Brantley, S. L., and Li, L.: Vertical connectivity regulates water transit time and chemical weathering at the hillslope scale, Water Resour. Res., 57, e2020WR029207, https://doi.org/10.1029/2020WR029207, 2021. a
Zhang, Z. and Furman, A.: Soil redox dynamics under dynamic hydrologic regimes-a review, Sci. Total Environ., 763, 143026, https://doi.org/10.1016/j.scitotenv.2020.143026, 2021. a
Zhi, W., Li, L., Dong, W., Brown, W., Kaye, J., Steefel, C., and Williams, K. H.: Distinct source water chemistry shapes contrasting concentration-discharge patterns, Water Resour. Res., 55, 4233–4251, 2019. a, b