the Creative Commons Attribution 4.0 License.
the Creative Commons Attribution 4.0 License.
 | 21 May 2025
Regional-scale shear-wave velocity profiles for ground response analyses and uncertainty evaluations – the Piedmont region (northwest Italy) database
Cesare Comina
Guido Maria Adinolfi
Carlo Bertok
Andrea Bertea
Vittorio Giraud
Pierluigi Pieruccini
Ground response analyses using a statistically representative sample of soil and rock profiles are typically used to estimate earthquake ground motions and, in turn, the seismic hazard of a particular area of study. With this aim shear-wave velocity (Vs) properties of the profiles are of paramount importance given that uncertainty in this parameter plays a major role in ground motion prediction and in its variability. Usually, stochastic procedures are adopted to model this uncertainty, and several stochastic approaches have been developed. These approaches should, however, be calibrated on detailed geological–geomorphological information and specific Vs profile databases. Within this context, the present paper aims to provide a new extensive database of Vs profiles over the Piedmont region (northwest Italy). These data are obtained through a specific workflow developed for their evaluation at the regional scale, merging the information of specific geological–geomorphological modelling and a devoted geophysical data collection. The obtained database (https://doi.org/10.5281/zenodo.13685087, Comina et al., 2024) could be used as the basis of Vs randomization approaches in different geological contexts as well, and results from the specific data analyses performed could be adopted as a reference for similar materials in analogous geological contexts.
- Article
(20094 KB) - Full-text XML
- BibTeX
- EndNote


The prediction of earthquake ground motions, and the consequent seismic hazard of a specific area of study, is usually based on ground response evaluations of a statistical representative sample of possible soil and rock profiles (i.e. seismo-stratigraphical profiles) in the area (Pieruccini et al., 2022). As an example, “amplification abacuses” are widely diffused simplified tools for the quantification of local stratigraphic amplifications of the seismic ground motion over large areas, i.e. regions. These evaluations are therefore the result of a compromise between generalization and specialization (Peruzzi et al., 2016), and several approaches have been adopted in the past for their formulation (e.g. Pagani et al., 2006). One of the challenging aspects of these kinds of analyses is the definition of a geological–geomorphological model (GGM) at regional scale built for the purposes of the assessment of shear-wave velocity (Vs) properties of seismo-stratigraphical profiles, their spatial distribution and related geological variability. Particularly, for regional-scale studies, the uncertainty in the Vs profiles definition is considered the main source of uncertainty in ground response evaluations (Toro, 2022) and must therefore be considered with devoted attention.
Usually, stochastic procedures are adopted to model this uncertainty. Several stochastic approaches have been developed through the years with parameters that should, however, be calibrated on specific GGM and Vs profile databases (e.g. Toro, 2005; Shi and Asimaki, 2018; Passeri et al., 2020). Indeed, older and widely used formulations of these approaches, e.g. Toro (1995), provided parameters calibrated on California profile data to be used elsewhere. New generic and site-specific stochastic Vs models should therefore be developed using specific databases or increased databases number and population together with insights gained in the practical use of these models.
Several research efforts have focused on constructing and analysing Vs databases for different purposes, including (1) developing site investigation guidelines, as demonstrated by EPRI (2013), with a database containing over 350 Vs profiles (mainly within the United States); (2) managing uncertainties, as in Toro (1995), who compiled a database containing 745 Vs profiles from the PEA (Pacific Earthquake Analysis) database for the development of a geostatistical model; (3) addressing data gaps, as shown by Stewart et al. (2014), creating a Vs database for Greece using open-source data to extrapolate Vs, z (the harmonic average shear-wave velocity profile down to depth z); (4) creating empirical correlations, as in Passeri et al. (2021), developing a database of 71 Vs profiles for statistical analysis and model calibration; (5) validating simplified methods, as in Aimar et al. (2019), using a Vs database to validate soil amplification factors in the Italian building code NTC (2018); (6) assessing measurement uncertainty, as in Moss (2008) and Comina et al. (2011), with smaller databases of 30 and 10 Vs profiles, respectively; and (7) supporting ground motion studies, as in Wang et al. (2022), establishing the United States community Vs database for ground motion and site response analysis.
In the present paper, a new methodological workflow for the assessment of a GGM and related Vs profiles distribution at regional scale is presented which is used to develop a new geological and geophysical database. Using existing datasets, which are implemented and validated, a new geographic database for ground response at the regional scale was developed. The methodological workflow is tested over the Piedmont region in northwest Italy. This region includes the Alpine mountain environment; the Foreland Hilly landscape with both different bedrock and cover terrains typologies and thicknesses; the Po River plain; and secondary alluvial plains, with thick Quaternary deposits overlying at different-depth bedrock. Following the proposed workflow, we assessed a new Vs database by performing quality control (QC) of all the available datasets and producing additional information in areas not covered or poorly covered by data.
Therefore, this paper has three main aims: (i) to provide a new, extensive (i.e. containing more than 1000 profiles) database of Vs profiles to be used as the basis for randomization approaches in different geological contexts, (ii) to provide median properties of the different investigated geological–geomorphological domains to be adopted as reference for similar materials in analogous geological contexts, and (iii) to provide a workflow to be adopted for the evaluation of Vs profile distribution at the regional scale by merging geological–geomorphological information and specific geophysical data collection.
The assessment of a geological–geomorphological model (GGM) at the regional scale is the first step of the proposed procedure. In order to get an updated synthesis of the geological knowledge, the geological map of the Piedmont region (1:250 000 scale) (Piana et al., 2017a, b) has been used. This map is available as open-source geodatabase (Geoportale Arpa) and therefore can be used for the purposes of reclassification.
Three main reclassification levels of the geological information are needed to obtain a GGM consistent with the seismic perspective:
-
The first level is the reclassification of the outcropping and subsoil units as geological bedrock and cover terrains. To simplify the model, cover terrains are usually those of the Quaternary Age, whereas geological bedrock can be considered pre-Quaternary (Pieruccini et al., 2022).
-
The second level is the classification of each geological bedrock and cover terrain according to their main geotechnical properties (Romagnoli et al., 2022; Gaudiosi et al., 2023).
-
The final level is gathering of the original formations units into different geological–geomorphological domains (GGDs) based on their stratigraphic–sedimentological characteristics and the geomorphological context of outcrop, including the range of thicknesses of expected subsoil characteristics.
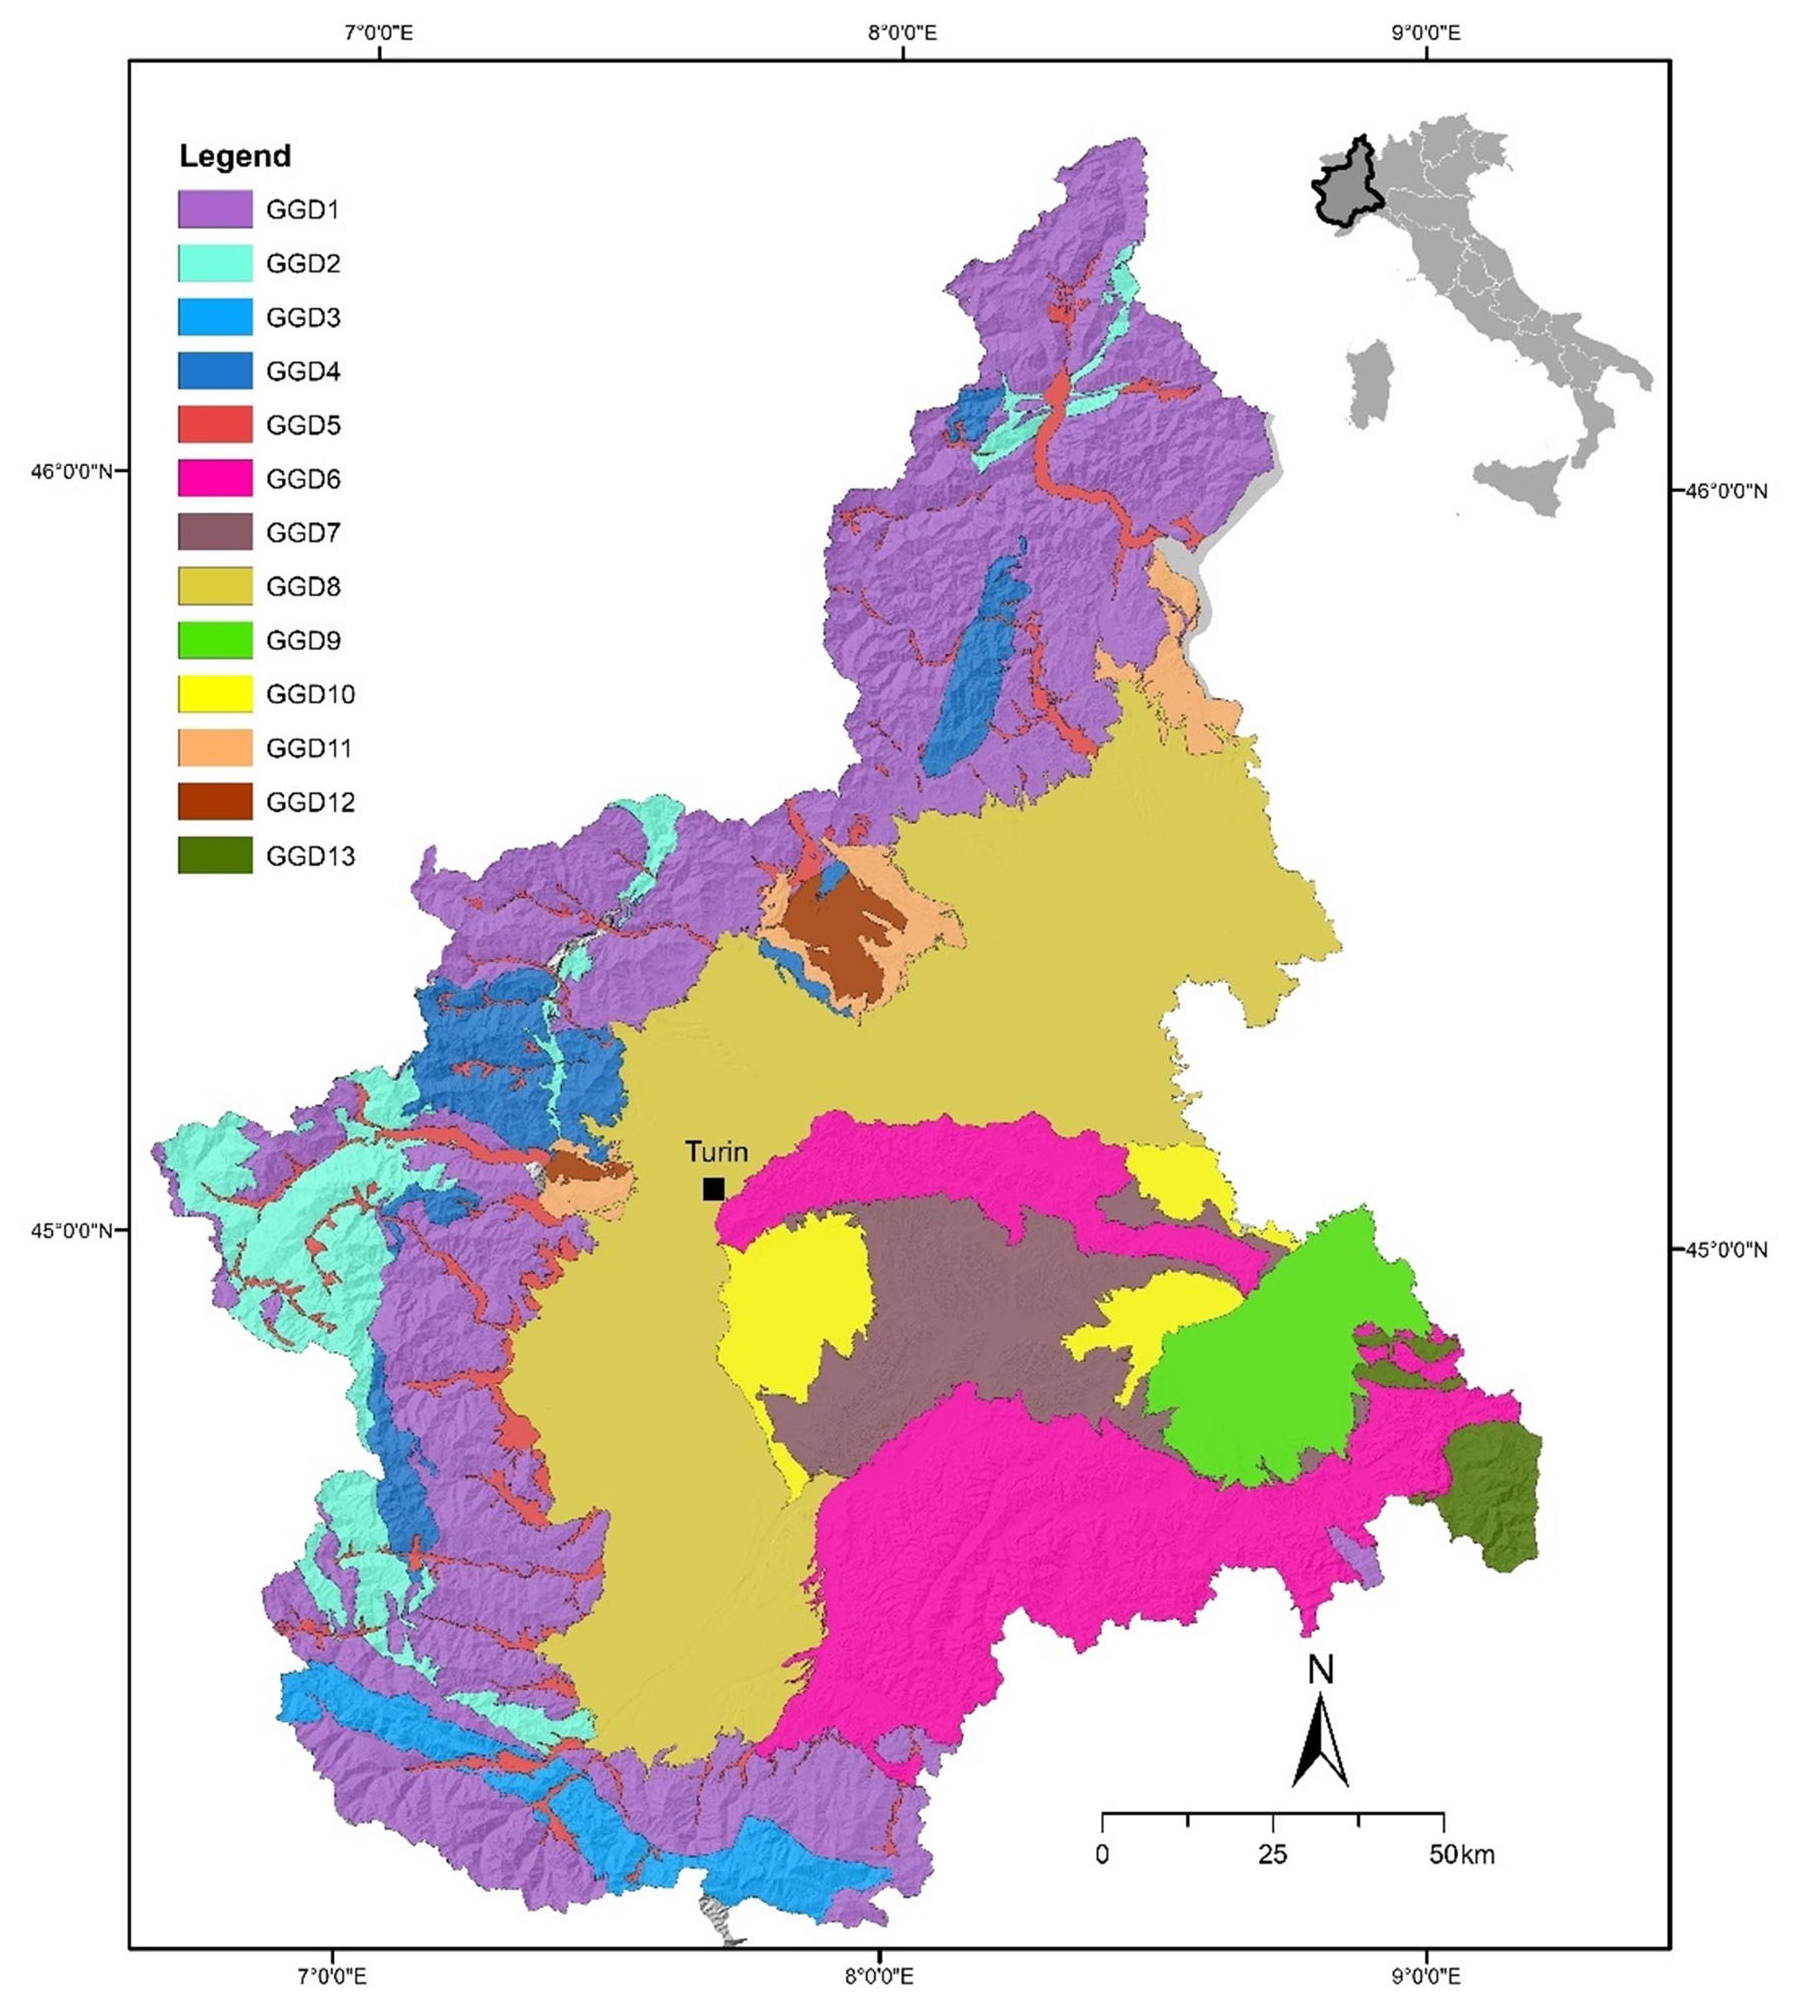
Figure 1Map of the geological–geomorphological domains within the Piedmont region.
The geological and geomorphological setting of the region is the result of a complex geodynamical evolution that, since the Mesozoic, has led to the formation of two passive continental margins and two oceanic zones. The collision of the two margins after the Eocene is the beginning of the Alpine–Apennine orogenesis, which is characterized by complex metamorphic, magmatic and sedimentary processes (Piana et al., 2017b, and references therein). The definitive emersion of the area is marked by the middle Pliocene–Quaternary continental successions, and the present-day landscape, the consequence of this complex evolution, can be subdivided into four main landscape systems or physiographic units.
-
mountain ridges, which include
- a.
the Alpine Ridge extending from the southwest to the noth-northeast with an arcuate shape,
- b.
the Apennine Ridge extending east–west and trending in the southeastern part of the region;
- a.
-
hills of Turin, Langhe and Monferrato;
-
the Quaternary alluvial basins and valley systems of the Po River, which include
- a.
the Po plain fed by rivers of Alpine provenance,
- b.
the floodplains of the valleys crossing the Alpine Ridge,
- c.
the floodplains fed by the rivers crossing the Apennine Ridge,
- d.
the floodplains fed by the rivers crossing the hills;
- a.
-
the Quaternary frontal moraines and related systems of fluvio-glacial and fluvio-lacustrine sediments of the main glacial amphitheatres extending into the Po Plain at the mouth of the main Alpine valleys (e.g. Ivrea and Rivoli).
The analysis and reclassification of the available geological and geomorphological database allowed for the identification of 13 different geological–geomorphological domains (GGDs) as reported in Fig. 1.
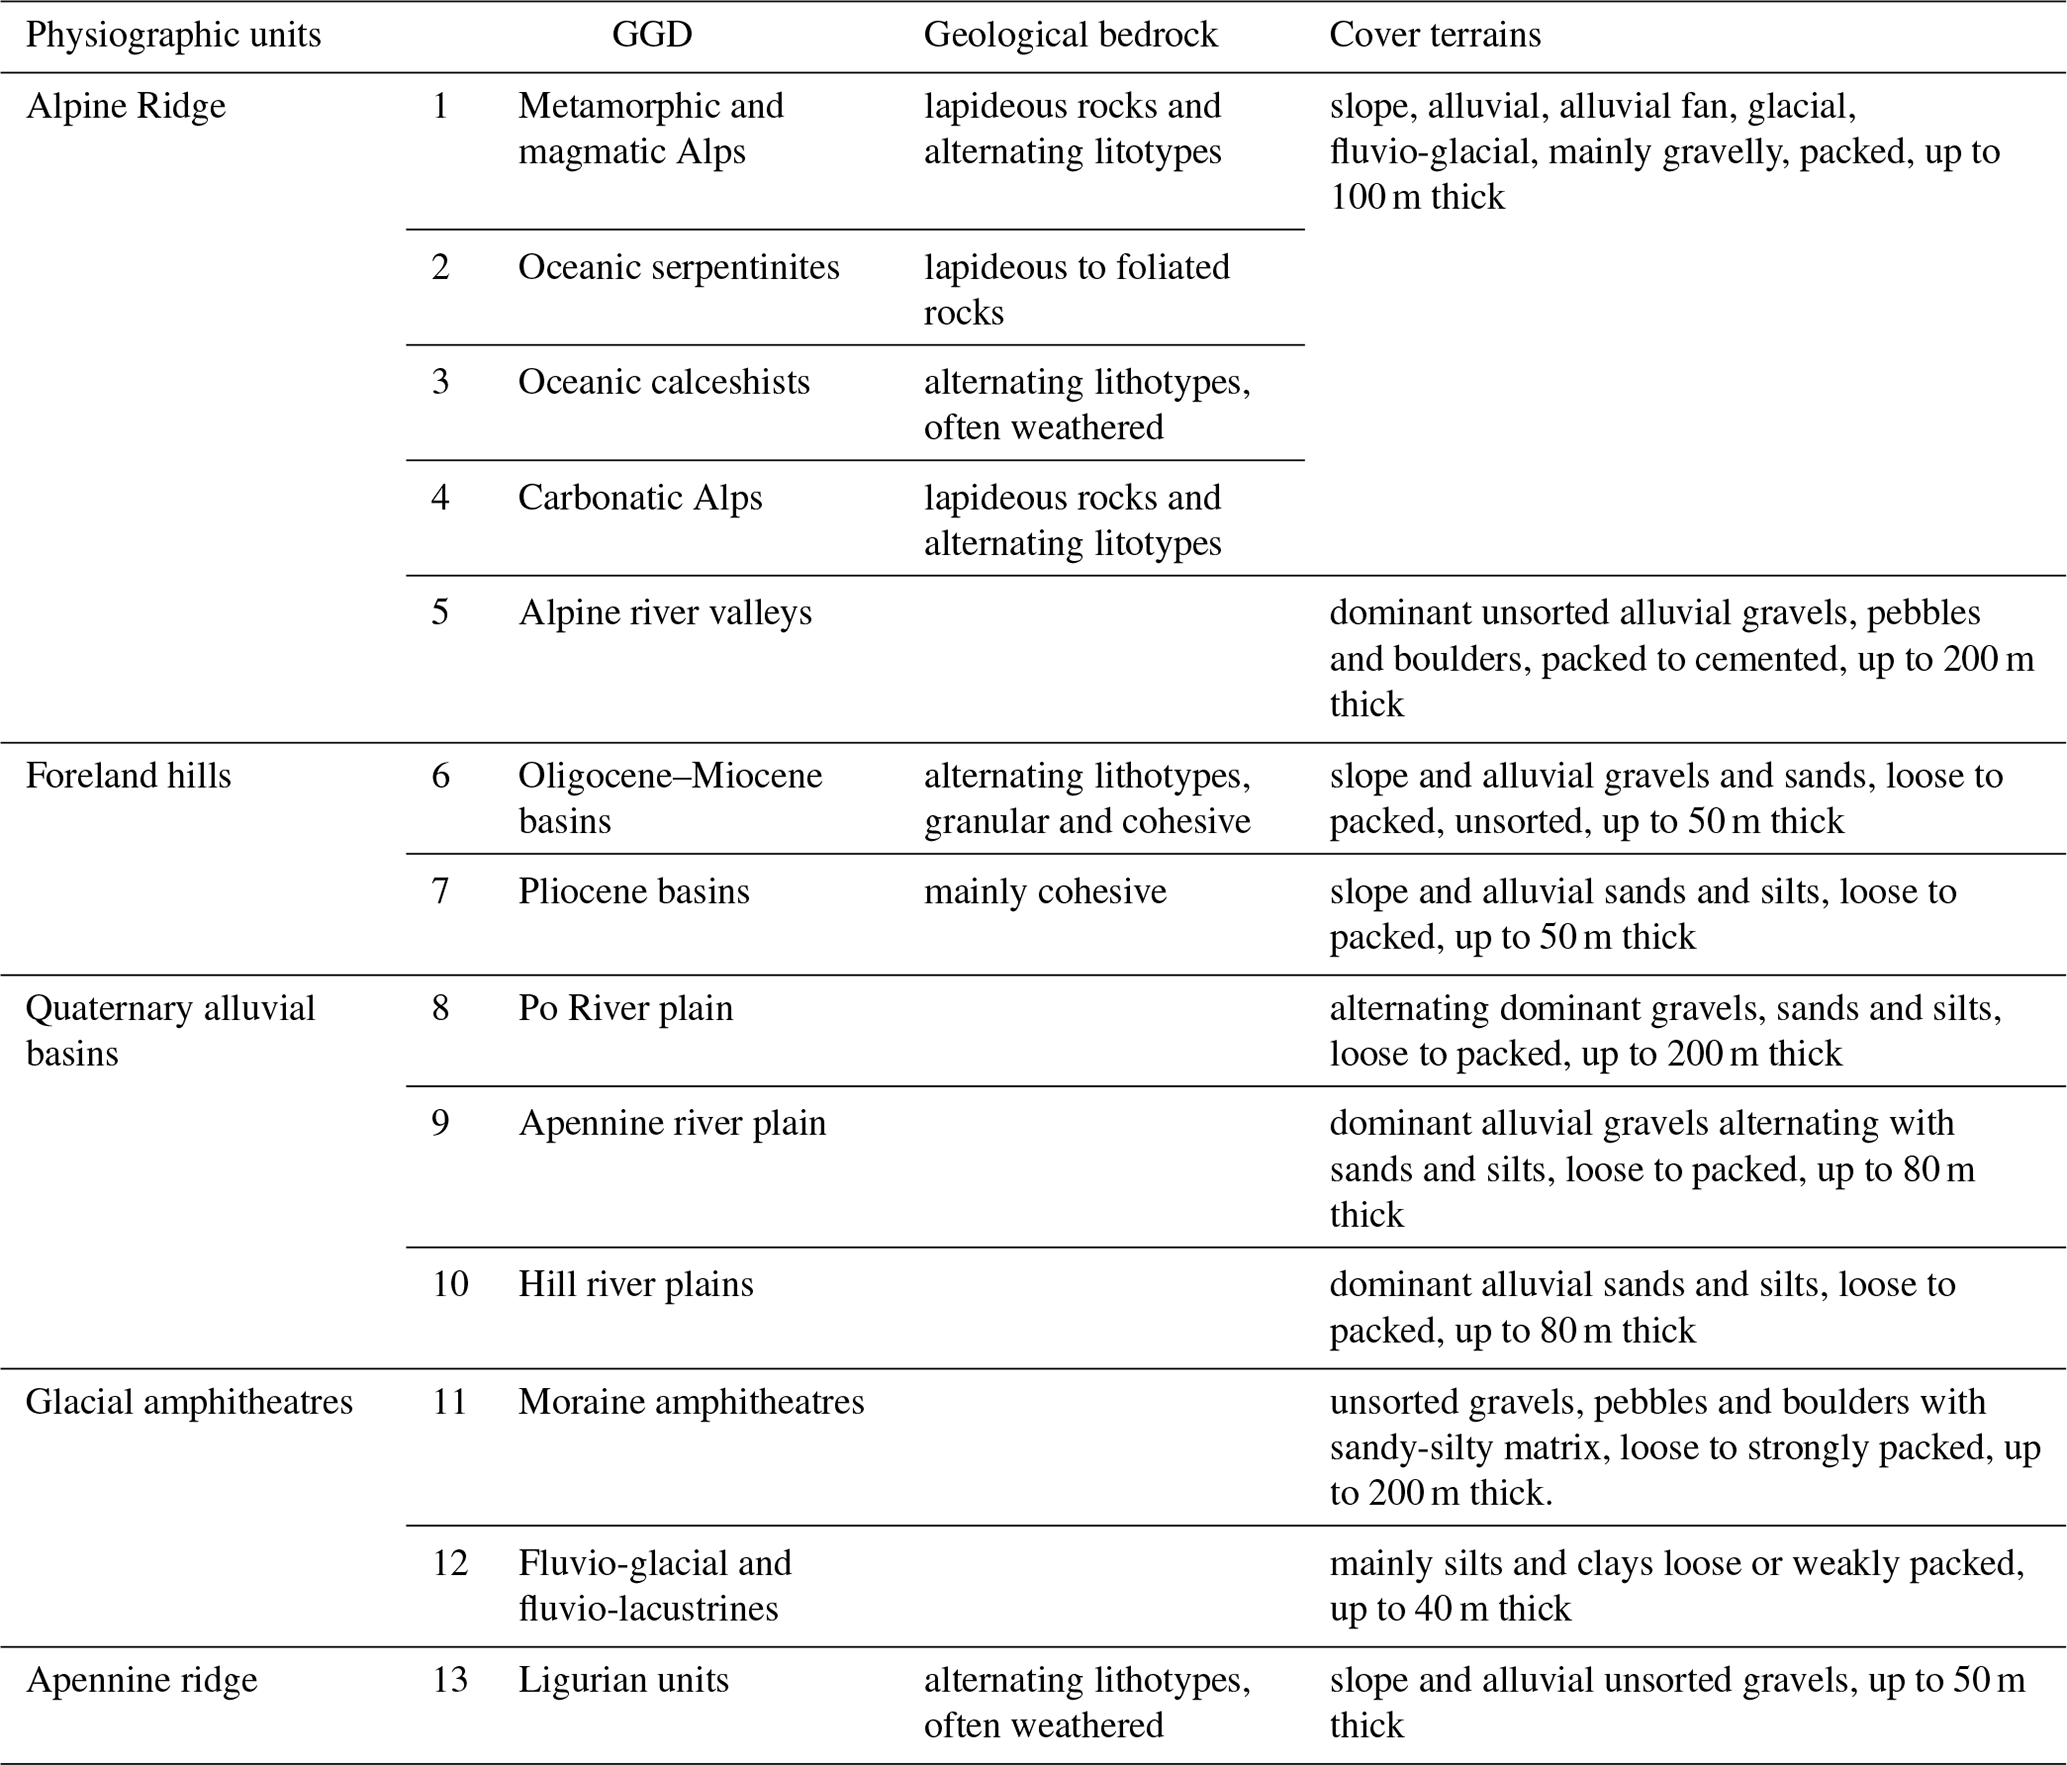
Each GGD is characterized by homogeneous geological bedrock typologies and potentially different litho-stratigraphic settings, including cover terrains. The GGDs are related to (Table 1): (a) the Alpine mountain chain with different bedrock (GGD 1 to 4), including the main Alpine valleys (GGD 5); (b) the foreland hilly landscape with different both bedrock and cover terrain typologies and thicknesses (GGD 6 and 7); (c) the Po River plain, fed by Alpine rivers, with thick, mostly coarse-grained Quaternary deposits overlying different-depth bedrock (GGD 8); (d) minor alluvial plains fed by rivers coming from the Apennines and the foreland hills with thick, mostly fine-grained Quaternary deposits overlying different-depth bedrock (GGD 9 and 10); (e) the moraine amphitheatres and the associated fluvio-glacial and lacustrine deposits (GGD 11 and 12); and (f) the complex successions belonging to the Ligurian units (GGD 13).
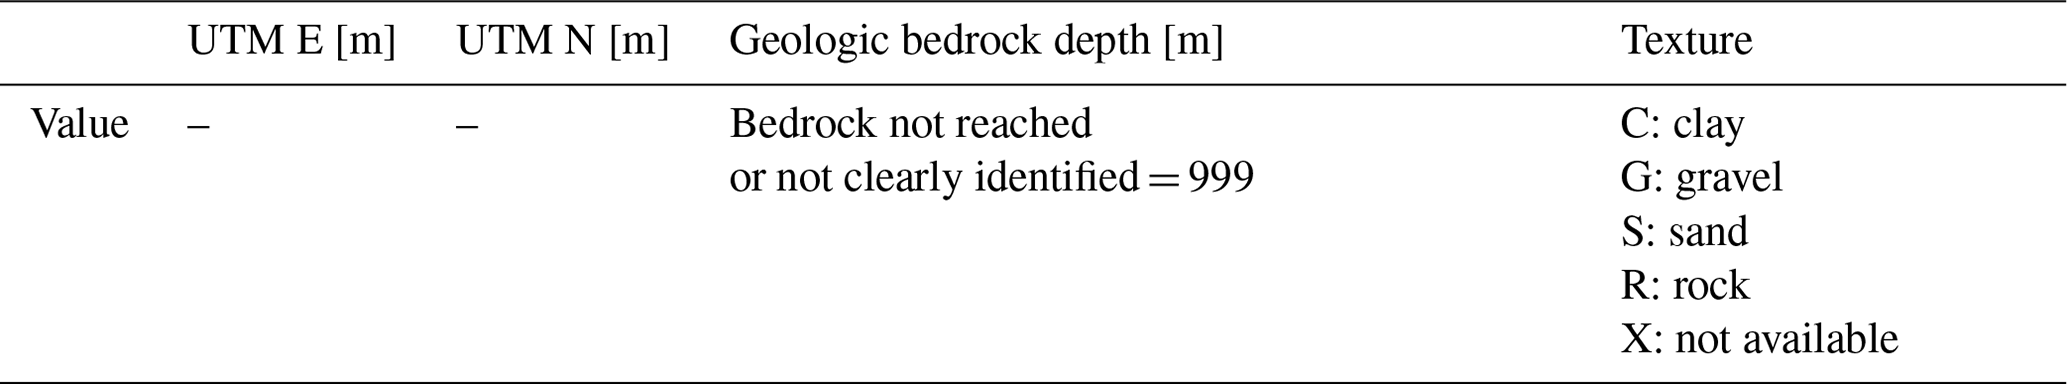
Once the GGDs were identified, the available geotechnical and geophysical databases from the regional authority's repositories were used for the geological/geotechnical characterization and for their Vs parameterization. The main source of information was the Geotechnical Database of Arpa (Regional Agency for Environmental Protection of Piedmont Region) Piedmont (Geoportale Arpa). This database contains several stratigraphic logs with various depths and at various quality. Attention was focused on the subset of about 3000 stratigraphic logs reaching at least 30 m in depth. Of these, more than 1000 logs, judged to be of higher quality, were consulted and are included in the presented database (Fig. 2). Most of these logs reached the geological bedrock, and in these cases, the bedrock depth was reported as information. Also, the prevalent properties of the cover terrains within the first 30 m were classified, when possible, according to the main textural and other characteristics. The final data format used in the database for this information is reported in Table 2.
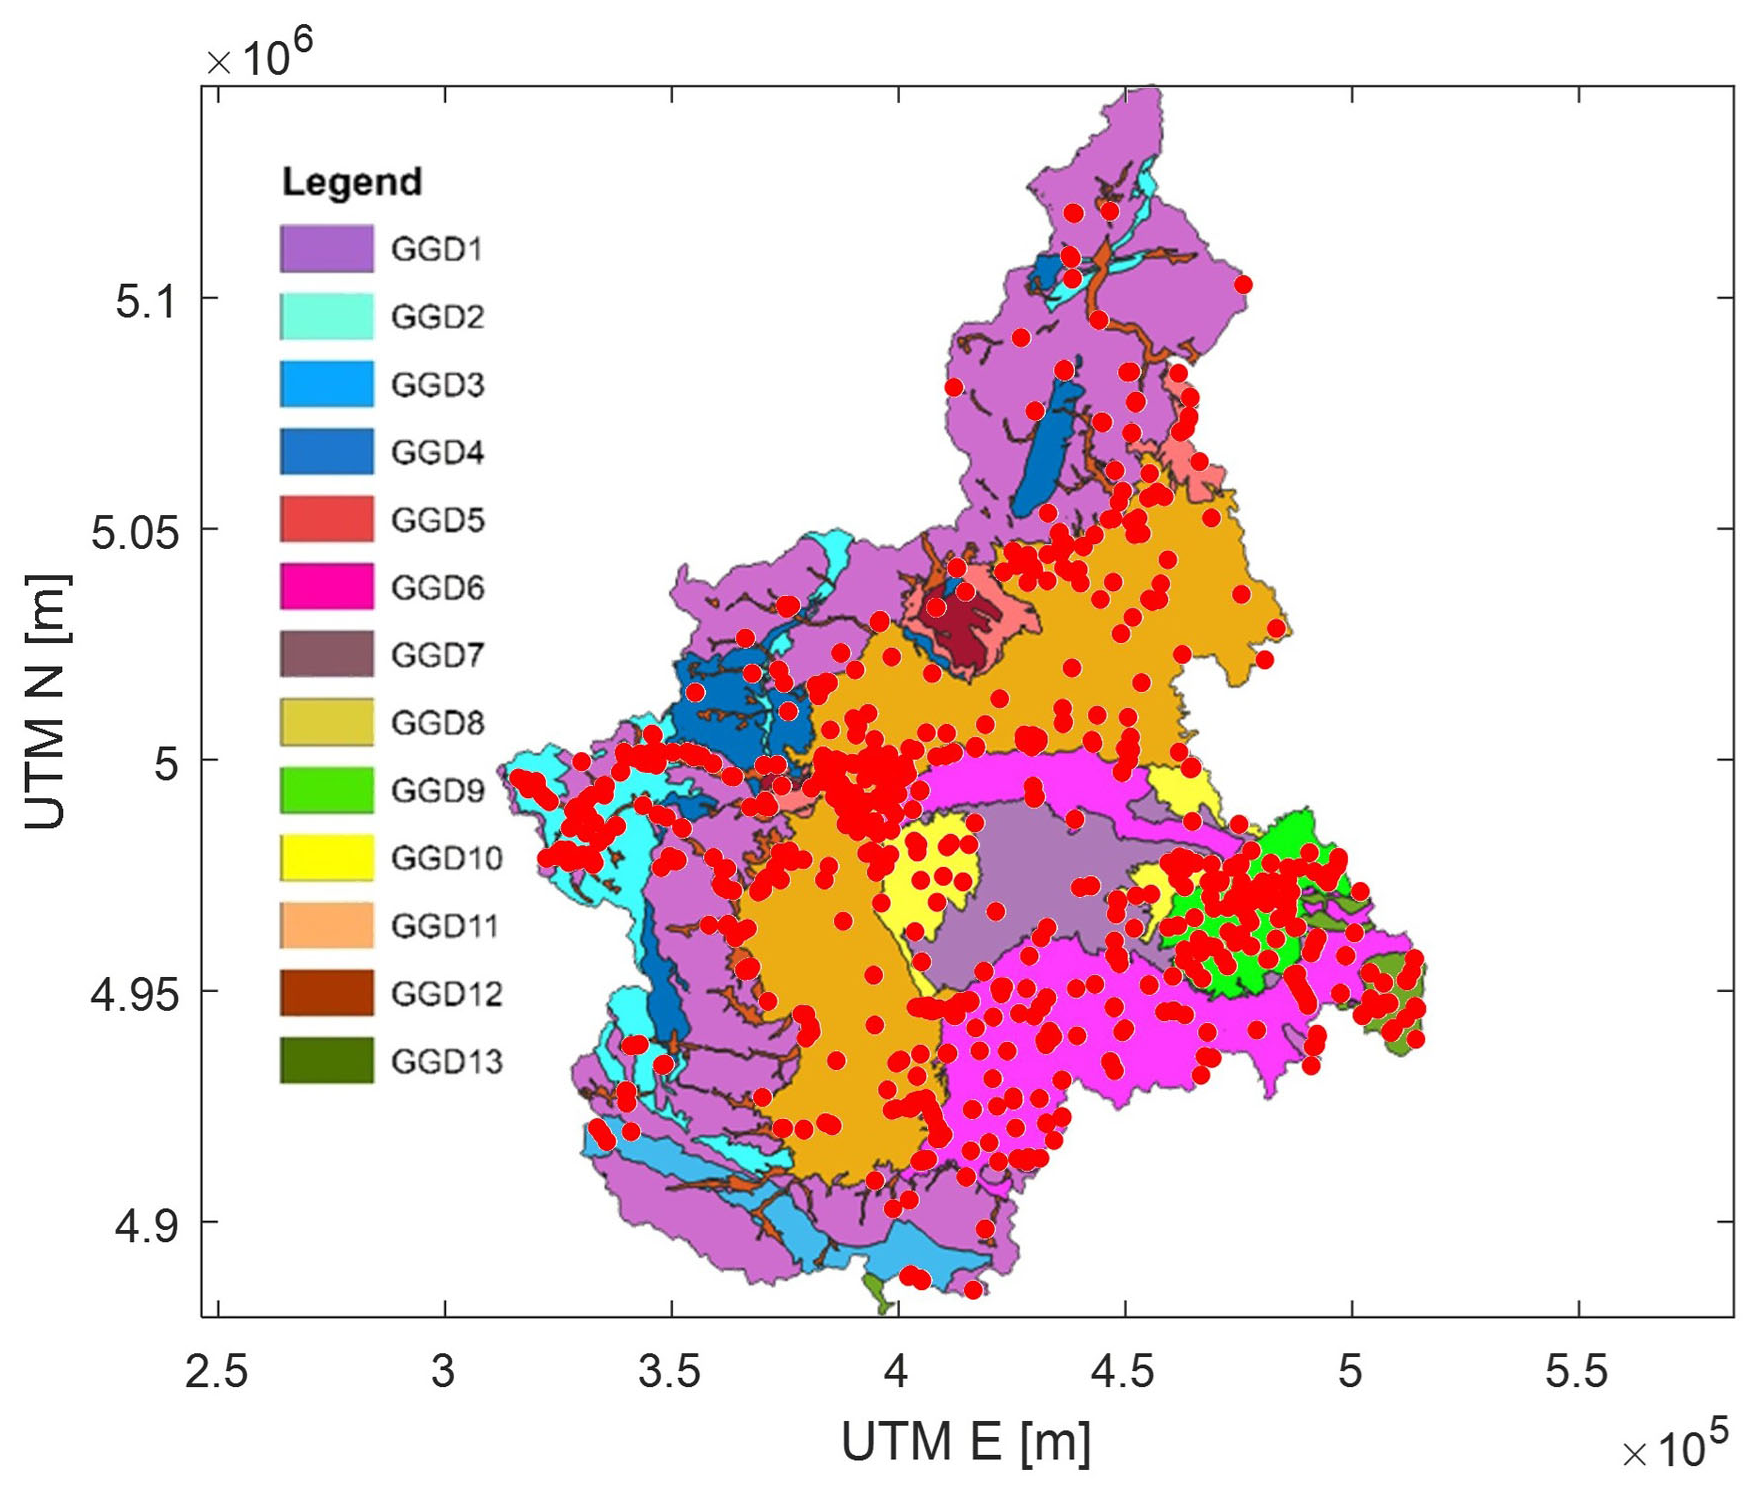
Figure 2Map of the GGDs and the distribution of the stratigraphic logs (red dots) analysed (from Geoportale Arpa).
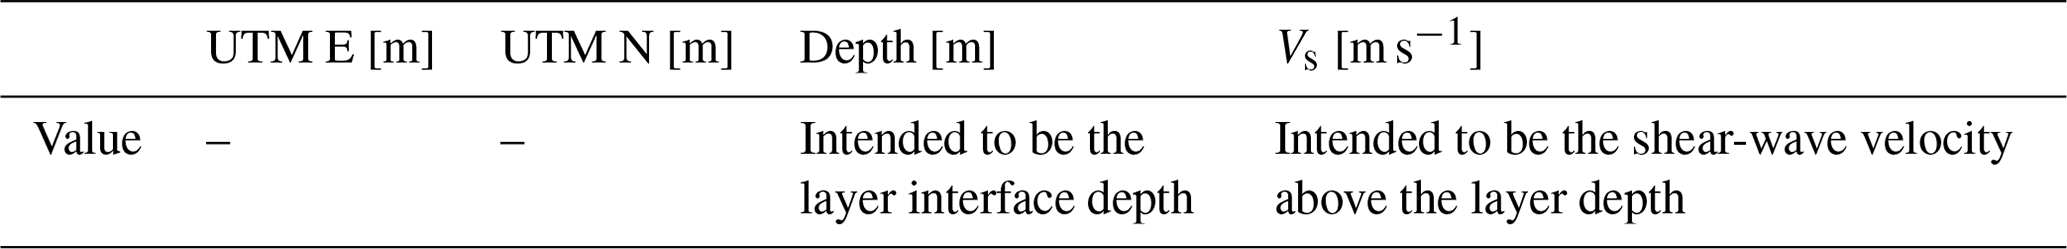
Table 2Data format for the geotechnical information contained in the database. Data values for the bedrock depth and texture attributes derived by the available logs. UTM E and UTM N are the metric coordinate system used for their georeferentiation (WGS84 UTM32N).
With respect to the shear-wave velocity properties, the main source of data was the same Geoportale Arpa. The analysis of this database allowed for the assessment of about 2000 Vs profiles coming from both invasive and non-invasive tests. To fill the gap in the geographic data distribution, we added more Vs profiles thanks to the collaboration with Techgea S.r.l., a leading geophysical private company that provided about 300 Vs profiles, and by performing specific field tests or implementing specific information from literature data (about 50 Vs profiles).
Geophysical data underwent specific quality control (QC) in order to consider only reliable and state-of-the-art information. Particularly, the data deriving from multichannel analysis of surface waves (MASW) tests (the most widely diffused technique for Vs profile determination) underwent a specific QC consisting in checking whether (1) the consistency of the dispersion curve presents a clearly visible and continuous fundamental mode in the frequency band of interest as it should; (2) when multiple dispersion modes occur, they are easily separable, well distinguishable, and reliably and independently interpretable as they should be; (3) the chosen dispersion curve is reliable and fits well with the spectral maxima of the seismogram transform used for the analysis; (4) the inversion of the data leads to a synthetic dispersion curve having a good correspondence with the experimental data; (5) the depth of the Vs profile is compatible with the minimum frequencies observed in the analysis, i.e. if the investigation depth is lower than at least the maximum wavelength (preferably half the maximum wavelength); and (6) the Vs profile matches the minimum parametrization criterion, i.e. the number of analysed layers compatible with the experimental information. The QC allowed for the identification of about 1000 high-quality Vs profiles distributed over all the GGDs that were included in the final database (Fig. 3). The final data format used in the database for the Vs profile information is reported in Table 3.
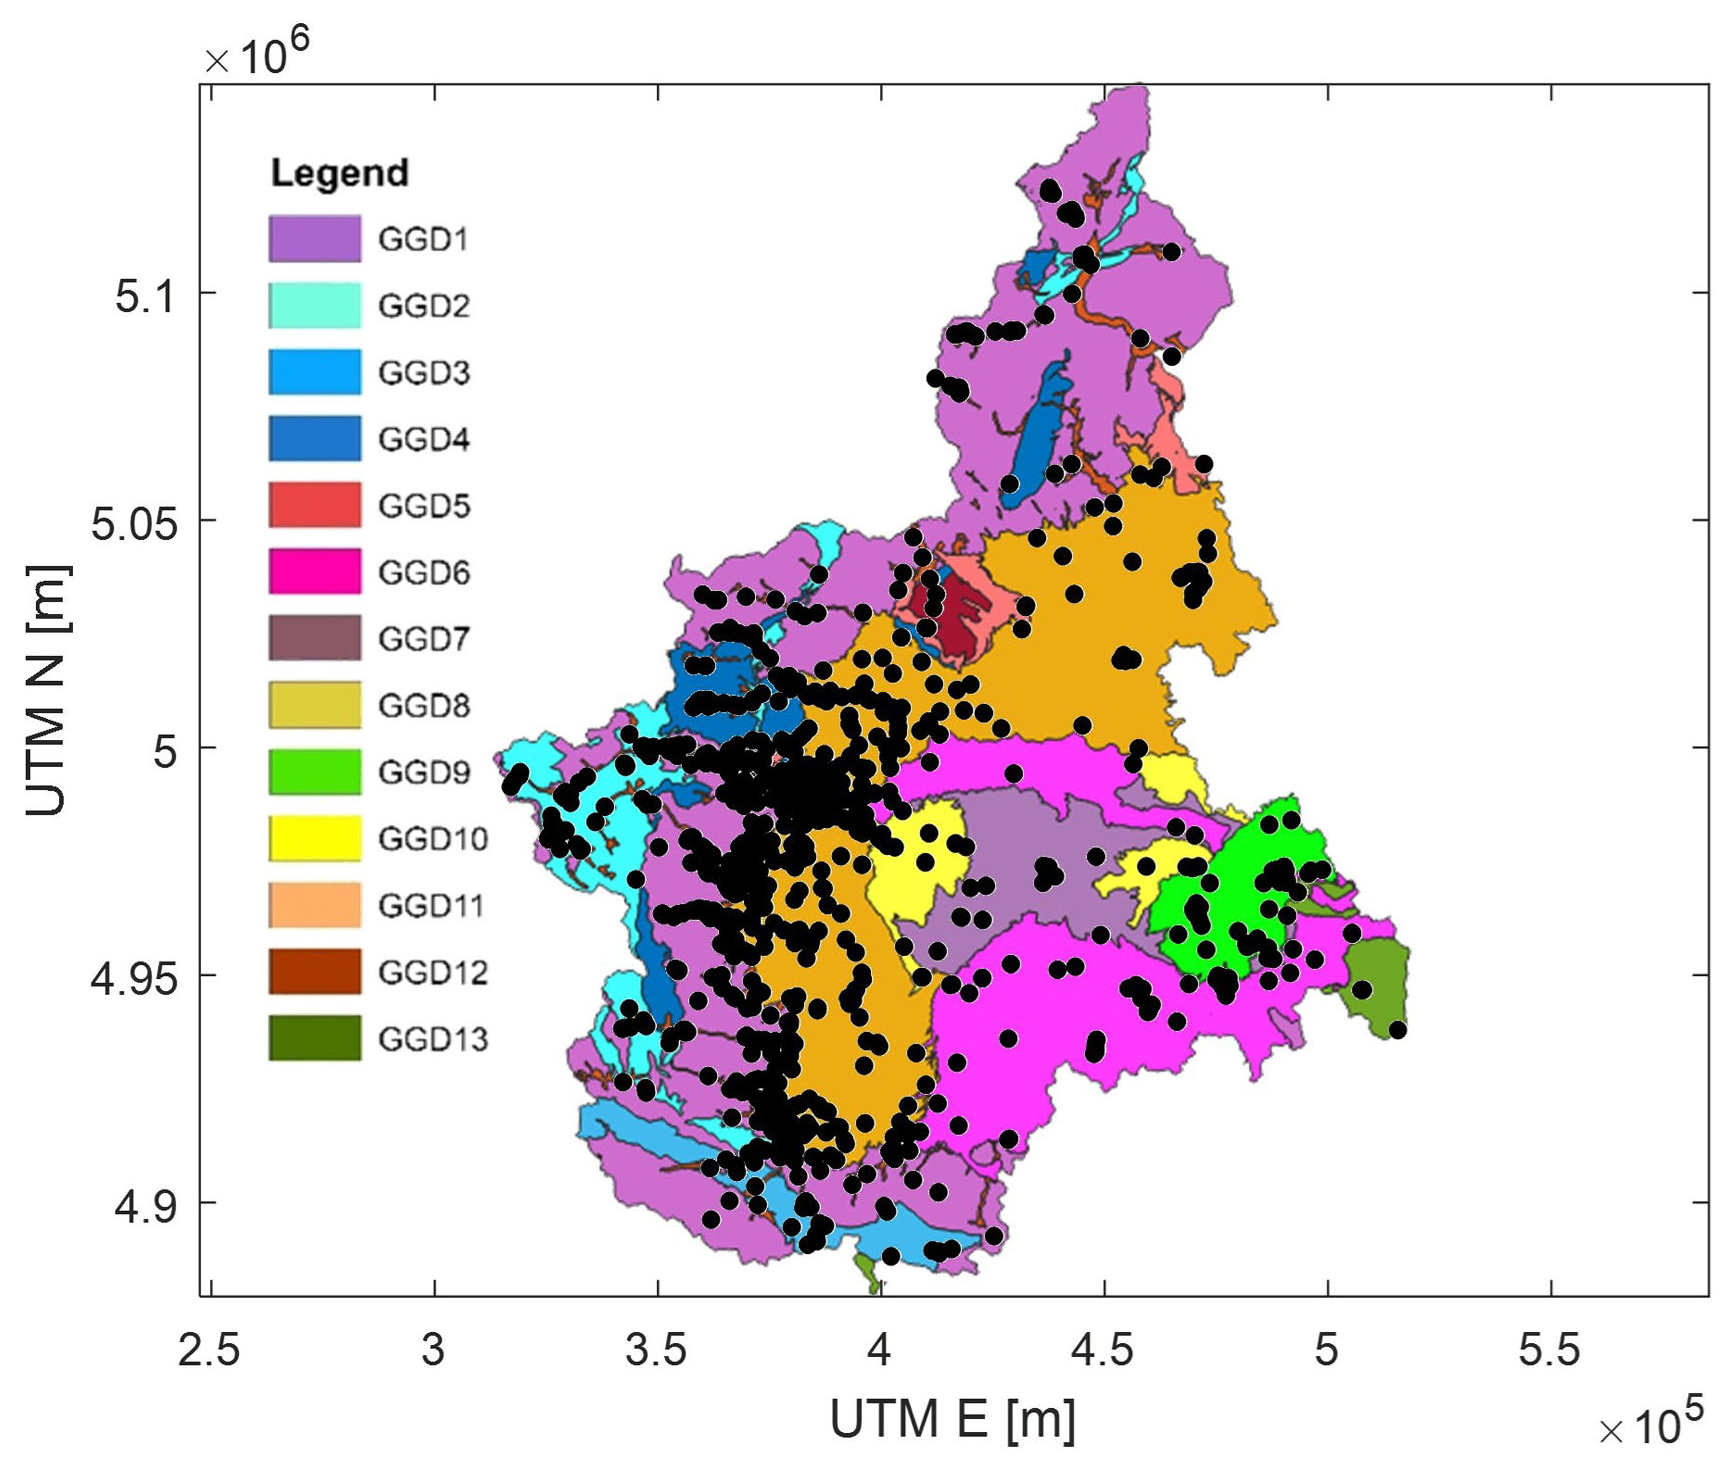
Figure 3Map of the GGDs' and the distribution of the Vs profiles (black dots) analysed (from Geoportale Arpa) after QC.
Table 3Data format for the geophysical information contained in the database. Data values for the attributes of depth of seismic layers and Vs values. UTM E and UTM N are the metric coordinate system used for their georeferentiation (WGS84 UTM32N).
Both geotechnical and geophysical data distribution is influenced by the aims for which the different field tests were conducted. For geophysical data in particular, most information is inherited by the seismic microzonation studies, performed mainly on the municipalities and settlements located within the Alpine valleys and at the border between the Alpine chain and the Po Plain in the western sector of the region, that is, the area with higher seismic hazard. Data results are therefore more concentrated within and around the main urban settlements and most populated areas that are the main targets for such types of studies (Fig. 3).
Nevertheless, the obtained data allow us to perform relevant analysis of the properties of the different materials characterizing each GGD. In particular, the final step of the workflow is the evaluation of specific Vs profile distribution within each GGD and their comparison among different GGDs. Also, plots of data property distributions at the regional scale were produced in order to evaluate their variability at the regional scale.
Presented below are the statistical analyses that characterize the database introduced in this work. These analyses provide detailed insights into the structure and distribution of the data, offering a comprehensive understanding of the regional Vs profile distribution and its relevance to geophysical modelling. Also, suggested applications of the data made available within the paper are briefly discussed in the view of a wider use of the database within the interested community. Further data elaboration and specific detailed analyses are, however, outside the scope of the paper, which is intended to present the database by itself and leave to potential users the autonomy on possibly conducting research on it.
The synthesis of the analysed parameters with respect to the Vs distribution for the different GGDs is reported in Table 4. Data distribution is not uniform among the GGDs due to the inhomogeneous geographical distribution of the data. The most populated GGDs are, respectively, GGD 8 (Po River plain) and GGD 5 (Alpine river valleys), whose results of the performed analysis are shown in Figs. 4 and 5.
Table 4Analysed parameters with respect to the Vs distribution for the different GGDs.
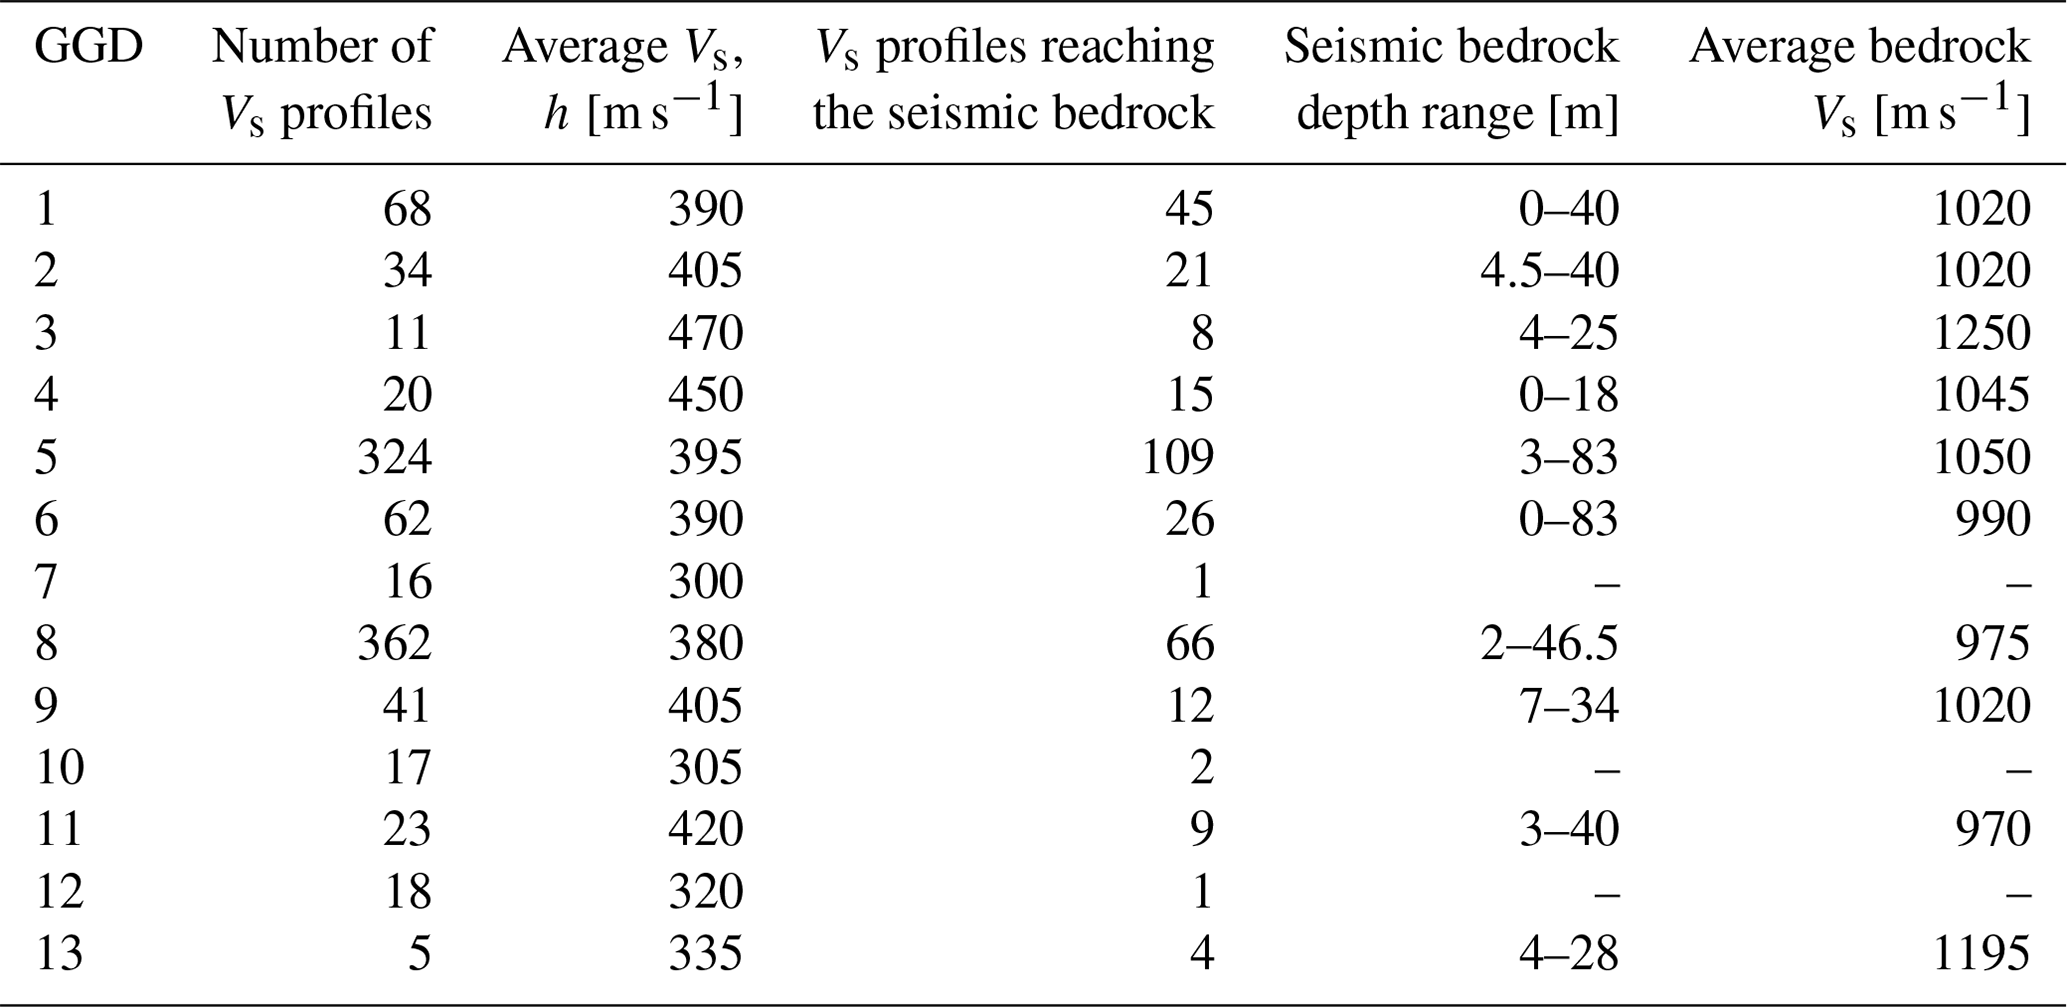
The higher population density of Vs profiles is within the GGD 8 (Po River plain), particularly next the city of Turin, and along the Alpine river floors (GGD 5), where most of the settlements are located. In these GGDs, 66 Vs profiles for GGD 8 and 109 for GGD 5 reached the seismic bedrock, considered Vs higher than 800 m s−1 (Figs. 4b and 5b). It is worth mentioning that in GGD 8, the distribution of profiles reaching the seismic bedrock is concentrated near the borders with the Alpine chain (Fig. 4a). The Vs, z distribution of the non-bedrock layers was also computed for each profile (Figs. 4c and 5c) together with the resulting Vs, h according to NTC (2018). That is, the depth h is the depth of the seismic bedrock if this is reached within 30 m; otherwise, it is 30 m. (Figs. 4d and 5d). The Vs, z is indeed usually considered a closer representation of the physics of the earthquake amplification along the soil profile than the Vs layered profile (Comina et al., 2022). This also allowed us to obtain a representative median Vs, z profile for the different GGDs (together with its standard deviation). The two GGDs show relatively similar distributions of both Vs, z and Vs, h, reflecting the similarities of the cover terrains within these domains (see also later sections for more comments on this aspect).
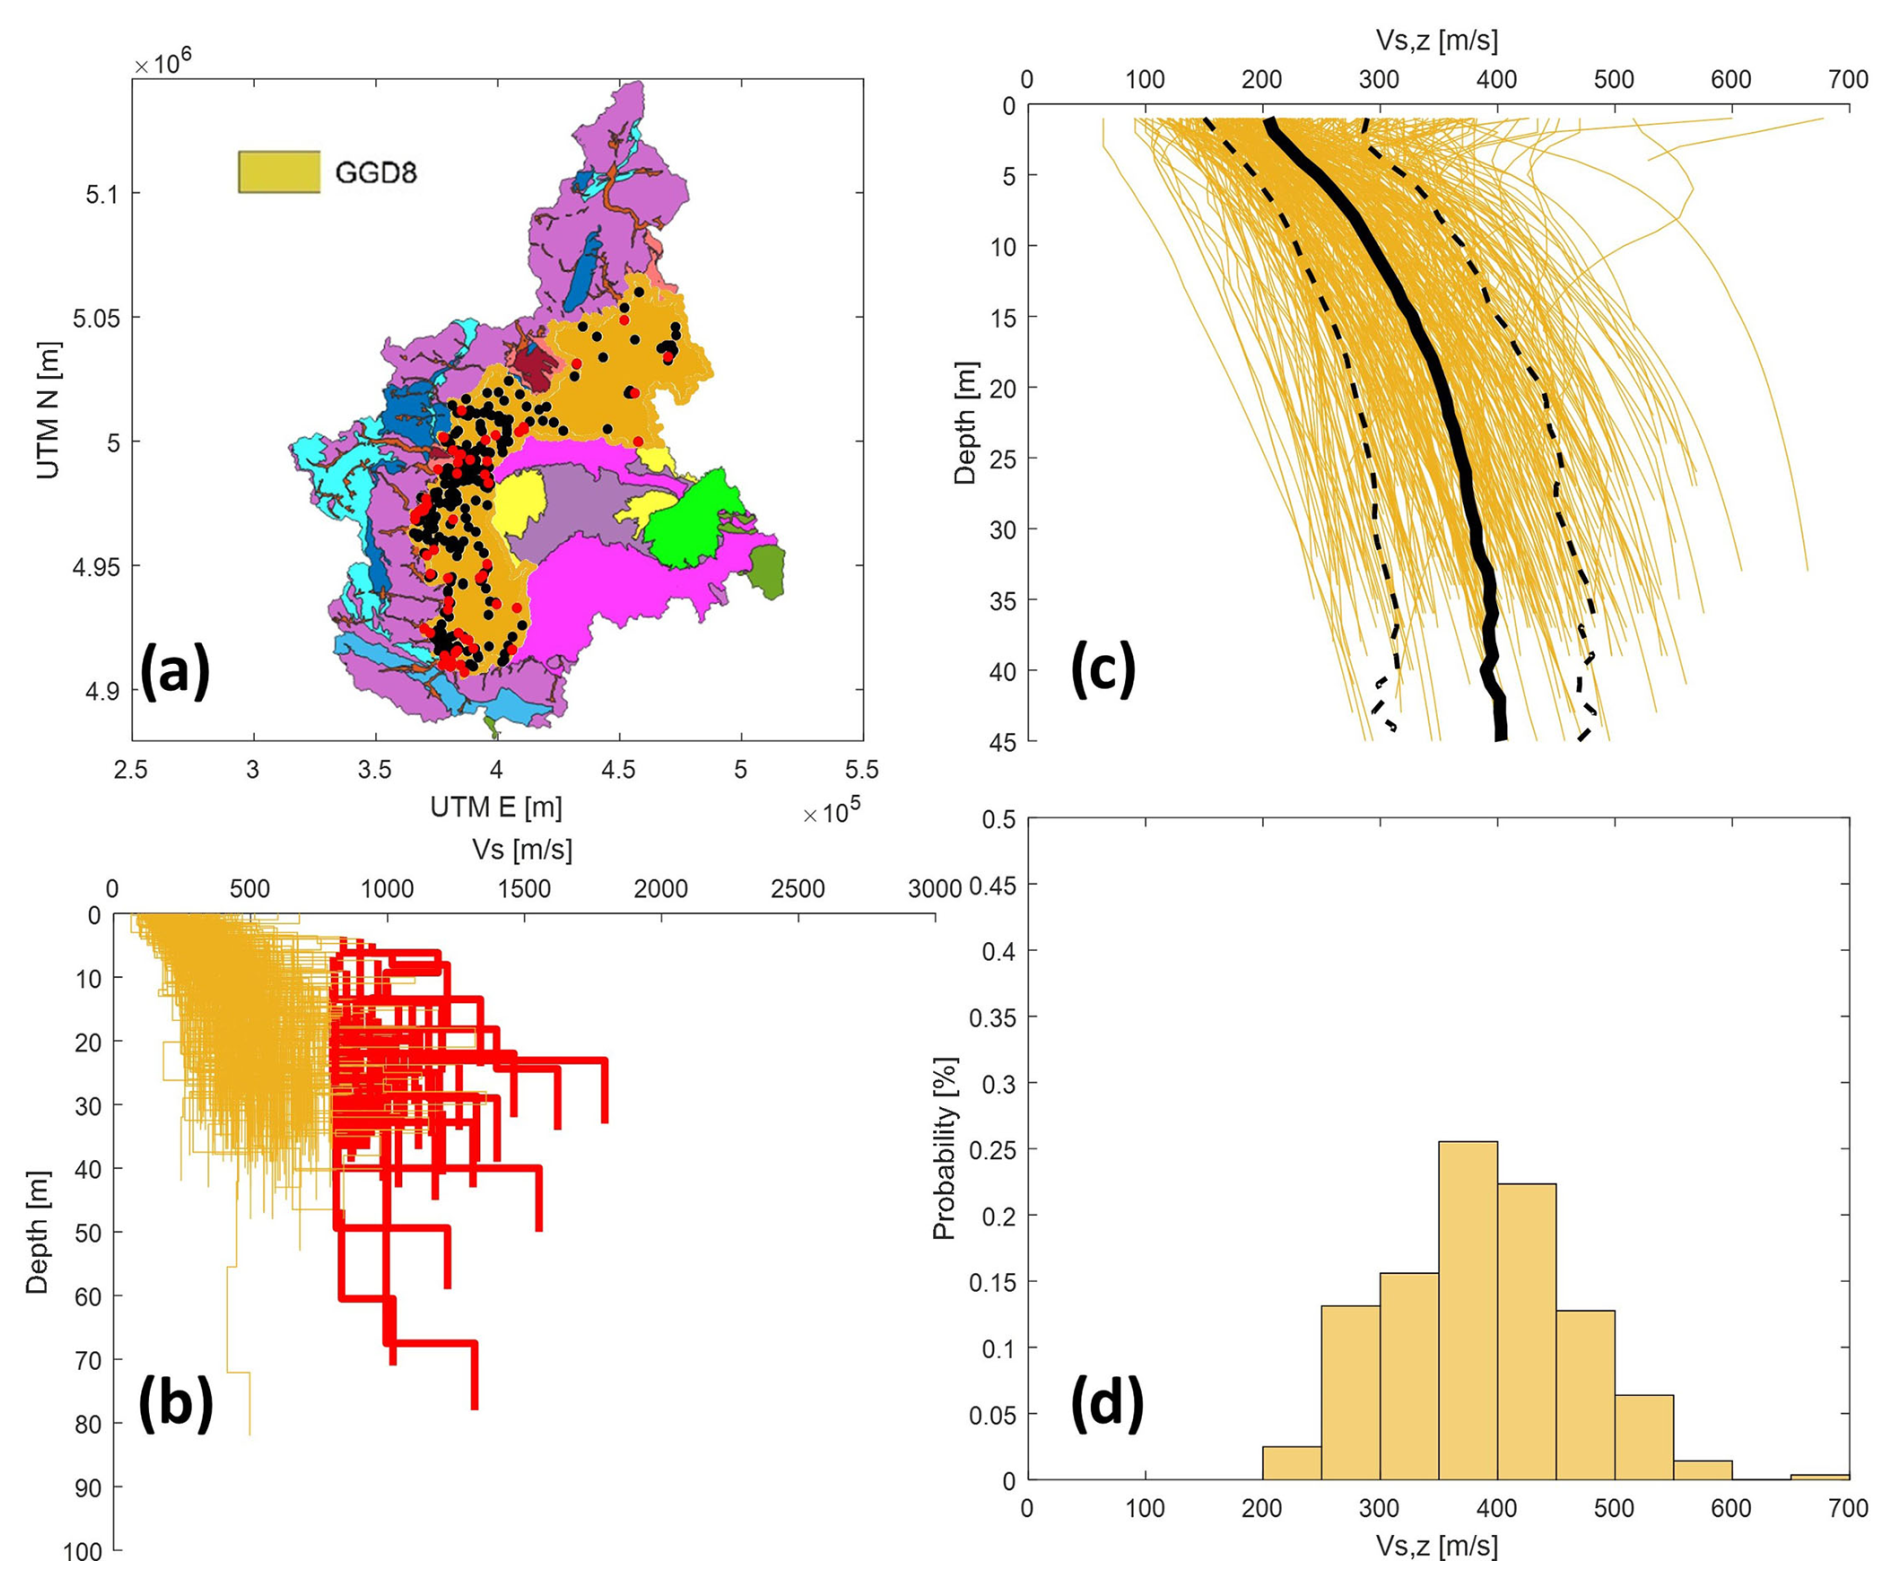
Figure 4The results of the analysis for GGD 8. (a) Vs profile geographical distribution (black dots) and Vs profiles reaching the seismic bedrock (red dots). (b) All Vs profiles (orange lines) indicating bedrock velocities (red lines). (c) Vs, z profiles for the cover terrains or weathered geological bedrock and their mean (continuous black line) and standard deviation (dashed black lines). (d) Vs, h distribution following NTC (2018).
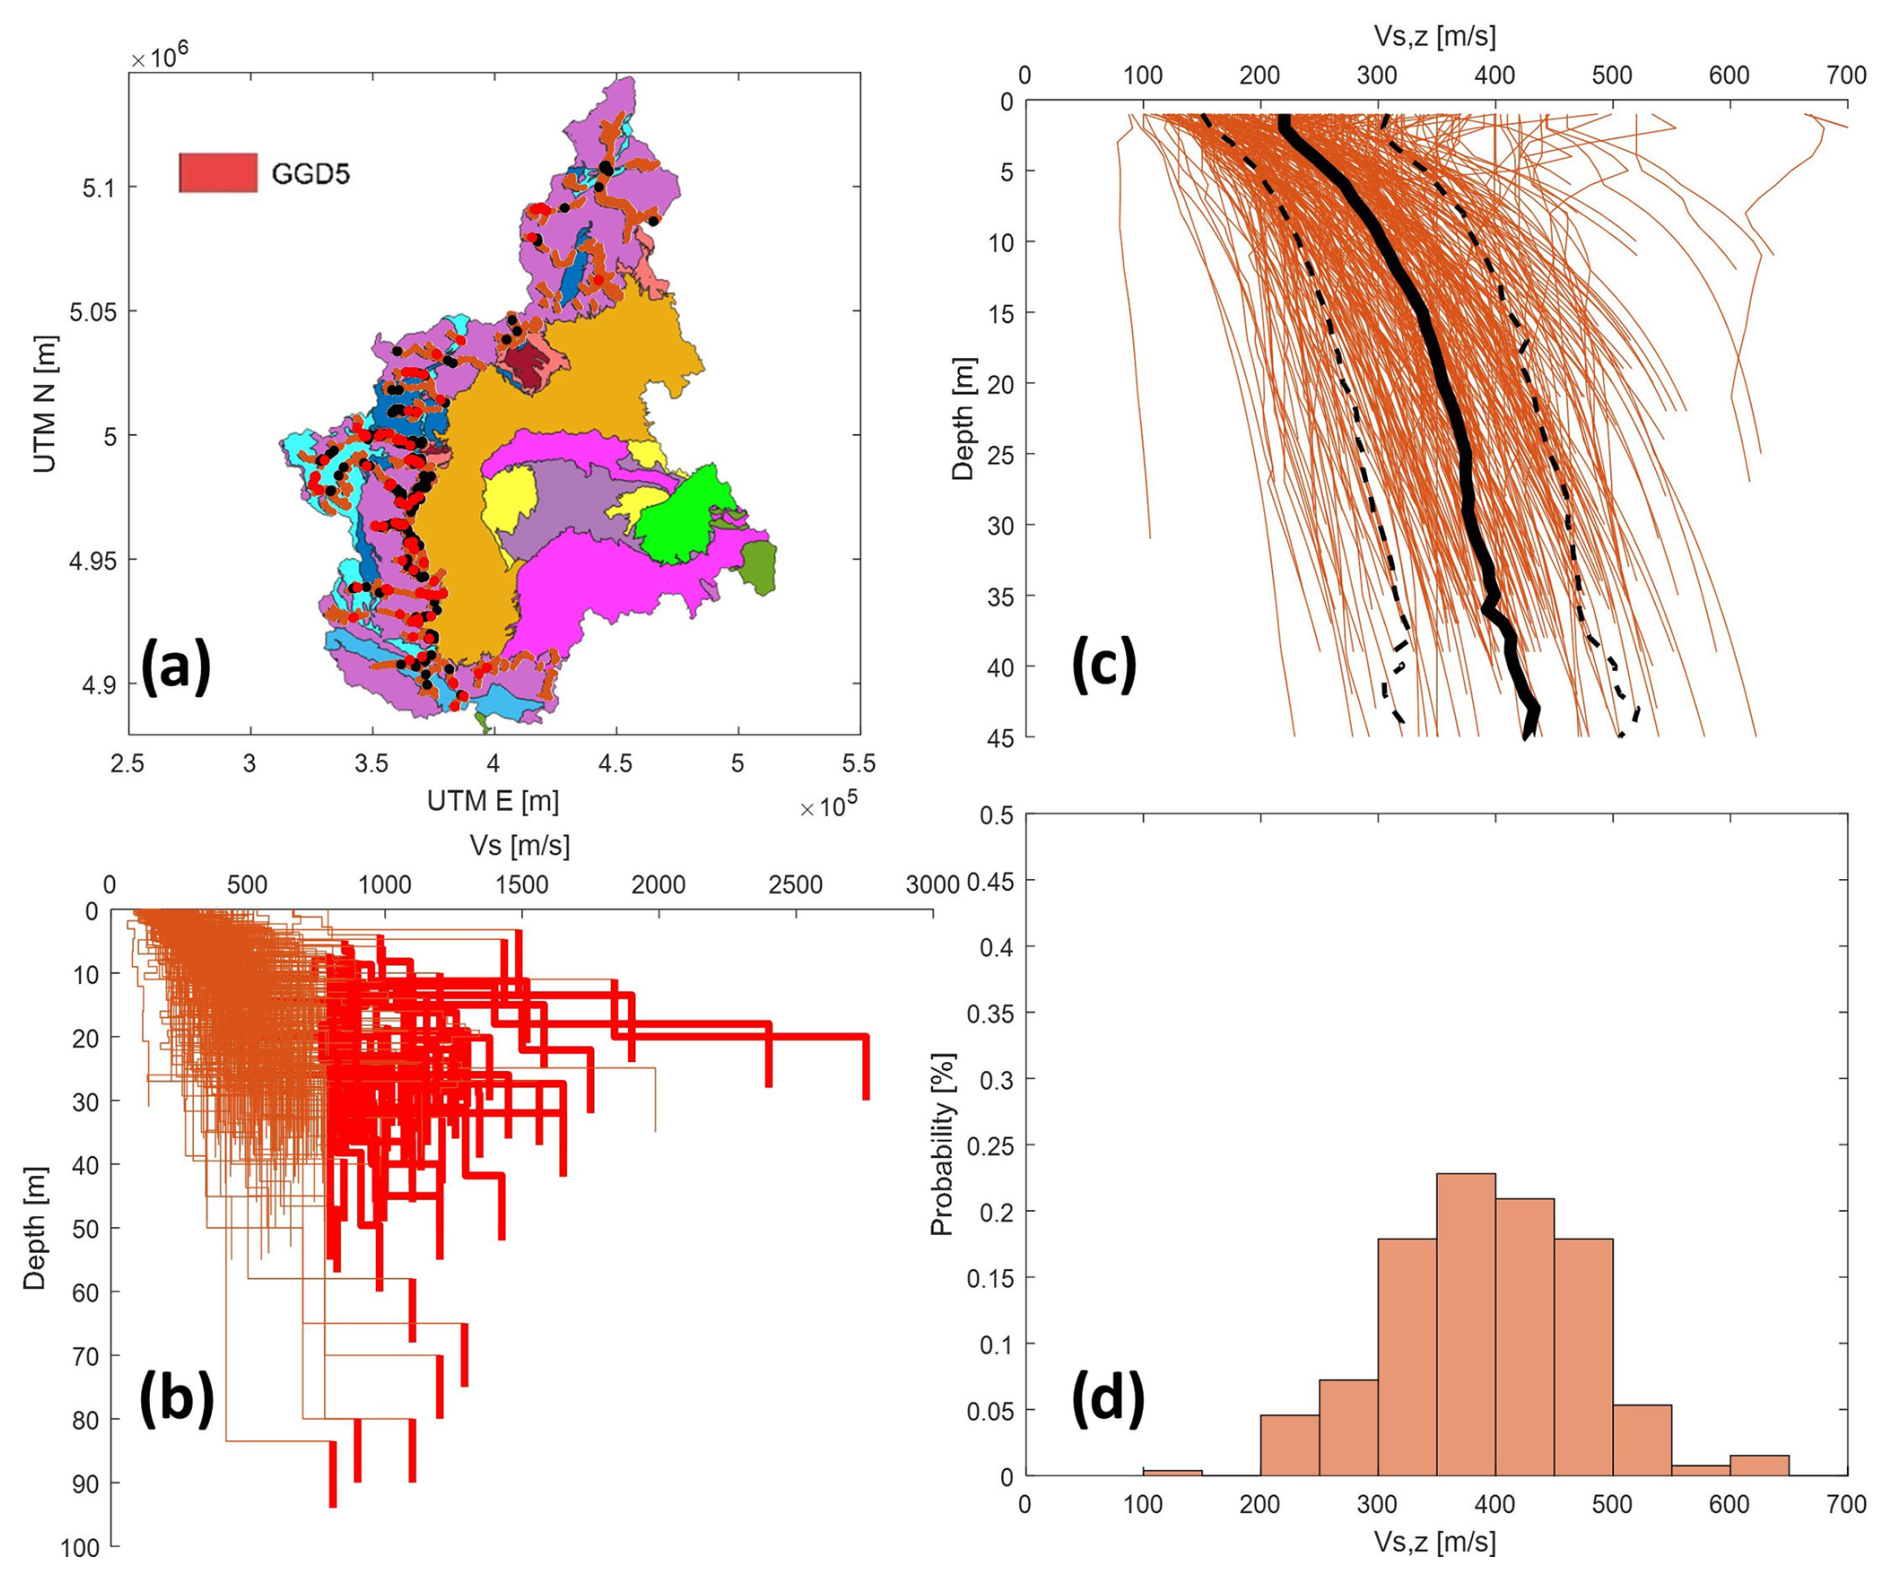
Figure 5The results of the analysis for GGD 5. (a) Vs profile distribution (black dots) and Vs profiles reaching the seismic bedrock (red dots). (b) All Vs profiles (orange lines) indicating bedrock velocities (red lines). (c) Vs, z profiles for cover terrains or weathered geological bedrock and their median (continuous black line) and standard deviation (dashed black lines). (d) Vs, h distribution following NTC (2018).
Based on available data from all the GGDs, keeping in mind the representativeness of the results as a function of data coverage and distribution, the median Vs profile and its corresponding uncertainty as a function of depth were also calculated following the approach by Toro (2022). This calculation captures the central tendency of the profiles, evaluated at 1 m intervals for each GGD, with uncertainty characterized by the logarithmic standard deviation (σlnV). These analyses were performed on all the GGDs, with the exception of GGD 13, which contains very few Vs profiles and result therefore not statistically significant. The median Vs profiles, accompanied by uncertainty bands equal to ±1 standard deviation, highlight the differences between the different GGDs (Fig. 6).
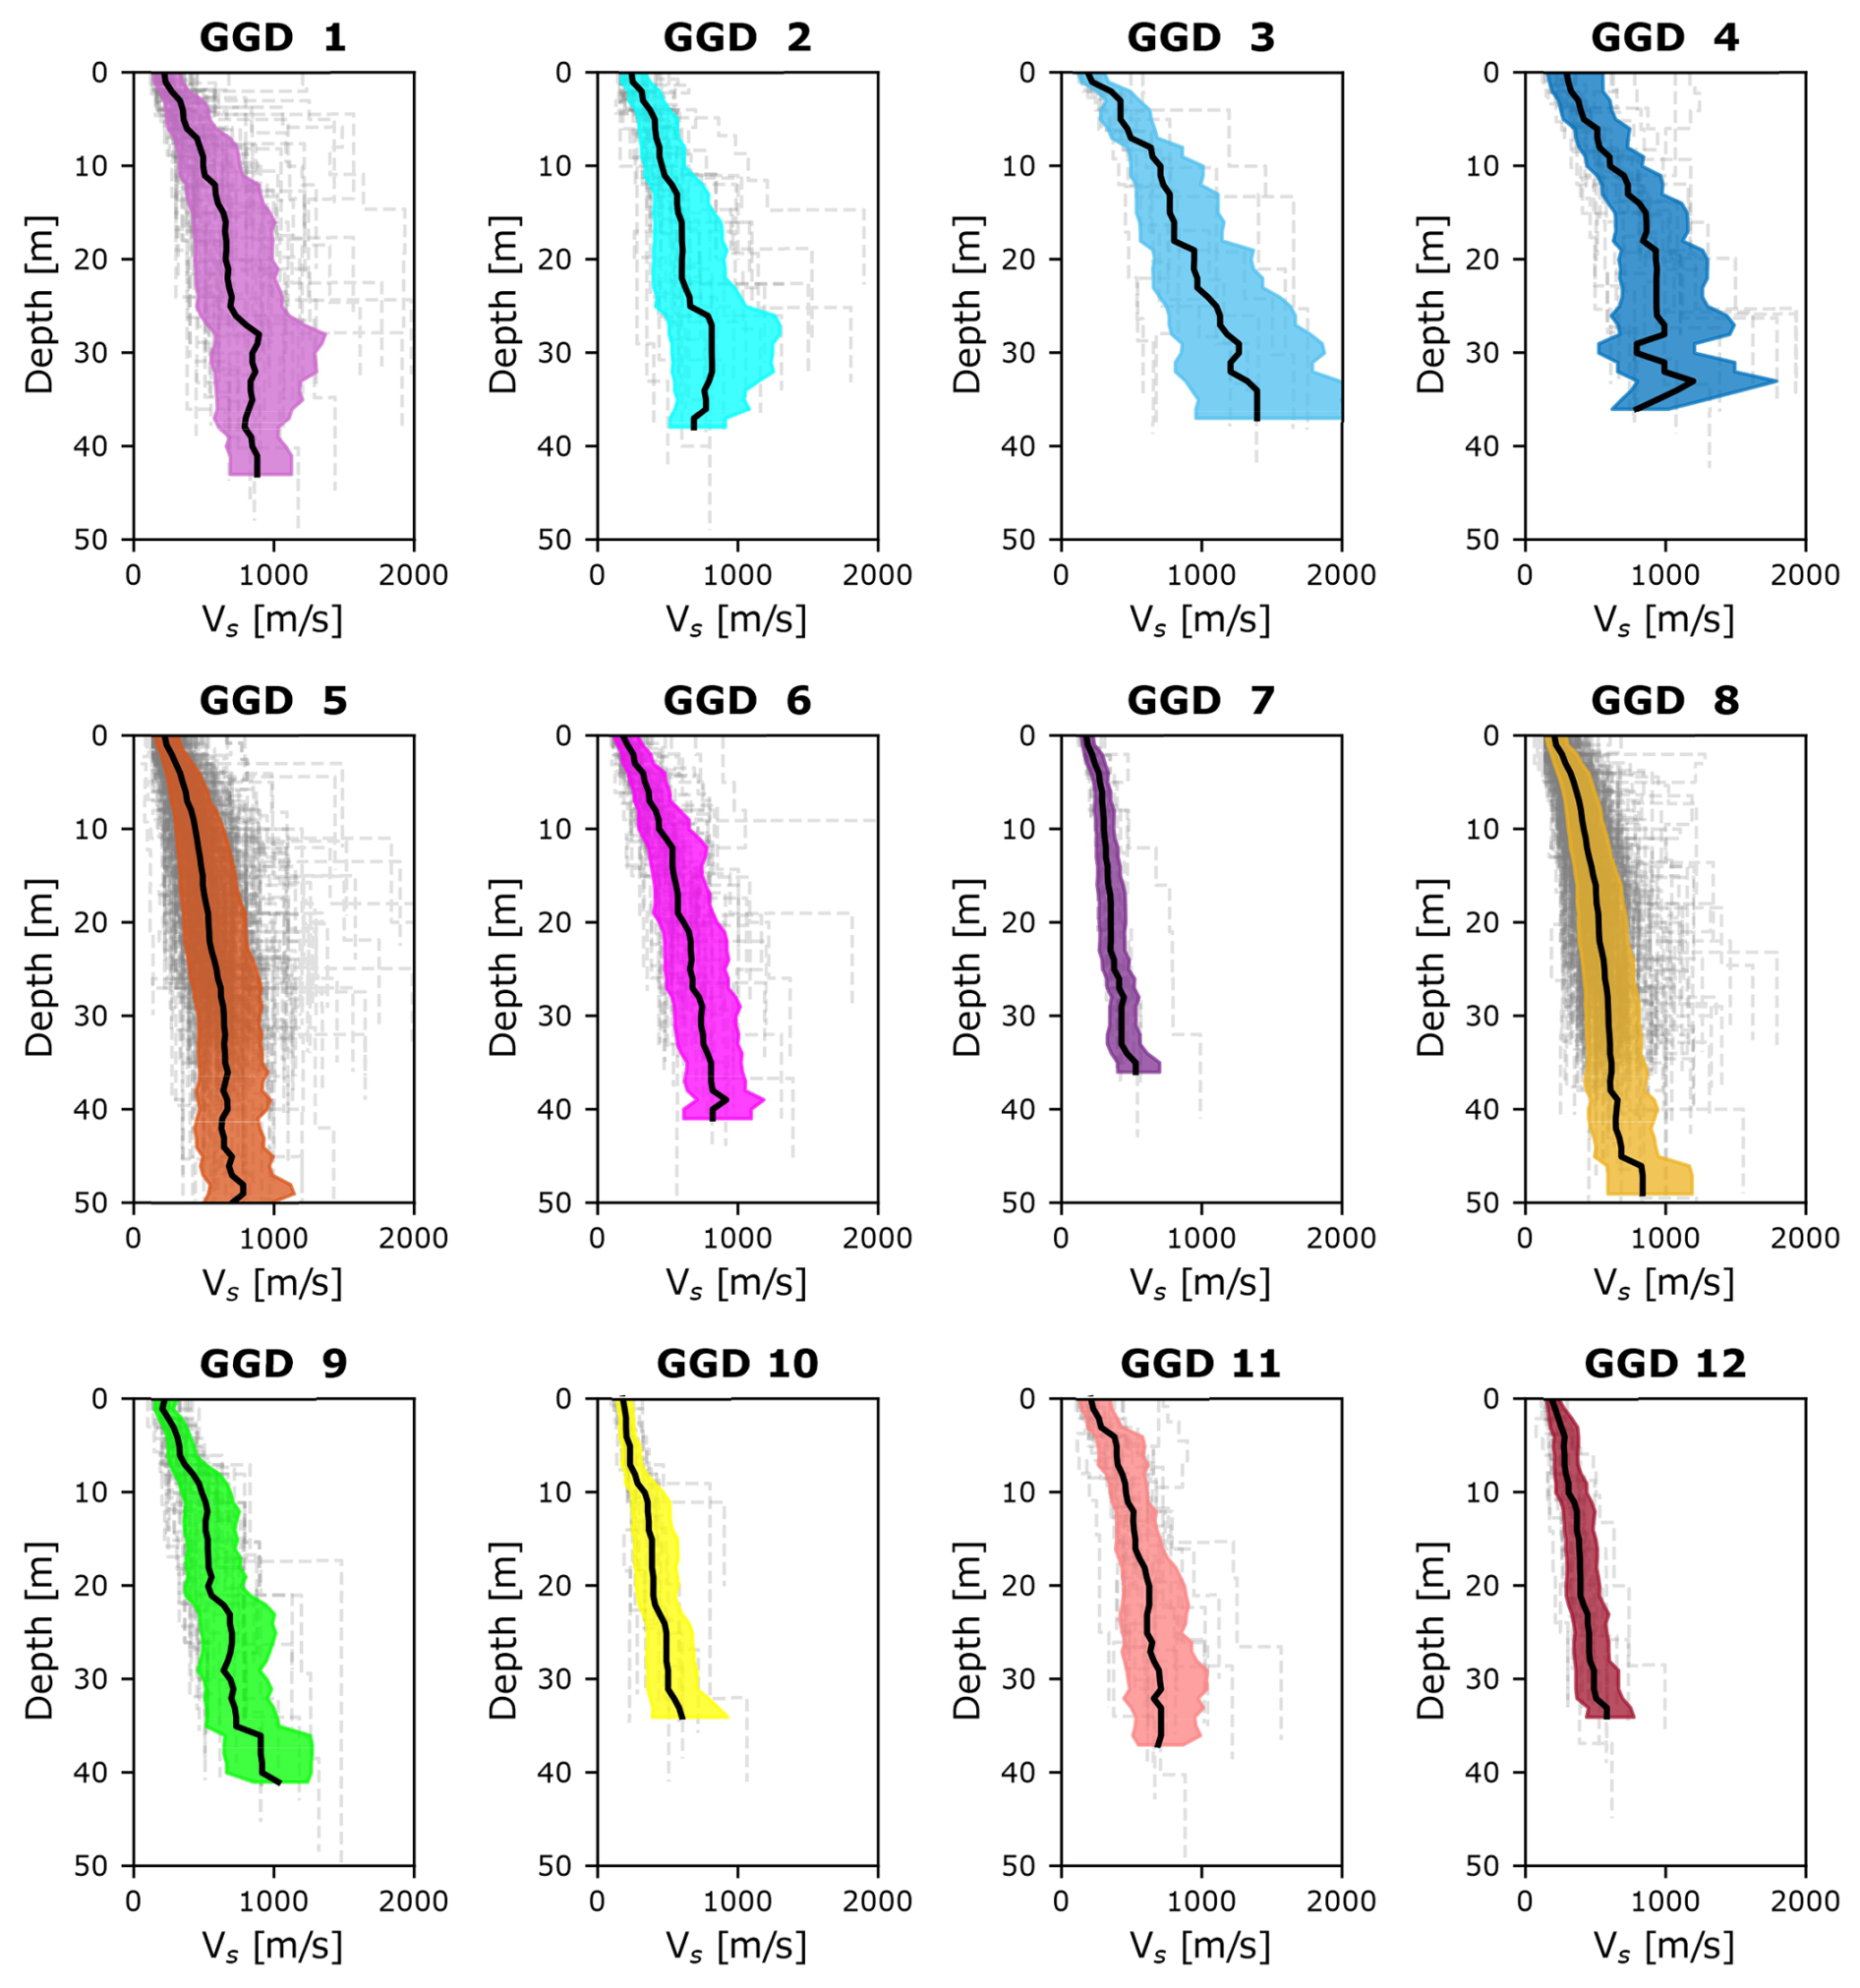
Figure 6Median Vs profiles (black line) with uncertainty bands of ±1 standard deviation (coloured area) as σlnVs. For each panel, the GGD code is indicated, and the Vs profiles used to calculate the median are represented by dashed grey lines.
When a high number of profiles are available and layer boundaries are not concentrated at specific depths (e.g. in geologically different settings), the median profile tends to be smooth (Toro 2022). Some median Vs profiles show larger uncertainty (e.g. GGD 1, GGD 2, GGD 3 and GGD 4) compared to others that exhibit less variability (e.g. GGD 5, GGD 7, GGD 8 and GGD 12) regardless of the number of profiles available for the calculation. Specifically, profiles GGD 5 and GGD 8 show lower uncertainty and a smoother trend with depth despite being derived from a higher number of profiles.
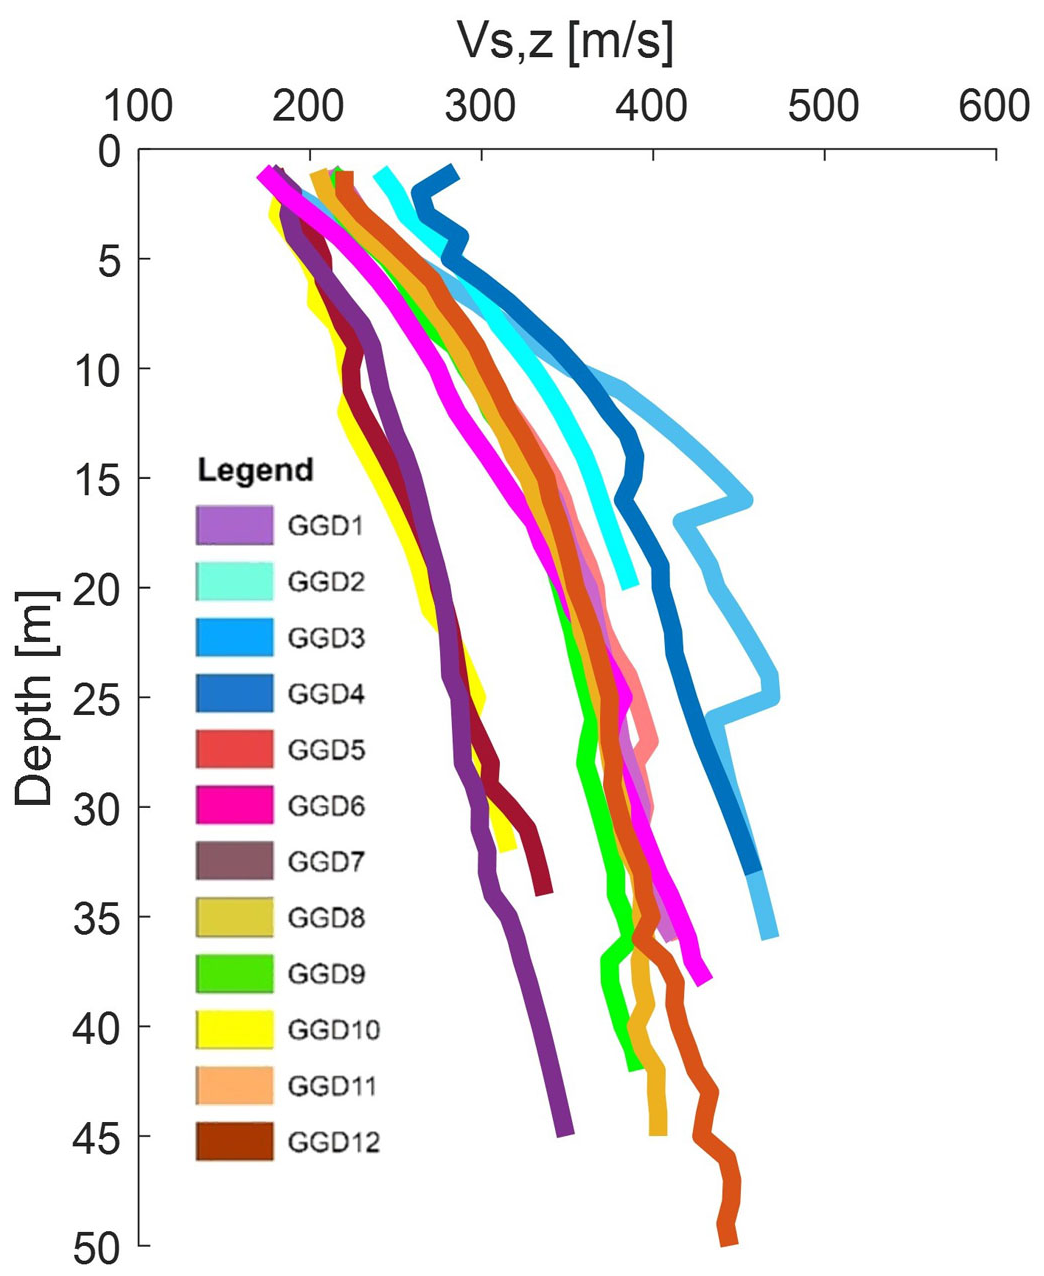
A similar procedure was also applied in terms of median Vs, z profiles to the different GGDs (Fig. 7). This analysis allows for the estimation of uncertainty and provides insight into the trend of the Vs, z profiles as a function of depth. Also, specific analyses of the median Vs, z profiles of the only cover terrains were performed. These last results are reported in terms of the only median profiles in Fig. 8, grouping all the GGDs (with the exception of GGD 13) to allow for more specific comparison of the velocity distributions.
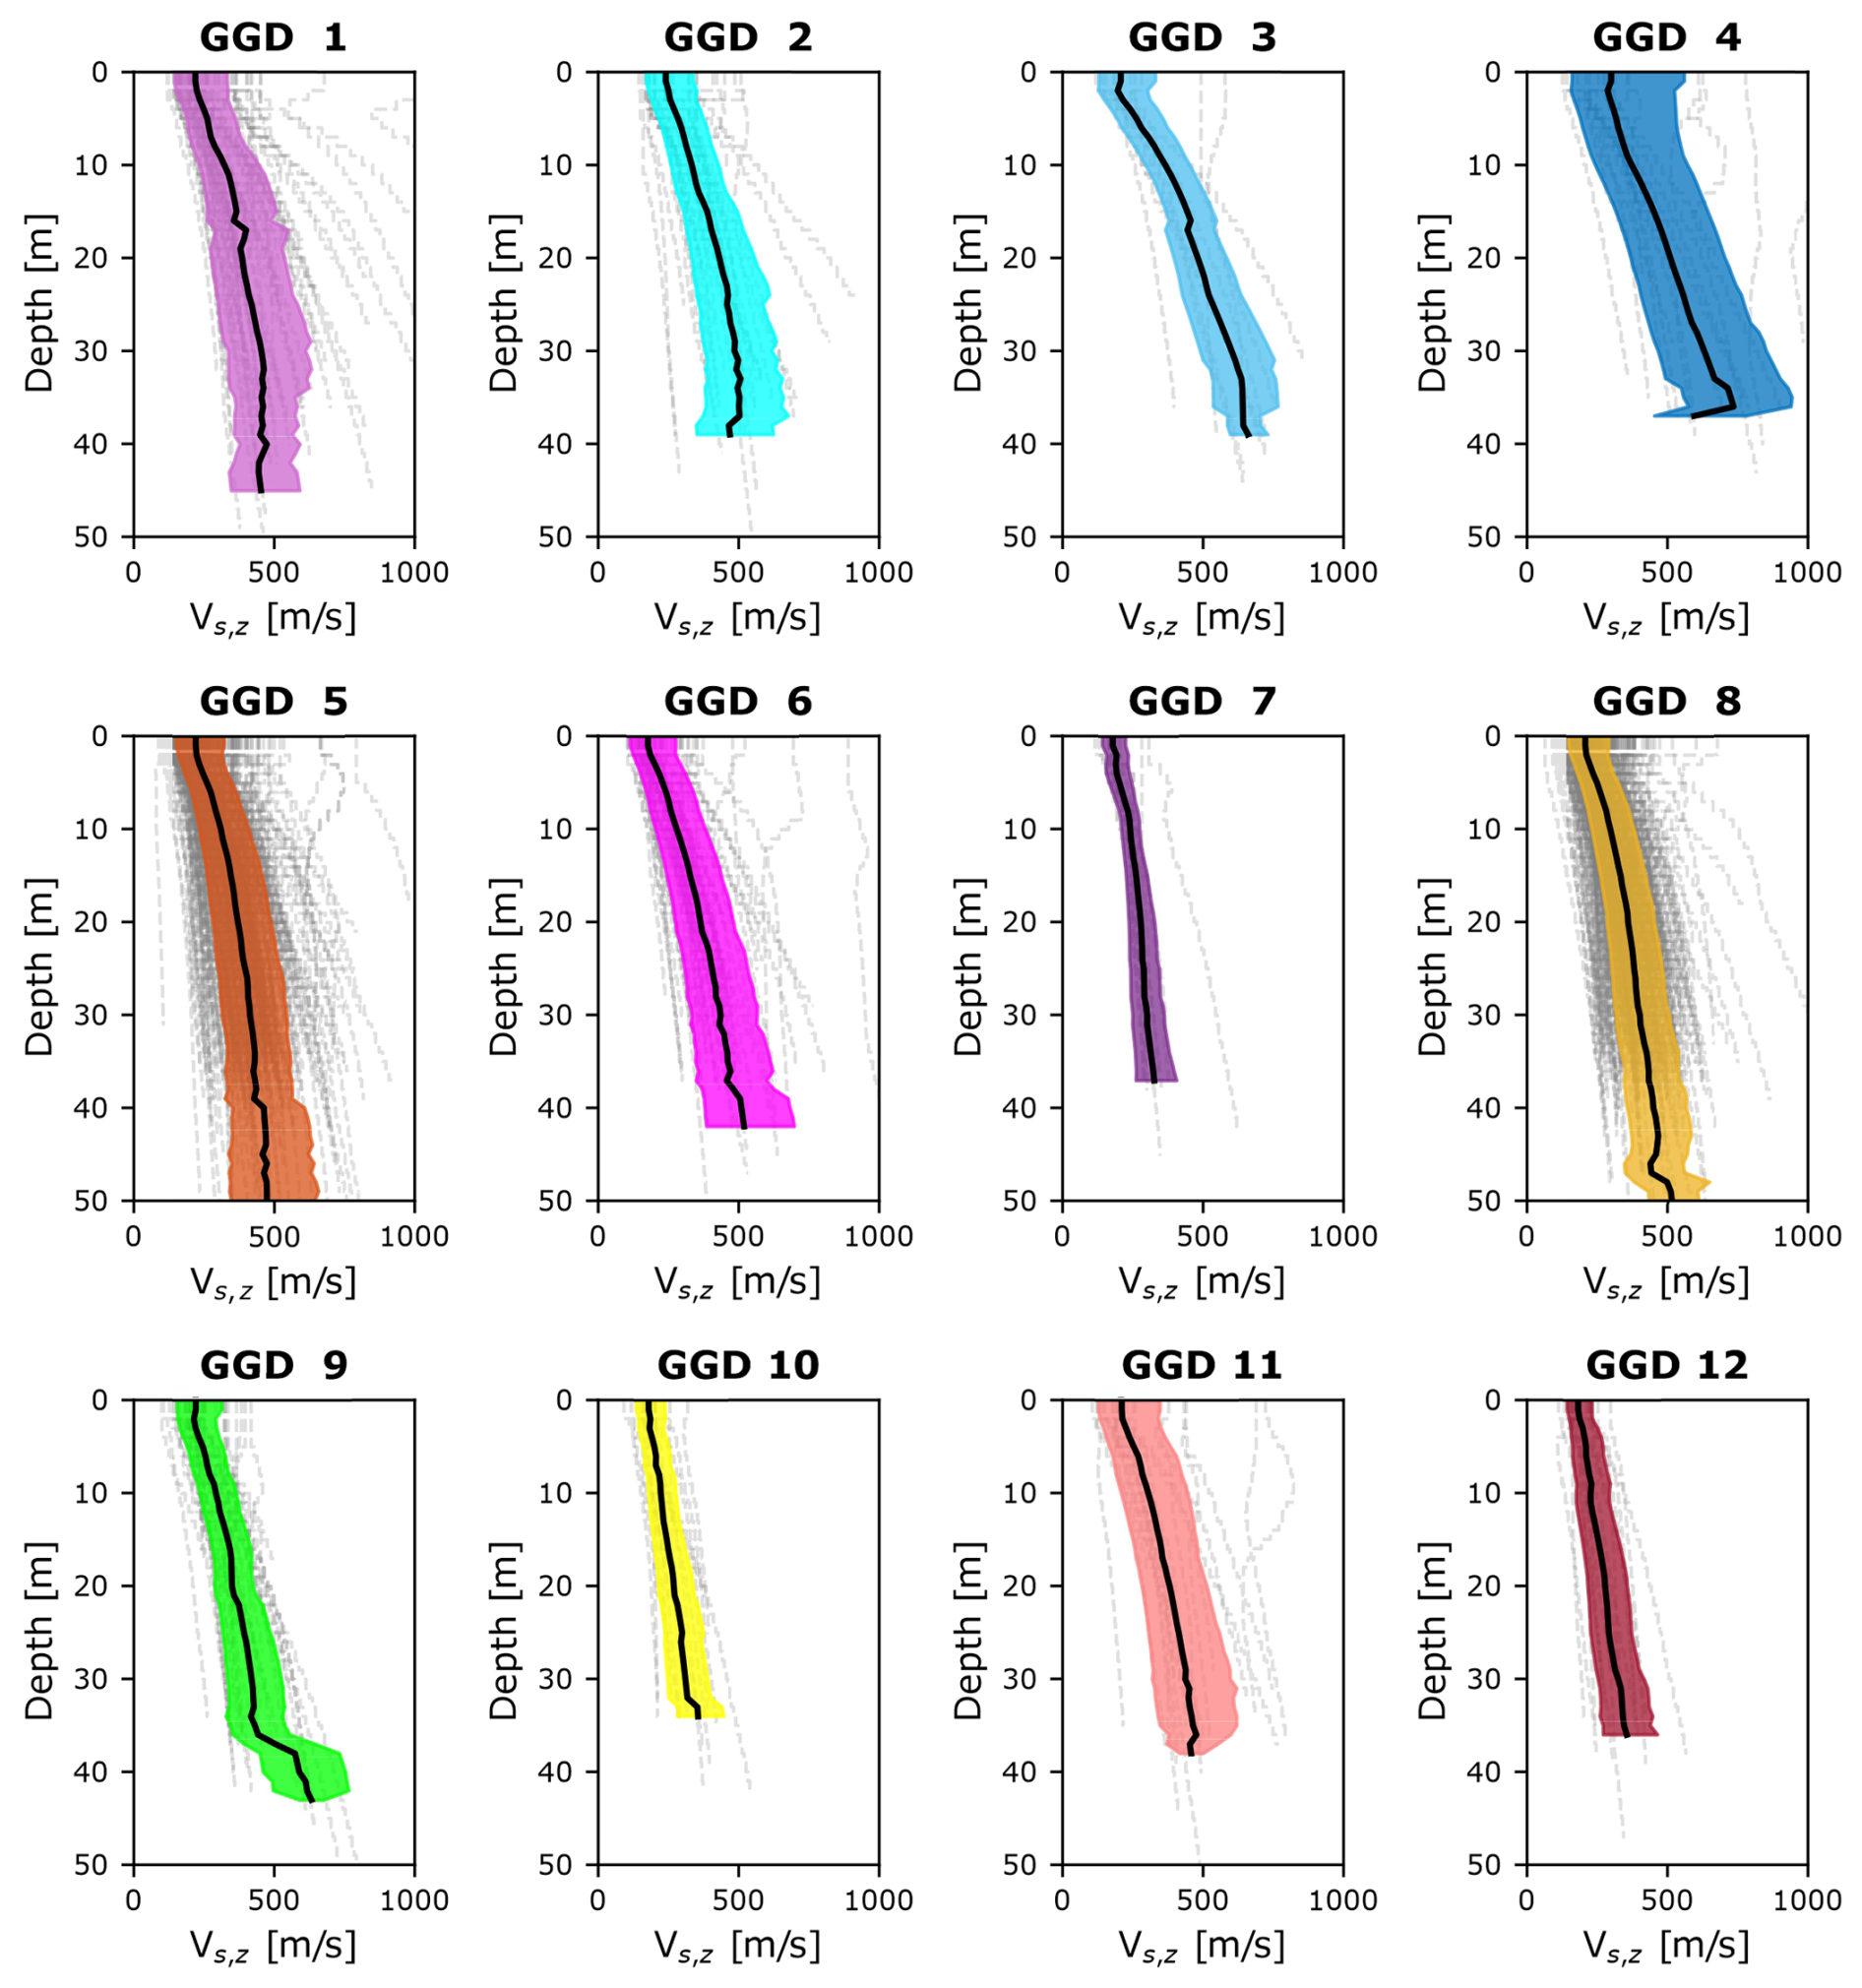
Figure 7The median Vs, z profiles are shown (black line), with uncertainty bands of ±1 standard deviation (coloured area) representing σlnVs,z, for different GGDs. Each panel displays the GGD code, and the Vs, z profiles used to calculate the median are indicated by dashed grey lines.
The distribution of the median Vs, z profiles shows groups of GGDs with very similar behaviour and reflecting similar properties of the cover terrains. In this respect, the different GGDs were initially selected only on the basis of the geological information, and the Vs distribution over the GGDs is considered a second step of the research in order to check if geological diversities correspond to different values of seismic velocity. Indeed, taking into account the uncertainties, the 13 proposed GGDs may be simplified further. In fact, the median Vs profile of one GGD may fall within the standard deviation boundaries of another (see Fig. 7). Therefore, some GGDs may be grouped together based on the Vs profile values and their uncertainty. In particular, the GGDs that fall within the Alpine chain (GGDs 2 to 4) show higher Vs, z distributions with depth (see Fig. 8), which is different to the others due to the presence of very coarse-grained cover terrains, typically along the slopes (debris-slope, glacial, fluvio-glacial) or within the valley floors (alluvial, alluvial fan, glacial, fluvio-glacial), whose thickness is in the 3–100 m range. Conversely, GGD 7 (hilly Pliocene basins), 10 (hill river plains) and 12 (fluvio-lacustrine) showed lower Vs, z distributions with depth (see Fig. 8), reflecting the mainly fine-grained (sands, silts, clays and minor gravels) slope, alluvial and lacustrine deposits up to 50 m thick.
Following a global approach to the data analysis, the median Vs, z profiles and their standard deviations, eventually merged between similar GGDs, could be adopted as the basis for randomization and amplification simulations within the region or in similar geological contexts. For this purpose, specific randomization approaches, based on the same Vs, z (Passeri et al., 2020) or on usually adopted Vs randomization criteria (e.g. Toro, 2022), could be adopted using the data contained in the database as a fundamental starting point. This proposed global approach allows us to overcome the limitations inherited by the uncertainties in the specific litho-stratigraphic settings within each GGD due to the regional scale of observations.
As an example, the approach proposed by Romagnoli et al. (2022), which aimed to estimate a power law model of the trend of Vs values with depth, was adopted. This model can be reported in linear terms following the form:
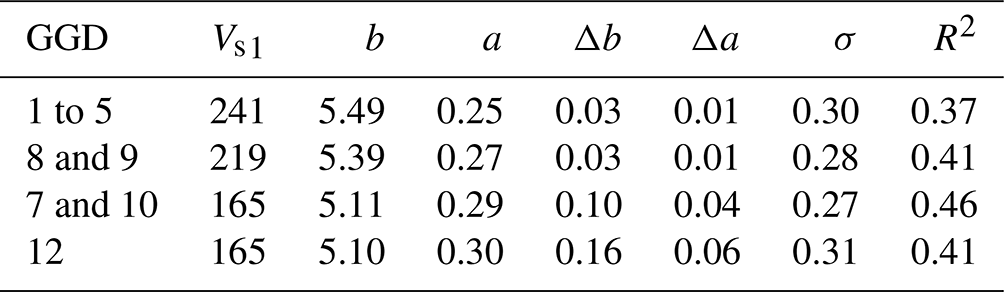
where z represents the depth and a and b are empirical parameters determined through the linear regression of Vs profiles. In particular, the term b represents the value of ln(Vs1), the Vs at a depth of 1 m, while the term a modulates the gradient of Vs with depth. Through regression, it is also possible to determine the standard deviation (σ) and determination coefficient (R2) associated with this law as well as the 95 % confidence intervals (Δa and Δb) associated with the estimate of a and b. These parameters can allow for further judgement on the effectiveness of the merging of different GGDs in a unique group or on the real differences among the various GGDs. This approach was tested by merging some GGDs which should share similar geological characteristics or Vs distributions: (i) the merged group of GGDs within the Alpine chain (i.e. 1 to 5), (ii) the merged group of GGDs within river plains (i.e. 8 and 9), (iii) the merged group of GGDs 7 (hilly Pliocene basins) and 10 (hill river plains), and (iv) the GGD 12 (fluvio-lacustrine). As it can be seen in the results of these analyses, reported in Table 5, both Alpine chain and river plain GGDs show increased values of Vs1 and b parameters with respect to Pliocene, Oligocene–Miocene and fluvio-lacustrine GGDs. As already commented above, these differences reflect the prevailing lithologies of the GGDs with higher velocities for coarse-grained cover terrain in the first case and mainly fine-grained cover terrain in the second case.
Table 5Analysed parameters for the power law Vs distribution among some example GGDs.
Moreover, the collected data allowed us to produce maps of relevant seismic parameters at the regional scale. Maps deriving from geological/geotechnical and geophysical information contained in the database were produced in the Surfer (Golden Software LLC) environment considering a uniform interpolation grid of about 2 km for all the data.
The map of the prevalent geological–technical properties of the cover terrains within the first 30 m (Fig. 9) shows the distribution based on the stratigraphical logs. The distribution of the cover terrain properties matches the geological–geomorphological information adopted for the GGD definition. Prevalent coarse-grained cover terrains (gravels and pebbles to boulders) are distributed along the Alpine domains (GGDs 1 to 4), within the Alpine valley floors (GGD 5), and within the Alpine and Apennine alluvial plains (GGDs 8 and 9). Finer-grained cover terrains (i.e. sands, silts and clays) characterize the Oligocene–Miocene and Pliocene basins (GGDs 6 and 7) and hill river plains (GGD 10). A comparison with respect to the distribution of subsoil properties for GGD 8 and GGD 6, clearly reflecting what is commented on above, is reported in Fig. 10.
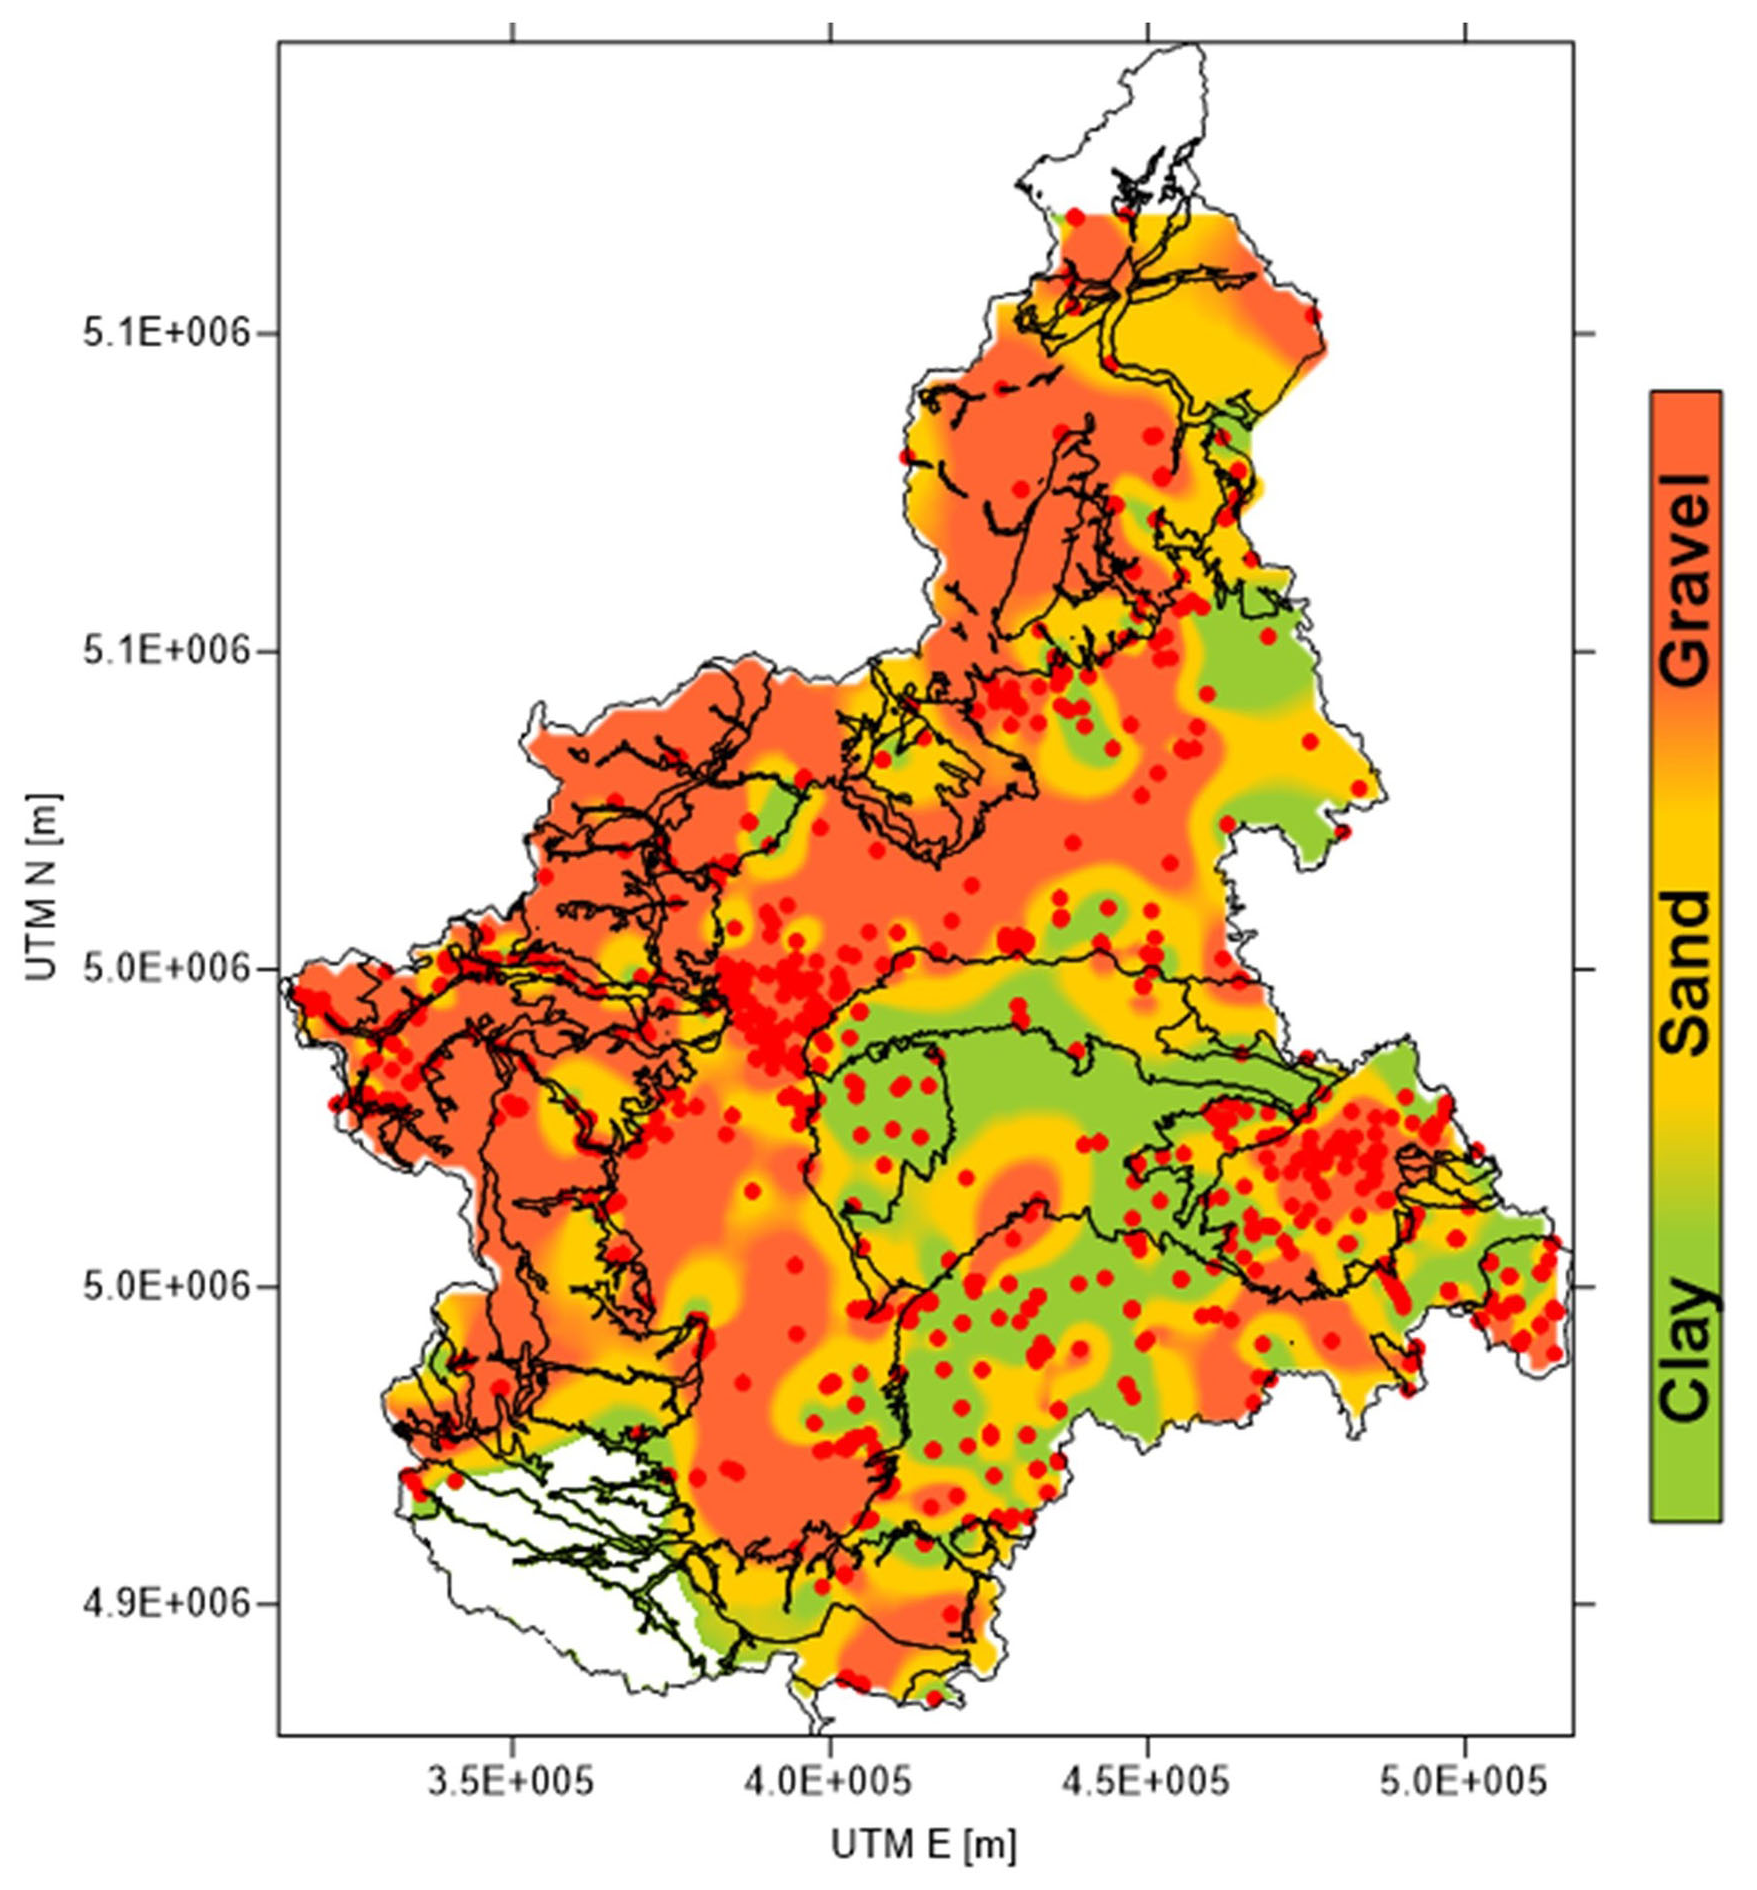
Figure 9Geological/geotechnical information derived by the stratigraphical logs database: map of the prevalent properties of the cover terrains within the first 30 m.
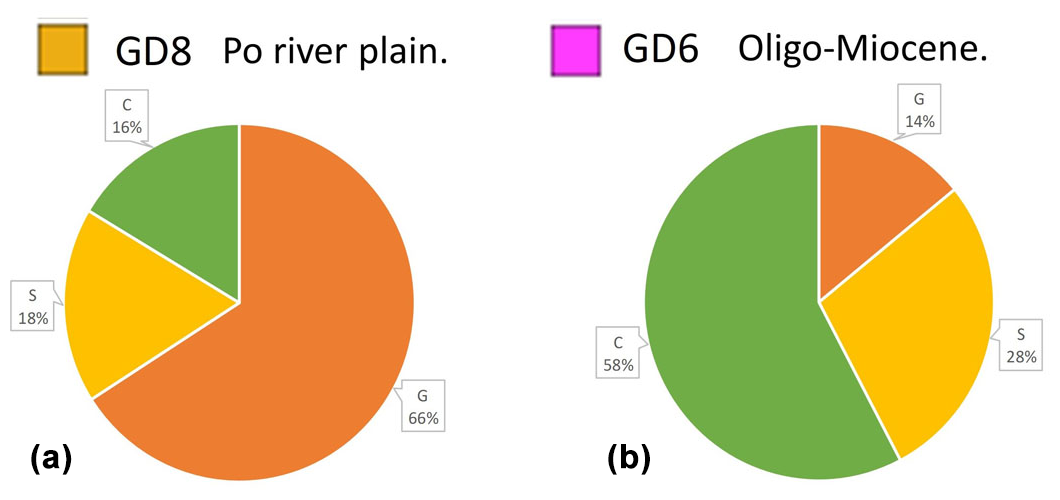
Figure 10Comparison on the distribution of cover terrains properties within the first 30 m for GGD 8, on the left, and GGD 6, on the right.
For ground response evaluations, this type of information is essential for the analysis of the subsoil nonlinear hysteretic behaviour. This is indeed usually described through appropriate shear modulus reduction and damping ratio curves. In common practice, in absence of specific laboratory tests, these curves can be estimated by employing empirical regression models (e.g. Vucetic and Dobry, 1991; Darendeli, 2001; Ciancimino et al., 2020; Wang and Stokoe, 2022), calibrated on large experimental datasets (e.g. Gaudiosi et al., 2023; Ciancimino et al., 2023), to correlate the soil physical properties and their statistical distribution in the investigated units with their nonlinear hysteretic behaviour. In this respect, the information contained in the database presented in this work can be adopted as key data for large-scale regional hazard assessments or in similar geological contexts.
Further essential complementary information for ground response analyses is the evaluation of the thickness of the cover terrains, i.e. the bedrock depth. In this respect, using the data from the database, the estimated geological bedrock depth distribution from stratigraphic logs (Fig. 11) and the seismic bedrock depth distribution based on Vs profiles (Fig. 12) have been compared.
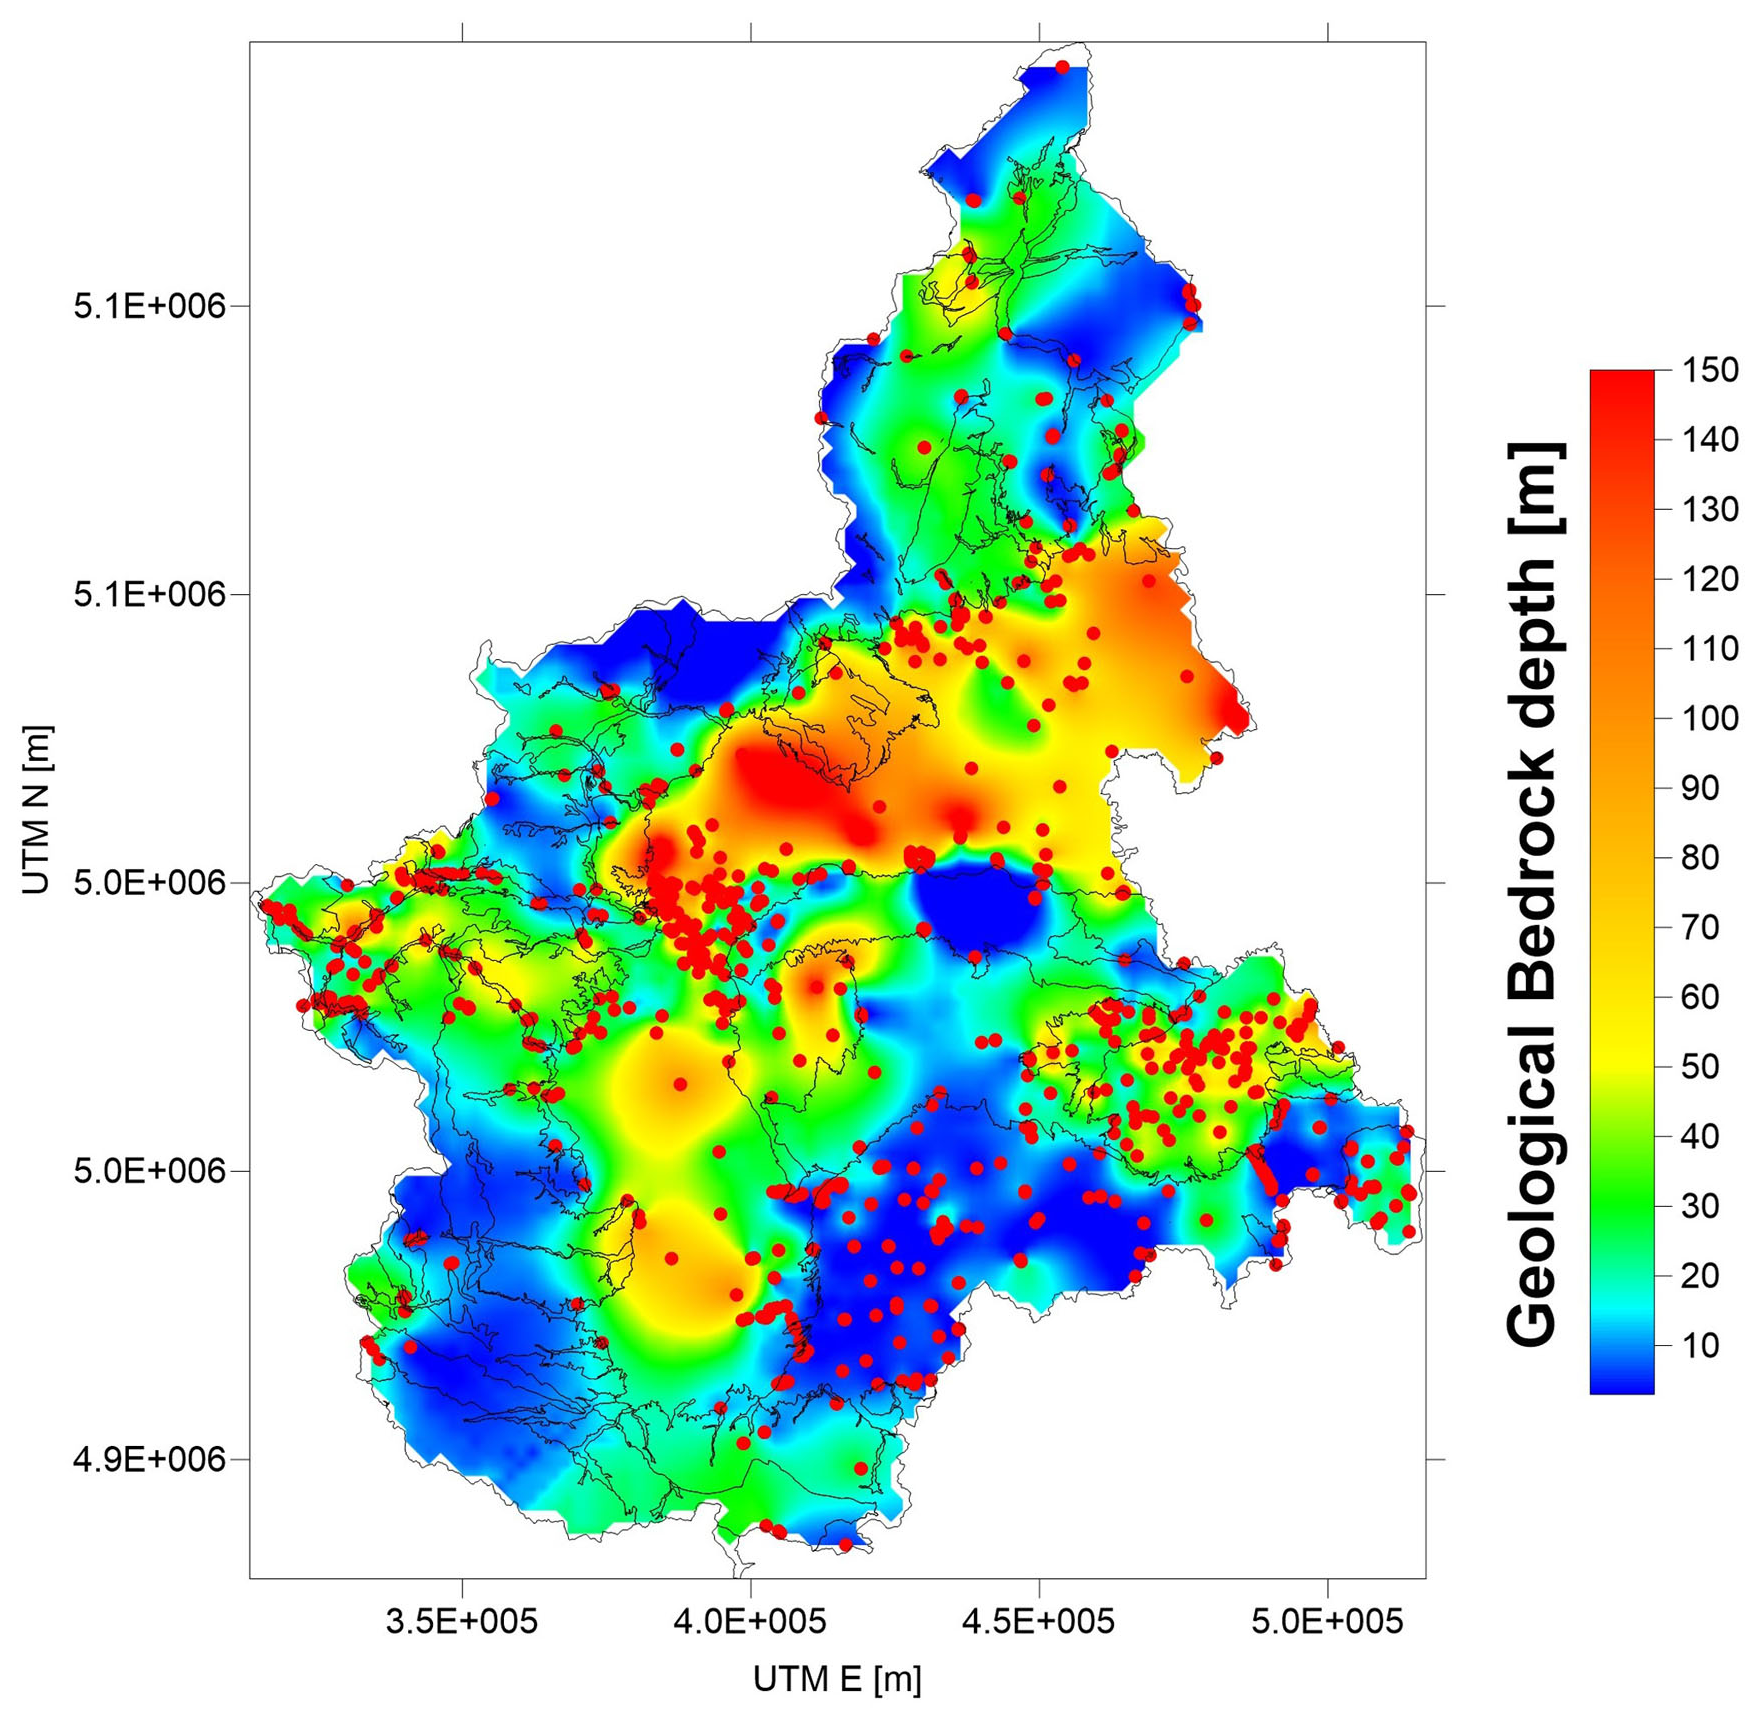
Figure 11Geological/geotechnical information presented in the database: map of the estimated geological bedrock depths.
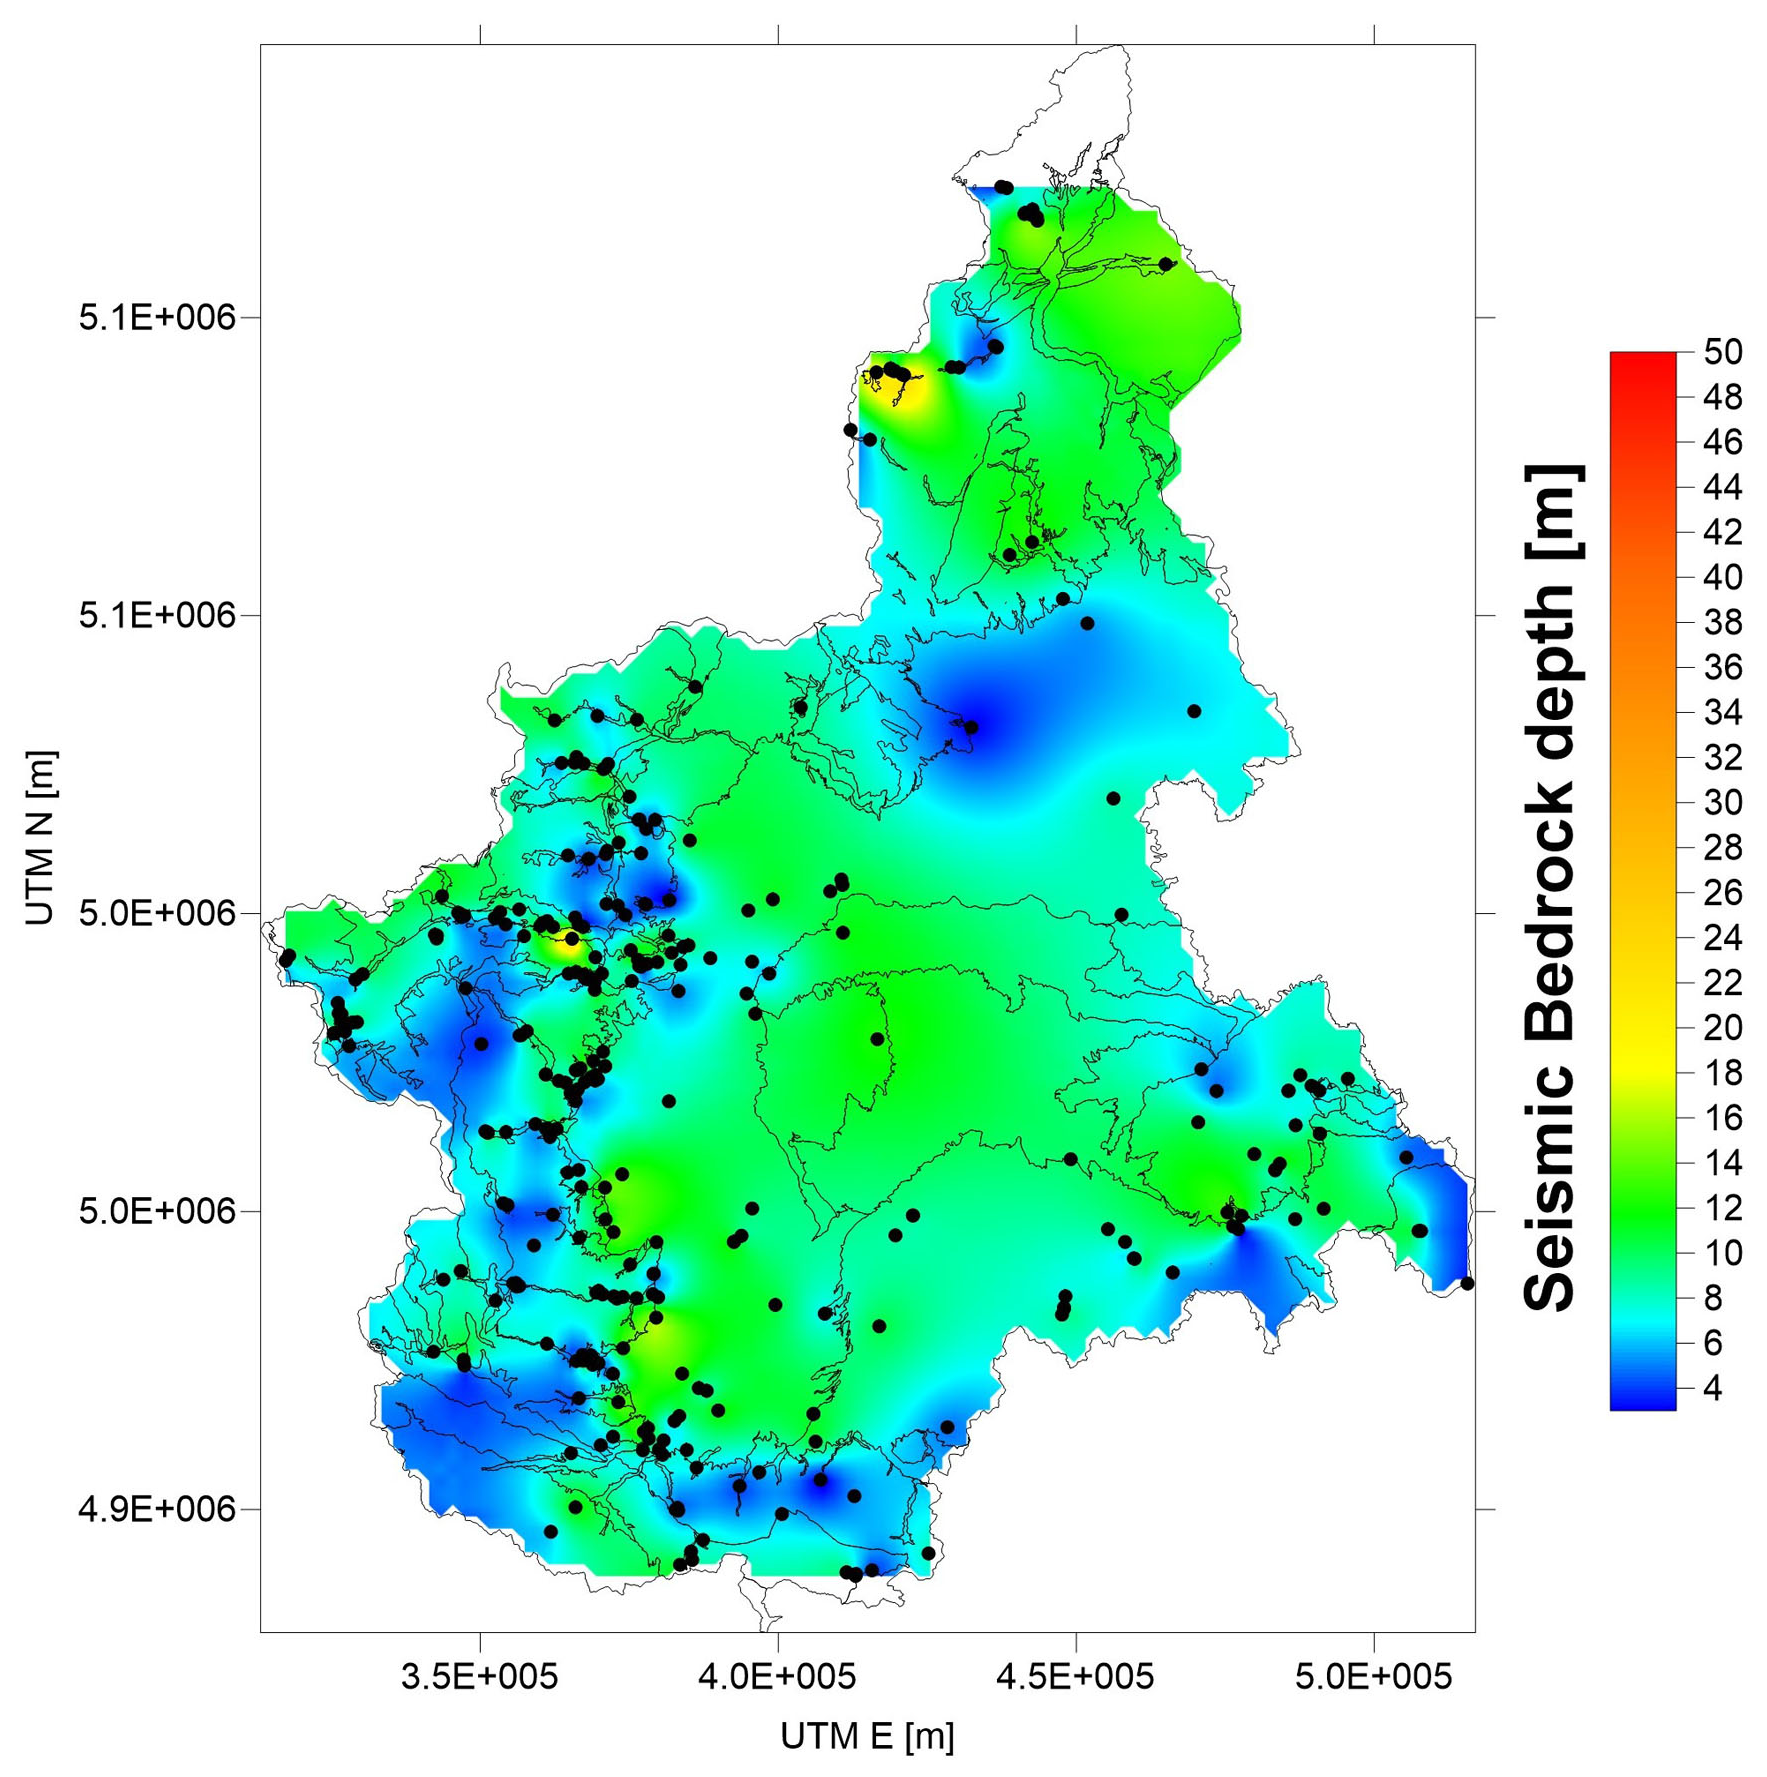
Figure 12Geophysical information presented in the database: map of the estimated seismic bedrock depths.
The depth of the geological bedrock (Fig. 11) shows a good correspondence with the attended geological–geomorphological setting. Increasing bedrock depths are observed along the main alluvial plains (i.e. GGD 8, Po River plain, and GGD 9, Apennine plain), whereas the depth decreases along the Alpine chain and in the Oligocene–Miocene (GGD 6) domain, are those with higher relief energy and therefore more eroded landscapes. The only exception to this model is the presence of the Alpine valleys (GGD 5), where the thickness of the valley floors deposits increases due to the glacial over-excavation. The same feature is observed within GGD 8 (Po River plain), where local increase in depths characterizes the tectonically downthrown buried structures (i.e. Savigliano Basin) and the buried continuation of the over-excavated glacial Alpine valleys (Irace et al., 2009; Gianotti et al., 2014; Ivy-Ochs et al., 2018).
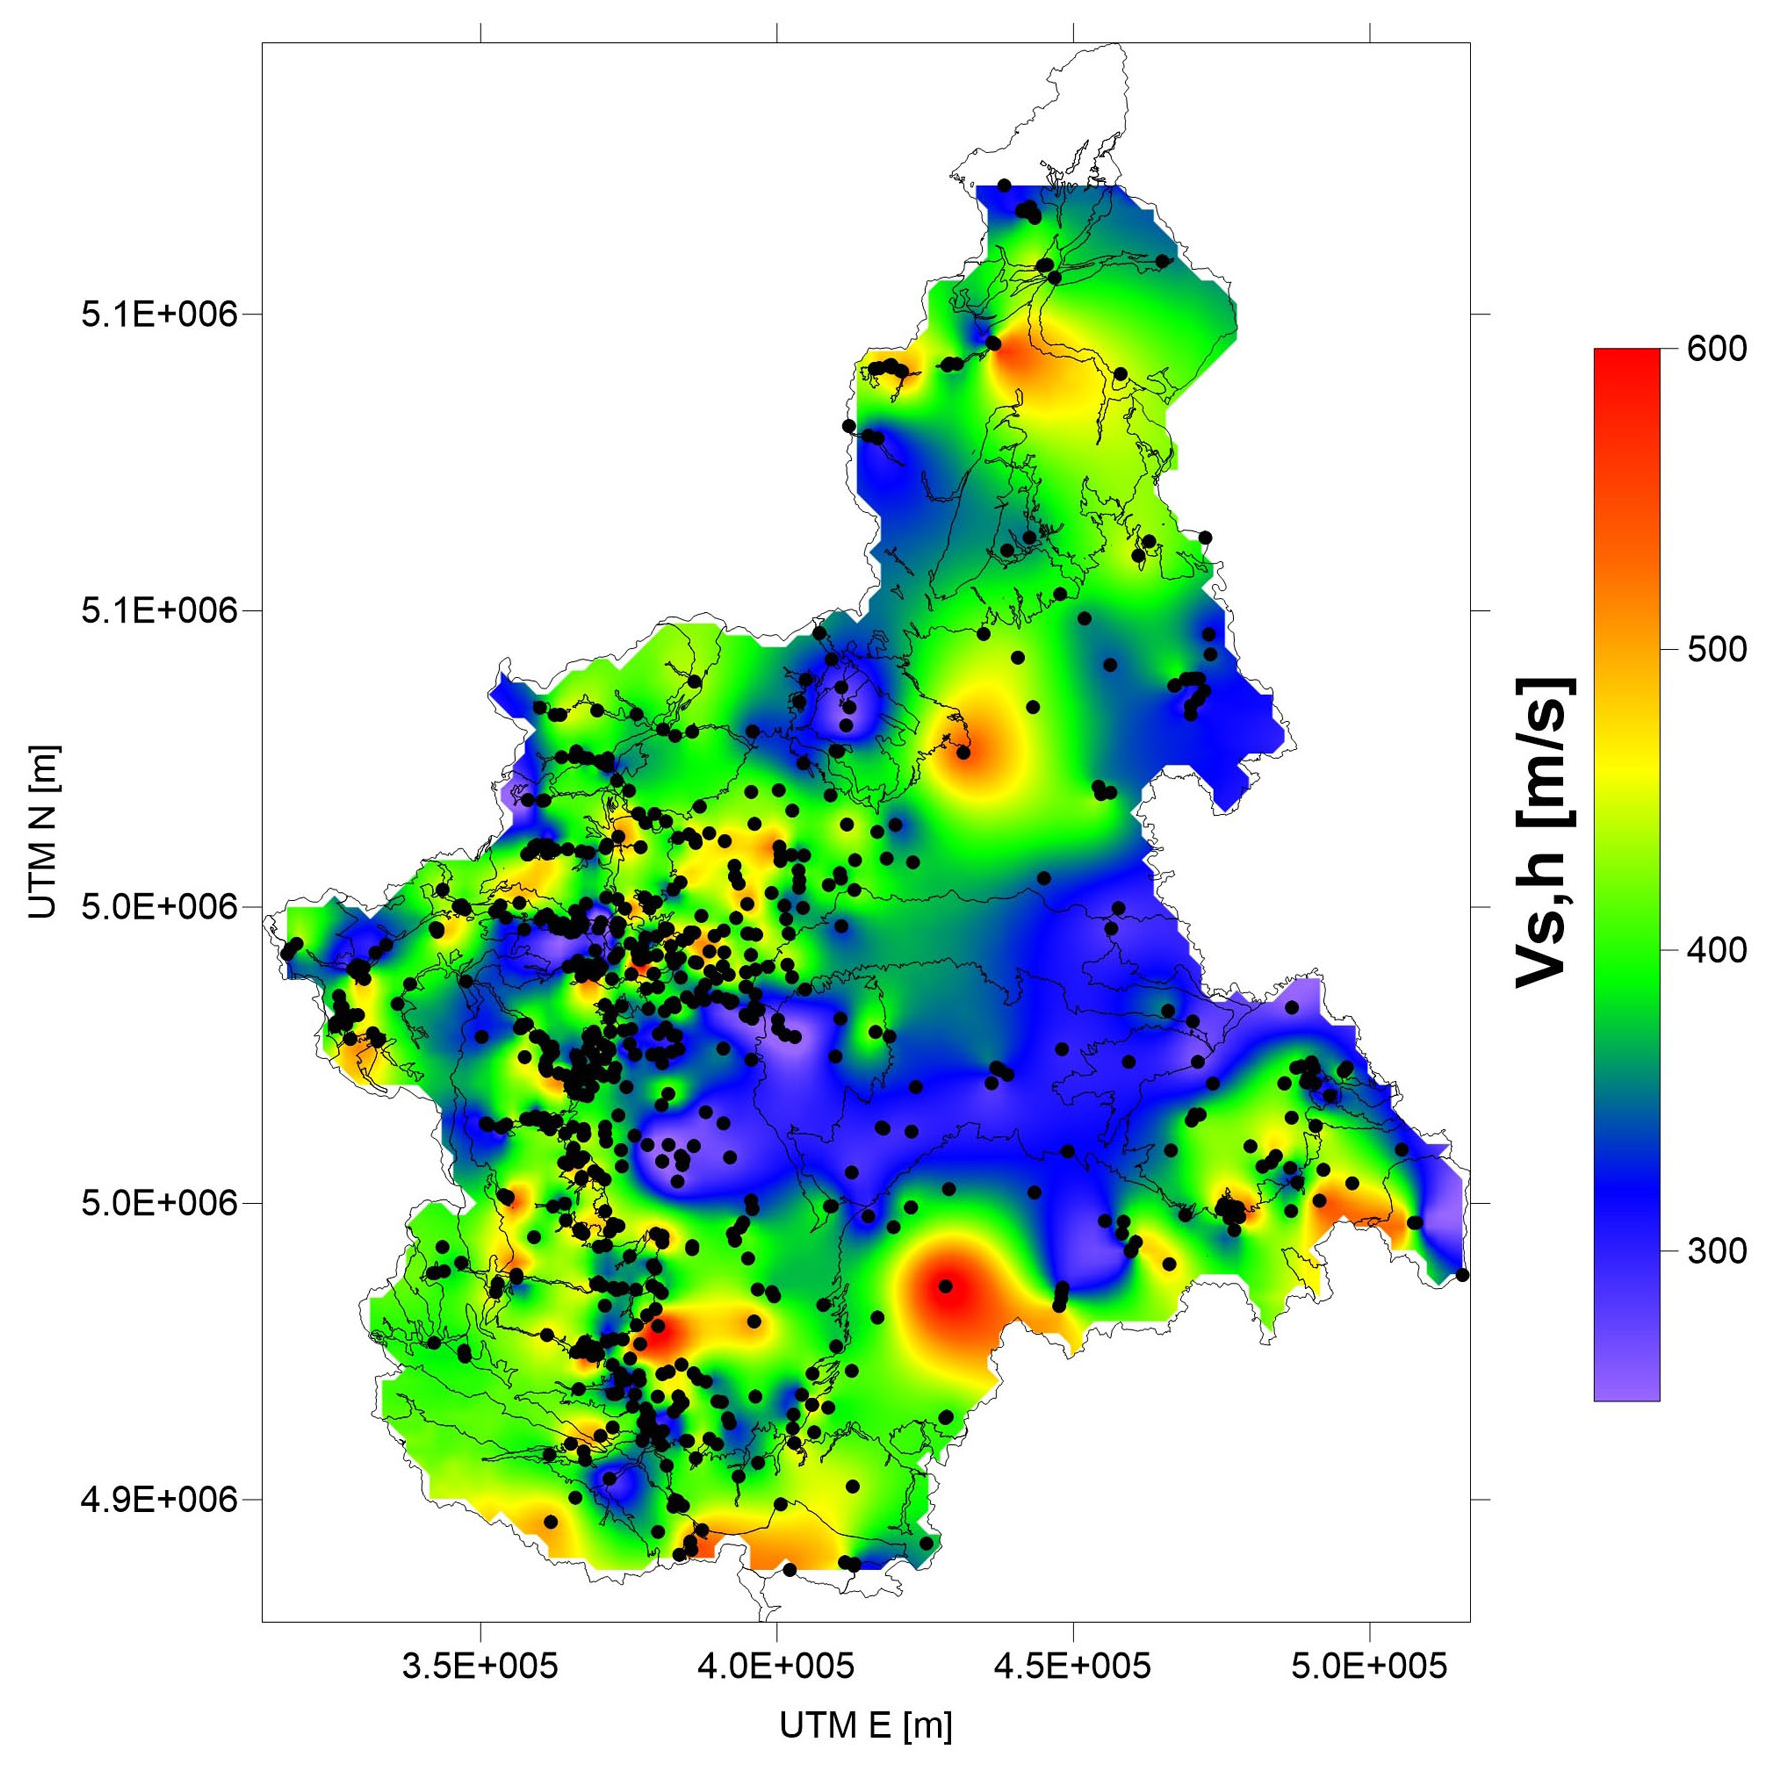
Figure 13Geophysical information presented in the database: map of the Vs, h distribution.
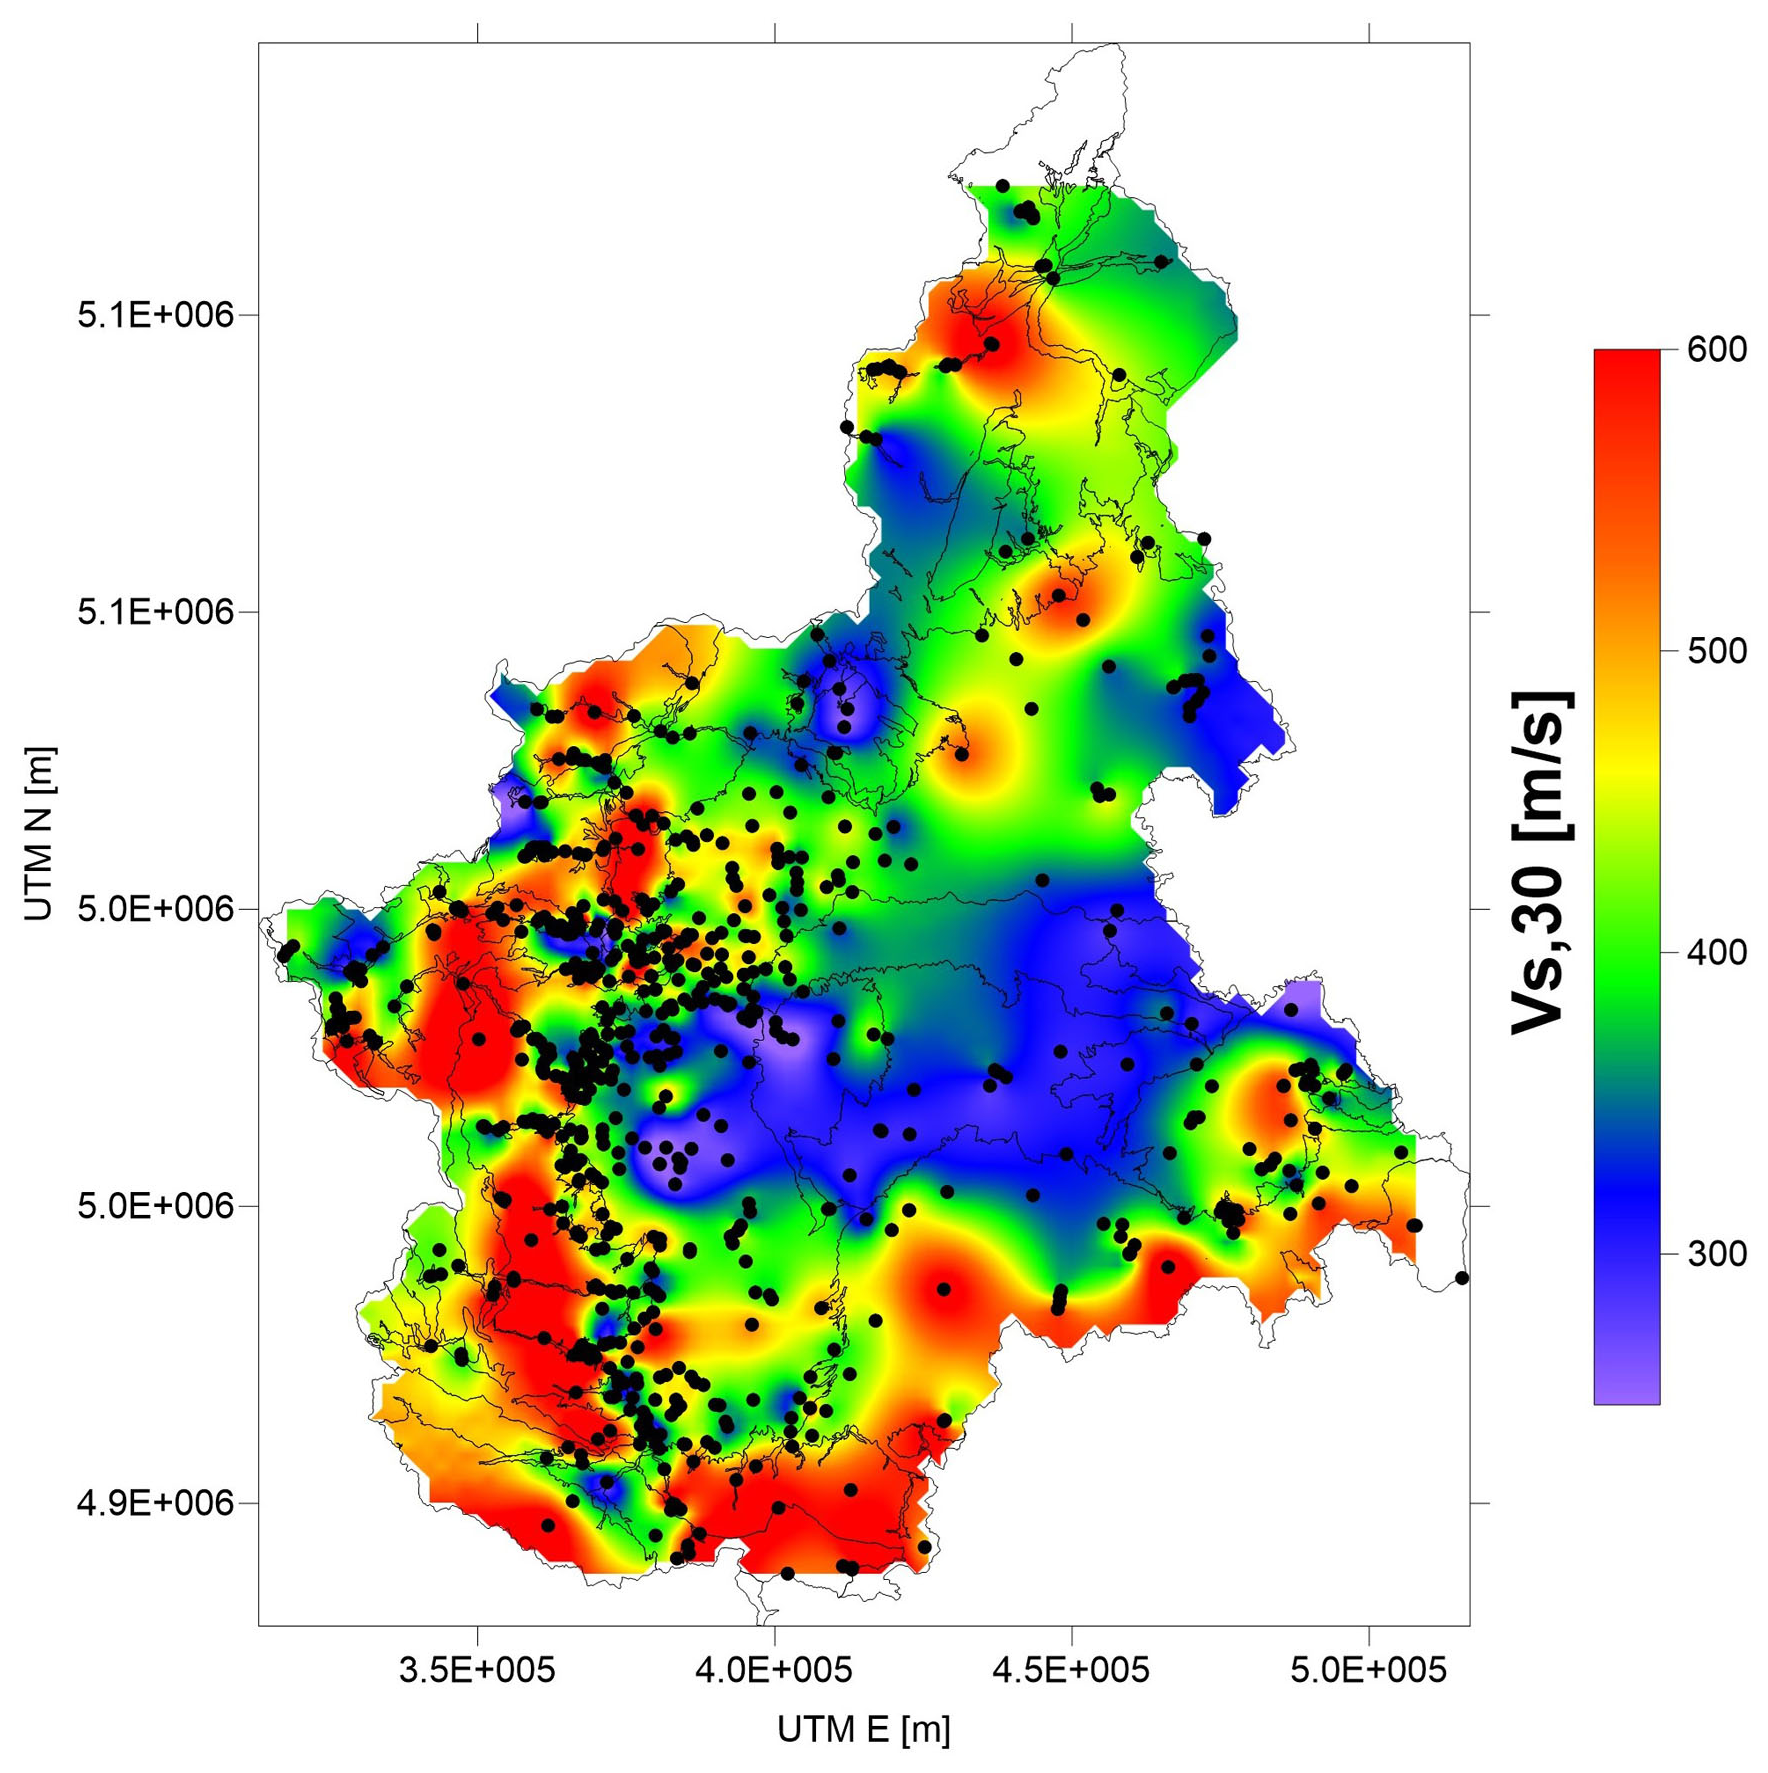
Figure 14Geophysical information presented in the database: map of the Vs, 30 distribution.
Comparing the geological bedrock depth (Fig. 11) and the seismic bedrock depth (Fig. 12) maps, the latter is generally shallower than the former, suggesting that the Vs profiles reach velocities of 800 m s−1 within the cover terrains, i.e. more packed or cemented or coarser-grained layers. This is highly relevant for ground response analyses since usually materials with this propagation velocity have rigid behaviour. Nevertheless, the seismic bedrock map (Fig. 12) still reports a setting coherent with the geological information, showing reduced bedrock depths along the Alpine chain. However, the number of data points in this last map is reduced with respect to the others (see also Table 4).
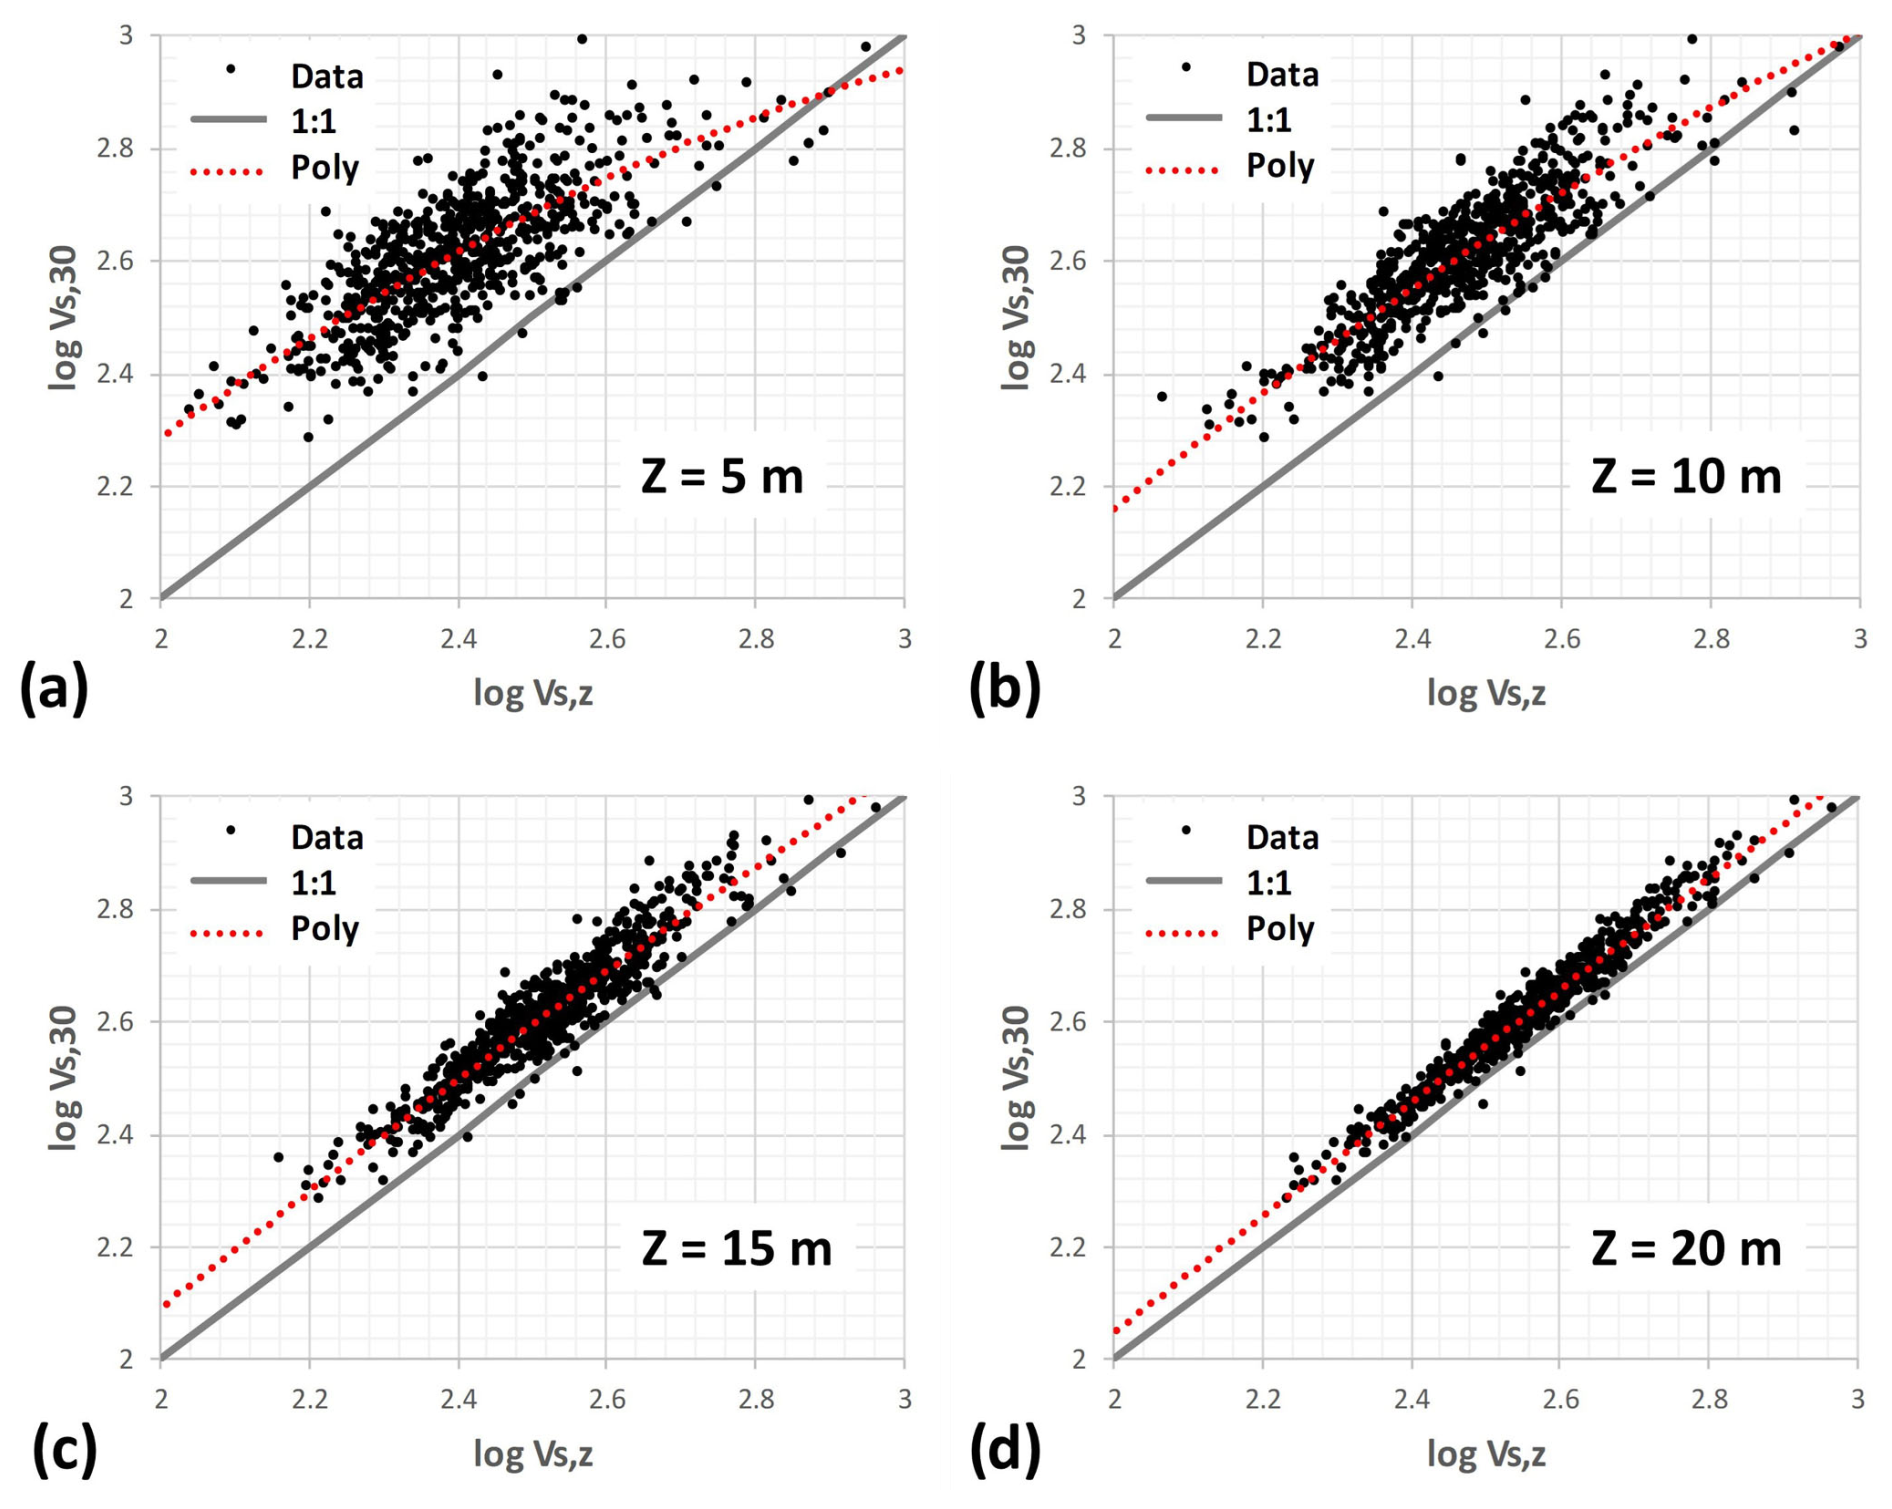
Figure 15Correlation of log Vs, 30 and log Vs, z from the data contained in the database at different depths.
Finally, availability of Vs profiles in the presented database allowed us to also represent, at the regional scale, the distribution of Vs, h according to NTC (Fig. 13), and of Vs, 30 (Fig. 14), where Vs, h is the harmonic average shear-wave velocity down to the depth h of the seismic bedrock if this is reached within 30 m; otherwise, h is 30 m, and Vs, 30 is the harmonic average shear-wave velocity down to the depth of 30 m. The two maps show partially similar features. The Vs, h map (Fig. 13), according to its formulation, reports generally lower velocities given that the Vs values reported pertain to the only cover deposits (i.e. Vs is evaluated only until the depth h of the seismic bedrock). Conversely, the Vs, 30 map (Fig. 14) better represents the average increased values of Vs, generally above 500 m s−1, within the Alpine Ridge GGDs where the shallower bedrock depths weights more on the velocity distribution. Notwithstanding this general difference, in both maps, GGD 7 (Pliocene basins) is characterized by generally lower velocities related to finer-grained cover terrains, as already evidenced in the velocity distribution curves (see Fig. 8). Similarly, GGD 12 shows a clear localized velocity reduction in both maps, contrasting with the coarser-grained and thick moraine deposits of GGD 11, bounding the same domain. Also, partially high Vs, h and Vs, 30 are observed within the GGD 6, reflecting the presence of shallower geological and seismic bedrock.
At the regional scale, similar attempts to map the ground zones with a homogeneous seismic response (i.e. De Ferrari et al., 2015) and a similar map of Vs, 30 (i.e. Perrone et al., 2015) have already been conducted in the past. With respect to these previous papers, the present work is based on a significantly increased data coverage (stratigraphical and seismic), increasing the reliability of the regional view and also including the geological–geomorphological modelling as a constraint for any further analysis. It must also be underlined that with respect to the similar attempts mentioned, the presented maps are only data-driven, i.e. developed without a specific geologically based strategy (like in De Ferrari et al., 2015), and the GGDs are, in this respect, only used for post-interpretation. The confirmation of the coherence of the maps presented in the present study with the geological distribution is therefore a confirmation of the data quality and of the developed methodology.
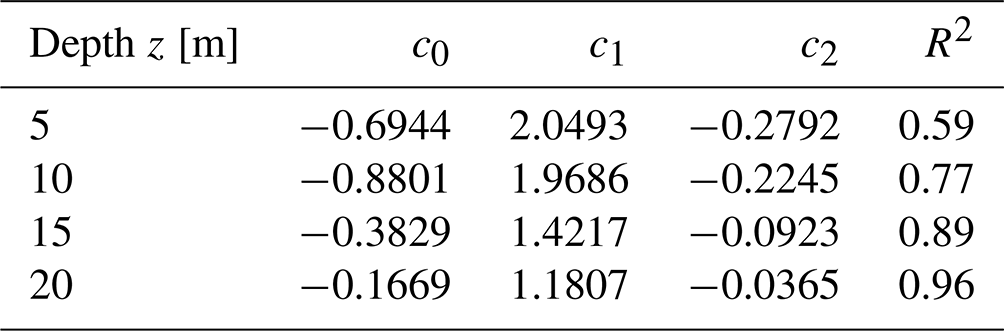
More generally, attempts to relate Vs, 30 to Vs, z were evaluated in the literature: Boore (2004) used regressions of data from boreholes in California to derive equations giving Vs, 30 in terms of Vs, z. Other studies (e.g. Cadet and Duval, 2009) have used velocity profiles based on borehole measurements at KiK-net sites in Japan to derive similar relations. The data provided in the database could be adopted for the verification of the above formulations or a similar type of analysis. Specifically, we analysed the Vs, 30-to-Vs, z data distribution contained in the database from z=5 to 20 m in depth and fitted the data following the Boore et al. (2011) second-order polynomial relationship in the following form:
Results of these analyses are reported in Fig. 15 and Table 6. It can be evidenced that, as attended, the reliability of the correlation and its determination coefficient (R2) increases with increasing depths. Also, the shape of the correlations and their trend with increasing depth corresponds to with what was observed in Boore et al. (2011) for Japan, California, Türkiye and mixed locations in Europe.
Table 6Coefficients of Eq. (2) in text, relating log Vs, 30 to log Vs, z.
The database presented in this work is the starting point for further work, i.e. numerical simulations of the seismic ground response over statistically representative samples of the different GGDs in order to produce amplification abacuses for the quantification of local stratigraphic amplifications of the seismic ground motion over the region.
The database provides insights into the geological and geophysical features of the Piedmont region in northwest Italy. It includes the geological–geomorphological database, the geotechnical database and the geophysical database. The database is referred to as Comina et al. (2024) and can be downloaded from https://doi.org/10.5281/zenodo.13685087.
In this work, a new extensive database of Vs profiles and geological technical properties of the cover terrains over the Piedmont region (NW Italy) is presented. The data are obtained through a specific workflow developed for their evaluation at the regional scale, merging geological information and specific geophysical data collection. Therefore, this paper (i) provides a new, extensive (i.e. containing more than 1000 profiles) database of Vs profiles to be used as the basis of randomization approaches in different geological contexts; (ii) provides a discussion, from specific analyses, of median properties of the different investigated geological units to be eventually adopted with similar approaches as a reference for similar materials in analogous geological contexts; and (iii) provides examples, from specific analyses, of relevant parameter maps at the regional scale to be adopted with similar approaches for specific studies and/or ground response regulations at the regional scale; and (iv) provides a workflow to be adopted with the same aim for evaluation of Vs profile distribution at the regional scale even in different case studies.
CC and PP designed the study. CC, PP, GMA and CB performed the fieldwork. CC, PP and GMA collected the data and assessed its quality. CC performed the analysis. CC, PP and GMA wrote the manuscript and created the figures. All authors contributed to the discussion and revision of the manuscript.
The contact author has declared that none of the authors has any competing interests.
Publisher’s note: Copernicus Publications remains neutral with regard to jurisdictional claims made in the text, published maps, institutional affiliations, or any other geographical representation in this paper. While Copernicus Publications makes every effort to include appropriate place names, the final responsibility lies with the authors.
Authors are indebted to Settore Sismico di Regione Piemonte for their support and data availability and to Techgea S.r.l. for sharing additional shear-wave velocity profiles, which are fundamental to complement the data.
This research has been supported by a UniTo–Regione Piemonte funding agreement (agreement no. PIEP_CT_RIC_23_01).
This paper was edited by Alessio Rovere and reviewed by two anonymous referees.
Aimar, M., Ciancimino, A., and Foti, S.: An assessment of the NTC18 simplified procedure for stratigraphic seismic site amplification prediction, Rivista Italiana di Geotecnica, https://doi.org/10.19199/2020.1.0557-1405.005, 2019.
Boore, D. M.: Estimating VS(30) (or NEHRP site classes) from shallow velocity models (depths < 30 m), B. Seismol. Soc. Am., 94, 591–597, 2004.
Boore, D. M., Thompson, E. M., and Cadet, H.: Regional correlations of VS30 and velocities averaged over depths less than and greater than 30 meters, B. Seismol. Soc. Am., 101, 3046–3059, https://doi.org/10.1785/0120110071, 2011.
Cadet, H. and Duval, A.-M.: A shear wave velocity study based on the KiK-net borehole data: A short note, Seismol. Res. Lett., 80, 440–445, 2009.
Ciancimino, A., Lanzo, G., Alleanza, G. A., Amoroso, S., Bardotti, R., Biondi, G., Cascone, E., Castelli, F., Di Giulio, A., and d'Onofrio, A.: Dynamic characterization of fine-grained soils in Central Italy by laboratory testing, B. Earthq. Eng., 18, 5503–5531, https://doi.org/10.1007/s10518-019-00611-6, 2020.
Ciancimino, A., Cosentini, R. M., Foti, S., Lanzo, G., Pagliaroli, A., and Pallara, O.: The PoliTO–UniRoma1 database of cyclic and dynamic laboratory tests: assessment of empirical predictive models, B. Earthq. Eng., 21, 2569–2601, 2023.
Comina, C., Foti, S., Boiero, D., and Socco, L.: Reliability of VS30 evaluation from surface-wave tests, J. Geotech. Geoenviron., 137, 579–586, https://doi.org/10.1061/(ASCE)GT.1943-5606.0000478, 2011.
Comina, C., Foti, S., Passeri, F., and Socco, L. V.: Time-weighted average shear wave velocity profiles from surface wave tests through a wavelength-depth transformation, Soil Dyn. Earthq. Eng., 158, 107262, https://doi.org/10.1016/j.soildyn.2022.107262, 2022.
Comina, C., Adinolfi, G. M., Bertok, C., Bertea, A., Giraud, V., and Pieruccini, P.: Regional scale shear wave velocity profiles for ground response analyses and uncertainties evaluations – the Piedmont Region (NW Italy) Database, Zenodo [data set], https://doi.org/10.5281/zenodo.13685087, 2024.
Darendeli, M. B.: Development of a new family of normalized modulus reduction and material damping curves, PhD thesis, University of Texas at Austin, http://hdl.handle.net/2152/10396 (last access: 13 January 2025), 2001.
De Ferrari, R., Ferretti, G., Bosco, F., and Gaeta, A. R.: Calibration of a VS30 map for shaking-map production in Piedmont (Italy), Near Surface Geoscience 2015 – 21st European Meeting of Environmental and Engineering Geophysics, Turin, Italy, 6–10 September 2015, 356–360, https://www.proceedings.com/28176.html (last access: 19 January 2025), 2015.
EPRI: Seismic Evaluation Guidance: Screening, Prioritization and Implementation Details (SPID) for the Resolution of Fukushima Near-Term Task Force Recommendation 2.1: Seismic, EPRI, Report 1025287, Palo Alto, CA, https://www.epri.com/research/products/000000000001025287 (last access: 13 January 2025), 2013.
Gaudiosi, I., Romagnoli, G., Albarello, D., Fortunato, C., Imprescia, P., Stigliano, F., and Moscatelli, M.: Shear modulus reduction and damping ratios curves joined with engineering geological units in Italy, Sci. Data, 10, 625, https://doi.org/10.1038/s41597-023-01936-3, 2023.
Geoportale ARPA: https://webgis.arpa.piemonte.it/agportal/apps/webappviewer/index.html?id=2067aa1af4aa44a5a6855a9d30cb5467, last access: 13 January 2025.
Gianotti, F., Forno, M. G., Ivy-Ochs, S., Monegato, G., Pini, R., and Ravazzi, C.: Stratigraphy of the Ivrea morainic amphitheatre (NW Italy): an updated synthesis, Alp. Mediterr. Quat., 28, 29–58, https://amq.aiqua.it/index.php/amq/article/view/80 (last access: 13 January 2025), 2014.
Irace, A., Clemente, P., Natalicchio, M., Ossella, L., Trenkwalder, S., De Luca, D. A., Mosca, P., Piana, F., Polino, R., and Violanti, D.: Geologia e idrostratigrafia profonda della Pianura Padana occidentale, La Nuova Lito Firenze, 111 pp., ISBN 978-88-904554-0-7, 2009.
Ivy-Ochs, S., Lucchesi, S., Baggio, P., Fioraso, G., Gianotti, F., Monegato, G., Graf, A., Akcar, N., Christl, M., and Carraro, F.: New geomorphological and chronological constraints for glacial deposits in the Rivoli-Avigliana end-moraine system and the lower Susa Valley (Western Alps, NW Italy), J. Quaternary Sci., 33, 550–562, https://doi.org/10.1002/jqs.3061, 2018.
Moss, R. E. S.: Quantifying measurement uncertainty of thirty-meter shear-wave velocity, B. Seismol. Soc. Am., 98, 1399–1411, https://doi.org/10.1785/0120070096, 2008.
NTC: Norme Tecniche per le Costruzioni Consiglio Superiore dei Lavori Pubblici, Ministero per le Infrastrutture e dei Trasporti, https://www.gazzettaufficiale.it/eli/id/2018/2/20/18A00716/sg (last access: 19 January 2025), 2018.
Pagani, M., Marcellini, A., Crespellani, T., Martelli, L., Tento, A., and Daminelli, R.: Seismic microzonation regulations of the Emilia-Romagna Region (Italy), Third Int. Symp. Effects Surf. Geol. Seism. Mot., Grenoble, France, 30 August–1 September 2006, 2006.
Passeri, F., Foti, S., and Rodriguez-Marek, A.: A new geostatistical model for shear wave velocity profiles, Soil Dyn. Earthq. Eng., 136, 106247, https://doi.org/10.1016/j.soildyn.2020.106247, 2020.
Passeri, F., Comina, C., Foti, S., and Socco, L. V.: The Polito Surface Wave flatfile Database (PSWD): statistical properties of test results and some intermethod comparisons, B. Earthq. Eng., 19, 2343–2370, https://doi.org/10.1007/s10518-021-01069-1, 2021.
Perrone, G., Riccardo Gaeta, A., Tiranti, D., Cadoppi, P., and Fioraso, G.: Ground zoning map of the Piedmont region (NW Italy): Methodology and preliminary results, Eng. Geol. Soc. Territ., 5, 1065–1069, https://doi.org/10.1007/978-3-319-09048-1_206, 2015.
Peruzzi, G., Albarello, D., Baglione, M., D'Intinosante, V., Fabbroni, P., and Pileggi, D.: Assessing 1D litho-stratigraphical amplification factor for microzoning studies in Italy, B. Earthq. Eng., 14, 373–389, https://doi.org/10.1007/s10518-015-9841-z, 2016.
Piana, F., Fioraso, G., Irace, A., Mosca, P., d'Atri, A., Barale, L., Falletti, P., Monegato, G., Morelli, M., Tallone, S., and Vigna, G. B.: Geology of Piemonte region (NW Italy, Alps–Apennines interference zone), J. Maps, 13, 395–405, https://doi.org/10.1080/17445647.2017.1316218, 2017a.
Piana, F., Barale, L., Compagnoni, R., d'Atri, A., Fioraso, G., Irace, A., Mosca, P., Tallone, S., Monegato, G., and Morelli, M.: Geological Map of Piemonte Region at 1:250 000 scale Explanatory Notes, Acc. Sc. Torino Memorie Sc. Fis., 41, 3–143, 2017b.
Pieruccini, P., Paolucci, E., Fantozzi, P. L., Naldini, D., and Albarello, D.: Developing effective subsoil reference model for seismic microzonation studies: Central Italy case studies, Nat. Hazards, 112, 451–474, https://doi.org/10.1007/s11069-021-05188-5, 2022.
Romagnoli, G., Tarquini, E., Porchia, A., Catalano, S., Albarello, D., and Moscatelli, M.: Constraints for the Vs profiles from engineering-geological qualitative characterization of shallow subsoil in seismic microzonation studies, Soil Dyn. Earthq. Eng., 161, 107347, https://doi.org/10.1016/j.soildyn.2022.107347, 2022.
Shi, J. and Asimaki, D.: A generic velocity profile for basin sediments in California conditioned on VS30, Seismol. Res. Lett., 89, 1397–1409, https://doi.org/10.1785/0220180057, 2018.
Stewart, J. P., Klimis, N., Savvaidis, A., Theodoulidis, N., Zargli, E., Athanasopoulos, G., Pelekis, P., Mylonakis, G., and Margaris, B.: Compilation of a local VS profile database and its application for inference of VS30 from geologic-and terrain-based proxies, B. Seismol. Soc. Am., 104, 2827–2841, https://doi.org/10.1785/0120140114, 2014.
Toro, G. R.: Probabilistic models of the site velocity profiles for generic and site–specific ground–motion amplification studies, Appendix in Technical Rep. No. 779574, Brookhaven National Laboratory, Upton, NY, 1995.
Toro, G. R.: Site-wide probabilistic model of shear-wave velocity profiles at the Savannah River Site, Aiken, South Carolina, Risk Engineering, Inc. to Bechtel Savannah River Co., Report No. WSRC-OS-2006–00514, Revision 1, https://doi.org/10.13140/RG.2.2.34012.46727, 2005.
Toro, G. R.: Uncertainty in Shear-Wave Velocity Profiles, J. Seismol., 26, 713–730, https://doi.org/10.1007/s10950-022-10084-x, 2022.
Vucetic, M. and Dobry, R.: Effect of soil plasticity on cyclic response, J. Geotech. Eng., 117, 89–107, https://doi.org/10.1061/(ASCE)0733-9410(1991)117:1(89), 1991.
Wang, P., Zimmaro, P., Ahdi, S. K., Kwak, D. Y., and Stewart, J. P.: Shear Wave Velocity Database and Its Application for Analysis of Non-Ergodic Site Amplification Effects, Report supported by the US Geological Survey, California Strong Motion Instrumentation Program, and Consortium of Organizations for Strong Motion Observation Systems, https://earthquake.usgs.gov/cfusion/external_grants/reports/G17AP00018.pdf (last access: 1 December 2024), 2019.
Wang, Y. and Stokoe, K.: Development of constitutive models for linear and nonlinear shear modulus and material damping ratio of uncemented soils, J. Geotech. Geoenviron., 148, 04021192, https://doi.org/10.1061/(ASCE)GT.1943-5606.0002684, 2022.