the Creative Commons Attribution 4.0 License.
the Creative Commons Attribution 4.0 License.
 | 17 Apr 2025
glenglat: a database of global englacial temperatures
Mylène Jacquemart
Ethan Welty
Marcus Gastaldello
Guillem Carcanade
Measurements of englacial temperatures have been collected since the earliest years of glaciology, with the first measurements dating back to the mid-19th century. Although temperature is a defining characteristic of any glacier – and is notoriously laborious to collect – no effort had been made yet to gather all existing measurements. In an attempt to make existing ice temperature data more accessible, we present glenglat, the global englacial temperature database compiled from 316 literature sources and 12 data submissions and composed of 1 931 831 measurements of depth and temperature from 788 boreholes located on 213 glaciers outside the ice sheets. Alongside recent compilations for the ice sheets (Løkkegaard et al., 2023; Vandecrux et al., 2023), most published englacial temperature measurements are now readily available to the research community.
Here, we review the variety of glacier thermal regimes that have been measured and summarize the spatial, temporal, and climatic coverage of measurements relative to the global glacierized area. Measurements of cold and polythermal glacier ice greatly outnumber those of temperate ice. Overall, temperature has been measured in fewer than 1 ‰ of all glaciers, and only 27 % of boreholes have been measured more than once, highlighting the great potential to investigate changing temperature conditions by repeating past measurements. The database is developed on GitHub (https://github.com/mjacqu/glenglat, last access: 7 April 2024) and published to Zenodo (https://doi.org/10.5281/zenodo.11516611, Welty et al., 2025). It consists of four relational tables and detailed machine-actionable and human-readable metadata. The GitHub repository also provides submission instructions (including a spreadsheet template and validation tools), in the hope that investigators will help us keep glenglat complete and current going forward. We hope that glenglat will improve our understanding of glacier thermal regimes, refine glacier thermodynamic models, and give insight into hazardous glacier instabilities in a warming world.
- Article
(3700 KB) - Full-text XML
-
Supplement
(793 KB) - BibTeX
- EndNote


Englacial temperature is a defining characteristic of any glacier. It influences glacier flow dynamics and subglacial hydrology, it can be a decisive factor in glacier hazards, and it can serve as an archive of past climate. To illustrate this, ice viscosity and deformation rate depend directly on ice temperature (Deeley and Woodward, 1908; Glen, 1954; Cuffey and Paterson, 2010), only temperate (basal) ice permits glacier sliding over the bed (Cuffey and Paterson, 2010), and impermeable cold ice can serve as a barrier for water, controlling subglacial and englacial water flow and possibly contributing to the formation of hazardous water accumulations within the ice or in glacier sediment beds (Irvine-Fynn et al., 2011; Vincent et al., 2012; Gilbert et al., 2012; Kääb et al., 2018; Gilbert et al., 2018; Jacquemart et al., 2020; Kääb et al., 2021). Under cold conditions, the variations in temperature with depth are a window into the past evolution of atmospheric temperatures, making englacial temperature changes an important climate variable (e.g., Gilbert et al., 2010). Ice temperatures and glacier flow regimes also have implications for glacial archeology, defining how well artifacts can survive in ice (Pilø et al., 2023). Finally, ice temperature records also serve to validate thermomechanical glacier models, which are important tools for improving our understanding of glacier systems.
Glaciers are typically categorized as either temperate, cold, or polythermal. Temperate ice is at the pressure melting point, cold ice is below the pressure melting point, and polythermal glaciers contain both cold and temperate ice. The pressure melting point depends mostly on the ice overburden pressure (and, to a lesser extent, the presence of air bubbles and other impurities), such that under temperate conditions ice temperature decreases with depth at around to m−1 (Paterson, 1971; Harrison, 1972; Jania et al., 1996). More generally, the englacial temperature is determined by the complex interaction between the surface energy balance, the geothermal heat flux, and internal heating from ice deformation, basal friction, and refreezing of meltwater (Cuffey and Paterson, 2010). Available heat is transferred through the ice and firn via conduction and advection by ice and water flow. The superposition of these processes can lead glaciers to be fully cold or temperate or simultaneously contain cold and temperate ice in a wide variety of spatial configurations (Blatter and Hutter, 1991; Irvine-Fynn et al., 2011).
Ongoing human-driven climate change is leading to substantial changes in englacial temperatures, evidence of which is clear in (the few existing) repeat measurements. At Dôme du Gouter in the French Alps, for example, a warming of 1.5 °C was recorded at a depth of 50 m between 1994 and 2017 (Vincent et al., 2020). Long-term measurements at Golle Gnifetti (Swiss Alps) between 1991 and 2023 reveal the same amount of warming at a depth of 20 m (Marcus Gastaldello and Martin Hoelzle, personal communication, 2024a). This warming can have several consequences. For one, meltwater infiltrating cold firn can degrade or destroy the archive of past climatic conditions that can be stored in firn or ice cores (Mattea et al., 2021; Gabrielli et al., 2016). In steep terrain, warming at the glacier bed can lead to widespread sliding and destabilization of entire glaciers, increasing the probability of very large ice avalanches, similar to the one observed at Altels in Switzerland in 1895 (Heim et al., 1895; Faillettaz et al., 2011). Counterintuitively, warming can also lead some glaciers to cool, because their disappearing firn cover reduces the amount of englacial warming that stems from the latent heat release of refreezing meltwater (Gilbert et al., 2012; Huss and Fischer, 2016; Irvine-Fynn et al., 2011). A similar effect may also occur in areas still covered by firn if the refreezing meltwater creates impermeable ice layers that prevent water percolation into the firn, thereby (locally) limiting the latent heat release (Vincent et al., 2020).
Measuring englacial temperatures is a laborious process; (deep) ice temperature measurements are therefore comparatively rare. Those that exist were typically collected for one of several reasons: to gain an understanding of glacier dynamics and englacial temperatures directly (e.g., Agassiz, 1847; Blatter and Haeberli, 1984; Clarke et al., 1984; Copland et al., 2003; Ryser et al., 2013; Gilbert et al., 2010; Vincent et al., 2020; Troilo et al., 2021; Karušs et al., 2022), in connection with the retrieval of ice cores used to reconstruct past climatic changes (e.g., Thompson et al., 1990, 2018; Kinnard et al., 2006; Schwikowski et al., 2013; Kinnard et al., 2020), or as part of operational glacier monitoring efforts to document current climate change (e.g., Hoelzle et al., 2020). The data resulting from such efforts are largely hidden away in the scientific literature spanning more than a century and are therefore not readily available as a community resource. At the same time, there is an increasing need to understand how englacial temperatures – and their changes over time – relate to glacier dynamics, climate change, and glacier hazards (Gilbert and Vincent, 2013; Colgan et al., 2015; Gilbert et al., 2015; Kääb et al., 2018; Machguth et al., 2023b). In order to make englacial temperature data from glaciers around the world more widely available, we have compiled glenglat, the global englacial temperature database, sourced – largely but not exclusively – from the published literature. In the following, we describe how englacial temperatures are measured in the field (Sect. 2.1), how we found and compiled these measurements (Sect. 2.2), and how the resulting glenglat database is structured and managed (Sect. 2.3). In Sect. 3, we present and discuss the content of glenglat (version 1.0) and close with instructions for how others can contribute additional data (Sect. 3.5). We hope that glenglat will serve as a community resource to help improve our understanding of ongoing changes in the cryosphere and that it will grow over time with the addition of past and future englacial temperature measurements.
2.1 Measurement methods
Englacial temperature measurements are typically made by placing one or more thermistors in a borehole (Fig. 1). Boreholes are drilled with either mechanical (reviewed in Talalay, 2016) or thermal (reviewed in Talalay, 2020) drills or a combination thereof. The advantage of mechanical drilling is that temperatures can be reliably measured after a short time. Thermal drilling (e.g., steam or hot water) significantly raises the temperature of the borehole, which subsequently needs time to re-adjust to the temperature of the surrounding ice – typically several days to a few weeks (Laternser, 1992; Miles et al., 2018). Depending on the measurement techniques and objectives, borehole temperatures are measured only once, or the thermistor chain is left in the hole (which is allowed to freeze up or is kept open with a casing or fluid) and is either remeasured manually or equipped with an automatic logger. A recent innovation replaces discrete thermistors with a fiber optic cable (distributed temperature sensing (DTS); Law et al., 2021), which can provide measurements with an unprecedented vertical resolution, especially in deep boreholes where the required number of thermistors would be prohibitively expensive.
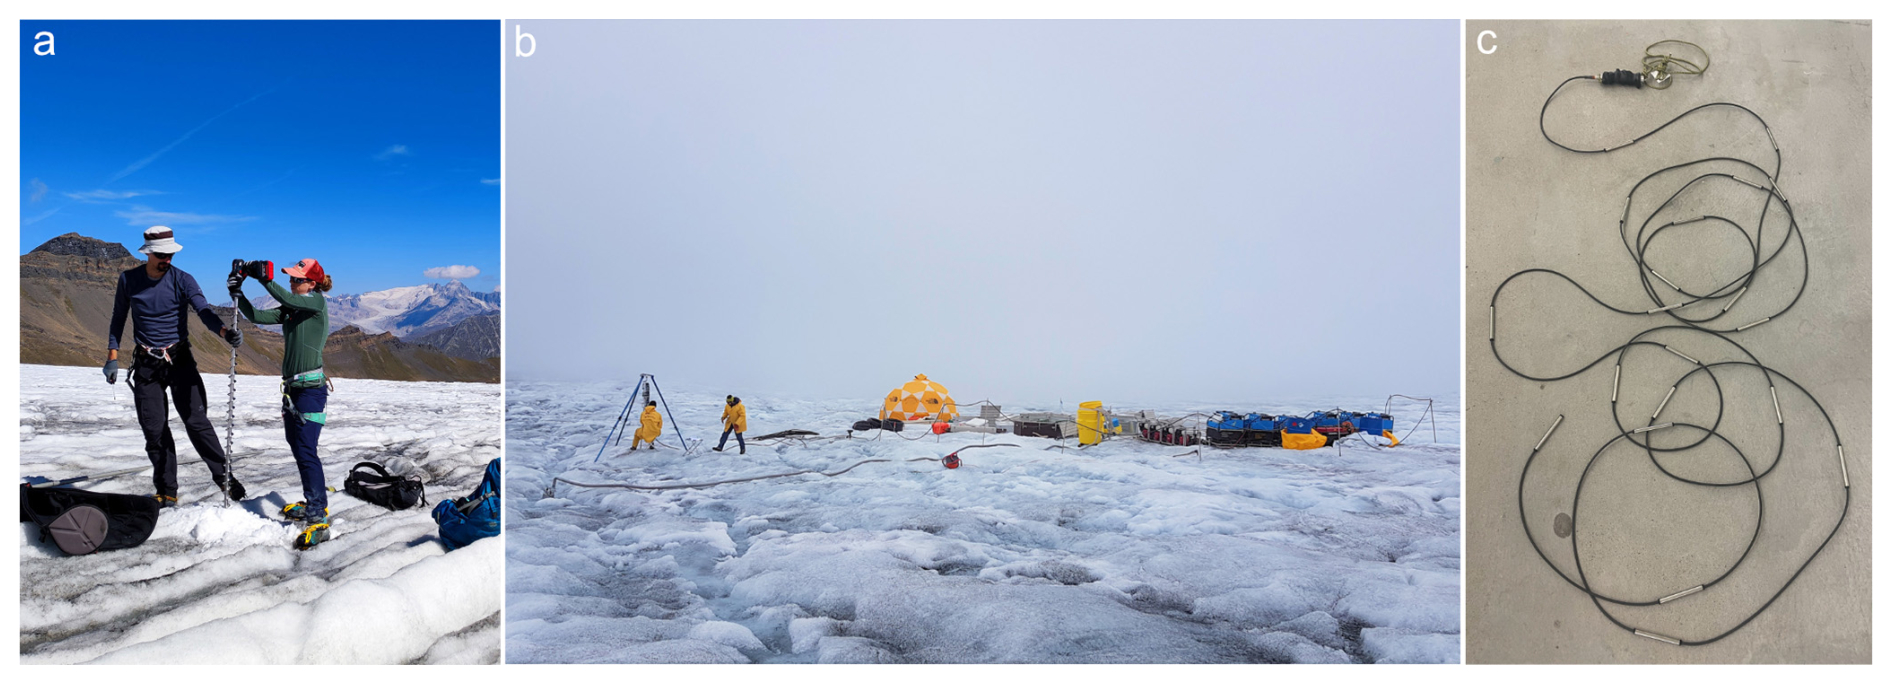
Figure 1Photographs illustrating methods for measuring glacier temperatures: (a) drilling a shallow borehole with a handheld mechanical auger on Griesgletscher, Switzerland (photo by Matthias Huss); (b) drilling a deep borehole with a hot-water drill and a large array of fuel drums and pumps to heat and pressurize the water on Rhonegletscher, Switzerland (photo by Raphael Moser); and (c) a typical string of thermistors used to measure temperature at different depths in a borehole (photo by Mylène Jacquemart).
2.2 Data compilation
Most data included in glenglat are sourced from published documents and datasets. Publications were initially found by searching Google Scholar (https://scholar.google.com, last access: 7 April 2024) and Google Dataset Search (https://datasetsearch.research.google.com, last access: 7 April 2024) for combinations of the English words “glacier”, “ice”, “temperature”, “thermal”, “regime”, “englacial”, “borehole”, “drill(ing)”, “measurement”, and “record”, together with ![]() and
and ![]() (“glacier borehole temperature” in Chinese and Russian, respectively). We then recursively sought out publications referenced in previously identified publications, striving to find the most complete and original data source for each measurement. Tracking down references was made more difficult by the practice of journals (primarily European and North American journals using Latin script, like this one) of not publishing references in their original script (e.g., “
(“glacier borehole temperature” in Chinese and Russian, respectively). We then recursively sought out publications referenced in previously identified publications, striving to find the most complete and original data source for each measurement. Tracking down references was made more difficult by the practice of journals (primarily European and North American journals using Latin script, like this one) of not publishing references in their original script (e.g., “![]() ”) but only translations (“temperature”) or phonetic transcriptions (“termicheskiy”). Finding these often involved reconstructing the original reference, since the modified form did not appear in search results. When we were unable to find the full text of a publication online or in print in nearby libraries, we requested it from the Swiss Library Service Platform (https://slsp.ch, last access: 7 April 2024) document delivery (DocDel) service through the University of Bern (https://www.ub.unibe.ch, last access: 7 April 2024). In addition to extracting data from publications, we solicited data submissions on CRYOLIST (https://cryolist.org, last access: 7 April 2024) at the 2023 Alpine Glaciology Meeting in Birmensdorf, Switzerland, and through personal communications. All the data sources are listed within glenglat itself (Sect. 2.3) and in the references of this publication (see Appendix A for a list of the glaciers and the corresponding references). Unfortunately, since Copernicus Publications does not support non-Latin characters, the latter are Latin only; complete versions of the appendices and references are thus provided in Sects. S1 and S2 of the Supplement.
”) but only translations (“temperature”) or phonetic transcriptions (“termicheskiy”). Finding these often involved reconstructing the original reference, since the modified form did not appear in search results. When we were unable to find the full text of a publication online or in print in nearby libraries, we requested it from the Swiss Library Service Platform (https://slsp.ch, last access: 7 April 2024) document delivery (DocDel) service through the University of Bern (https://www.ub.unibe.ch, last access: 7 April 2024). In addition to extracting data from publications, we solicited data submissions on CRYOLIST (https://cryolist.org, last access: 7 April 2024) at the 2023 Alpine Glaciology Meeting in Birmensdorf, Switzerland, and through personal communications. All the data sources are listed within glenglat itself (Sect. 2.3) and in the references of this publication (see Appendix A for a list of the glaciers and the corresponding references). Unfortunately, since Copernicus Publications does not support non-Latin characters, the latter are Latin only; complete versions of the appendices and references are thus provided in Sects. S1 and S2 of the Supplement.
For this first version of glenglat, we selected only firn and/or ice temperature measurements with a well-defined depth. This means that we omitted measurements made in tunnels dug horizontally into glaciers. We also disregarded publications with measurements made exclusively in seasonal snow but included snow temperatures when they were provided alongside or as part of a profile reaching firn or ice. We also focused on glaciers and omitted measurements from the Antarctic and Greenland ice sheets, to a large degree because data from the ice sheets were already compiled by Løkkegaard et al. (2023) and Vandecrux et al. (2023).
For each measurement, we extracted depth, temperature, and associated metadata (see below). Submitted or published data in machine-readable formats were added directly to the database, data published numerically in text or tables were transcribed with the help of optical character recognition (OCR), and data represented graphically (e.g., as a plot of temperature versus depth) were digitized using the open-source software Plot Digitizer (Huwaldt, 2020). For plots that used points to indicate each measurement (Fig. 3a), we digitized the values at each point. For plots using a continuous line (Fig. 3b), such that the locations of the measurements along the line are unknown, we used a point density sufficient to reproduce the original line.
Metadata associated with the temperature measurements were compiled from one or more sources to the best of our abilities (see Tables 1–4). For example, borehole coordinates were either extracted directly from text, digitized from a map with defined axes (e.g., latitude and longitude) using Plot Digitizer, digitized from a map (without such axes) visually georeferenced to a global basemap using the QGIS Freehand Raster Georeferencer plugin (Vellut, 2021), or approximated on global basemaps with the help of terrain features, glacier morphology, or elevation information. Borehole elevation was published as text in most cases, though we did occasionally have to approximate elevation from provided contour lines or by comparison to an independent topographic map. Other metadata included the measurement and drilling dates, the drill type (mechanical, thermal, or combined), the depth of the firn–ice interface (i.e., whether the measurements are in firn, ice, or both), whether the borehole reached the glacier bed, and the uncertainty of the temperature measurements.
2.3 Data structure and management
glenglat is packaged and described following the Frictionless Tabular Data Package standard (Pollock et al., 2025a), version-controlled and tested on GitHub (https://github.com/mjacqu/glenglat, last access: 7 April 2024) and published to Zenodo (https://doi.org/10.5281/zenodo.11516611, Welty et al., 2025). Data and metadata (Tables 1–4) are stored using common text file formats to ensure that they are human-readable, machine-actionable, and compatible with line-based version-control systems like Git. The data are structured as a four-table relational database stored in comma-separated values (CSV) files. The source table (Table 1) contains a full reference to each data source that we used. Names in non-Latin scripts (Cyrillic, Hangul, and Chinese characters) are accompanied by a latinized form, and non-English titles are accompanied by an English translation. The borehole table (Table 2) describes the drill site – including the location, elevation, drill method, and reported uncertainty of the temperature measurements. The profile table (Table 3) describes each temperature–depth profile – including the timing of the measurement and whether or not the measurement was made after the borehole was known to have reached thermal equilibrium. Finally, the measurement table (Table 4) contains the measurements of temperature with depth. To improve the manageability of the CSV data from boreholes with time series measurements (i.e., with thousands of profiles), the profile and measurement tables are stored in separate, source-specific CSV files. Supporting these tabular data are files that, for each source, document how and from where the data were extracted. For submissions, these include data files and email correspondence. For publications, these include the key text passages, tables, maps, or figures that served as the sources of the data. Additional files can be used to reproduce how numerical values were digitized from maps and figures using Plot Digitizer (*.xml) or georeferenced and digitized using QGIS (*.pgw, *.{png|jpg}.aux.xml, and *.geojson).
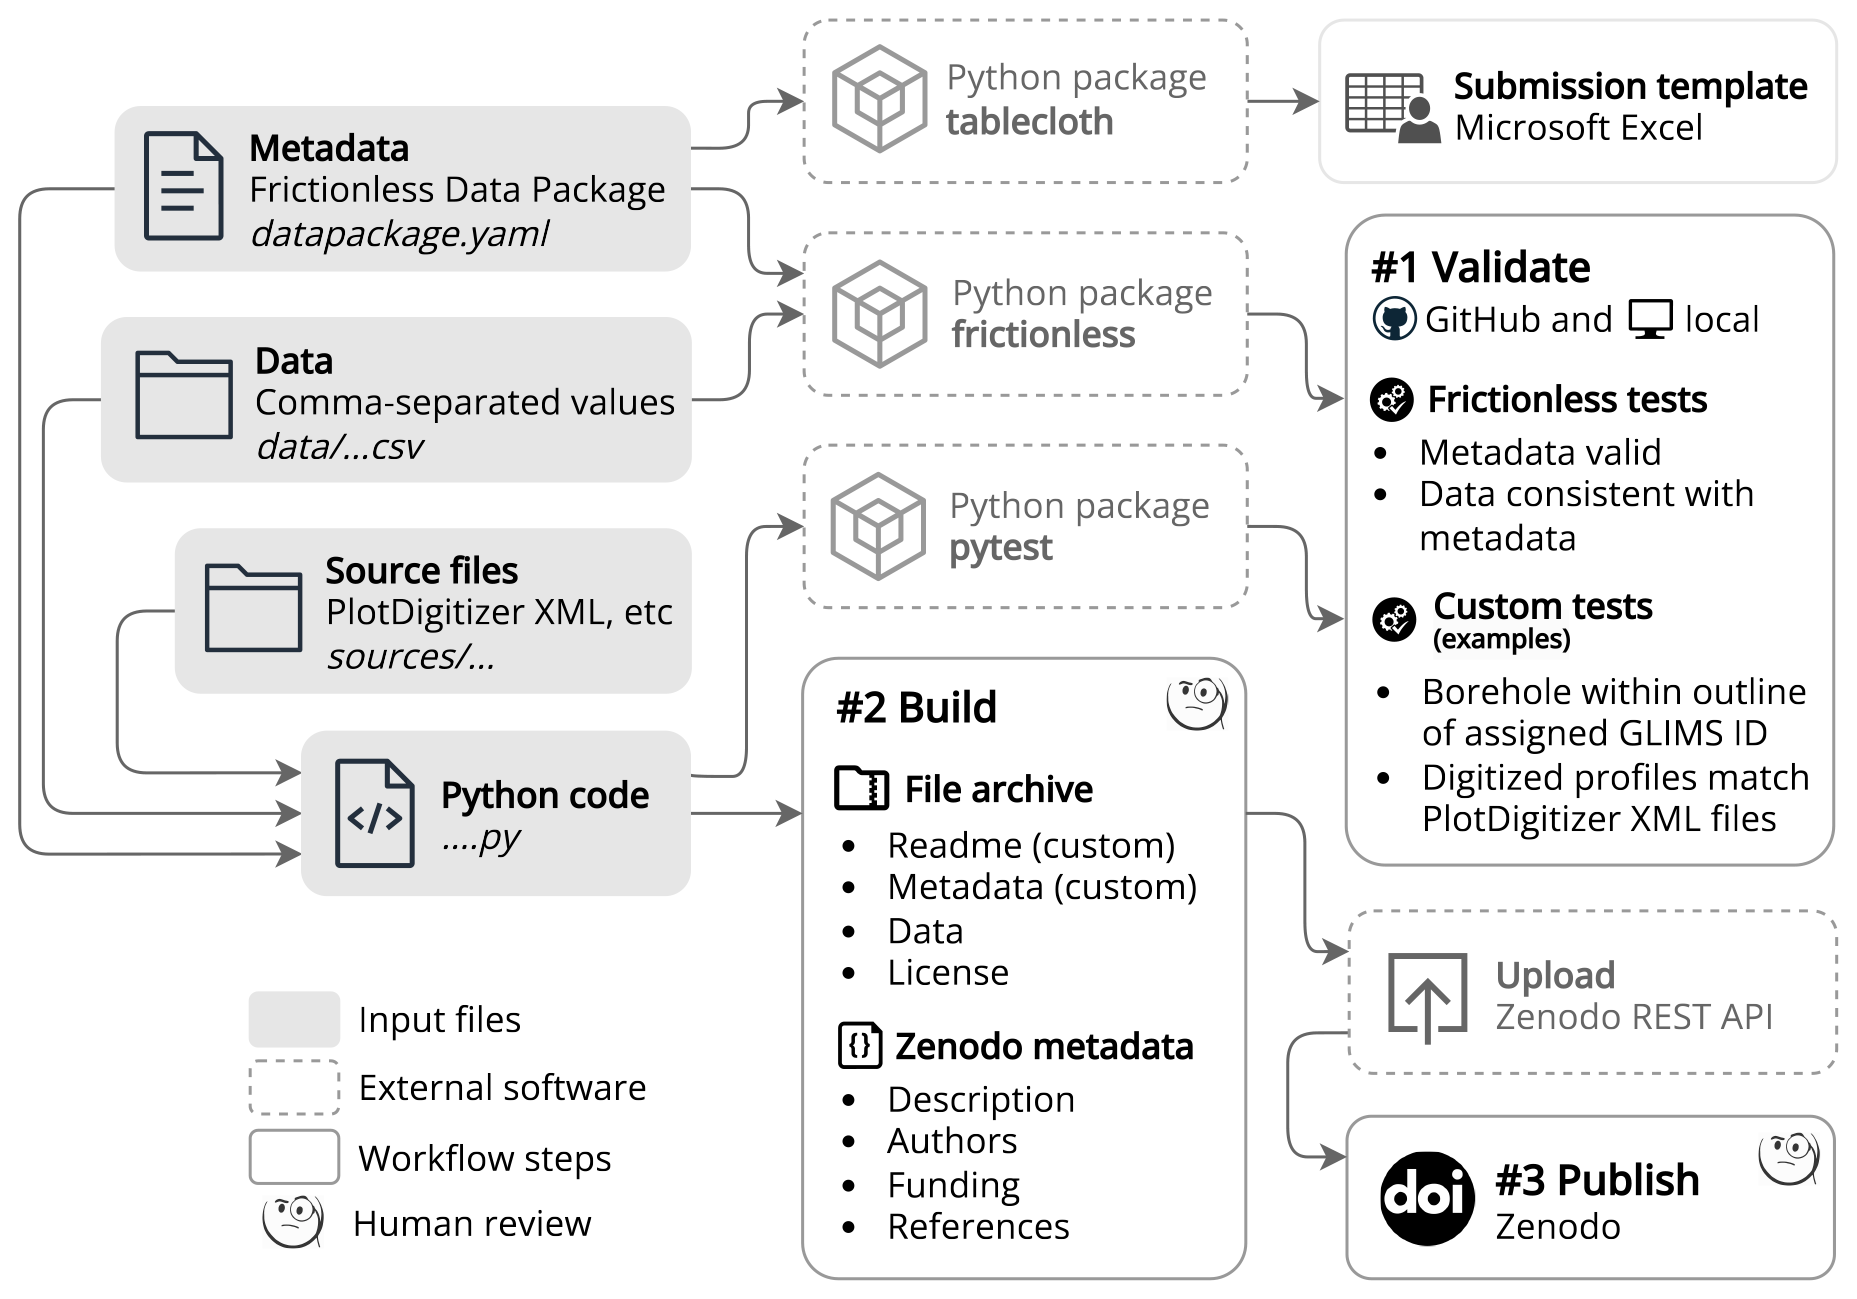
Figure 2The glenglat testing and publishing workflow. The input files (in gray) are those version-controlled in the GitHub repository.
The tabular data are described in a single YAML (https://yaml.org, last access: 7 April 2024) metadata file (datapackage.yaml). This file lists general attributes of the database – like name, description, version, license, and contributors – and gives a detailed description of the structure and content of each tabular data file. The Table Dialect (Pollock et al., 2025b) specifies how exactly the CSV files are structured, while the Table Schema (Pollock et al., 2025c) specifies the name and data type of each column, the constraints on each column's values, and the foreign-key relations between tables.
This metadata architecture allows data maintainers and contributors to use Frictionless (e.g., for Python; Karev et al., 2024) to test whether the metadata are correctly structured and whether the data are consistent with the metadata. These tests are run automatically in a continuous-integration pipeline on GitHub, ensuring the integrity of the database whenever any file is modified. Additional custom tests, which cannot be expressed by the metadata, further verify the integrity of the dataset, e.g., that all people who contributed data (referenced as a personal communication in table source) are listed as contributors in datapackage.yaml. Using software (Welty, 2023) built on the Frictionless Tabular Data Package standard, we can also render the metadata as an interactive spreadsheet template with dropdown menus and real-time validation, lowering the bar for future data contributors.
We publish the database to Zenodo using a custom build process. The uploaded file archive and detailed Zenodo metadata are generated automatically from the contents of the GitHub repository and submitted using Zenodo's InvenioRDM REST API (https://inveniordm.docs.cern.ch/reference/rest_api_index, last access: 7 April 2024). Zenodo manages the DOIs for glenglat, registering a concept DOI encompassing all versions (https://doi.org/10.5281/zenodo.11516611, Welty et al., 2025) and a DOI for each new version. To keep the structure simple and the download small, Zenodo releases contain only the CSV files (data/*.csv), a license (LICENSE.md), simplified documentation (README.md), and a version of the metadata (datapackage.yaml) converted into JSON.
Table 1Main columns of the source table (data/source.csv); a full description is provided in datapackage.yaml. Column names and categorical values closely match the Citation Style Language (CSL) 1.0.2 specification (Zelle et al., 2015). The primary key is indicated with *.
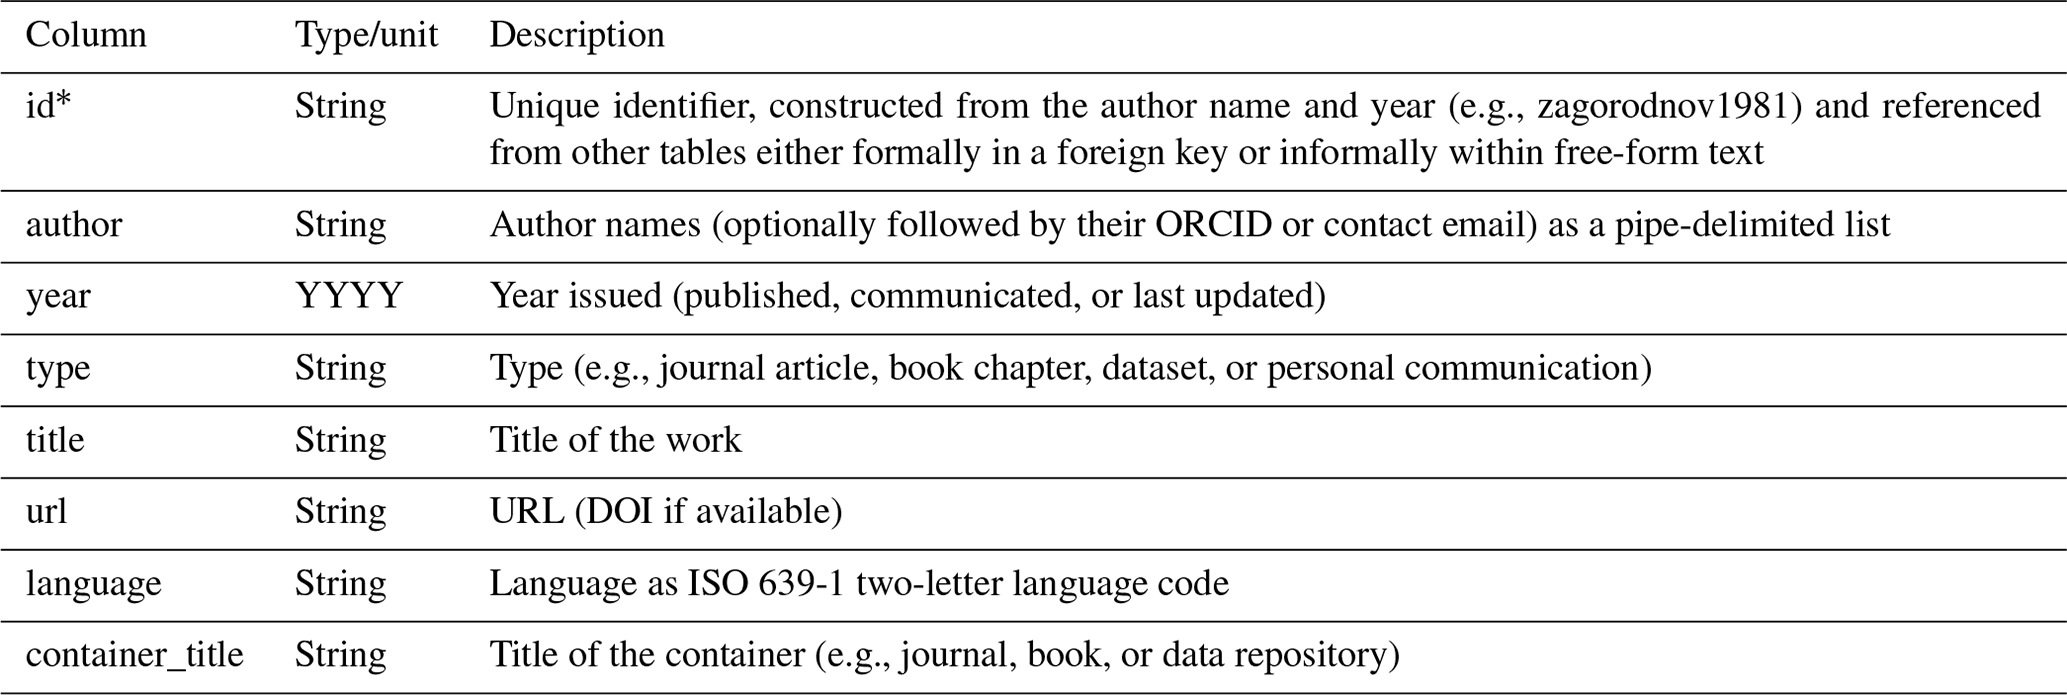
Table 2Columns of the borehole table (data/borehole.csv). Primary keys are indicated with *, foreign keys with °.
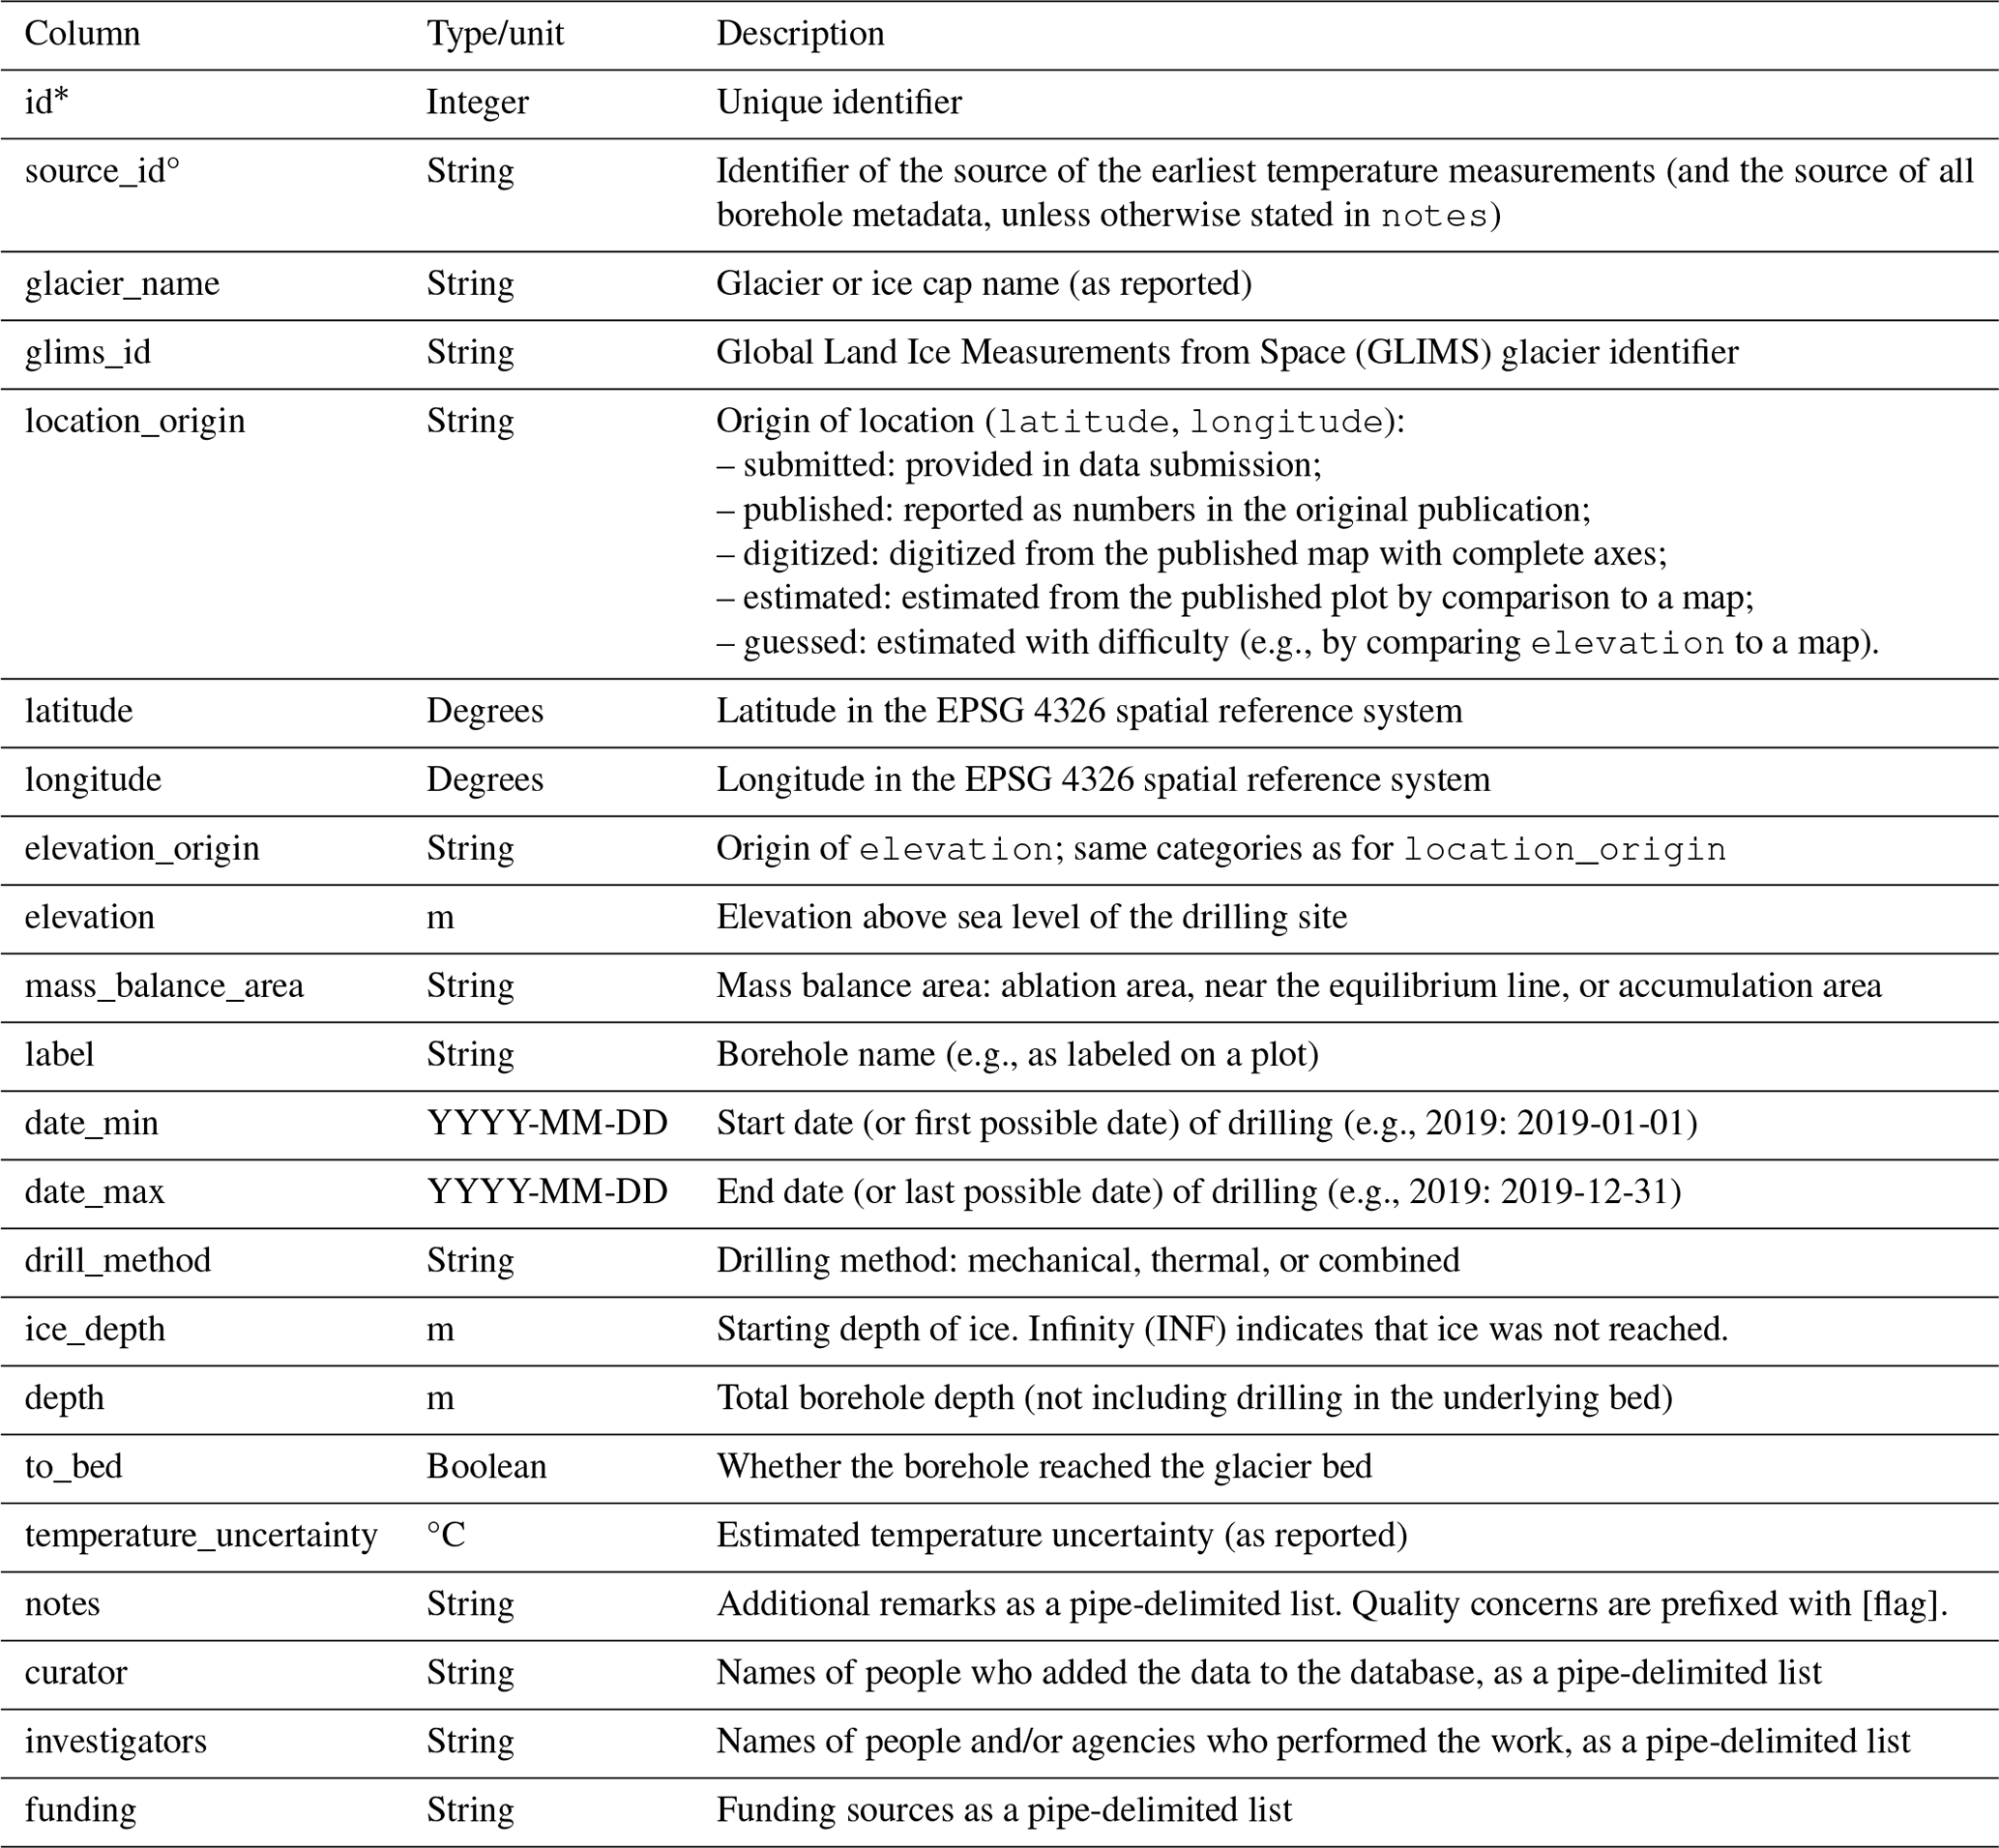
Table 3Columns of the profile table (data/profile.csv and data/**/profile.csv), where indicates subdirectories that hold separate profile.csv and measurement.csv files from boreholes with many profiles (e.g., from automated loggers). Composite primary keys are indicated with *, foreign keys with °.
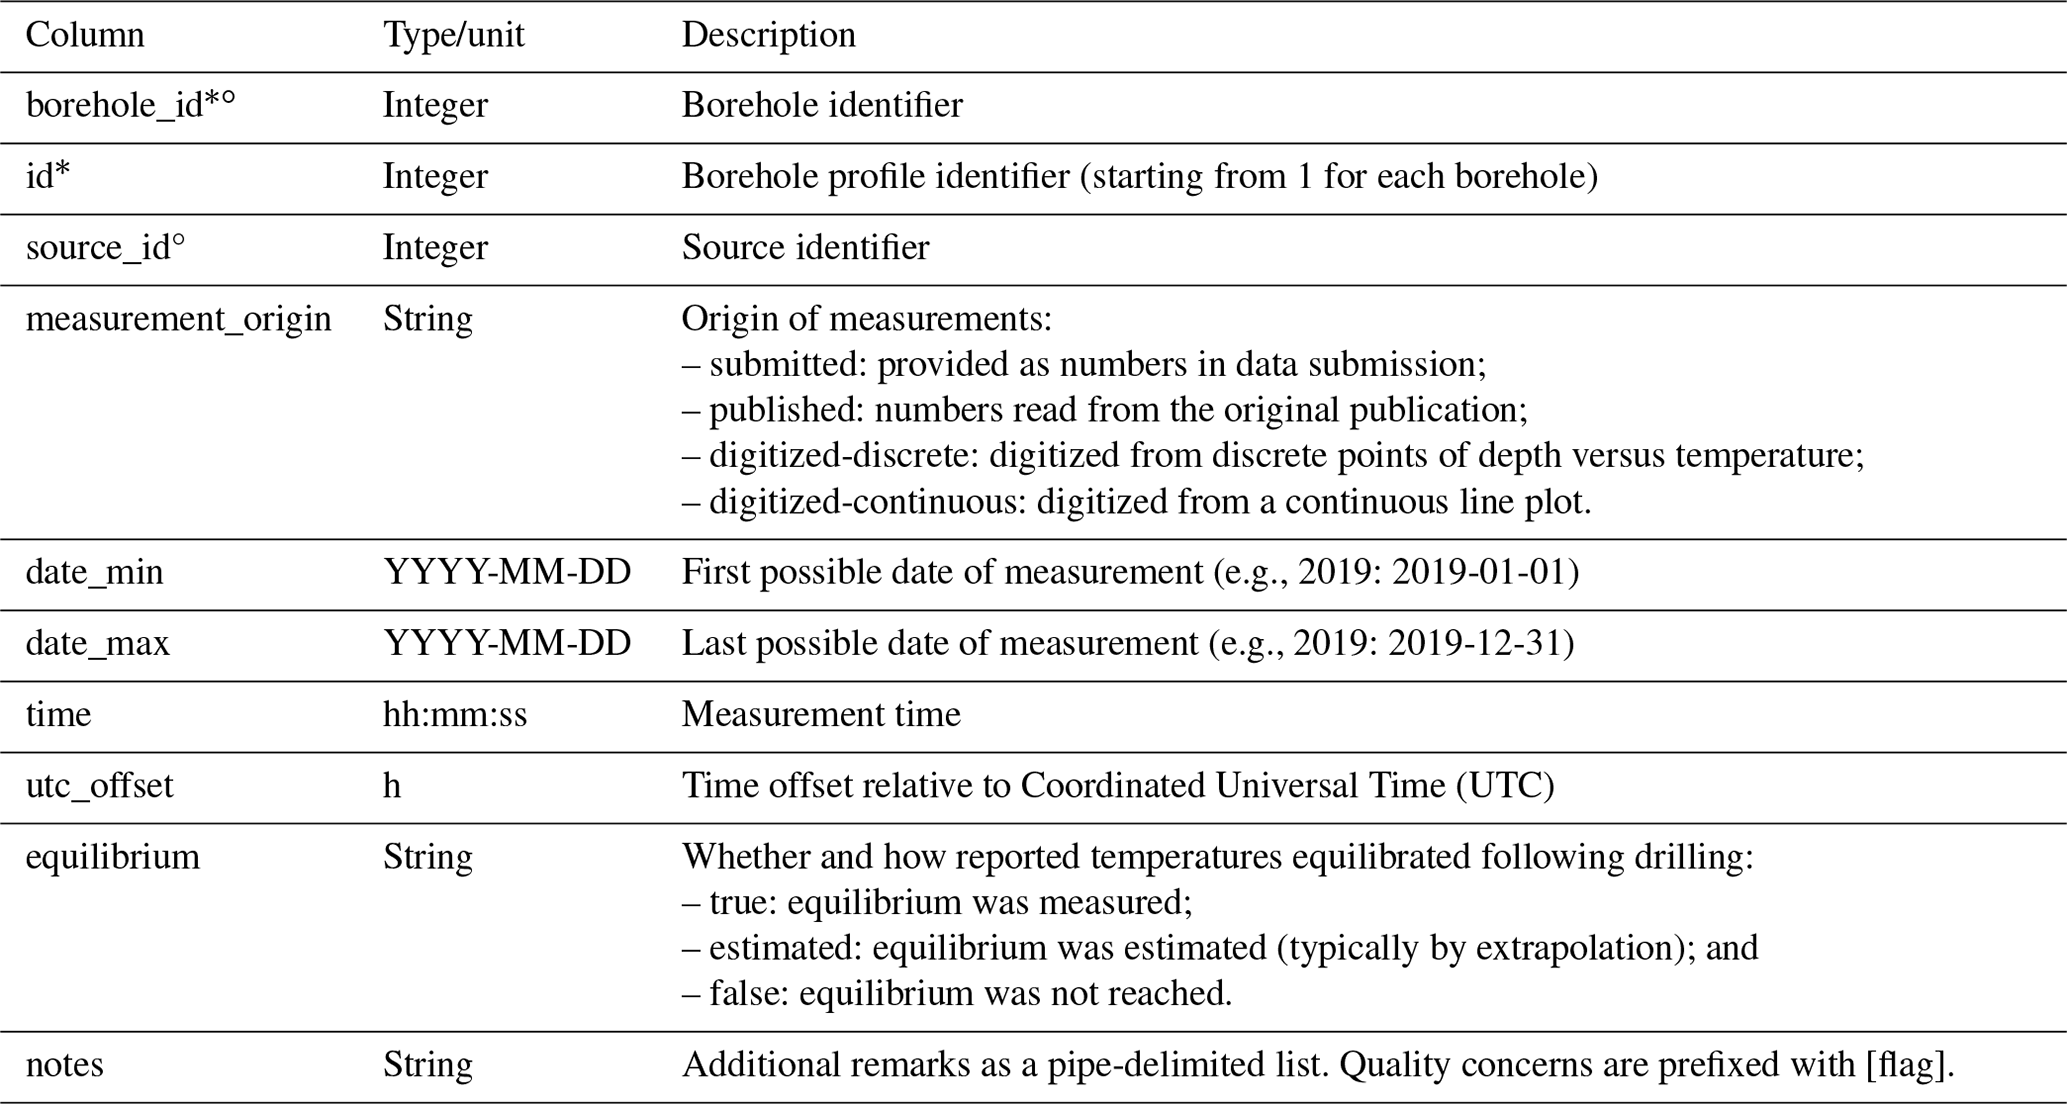
Table 4Columns of the measurement table (data/measurement.csv and data/**/measurement.csv), where indicates subdirectories that hold separate profile.csv and measurement.csv files from boreholes with many profiles (e.g., from automated loggers). Composite primary keys are indicated with *, foreign keys with °.
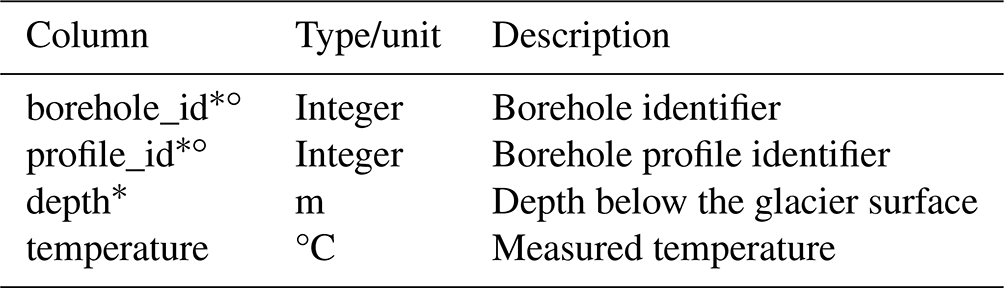
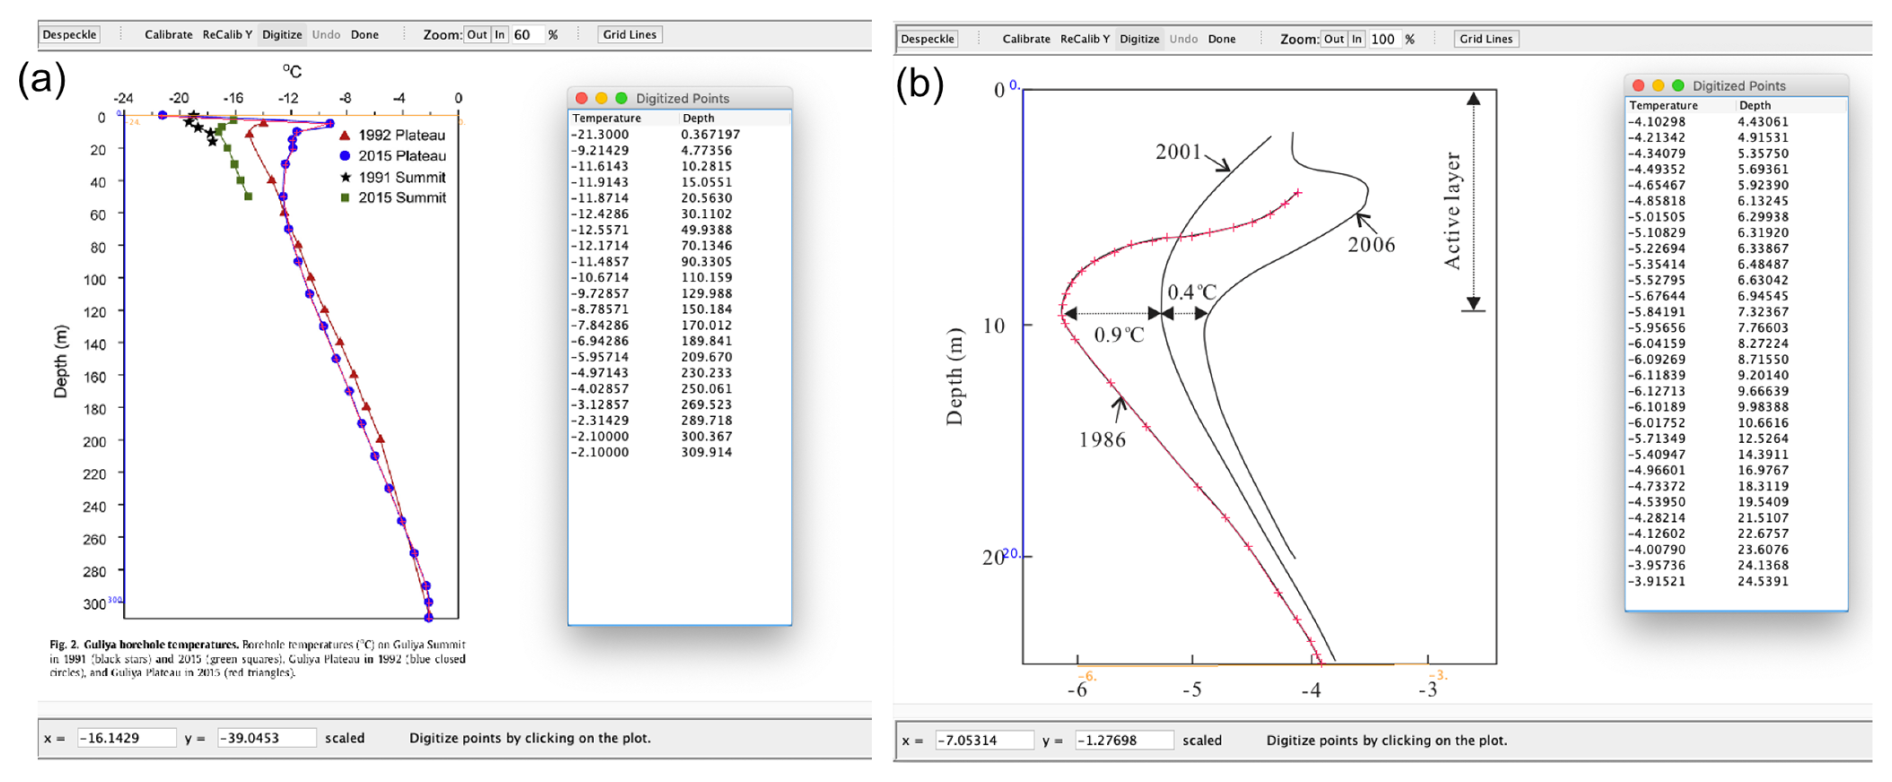
Figure 3Screenshots of the digitization process with Plot Digitizer (https://plotdigitizer.sourceforge.net, last access: 7 April 2024), where temperature and depth are plotted either as (a) discrete points for each measurement or (b) a continuous line with unknown measurement locations. The data are from (a) ![]() (Guliya Ice Cap, GLIMS ID G081455E35226N) and (b)
(Guliya Ice Cap, GLIMS ID G081455E35226N) and (b) ![]() (Urumqi Glacier No. 1, GLIMS ID G086810E43111N).
(Urumqi Glacier No. 1, GLIMS ID G086810E43111N).
2.4 Errors from digitization and data reproduction
In addition to the uncertainty of the original measurements, errors are introduced when the measurements are reproduced in tables or figures (henceforth “reproduction error”), and again when these reproductions are digitized (henceforth “digitization error”). Such errors can multiply if the data are shared between researchers or digitized from older publications and reprinted in subsequent publications. In 109 cases, we acquired the same temperature profile from two different sources (a published figure replaced by a data submission, table, or better figure), allowing us to assess the magnitude of reproduction errors (inclusive of digitization errors). In order to quantify the digitization error in isolation, 177 temperature profiles were digitized by two different people. This exercise also allowed us to refine our method by identifying avoidable human errors and software quirks (e.g., wrong scaling of an axis or misplaced points). We calculated both of these errors from profile pairs as the difference between their temperatures after interpolating (but never extrapolating) the temperatures of one to match the depths of the other.
As far as we know, glenglat is the largest collection of englacial temperature measurements. It contains 1 931 831 measurements of depth and temperature, organized into 256 450 profiles from 788 boreholes (Fig. 4). We included 39 366 profiles (for 80 boreholes) from 10 data submissions. The remaining data were extracted from 203 primary literature sources (see Table A1), with an additional 115 secondary sources helping to further populate the metadata. Non-English sources make up 20 % (60) of all primary sources but 48 % (48) of those published before the year 2000.
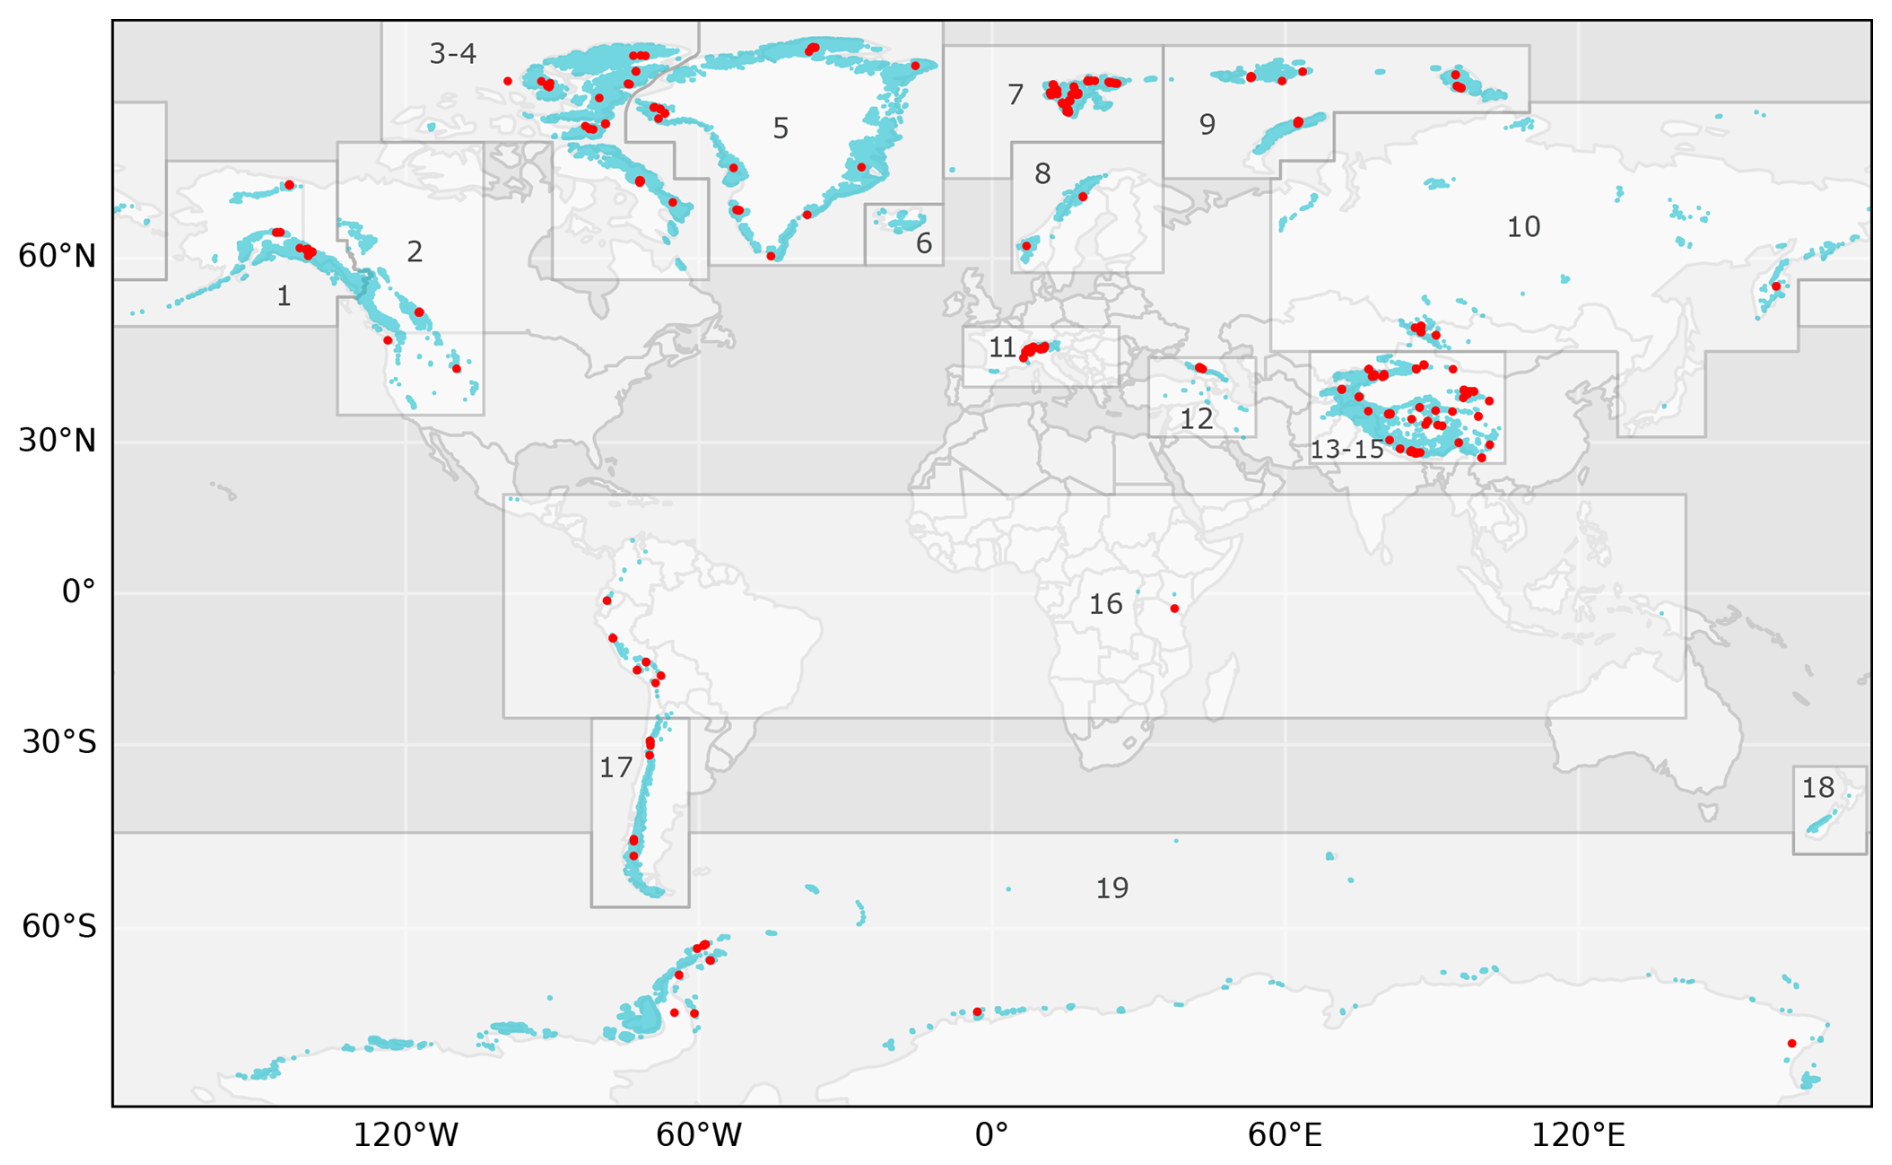
Figure 4Spatial distribution of temperature measurements recorded in glenglat. Boreholes are plotted in red, glaciers (according to the Randolph Glacier Inventory (RGI) 7.0; RGI Consortium, 2023) in light blue. The Global Terrestrial Network for Glaciers (GTN-G) glacier regions (GTN-G, 2017) are shown in gray and are numbered; these correspond to the region numbers in Fig. 6.
3.1 Thermal regimes and borehole depths
A variety of thermal structures can be identified in the temperature profiles (Fig. 5). The borehole from the Devon Ice Cap (Nunavut, Canada; data from Paterson and Clarke, 1978) is an example of fully cold conditions. At depth, the temperature increases at a rate largely determined by the geothermal heat flux (heat conduction from Earth's interior). In contrast to the fully cold conditions, profiles can be fully temperate, such as on Hansbreen (e.g., Svalbard; data from Jania et al., 1996), where the ice temperature decreases with depth in accordance with the lowering of the pressure melting point. Between these two endmembers, there is a lot of variety. At Grenzgletscher (Switzerland; data from Ryser et al., 2013; Hoelzle et al., 2011) and White Glacier (Axel Heiberg Island, Canada; data from Blatter, 1987), for example, the ice in the accumulation area is colder than the ice in the ablation area, indicating that the cold ice is warmed (e.g., by shear heating and latent heat release) as it advects down from the accumulation area. The opposite is true at Kongsvegen (Svalbard; data from Björnsson et al., 1996), where the latent heat release of refreezing meltwater and precipitation is high enough to eliminate the winter cold wave and create temperate firn and ice in the accumulation area. In the ablation area lower on the glacier, meltwater and precipitation can run off, allowing the near-surface ice to cool into a layer of cold ice superimposed onto the temperate ice.
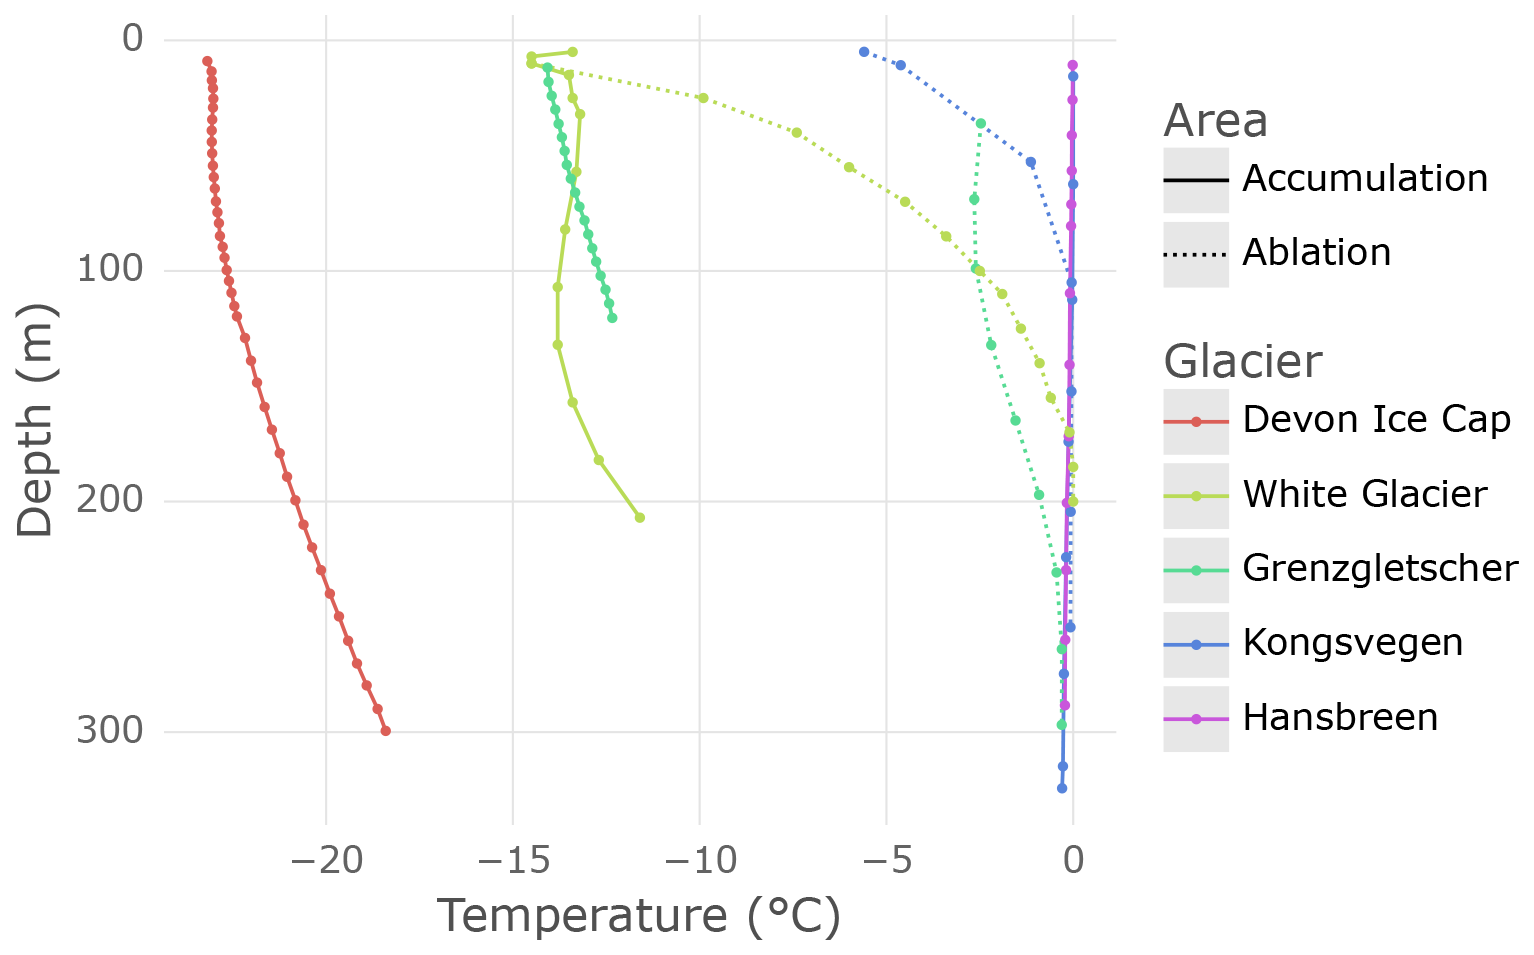
Figure 5Measured profiles demonstrating the range of englacial temperatures and some typical profile shapes – from fully cold (Devon Ice Cap; Paterson and Clarke, 1978) to fully temperate (Hansbreen; Jania et al., 1996). Measurements from the accumulation areas are plotted with solid lines, those from ablation areas with dotted lines.
The temperatures measured in the boreholes range from temperate (i.e., at the pressure melting point) to −33.5 °C (the lowest temperature at 15 m depth is −31.7 °C). The majority (67 %) of boreholes deeper than 15 m are in cold or polythermal ice (defined as those where the maximum measured temperature is colder than −0.25 °C), with only 7 % of all boreholes deeper than 15 m showing fully temperate conditions (i.e., the coldest measured temperature at any depth below 15 m is warmer than −0.25 °C). This is not surprising. For one, temperate (or even partially temperate) ice is of little interest to ice core investigations because it does not retain a memory of past climatic conditions (though research for dating temperate cores is ongoing; see, e.g., Di Stefano et al., 2024). Secondly, temperate ice measurements are deemed less interesting. Therefore, englacial temperature measurements are rarely carried out on glaciers that are assumed to be fully temperate, and if temperate conditions are measured, the results are rarely published. However, such measurements would be very valuable for training and calibrating models that predict glacier thermal regimes at regional to global scales. At present, it may be possible to train a model to accurately identify cold or polythermal glaciers, but it would be harder to constrain the boundaries – in terms of elevation, latitude, mean air temperature, etc. – between cold and temperate ice.
The median of the maximum measured depths in all boreholes in glenglat is 20 m (see Fig. 6). A total of 508 boreholes (64 %) were measured at depths greater than 15 m, and 151 (19 %) were measured at depths greater than 100 m. Only 147 (19 %) are known to have reached the glacier bed, including the deepest one, a 724 m ice core borehole drilled on ![]() (Akademii Nauk Ice Cap, Severnaya Zemlya, Russia; Kotlyakov et al., 2004).
(Akademii Nauk Ice Cap, Severnaya Zemlya, Russia; Kotlyakov et al., 2004).
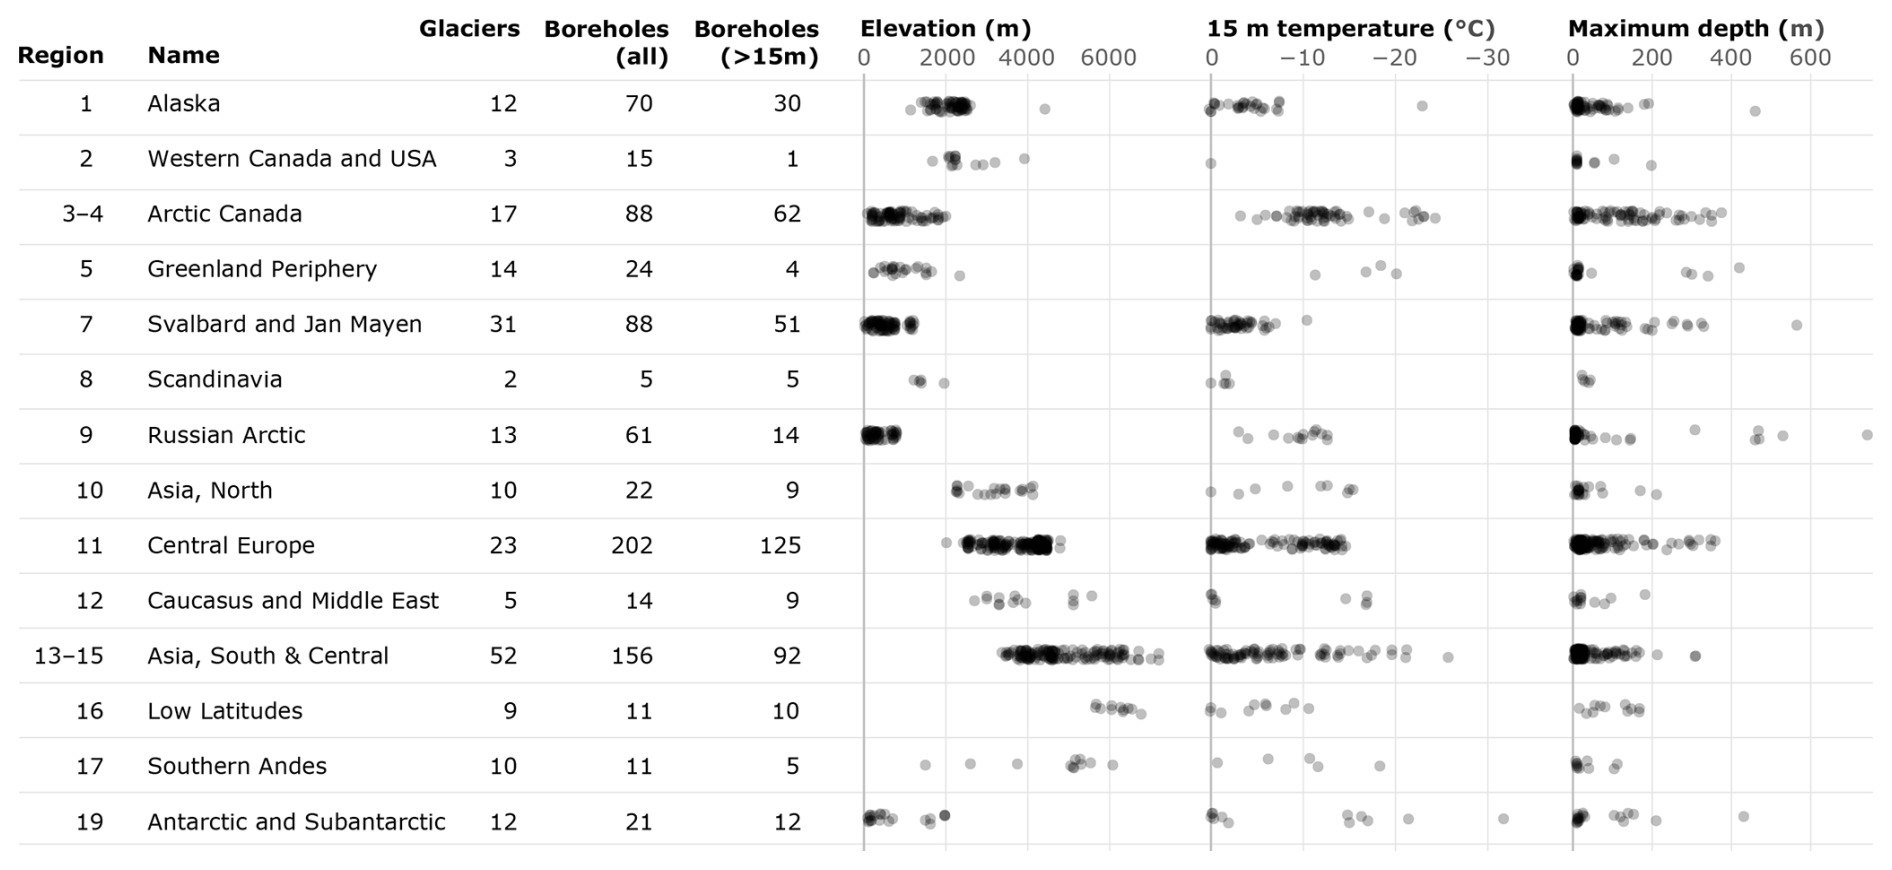
Figure 6Overview of the borehole counts (all and those deeper than 15 m) and the surface elevation, the 15 m temperature, and the maximum measured depth for each borehole (each represented by a dot) by region (see Fig. 4).
Of 224 boreholes with a reported ice surface depth (an attribute that was added later and thus likely incomplete with respect to the available literature), 131 actually reached ice, whether at 0 m depth (for 82 boreholes) or below a maximum of 80 m of snow and firn (at Col du Dôme, France; Gilbert and Vincent, 2013). Unfortunately, whether a borehole was drilled into snow, firn, ice, or a combination thereof is not always known. For applications where this is relevant, the stratigraphy can often be estimated – if not explicitly reported – from the depth of the borehole and its location on the glacier (e.g., ablation or accumulation area). Further complicating the borehole stratigraphy, repeat measurements in the same borehole typically define depth relative to the glacier surface at the time of the initial drilling or thermistor installation, despite accumulation and ablation that may occur in the interim. This can lead to spurious and above-zero temperature measurements if thermistors melt out over time. Only in very rare cases (e.g., in Harrison et al., 1975) are the changes in the surface elevation recorded in detail.
3.2 Climatic conditions
Compared to the average climatic conditions at the locations of all glaciers in the Randolph Glacier Inventory (RGI) 7.0 (RGI Consortium, 2023), the locations selected for englacial temperature measurements are biased towards cold and dry conditions (Fig. 7a). Most boreholes are in locations where the total annual precipitation is less than 1 m yr−1 and the mean annual air temperature is below −5 °C. This focus on regions with a continental climate is again not surprising, because the high accumulation rates and warmer air temperatures of maritime climates are more likely to lead to temperate ice – which is considered less interesting – or high ice fluxes – which are not desirable for ice core measurements (e.g., Vance et al., 2016; Bohleber, 2019).
To explore the controls on englacial temperatures, we take the 15 m temperature – the depth at which seasonal temperature variations have mostly disappeared (see Fig.8) – as an indicator of the local glacier thermal regime. Comparing borehole temperatures measured since 1960 to the mean annual air temperature (MAAT) (ERA5-Land from Muñoz Sabater, 2019) of the 10 years prior to the borehole measurement reveals that temperate ice can occur over a wide range of surface air temperatures (Fig. 7b). Englacial temperatures generally decrease with decreasing air temperature, but they are also consistently warmer than the temperatures at the surface. This is expected, given the numerous processes that can deliver heat into the glacier (latent heat release and geothermal, frictional, and strain heating). This warm bias is smallest at the coldest surface temperatures (presumably because there is little melt) but can still be up to +10 °C at −20 °C. It reaches a maximum of +15 °C at −15 °C before gradually decreasing towards warmer temperatures only because ice cannot be any warmer than the melting point. Temperate ice does not seem to occur where the mean annual air temperature is below . It is unclear, however, whether the absence of temperate ice in colder climates is real or due to the undersampling of temperate glaciers.
The trends and boundaries in Fig. 7b need to be evaluated with respect to possible caveats of the chosen dataset and are only intended to show broad patterns. ERA5-Land (and other reanalysis products) may not be able to represent the true variability of temperature fields or precipitation patterns in complex alpine terrain. The observed “warm bias” could therefore partly be due to biases within this dataset, and the 2 m air temperature is in reality not the true surface boundary condition. Beyond this, the chosen lapse rate (in our case ) changes the relationship between air temperature and englacial temperature, though we found that it mostly affects the positions of the data points relative to the 1:1 line, while the overall shape remains stable. In reality, of course, englacial temperatures are controlled by much more than mean annual air temperature and precipitation, and the consideration of 15 m temperatures further ignores the facts that (i) temperate ice can exist at deeper locations within the ice even under very cold conditions (e.g., due to shear heating; Blatter, 1987), (ii) ice temperatures can be controlled by glacier dynamics more than by climate (e.g., emergence of cold ice in the ablation area of a glacier in a temperate climate; Ryser et al., 2013), and (iii) ice at depth has a memory of past surface temperatures, which can lead to complex patterns of englacial temperatures that are not reflected in the 15 m temperature. Despite these caveats, the large number of englacial temperature measurements available in glenglat makes it possible, for the first time ever, to investigate global patterns of englacial temperatures and hopefully find more robust ways of predicting the thermal regime of all glaciers in a region or worldwide.
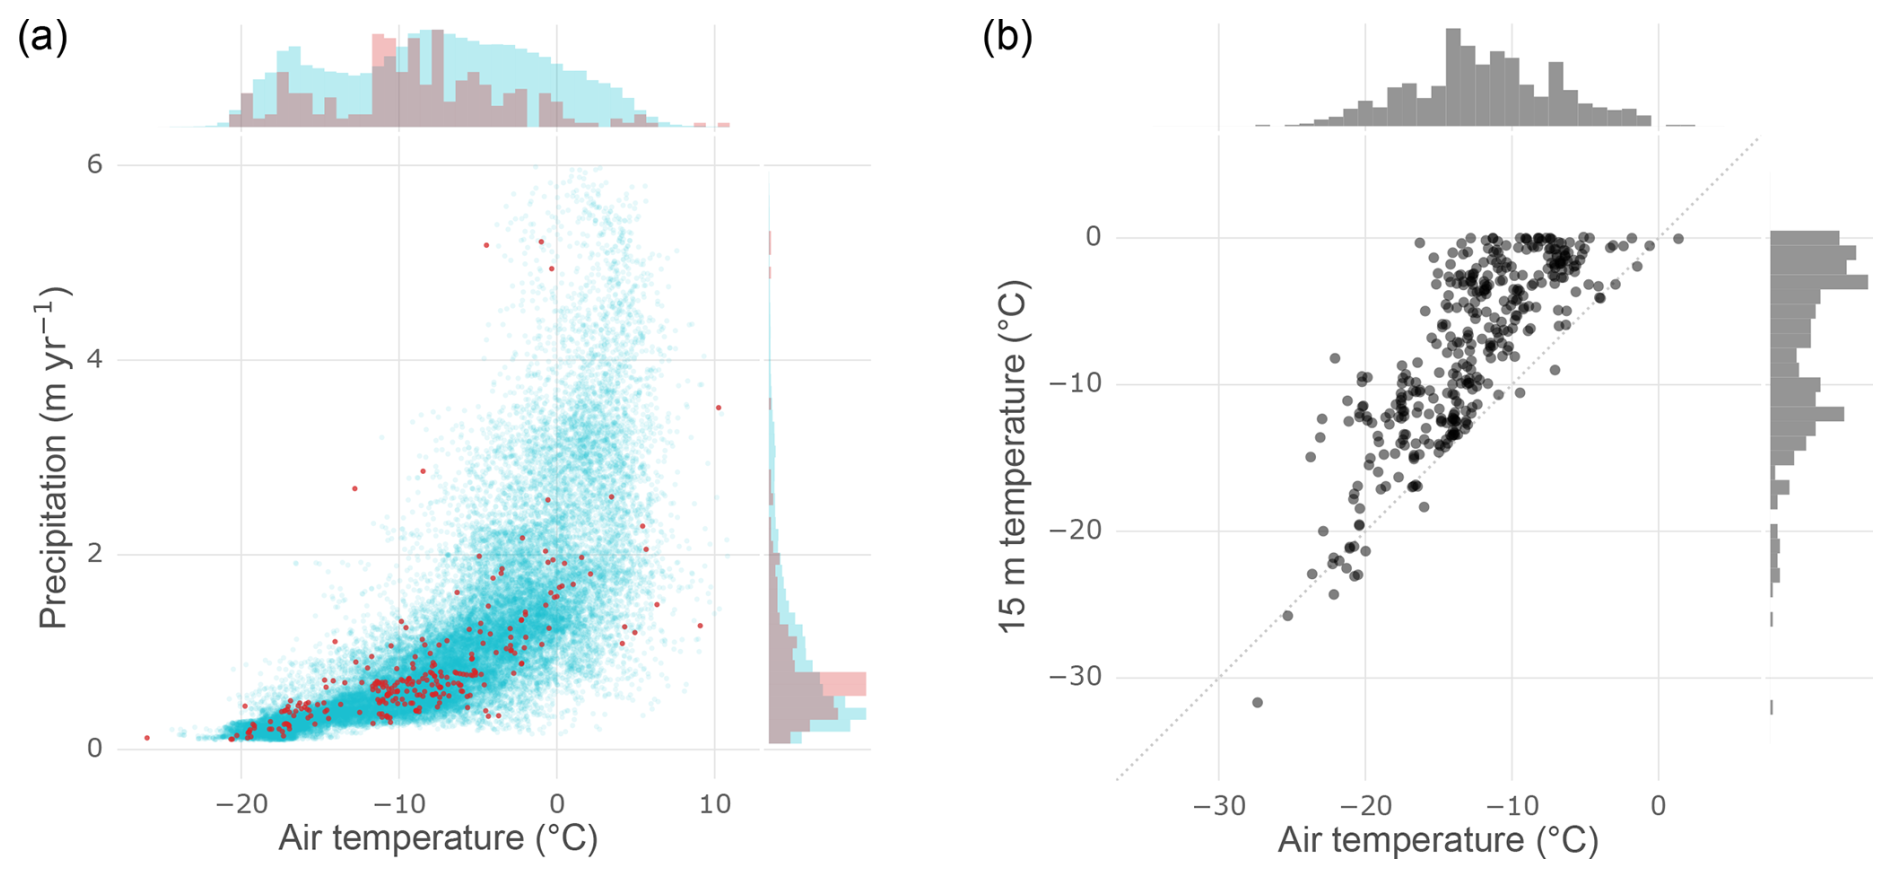
Figure 7(a) Distribution of the 2000–2019 mean annual 2 m air temperature and total annual precipitation for the locations of glenglat boreholes (red) and the locations of all RGI 7.0 glaciers (blue). (b) Englacial temperatures (1960 to the present) at 15 m depth versus mean annual air temperature at the borehole locations for the 10 years prior to the borehole measurement. Air temperatures were adjusted to the elevation of the borehole using a lapse rate of . The climate data are from ERA5-Land (Muñoz Sabater, 2019).
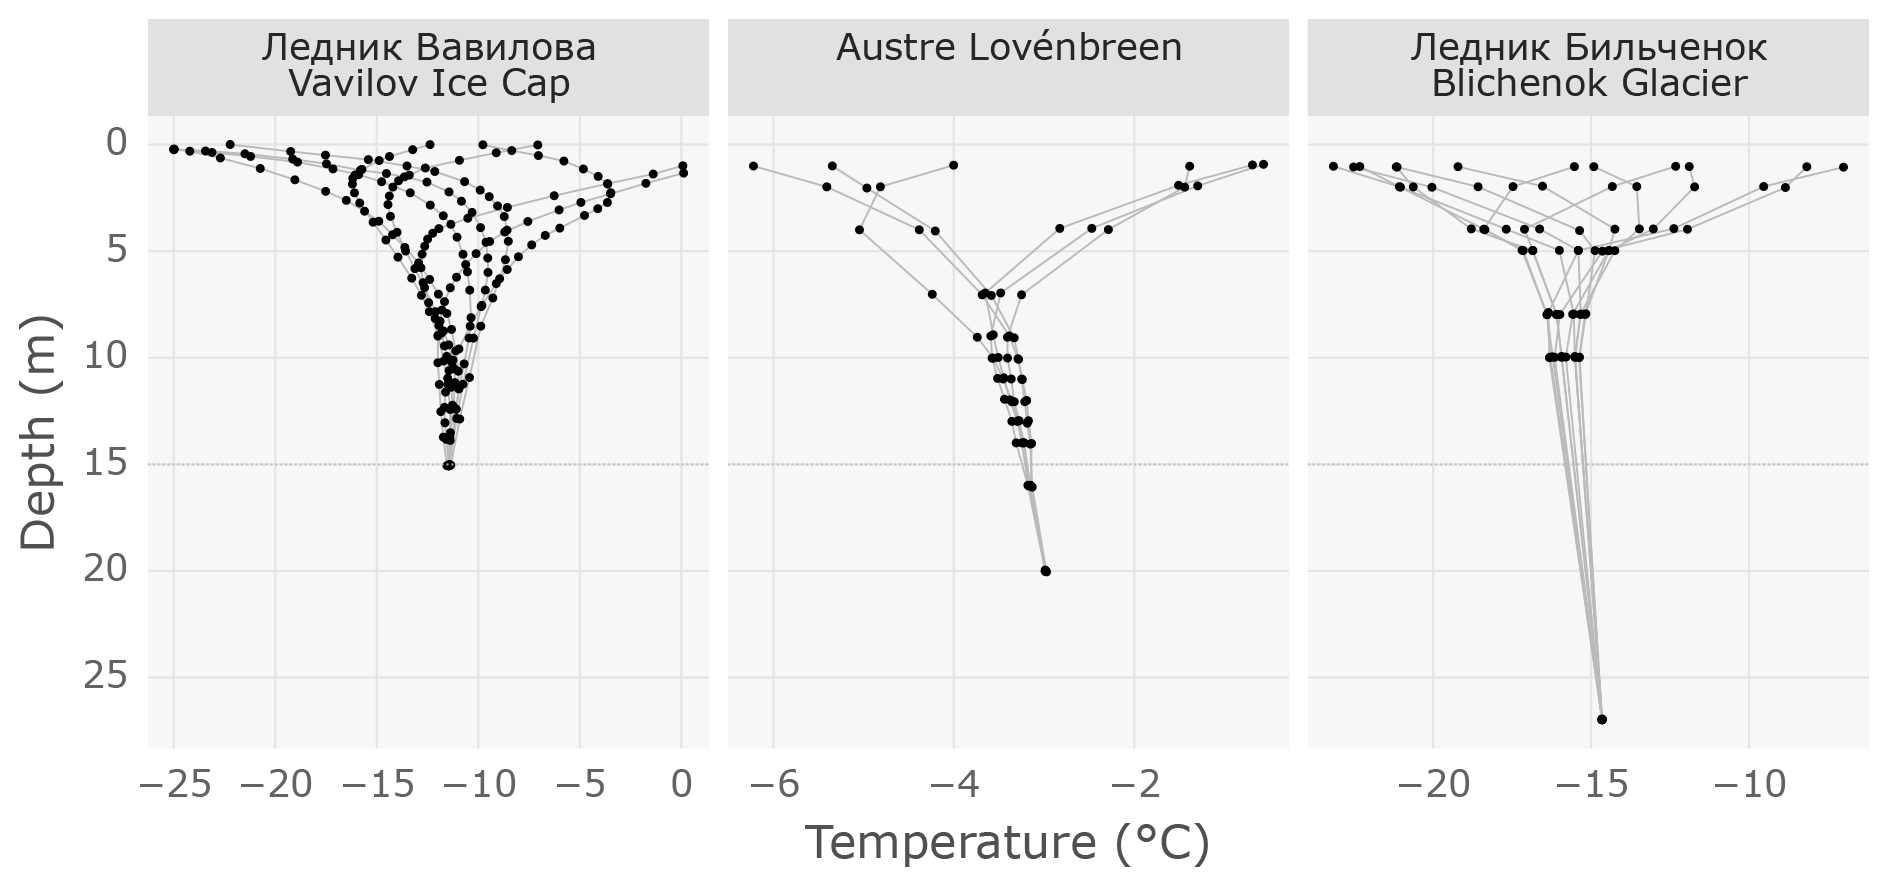
Figure 8Examples of temperature profiles measured in the same borehole at different times of the year, showing the elimination of seasonal surface temperature variations at a depth of around 15 m. Data are from Vavilov Ice Cap (Barkov et al., 1988), Austre Lovénbreen (Sun et al., 2016), and Blichenok Glacier (Shiraiwa et al., 2001).
3.3 Spatial, temporal, and elevation distributions
The 788 boreholes in glenglat are located on 213 individual glaciers (based on their GLIMS IDs) scattered across the world (see Figs. 4 and 6). This represents less than 1 ‰ of all glaciers worldwide, illustrating both how laborious englacial temperature measurements are (see Appendix A) and how interest in this glacier variable remains relatively limited. Two-thirds of all boreholes (68 %) are in Arctic Canada (88), Svalbard and Jan Mayen (88); central Europe (202 – albeit with 80 on a single glacier, Grenzgletscher); and South and Central Asia (156). Conversely, there are only 5 boreholes in Scandinavia and 11 in the southern Andes, with 0 in Iceland or New Zealand. If we envision using global or regional models to constrain thermal regimes by space, elevation, temperature, precipitation regime, or glacier dynamics, we ideally need measurements that span the transition and range of conditions where glaciers exist. In this context it is important to understand which data are present in a possible training dataset. In the following, we therefore briefly discuss the temporal and spatial patterns of the data in glenglat.
The surface elevations of boreholes in glenglat range from 14 m a.s.l. (Erikbreen, Svalbard; Ødegård et al., 1992) to 7200 m a.s.l. (Dasoupu Glacier, China; Yao et al., 2002). Compared to the elevation distribution of glaciers worldwide (as represented by RGI 7.0), elevations above 2000 m are oversampled and elevations between 750 and 1500 m are undersampled (Fig. 9). This sampling bias may have several causes. Topographic saddles and summits of very-high-elevation glaciers (>4500 m) are of particular interest to ice core science because ice flow, accumulation, and melt are minimal and a maximum number of annual ice layers can be preserved. The middle elevations (2000 to 4500 m) are likely oversampled because they circumvent many of the challenges of work at very high elevations, allowing for simpler (helicopter) logistics and reasonable working conditions. Additionally, this is the elevation range of glaciers in central Europe (region 11; see Figs. 4 and 6), which are historically overstudied compared to other regions. Below 2000 m, most of the data come from Svalbard and Jan Mayen (region 7) and Arctic Canada (regions 3–4). Though there are many measurements from these regions, lower elevations remain undersampled, likely because (i) there is a very large glacierized area in this elevation band, (ii) there is a lack of interest in measurements from temperate ice (e.g., the large low-lying glaciers along the western coast of Alaska), (iii) the tongues of tidewater glaciers – which make up a large portion of this band – are notoriously difficult to access, and, (iv) when accessing land-terminating glaciers in these remote regions, working on their low-elevation tongues is easier than accessing the higher-elevation accumulation areas (750 to 1500 m).
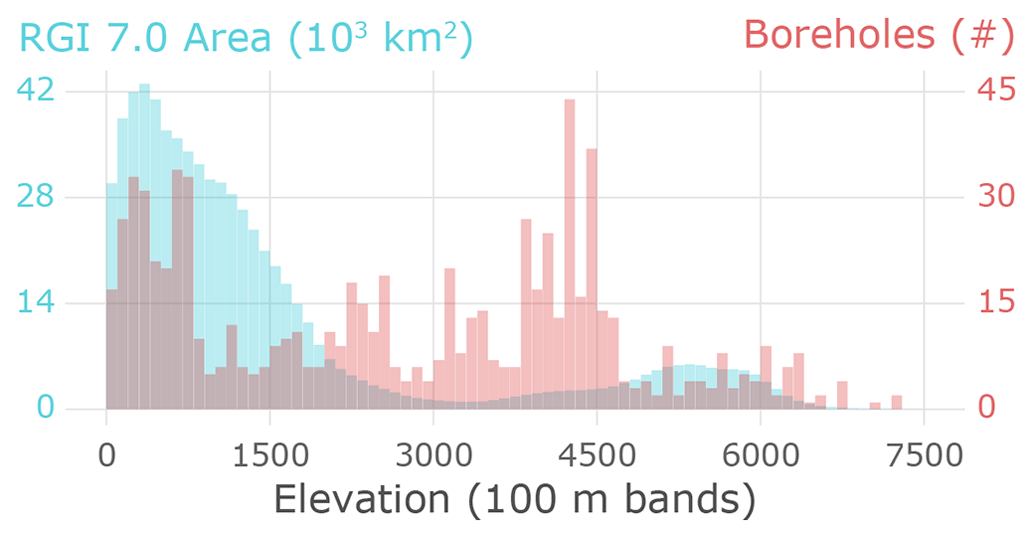
Figure 9Elevation distribution of glenglat boreholes (red) compared to the elevation distribution of all RGI 7.0 glaciers (blue). Higher elevations, especially between 2000 and 4500 m, are oversampled, while low elevations are undersampled.
The earliest measurement in glenglat stems from 1842, when Louis Aggasiz and colleagues drilled a 60 m borehole in temperate ice on Unteraargletscher (Agassiz, 1847) in Switzerland (see Fig. 10). With the exception of other early outliers (1911, Vallot, 1913; 1938, Hughes and Seligman, 1939; 1948, Sharp, 1951), widespread measurement did not begin until the late 1950s – in large part motivated by the 1957/1958 International Geophysical Year – when drilling technology and motorized transport were developed enough to allow increasingly ambitious expeditions to remote areas. Mid-century measurements likely remain underrepresented in glenglat because of early and obscure publications that were never indexed nor published online. After sustained activity since the 1970s, measurements declined beginning in 2015, which may be the result of a lag between data collection and publishing, reduced interest and funding for complex field campaigns, a shift in focus from glaciers to ice sheets, or increased emphasis on modeling and remote sensing. The wide range of measurement dates in glenglat could present a challenge for training or calibrating numerical models, as it requires longer model runs and inputs (e.g., climate reanalysis) from earlier periods with fewer and lower-quality data.
Of all the boreholes in glenglat, 209 (27 %) have repeat temperature measurements. The most frequently measured borehole is on Hintergrat Glacier (Italy; Carturan et al., 2023a), with 5 years of hourly measurements (2011–2016). The longest monitored borehole is CG05-1 on Grenzgletscher (Switzerland; Hoelzle, 2014; Darms, 2009; Hoelzle, 2017), drilled in 2005 and measured four times over 8 years (2007–2015). The lifetime of a single borehole is limited by creep closure, internal deformation, and other forces that inevitably lead to equipment failure, so to achieve longer records, a new borehole is drilled and instrumented nearby. A cursory review of boreholes within 100 m reveals only a few locations with multiple comparable boreholes and temperatures spanning more than 20 years, all of which are the result of deliberate repeat studies (Vincent et al., 2020; Hoelzle et al., 2011; Thompson et al., 2018; Mikhalenko et al., 2005a; Rabus and Echelmeyer, 2002; Li et al., 2011). Clusters of more distant boreholes, however, suggest opportunities for retroactive comparisons.
The low percentage of locations that have been measured more than once indicates that there is a large potential for repeat measurements that would yield insight into how englacial temperatures have changed. Repeat measurements could focus on locations with deep boreholes (e.g., more than 30 m), predominantly cold englacial temperatures, high measurement accuracies (low reported uncertainties), and a last measurement dating back around 20 years or more. Ignoring surge-type glaciers, a search of glenglat reveals high-value repeat-measurement locations in many different regions and climates. Some examples that fall into this category include Nevado Illimani (Bolivia, 138 m, measured in 1999; Gilbert et al., 2010), Vavilov Glacier (Russian Arctic, up to 460 m, last measured in 1985; Morev et al., 1988), or Åsgårdfonna (Svalbard, 185 m, measured in 1993; Uchida et al., 1996).
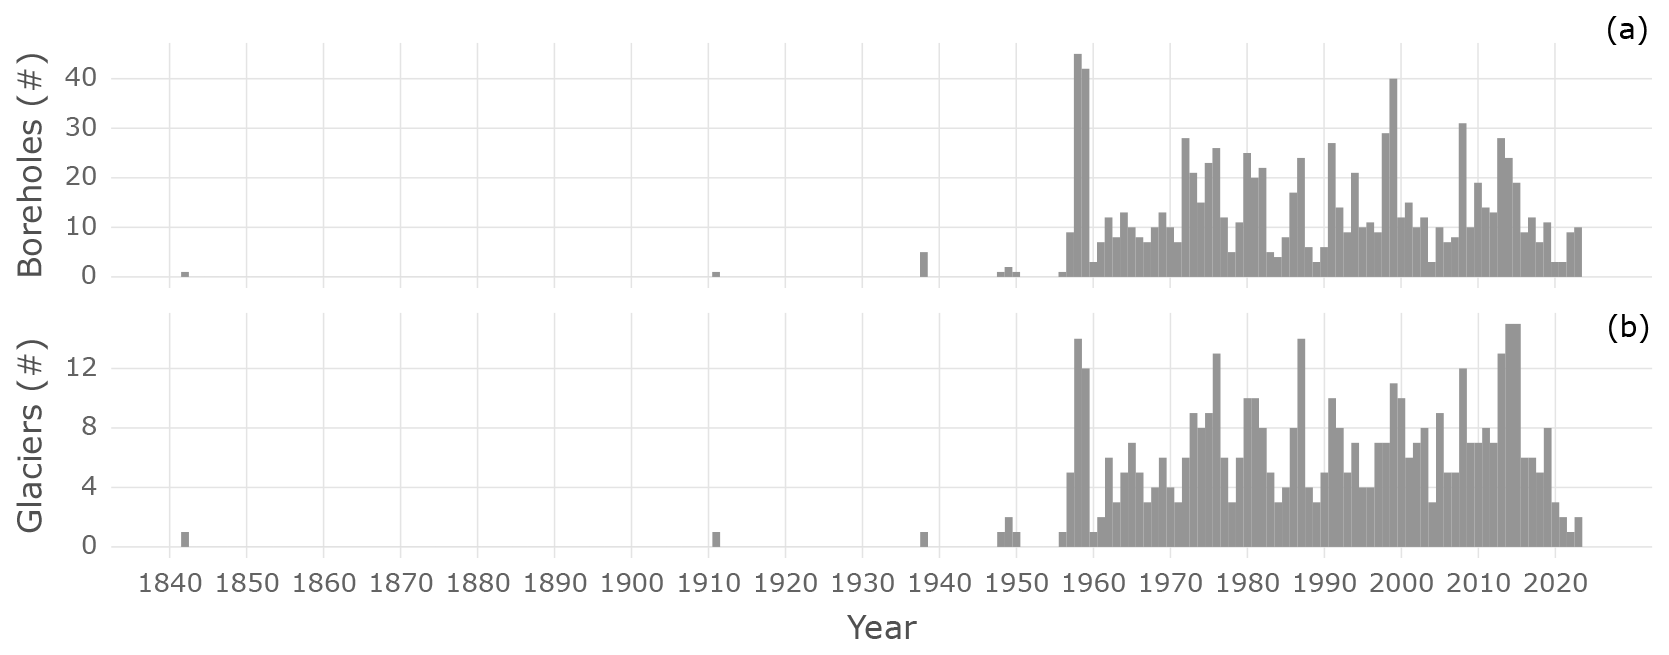
Figure 10Number of measured boreholes (a) and number of measured glaciers (b) for each year. We assume that early measurements are still underrepresented, because publications were not archived. The drop-off towards more recent years may be due to the lag between drilling and publication or changes in research and funding priorities.
3.4 Error analysis
In our analysis, we distinguish between three sources of uncertainty in the reported englacial temperatures: the reported uncertainty of the original measurements, errors introduced by their subsequent textual or graphical reproduction, and errors associated with the digitization of graphical reproductions.
The measurement uncertainty encompasses a wide range of instrumental, methodological, and environmental factors. The design and calibration of a thermistor determine the precision and accuracy with which it measures temperature. Whether the measured temperature differs from the temperature of the glacier is primarily determined by the extent to which the borehole reached thermal equilibrium following drilling and sensor installation or the method by which an equilibrium temperature is extrapolated from a sensor cooling curve. Secondary sources of thermal disturbance include “wind pumping” (air circulation within firn or snow caused by surface pressure changes; Clarke et al., 1987), sensor electronics (Ryser et al., 2013), and artificial thermal coupling with the surface (e.g., the black tubing used in Davis, 1967). Finally, the uncertainty in the measurement depth translates into an uncertainty in the temperature at that depth, especially in areas with steep temperature gradients (e.g., near the surface).
Temperature measurement uncertainty is reported for 64 % of the boreholes included in glenglat (0.01 to 1.0 °C; see Fig. 11). Which sources of error that the value represents are rarely specified, but sensor design and calibration are often the only factors discussed. Other glenglat attributes like drilling method, drilling and measurement dates, whether and how equilibrium was reported to have been reached, and repeat measurements from the same borehole are thus helpful for independently assessing measurement uncertainty. Contrary to the suggestion of Løkkegaard et al. (2023) that sensor accuracy has improved substantially since 1950, we found no significant change in reported temperature uncertainties over time. This could reflect increased caution in error reporting, an acknowledgement that sensor accuracy is only one component of the total uncertainty, or indeed that the accuracy of the typical englacial temperature measurement has not improved significantly.
Depth measurement uncertainty is so rarely reported that no provision was made to track it in glenglat. In many cases, the reference surface for the depth measurements is not specified, nor whether this reference changed over time (e.g., the upper glacier surface at the time of installation or the snow–ice boundary at the time of measurement). As the glacier surface changes, so do the depths of the sensors relative to this surface, and this can complicate the comparability of measurements through time.
Figure 11 presents the reported measurement uncertainties alongside errors introduced by data reproduction and digitization. For the sake of comparison, we describe each distribution by the 0.5 (median), 0.68, and 0.95 quantiles (of the absolute values). For measurement uncertainties, these are 0.1, 0.2, and 0.3 °C. Reproduction errors were calculated as the difference between temperatures for the same profile retrieved from a figure versus either a table or another figure (and they thus include digitization error). They are typically smaller than measurement uncertainties (0.05, 0.10, and 0.51 °C), especially at depths greater than 15 m (0.04, 0.09, and 0.31 °C). The largest of these are due to different measurements being included (the impact of which is greatest near the surface, where temperature gradients are steepest), actual differences in the reported temperatures, or poor figure quality (e.g., large °C/pixel size or non-square axes from hand drawing or bad scanning). Random digitization errors (isolated from reproduction errors) were calculated as the difference between temperatures for the same profile and figure digitized by two different people. They are smaller (0.03, 0.05, and 0.23 °C) and sensitive to the interaction between figure scale and temperature gradient. The °C/pixel sizes of the figures' digitized temperature axes – an imperfect proxy for their effective resolution – range from 0.002 to 0.109 °C (median 0.016 °C) and are weakly correlated with the digitization errors (R2=0.058, slope =1.29). However, the °C/pixel sizes of the depth axes – once converted to °C based on the local slope of the profile – range from 0.000 to 1.007 °C (median 0.007 °C) and explain the observations much better (R2=0.483, slope=1.26).
A full assessment of uncertainty would require a careful evaluation of each profile (e.g., Løkkegaard et al., 2023), including a review of the original sources, since these often contain more details than could be integrated into glenglat. However, we can provide some general guidance to users: favor data with low reported measurement uncertainties sourced from textual reproductions (measurement_origin “submitted” or “published”), inspect the source of digitized data (measurement_origin “digitized-discrete” or “digitized-continuous”), favor profiles known to have reached thermal equilibrium (equilibrium), and avoid interpolation at depths with steep temperature gradients.
Reducing and quantifying uncertainties will be crucial for detecting and correctly interpreting the long-term thermal evolution of glaciers and ice sheets, so we urge future campaigns to carefully assess uncertainties and thoroughly and precisely describe their measurements. To eliminate reproduction and digitization errors in the future, new and existing measurements should be published somewhere as text, e.g., by submitting them directly to glenglat (see Sect. 3.5).
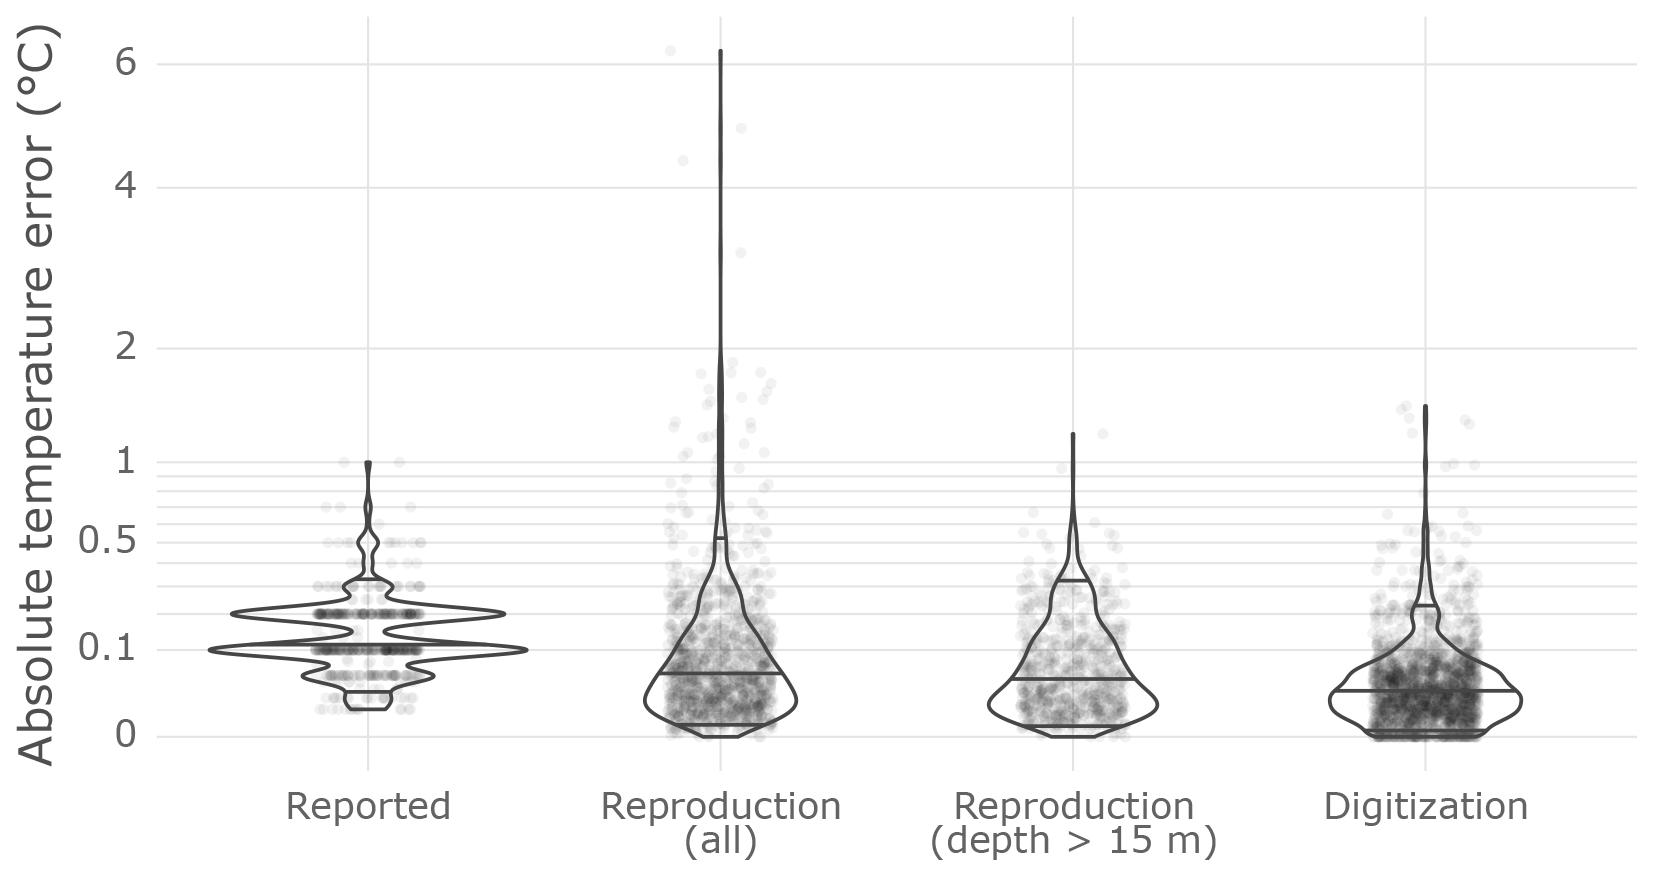
Figure 11Distribution of the reported measurement uncertainties alongside distributions of the absolute values of the reproduction errors (comparing the same measurement from different sources) and digitization errors (comparing the digitization of the same measurement by two different people). The y axis uses square-root scaling to accentuate differences near 0 °C. For each distribution, horizontal lines are drawn at the 0.05, 0.5 (median), and 0.95 quantiles.
3.5 Future additions
We hope that glenglat will serve not only as a valuable resource for glaciological research today, but also as a long-lived data repository for additional past and future englacial temperature measurements. The dataset is currently hosted at https://github.com/mjacqu/glenglat, last access: 7 April 2024. To encourage and facilitate submissions, we have included detailed instructions, a Microsoft Excel spreadsheet template, and a tutorial showing how to self-validate the data prior to submission using the Frictionless Python package. We have done our best to populate all fields of the database, but certain columns were added at a later stage of the database creation process, and we were not able to revisit every source every time. Therefore, not all columns are equally well populated. Additions to or refinements of existing entries are welcome any time, either by emailing the authors or by creating an issue at https://github.com/mjacqu/glenglat/issues, last access: 7 April 2024. Community members are also welcome to take on existing issues and contribute to the improvement of the dataset in this way. Anyone who submits data to glenglat will be invited to become a co-author of future releases of the dataset (see the detailed authorship policy at https://github.com/mjacqu/glenglat/tree/main?tab=readme-ov-file#authorship-policy, last access: 7 April 2024).
Published versions of glenglat are released to Zenodo (https://doi.org/10.5281/zenodo.11516611, Welty et al., 2025). The database is maintained as a GitHub repository (https://github.com/mjacqu/glenglat, last access: 7 April 2024) which also contains all of the Python code for the tests, build process, and Zenodo publishing described above. It also contains a Jupyter notebook with tutorials on how to download the data from Zenodo, read the data into Python, and produce statistics and plots similar to those in this paper. It can be run in Google Colab (https://colab.google, Google, 2025). This paper refers to version 1.0.0 (https://doi.org/10.5281/zenodo.15005624, Welty et al., 2025). glenglat is licensed under Creative Commons Attribution 4.0 International, though the repository's license does not extend to figures, tables, maps, or text extracted from publications. These are included in the sources folder for transparency and reproducibility. Full PDF files of the original sources will gladly be shared upon request. ERA5-Land climate reanalysis data (Muñoz Sabater, 2019) were downloaded from the Copernicus Climate Change Service (https://cds.climate.copernicus.eu, last access: 7 April 2024).
Dataset citation. When using glenglat, please cite both this publication (Jacquemart et al., 2025) and the version of the dataset that was used (Welty, Jacquemart et al. <year>. glenglat: Global englacial temperature database. <version>. Zenodo. <version doi>). We also recommend citing the original sources, especially when using only a subset. Finding and citing the original literature is facilitated by the bibliographic information that is provided in the source.csv file.
Based on an extensive literature search and data submissions, we have created glenglat, the first (to our knowledge) englacial temperature database for all glaciers outside of the ice sheets. Together with recent compilations of deep boreholes in Greenland by Løkkegaard et al. (2023) of shallow measurements for Greenland and Antarctica in the SUMup collaborative database (Vandecrux et al., 2023), most published englacial temperature measurements are now readily available to researchers. Depending on community needs, it may be worth combining these datasets into one, for lower maintenance overhead, for ease of use, and because the distinction between ice sheet and glacier will become increasingly arbitrary as glaciers detach from retreating ice sheet margins. Subsurface variables like density (as in SUMup) or stratigraphy (as in glenglat, but only for the depth of the snow–ice or firn–ice transition) may be worth adding, especially since these are often measured alongside temperature. Another enhancement would be to include qualitative temperature information, i.e., whether a borehole was measured as temperate (but no actual measurements were reported), together with the presence and depth of a cold–temperate transition surface (often extracted from ice-penetrating radar profiles as an indicator of the glacier thermal regime; Björnsson et al., 1996; Ødegård et al., 1992, 1997; Pettersson et al., 2003; Wilson et al., 2013).
We believe that glenglat can contribute to better modeling and understanding of englacial temperatures, their spatial distribution, and their changes in a warming world – most directly as an unparalleled source of observational data for model training and validation. For measurements to better reflect global glacier conditions, however, we see a general need for more measurements (or reporting thereof) from temperate glaciers, warmer climates, elevations between 750 and 1500 m, and underrepresented regions (e.g., Iceland, New Zealand, or Scandinavia). glenglat also presents new opportunities to investigate changes in englacial temperatures over time, both by making more evident the existence of repeat measurements and by documenting a century of early measurements that could now be deliberately repeated.
Table A1Summary of englacial temperature measurements contained in glenglat – sorted by glacier region and grouped by glacier (as defined by boreholes with matching glacier names or GLIMS IDs) – with borehole count, profile count, maximum depth, minimum temperature (at all depths and at 15 m in depth, if available), range of years, and sources. Since Copernicus Publications does not support non-Latin characters, only the English translations of the glacier names are provided here. A complete version is provided in Sect. S1 of the Supplement.

These are the authors of all the sources used to compile the data in glenglat. The list is sorted alphabetically by (Latin) family name, which is capitalized. The latinized form preserves the order of the original, which is family name first for Chinese, Japanese, and Korean names. Since Copernicus Publications does not support non-Latin characters, a version of this list that preserves the people's original names is provided in Sect. S3 of the Supplement.
Jakob ABERMANN ⋅ Andrey Andreevich ABRAMOV ⋅ Louis AGASSIZ ⋅ AHN Jinho ⋅ AI Songtao ⋅ Vladimir B. AIZEN ⋅ Jürg ALEAN ⋅ E. Calvin ALEXANDER JR. ⋅ Wenling AN ⋅ Katrine Krogh ANDERSEN ⋅ Teruo AOKI ⋅ Alberto J. ARISTARAIN ⋅ Serguei M. ARKHIPOV ⋅ Andy ASCHWANDEN ⋅ Giovanni BACCOLO ⋅ BAO Hanzhang ⋅ Weijia BAO ⋅ Martina BARANDUN ⋅ Stanisław BARANOWSKI ⋅ Carlo BARBANTE ⋅ V. R. BARBASH ⋅ Gonzalo BARCAZA ⋅ N. I. BARKOV ⋅ Andreas BAUDER ⋅ A. B. BAZHEV ⋅ Emilie BEAUDON ⋅ Jürg BEER ⋅ Sultan BELEKOV ⋅ Carl BENSON ⋅ Steven BERNSEN ⋅ Giuliano BERTAGNA ⋅ Etienne BERTHIER ⋅ Michele BERTÓ ⋅ Daniel BINDER ⋅ Robert G. BINGHAM ⋅ Helgi BJÖRNSSON ⋅ Erik BLAKE ⋅ Heinz BLATTER ⋅ Norbert BLINDOW ⋅ K. V. BLINOV ⋅ Per Helge BØ ⋅ Carl Egede BØGGILD ⋅ Pascal BOHLEBER ⋅ John F. BOLZAN ⋅ Hervé BONNAVEIRA ⋅ Jocelyne C. BOURGEOIS ⋅ Francisca BOWN ⋅ Claudio BRAVO ⋅ Henry H. BRECHER ⋅ Donald BREN ⋅ M. BRIAT ⋅ Joel BROWN ⋅ Sabine BRÜTSCH ⋅ M. S. BUGORKOV ⋅ I. V. BUZIN ⋅ CAI Baolin ⋅ Nicolas CAILLON ⋅ Seth W. CAMPBELL ⋅ R. Kramer CAMPEN ⋅ Alberto CARTON ⋅ Luca CARTURAN ⋅ Gino CASASSA ⋅ Federico CAZORZI ⋅ Jorge Luis CEBALLOS ⋅ Jérôme CHAPPELLAZ ⋅ Jizu CHEN ⋅ Xuejiao CHEN ⋅ CHEN Yaning ⋅ Anastasia CHEREMNYKH ⋅ R. A. CHERNOV ⋅ Taejin CHOI ⋅ Poul CHRISTOFFERSEN ⋅ Peter C. CHU ⋅ Garry K. C. CLARKE ⋅ David Farley CLASSEN ⋅ Henrik B. CLAUSEN ⋅ David CLEMENS-SEWALL ⋅ Gary D. CLOW ⋅ Jihong COLE-DAI ⋅ William T. COLGAN ⋅ Sam G. COLLINS ⋅ Luke COPLAND ⋅ Giulio COZZI ⋅ Michel CRESEVEUR ⋅ David J. CROSSLEY ⋅ Dorthe DAHL-JENSEN ⋅ Giancarlo DALLA FONTANA ⋅ Willi DANSGAARD ⋅ Gian Andrea DARMS ⋅ Gombo DAVAA ⋅ Mary E. DAVIS ⋅ Robert M. DAVIS ⋅ Martine DE ANGELIS ⋅ Fabrizio DE BLASI ⋅ Charlotte DELCOURT ⋅ Robert Jean DELMAS ⋅ DENG Yangxin ⋅ Marc DESCLOITRES ⋅ Anja DIEZ ⋅ A. N. DIKIKH ⋅ Roberto DINALE ⋅ Minghu DING ⋅ D. N. DMITRIEV ⋅ L. D. DOLGUSHIN ⋅ Zhiwen DONG ⋅ Julian A. DOWDESWELL ⋅ Samuel H. DOYLE ⋅ Gianfranco DRAGÀ ⋅ Giuliano DREOSSI ⋅ DU Jiankuo ⋅ Wentao DU ⋅ DUAN Keqin ⋅ Inés Maria DUSSAILLANT ⋅ Mark DYURGEROV ⋅ Pēteris DŽERIŅŠ ⋅ Keith A. ECHELMEYER ⋅ Anja EICHLER ⋅ Olaf EISEN ⋅ Alexey Anatolyevich EKAYKIN ⋅ Tobias ERHARDT ⋅ Björn ERLINGSSON ⋅ Bakyt ERMENBAIEV ⋅ Nao ESASHI ⋅ Mukhammed ESENAMAN ULUU ⋅ Bernd ETZELMULLER ⋅ Stella EYRIKH ⋅ Xavier FAÏN ⋅ F. F. FAIZRAKHMANOV ⋅ Sonia FALOURD ⋅ Robert S. FAUSTO ⋅ Daniela FESTI ⋅ David A. FISCHER ⋅ Hubertus FISCHER ⋅ David A. FISHER ⋅ Gwenn E. FLOWERS ⋅ Bernard FRANCOU ⋅ Regula FRAUENFELDER ⋅ Massimo FREZZOTTI ⋅ Børge FRISTRUP ⋅ Diedrich FRITZSCHE ⋅ FUJII Yoshiyuki ⋅ FUJITA Koji ⋅ Takehiro FUKUDA ⋅ Martin FUNK ⋅ Johannes J. FÜRST ⋅ Jacopo GABRIELI ⋅ Paolo GABRIELLI ⋅ Bogdan GĄDEK ⋅ Heinz W. GÄGGELER ⋅ Olivier GAGLIARDINI ⋅ Robert GALLAIRE ⋅ Stephan P. GALOS ⋅ Stéphane GARAMBOIS ⋅ Alex S. GARDNER ⋅ Marcus GASTALDELLO ⋅ GENG Zhixin ⋅ Mike GERASIMOFF ⋅ Christopher C. GERBI ⋅ Adrien GILBERT ⋅ Patrick GINOT ⋅ Yngvar GJESSING ⋅ A. F. GLAZOVSKY ⋅ María Angélica GODOI ⋅ Vikram GOEL ⋅ Kumiko GOTO-AZUMA ⋅ L. S. GOVORUKHA ⋅ A. I. GROMYKO ⋅ Martin GROSJEAN ⋅ Marek GRZEŚ ⋅ Niels S. GUNDESTRUP ⋅ GUO Wanqin ⋅ Tika Ram GURUNG ⋅ Robert J. GUSTAFSON ⋅ Hélène GUYARD ⋅ Wilfried HAEBERLI ⋅ Jon Ove HAGEN ⋅ Patrick HAGER ⋅ Claus Uffe HAMMER ⋅ Svein-Erik HAMRAN ⋅ S.-E. HAMRANW ⋅ Hyangsun HAN ⋅ HAN Jiankang ⋅ HAN Yeongcheol ⋅ Steffen B. HANSEN ⋅ Margareta HANSSON ⋅ Douglas R. HARDY ⋅ Joel HARPER ⋅ J. HARRISON ⋅ William Douglas HARRISON ⋅ Bent HASHOLT ⋅ G. HATTERSLEY-SMITH ⋅ H. HAUSMANN ⋅ Robert L. HAWLEY ⋅ HE Yuanqing ⋅ Thomas M. HEDEGAARD ⋅ Petra HEIDENWOLF ⋅ Keith A. HENDERSON ⋅ Pierre-Alain HERREN ⋅ Martin HEULE ⋅ Benjamin HILLS ⋅ Richard HODGKINS ⋅ Andrew HODSON ⋅ Martin HOELZLE ⋅ Georg HOFFMANN ⋅ Helene HOFFMANN ⋅ Coen HOFSTEDE ⋅ Per HOLMLUND ⋅ Takeo HONDOH ⋅ HONG Sang Bum ⋅ Roger LeB. HOOKE ⋅ HOU Shanshan ⋅ HOU Shugui ⋅ Kate HRUBY ⋅ Houtse HSU ⋅ HUANG Maohuan ⋅ Bryn HUBBARD ⋅ Hans-Wolfgang HUBBERTEN ⋅ T. P. HUGHES ⋅ Neil HUMPHREY ⋅ HUR Soon Do ⋅ Matthias HUSS ⋅ Philippe HUYBRECHTS ⋅ Makoto IGARASHI ⋅ Hajime IIDA ⋅ Yoshinori IIZUKA ⋅ Elisabeth ISAKSSON ⋅ Kaoru IZUMI ⋅ Mylène JACQUEMART ⋅ Youngjoon JANG ⋅ Jacek JANIA ⋅ Peter JANSSON ⋅ Gary Trevor JARVIS ⋅ Theo M. JENK ⋅ Jurijs JEŠKINS ⋅ Liming JIANG ⋅ Zongli JIANG ⋅ JIAO Keqin ⋅ Xiaoyu JIAO ⋅ JIN Huijun ⋅ Sigfús Jóhann JOHNSEN ⋅ Peter JONSSON ⋅ Daniel JOSWIAK ⋅ Bruno JOURDAIN ⋅ Jean JOUZEL ⋅ JUN Seong Joon ⋅ Andreas KÄÄB ⋅ KAMEDA Takao ⋅ Kokichi KAMIYAMA ⋅ KANG Schichang ⋅ KANG Xingcheng ⋅ KANG Zhicheng ⋅ Giovanni KAPPENBERGER ⋅ Nanna B. KARLSSON ⋅ Jānis KARUŠS ⋅ Sadao KAWAGUCHI ⋅ Toshiyuki KAWAMURA ⋅ Rijan B. KAYASTHA ⋅ Lothar KECK ⋅ Charles M. KEELER ⋅ Natalie KEHRWALD ⋅ Donald V. KENNY ⋅ Ruslan KENZHEBAEV ⋅ Purevdagva KHALZAN ⋅ Shfaqat A. KHAN ⋅ I. F. KHMELEVSKOY ⋅ Tatiana Emelyanovna KHROMOVA ⋅ Seong‐Joong KIM ⋅ Christophe KINNARD ⋅ Boris Vasilievich KISLOV ⋅ L. KLEIN ⋅ O. L. KLEMENTIEV ⋅ Roy M. KOERNER ⋅ Jack KOHLER ⋅ Mika KOHNO ⋅ Shiro KOHSHIMA ⋅ P. A. KOROLEV ⋅ V. S. KORYAKIN ⋅ Vladimir M. KOTLYAKOV ⋅ Anna KOZACHEK ⋅ Karl KRAINER ⋅ Karl KREUTZ ⋅ Marlene KRONENBERG ⋅ Jean KRUG ⋅ Jumpei KUBOTA ⋅ N. V. KUBYSHKIN ⋅ A. V. KUDIKOV ⋅ Christoph KULL ⋅ Mario KUMMERT ⋅ M. G. KUNAKHOVICH ⋅ Stanislav S. KUTUZOV ⋅ Olivier LAARMAN ⋅ Ang J. B. LAMA SHERPA ⋅ Kristaps LAMSTERS ⋅ Amaelle LANDAIS ⋅ Martin LATERNSER ⋅ Bernard LAURIOL ⋅ Ivan I. LAVRENTIEV ⋅ Yu. A. LAVRUSHIN ⋅ Robert LAW ⋅ Emmanuel LE MEUR ⋅ LEE Hun-Gyu ⋅ Ian R. LEE ⋅ Eric LEFEBVRE ⋅ Anatoly LEGCHENKO ⋅ Michel LEGRAND ⋅ Andreas LEMARK ⋅ LI Huilin ⋅ LI Shuang ⋅ Yemeng LI ⋅ LI Zhen ⋅ LI Zhongqin ⋅ Olav LIESTØL ⋅ S. LIM ⋅ Ping-Nan LIN ⋅ Song LINLIN ⋅ Vladimir Y. LIPENKOV ⋅ Peter LISAGER ⋅ LIU Chaohai ⋅ LIU Dongsheng ⋅ K.-b. LIU ⋅ LIU Leibao ⋅ Lin LIU ⋅ Qiao LIU ⋅ LIU Shiyin ⋅ LIU Yaping ⋅ LIU Yushuo ⋅ LIU Zongxiang ⋅ Louis LLIBOUTRY ⋅ Albert LLUBERAS ⋅ Anja LØKKEGAARD ⋅ Martin Peter LÜTHI ⋅ Shelley MACDONELL ⋅ Joseph A. MACGREGOR ⋅ Yuri Yakovlevich MACHERET ⋅ Horst MACHGUTH ⋅ Olivier MAGAND ⋅ Sudan B. MAHARJAN ⋅ Volkmar MAIR ⋅ Philipp MALZ ⋅ L. N. MANEVSKY ⋅ Kenneth D. MANKOFF ⋅ Sergey MARCHENKO ⋅ V. A. MARKIN ⋅ Von G. MARKL ⋅ Tõnu MARTMA ⋅ Tracy A. MASHIOTTA ⋅ Mariano H. MASIOKAS ⋅ Robert W. MASON ⋅ Valérie MASSON-DELMOTTE ⋅ Sumito MATOBA ⋅ Vladimir Vladimirovich MATSKOVSKY ⋅ MATSUDA Yoshihiro ⋅ Kenichi MATSUOKA ⋅ Enrico MATTEA ⋅ Paul A. MAYEWSKI ⋅ Lawrence R. MAYO ⋅ Ian MCDOWELL ⋅ Toby MEIERBACHTOL ⋅ Hanno MEYER ⋅ Nikolay N. MIKHAILOV ⋅ Vladimir N. MIKHALENKO ⋅ V. I. MIKHALEV ⋅ Evan S. MILES ⋅ Katie E. MILES ⋅ Gifford H. MILLER ⋅ Heinz MILLER ⋅ Laurent MINGO ⋅ Hans-Erwin MINOR ⋅ Masahiro MINOWA ⋅ Morihiro MIYAHARA ⋅ Dariusz MOCHNACKI ⋅ J. Tyge MØLLER ⋅ Jangil MOON ⋅ John C. MOORE ⋅ V. A. MOREV ⋅ Carsten MORTENSEN ⋅ M. MOSKALEVSKY ⋅ Ellen S. MOSLEY-THOMPSON ⋅ Hideaki MOTOYAMA ⋅ Fritz MÜLLER ⋅ Dhruba D. MULMI ⋅ Robert MULVANEY ⋅ A. Ya. MURAVIEV ⋅ Yaroslav D. MURAVYEV ⋅ Tavi MURRAY ⋅ A. MUTO ⋅ David L. NAFTZ ⋅ Oleg V. NAGORNOV ⋅ NAKAWO Masayoshi ⋅ Fumio NAKAZAWA ⋅ Kazuhiro NAOKI ⋅ Chiyuki NARAMA ⋅ Hideki NARITA ⋅ Renji NARUSE ⋅ Francisco J. NAVARRO ⋅ Robbe NEYNS ⋅ K. W. NICHOLLS ⋅ Lindsey NICHOLSON ⋅ H. NICOLET ⋅ Peter NIENOW ⋅ Stanislav A. NIKITIN ⋅ NISHIO Fumihiko ⋅ NIU Hewen ⋅ Masashi NIWANO ⋅ Matt NOLAN ⋅ G. A. NOSENKO ⋅ V. K. NOZDRYUKHIN ⋅ Anne-Marie NUTTALL ⋅ Rune Strand ØDEGÅRD ⋅ Klaus OEGGL ⋅ H. OESCHGER ⋅ Atsumu OHMURA ⋅ Sachiko OKAMOTO ⋅ Ole B. OLESEN ⋅ Susanne OLIVIER ⋅ Yukihiko ONUMA ⋅ Anaïs J. ORSI ⋅ Svenn ORVIG ⋅ Jaime OTERO ⋅ Alexander A. OVSYANNIKOV ⋅ Chloë Marie PAICE ⋅ Mark PALLETT ⋅ Anne PALMER ⋅ Erkki PALOSUO ⋅ Finnur PÁLSSON ⋅ PANG Hongxi ⋅ Tatyana PAPINA ⋅ J. G. PAREN ⋅ W. S. B. PATERSON ⋅ Nicolas PATRIS ⋅ Frank PATTYN ⋅ F. I. PERZIGER ⋅ Rickard PETTERSSON ⋅ E. C. PETTIT ⋅ Luc PIARD ⋅ Gianni PIFFER ⋅ Sam PIMENTEL ⋅ Jean Francis PINGLOT ⋅ Pierre PITTE ⋅ M. Ya. PLAM ⋅ Veijo A. POHJOLA ⋅ Ulrich POLOM ⋅ Ivan A. PONOMAREV ⋅ Victor POPOVNIN ⋅ Trevor J. POPP ⋅ Stacy E. PORTER ⋅ Philippe POSSENTI ⋅ Michel POURCHET ⋅ Bernard POUYAUD ⋅ Susanne PREUNKERT ⋅ Rainer PRINZ ⋅ T. V. PSAREVA ⋅ PU Jianchen ⋅ PU Tao ⋅ V. A. PUKHOV ⋅ QIN Dahe ⋅ QIN Xiang ⋅ QIU Jiaqi ⋅ Duncan J. QUINCEY ⋅ Antoine RABATEL ⋅ Bernhard T. RABUS ⋅ Edson RAMÍREZ ⋅ S. Olander RASMUSSEN ⋅ Yu. V. RAYKOVSKY ⋅ Dominique RAYNAUD ⋅ N. G. RAZUMEIKO ⋅ Niels REEH ⋅ REN Jiawen ⋅ Patrick RIESEN ⋅ Mirko RINALDI ⋅ Andrés RIVERA ⋅ E. RÖSSLER ⋅ Hans RÖTHLISBERGER ⋅ O. V. ROTOTAEVA ⋅ Nicolas ROUX ⋅ Ann V. ROWAN ⋅ Lucas RUIZ ⋅ Arthur S. RUNDLE ⋅ Oleg RYBAK ⋅ Claudia RYSER ⋅ Yeongjun RYU ⋅ SAKAI Akiko ⋅ Daiki SAKAKIBARA ⋅ Andrey N. SALAMATIN ⋅ Masaki SANO ⋅ Pamela SANTIBAÑEZ ⋅ Yota SATO ⋅ Kazuhide SATOW ⋅ Rysbek SATYLKANOV ⋅ Matthias SAURER ⋅ A. M. SAVATYUGIN ⋅ Lev M. SAVATYUGIN ⋅ Takanobu SAWAGAKI ⋅ Ted A. SCAMBOS ⋅ Manuel SCHLÄPPI ⋅ Forrest SCHOESSOW ⋅ Christian G. SCHOOF ⋅ Ulrich SCHOTTERER ⋅ Philipp SCHUPPLI ⋅ Aurel A. SCHWERZMANN ⋅ Margit SCHWIKOWSKI ⋅ Valter SCHYTT ⋅ Takahiro SEGAWA ⋅ Julien SEGUINOT ⋅ SEKO Katsumoto ⋅ Gerald SELIGMAN ⋅ Roberto SEPPI ⋅ SHANG Xinchun ⋅ Donghui SHANGGUAN ⋅ SHANGGUAN Donghui ⋅ SHAO Wenzhang ⋅ Yaping SHAO ⋅ Martin J. SHARP ⋅ Robert P. SHARP ⋅ Simon G. SHELDON ⋅ Tenzing C. SHERPA ⋅ SHI Yafeng ⋅ Takayuki SHIRAIWA ⋅ M. Roxana SIERRA-HERNÁNDEZ ⋅ Marie-Louise SIGGAARD-ANDERSEN ⋅ Nadia SIGNER ⋅ E. M. SINGER ⋅ Anna SINISALO ⋅ S. A. SINKEVICH ⋅ Delphine SIX ⋅ A. A. SKUTIN ⋅ Mark E. SMITH ⋅ Ireneusz SOBOTA ⋅ Sergey Alfredovich SOKRATOV ⋅ Anne SOLGAARD ⋅ Johan Ludvig SOLLID ⋅ SONG Guoping ⋅ Alvaro SORUCO ⋅ Todd A. SOWERS ⋅ Nicole SPAULDING ⋅ Andrea SPOLAOR ⋅ Francisco A. SQUEO ⋅ Mia STAMPE ⋅ Dieter STAMPFLI ⋅ Felix STAMPFLI ⋅ Wolfgang STARZER ⋅ Bernhard STAUFFER ⋅ Jørgen Peder STEFFENSEN ⋅ Jakob Friedrich STEINER ⋅ Barbara STENNI ⋅ Willibald STICHLER ⋅ SU Zhen ⋅ Sonja SUCKRO ⋅ SUGIYAMA Shin ⋅ Huan SUN ⋅ Sainan SUN ⋅ SUN Weijun ⋅ Yafei SUN ⋅ Arzhan SURAZAKOV ⋅ V. F. SUSLOV ⋅ Stephan SUTER ⋅ Keisuke SUZUKI ⋅ Toshitaka SUZUKI ⋅ Arny E. SVEINBJØRNSDOTTIR ⋅ Anders M. SVENSSON ⋅ Akiyoshi TAKAHASHI ⋅ Shuhei TAKAHASHI ⋅ Shuhei TAKENAKA ⋅ Nozomu TAKEUCHI ⋅ Masumi TAKIKAWA ⋅ Jean Denis TAUPIN ⋅ Khadga B. THAPA ⋅ Emmanuel THIBERT ⋅ Martijn P. A. THOMASSEN ⋅ David E. THOMPSON ⋅ Lonnie G. THOMPSON ⋅ Henrik Højmark THOMSEN ⋅ TIAN Lide ⋅ Leonhard TOBLER ⋅ A. I. TOLSTOY ⋅ David TONIDANDEL ⋅ Pavel A. TOROPOV ⋅ Yoko TOYAMA ⋅ Dennis C. TRABANT ⋅ L. S. TROITSKY ⋅ Akane TSUSHIMA ⋅ TSUTAKI Shun ⋅ Aleksey Viktorovich TSVETKOV ⋅ G. A. TSYKINA ⋅ S. TYUFLIN ⋅ Tsutomu UCHIDA ⋅ Jun UETAKE ⋅ Chiara UGLIETTI ⋅ Norbert UNTERSTEINER ⋅ David URMANN ⋅ Ryskul USUBALIEV ⋅ Joseph VALLOT ⋅ Jonas VAN BREEDAM ⋅ Roderik S. W. VAN DE WAL ⋅ Brice VAN LIEFFERINGE ⋅ Ward J. J. VAN PELT ⋅ Lander VAN TRICHT ⋅ W. VAN WYCHEN ⋅ Evgeny V. VASILENKO ⋅ N. I. VASILIEV ⋅ T. V. VASILYEVA ⋅ Geir VATNE ⋅ Carmen P. VEGA ⋅ E. N. VILESOV ⋅ Françoise VIMEUX ⋅ Christian VINCENT ⋅ Bo M. VINTHER ⋅ Diana Olegovna VLADIMIROVA ⋅ Edith VOGEL ⋅ Ulrich VON GRAFENSTEIN ⋅ H. R. VON GUNTEN ⋅ T. A. VOSTOKOVA ⋅ R. N. VOSTRETSOV ⋅ Mathias VUILLE ⋅ Edwin D. WADDINGTON ⋅ H. P. WAGNER ⋅ Stephan WAGNER ⋅ Patrick WAGNON ⋅ Cameron P. WAKE ⋅ Silas WALTHER ⋅ Chaomin WANG ⋅ Hansheng WANG ⋅ WANG Lilun ⋅ Lin WANG ⋅ WANG Ninglian ⋅ Puyu WANG ⋅ WANG Shijin ⋅ Wenbin WANG ⋅ WANG Wenying ⋅ WANG Xiaojun ⋅ WANG Yetang ⋅ WANG Yuzhe ⋅ WANG Zemin ⋅ WANG Zhonglong ⋅ WANG Zhongxiang ⋅ WANG Zongtai ⋅ Okitsugu WATANABE ⋅ Len G. WATTS ⋅ Matthias WECHT ⋅ Junfeng WEI ⋅ Anker WEIDICK ⋅ Gunter WELLER ⋅ WEN Jiahong ⋅ Gerd WENDLER ⋅ Jonas WICKY ⋅ Johannes WILD ⋅ Frank WILHELMS ⋅ Nat J. WILSON ⋅ Bjoern WOLD ⋅ WOONG Chung Ji ⋅ WU Guangjian ⋅ Lizong WU ⋅ Shuang-Ye WU ⋅ X. WU ⋅ WU Zhen ⋅ Cunde XIAO ⋅ XIE Zichu ⋅ XIN Huijuan ⋅ XU Baiqing ⋅ XU Junli ⋅ XU Yuetong ⋅ V. M. YAKOVLEV ⋅ Kotaro YAMAGATA ⋅ Satoru YAMAGUCHI ⋅ Tetsuhide YAMASAKI ⋅ Tetsuya YAMAZAKI ⋅ YAN Ming ⋅ Ji‐Woong YANG ⋅ YANG Meixue ⋅ YANG Zhihong ⋅ YAO Tandong ⋅ Xiaojun YAO ⋅ Chaolu YI ⋅ Yang YI ⋅ Yusuke YOKOYAMA ⋅ Yoshitaka YOSHIMURA ⋅ YOU Genxiang ⋅ Pengchun YU ⋅ YUAN Jianmo ⋅ Victor Serafimovich ZAGORODNOV ⋅ Thomas ZANONER ⋅ Alexander ZAPF ⋅ Christian M. ZDANOWICZ ⋅ Harry ZEKOLLARI ⋅ Tiziana Lazzarina ZENDRINI ⋅ Piero ZENNARO ⋅ ZHANG Jinhua ⋅ ZHANG Shiqiang ⋅ ZHANG Tong ⋅ ZHANG Wanchang ⋅ ZHANG Wangbin ⋅ ZHANG Wenjing ⋅ ZHANG Xinping ⋅ ZHANG Yinsheng ⋅ Liyun ZHAO ⋅ Jiancheng ZHENG ⋅ Ping ZHOU ⋅ ZHOU Tao ⋅ ZHU Guocai ⋅ A. B. ZHURAVLEV ⋅ Greg ZIELINSKI ⋅ I. A. ZOTIKOV
Versions of the Appendices and references preserving non-Latin characters can be found in the Supplement. The supplement related to this article is available online at https://doi.org/10.5194/essd-17-1627-2025-supplement.
MJ and EW contributed equally to this project (manuscript and dataset). MJ conceived the project and, together with EW, designed, implemented, and populated the database. EW managed the testing and publishing pipelines, and MJ and EW wrote the manuscript. MG curated the Colle Gnifetti dataset, including a (re)evaluation of uncertainties for selected boreholes. GC re-digitized a large subset of figures from which data were sourced, providing the basis for the digitization error assessment. All the authors read, edited, and approved the manuscript.
The contact author has declared that none of the authors has any competing interests.
Publisher’s note: Copernicus Publications remains neutral with regard to jurisdictional claims made in the text, published maps, institutional affiliations, or any other geographical representation in this paper. While Copernicus Publications makes every effort to include appropriate place names, the final responsibility lies with the authors.
We thank the countless people who contributed to the planning, execution, and processing of the englacial measurements included in glenglat. As an (imperfect) proxy of who they are, we list the names of all the authors who were involved in the publications from which we drew data in Appendix B. We are grateful to Gwenn Flowers, Shin Sugiyama, Tika Ram Gurung, Rainer Prinz, Martina Barandun, Olivier Gagliardini, Lonnie G. Thompson, Tong Zhang, Horst Machguth, and Marlene Kronenberg for submitting data to us. Lander Van Tricht shared the results of his own literature search. Thanks go to Daniel Farinotti and Matthias Huss for offering valuable suggestions and discussions along the way. We are particularly indebted to the librarians around the world who tracked down obscure references, including the DocDel staff of the University Library (Universitätsbibliothek) and Central Library (Zentralbibliothek) in Zurich, the Royal Danish Library (Det Kongelige Bibliotek) in Copenhagen, the Shanghai Library (![]() ), and the Russian State Library (
), and the Russian State Library (![]() ) in Moscow. Special thanks also go to the Library of Glaciology (
) in Moscow. Special thanks also go to the Library of Glaciology (![]() ) at the Russian Academy of Sciences (
) at the Russian Academy of Sciences (![]() ) Institute of Geography (
) Institute of Geography (![]() ) for their efforts to digitize and disseminate Russian language literature (https://sites.google.com/view/glaciobiblio, last access: 7 April 2024). Finally, we thank William Colgan, Martin Hoelzle, and Baptiste Vandecrux (editor) for their constructive feedback.
) for their efforts to digitize and disseminate Russian language literature (https://sites.google.com/view/glaciobiblio, last access: 7 April 2024). Finally, we thank William Colgan, Martin Hoelzle, and Baptiste Vandecrux (editor) for their constructive feedback.
Mylène Jacquemart was funded by the Swiss National Science Foundation project PROGGRES: Process-based modelling of global glacier changes (grant no. 184634). Ethan Welty was supported by the Federal Office of Meteorology and Climatology (MeteoSwiss) within the framework of the Global Climate Observing System (GCOS) in Switzerland. Marcus Gastaldello received funding through the Measuring Firn Hydrology and Ice Dynamics at the Greenland Runoff Limit (MAGNOLIA) project (funded by the Swiss Polar Institute).
This paper was edited by Baptiste Vandecrux and reviewed by William Colgan and Martin Hoelzle.
Abermann, J., Steiner, J. F., Prinz, R., Wecht, M., and Lisager, P.: The Red Rock ice cliff revisited – six decades of frontal, mass and area changes in the Nunatarssuaq area, northwest Greenland, J. Glaciol., 66, 567–576, https://doi.org/10.1017/jog.2020.28, 2020. a
Agassiz, L.: From the temperature of the interior of the glacier, in: New studies and experiments on current glaciers: their structure, their progression and their physical actions on the ground, Victor Masson, 419–434, https://gallica.bnf.fr/ark:/12148/bpt6k97697182/f454.item (last access: 7 April 2024), 1847. a, b, c
Aizen, V., Bren, D., Kreutz, K., and Wake, C.: Paleo-climate and glaciological reconstruction in Central Asia through the collection and analysis of ice cores and instrumental data from the Tien Shan, Tech. rep., Regents of The University of California Santa Barbara (US), https://doi.org/10.2172/794067, 2001. a
An, W., Hou, S., Zhang, W., Wang, Y., Liu, Y., Wu, S., and Pang, H.: Significant recent warming over the northern Tibetan Plateau from ice core δ18O records, Clim. Past, 12, 201–211, https://doi.org/10.5194/cp-12-201-2016, 2016. a
Aristarain, A. J. and Delmas, R.: First glaciological studies on the James Ross Island Ice Cap, Antarctic Peninsula, J. Glaciol., 27, 371–379, https://doi.org/10.3189/S0022143000011412, 1981. a
Arkhipov, S. M., Mikhalenko, V. N., Kunakhovich, M. G., Dikikh, A. N., and Nagornov, O. V.: Thermal regime, conditions of ice formation and accumulation on Grigoriev Glacier (Tien Shan) in 1962–2001, Data of Glaciological Studies, 96, 77–83, http://geolibrary.ru/sites/default/files/2021-01/96.pdf#page=78 (last access: 7 April 2024), 2004. a
Arktisk Institute: Danish scientific work in Greenland, 1957, Polar Rec., 9, 452–454, https://doi.org/10.1017/S0032247400066432, 1959. a, b
Arktisk Institute: Danish scientific work in Greenland, 1958, Polar Rec., 10, 38–40, https://doi.org/10.1017/S0032247400050609, 1960. a, b
Barandun, M.: A novel approach to estimate glacier mass balance in the Tien Shan and Pamir based on transient snowline observations, Ph.D. thesis, University of Fribourg, Department of Geosciences, https://folia.unifr.ch/global/documents/307523 (last access: 7 April 2024), 2018. a
Baranowski, S.: Glaciological investigations and glaciomorphological observations made in 1970 on Werenskiold Glacier and in its forefield, Vol. 1, in: Results of investigations of the Polish Scientific Spitsbergen Expeditions 1970–1974, edited by: Baranowski, S. and Jahn, A., no. 251 in Acta Universitatis Wratislaviensis, Państwowe Wydawnictwo Naukowe, 69–94, 1975. a
Barbash, V. R., Govorukha, L. S., and Zotikov, I. A.: On the temperature state of the thickness of the Vavilov Ice Cap, in: Studies of the ice cover and periglacial of Severnaya Zemlya, no. 367 in Proceedings of AARI, Arctic and Antarctic Research Institute, 54–57, 1981. a
Barkov, N. I., Blinov, K. V., Bugorkov, M. S., and Dmitriev, D. N.: Geophysical research in a well 460 m deep on the Vavilov Glacier (Severnaya Zemlya), in: Geographical and glaciological studies in polar countries, Gidrometeoizdat, 14–24, 1988. a, b
Beaudon, E., Moore, J. C., Martma, T., Pohjola, V. A., van de Wal, R. S. W., Kohler, J., and Isaksson, E.: Lomonosovfonna and Holtedahlfonna ice cores reveal east–west disparities of the Spitsbergen environment since AD 1700, J. Glaciol., 59, 1069–1083, https://doi.org/10.3189/2013JoG12J203, 2013. a
Björnsson, H., Gjessing, Y., Hamran, S.-E., Hagen, J. O., Liestøl, O., Pálsson, F., and Erlingsson, B.: The thermal regime of sub-polar glaciers mapped by multi-frequency radio-echo sounding, J. Glaciol., 42, 23–32, https://doi.org/10.3189/S0022143000030495, 1996. a, b, c, d, e
Blatter, H.: On the thermal regime of Arctic glaciers: A study of the White Glacier, Axel Heiberg Island, and the Laika Glacier, Coburg Island, Canadian Arctic Archipelago, Tech. rep., Eidgenössische Technische Hochschule (ETH) Zürich, Geographisches Institut, 1985. a, b
Blatter, H.: On the thermal regime of an Arctic valley glacier: A study of White Glacier, Axel Heiberg Island, N.W.T., Canada, J. Glaciol., 33, 200–211, https://doi.org/10.3189/S0022143000008704, 1987. a, b, c
Blatter, H. and Haeberli, W.: Modelling temperature distribution in Alpine glaciers, Ann. Glaciol., 5, 18–22, https://doi.org/10.3189/1984AoG5-1-18-22, 1984. a, b
Blatter, H. and Hutter, K.: Polythermal conditions in arctic glaciers, J. Glaciol., 37, 261–269, https://doi.org/10.3189/S0022143000007279, 1991. a
Blatter, H. and Kappenberger, G.: Mass balance and thermal regime of Laika Ice Cap, Coburg Island, N.W.T., Canada, J. Glaciol., 34, 102–110, https://doi.org/10.3189/S0022143000009126, 1988. a
Bohleber, P.: Alpine ice cores as climate and environmental archives, in: Oxford Research Encyclopedia of Climate Science, Oxford University Press, ISBN 978-0-19-022862-0, https://doi.org/10.1093/acrefore/9780190228620.013.743, 2019. a
Bohleber, P., Erhardt, T., Spaulding, N., Hoffmann, H., Fischer, H., and Mayewski, P.: Temperature and mineral dust variability recorded in two low-accumulation Alpine ice cores over the last millennium, Clim. Past, 14, 21–37, https://doi.org/10.5194/cp-14-21-2018, 2018. a
Bonnaveira, H., Taupin, J.-D., Godoi, M.-A., Ginot, P., Pourchet, M., Schotterer, U., and Stichler, W.: Etat d'avancement de l'analyse des carottes de glace du Chimborazo (Equateur), Tech. rep., IRD, INAMHI, PSI, LGGE, LSCE, https://www.researchgate.net/publication/282170525_Etat_d'avancement_de_l'analyse_des_carottes_de_glace_du_Chimborazo_Equateur (last access: 7 April 2024), 2011. a
Bravo, C. and Rivera, A.: Monitoreo de temperatura de glaciares y glaciaretes en Pascua Lama, Tech. rep., Centro de Estudios Científicos, https://snifa.sma.gob.cl/SeguimientoAmbiental/Ficha/35669 (last access: 7 April 2024), 2015. a, b, c, d, e
Cai, B., Huang, M., and Xie, Z.: A preliminary research on the temperature in deep borehole of Glacier No. 1, Ürümqi River headwaters, Kexue Tongbao, 33, 2054–2056, https://doi.org/10.1360/sb1988-33-24-2054, 1988. a
Carturan, L., De Blasi, F., Dinale, R., Dragà, G., Gabrielli, P., Mair, V., Seppi, R., Tonidandel, D., Zanoner, T., Zendrini, T. L., and Dalla Fontana, G.: Data from air, englacial and permafrost temperature measurements on Mt. Ortles (eastern European Alps) (version 2.0), Zenodo [data set], https://doi.org/10.5281/ZENODO.8330289, 2023a. a, b, c
Carturan, L., De Blasi, F., Dinale, R., Dragà, G., Gabrielli, P., Mair, V., Seppi, R., Tonidandel, D., Zanoner, T., Zendrini, T. L., and Dalla Fontana, G.: Modern air, englacial and permafrost temperatures at high altitude on Mt Ortles (3905 m a.s.l.), in the eastern European Alps, Earth Syst. Sci. Data, 15, 4661–4688, https://doi.org/10.5194/essd-15-4661-2023, 2023b. a, b
Chernov, R. A., Vasilyeva, T. V., and Kudikov, A. V.: Temperature regime of upper layer of the glacier East Grönfjordbreen (West Svalbard), Ice and Snow, 131, 38–46, https://doi.org/10.15356/2076-6734-2015-3-38-46, 2015. a
Clarke, G. K. C. and Jarvis, G. T.: Post-surge temperatures in Steele Glacier, Yukon Territory, Canada, J. Glaciol., 16, 261–268, https://doi.org/10.3189/S0022143000031580, 1976. a
Clarke, G. K. C., Collins, S. G., and Thompson, D. E.: Flow, thermal structure, and subglacial conditions of a surge-type glacier, Can. J. Earth Sci., 21, 232–240, https://doi.org/10.1139/e84-024, 1984. a, b
Clarke, G. K. C., Fischer, D. A., and Waddington, E. D.: Wind pumping: A potentially significant heat source in ice sheets, in: The Physical Basis of Ice Sheet Modelling (Proceedings of the Vancouver Symposium, August 1987), Publication, International Association of Hydrological Sciences, 169–180, https://iahs.info/uploads/dms/7236.169-180-170-Clarke.pdf (last access: 7 April 2024), 1987. a, b
Classen, D. F.: Thermal drilling and deep ice-temperature measurements on the Fox Glacier, Yukon, Master's thesis, University of British Columbia, https://doi.org/10.14288/1.0302225, 1970. a, b
Classen, D. F.: Temperature profiles for the Barnes Ice Cap surge zone, J. Glaciol., 18, 391–405, https://doi.org/10.3189/S0022143000021079, 1977. a
Classen, D. F. and Clarke, G. K. C.: Basal hot spot on a surge type glacier, Nature, 229, 481–483, https://doi.org/10.1038/229481a0, 1971. a
Colgan, W., Sommers, A., Rajaram, H., Abdalati, W., and Frahm, J.: Considering thermal-viscous collapse of the Greenland ice sheet, Earth's Future, 3, 252–267, https://doi.org/10.1002/2015EF000301, 2015. a
Collins, S. G.: Survey of the Rusty Glacier area, Yukon Territory, Canada, 1967–70, J. Glaciol., 11, 235–253, https://doi.org/10.3189/S0022143000022231, 1972. a
Copland, L., Sharp, M. J., Nienow, P., and Bingham, R. G.: The distribution of basal motion beneath a High Arctic polythermal glacier, J. Glaciol., 49, 407–414, https://doi.org/10.3189/172756503781830511, 2003. a, b
Crossley, D. J. and Clarke, G. K. C.: Gravity and shallow-ice temperature measurements on the Rusty Glacier, in: Icefield Ranges Research Project Scientific Results, edited by: Bushnell, V. C. and Ragle, R. H., American Geophysical Society, Arctic Institute of North America, vol. 3, 93–101, https://archives-ftp.gov.yk.ca/library/normal/Icefield_Ranges_Research_Project_v3.pdf#page=109.00 (last access: 7 April 2024), 1972. a
Cuffey, K. M. and Paterson, W. S. B.: The physics of glaciers, Academic Press, ISBN 978-0-08-091912-6, google-Books-ID: Jca2v1u1EKEC, 2010. a, b, c
Darms, G. A.: Snow temperatures on Colle Gnifetti: Compilation and analysis of existing and new temperature profiles, Master's thesis, Universität Zürich, Geographisches Institut, https://uzb.swisscovery.slsp.ch/discovery/delivery/41SLSP_UZB:UZB/12464857880005508 (last access: 7 April 2024), 2009. a, b
Davaa, G.: Glacier monitoring in Mongolia, Global Cryosphere Watch (GCW) 2nd Asia CryoNet Meeting in Salekhard, Russian Federation, 2–5 February 2016. a
Davis, R. M.: Approach roads, Greenland, 1960–1964, Tech. rep., U.S. Cold Regions Research and Engineering Laboratory (CRREL), https://erdc-library.erdc.dren.mil/jspui/handle/11681/5708 (last access: 7 April 2024), 1967. a, b
Deeley, R. M. and Woodward, H.: The viscosity of ice, P. Roy. Soc. A-Math. Phy., 81, 250–259, https://doi.org/10.1098/rspa.1908.0077, 1908. a
Delcourt, C., Van Liefferinge, B., Nolan, M., and Pattyn, F.: The climate memory of an Arctic polythermal glacier, J. Glaciol., 59, 1084–1092, https://doi.org/10.3189/2013JoG12J109, 2013. a
Di Stefano, E., Baccolo, G., Clemenza, M., Delmonte, B., Fiorini, D., Garzonio, R., Schwikowski, M., and Maggi, V.: Temporal markers in a temperate ice core: insights from 3H and 137Cs profiles from the Adamello Glacier, The Cryosphere, 18, 2865–2874, https://doi.org/10.5194/tc-18-2865-2024, 2024. a
Diez, A., Eisen, O., Hofstede, C., Bohleber, P., and Polom, U.: Joint interpretation of explosive and vibroseismic surveys on cold firn for the investigation of ice properties, Ann. Glaciol., 54, 201–210, https://doi.org/10.3189/2013AoG64A200, 2013. a
Dikikh, A. N.: The temperature regime of flat-top glaciers (using Grigoriev Glacier as an example), in: Glaciological studies in the Tien Shan, no. 11 in Works of the Tien Shan physical-geographical station, Academy of Sciences of the Kirghiz SSR, 32–35, 1965. a, b
Dolgushin, L. D.: Main particuliarities of glaciation of Central Asia according to the latest data, in: General Assembly of Helsinki, 25 July–6 August 1960, Publication, International Association of Scientific Hydrology, 348–358, https://iahs.info/uploads/dms/1796.348-358-54-Dolgushin-opt.pdf, 1961. a, b, c
Du, J., He, Y., Li, S., Wang, S., Niu, H., Xin, H., and Pu, T.: Mass balance and near-surface ice temperature structure of Baishui Glacier No.1 in Mt. Yulong, J. Geograph. Sci., 23, 668–678, https://doi.org/10.1007/s11442-013-1036-4, 2013. a
Eisen, O., Bauder, A., Lüthi, M., Riesen, P., and Funk, M.: Deducing the thermal structure in the tongue of Gornergletscher, Switzerland, from radar surveys and borehole measurements, Ann. Glaciol., 50, 63–70, https://doi.org/10.3189/172756409789097612, 2009. a
European Space Agency: Copernicus Global Digital Elevation Model, OpenTopography [data set], https://doi.org/10.5069/G9028PQB, 2024. a
Faillettaz, J., Sornette, D., and Funk, M.: Numerical modeling of a gravity-driven instability of a cold hanging glacier: reanalysis of the 1895 break-off of Altelsgletscher, Switzerland, J. Glaciol., 57, 817–831, https://doi.org/10.3189/002214311798043852, 2011. a
Fisher, D. A., Koerner, R. M., Bourgeois, J. C., Zielinski, G., Wake, C., Hammer, C. U., Clausen, H. B., Gundestrup, N., Johnsen, S., Goto-Azuma, K., Hondoh, T., Blake, E., and Gerasimoff, M.: Penny Ice Cap cores, Baffin Island, Canada, and the Wisconsinan Foxe Dome connection: Two states of Hudson Bay ice cover, Science, 279, 692–695, https://doi.org/10.1126/science.279.5351.692, 1998. a
Flowers, G. E., Roux, N., Pimentel, S., and Schoof, C. G.: Present dynamics and future prognosis of a slowly surging glacier, The Cryosphere, 5, 299–313, https://doi.org/10.5194/tc-5-299-2011, 2011. a
Fristrup, B.: Danish glaciological investigations in the International Geophysical Year, Polarforschung, 30, 3–11, https://doi.org/10.2312/polarforschung.30.1-2.3, 1960a. a, b, c, d
Fristrup, B.: Studies of four glaciers in Greenland, Danish Journal of Geography, 59, 89–102, https://tidsskrift.dk/geografisktidsskrift/article/view/46529 (last access: 7 April 2024), 1960b. a
Fristrup, B.: Danish glaciological investigations in Greenland, in: Geology of the Arctic: Proceedings of the First International Symposium on Arctic Geology, edited by: Raasch, G. O., University of Toronto Press, 2, 735–746, https://doi.org/10.3138/9781487584962-001, 1961. a, b, c, d
Fritzsche, D., Wilhelms, F., Savatyugin, L. M., Pinglot, J. F., Meyer, H., Hubberten, H.-W., and Miller, H.: A new deep ice core from Akademii Nauk Ice Cap, Severnaya Zemlya, Eurasian Arctic: first results, Ann. Glaciol., 35, 25–28, https://doi.org/10.3189/172756402781816645, 2002. a
Fujii, Y., Nishio, F., and Kameda, T.: Snow and ice observation at Sofisky Glacier in the Altai Mountains, Russia, Seppyo, 62, 549–556, https://doi.org/10.5331/seppyo.62.549, 2000. a
Fujii, Y., Kameda, T., Nishio, F., Suzuki, K., Kohno, M., Nakazawa, F., Uetake, J., Savatyugin, L. M., Arkhipov, S. M., Ponomarev, I. A., and Mikhailov, N. N.: Outline of Japan-Russia joint glaciological research on Sofiyskiy Glacier, Russian Altai Mountains in 2000 and 2001, Bulletin of Glaciological Research, 19, 53–58, https://kitami-it.repo.nii.ac.jp/records/6854 (last access: 7 April 2024), 2002. a
Gabrielli, P., Carturan, L., Gabrieli, J., Dinale, R., Krainer, K., Hausmann, H., Davis, M., Zagorodnov, V., Seppi, R., Barbante, C., Dalla Fontana, G., and Thompson, L. G.: Atmospheric warming threatens the untapped glacial archive of Ortles Mountain, South Tyrol, J. Glaciol., 56, 843–853, https://doi.org/10.3189/002214310794457263, 2010. a
Gabrielli, P., Barbante, C., Carturan, L., Cozzi, G., Dalla Fontana, G., Dinale, R., Dragà, G., Gabrieli, J., Kehrwald, N., Mair, V., Mikhalenko, V., Piffer, G., Rinaldi, M., Seppi, R., Spolaor, A., Thompson, L. G., and Tonidandel, D.: Discovery of cold ice in a new drilling site in the eastern European Alps, Physical Geography and Quaternary Dynamics, 35, 101–105, https://doi.org/10.4461/GFDQ.2012.35.10, 2012. a
Gabrielli, P., Barbante, C., Bertagna, G., Bertó, M., Binder, D., Carton, A., Carturan, L., Cazorzi, F., Cozzi, G., Dalla Fontana, G., Davis, M., De Blasi, F., Dinale, R., Dragà, G., Dreossi, G., Festi, D., Frezzotti, M., Gabrieli, J., Galos, S. P., Ginot, P., Heidenwolf, P., Jenk, T. M., Kehrwald, N., Kenny, D., Magand, O., Mair, V., Mikhalenko, V., Lin, P. N., Oeggl, K., Piffer, G., Rinaldi, M., Schotterer, U., Schwikowski, M., Seppi, R., Spolaor, A., Stenni, B., Tonidandel, D., Uglietti, C., Zagorodnov, V., Zanoner, T., and Zennaro, P.: Age of the Mt. Ortles ice cores, the Tyrolean Iceman and glaciation of the highest summit of South Tyrol since the Northern Hemisphere Climatic Optimum, The Cryosphere, 10, 2779–2797, https://doi.org/10.5194/tc-10-2779-2016, 2016. a, b, c
Gilbert, A.: Modeling the thermal regime of glaciers: applications to the study of glacial risk and the quantification of climate changes at high altitude, Ph.D. thesis, Université de Grenoble, https://theses.hal.science/tel-01061854 (last access: 7 April 2024), 2013. a
Gilbert, A. and Vincent, C.: Atmospheric temperature changes over the 20th century at very high elevations in the European Alps from englacial temperatures, Geophys. Res. Lett., 40, 2102–2108, https://doi.org/10.1002/grl.50401, 2013. a, b, c
Gilbert, A., Wagnon, P., Vincent, C., Ginot, P., and Funk, M.: Atmospheric warming at a high‐elevation tropical site revealed by englacial temperatures at Illimani, Bolivia (6340 m above sea level, 16°S, 67°W), J. Geophys. Res.-Atmos., 115, D10109, https://doi.org/10.1029/2009JD012961, 2010. a, b, c, d
Gilbert, A., Vincent, C., Wagnon, P., Thibert, E., and Rabatel, A.: The influence of snow cover thickness on the thermal regime of Tête Rousse Glacier (Mont Blanc range, 3200 m a.s.l.): Consequences for outburst flood hazards and glacier response to climate change, J. Geophys. Res.-Earth, 117, F04018, https://doi.org/10.1029/2011JF002258, 2012. a, b, c
Gilbert, A., Vincent, C., Gagliardini, O., Krug, J., and Berthier, E.: Assessment of thermal change in cold avalanching glaciers in relation to climate warming, Geophys. Res. Lett., 42, 6382–6390, https://doi.org/10.1002/2015GL064838, 2015. a, b
Gilbert, A., Flowers, G. E., Miller, G. H., Rabus, B. T., Van Wychen, W., Gardner, A. S., and Copland, L.: Sensitivity of Barnes Ice Cap, Baffin Island, Canada, to climate state and internal dynamics, J. Geophys. Res.-Earth, 121, 1516–1539, https://doi.org/10.1002/2016JF003839, 2016. a
Gilbert, A., Leinss, S., Kargel, J., Kääb, A., Gascoin, S., Leonard, G., Berthier, E., Karki, A., and Yao, T.: Mechanisms leading to the 2016 giant twin glacier collapses, Aru Range, Tibet, The Cryosphere, 12, 2883–2900, https://doi.org/10.5194/tc-12-2883-2018, 2018. a
Gilbert, A., Sinisalo, A., Gurung, T. R., Fujita, K., Maharjan, S. B., Sherpa, T. C., and Fukuda, T.: The influence of water percolation through crevasses on the thermal regime of a Himalayan mountain glacier, The Cryosphere, 14, 1273–1288, https://doi.org/10.5194/tc-14-1273-2020, 2020. a
Ginot, P., Stampfli, F., Stampfli, D., Schwikowski, M., and Gäggeler, H. W.: FELICS, a new ice core drilling system for high-altitude glaciers, Memoirs of National Institute of Polar Research Special Issue, 56, 38–48, https://nipr.repo.nii.ac.jp/records/2428 (last access: 7 April 2024), 2002. a
Ginot, P., Kull, C., Schotterer, U., Schwikowski, M., and Gäggeler, H. W.: Glacier mass balance reconstruction by sublimation induced enrichment of chemical species on Cerro Tapado (Chilean Andes), Clim. Past, 2, 21–30, https://doi.org/10.5194/cp-2-21-2006, 2006. a
Glen, J. W.: The stability of ice-dammed lakes and other water-filled holes in glaciers, J. Glaciol., 2, 316–318, https://doi.org/10.3189/S0022143000025132, 1954. a
Goel, V., Brown, J., and Matsuoka, K.: In-situ tempetatures in the top 20 m of firn near the summit of Blåskimen Island, Western Dronning Maud Land, Norwegian Polar Institute [data set], https://doi.org/10.21334/NPOLAR.2017.3845E964, 2017a. a
Goel, V., Brown, J., and Matsuoka, K.: Glaciological settings and recent mass balance of Blåskimen Island in Dronning Maud Land, Antarctica, The Cryosphere, 11, 2883–2896, https://doi.org/10.5194/tc-11-2883-2017, 2017b. a
Google: Google Colaboratory [code], https://colab.research.google.com (last access: 7 April 2025), 2025. a
Grześ, M.: Non-cored hot point drills on Hans Glacier (Spitsbergen), method and first results, Pol. Polar Res., 1, 75–85, https://journals.pan.pl/dlibra/publication/127922/edition/111611 (last access: 7 April 2024), 1980. a
GTN-G: GTN-G Glacier Regions (GlacReg), Global Terrestrial Network for Glaciers [data set], https://doi.org/10.5904/gtng-glacreg-2017-07, 2017. a
Guo, W., Liu, S., Xu, J., Wu, L., Shangguan, D., Yao, X., Wei, J., Bao, W., Yu, P., Liu, Q., and Jiang, Z.: The second Chinese glacier inventory: data, methods and results, J. Glaciol., 61, 357–372, https://doi.org/10.3189/2015JoG14J209, 2015. a, b, c, d, e, f
Gäggeler, H., von Gunten, H. R., Rössler, E., Oeschger, H., and Schotterer, U.: 210Pb-dating of cold alpine firn/ice cores from Colle Gnifetti, Switzerland, J. Glaciol., 29, 165–177, https://doi.org/10.3189/S0022143000005220, 1983. a
Haeberli, W.: Ice temperatures in the Alps, Zeitschrift für Gletscherkunde und Glazialgeologie, 11, 203–220, 1976. a, b
Haeberli, W. and Alean, J.: Temperature and accumulation of high altitude firn in the Alps, Ann. Glaciol., 6, 161–163, https://doi.org/10.3189/1985AoG6-1-161-163, 1985. a, b
Haeberli, W. and Funk, M.: Borehole temperatures at the Colle Gnifetti core-drilling site (Monte Rosa, Swiss Alps), J. Glaciol., 37, 37–46, https://doi.org/10.3189/S0022143000042775, 1991. a
Haeberli, W., Frauenfelder, R., Kääb, A., and Wagner, S.: Characteristics and potential climatic significance of “miniature ice caps” (crest- and cornice-type low-altitude ice archives), J. Glaciol., 50, 129–136, https://doi.org/10.3189/172756504781830330, 2004. a
Hagen, J. O.: Temperature distribution in Brøggerbreen, Lovenbreen and Kongsvegen, Northwest Spitsbergen, in: Field Workshop on Glaciological Research in Svalbard: Current Problems at the Polish Polar Station, Hornsund, Spitsbergen 26-30 April 1992, Uniwersytet Śląski, https://opus.us.edu.pl/info/book/USL18f37e0cd7a14ae7b83e6f9b37ce7dc2 (last access: 7 April 2024), 1992. a, b, c
Hager, P.: Glaziologische Untersuchungen am Gipfelgrat des Vadret dal Corvatsch: Thermik und Oberflächenprozesse, Master's thesis, Universität Zürich, Geographisches Institut, 2002. a
Hammer, C. U.: Ice core drilling, in: Report on activities and results 1993–1995 for Hans Tavsen Ice Cap Project – Glacier and Climate Change Research, North Greenland, edited by: Reeh, N., NMRs (Nordisk Minister Råd) miljøforskningsprogram – klimaforskning, Dansk Polar Center, 16–28, 1995. a
Han, J., Wen, J., Shang, X., and Jin, H.: Temperature distribution in Collins Ice Cap, King George Island, Antarctica, Chinese Journal of Polar Research, 7, 62–69, https://journal.chinare.org.cn/CN/Y1995/V7/I1/62 (last access: 7 April 2024), 1995. a
Han, Y., Jun, S. J., Miyahara, M., Lee, H.-G., Ahn, J., Woong, C. J., Hur, S. D., and Hong, S. B.: Shallow ice-core drilling on Styx Glacier, northern Victoria Land, Antarctica in the 2014-2015 summer, Journal of the Geological Society of Korea, 51, 343–355, https://doi.org/10.14770/jgsk.2015.51.3.343, 2015. a
Harrison, J.: Jacobsen-McGill Arctic Research Expedition 1959–1962: Preliminary report 1961–1962, Axel Heiberg Island Research Reports, McGill University, 1963. a, b
Harrison, W. D.: Temperature of a temperate glacier, J. Glaciol., 11, 15–29, https://doi.org/10.3189/S0022143000022450, 1972. a, b
Harrison, W. D., Mayo, L. R., and Trabant, D. C.: Temperature measurements on Black Rapids Glacier, Alaska, 1973, in: Climate of the Arctic: Twenty-Fourth Alaska Science Conference, 15–17 August 1973: Fairbanks, edited by: Weller, G. and Bowling, S. A., University of Alaska, Geophysical Institute, 350–352, https://citeseerx.ist.psu.edu/document?repid=rep1&type=pdf&doi=9dbf174017ca2945dec1f6266164b9707cdd33f3, 1975. a, b
Hasholt, B.: A new map of the Mitdluagkat glacier – a preliminary report, Danish Journal of Geography, 87, 19–21, https://tidsskrift.dk/geografisktidsskrift/article/view/44411 (last access: 7 April 2024), 1987. a
Hattersley-Smith, G.: Studies of englacial profiles in the Lake Hazen area of Northern Ellesmere Island, J. Glaciol., 3, 610–625, https://doi.org/10.3189/S002214300002373X, 1960. a, b
Heim, A., Pasquier, L. D., and Forel, F. A.: Die Gletscherlawine an der Altels am 11. September 1895, Zürcher und Furrer, https://www.google.com/books/edition/Die_Gletscherlawine_an_der_Altels_am_11/wak3ZUof9yUC (last access: 7 April 2024), google-Books-ID: wak3ZUof9yUC, 1895. a
Herren, P.-A., Eichler, A., Machguth, H., Papina, T., Tobler, L., Zapf, A., and Schwikowski, M.: The onset of Neoglaciation 6000 years ago in western Mongolia revealed by an ice core from the Tsambagarav mountain range, Quaternary Sci. Rev., 69, 59–68, https://doi.org/10.1016/j.quascirev.2013.02.025, 2013. a
Hodgkins, R., Hagen, J. O., and Hamran, S.-E.: 20th century mass balance and thermal regime change at Scott Turnerbreen, Svalbard, Ann. Glaciol., 28, 216–220, https://doi.org/10.3189/172756499781821986, 1999. a
Hoelzle, M.: Englacial temperature, in: The Swiss Glaciers 2003/04 and 2004/05, no. 125-126 in: Glaciological Report, edited by: Bauder, A. and Rüegg, R., Swiss Academy of Sciences (SCNAT), Cryospheric Commission (EKK), 71–74, https://doi.glamos.ch/pubs/glrep/glrep_125-126.html (last access: 7 April 2024), 2009. a
Hoelzle, M.: Englacial temperature, in: The Swiss Glaciers 2007/08 and 2008/09, no. 129-130 in: Glaciological Report, edited by: Bauder, A., Steffen, S., and Usselmann, S., Swiss Academy of Sciences (SCNAT), Cryospheric Commission (EKK), 69–73, https://doi.org/10.18752/glrep_129-130, 2014. a, b
Hoelzle, M.: Englacial temperature, in: The Swiss Glaciers 2013/14 and 2014/15, edited by: Bauder, A., no. 135–136 in Glaciological Report, pp. 93–98, Swiss Academy of Sciences (SCNAT), Cryospheric Commission (EKK), https://doi.org/10.18752/glrep_135-136, 2017. a, b
Hoelzle, M.: Englacial temperature, in: The Swiss Glaciers 2019/20 and 2020/21, edited by Bauder, A., Huss, M., and Linsbauer, A., no. 141-142 in Glaciological Report, Swiss Academy of Sciences (SCNAT), Cryospheric Commission (EKK), 115–119, https://doi.org/10.18752/glrep_141-142, 2022. a
Hoelzle, M., Darms, G., Lüthi, M. P., and Suter, S.: Evidence of accelerated englacial warming in the Monte Rosa area, Switzerland/Italy, The Cryosphere, 5, 231–243, https://doi.org/10.5194/tc-5-231-2011, 2011. a, b, c
Hoelzle, M., Huss, M., Kronenberg, M., Machguth, H., and Mattea, E.: Englacial temperature, in: The Swiss Glaciers 2017/18 and 2018/19, edited by Bauder, A., Huss, M., and Linsbauer, A., no. 139-140 in Glaciological Report, Swiss Academy of Sciences (SCNAT), Cryospheric Commission (EKK), 111–115, https://doi.org/10.18752/glrep_139-140, 2020. a, b
Hooke, R. L.: Pleistocene ice at the base of the Barnes Ice Cap, Baffin Island, N.W.T., Canada, J. Glaciol., 17, 49–59, https://doi.org/10.3189/S0022143000030719, 1976. a
Hooke, R. L., Alexander Jr., E. C., and Gustafson, R. J.: Temperature profiles in the Barnes Ice Cap, Baffin Island, Canada, and heat flux from the subglacial terrane, Can. J. Earth Sci., 17, 1174–1188, https://doi.org/10.1139/e80-124, 1980. a
Hou, S., Qin, D., Jouzel, J., Masson-Delmotte, V., von Grafenstein, U., Landais, A., Caillon, N., and Chappellaz, J.: Age of Himalayan bottom ice cores, J. Glaciol., 50, 467–468, https://doi.org/10.3189/172756504781829981, 2004. a
Hou, S., Chappellaz, J., Jouzel, J., Chu, P. C., Masson-Delmotte, V., Qin, D., Raynaud, D., Mayewski, P. A., Lipenkov, V. Y., and Kang, S.: Summer temperature trend over the past two millennia using air content in Himalayan ice, Clim. Past, 3, 89–95, https://doi.org/10.5194/cp-3-89-2007, 2007. a
Hou, S., Jenk, T. M., Zhang, W., Wang, C., Wu, S., Wang, Y., Pang, H., and Schwikowski, M.: Age ranges of the Tibetan ice cores with emphasis on the Chongce ice cores, western Kunlun Mountains, The Cryosphere, 12, 2341–2348, https://doi.org/10.5194/tc-12-2341-2018, 2018. a
Huang, M.: Glacier temperature conditions on the north slope of Shishapangma, in: Scientific expedition report on Shishapangma area, Science Press, 60–66, https://book.sciencereading.cn/shop/book/Booksimple/show.do?id=B56292D9F06FB4858ACFA509BCE48BBEB000 (last access: 7 April 2024), 1982. a, b
Huang, M.: On the temperature distribution of glaciers in China, J. Glaciol., 36, 210–216, https://doi.org/10.3189/S002214300000945X, 1990. a, b, c, d
Huang, M., Wang, Z., and Ren, J.: Ice temperature of glaciers in China, J. Glaciol. Geocryo., 4, 20–28, https://doi.org/10.7522/j.issn.1000-0240.1982.0002, 1982. a, b, c, d, e
Hubbard, B., Miles, K., Doyle, S., Quincey, D., and Miles, E.: Ice temperature time-series from sensors installed in boreholes drilled into Khumbu Glacier, Nepal, in 2017 and 2018 as part of EverDrill research project (version 2.0), NERC EDS UK Polar Data Centre [data set], https://doi.org/10.5285/32ECD5F4-1F00-4EEB-BD1E-5EAFFB60F556, 2021. a
Hughes, T. P. and Seligman, G.: The temperature, melt water movement and density increase in the névé of an Alpine glacier, Geophys. J. Int., 4, 616–647, https://doi.org/10.1111/j.1365-246X.1939.tb02922.x, 1939. a, b
Huss, M. and Fischer, M.: Sensitivity of very small glaciers in the Swiss Alps to future climate change, Front. Earth Sci., 4, 34, https://doi.org/10.3389/feart.2016.00034, 2016. a
Huwaldt, J. A.: Plot Digitizer (version 2.6.9), SourceForge [code], https://plotdigitizer.sourceforge.net (last access: 7 April 2024), 2020. a
Iida, H., Watanabe, O., and Takikawa, M.: First results from Himalayan Glacier Boring Project in 1981–1982: Part II. Studies on internal structure and transformation process from snow to ice of Yala Glacier, Langtang Himal, Nepal, Bull. Glacier Res., 2, 25–33, https://web.seppyo.org/bgr/pdf/2/BGR2P25.PDF (last access: 7 April 2024), 1984. a
Irvine-Fynn, T. D. L., Hodson, A. J., Moorman, B. J., Vatne, G., and Hubbard, A. L.: Polythermal glacier hydrology: a review, Rev. Geophys., 49, RG4002, https://doi.org/10.1029/2010RG000350, 2011. a, b, c
Jacquemart, M., Loso, M., Leopold, M., Welty, E., Berthier, E., Hansen, J. S., Sykes, J., and Tiampo, K.: What drives large-scale glacier detachments? Insights from Flat Creek glacier, St. Elias Mountains, Alaska, Geology, 48, 703–707, https://doi.org/10.1130/G47211.1, 2020. a
Jania, J., Mochnacki, D., and Gądek, B.: The thermal structure of Hansbreen, a tidewater glacier in southern Spitsbergen, Svalbard, Polar Res., 15, 53–66, https://doi.org/10.3402/polar.v15i1.6636, 1996. a, b, c, d
Jarvis, G. T.: Thermal studies related to surging glaciers, Master's thesis, University of British Columbia, https://doi.org/10.14288/1.0052497, 1973. a, b
Jarvis, G. T. and Clarke, G. K. C.: Thermal effects of crevassing on Steele Glacier, Yukon Territory, Canada, J. Glaciol., 13, 243–254, https://doi.org/10.3189/S0022143000023054, 1974. a
Jarvis, G. T. and Clarke, G. K. C.: The thermal regime of Trapridge Glacier and its relevance to glacier surging, J. Glaciol., 14, 235–250, https://doi.org/10.3189/S0022143000021729, 1975. a
Jiao, X., Dong, Z., Baccolo, G., Chen, X., Qin, X., and Shao, Y.: Provenance of aeolian dust revealed by (234u/238u) activity ratios in cryoconites from high-altitude glaciers in western China and its transport and settlement mechanisms, J. Geophys. Res.-Earth, 128, e2023JF007227, https://doi.org/10.1029/2023JF007227, 2023. a
Johnsen, S. J., Clausen, H. B., Dansgaard, W., Gundestrup, N. S., Hansson, M., Jonsson, P., Steffensen, J. P., and Sveinbjørnsdottir, A. E.: A “deep” ice core from East Greenland, Meddelelser om Grønland: Geoscience, 29, 3–22, https://doi.org/10.7146/moggeosci.v29i.140329, 1992. a
Jouzel, J., Legrand, M., Pinglot, J. F., and Pourchet, M.: Chronology of a core sample in the Col du Dôme (Mont Blanc massif), La Houille Blanche, 70, 491–498, https://doi.org/10.1051/lhb/1984035, 1984. a, b, c
Kameda, T., Takahashi, S., Goto-Azuma, K., Kohshima, S., Watanabe, O., and Hagen, J. O.: First report of ice core analyses and borehole temperatures on the highest icefield on western Spitsbergen in 1992, Bulletin of Glacier Research, 51–61, https://kitami-it.repo.nii.ac.jp/records/6924 (last access: 7 April 2024), 1993. a, b
Karev, E., Camilleri, P., Baptista, V., Bere, G., Borruso, A., Desmet, P., Gharti, S., Herrmann, A., Kariv, A., Shaw, C., Walsh, P., Winfree, L., Zanella Alvarenga, E., Zedlitz, J., Open Knowledge Foundation, and Petti, S.: frictionless: Python library for Data Packages, Zenodo [code], https://doi.org/10.5281/zenodo.4663759, 2024. a
Karušs, J., Lamsters, K., Sobota, I., Ješkins, J., Džeriņš, P., and Hodson, A.: Drainage system and thermal structure of a high Arctic polythermal glacier: Waldemarbreen, western Svalbard, J. Glaciol., 68, 591–604, https://doi.org/10.1017/jog.2021.125, 2022. a, b
Kawamura, T., Fujii, Y., Satow, K., Kamiyama, K., Izumi, K., Kameda, T., Watanabe, O., Kawaguchi, S., Wold, B., and Gjessing, Y.: Glaciological characteristics of cores drilled on Jostedalsbreen, Southern Norway, Proceedings of the NIPR Symposium on Polar Meteorology and Glaciology, 2, 152–160, https://doi.org/10.15094/00003576, 1989. a
Kawamura, T., Kameda, T., and Izumi, K.: Preliminary results of structural analyses of an 85.6m deep ice core retrieved from Hoghetta Ice Dome in Northern Spitsbergen, Svalbard, Bulletin of Glacier Research, 77–83, https://kitami-it.repo.nii.ac.jp/records/6923 (last access: 7 April 2024), 1991. a
Keck, L.: Climate significance of stable isotope records from Alpine ice cores, Ph.D. thesis, Ruprecht Karl University of Heidelberg, Combined Faculties for the Natural Sciences and for Mathematics, https://archiv.ub.uni-heidelberg.de/volltextserver/1837/1/summary.pdf (last access: 7 April 2024), 2001. a
Keeler, C. M.: Relationship between climate, ablation, and run-off on the Sverdrup Glacier, 1963, Devon Island, N.W.T., Tech. rep., Arctic Institute of North America, Research Paper, collection number 27, 1964. a
Khalzan, P., Sakai, A., and Fujita, K.: Mass balance of four Mongolian glaciers: in-situ measurements, long-term reconstruction and sensitivity analysis, Fron. Earth Sci., 9, 785306, https://doi.org/10.3389/feart.2021.785306, 2022. a
Khmelevskoy, I. F.: Temperature of snow, firn and ice: Stationary observations at the station Barier Somneiy and en route researches, vol. 2 of Data of Glaciological Studies: Novaya Zemlya, Academy of Sciences of the USSR, Institute of Geography, 1963. a
Khmelevskoy, I. F.: Temperature of snow, firn and ice: Stationary observations at the station Ledorazdelnaya, vol. 1 of Data of Glaciological Studies: Novaya Zemlya, Academy of Sciences of the USSR, Institute of Geography, 1964. a
Khromova, T. E., Nosenko, G. A., Glazovsky, A. F., Muraviev, A. Y., Nikitin, S. A., and Lavrentiev, I. I.: New inventory of Russian glaciers based on satellite data (2016–2019), Water Resour., 49, S55–S68, https://doi.org/10.1134/S0097807822070065, 2022. a
Kinnard, C., Zdanowicz, C. M., Fisher, D. A., and Wake, C. P.: Calibration of an ice-core glaciochemical (sea-salt) record with sea-ice variability in the Canadian Arctic, Ann. Glaciol., 44, 383–390, https://doi.org/10.3189/172756406781811349, 2006. a, b
Kinnard, C., Koerner, R. M., Zdanowicz, C. M., Fisher, D. A., Zheng, J., Sharp, M. J., Nicholson, L., and Lauriol, B.: Stratigraphic analysis of an ice core from the Prince of Wales Icefield, Ellesmere Island, Arctic Canada, using digital image analysis: High-resolution density, past summer warmth reconstruction, and melt effect on ice core solid conductivity, J. Geophys. Res.-Atmos., 113, D24120, https://doi.org/10.1029/2008JD011083, 2008. a
Kinnard, C., Ginot, P., Surazakov, A., MacDonell, S., Nicholson, L., Patris, N., Rabatel, A., Rivera, A., and Squeo, F. A.: Mass balance and climate history of a high-altitude glacier, desert Andes of Chile, Front. Earth Sci., 8, 40, https://doi.org/10.3389/feart.2020.00040, 2020. a, b
Kislov, B. V.: Infiltration feeding and ice formation on a glacier, in: Abramov Glacier (Alai Range), edited by: Krenke, A. N. and Suslov, V. F., Gidrometeoizdat, 97–108, http://geolibrary.ru/sites/default/files/2020-10/LednAbramova.pdf#page=98 (last access: 7 April 2024), 1980. a
Kislov, B. V., Nozdryukhin, V. K., and Perziger, F. I.: Temperature regime of the active layer of the Abramov Glacier, Data of Glaciological Studies, 30, 199–204, http://geolibrary.ru/sites/default/files/2020-11/30.pdf#page=199 (last access: 7 April 2024), 1977. a
Koerner, R. M.: Fabric analysis of a core from the Meighen Ice Cap, Northwest Territories, Canada, J. Glaciol., 7, 421–430, https://doi.org/10.3189/S0022143000020621, 1968. a
Koerner, R. M.: The mass balance of the Devon Island Ice Cap, Northwest Territories, Canada, 1961-66, J. Glaciol., 9, 325–336, https://doi.org/10.3189/S0022143000022863, 1970. a
Kotlyakov, V. M.: Deep structure of glaciers, in: Glaciology of Spitsbergen, Hayka, 132–144, http://geolibrary.ru/sites/default/files/2020-10/Glyatsiologiya_Shpitsbergena1985.pdf#page=71 (last access: 7 April 2024), 1985. a
Kotlyakov, V. M., Arkhipov, S. M., Henderson, K. A., and Nagornov, O. V.: Deep drilling of glaciers in Eurasian Arctic as a source of paleoclimatic records, Quaternary Sci. Rev., 23, 1371–1390, https://doi.org/10.1016/j.quascirev.2003.12.013, 2004. a, b, c, d, e, f, g
Kronenberg, M.: Changing glacier firn in Central Asia and its impact on glacier mass balance, Ph.D. thesis, University of Fribourg, Department of Geosciences, https://doi.org/10.51363/unifr.sth.2022.005, 2022. a
Kronenberg, M., Machguth, H., Eichler, A., Schwikowski, M., and Hoelzle, M.: Comparison of historical and recent accumulation rates on Abramov Glacier, Pamir Alay, J. Glaciol., 67, 253–268, https://doi.org/10.1017/jog.2020.103, 2021. a
Kronenberg, M., Cheremnykh, A., Eichler, A., Esenaman Uluu, M., Gilbert, A., Hoelzle, M., Kenzhebaev, R., Kummert, M., Lavrentiev, I., Machguth, H., Schwikowski, M., Schuppli, P., Walther, S., and Wicky, J.: Abramov glacier firn data (version 1), Zenodo [data set], https://doi.org/10.5281/zenodo.7112894, 2022a. a
Kronenberg, M., Lavrentiev, I., Machguth, H., Schuppli, P., and Wicky, J.: Gregoriev firn data (version 1), Zenodo [data set], https://doi.org/10.5281/zenodo.7113282, 2022b. a
Kubyshkin, N. V., Buzin, I. V., Skutin, A. A., and Glazovsky, A. F.: Determination of the area of generation of big icebergs in the Barents Sea – temperature distribution analysis, in: Proceedings of the Sixteenth (2006) International Offshore and Polar Engineering Conference, The International Society of Offshore and Polar Engineers, https://onepetro.org/ISOPEIOPEC/proceedings-abstract/ISOPE06/All-ISOPE06/9744 (last access: 7 April 2024), 2006. a
Kutuzov, S. S.: Changes in glacier area and volume in Terskey Ala-Too Range in the second half of the 20th century, Ice and Snow, 52, 5–14, https://doi.org/10.15356/2076-6734-2012-1-5-14, 2012. a
Kääb, A., Leinss, S., Gilbert, A., Bühler, Y., Gascoin, S., Evans, S. G., Bartelt, P., Berthier, E., Brun, F., Chao, W.-A., Farinotti, D., Gimbert, F., Guo, W., Huggel, C., Kargel, J. S., Leonard, G. J., Tian, L., Treichler, D., and Yao, T.: Massive collapse of two glaciers in western Tibet in 2016 after surge-like instability, Nat. Geosci., 11, 114–120, https://doi.org/10.1038/s41561-017-0039-7, 2018. a, b
Kääb, A., Jacquemart, M., Gilbert, A., Leinss, S., Girod, L., Huggel, C., Falaschi, D., Ugalde, F., Petrakov, D., Chernomorets, S., Dokukin, M., Paul, F., Gascoin, S., Berthier, E., and Kargel, J. S.: Sudden large-volume detachments of low-angle mountain glaciers – more frequent than thought?, The Cryosphere, 15, 1751–1785, https://doi.org/10.5194/tc-15-1751-2021, 2021. a
Laternser, M.: Firntemperaturmessungen in den Schweizer Alpen, Master's thesis, Eidgenössische Technische Hochschule (ETH) Zürich, 1992. a, b, c, d
Law, R., Christoffersen, P., Hubbard, B., Doyle, S. H., Chudley, T. R., Schoonman, C. M., Bougamont, M., des Tombe, B., Schilperoort, B., Kechavarzi, C., Booth, A., and Young, T. J.: Thermodynamics of a fast-moving Greenlandic outlet glacier revealed by fiber-optic distributed temperature sensing, Sci. Adv., 7, eabe7136, https://doi.org/10.1126/sciadv.abe7136, 2021. a
Lee, I.: Borehole tilt sensor data for Jarvis Glacier, Alaska (2017–2018), Arctic Data Center [data set], https://doi.org/10.18739/A2348GG12, 2019. a
Lee, I. R., Hawley, R. L., Bernsen, S., Campbell, S. W., Clemens-Sewall, D., Gerbi, C. C., and Hruby, K.: A novel tilt sensor for studying ice deformation: application to streaming ice on Jarvis Glacier, Alaska, J. Glaciol., 66, 74–82, https://doi.org/10.1017/jog.2019.84, 2020. a
Lemark, A.: A study of the Flade Isblink ice cap using a simple ice flow model, Master's thesis, University of Copenhagen, https://nbi.ku.dk/english/theses/masters-theses/andreas-lemark (last access: 7 April 2024), 2010. a
Li, Y., Tian, L., Yi, Y., Moore, J. C., Sun, S., and Zhao, L.: Simulating the evolution of Qiangtang No. 1 Glacier in the central Tibetan Plateau to 2050, Arct. Antarct. Alp. Res., 49, 1–12, https://doi.org/10.1657/AAAR0016-008, 2017. a
Li, Z., Yao, T., Tian, L., Xu, B., Wu, G., and Zhu, G.: Ice-core borehole temperature at 7000 m on the Muztagh Glacier, J. Glaciol. Geocryo., 26, 284–288, https://doi.org/10.7522/j.issn.1000-0240.2004.0047, 2004. a
Li, Z., Li, H., and Chen, Y.: Mechanisms and simulation of accelerated shrinkage of continental glaciers: A case study of Urumqi Glacier No. 1 in eastern Tianshan, Central Asia, J. Earth Sci., 22, 423–430, https://doi.org/10.1007/s12583-011-0194-5, 2011. a, b
Liu, C. and Sharmal, C. K. (Eds.): Report on first expedition to glaciers and glacier lakes in the Pumqu (Arun) and Poiqu (Bhote-Sun Kosi) river basins, Xizang (Tibet), China: Sino-Nepalese investigation of glacier lake outburst floods in the Himalayas, Science Press, https://book.sciencereading.cn/shop/book/Booksimple/show.do?id=BFE8446A281124A7580F32634BC24A26C000 (last access: 7 April 2024), 1988. a, b, c
Liu, L., Jiang, L., Sun, Y., Wang, H., Yi, C., and Hsu, H.: Morphometric controls on glacier mass balance of the Puruogangri Ice Field, central Tibetan Plateau, Water, 8, 496, https://doi.org/10.3390/w8110496, 2016. a
Liu, S., Guo, W., and Xu, J.: The second glacier inventory dataset of China (version 1.0), National Tibetan Plateau Data Center [data set], https://doi.org/10.3972/glacier.001.2013.db, 2012. a, b, c, d, e, f, g, h, i, j, k
Liu, Y., Hou, S., Ren, J., Wang, Y., and Geng, Z.: Temperature distribution characteristics of boreholes in Miaoergou flat-top glacier in East Tianshan Mountains, J. Glaciol. Geocryol., 28, 668–671, https://doi.org/10.7522/j.issn.1000-0240.2006.0097, 2006. a
Liu, Y., Hou, S., Wang, Y., and Linlin, S.: Distribution of borehole temperature at four high-altitude alpine glaciers in Central Asia, J. Mountain Sci., 6, 221–227, https://doi.org/10.1007/s11629-009-0254-9, 2009. a, b, c, d
Lliboutry, L., Briat, M., Creseveur, M., and Pourchet, M.: 15m deep temperatures in the glaciers of Mont Blanc (French Alps), J. Glaciol., 16, 197–203, https://doi.org/10.3189/S0022143000031531, 1976. a
Løkkegaard, A., Mankoff, K. D., Zdanowicz, C., Clow, G. D., Lüthi, M. P., Doyle, S. H., Thomsen, H. H., Fisher, D., Harper, J., Aschwanden, A., Vinther, B. M., Dahl-Jensen, D., Zekollari, H., Meierbachtol, T., McDowell, I., Humphrey, N., Solgaard, A., Karlsson, N. B., Khan, S. A., Hills, B., Law, R., Hubbard, B., Christoffersen, P., Jacquemart, M., Seguinot, J., Fausto, R. S., and Colgan, W. T.: Greenland and Canadian Arctic ice temperature profiles database, The Cryosphere, 17, 3829–3845, https://doi.org/10.5194/tc-17-3829-2023, 2023. a, b, c, d, e, f, g, h, i, j
Lüthi, M. P.: Experimental and numerical investigation of a firn covered cold glacier and a polythermal ice stream: case studies at Colle Gnifetti and Jakobshavns Isbræ, Ph.D. thesis, Eidgenossischen Technischen Hochschule (ETH) Zürich, https://doi.org/10.3929/ethz-a-003884174, 1999. a
Lüthi, M. P. and Funk, M.: Modelling heat flow in a cold, high-altitude glacier: interpretation of measurements from Colle Gnifetti, Swiss Alps, J. Glaciol., 47, 314–324, https://doi.org/10.3189/172756501781832223, 2001. a
Macheret, Y. Y., Zagorodnov, V. S., Vasilenko, E. V., Gromyko, A. I., and Zhuravlev, A. B.: On the nature of internal radio echo returns from a subpolar glacier, Data of Glaciological Studies, 54, 120–130, http://geolibrary.ru/sites/default/files/2020-12/54.pdf#page=121 (last access: 7 April 2024), 1985. a, b
Machguth, H. and Kronenberg, M.: Add 2018 Abramov borehole from Kronenberg 2022, https://github.com/mjacqu/glenglat/issues/71 (last access: 7 April 2024), 2024. a
Machguth, H., Eichler, A., Schwikowski, M., Brütsch, S., Mattea, E., Kutuzov, S., Heule, M., Usubaliev, R., Belekov, S., Mikhalenko, V. N., Hoelzle, M., and Kronenberg, M.: Firn core data from Grigoriev Ice Cap, 1962 to present (version 0.1), Zenodo [data set], https://doi.org/10.5281/zenodo.10082961, 2023a. a
Machguth, H., Eichler, A., Schwikowski, M., Brütsch, S., Mattea, E., Kutuzov, S., Heule, M., Usubaliev, R., Belekov, S., Mikhalenko, V. N., Hoelzle, M., and Kronenberg, M.: Fifty years of firn evolution on Grigoriev ice cap, Tien Shan, Kyrgyzstan, The Cryosphere, 18, 1633–1646, https://doi.org/10.5194/tc-18-1633-2024, 2024b. a, b
Mankoff, K.: Renland88, Github [code], https://github.com/GEUS-Glaciology-and-Climate/greenland_ice_borehole_temperature_profiles/tree/8b28d0e7333426426ac377615663ba735e5623f9/boreholes/Renland88, 2022a. a
Mankoff, K.: PrinceWales05, Github [code], https://github.com/GEUS-Glaciology-and-Climate/greenland_ice_borehole_temperature_profiles/tree/8b28d0e7333426426ac377615663ba735e5623f9/boreholes/PrinceWales05, 2022b. a
Mankoff, K.: Penny96, Github [code], https://github.com/GEUS-Glaciology-and-Climate/greenland_ice_borehole_temperature_profiles/tree/8b28d0e7333426426ac377615663ba735e5623f9/boreholes/Penny96, 2022c. a
Mankoff, K.: FladeIsblink06, Github [code], https://github.com/GEUS-Glaciology-and-Climate/greenland_ice_borehole_temperature_profiles/tree/8b28d0e7333426426ac377615663ba735e5623f9/boreholes/FladeIsblink06, 2022d. a
Mankoff, K.: Devon98, Github [code], https://github.com/GEUS-Glaciology-and-Climate/greenland_ice_borehole_temperature_profiles/tree/8b28d0e7333426426ac377615663ba735e5623f9/boreholes/Devon98, 2022e. a
Mankoff, K., Løkkegaard, A., Colgan, W., Thomsen, H., Clow, G., Fisher, D., Zdanowicz, C., Lüthi, M. P., Vinther, B., MacGregor, J. A., McDowell, I., Zekollari, H., Meierbachtol, T., Doyle, S., Law, R., Hills, B., Harper, J., Humphrey, N., Hubbard, B., Christoffersen, P., and Jacquemart, M.: Greenland deep ice temperature database (version 1.1), GEUS Dataverse V4 [data set], https://doi.org/10.22008/FK2/3BVF9V, 2022. a, b, c, d, e
Marchenko, S., Pohjola, V. A., Pettersson, R., van Pelt, W. J. J., Vega, C. P., Machguth, H., Bøggild, C. E., and Isaksson, E.: A plot-scale study of firn stratigraphy at Lomonosovfonna, Svalbard, using ice cores, borehole video and GPR surveys in 2012–14, J. Glaciol., 63, 67–78, https://doi.org/10.1017/jog.2016.118, 2017. a
Markl, V. G. and Wagner, H. P.: Measurements of ice and firn temperatures on the Hintereisferner (Ötztal Alps), Zeitschrift für Gletscherkunde und Glazialgeologie, 13, 261–265, https://www.uibk.ac.at/projects/station-hintereis-opal-data/publications/pdf/markl_wagner_1977_zgg.pdf (last access: 7 April 2024), 1977. a
Masiokas, M. H., Rabatel, A., Rivera, A., Ruiz, L., Pitte, P., Ceballos, J. L., Barcaza, G., Soruco, A., Bown, F., Berthier, E., Dussaillant, I., and MacDonell, S.: A review of the current state and recent changes of the Andean cryosphere, Front. Earth Sci., 8, 99, https://doi.org/10.3389/feart.2020.00099, 2020. a
Matsuda, Y., Sakai, A., Fujita, K., Nakawo, M., Duan, K., Pu, J., and Yao, T.: Glaciological observations on July 1st glacier in Qilian Mountains of west China during summer 2002, Bulletin of Glaciological Research, 21, 31–36, https://web.seppyo.org/bgr/pdf/21/BGR21P31.pdf (last access: 7 April 2024), 2004. a
Matsuoka, K. and Naruse, R.: Mass balance features derived from a firn core at Hielo Patagónico Norte, South America, Arct. Antarct. Alp. Res., 31, 333–340, https://doi.org/10.1080/15230430.1999.12003318, 1999. a
Mattea, E.: Measuring and modelling changes in the firn at Colle Gnifetti, 4400 m a.s.l., Swiss Alps, Master's thesis, University of Fribourg, Department of Geosciences, https://bigweb.unifr.ch/Science/Geosciences/GeographyTechnical/Secretary/Pub/Publications/Geography/SelectedBachelorMasterThesis/2020/Mattea_E._(2020)_M_Measuring_modelling_changes_Colle_Gnifetti.pdf (last access: 7 April 2024), 2020. a
Mattea, E., Machguth, H., Kronenberg, M., van Pelt, W., Bassi, M., and Hoelzle, M.: Firn changes at Colle Gnifetti revealed with a high-resolution process-based physical model approach, The Cryosphere, 15, 3181–3205, https://doi.org/10.5194/tc-15-3181-2021, 2021. a
Mayewski, P.: Colle Gnifetti ice core (KCC) progress report (year one) – Arcadia ice core proposal: Initiatives on the science of the human past, Tech. rep., University of Maine, https://digitalcommons.library.umaine.edu/orsp_reports/29 (last access: 7 April 2024), 2014. a
Mikhalenko, V., Sokratov, S., Kutuzov, S., Ginot, P., Legrand, M., Preunkert, S., Lavrentiev, I., Kozachek, A., Ekaykin, A., Faïn, X., Lim, S., Schotterer, U., Lipenkov, V., and Toropov, P.: Investigation of a deep ice core from the Elbrus western plateau, the Caucasus, Russia, The Cryosphere, 9, 2253–2270, https://doi.org/10.5194/tc-9-2253-2015, 2015. a
Mikhalenko, V. N.: Properties of the mass-exchange of plateau glaciers in the inner Tian Shan, Data of Glaciological Studies, 65, 86–92, http://geolibrary.ru/sites/default/files/2020-12/65.pdf#page=87 (last access: 7 April 2024), 1989. a
Mikhalenko, V. N., Kutuzov, S. S., Faizrakhmanov, F. F., Nagornov, O. V., Thompson, L. G., Kunakhovich, M. G., Arkhipov, S. M., Dikikh, A. N., and Usubaliev, R.: Reduction of glaciation in the Tien Shan in the 19th – early 21st centuries: results of core drilling and temperature measurements in wells, Data of Glaciological Studies, 98, 175–182, http://geolibrary.ru/sites/default/files/2021-01/98.pdf#page=177 (last access: 7 April 2024), 2005a. a, b
Mikhalenko, V. N., Kutuzov, S. S., Lavrentiev, I. I., Kunakhovich, M. G., and Thompson, L. G.: Studies of the western Elbrus glacial plateau: results and prospects, Data of Glaciological Studies, 99, 185–190, http://geolibrary.ru/sites/default/files/2021-01/99.pdf#page=187(last access: 7 April 2024), 2005b. a
Mikhalenko, V. N., Kutuzov, S. S., Lavrentiev, I. I., Toropov, P. A., Vladimirova, D. O., Abramov, A. A., and Matskovsky, V. V.: Glacioclimatological investigations of the Institute of Geography, RAS, in the crater of Eastern Summit of Mt. Elbrus in 2020, Ice and Snow, 61, 149–160, https://doi.org/10.31857/S2076673421010078, 2021. a
Miles, K. E., Hubbard, B., Quincey, D. J., Miles, E. S., Sherpa, T. C., Rowan, A. V., and Doyle, S. H.: Polythermal structure of a Himalayan debris-covered glacier revealed by borehole thermometry, Sci. Rep., 8, 16 825, https://doi.org/10.1038/s41598-018-34327-5, 2018. a, b
Miles, K. E., Miles, E. S., Hubbard, B., Quincey, D. J., Rowan, A. V., and Pallett, M.: Instruments and methods: hot-water borehole drilling at a high-elevation debris-covered glacier, J. Glaciol., 65, 822–832, https://doi.org/10.1017/jog.2019.49, 2019. a
Morev, V. A. and Pukhov, V. A.: Experimental work on drilling cold cover glaciers using AARI thermal drilling equipment, in: Studies of the ice cover and periglacial of Severnaya Zemlya, no. 367 in: Proceedings of AARI, Arctic and Antarctic Research Institute, 64–68, 1981. a
Morev, V. A., Klementiev, O. L., Manevsky, L. N., Raykovsky, Y. V., Tolstoy, A. I., and Yakovlev, V. M.: Glacio-drilling work on the Vavilov Glacier in 1979–1985, in: Geographical and glaciological studies in polar countries, edited by: Korotkevich, E. S. and Petrov, V. N., Gidrometeoizdat, 25–32, 1988. a, b
Motoyama, H., Kamiyama, K., Igarashi, M., Nishio, F., and Watanabe, O.: Distribution of chemical constituents in superimposed ice from Austre Brøggerbreen, Spitsbergen, Geogr. Ann. A, 82, 33–38, https://doi.org/10.1111/j.0435-3676.2000.00003.x, 2000. a
Motoyama, H., Watanabe, O., Fujii, Y., Kamiyama, K., Igarashi, M., Matoba, S., Kameda, T., Goto-Azuma, K., Izumi, K., Narita, H., Iizuka, Y., and Isaksson, E.: Analyses of ice core data from various sites in Svalbard glaciers from 1987 to 1999, Tech. rep., NIPR Arctic Data Reports, National Institute of Polar Research, https://doi.org/10.15094/00006119, 2008. a, b, c, d, e
Muñoz Sabater, J.: ERA5-Land monthly averaged data from 1950 to present, Copernicus Climate Change Service (C3S) Climate Data Store (CDS) [data set], https://doi.org/10.24381/cds.68d2bb30, 2019. a, b, c
Møller, J. T.: Glaciers in Upernivik Ø: With special reference to the periglacial phenomena, Danish Journal of Geography, 58, 30–53, https://tidsskrift.dk/geografisktidsskrift/article/view/46404 (last access: 7 April 2024), 1959. a
Müller, F.: Englacial temperature measurements, in: Jacobsen-McGill Arctic Research Expedition to Axel Heiberg Island, Queen Elizabeth Islands: Preliminary Report of 1959–1960, edited by: Müller, B. S., McGill University, 87–99, 1961. a
Müller, F.: Englacial temperature measurements, in: Jacobsen-McGill Arctic Research Expedition 1959-1962: Preliminary report 1961–1962, Axel Heiberg Island Research Reports, McGill University, 81–89, 1963a. a, b
Müller, F.: Accumulation studies, in: Jacobsen-McGill Arctic Research Expedition 1959–1962: Preliminary report 1961–1962, Axel Heiberg Island Research Reports, McGill University, 7–25, 1963b. a
Müller, F.: On the thermal regime of a high-Arctic valley glacier, J. Glaciol., 16, 119–133, https://doi.org/10.3189/S0022143000031476, 1976. a, b
Naftz, D. L. and Smith, M. E.: Ice thickness, ablation, and other glaciological measurements on Upper Fremont Glacier, Wyoming, Phys. Geogr., 14, 404–414, https://doi.org/10.1080/02723646.1993.10642488, 1993. a
Nicholls, K. W. and Paren, J. G.: Extending the Antarctic meteorological record using ice-sheet temperature profiles, J. Climate, 6, 141–150, https://doi.org/10.1175/1520-0442(1993)006<0141:ETAMRU>2.0.CO;2, 1993. a, b
Nikitin, S. A.: Temperature regime of Maly Aktru Glacier during the ablation period, Glaciology of Siberia: Collection of articles, 3, 81–84, https://vital.lib.tsu.ru/vital/access/manager/Repository/vtls:000070022, 1986. a, b
Nuttall, A.-M., Hagen, J. O., and Dowdeswell, J.: Quiescent-phase changes in velocity and geometry of Finsterwalderbreen, a surge-type glacier in Svalbard, Ann. Glaciol., 24, 249–254, https://doi.org/10.3189/S0260305500012258, 1997. a
Oeschger, H., Schotterer, U., Stauffer, B., Haeberli, W., and Röthlisberger, H.: First results from alpine core drilling projects, Zeitschrift für Gletchserkunde und Glazialgeologie, 13, 193–208, 1977. a
Olivier, S., Schwikowski, M., Brütsch, S., Eyrikh, S., Gäggeler, H. W., Lüthi, M., Papina, T., Saurer, M., Schotterer, U., Tobler, L., and Vogel, E.: Glaciochemical investigation of an ice core from Belukha Glacier, Siberian Altai, Geophys. Res. Lett., 30, 2019, https://doi.org/10.1029/2003GL018290, 2003. a
Orvig, S. and Mason, R. W.: Ice temperatures and heat flux, McCall Glacier, Alaska, in: General Assembly of Berkeley: Commission of Snow and Ice, vol. 61 of Publication, International Association of Scientific Hydrology, 181–188, https://iahs.info/uploads/dms/061021.pdf (last access: 7 April 2024), 1963. a
Palosuo, E.: A study of snow and ice temperatures on Vestfonna, Svalbard, 1956, 1957 and 1958, Geogr. Ann. A, 69, 431–437, https://doi.org/10.2307/521356, 1987. a
Palosuo, E. and Schytt, V.: To Nordaustlandet with the Swedish glaciological expedition, Eripainos Terrasta, 72, 1–19, 1960. a
Paterson, W. S. B.: A temperature profile through the Meighen Ice Cap, in: General Assembly of Bern: Commission of Snow and Ice, vol. 79 of Publication, International Association of Scientific Hydrology, 440–449, https://iahs.info/uploads/dms/079041.pdf (last access: 7 April 2024), 1968. a
Paterson, W. S. B.: Temperature measurements in Athabasca Glacier, Alberta, Canada, J. Glaciol., 10, 339–349, https://doi.org/10.3189/S0022143000022036, 1971. a, b
Paterson, W. S. B.: Temperature distribution in the upper layers of the ablation area of Athabasca Glacier, Alberta, Canada, J. Glaciol., 11, 31–41, https://doi.org/10.3189/S0022143000022462, 1972. a
Paterson, W. S. B. and Clarke, G. K. C.: Comparison of theoretical and observed temperature profiles in Devon Island Ice Cap, Canada, Geophys. J. Int., 55, 615–632, https://doi.org/10.1111/j.1365-246X.1978.tb05931.x, 1978. a, b, c
Pettersson, R., Jansson, P., and Holmlund, P.: Cold surface layer thinning on Storglaciären, Sweden, observed by repeated ground penetrating radar surveys, J. Geophys. Res.-Earth, 108, 6004, https://doi.org/10.1029/2003JF000024, 2003. a, b
Pilø, L., Reitmaier, T., Fischer, A., Barrett, J. H., and Nesje, A.: Ötzi, 30 years on: A reappraisal of the depositional and post-depositional history of the find, Holocene, 33, 112–125, https://doi.org/10.1177/09596836221126133, 2023. a
Plam, M. Y.: Temperature of firn and ice, Data of Glaciological Studies: Elbrus, 5–59, 1962. a
Pollock, R., Walsh, P., Kariv, A., Karev, E., Desmet, P., and Data Package Working Group: Data Package v2, https://datapackage.org/standard/data-package (last access: 7 April 2024), 2025a. a
Pollock, R., Walsh, P., Kariv, A., Karev, E., Desmet, P., Husmann, K., and Data Package Working Group: Table Dialect v2, https://datapackage.org/standard/table-dialect (last access: 7 April 2024), 2025b. a
Pollock, R., Walsh, P., Kariv, A., Karev, E., Desmet, P., Welty, E., Slagel, D., Husmann, K., and Data Package Working Group: Table Schema v2, https://datapackage.org/standard/table-schema (last access: 7 April 2024), 2025c. a
Psareva, T. V.: Experimental 150-meter borehole on the Bezengi Glacier, Data of Glaciological Studies, 14, 93–97, http://geolibrary.ru/sites/default/files/2020-11/14.pdf#page=93 (last access: 7 April 2024), 1968. a
Pu, J., Yao, T., Zhang, Y., Seko, K., and Fujita, K.: Mass balance on the Dongkemadi and Meikuang glaciers in 1992/1993, J. Glaciol. Geocryol., 17, 138–143, https://doi.org/10.7522/j.issn.1000-0240.1995.0018, 1995. a
Pu, J., Yao, T., Wang, N., Duan, K., Zhu, G., and Yang, M.: The distribution of 80-m ice temperature in Puruogangri Ice Field on the Tibetan Plateau, J. Glaciol. Geocryol., 24, 282–286, https://doi.org/10.7522/j.issn.1000-0240.2002.0053, 2002. a
Qiu, J. and Deng, Y.: Snow Avalanche in Bogda Region, Tian Shan, J. Glaciol. Geocryol., 5, 227–234, https://doi.org/10.7522/j.issn.1000-0240.1983.0055, 1983. a
Rabus, B. T. and Echelmeyer, K. A.: Increase of 10 m ice temperature: climate warming or glacier thinning?, J. Glaciol., 48, 279–286, https://doi.org/10.3189/172756502781831430, 2002. a, b
Razumeiko, N. G.: Snow and ice temperature: Stationary studies of the Churlyanis Cupola, vol. 1 of Data of Glaciological Studies: Franz Josef Land, Academy of Sciences of the USSR, Institute of Geography, 1960. a
Razumeiko, N. G.: Snow and ice temperature: Stationary observations on the Sedov Glacier, En route thermosoundings of ice of the Churlyanis and Jackson cupolas and on the Sedov Glacier, vol. 2 of Data of Glaciological Studies: Franz Josef Land, Academy of Sciences of the USSR, Institute of Geography, 1963. a, b
Reeh, N.: Summary of activities and preliminary results, in: Report on activities and results 1993–1995 for Hans Tausen Ice Cap Project – Glacier and Climate Change Research, North Greenland, edited by: Reeh, N., NMRs (Nordisk Minister Råd) miljøforskningsprogram – klimaforskning, Dansk Polar Center, 7–13, 1995. a
Reeh, N., Olesen, O. B., Thomsen, H. H., Starzer, W., and Bøggild, C. E.: Mass balance parameterisation for the Hans Tausen Iskappe, Peary Land, North Greenland, Meddelelser om Grønland, Geoscience, 39, 57–69, https://doi.org/10.7146/moggeosci.v39i.140219, 2001. a
Ren, J.: The ice temperature of Bogda Fan-Shaped Diffluence Glacier in Bogda Area, Tian Shan, J. Glaciol. Geocryol., 5, 83–89, https://doi.org/10.7522/j.issn.1000-0240.1983.0040, 1983. a
Ren, J.: Temperature regime of the glaciers in the neighbourhood of Great Wall Station, Antarctica, Chinese Journal of Polar Research, 2, 22–27, https://journal.chinare.org.cn/CN/Y1990/V2/I2/22 (last access: 7 April 2024), 1990. a, b
Ren, J. and Huang, M.: Heat transfer within glacial active layer – Taking No. 5 Glacier, Yanglong River, Qilian Shan as an example, J. Glaciol. Geocryol., 3, 23–28, https://doi.org/10.7522/j.issn.1000-0240.1981.0042, 1981. a
Ren, J., Zhang, J., and Huang, M.: A study of ice temperature in No. 1 Glacier in the Urumqi River headwaters, Tianshan, J. Glaciol. Geocryol., 7, 141–152, https://doi.org/10.7522/j.issn.1000-0240.1985.0019, 1985. a
RGI Consortium: Randolph Glacier Inventory – A dataset of global glacier outlines: Version 7.0, National Snow and Ice Data Center [data set], https://doi.org/10.5067/f6jmovy5navz, 2023. a, b
Rundle, A. S.: Glaciological investigations on Sukkertoppen Ice Cap, Southwest Greenland, summer 1964, Tech. rep., The Ohio State University Research Foundation, https://hdl.handle.net/1811/51380 (last access: 7 April 2024), 1965. a
Ryser, C., Lüthi, M., Blindow, N., Suckro, S., Funk, M., and Bauder, A.: Cold ice in the ablation zone: Its relation to glacier hydrology and ice water content, J. Geophys. Res.-Earth, 118, 693–705, https://doi.org/10.1029/2012JF002526, 2013. a, b, c, d, e
Savatyugin, A. M. and Zagorodnov, V. S.: Glaciological studies on the Akademiya Nauk Ice Dome, Data of Glaciological Studies, 61, 228–228, http://geolibrary.ru/sites/default/files/2020-12/61.pdf#page=229 (last access: 7 April 2024), 1988. a
Savatyugin, L. M., Arkhipov, S. M., Vasiliev, N. I., Vostretsov, R. N., Fritzsche, D., and Miller, H.: Russian-German glaciological studies on Severnaya Zemlya and adjacent islands in 2000, Data of Glaciological Studies, 91, 150–162, http://geolibrary.ru/sites/default/files/2021-01/91.pdf#page=152 (last access: 7 April 2024), 2001. a
Schotterer, U., Grosjean, M., Stichler, W., Ginot, P., Kull, C., Bonnaveira, H., Francou, B., Gäggeler, H. W., Gallaire, R., Hoffmann, G., Pouyaud, B., Ramirez, E., Schwikowski, M., and Taupin, J. D.: Glaciers and climate in the Andes between the Equator and 30° S: What is recorded under extreme environmental conditions?, in: Climate variability and change in high elevation regions: Past, present & future, Springer, 157–175, https://doi.org/10.1007/978-94-015-1252-7_9, 2003. a
Schwerzmann, A., Funk, M., Blatter, H., Lüthi, M., Schwikowski, M., and Palmer, A.: A method to reconstruct past accumulation rates in Alpine firn regions: A study on Fiescherhorn, Swiss Alps, J. Geophys. Res.-Earth, 111, F01014, https://doi.org/10.1029/2005JF000283, 2006a. a
Schwerzmann, A. A., Blatter, H., and Funk, M.: Borehole analysis and flow modeling of firn-covered cold glaciers, Ph.D. thesis, Eidgenössische Technische Hochschule (ETH) Zürich, https://doi.org/10.3929/ethz-a-005114924, 2006b. a, b, c, d
Schwikowski, M., Schläppi, M., Santibañez, P., Rivera, A., and Casassa, G.: Net accumulation rates derived from ice core stable isotope records of Pío XI glacier, Southern Patagonia Icefield, The Cryosphere, 7, 1635–1644, https://doi.org/10.5194/tc-7-1635-2013, 2013. a, b
Schytt, V.: Scientific results of the Swedish glaciological expedition to Nordaustlandet, Spitsbergen, 1957 and 1958, Geograf. Ann., 46, 243–281, https://doi.org/10.1080/20014422.1964.11881042, 1964. a
Schytt, V.: Notes on glaciological activities in Kebnekaise, Sweden during 1965, Geograf. Ann. A, 48, 43–50, https://doi.org/10.1080/04353676.1966.11879728, 1966. a
Schytt, V.: Notes on glaciological activities in Kebnekaise, Sweden during 1966 and 1967, Geograf. Ann. A, 50, 111–120, https://doi.org/10.1080/04353676.1968.11879777, 1968. a
Shao, W. and Liu, Z.: Preliminary studies on the temperature in the surface layer of Guozha Glacier and Chongce Ice Cap in the West Kunlun Mountains, China, Bulletin of Glacier Research, 8, 87–91, https://web.seppyo.org/bgr/pdf/8/BGR8P87.PDF (last access: 7 April 2024), 1990. a, b, c
Sharp, R. P.: Thermal regimen of firn on Upper Seward Glacier, Yukon Territory, Canada, J. Glaciol., 1, 476–487, https://doi.org/10.3189/S0022143000026460, 1951. a, b
Sheldon, S. G., Popp, T. J., Hansen, S. B., Hedegaard, T. M., and Mortensen, C.: A new intermediate-depth ice-core drilling system, Ann. Glaciol., 55, 271–284, https://doi.org/10.3189/2014AoG68A038, 2014. a
Shi, Y. and Liu, D.: Preliminary report on the scientific expedition to the Shishapangma area, Sci. Bull., 15, 928–938, https://doi.org/10.1360/csb1964-9-10-928, 1964. a, b
Shiraiwa, T., Muravyev, Y. D., and Yamaguchi, S.: Stratigraphic features of firn as proxy climate signals at the summit ice cap of Usnkovsky Volcano, Kamchatka, Russia, Arct. Alp. Res., 29, 414–421, https://tandfonline.com/doi/abs/10.1080/00040851.1997.12003262 (last access: 7 April 2024), 1997. a
Shiraiwa, T., Murav'yev, Y. D., Kameda, T., Nishio, F., Toyama, Y., Takahashi, A., Ovsyannikov, A. A., Salamatin, A. N., and Yamagata, K.: Characteristics of a crater glacier at Ushkovsky volcano, Kamchatka, Russia, as revealed by the physical properties of ice cores and borehole thermometry, J. Glaciol., 47, 423–432, https://doi.org/10.3189/172756501781832061, 2001. a, b
Signer, N.: Analysis of ice temperatures of four selected very small glaciers in the Swiss Alps by means of modelling and ground penetrating radar, Master's thesis, Universität Zürich, https://lean-gate.geo.uzh.ch/typo3conf/ext/qfq/Classes/Api/download.php/mastersThesis/262 (last access: 7 April 2024), 2014. a, b
Singer, E. M. and Mikhalev, V. I.: Snow accumulation on Spitsbergen glaciers, Data of Glaciological Studies, 13, 86–100, http://geolibrary.ru/sites/default/files/2020-11/13.pdf#page=86 (last access: 7 April 2024), 1967. a
Singer, E. M., Koryakin, V. S., Lavrushin, Y. A., Markin, V. A., Mikhalev, V. I., and Troitsky, L. S.: Exploration of Spitsbergen glaciers by the Soviet expedition in the summer of 1965, Data of Glaciological Studies, 12, 59–72, http://geolibrary.ru/sites/default/files/2020-11/12_0.pdf#page=60 (last access: 7 April 2024), 1966. a, b
Sobota, I.: The near-surface ice thermal structure of the Waldemarbreen, Svalbard, Polish Polar Research, 30, 317–338, https://bibliotekanauki.pl/articles/2051641 (last access: 7 April 2024), 2009. a
Sobota, I.: Snow accumulation, melt, mass loss, and the near-surface ice temperature structure of Irenebreen, Svalbard, Polar Sci., 5, 327–336, https://doi.org/10.1016/j.polar.2011.06.003, 2011. a
Steffensen, J. P., Siggaard-Andersen, M.-L., Stampe, M., and Clausen, H. B.: Microparticles, soil derived chemical components and sea salt in the Hans Tausen Ice Cap ice core from Peary Land, North Greenland, Meddelelser om Grønland, Geoscience, 39, 151–160, https://doi.org/10.7146/moggeosci.v39i.140228, 2001. a
Su, Z.: Physical and chemical properties of glaciers in the Karakoram-Kunlun Mountains region, in: Glaciers and environment in the Karakoram-Kunlun Mountains region, Scientific Expedition Series in the Karakoram-Kunlun Mountains Region of the Tibetan Plateau, Science Press, 58–82, https://book.sciencereading.cn/shop/book/Booksimple/show.do?id=B828976A04419443DB3FE50FBA719BB38000 (last access: 7 April 2024), 1998. a, b, c, d
Sugiyama, S., Navarro, F. J., Sawagaki, T., Minowa, M., Segawa, T., Onuma, Y., Otero, J., and Vasilenko, E. V.: Subglacial water pressure and ice-speed variations at Johnsons Glacier, Livingston Island, Antarctic Peninsula, J. Glaciol., 65, 689–699, https://doi.org/10.1017/jog.2019.45, 2019. a
Sun, H., Wang, N., and Hou, S.: Twentieth century warming reflected by the Malan Glacier borehole temperatures, northern Tibetan Plateau, Arct. Antarct. Alp. Res., 53, 227–236, https://doi.org/10.1080/15230430.2021.1974667, 2021. a
Sun, W., Yan, M., Ai, S., Zhu, G., Wang, Z., Liu, L., Xu, Y., and Ren, J.: Ice temperature characteristics of Austre Lovénbreen in Ny-Ålesund, Arctic Region, Geomatics and Information Science of Wuhan University, 41, 79–85, https://doi.org/10.13203/j.whugis20150302, 2016. a, b
Suslov, V. F.: History and organization of research, in: Abramov Glacier (Alai Range), edited by: Krenke, A. N. and Suslov, V. F., Gidrometeoizdat, 8–12, http://geolibrary.ru/sites/default/files/2020-10/LednAbramova.pdf#page=9, 1980. a
Suter, S., Laternser, M., Haeberli, W., Frauenfelder, R., and Hoelzle, M.: Cold firn and ice of high-altitude glaciers in the Alps: measurements and distribution modelling, J. Glaciol., 47, 85–96, https://doi.org/10.3189/172756501781832566, 2001. a, b
Suter, S., Minor, H.-E., and Ohmura, A.: Cold firn and ice in the Monte Rosa and Mont Blanc areas: spatial occurrence, surface energy balance and climatic evidence, Ph.D. thesis, Eidgenössische Technische Hochschule (ETH) Zürich, https://doi.org/10.3929/ethz-a-004288434, 2002. a, b, c, d
Swisstopo: Journey through time – Topographic maps (version 2021.03.16), https://www.geocat.ch/geonetwork/srv/eng/catalog.search#/metadata/22287cd6-b75b-4caf-9413-aa3f196548b2 (last access: 7 April 2024), 2021. a
Takeuchi, N., Takahashi, A., Uetake, J., Yamazaki, T., Aizen, V. B., Joswiak, D., Surazakov, A., and Nikitin, S.: A report on ice core drilling on the western plateau of Mt. Belukha in the Russian Altai Mountains in 2003, Polar Meteorol. Glaciol., 18, 121–133, https://doi.org/10.15094/00002977, 2004. a
Takeuchi, N., Nakawo, M., Narita, H., and Han, J.: Miaoergou Glaciers in the Kalik Mountains, western China: Report of a reconnaissance for future ice core drilling and biological study, Bulletin of Glaciological Research, 26, 33–40, https://web.seppyo.org/bgr/pdf/26/BGR26P33.pdf (last access: 7 April 2024), 2008. a
Takeuchi, N., Fujita, K., Aizen, V. B., Narama, C., Yokoyama, Y., Okamoto, S., Naoki, K., and Kubota, J.: The disappearance of glaciers in the Tien Shan Mountains in Central Asia at the end of Pleistocene, Quaternary Sci. Rev., 103, 26–33, https://doi.org/10.1016/j.quascirev.2014.09.006, 2014. a
Talalay, P. G.: Mechanical ice drilling technology, Springer, Singapore, ISBN 978-981-10-0559-6, 978-981-10-0560-2, https://doi.org/10.1007/978-981-10-0560-2, 2016. a
Talalay, P. G.: Thermal ice drilling technology, Springer Geophysics, Springer, Singapore, ISBN 9789811388477, 9789811388484, https://doi.org/10.1007/978-981-13-8848-4, 2020. a
Thompson, L. G.: Glaciological investigations of the tropical Quelccaya Ice Cap, Peru, J. Glaciol., 25, 69–84, https://doi.org/10.3189/S0022143000010297, 1980. a
Thompson, L. G.: Curriculum vitae, https://research.bpcrc.osu.edu/Icecore/vitae/lgt_cv_old_format_2015.pdf (last access: 7 April 2024), 2015. a
Thompson, L. G.: Email to Mylène Jacquemart, 2022. a, b, c, d, e, f, g, h
Thompson, L. G., Mosley-Thompson, E., Davis, M. E., Bolzan, J. F., Dai, J., Klein, L., Gundestrup, N., Yao, T., Wu, X., and Xie, Z.: Glacial stage ice-core records from the subtropical Dunde Ice Cap, China, Ann. Glaciol., 14, 288–297, https://doi.org/10.3189/S0260305500008776, 1990. a, b
Thompson, L. G., Mosley-Thompson, E., Davis, M., Lin, P. N., Yao, T., Dyurgerov, M., and Dai, J.: “Recent warming”: ice core evidence from tropical ice cores with emphasis on Central Asia, Global Planet. Chang., 7, 145–156, https://doi.org/10.1016/0921-8181(93)90046-Q, 1993. a
Thompson, L. G., Mosley-Thompson, E., Davis, M. E., Lin, P. N., Dai, J., Bolzan, J. F., and Yao, T.: A 1000 year climate ice-core record from the Guliya ice cap, China: its relationship to global climate variability, Ann. Glaciol., 21, 175–181, https://doi.org/10.3189/S0260305500015780, 1995a. a
Thompson, L. G., Mosley-Thompson, E., Davis, M. E., Lin, P. N., Henderson, K. A., Cole-Dai, J., Bolzan, J. F., and Liu, K.-b.: Late glacial stage and Holocene tropical ice core records from Huascarán, Peru, Science, 269, 46–50, https://doi.org/10.1126/science.269.5220.46, 1995b. a
Thompson, L. G., Mikhalenko, V., Mosley-Thompson, E., Durgerov, M., Lin, P. N., Moskalevsky, M., Davis, M. E., Arkhipov, S., and Dai, J.: Ice core records of recent climatic variability: Grigoriev and It-Tish ice caps in Central Tien Shan, Central Asia, Data of Glaciological Studies, 81, 100–109, http://geolibrary.ru/sites/default/files/2021-01/81.pdf#page=100 (last access: 7 April 2024), 1997. a
Thompson, L. G., Davis, M. E., Mosley-Thompson, E., Sowers, T. A., Henderson, K. A., Zagorodnov, V. S., Lin, P.-N., Mikhalenko, V. N., Campen, R. K., Bolzan, J. F., Cole-Dai, J., and Francou, B.: A 25,000-year tropical climate history from Bolivian ice cores, Science, 282, 1858–1864, https://doi.org/10.1126/science.282.5395.1858, 1998. a
Thompson, L. G., Yao, T., Mosley-Thompson, E., Davis, M. E., Henderson, K. A., and Lin, P.-N.: A high-resolution millennial record of the South Asian monsoon from Himalayan ice cores, Science, 289, 1916–1919, https://doi.org/10.1126/science.289.5486.1916, 2000. a
Thompson, L. G., Mosley-Thompson, E., Davis, M. E., Henderson, K. A., Brecher, H. H., Zagorodnov, V. S., Mashiotta, T. A., Lin, P.-N., Mikhalenko, V. N., Hardy, D. R., and Beer, J.: Kilimanjaro ice core records: Evidence of Holocene climate change in tropical Africa, Science, 298, 589–593, https://doi.org/10.1126/science.1073198, 2002. a
Thompson, L. G., Mosley-Thompson, E. S., Zagorodnov, V., Davis, M. E., Mashiotta, T. A., and Lin, P.: 1500 years of annual climate and environmental variability as recorded in Bona-Churchill (Alaska) ice cores, https://ui.adsabs.harvard.edu/abs/2004AGUFMPP23C..05T (last access: 7 April 2024), 2004. a
Thompson, L. G., Yao, T., Davis, M. E., Mosley-Thompson, E., Mashiotta, T. A., Lin, P.-N., Mikhalenko, V. N., and Zagorodnov, V. S.: Holocene climate variability archived in the Puruogangri Ice Cap on the central Tibetan Plateau, Ann. Glaciol., 43, 61–69, https://doi.org/10.3189/172756406781812357, 2006. a
Thompson, L. G., Yao, T., Davis, M. E., Mosley-Thompson, E., Wu, G., Porter, S. E., Xu, B., Lin, P.-N., Wang, N., Beaudon, E., Duan, K., Sierra-Hernández, M. R., and Kenny, D. V.: Ice core records of climate variability on the Third Pole with emphasis on the Guliya ice cap, western Kunlun Mountains, Quaternary Sci. Rev., 188, 1–14, https://doi.org/10.1016/j.quascirev.2018.03.003, 2018. a, b, c, d
Thompson, L. G., Mosley-Thompson, E., Schoessow, F., Davis, M. E., Sierra-Hernández, M. R., and Beaudon, E.: The challenges, successes, and preliminary status report on the 2019 recovery of ice cores from Nevado Huascarán, Earth’s highest tropical mountain, Revista de Glaciares y Ecosistemas de Montaña, 8, 31–42, http://hdl.handle.net/20.500.12748/551 (last access: 7 April 2024), 2023. a
Thomsen, H. H., Reeh, N., Olesen, O. B., and Jonsson, P.: Glacier and climate research on Hans Tausen Iskappe, North Greenland – 1995 glacier basin activities and preliminary results, Bulletin Grønlands Geologiske Undersøgelse, 172, 78–84, https://doi.org/10.34194/bullggu.v172.6749, 1996. a
Trabant, D., Harrison, W. D., and Benson, C.: Thermal regime of McCall Glacier, Brooks Range, Northern Alaska, in: Climate of the Arctic: Twenty-Fourth Alaska Science Conference, 15–17 August 1973: Fairbanks, edited by: Weller, G. and Bowling, S. A., 347–349, University of Alaska, Geophysical Institute, 1975. a
Troilo, F., Gottardelli, S., Giordan, D., Dematteis, N., Godio, A., and Vincent, C.: Geophysical and geomatic recent surveys at Whymper hanging Glacier (Aosta Valley – Italy), EGU General Assembly 2021, online, 19–30 Apr 2021, EGU21-5178, https://doi.org/10.5194/egusphere-egu21-5178, 2021. a
Tsushima, A., Miyahara, M., Yamasaki, T., Esashi, N., Sato, Y., Kayastha, R. B., Lama Sherpa, A. J. B., Sano, M., and Fujita, K.: Ice core drilling on a high-elevation accumulation zone of Trambau Glacier in the Nepal Himalaya, Ann. Glaciol., 62, 353–359, https://doi.org/10.1017/aog.2021.15, 2021. a
Tsutaki, S., Sugiyama, S., Sakakibara, D., Aoki, T., and Niwano, M.: Surface mass balance, ice velocity and near-surface ice temperature on Qaanaaq Ice Cap, northwestern Greenland, from 2012 to 2016, Ann. Glaciol., 58, 181–192, https://doi.org/10.1017/aog.2017.7, 2017. a
Tsvetkov, A. V.: Mountains: Tsvetkov, https://nakarte.me/#m=7/43.03511/76.11952&l=O/Mt (last access: 7 April 2024), 2023. a
Tsykina, G. A. and Vilesov, E. N.: About the temperature regime of the Central Tuyuksu Glacier, in: Research on glaciers and glacial areas, edited by Avsyuk, G. A., Academy of Sciences of the USSR, 3, 56–66, http://geolibrary.ru/sites/default/files/2020-11/IslLedLegnR_3.pdf#page=56 (last access: 7 April 2024), 1963. a
Uchida, T., Kamiyama, K., Fujii, Y., Takahashi, A., Suzuki, T., Yoshimura, Y., Igarashi, M., and Watanabe, O.: Ice core analyses and borehole temperature measurements at the drilling site on Asgardfonna, Svalbard, in 1993, Memoirs of National Institute of Polar Research: Special issue, 51, 377–386, https://nipr.repo.nii.ac.jp/records/2300 (last access: 7 April 2024), 1996. a, b
Urmann, D.: Decadal scale climate variability during the last millennium as recorded by the Bona Churchill and Quelccaya ice cores, Ph.D. thesis, The Ohio State University, https://etd.ohiolink.edu/acprod/odb_etd/ws/send_file/send?accession=osu1237853800 (last access: 7 April 2024), 2009. a
Vallot, J.: Value and variation of the deep temperature of the glacier, at Mont Blanc, in: Weekly reports of the sessions of the Academy of Sciences, Imprimerie Gauthier-Villars, 156, 1575–1578, https://gallica.bnf.fr/ark:/12148/bpt6k3109m/f1577.item (last access: 7 April 2024), 1913. a, b
van de Wal, R. S. W., Mulvaney, R., Isaksson, E., Moore, J. C., Pinglot, J. F., Pohjola, V. A., and Thomassen, M. P. A.: Reconstruction of the historical temperature trend from measurements in a medium-length borehole on the Lomonosovfonna plateau, Svalbard, Ann. Glaciol., 35, 371–378, https://doi.org/10.3189/172756402781816979, 2002. a
Van Tricht, L., Huybrechts, P., Van Breedam, J., Fürst, J. J., Rybak, O., Satylkanov, R., Ermenbaiev, B., Popovnin, V., Neyns, R., Paice, C. M., and Malz, P.: Measuring and inferring the ice thickness distribution of four glaciers in the Tien Shan, Kyrgyzstan, J. Glaciol., 67, 269–286, https://doi.org/10.1017/jog.2020.104, 2021. a
Vance, T. R., Roberts, J. L., Moy, A. D., Curran, M. A. J., Tozer, C. R., Gallant, A. J. E., Abram, N. J., van Ommen, T. D., Young, D. A., Grima, C., Blankenship, D. D., and Siegert, M. J.: Optimal site selection for a high-resolution ice core record in East Antarctica, Clim. Past, 12, 595–610, https://doi.org/10.5194/cp-12-595-2016, 2016. a
Vandecrux, B., Charles Amory, Andreas P. Ahlstrøm, Pete D. Akers, Mary Albert, and and others: The SUMup collaborative database: Surface mass balance, subsurface temperature and density measurements from the Greenland and Antarctic ice sheets (1912–2023), Arctic Data Center [data set], https://doi.org/10.18739/A2M61BR5M, 2023. a, b, c
Vasilenko, E. V.: Structure of the Davydov Glacier according to radio sounding and thermal drilling data, Data of Glaciological Studies, 62, 208–214, http://geolibrary.ru/sites/default/files/2020-12/62.pdf#page=209 (last access: 7 April 2024), 1988. a
Vellut, Guilhem: Freehand raster georeferencer (version 0.8.3), QGIS plugins web portal [code], https://plugins.qgis.org/plugins/FreehandRasterGeoreferencer (last access: 7 April 2024), 2021. a
Vilesov, E. N.: Temperature of ice in the lower parts of the Tuyuksu glaciers, in: General Assembly of Helsinki. 25-7 – 6-8 1960, Publication, International Association of Scientific Hydrology, 313–324, https://iahs.info/uploads/dms/1793.313-324-54-Vilesov-opt.pdf (last access: 7 April 2024), 1961. a
Vilesov, E. N.: Ice temperature: Stationary observations, vol. 1 of Data of Glaciological Studies: Tien Shan Trans-Ili Alatau, Academy of Sciences of the USSR, Institute of Geography, 1962a. a
Vilesov, E. N.: Ice temperature: Stationary observations, vol. 2 of Data of Glaciological Studies: Tien Shan Trans-Ili Alatau, Academy of Sciences of the USSR, Institute of Geography, 1962b. a
Vilesov, E. N.: Ice temperature: Stationary observations, vol. 3 of Data of Glaciological Studies: Tien Shan Trans-Ili Alatau, Academy of Sciences of the USSR, Institute of Geography, 1962c. a
Vimeux, F., de Angelis, M., Ginot, P., Magand, O., Casassa, G., Pouyaud, B., Falourd, S., and Johnsen, S.: A promising location in Patagonia for paleoclimate and paleoenvironmental reconstructions revealed by a shallow firn core from Monte San Valentín (Northern Patagonia Icefield, Chile), J. Geophys. Res.-Atmos., 113, D16118, https://doi.org/10.1029/2007JD009502, 2008. a
Vimeux, F., Ginot, P., Schwikowski, M., Vuille, M., Hoffmann, G., Thompson, L. G., and Schotterer, U.: Climate variability during the last 1000 years inferred from Andean ice cores: A review of methodology and recent results, Palaeogeogr. Palaeocl., 281, 229–241, https://doi.org/10.1016/j.palaeo.2008.03.054, 2009. a, b, c
Vincent, C., Le Meur, E., Six, D., Possenti, P., Lefebvre, E., and Funk, M.: Climate warming revealed by englacial temperatures at Col du Dôme (4250 m, Mont Blanc area), Geophys. Res. Lett., 34, L16502, https://doi.org/10.1029/2007GL029933, 2007. a
Vincent, C., Descloitres, M., Garambois, S., Legchenko, A., Guyard, H., and Gilbert, A.: Detection of a subglacial lake in Glacier de Tête Rousse (Mont Blanc area, France), J. Glaciol., 58, 866–878, https://doi.org/10.3189/2012JoG11J179, 2012. a, b
Vincent, C., Gilbert, A., Jourdain, B., Piard, L., Ginot, P., Mikhalenko, V., Possenti, P., Le Meur, E., Laarman, O., and Six, D.: Strong changes in englacial temperatures despite insignificant changes in ice thickness at Dôme du Goûter glacier (Mont Blanc area), The Cryosphere, 14, 925–934, https://doi.org/10.5194/tc-14-925-2020, 2020. a, b, c, d, e
Vinther, B. M., Clausen, H. B., Fisher, D. A., Koerner, R. M., Johnsen, S. J., Andersen, K. K., Dahl-Jensen, D., Rasmussen, S. O., Steffensen, J. P., and Svensson, A. M.: Synchronizing ice cores from the Renland and Agassiz ice caps to the Greenland ice core chronology, J. Geophys. Res.-Atmos., 113, D08115, https://doi.org/10.1029/2007JD009143, 2008. a
Wang, L., Liu, C., Kang, X., and You, G.: Fundamental features of modern glaciers in the Altay Shan of China – Taking Halasi Glacier as an example, J. Glaciol. Geocryol., 5, 27–38, https://doi.org/10.7522/j.issn.1000-0240.1983.0061, 1983. a
Wang, L., Zhang, W., and Song, G.: Temperature conditions of glaciers in the Tomur Peak area, in: Glaciers and meteorology in the Tomur Peak area of the Tianshan Mountains, Xinjiang People's Publishing House, 64–69, 1985. a
Wang, N. and Pu, J.: Strong influence of geothermal heat on the physical properties of glacier ice in the Tibetan Plateau, J. Glaciol., 51, 177–178, https://doi.org/10.3189/S0022143000215207, 2005. a
Wang, P., Li, Z., Li, H., Wang, W., Zhou, P., and Wang, L.: Characteristics of a partially debris-covered glacier and its response to atmospheric warming in Mt. Tomor, Tien Shan, China, Global Planet. Change, 159, 11–24, https://doi.org/10.1016/j.gloplacha.2017.10.006, 2017. a
Wang, W.: Existing glaciers and their variations in the northeastern part of the Qinghai-Xizang Plateau, in: Reports on the northeastern part of the Qinghai-Xizang (Tibet) Plateau by Sino-W, German Scientific Expedition, edited by: Hövermann, J. and Wang, W., Science Press, 22–37, 1987. a
Wang, Y., Zhang, T., Ren, J., Qin, X., Liu, Y., Sun, W., Chen, J., Ding, M., Du, W., and Qin, D.: An investigation of the thermomechanical features of Laohugou Glacier No. 12 on Qilian Shan, western China, using a two-dimensional first-order flow-band ice flow model, The Cryosphere, 12, 851–866, https://doi.org/10.5194/tc-12-851-2018, 2018. a
Wang, Z., Zhang, J., and Shao, W.: Basic characteristics and utilization of glaciers on the southern slope of Bogda Peak, in: Water resources and environment in Chaiwopu-Dabancheng Area, edited by: Shi, Y., Science Press, 40–57, https://book.sciencereading.cn/shop/book/Booksimple/show.do?id=B21B5425CD1804E6DAB5BCC6E5D75E9B4000 (last access: 7 April 2024), 1989. a
Watanabe, O., Takenaka, S., Iida, H., Kamiyama, K., Thapa, K. B., and Mulmi, D. D.: First results from Himalayan Glacier Boring Project in 1981-1982: Part I. Stratigraphic analyses of full-depth cores from Yala Glacier, Langtang Himal, Nepal, Bulletin of Glacier Research, 2, 7–23, https://web.seppyo.org/bgr/pdf/2/BGR2P7.PDF, 1984. a
Watanabe, O., Motoyama, H., Igarashi, M., Kamiyama, K., Matoba, S., Goto-Azuma, K., Narita, H., and Kameda, T.: Studies on climatic and environmental changes during the last few hundred years using ice cores from various sites in Nordaustlandet, Svalbard (scientific paper), Memoirs of National Institute of Polar Research: Special Issue, 54, 227–242, https://kitami-it.repo.nii.ac.jp/records/7220 (last access: 7 April 2024), 2001. a, b
Watts, L. G., Dowdeswell, J. A., and Murray, T.: The dynamics of Austfonna, Svalbard: two dimensional modelling of ice motion over a deformable substrate, Data of Glaciological Studies, 83, 10–21, http://geolibrary.ru/sites/default/files/2021-01/83.pdf#page=11, 1997. a
Weidick, A.: Glaciers in South Greenland: history, nature, surroundings, no. 2 in Geology in Greenland, Geological Survey of Greenland, https://doi.org/10.22008/gpub/38104, 1988. a
Weller, G., Nolan, M., Wendler, G., Benson, C., Echelmeyer, K., and Untersteiner, N.: Fifty years of McCall Glacier research: From the International Geophysical Year 1957–58 to the International Polar Year 2007–08, ARCTIC, 60, 101–110, https://doi.org/10.14430/arctic280, 2007. a
Welty, E.: tablecloth (version 0.1.0), GitHub [code], https://github.com/ezwelty/tablecloth (last access: 7 april 2024), 2023. a
Welty, E., Jacquemart, M., Carcanade, G., Gastaldello, M., Van Tricht, L., Flowers, G. E., Sugiyama, S., Gurung, T. R., Prinz, R., Abermann, J., Steiner, J. F., Barandun, M., Gagliardini, O., Vincent, C., Thompson, L. G., Zhang, T., and Hoelzle, M.: glenglat: Global englacial temperature database, Zenodo [data set], https://doi.org/10.5281/zenodo.11516611, 2025. a, b, c, d, e
Wild, J., Nicolet, H., and Agassiz, L.: Carte du glacier inférieur de l'Aar, Zentralbibliothek Zürich, 5 Jd 15, 1, https://doi.org/10.3931/e-rara-35661, 1842. a
Wilson, N.: Characterization and interpretation of polythermal structure in two subarctic glaciers, Master's thesis, Simon Fraser University, https://summit.sfu.ca/item/12553 (last access: 7 April 2024), 2012. a
Wilson, N. J., Flowers, G. E., and Mingo, L.: Comparison of thermal structure and evolution between neighboring subarctic glaciers, J. Geophys. Res.-Earth, 118, 1443–1459, https://doi.org/10.1002/jgrf.20096, 2013. a, b, c
Wu, G., Yao, T., Xu, B., Li, Z., and Bao, H.: Ice-core borehole temperature in the Muztagh Ata, East Pamirs, J. Glaciol. Geocryol., 25, 676–679, https://doi.org/10.7522/j.issn.1000-0240.2003.0119, 2003. a
Wu, Z., Liu, S., Zhang, S., and Shangguan, D.: Accelerated thinning of Hei Valley No. 8 Glacier in the Tianshan Mountains, China, J. Earth Sci., 24, 1044–1055, https://doi.org/10.1007/s12583-013-0382-6, 2013. a
Yakor, I. S. (Ed.): Djankuat Glacier (Central Caucasus), Water-ice and heat balance of mountain glacier basins, Gidrometeoizdat, http://geolibrary.ru/sites/default/files/2020-10/Djankuat_Glacier_1978.pdf (last access: 7 April 2024), 1978. a
Yang, J., Han, Y., Orsi, A. J., Kim, S., Han, H., Ryu, Y., Jang, Y., Moon, J., Choi, T., Hur, S. D., and Ahn, J.: Surface temperature in Twentieth Century at the Styx Glacier, northern Victoria Land, Antarctica, from borehole thermometry, Geophys. Res. Lett., 45, 9834–9842, https://doi.org/10.1029/2018GL078770, 2018. a
Yao, T., Jiao, K., Zhang, X., Yang, Z., and Thompson, L. G.: Glaciologic studies on Guliya Ice Cap, J. Glaciol. Geocryol., 14, 233–241, https://doi.org/10.7522/j.issn.1000-0240.1992.0037, 1992. a
Yao, T., Duan, K., Xu, B., Wang, N., Pu, J., Kang, S., Qin, X., and Thompson, L. G.: Temperature and methane changes over the past 1000 years recorded in Dasuopu Glacier (central Himalaya) ice core, Ann. Glaciol., 35, 379–383, https://doi.org/10.3189/172756402781816997, 2002. a, b
Yuan, J., Wang, Z., Deng, Y., and Kang, Z.: Basic characteristics of marine glaciers in Guxiang, Tibet, in: Selected papers from the Academic Conference on Glaciology and Permafrost of the Chinese Geographical Society, Science Press, p. 21, https://book.sciencereading.cn/shop/book/Booksimple/onlineRead.do?id=B178ABC87BABF4C6798384A63D28510E5000&bookPageNum=30 (last access: 7 April 2024), 1982. a
Zagorodnov, V. and Arkhipov, S.: Studies of structure, composition and temperature regime of sheet glaciers of Svalbard and Severnaya Zemlya: methods and outcomes, Bulletin of Glacier Research, 8, 19–28, https://web.seppyo.org/bgr/pdf/8/BGR8P19.PDF, 1990. a
Zagorodnov, V., Thompson, L. G., Ginot, P., and Mikhalenko, V.: Intermediate-depth ice coring of high-altitude and polar glaciers with a lightweight drilling system, J. Glaciol., 51, 491–501, https://doi.org/10.3189/172756505781829269, 2005. a, b
Zagorodnov, V., Nagornov, O., and Thompson, L. G.: Influence of air temperature on a glacier’s active-layer temperature, Ann. Glaciol., 43, 285–291, https://doi.org/10.3189/172756406781812203, 2006. a
Zagorodnov, V., Nagornov, O., Scambos, T. A., Muto, A., Mosley-Thompson, E., Pettit, E. C., and Tyuflin, S.: Borehole temperatures reveal details of 20th century warming at Bruce Plateau, Antarctic Peninsula, The Cryosphere, 6, 675–686, https://doi.org/10.5194/tc-6-675-2012, 2012. a
Zagorodnov, V. S.: Study of the structure and temperature regime of Svalbard glaciers using thermal drilling, Data of Glaciological Studies, 41, 196–202, http://geolibrary.ru/sites/default/files/2020-12/41.pdf#page=196 (last access: 7 April 2024), 1981. a, b, c
Zagorodnov, V. S.: Temperature regime of the Academy of Sciences Glacier on Severnaya Zemlya, Data of Glaciological Studies, 65, 134–138, http://geolibrary.ru/sites/default/files/2020-12/65.pdf#page=135 (last access: 7 April 2024), 1989. a
Zagorodnov, V. S. and Zotikov, I. A.: Core drilling in Svalbard, Data of Glaciological Studies, 40, 157–163, http://geolibrary.ru/sites/default/files/2020-12/40.pdf#page=154 (last access: 7 April 2024), 1981. a, b
Zagorodnov, V. S., Sinkevich, S. A., and Arkhipov, S. M.: Hydrothermal regime of the ice-divide area of Austfonna, Nordaustlandet, Data of Glaciological Studies, 68, 133–141, http://geolibrary.ru/sites/default/files/2020-12/68.pdf#page=134 (last access: 7 April 2024), 1990. a
Zagorodnov, V. S., Arkhipov, S. M., Bazhev, A. B., Vostokova, T. A., Korolev, P. A., Rototaeva, O. V., Sinkevich, S. A., and Khmelevskoy, I. F.: Structure, composition and hydrothermal regime of the Garabashi Glacier at Elbrus, Data of Glaciological Studies, 73, 109–117, http://geolibrary.ru/sites/default/files/2020-12/73.pdf#page=110 (last access: 7 April 2024), 1992. a
Zelle, R. M., Wiernik, B. M., Bennet, F. G., D'Arcus, B., and Maier, D.: Citation Language Style: CSL 1.0.2. Specification, https://docs.citationstyles.org/en/v1.0.2/specification.html (last access: 7 April 2024), 2015. a
Zhang, T., Xiao, C., Colgan, W., Qin, X., Du, W., Sun, W., Liu, Y., and Ding, M.: Observed and modelled ice temperature and velocity along the main flowline of East Rongbuk Glacier, Qomolangma (Mount Everest), Himalaya, J. Glaciol., 59, 438–448, https://doi.org/10.3189/2013JoG12J202, 2013. a
Zhang, W., Han, J., Xie, Z., Wang, X., Lluberas, A., and Goto-Azuma, K.: A preliminary study of ice texture and fabric on an ice core to the bedrock extracted from Glacier No. 1 at the headwater of Ulumqi River, Tianshan, China, Bulletin of Glacier Research, 11, 9–15, https://web.seppyo.org/bgr/pdf/11/BGR11P9.PDF (last access: 7 April 2024), 1993. a
Zhou, T.: Study on temperature distribution of Chongce Ice Cap in West Kunlun Mountains, Chinese Science Bulletin, 35, 212–215, https://doi.org/10.1360/csb1990-35-3-212, 1990. a
Ødegård, R. S., Hamran, S.-E., Bø, P. H., Etzelmuller, B., Vatne, G., and Sollid, J. L.: Thermal regime of a valley glacier, Erikbreen, northern Spitsbergen, Polar Res., 11, 69–79, https://doi.org/10.3402/polar.v11i2.6718, 1992. a, b, c
Ødegård, R. S., Hagen, J. O., and Hamranw, S.-E.: Comparison of radio-echo sounding (30–1000 MHz) and high-resolution borehole-temperature measurements at Finsterwalderbreen, southern Spitsbergen, Svalbard, Ann. Glaciol., 24, 262–267, https://doi.org/10.3189/S0260305500012271, 1997. a, b
- Abstract
- Introduction
- Methods and data
- Results and discussion
- Code and data availability
- Conclusions and outlook
- Appendix A: References by glacier and region
- Appendix B: Source authors
- Author contributions
- Competing interests
- Disclaimer
- Acknowledgements
- Financial support
- Review statement
- References
- Supplement