the Creative Commons Attribution 4.0 License.
the Creative Commons Attribution 4.0 License.
 | 09 Apr 2025
A daily sunshine duration (SD) dataset in China from Himawari AHI imagery (2016–2023)
Zhanhao Zhang
Shibo Fang
Jiahao Han
Monitoring global radiation resources relies on sunshine duration (SD) as an important indicator; however, research examining high-resolution SD data is scarce. This study established a daily 5 km SD dataset in China from 2016 to 2023 using Himawari's Advanced Himawari Imager (AHI) Level 3 shortwave radiation fitted with the Ångström–Prescott model based on a time series. We used ground-measured SD at 2380 Chinese Meteorological Administration stations to verify the SD dataset accuracy. The results of the testing set indicate that the average correlation coefficient between the SD from the estimation and ground measurements was 0.88. Additionally, we investigated the effects of wind speed, vapour pressure, precipitation, aerosol optical depth, and cloud capacity on the estimation performance of SD and found that temperature had the greatest effect. We also found that cloud capacity that was both too low and too high, and wind speed that was too high affected SD estimation on an average annual scale. These high-resolution SD data provide important support for accurate radiation resource assessments in China. The SD dataset is freely accessible at https://doi.org/10.57760/sciencedb.10276 (Zhang et al., 2024).
- Article
(13334 KB) - Full-text XML
- BibTeX
- EndNote


Solar radiation is a major driver of photosynthesis and evapotranspiration, plays an indispensable role in regulating temperature and supporting agricultural production, and affects photovoltaic power generation, making it critical to ecosystems and productive human life (Yu et al., 2022; Feng et al., 2021). Satellite remote sensing is an effective method for monitoring and tracking solar radiation, particularly using geostationary satellites that can monitor solar radiation levels in the same target area several times a day. However, solar radiation inverted by satellite sensors based on reflectance information from land surfaces is highly susceptible to atmospheric inverted radiation from clouds and aerosols, which must be corrected using ground measurement radiation stations.
There are limited numbers of radiation observation stations in China (< 200 stations in mainland China) and other parts of the world (Liang et al., 2006; Zhang et al., 2015). This is because of the expensive upkeep of terrestrial radiation-measuring devices (Zhang et al., 2017; Chukwujindu, 2017), as well as the lack of widely used empirical physical models for satellite–ground radiation correction, making precise tracking of high spatiotemporal solar radiation over time difficult. Sunshine duration (SD) is a readily available and cost-effective indicator for monitoring global radiation resources, and its variability is determined by a combination of regional factors as well as solar constants, cloud cover, water vapour, and atmospheric pollutants. The SD measured from regular meteorological observations has the advantages of being over a long period and having good continuity, high spatial density (> 2000 stations in mainland China), and reliability, and it is considered the best alternative to solar radiation (Xia, 2010). SD is a key parameter in solar power potential forecasting (Baumgartner et al., 2018; Liu et al., 2022); for example, a new SD conversion method based on predicted temperature and weather type data for daily scale solar radiation prediction was proposed by Qin et al. (2023). Climate change assessment and agricultural production also need to consider the impact of changes in SD (Ghanghermeh et al., 2022). Marsz et al. (2021) suggest that long-term variations in SD in central Europe are related to changes in the annual frequency of macro-types of circulation in the mid-troposphere as well as changes in the surface composition of the thermohaline circulation in the North Atlantic. In addition, some researchers have found that changes in SD also affect the probability of human diseases (Chang et al., 2022; Gu et al., 2019). Liu et al. (2023) observed that insufficient SD (< 5.3 h) was associated with increased hospitalisation for schizophrenia.
Accurate SD inversion is an important reference for agricultural production, solar resource utilisation, and global climate change analysis. Studies on SD have mostly been based on limited ground stations (Vivar et al., 2014; Fan et al., 2018; Yao et al., 2018), while SD is affected by atmospheric conditions, and it is difficult for a single station to represent this over a large area. Therefore, there is a considerable need for high-resolution SD data based on satellite remote sensing for studies on solar radiation. The Advanced Himawari Imager (AHI) instrument, carried on board the new generation of geostationary satellites – Himawari-8 and Himawari-9 – has been widely used to estimate radiation indicators at different timescales for their shortwave radiation products (Damiani et al, 2018; Hou et al., 2020; Letu et al., 2020; Tana et al., 2023). The Ångström–Prescott model (Ångström, 1924) is the most dominant and widely used model based on SD and solar radiation, and its quadratic and cubic forms have been improved and applied to different meteorological conditions (Rietveld, 1978; Bahel et al., 1987; Chen et al., 2004; Wu et al., 2007; Liu et al., 2012; Ampratwum and Dorvlo, 1999; Elagib and Mansell, 2000). Therefore, based on the advantages of the high spatiotemporal and temporal resolution of the AHI and the existing widely used empirical relationship model between solar radiation and SD, we can use the radiation products of the AHI to validate SD data from high-density regular meteorological observation stations in China to estimate the gridded SD data.
In this study, we generated a daily SD dataset for China at a spatial resolution of 5 km using AHI Level 3 shortwave radiation data from 2016 to 2023 fitted with the Ångström–Prescott model on different days of the year (DOYs). We validated and assessed the accuracy of daily SD data using ground-measured SD and other meteorological data (wind speed, vapour pressure (VAP), cloud capacity, and precipitation) from 2380 Chinese Meteorological Administration (CMA) stations, as well as the aerosol optical depth (AOD) from MODIS.
2.1 Remote sensing data
The geostationary meteorological satellite Himawari was launched on 7 October 2014 by the Japan Aerospace Exploration Agency (JAXA) in Tanegashima, Japan, with its hypocentre located at 0.0° N and 140.7° E, ∼ 35 800 km above the land surface. Compared to other geostationary satellites, the AHI exhibits superior temporal and spatial resolution, reflection band sensitivity, and accuracy (Zhang et al., 2016). The AHI from Himawari-8 and Himawari-9 has 16 spectral channels covering the visible to infrared range, with wavelengths ranging from 0.47 to 13.3 µm, providing a wealth of spectral information (Bessho et al., 2016; Kim et al., 2018; Yu et al., 2019). The temporal and spatial resolutions of the land surface products provided by the AHI are 10 min and 5 km, respectively, which are important for understanding spatiotemporal variations on short timescales (Sawada et al., 2019).
Here, AHI Level 3 hourly shortwave radiation (5 km resolution) data from 1 January 2016 to 31 December 2023 were used for SD dataset construction, calculated by plane-parallel theory, and considered the top-of-atmosphere radiation as the difference between the 300–3000 nm solar shortwave band and reflected solar radiation by the atmosphere–land surface (Frouin and Murakami, 2007). This approach assumes that the effects of clouds and a clear atmosphere can be decoupled, which has proven to be effective (Dedieu et al., 1987; Frouin and Pinker, 1995). If a 1 h interval was absent from the imagery, linear interpolation was conducted on each pixel of the missing imagery based on the time series. When imagery was absent for a period exceeding 1 h, the day in question was excluded. We calculated the daily average shortwave radiation in China based on China standard time using hourly AHI shortwave radiation data.
MCD19A2 is a combined MODIS Terra and Aqua Multi-Angle Implementation of Atmospheric Correction (MAIAC) land AOD-gridded Level 2 product. It is produced daily at a 1 km pixel resolution, which is corrected for atmospheric gases and aerosols using a new MAIAC algorithm that is based on a time series analysis and a combination of pixel- and image-based processing (Lyapustin and Wang, 2022). Here, AOD at 550 nm in MCD19A2 from 2016 to 2023 was collected using Google Earth Engine (Gorelick et al., 2017).
2.2 Ground measurement data
Ground measurements in the CMA from 1 January 2016 to 31 December 2023 were used to perform the SD estimation. The spatial coverage of Himawari is 2380 CMA automatic meteorological stations in China. The CMA performs quality control of the data, including spatiotemporal consistency checks, manual corrections, and adjustments, before releasing the meteorological data (Moradi, 2009; Tang et al., 2010). Although the quality of ground-based measurements should be controlled before acquisition, there is still a need for a more stringent check on the data quality based on the daily meteorological data reconstruction method from the CMA (Zhang et al., 2015). Figure 1 shows the spatial distribution of the 2380 meteorological stations. Here, daily SD, vapour pressure, temperature, wind speed, cloud capacity, and precipitation from the CMA automatic meteorological stations were used to fit and validate the grid dataset as well as to analyse the factors influencing the estimated performance. In this study, March–May was classified as spring, June–August as summer, September–November as autumn, and December–February as winter.
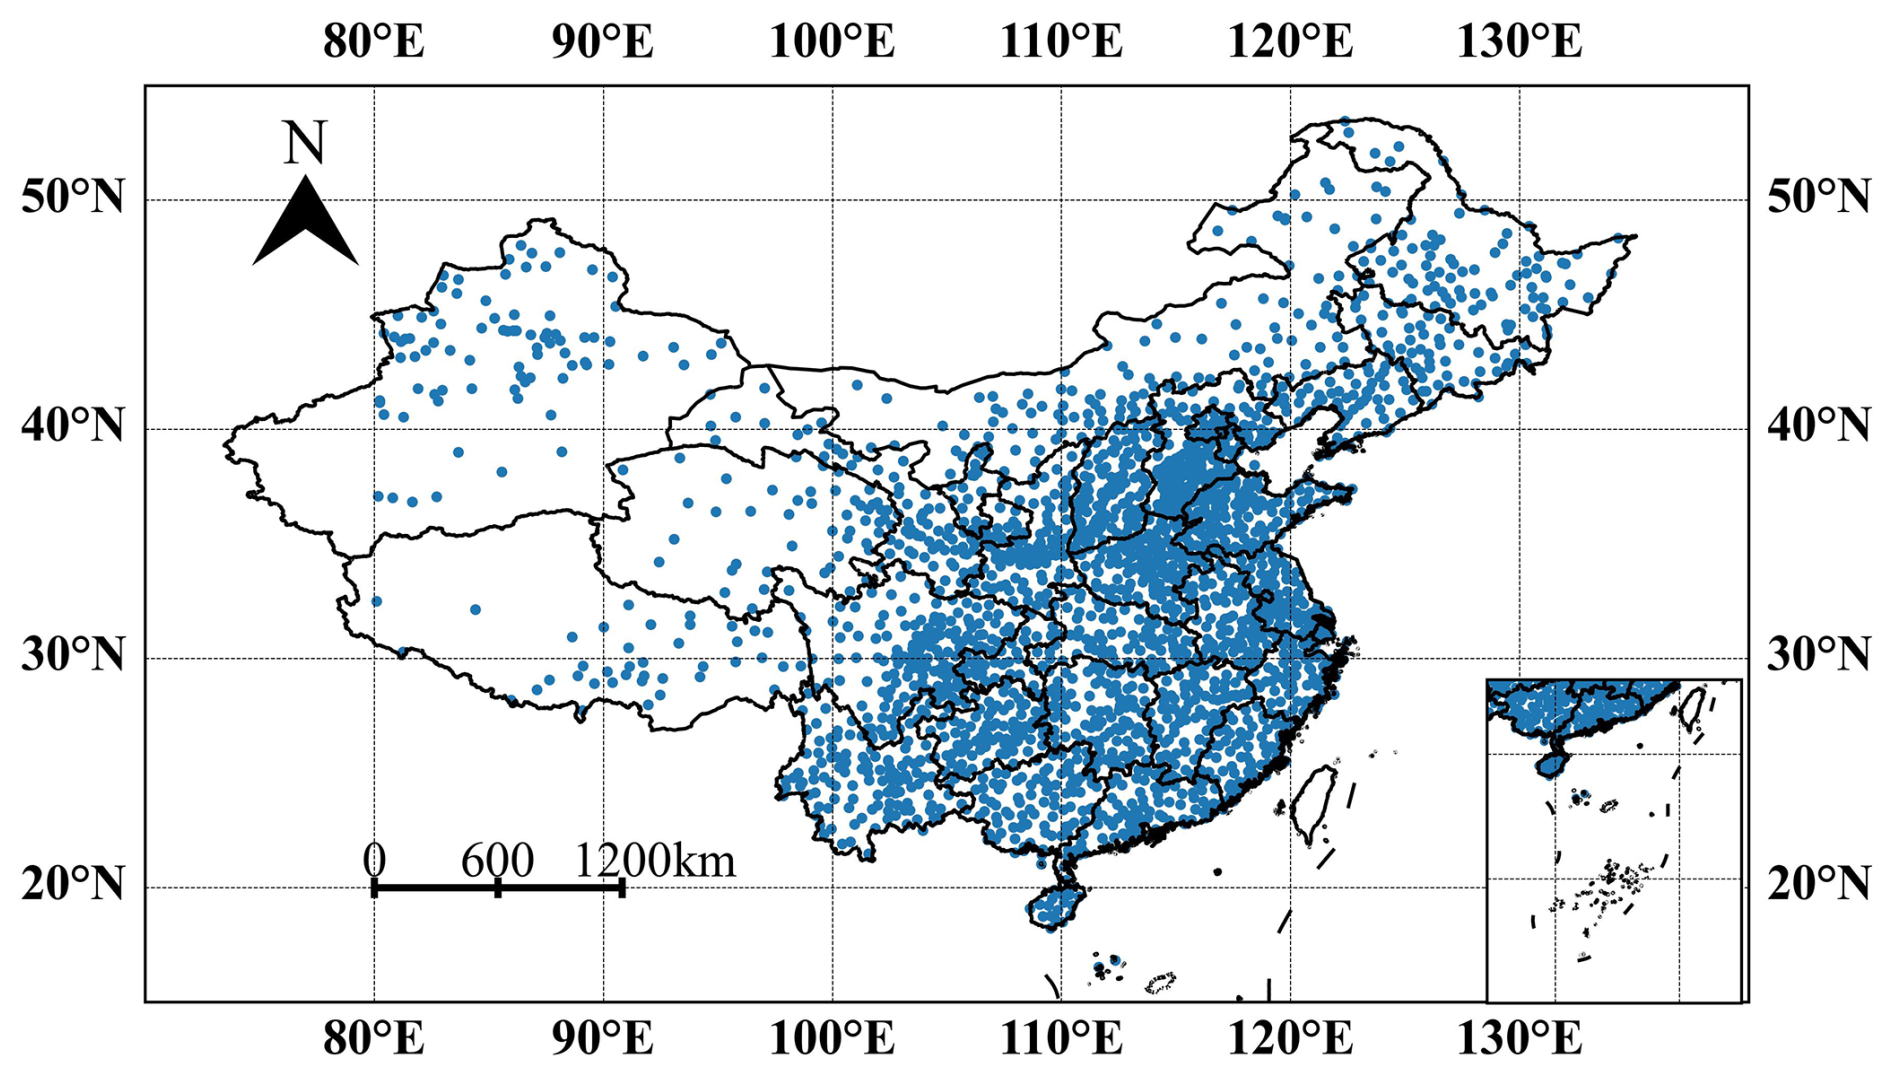
Figure 1Spatial distribution of the 2380 automatic meteorological stations of the China Meteorological Administration.
2.3 Model overview
The Ångström–Prescott model is an empirical model based on the relationship between SD and solar radiation and is widely used in meteorology and agricultural science. The model was proposed by Ångström based on the total solar radiation on clear days and was improved by Prescott based on astronomical radiation (Ångström, 1924) using the following equations:
where Rs is the total solar radiation reaching the surface, Ra is the astronomical radiation, a and b are empirical coefficients, n is the actual SD, and N is the maximum SD available. Ra and N counts were calculated according to Liu et al. (2009), as follows:
where dr is the eccentricity of the Earth's orbit around the Sun, ωs is the angle at sunset, φ is the latitude, δ is the inclination angle of the sun, and DOY is the days of a year. We considered the AHI Level 3 hourly shortwave radiation Rs in this model and SD of ground-based observations a validation of n. Parameters a and b of the Ångström–Prescott model were fitted using the least-squares method.
2.4 Validation
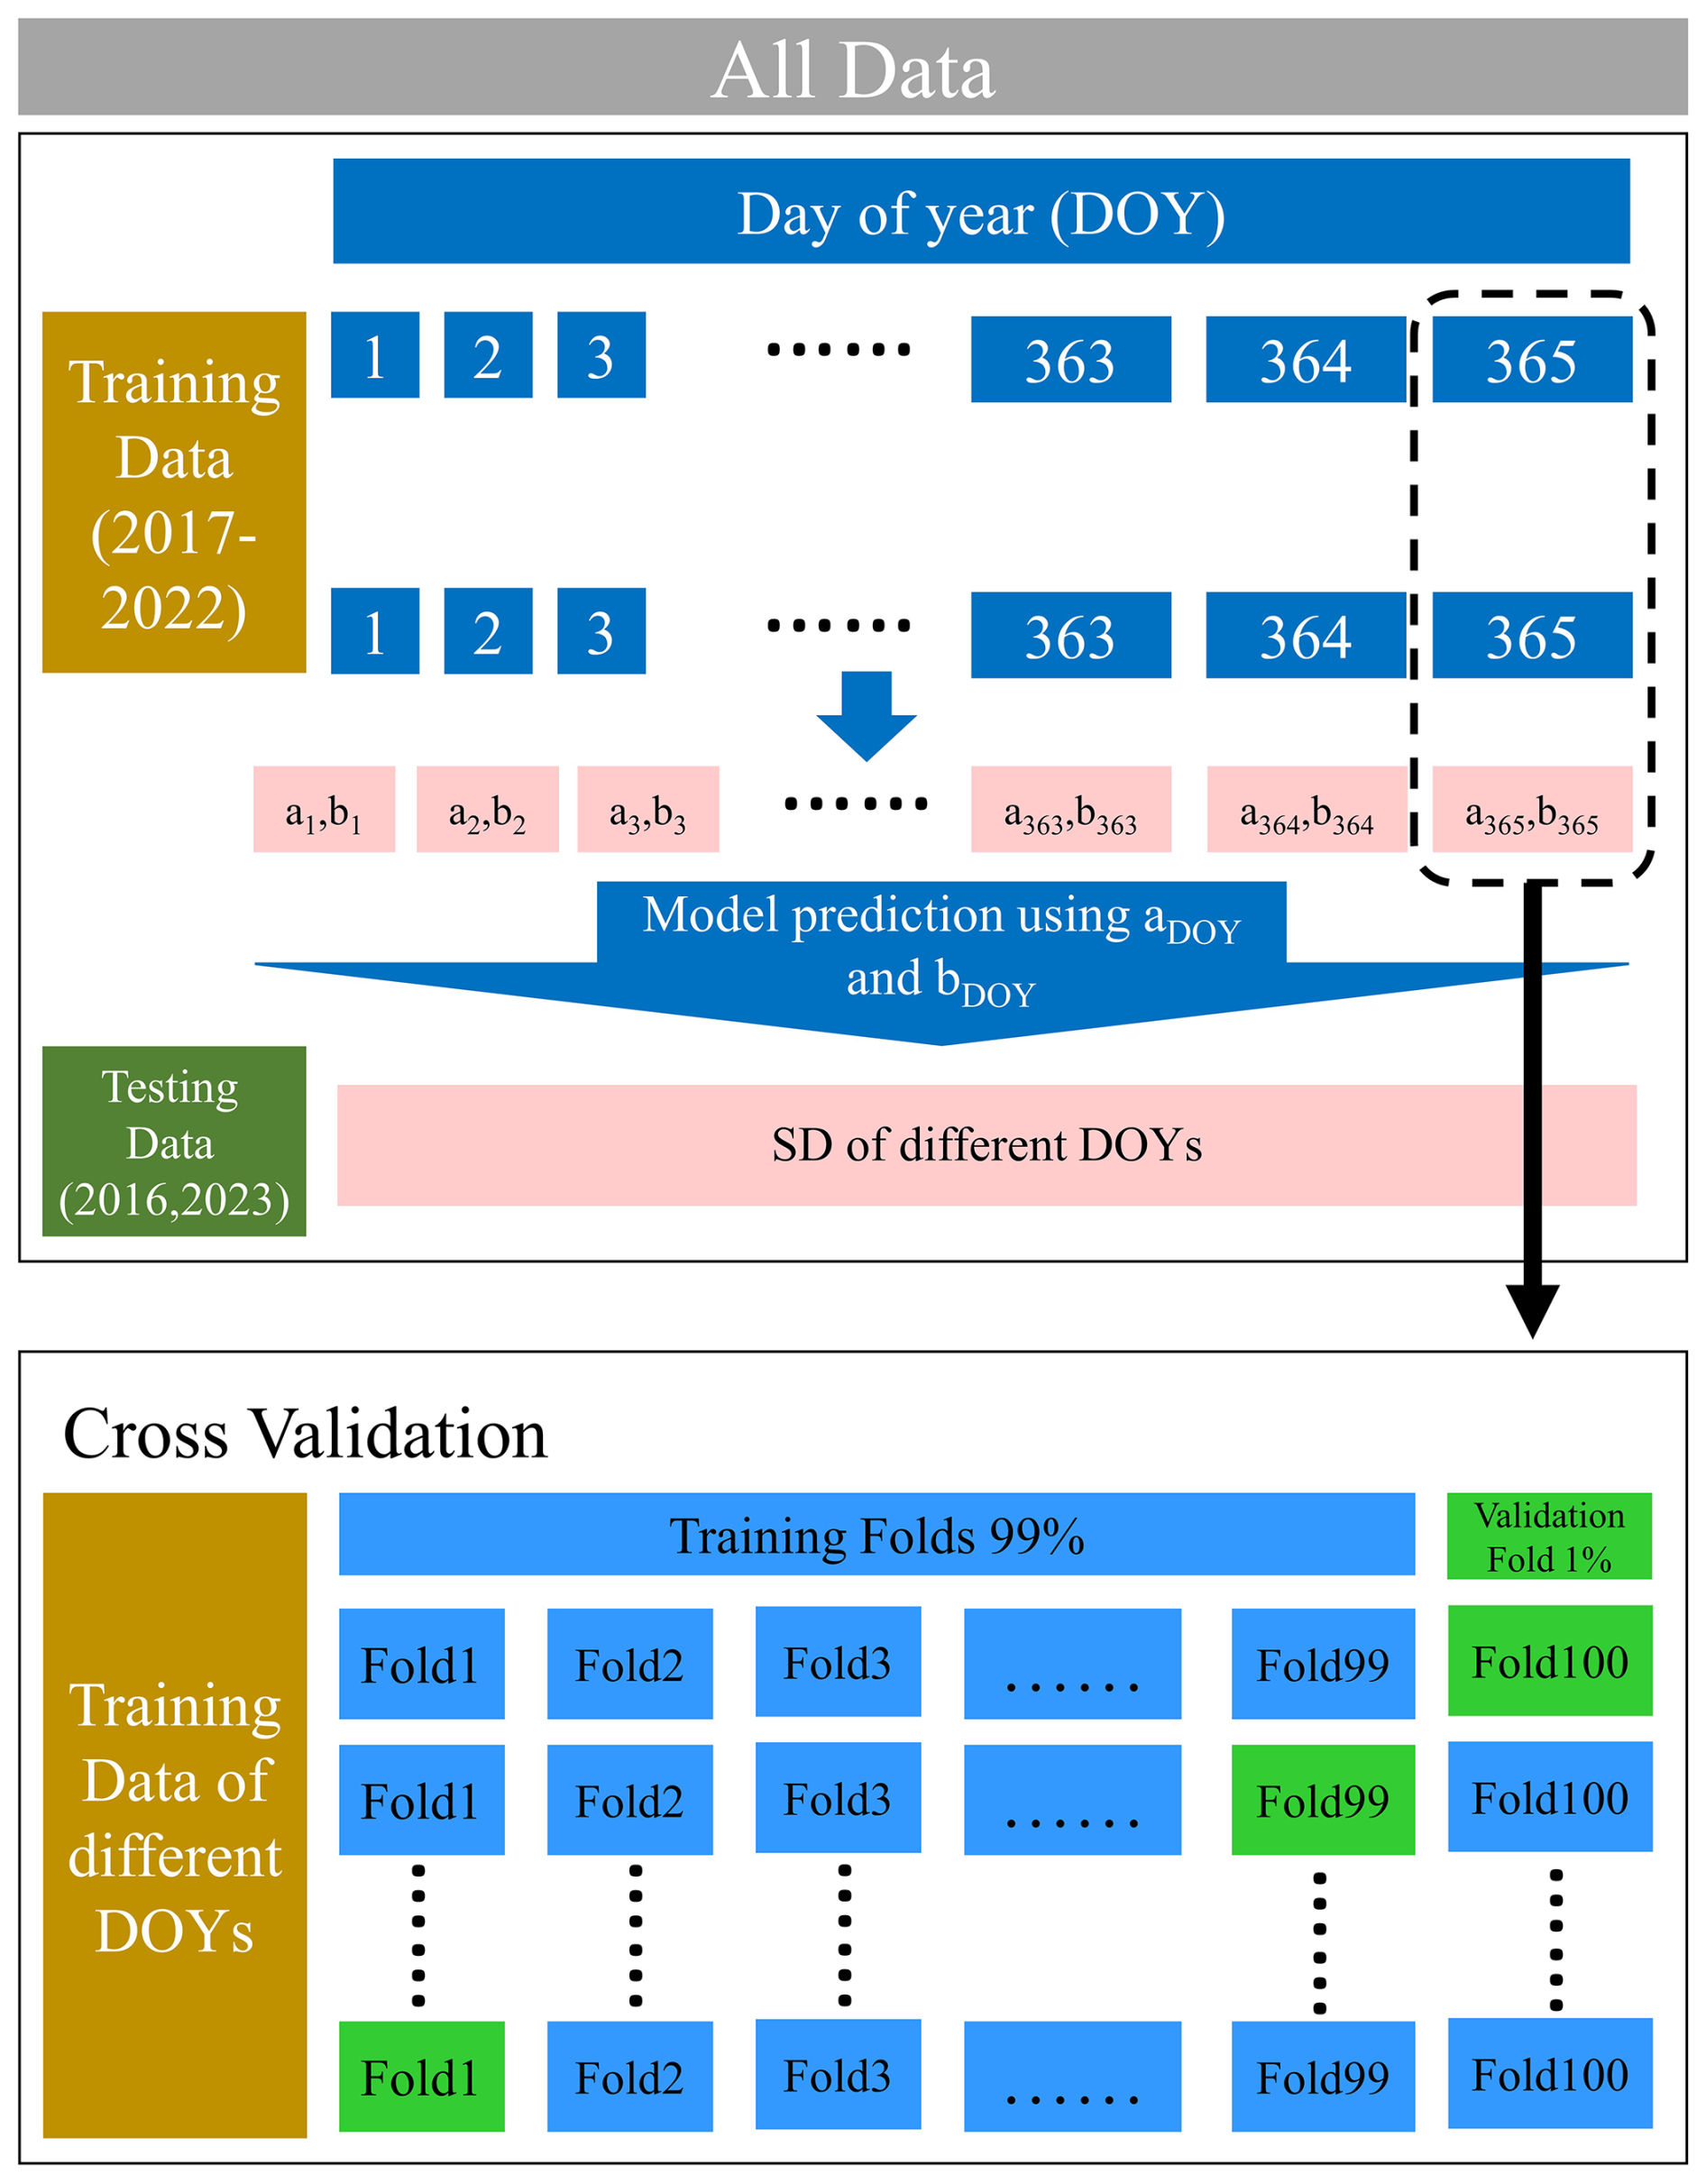
We divided the original data into a training set (> 5 × 10⁶ grid cells during 2017–2022) and a testing set (2016 and 2023 were used as there was a widespread transition from manual to automatic SD recorders in 2019 or station relocations; He et al., 2024). To identify the best Ångström–Prescott model and corresponding parameters, its performance on the training set (2017–2022) was evaluated using a 100-fold cross-validation (CV) approach and DOY-based CV strategy. In each iteration of each DOY, 99 folds were used as the training set, and the remaining folds were used as the validation set. The training and validation processes were repeated 100 times to obtain the best model parameters a and b for each DOY. In addition, the 2016 and 2023 ground-based SD data were used as test data to evaluate the generalisation capability of the best model parameters, a and b, at each DOY (Fig. 2). Pearson's correlation coefficient (R) and root-mean-square error (RMSE) were calculated to evaluate the performance of the model.
2.5 Methods of spatiotemporal variation analysis
Empirical orthogonal function (EOF) decomposition is an important technique used to investigate geographical and temporal fluctuations in meteorological characteristics (Zhou et al., 2021). The variable field can be decomposed into two parts: a spatial function that remains constant across time and a temporal function that changes exclusively with time; thus, the primary spatial and temporal variations are evident in the area with a notable contribution to the variance. The spatial function component comprises several mutually independent and orthogonal spatial modes, which are also considered eigenvectors. The temporal function consists of the projection of spatial modes in time, which is represented by time coefficients. We used EOF to analyse the spatiotemporal variations of the established SD dataset in China. Then, the original variable field information and spatial coefficients were concentrated in the first few modes.
3.1 Evaluation of the training data
Figure 3 shows the estimation results of the CV sampling method for all DOYs in the training set (N=68 806). An R value of 0.9695 was obtained for the entire training set, with a corresponding RMSE value of 1.2 h. The measured and inverted SD converged to the 1:1 trend line; however, an overestimation occurred in the dense region at ∼ 10 h. Figure 4 shows the inverse performance for different seasons in the training set. The SD was significantly higher in spring and summer than in autumn and winter and was more concentrated in the 0 and 10 h regions in winter. In spring the highest R and RMSE values were 0.9747 and 1.18 h, respectively, while in winter the lowest RMSE value was 1.13 h (Fig. 4). However, in summer the highest RMSE value was 1.3 h, and the estimation in summer performed the worst when the measured SD was 0 h. The measured and inverted SD in spring mostly converged to the 1:1 trend line, while overestimation occurred in the dense region around 10 h in winter.
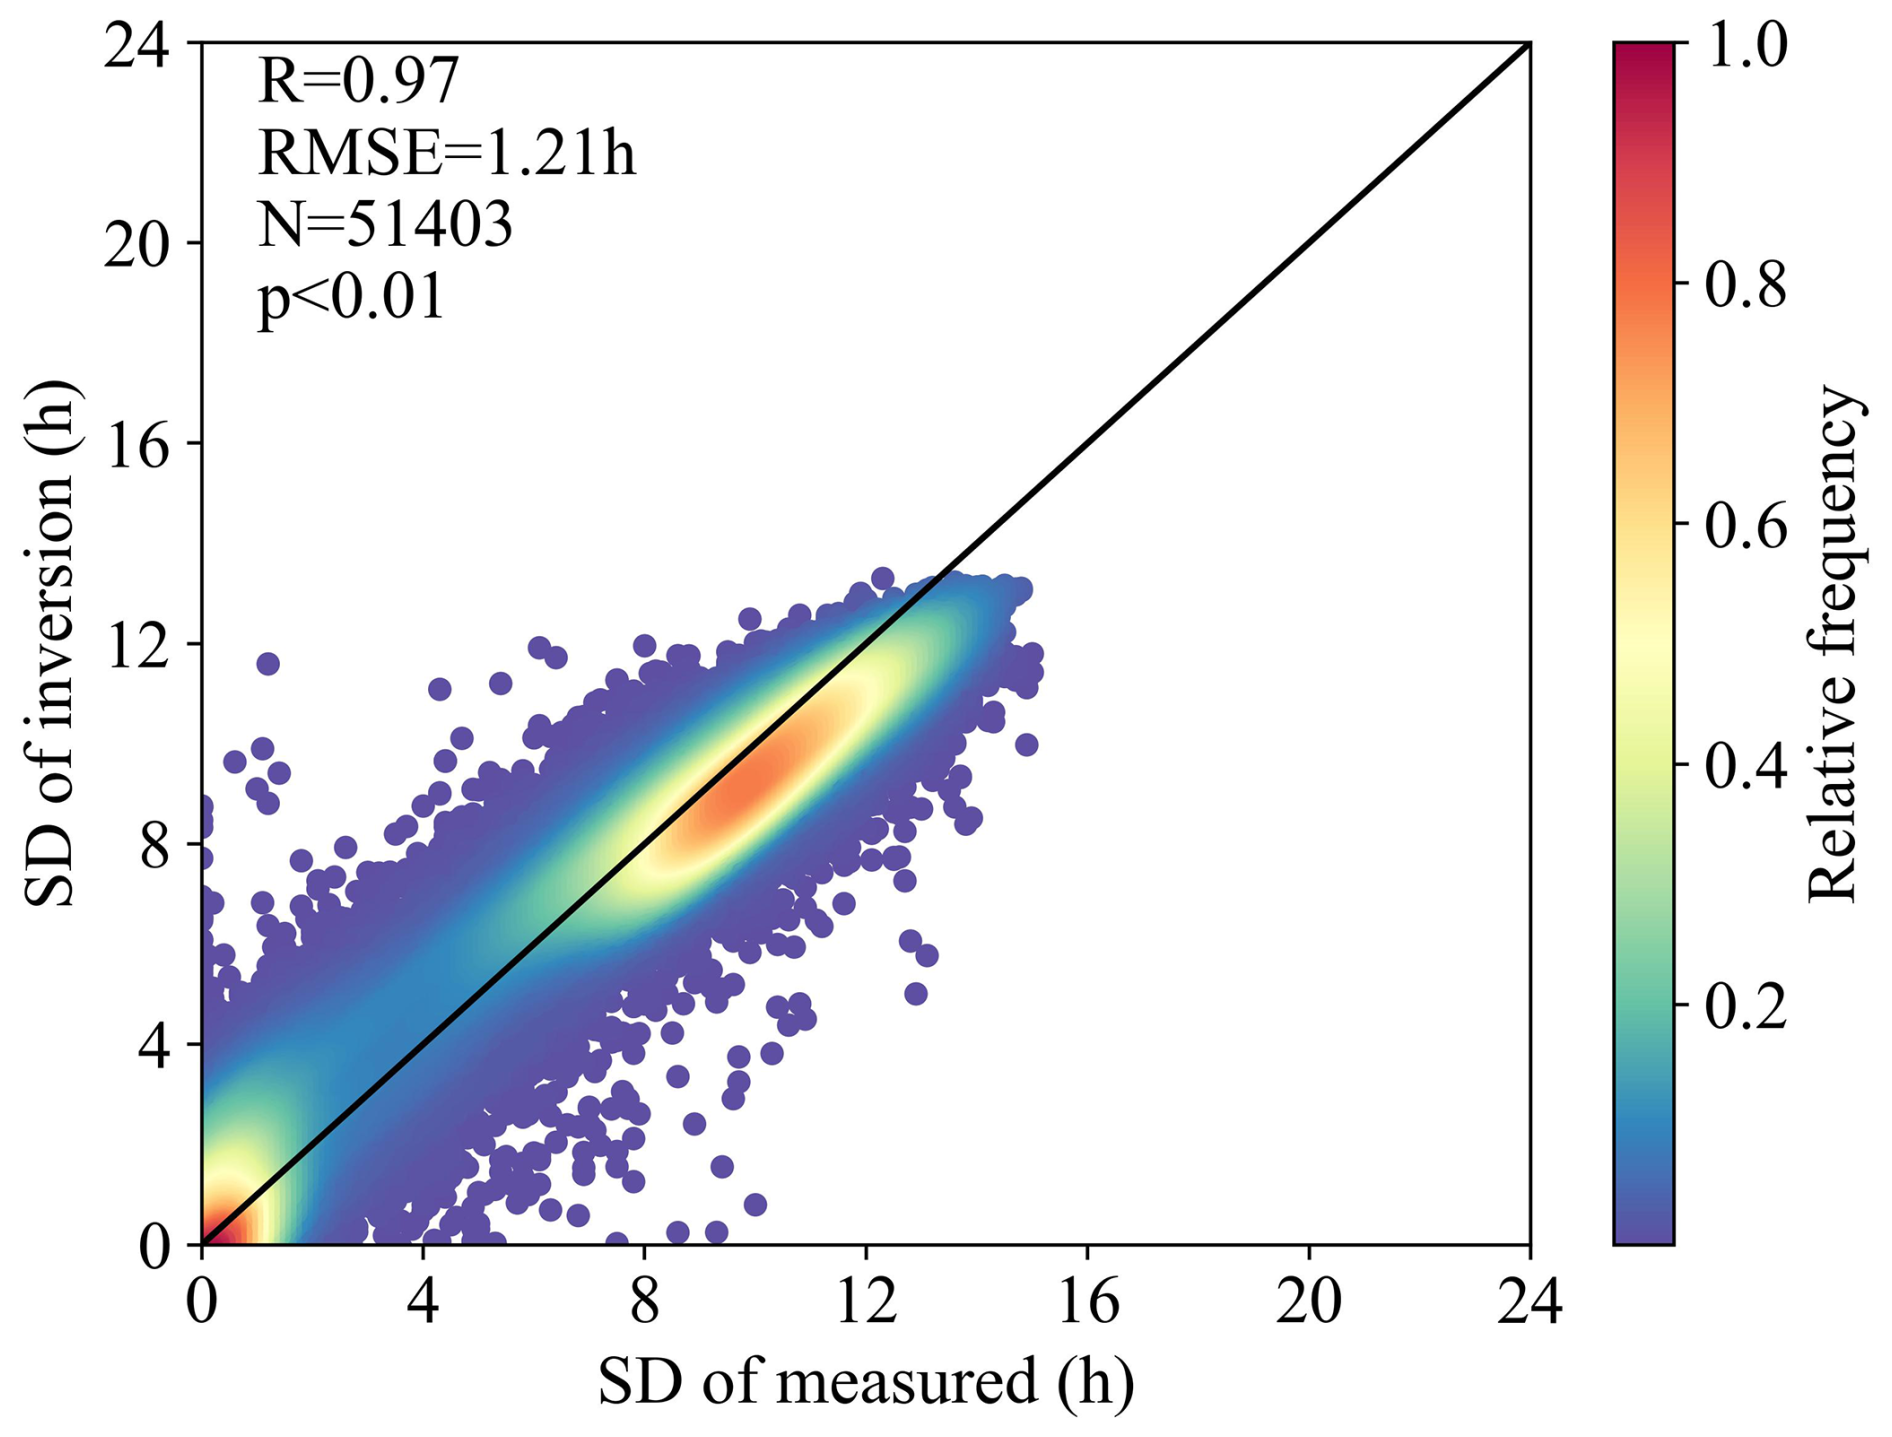
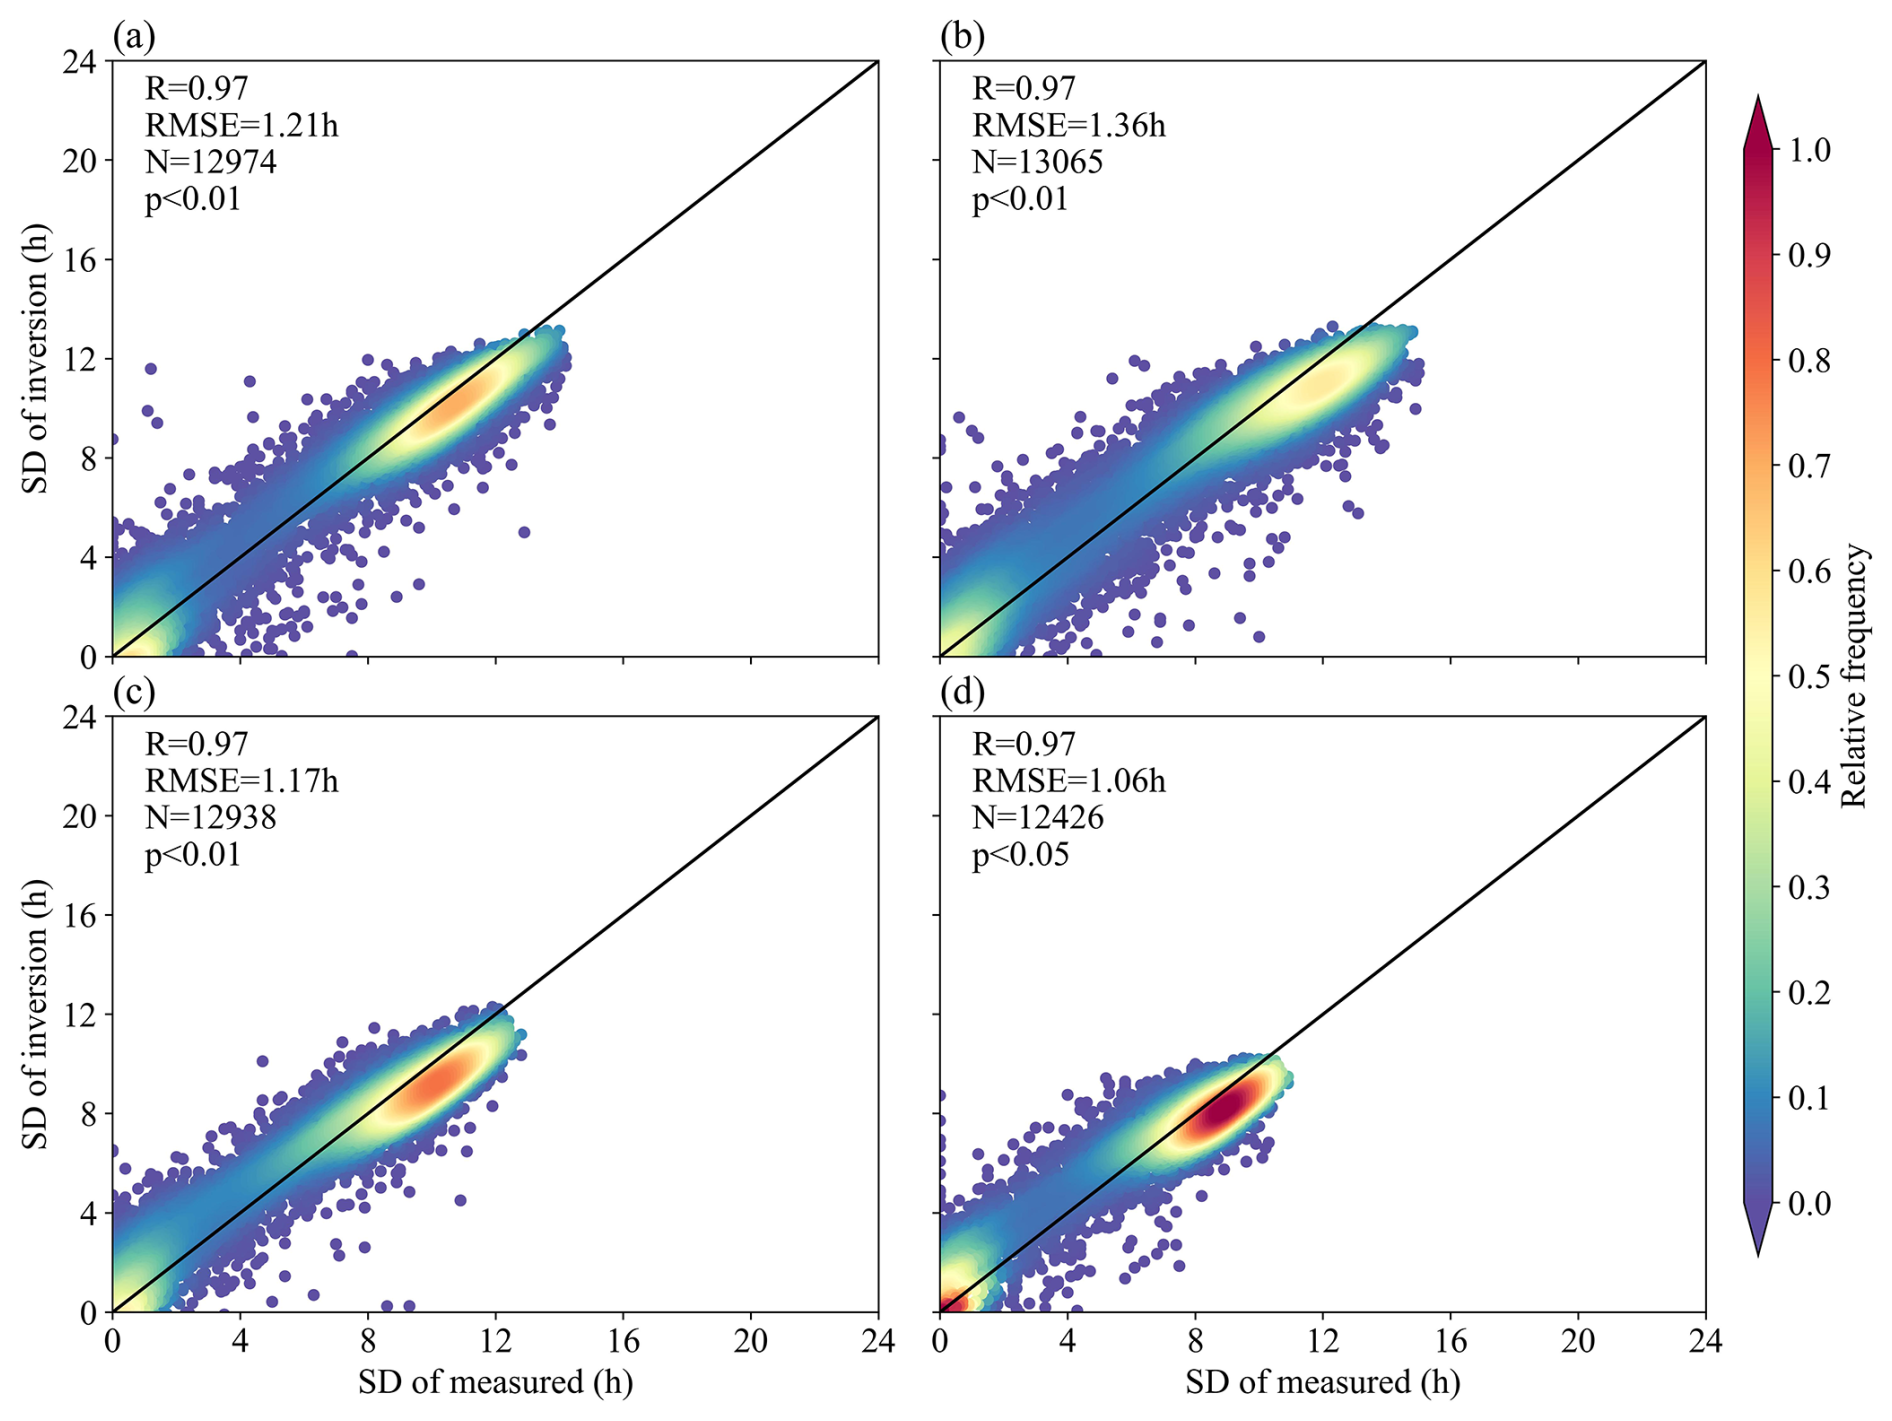
Figure 4Estimates of sunshine duration (SD) for the CV sampling method in the training set from different seasons: (a) spring, (b) summer, (c) autumn, and (d) winter.
Figure 5 shows the optimal Ångström–Prescott model parameters a and b for different DOYs. The parameter a has an upward parabolic trend with DOY, with local maximum and minimum values of 0.22 at DOY = 306 and 0.13 at DOY = 351, respectively. Parameter b showed a significant “W”-shaped variation with DOY, with a local maximum value of 0.74 at DOY = 146 and two local minimum values of 0.66 and 0.63 at DOY = 99 and 351. In general, parameters a and b of the Ångström–Prescott model are characterised by more pronounced seasonal variations. Figure 6 shows the variation in the training set evaluation indicators (R and RMSE) with DOY. More than half of the DOYs had R values greater than the overall R value (Fig. 3), but there was still 134 d with R values < 0.97 and a minimum value of 0.94 at DOY = 193. Meanwhile, more than half of the DOYs have RMSE values less than the overall RMSE values in Fig. 3, but there was still 157 d with R values < 1.2 h, and again there was a maximum value of 2.1 h for RMSE at DOY = 193. The evaluation indicator for the training set was not characterised by significant seasonal variations.
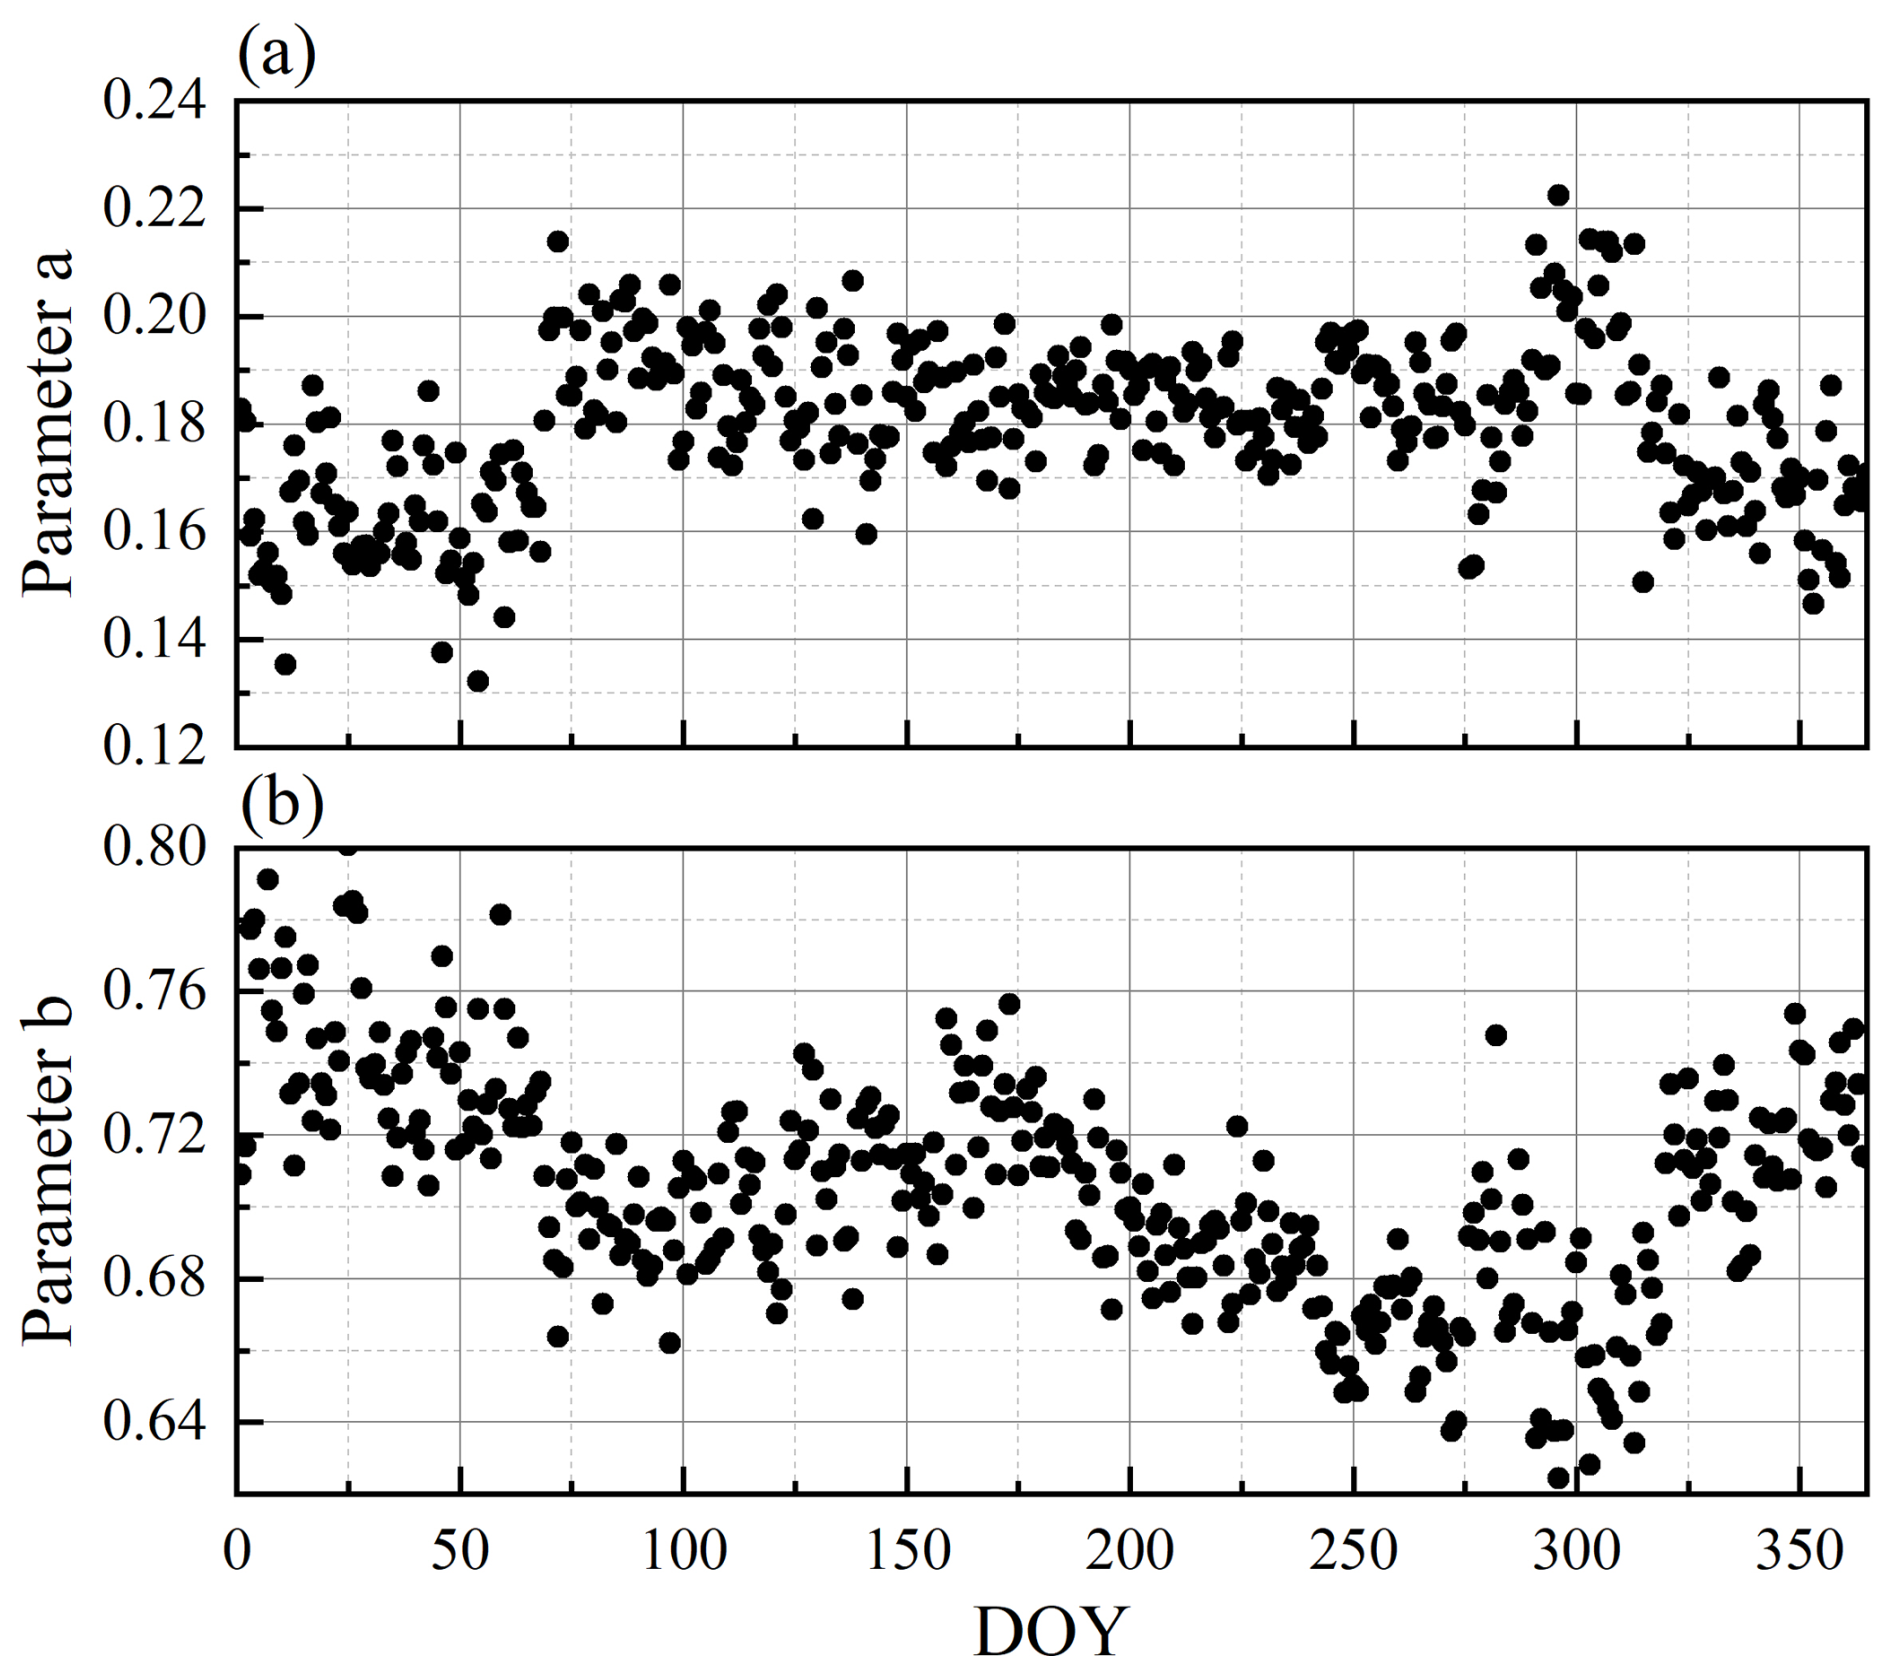
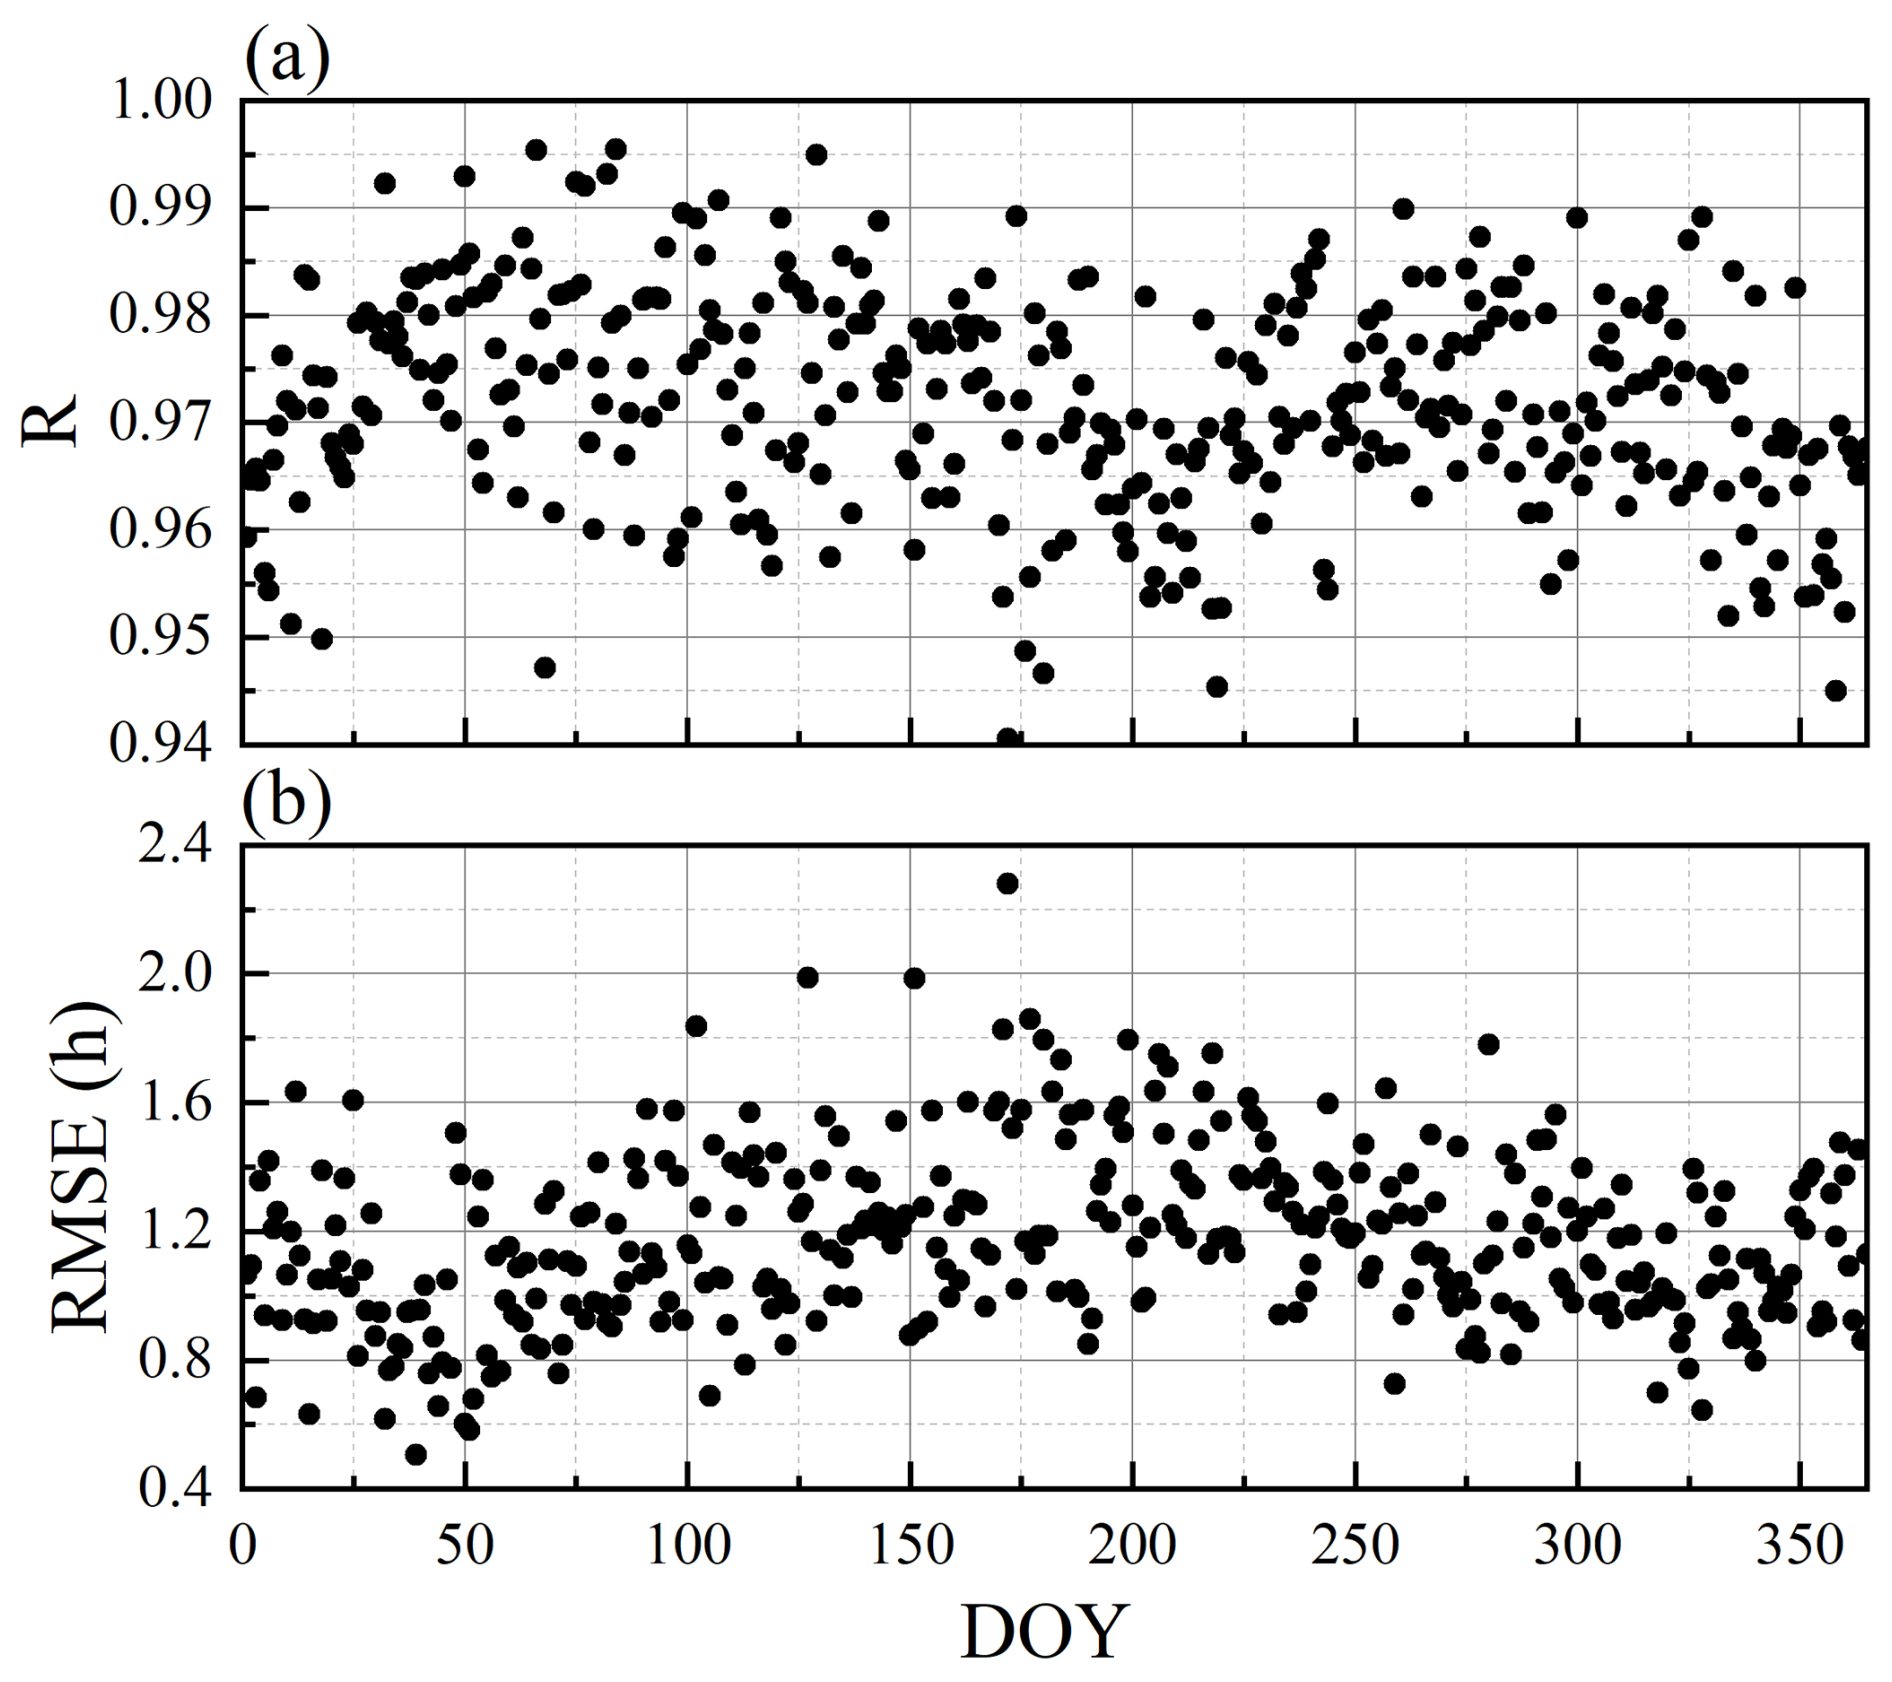
Figure 6The correlation coefficients (R) (a) and RMSE (b) of the CV sampling method in the training set for different DOYs.
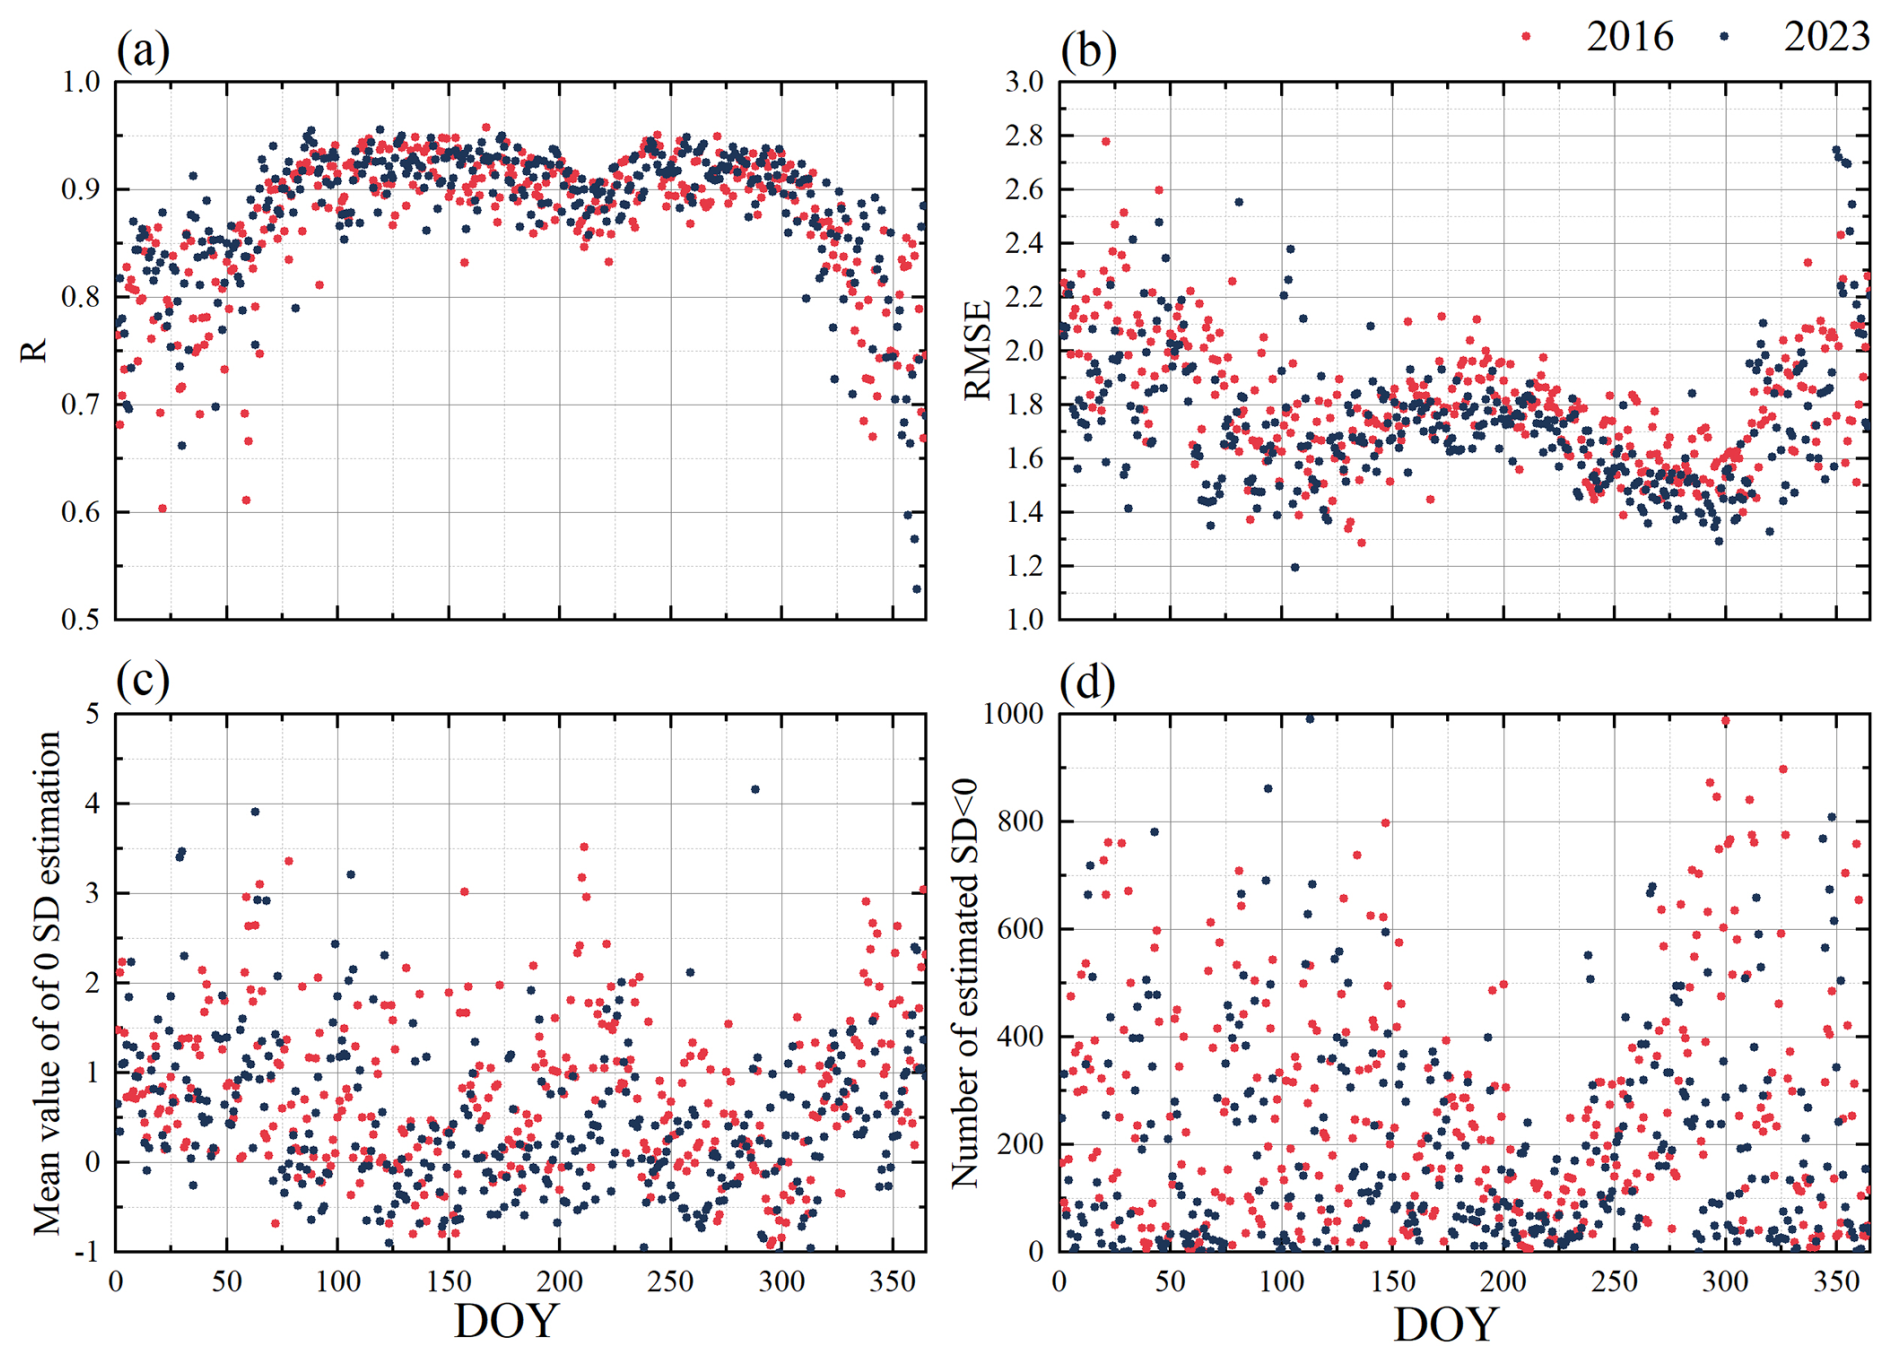

Figure 8Estimated performance by changing all estimated sunshine durations (SDs) < 0 to 0 in the testing set.
3.2 Evaluation of the testing data
The different evaluation indicators for the test sets (2016 and 2023) are shown in Fig. 7. Figure 7a shows the R of 2016 and 2023, with the trends in these 2 years essentially identical to an “M” shape. The average R value for 2016 was 0.88, which is generally consistent with that for 2023. The minimum R value of 0.52 in 2023 (DOY = 361) was lower than that of 0.60 in 2016 (DOY = 21), but both occurred during winter. The trend of RMSE values for 2016 and 2023 is opposite to the R value, with the maximum and minimum RMSE values occurring in 2023 at 2.77 (DOY = 355) and 1.19 (DOY = 106), respectively. Figure 7c and d show the estimated performances of 0 SD (no sunshine for the entire day) for the CMA meteorological stations in 2016 and 2023. Figure 7c shows the estimated mean values of 0 SD for different DOYs in 2016 and 2023, where the mean value in 2023 (0.49 h) is smaller than that in 2016 (0.75 h), with the maximum and minimum mean values still occurring in 2023 at 3.42 (DOY = 211) and −0.75 (DOY = 134), respectively. Figure 7d shows the number of estimated SDs < 0 for different DOYs in 2016 and 2023. There were more average daily estimated SDs of < 0 in 2016 than in 2023 at 267 d−1, with the lowest value occurring in 2016 at 997 (DOY = 294). The bias in the 0 SD estimation is linked to the over- and under-representation of its number. Changing all estimated SDs from < 0 to 0 resulted in an improvement in their estimated performance (Fig. 8), with 2016 showing a greater improvement than 2023 with DOY = 285.
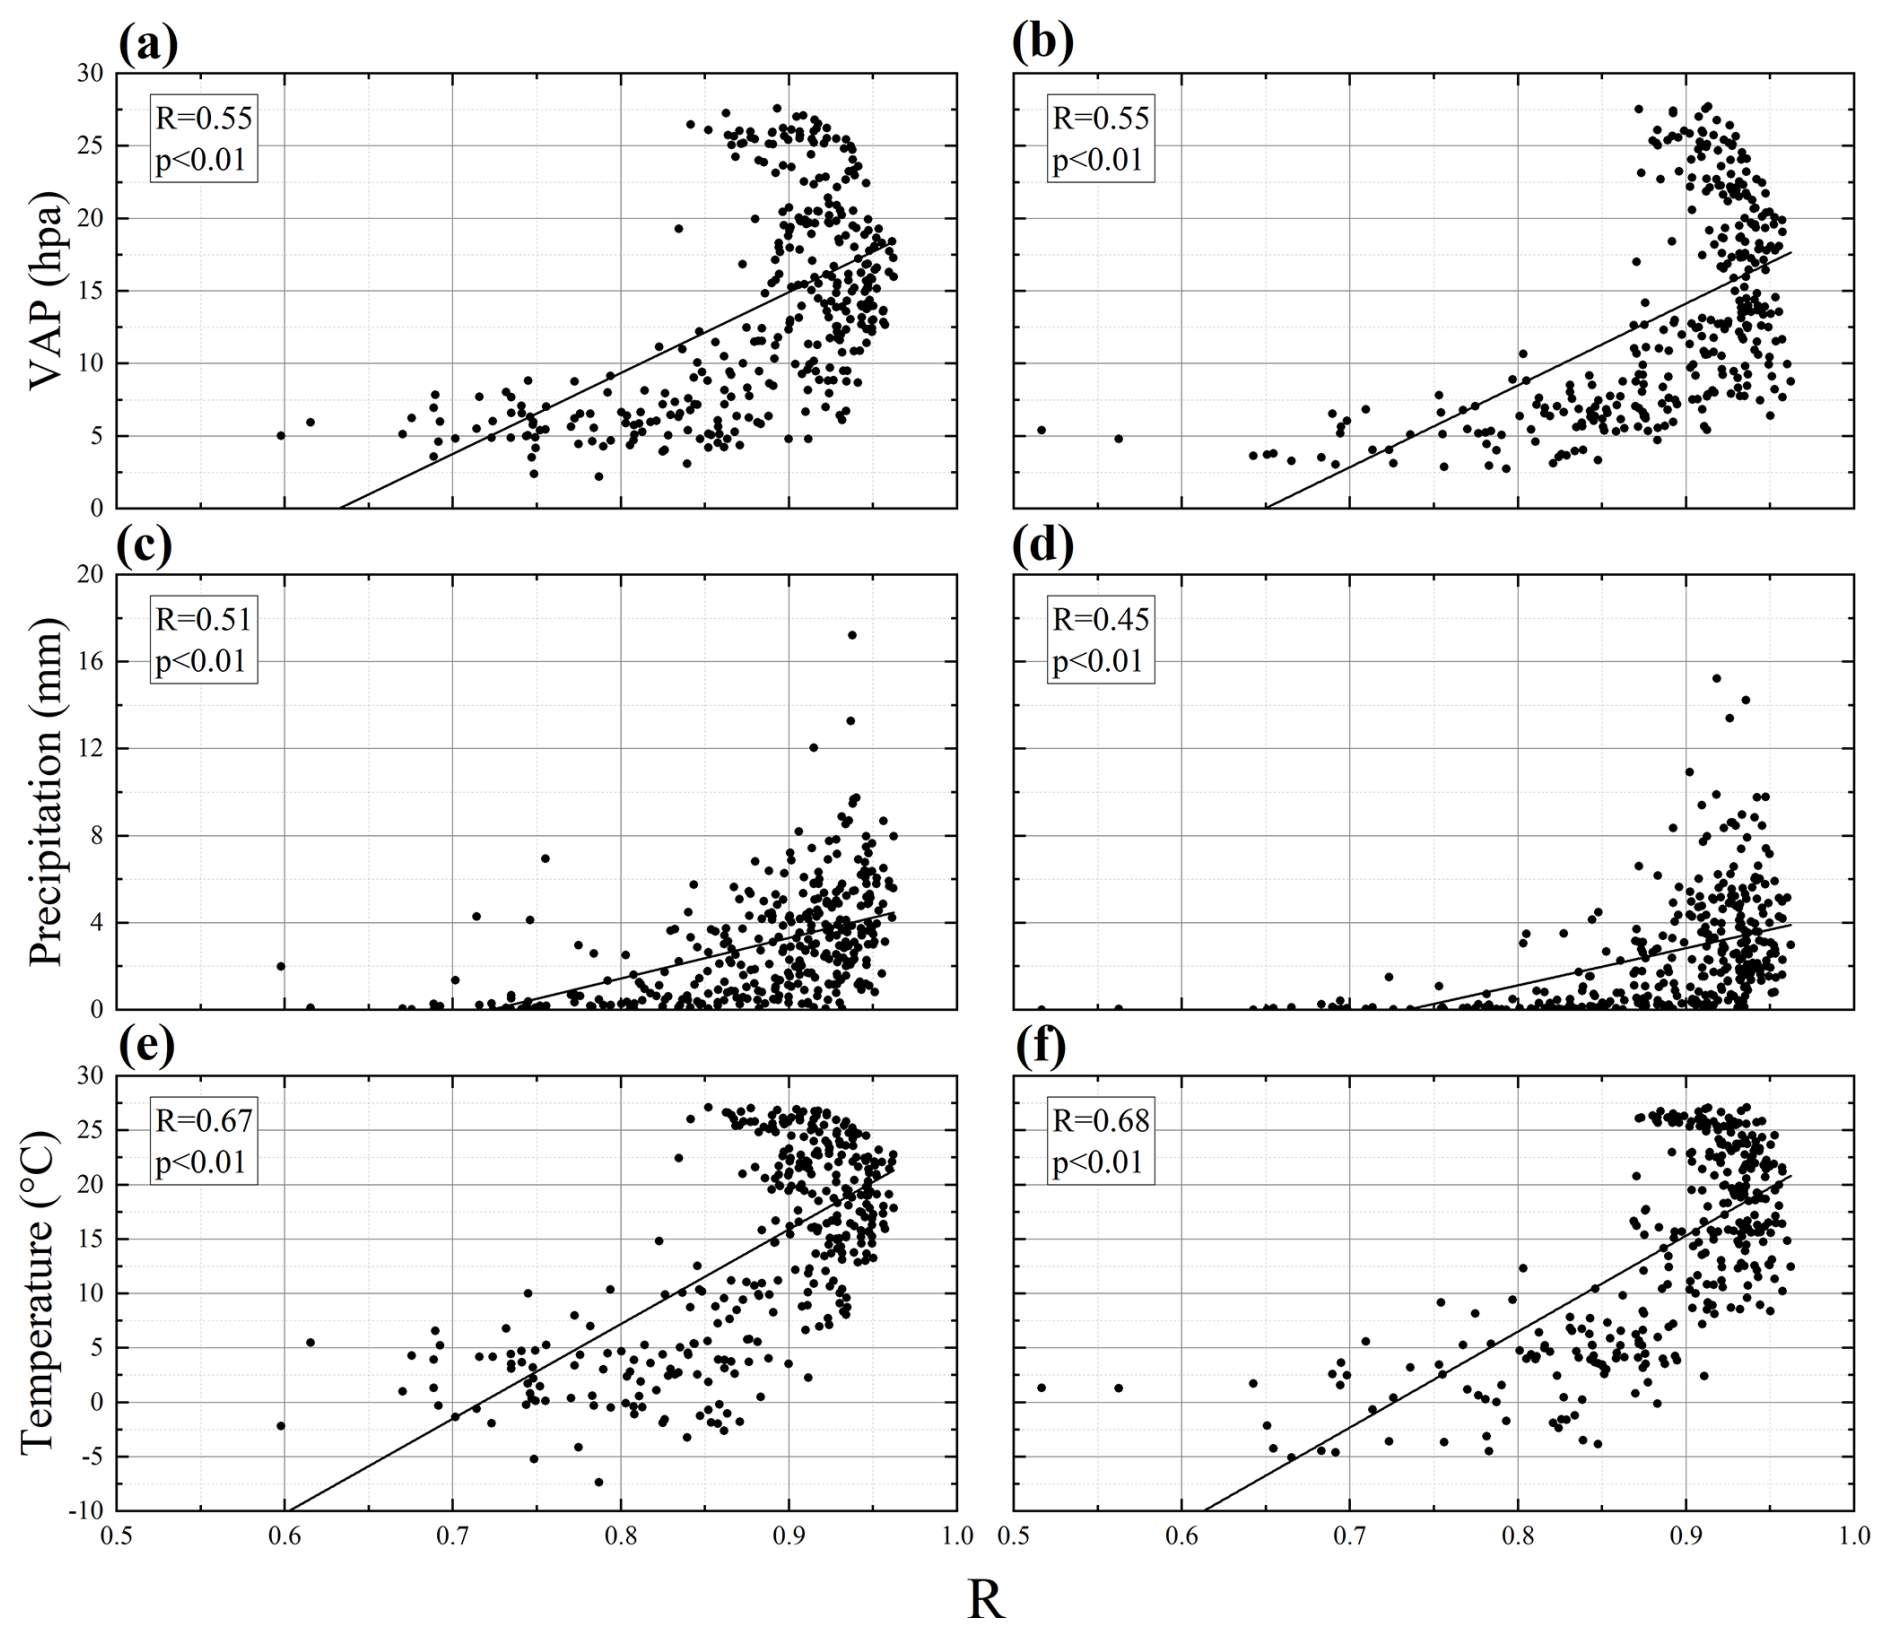
Figure 9R values and different environmental factors: VAP (a, b), precipitation (c, d), and temperature (e, f). Correlations in 2016 (a, c, e) and 2023 (b, d, f).
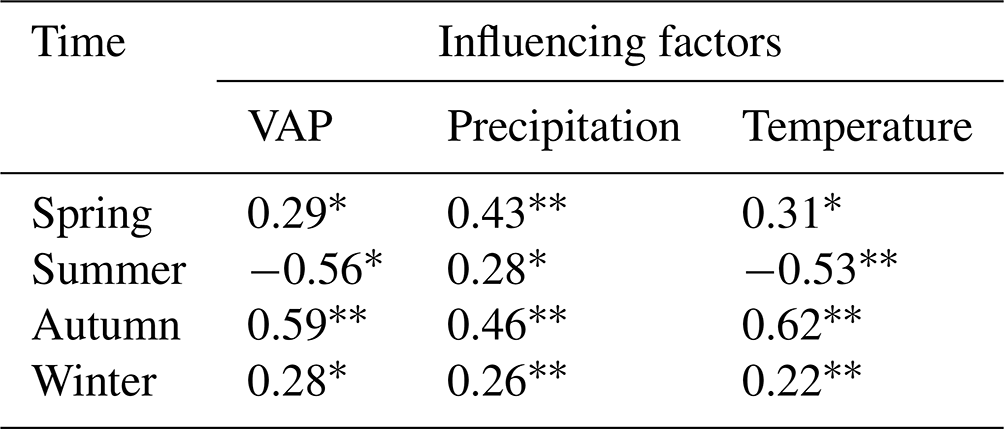
Table 1Correlation coefficients between estimated performance and influencing factors in different seasons (* and refer to passing the p<0.05 and p<0.01 significance tests, respectively).
3.3 Effect of different environmental factors on SD estimation
Figure 9 shows the effects of the national daily average VAP, precipitation, and temperature (based on CMA meteorological stations) on the R values in Fig. 8. The R values were exponentially related to both VAP and precipitation, and VAP had a greater effect on R than precipitation. Meanwhile, the estimated performance in 2016 was more affected by moisture conditions. Temperature had the greatest impact on R, with 2023 being affected to a greater extent than in 2016 (Fig. 9e, f). The influences on SD estimation are discussed by distinguishing the different seasons (Table 1). VAP, precipitation, and temperature had the greatest influence on R values in autumn and the least in winter. Notably, R in summer was negatively correlated with VAP and temperature.
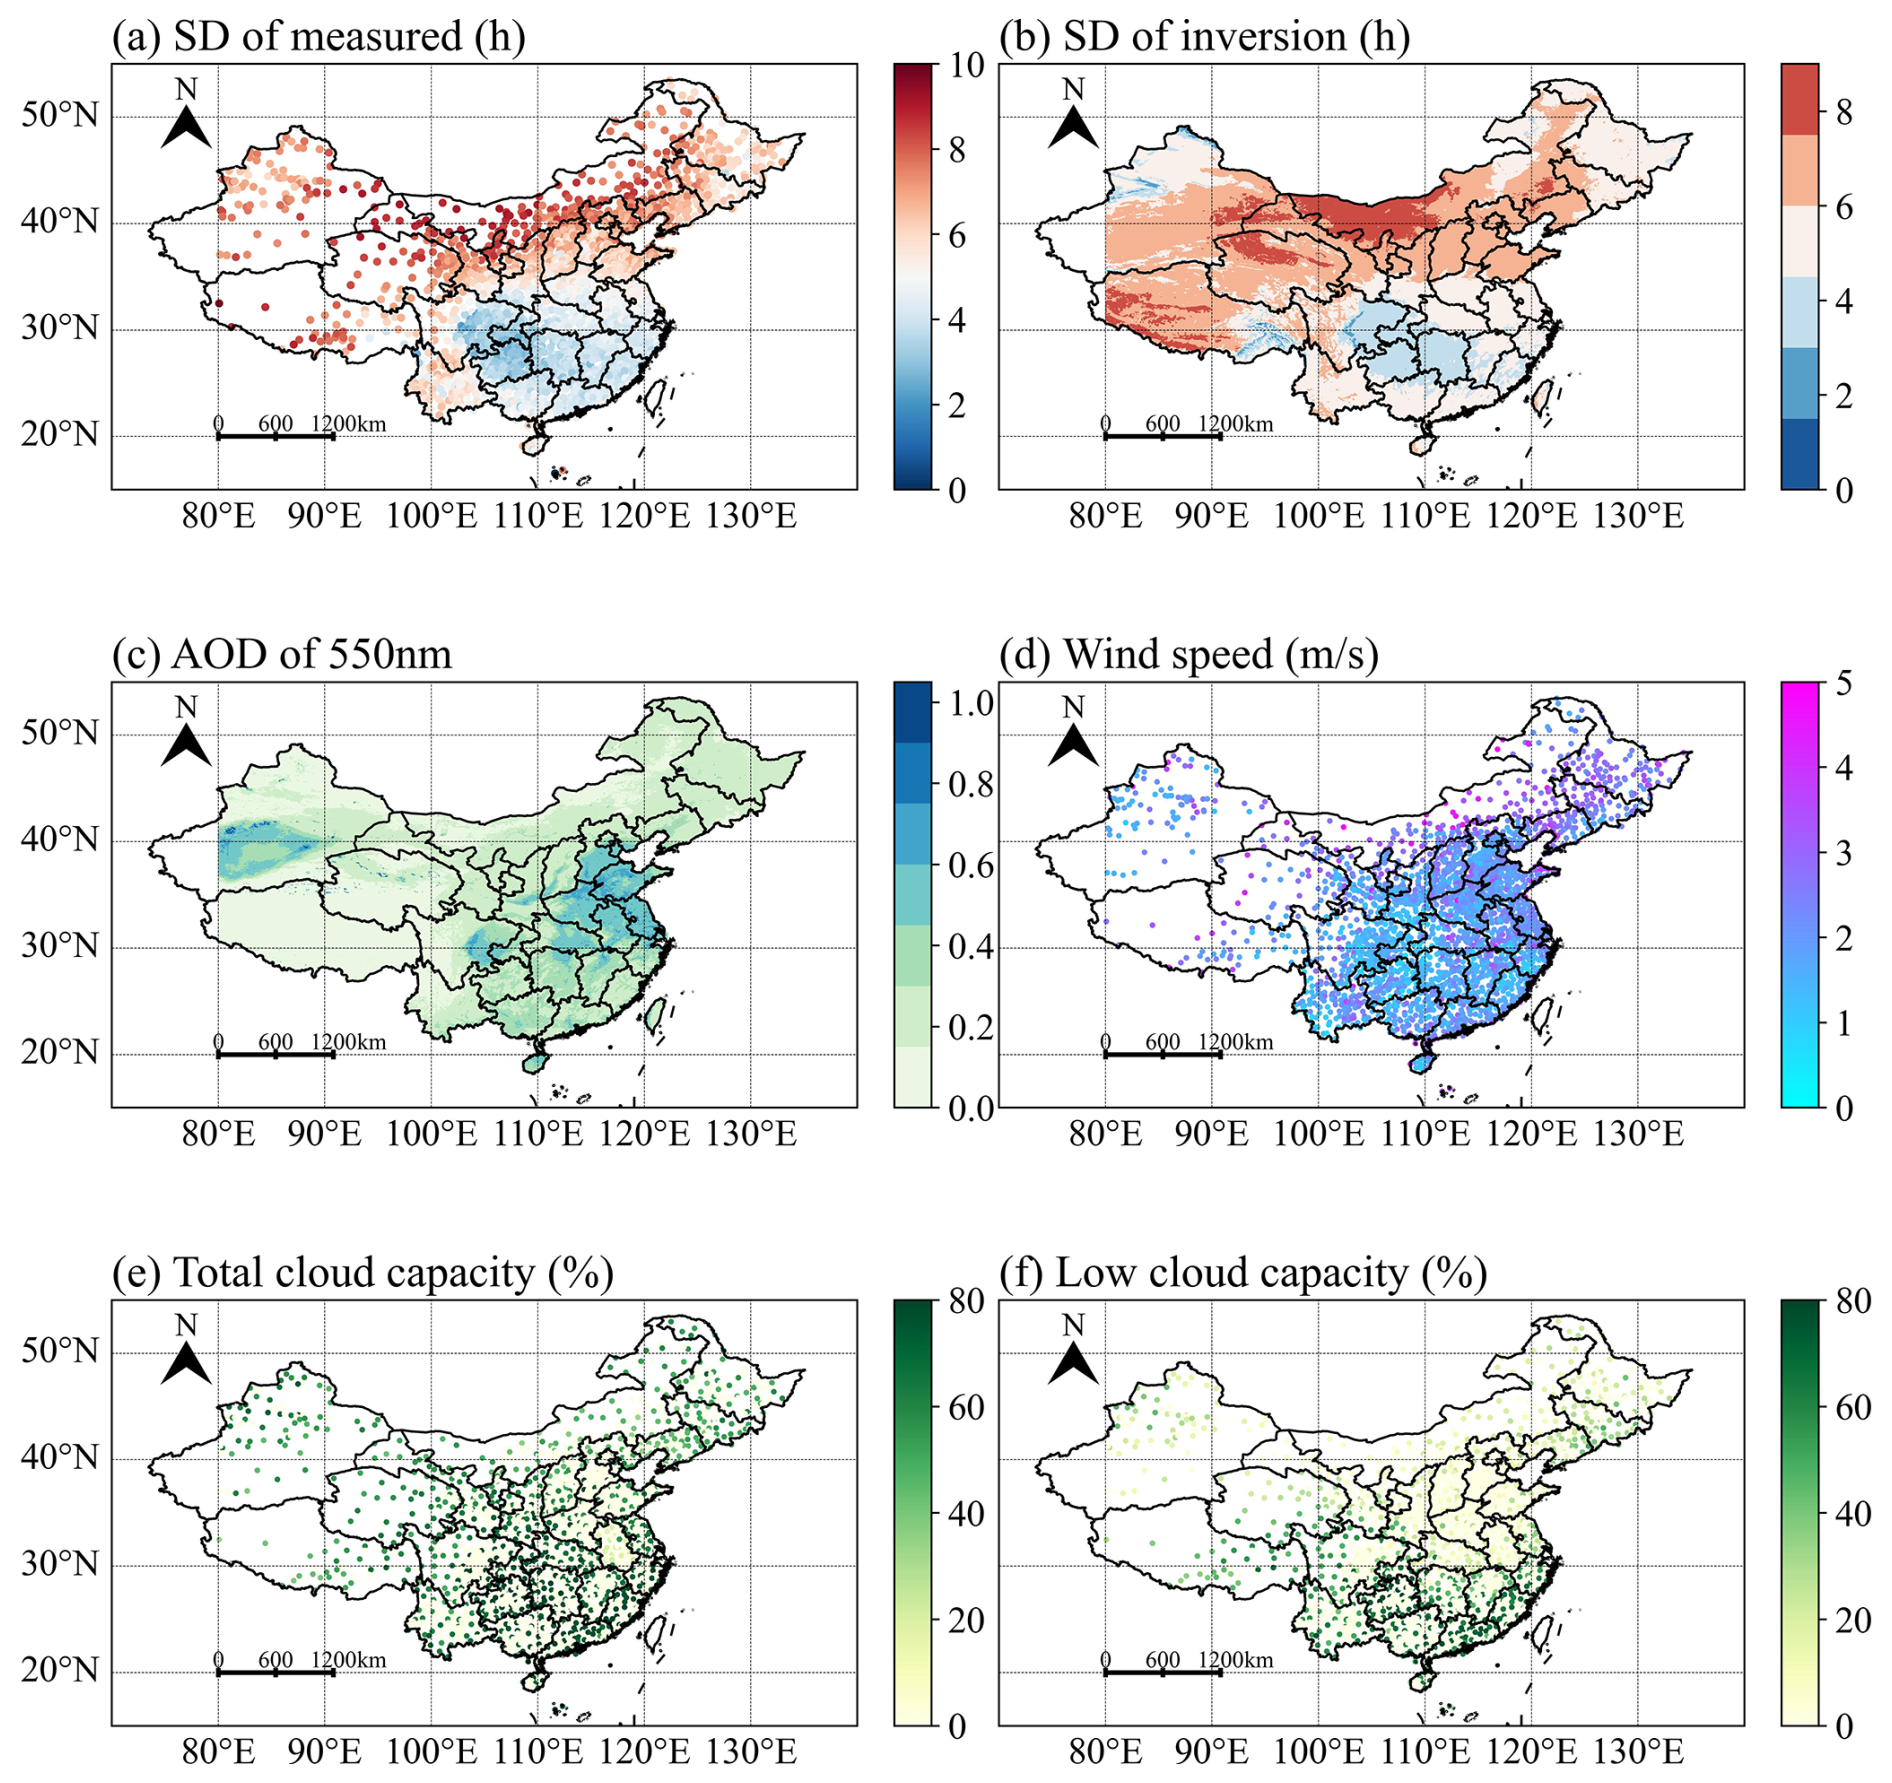
Figure 10Comparison of annual average ground measurement (a) and Himawari (b) sunshine duration (SD) in 2016, giving an annual average AOD of 550 nm (c), wind speed (d), total cloud capacity (e), and low cloud capacity (f).
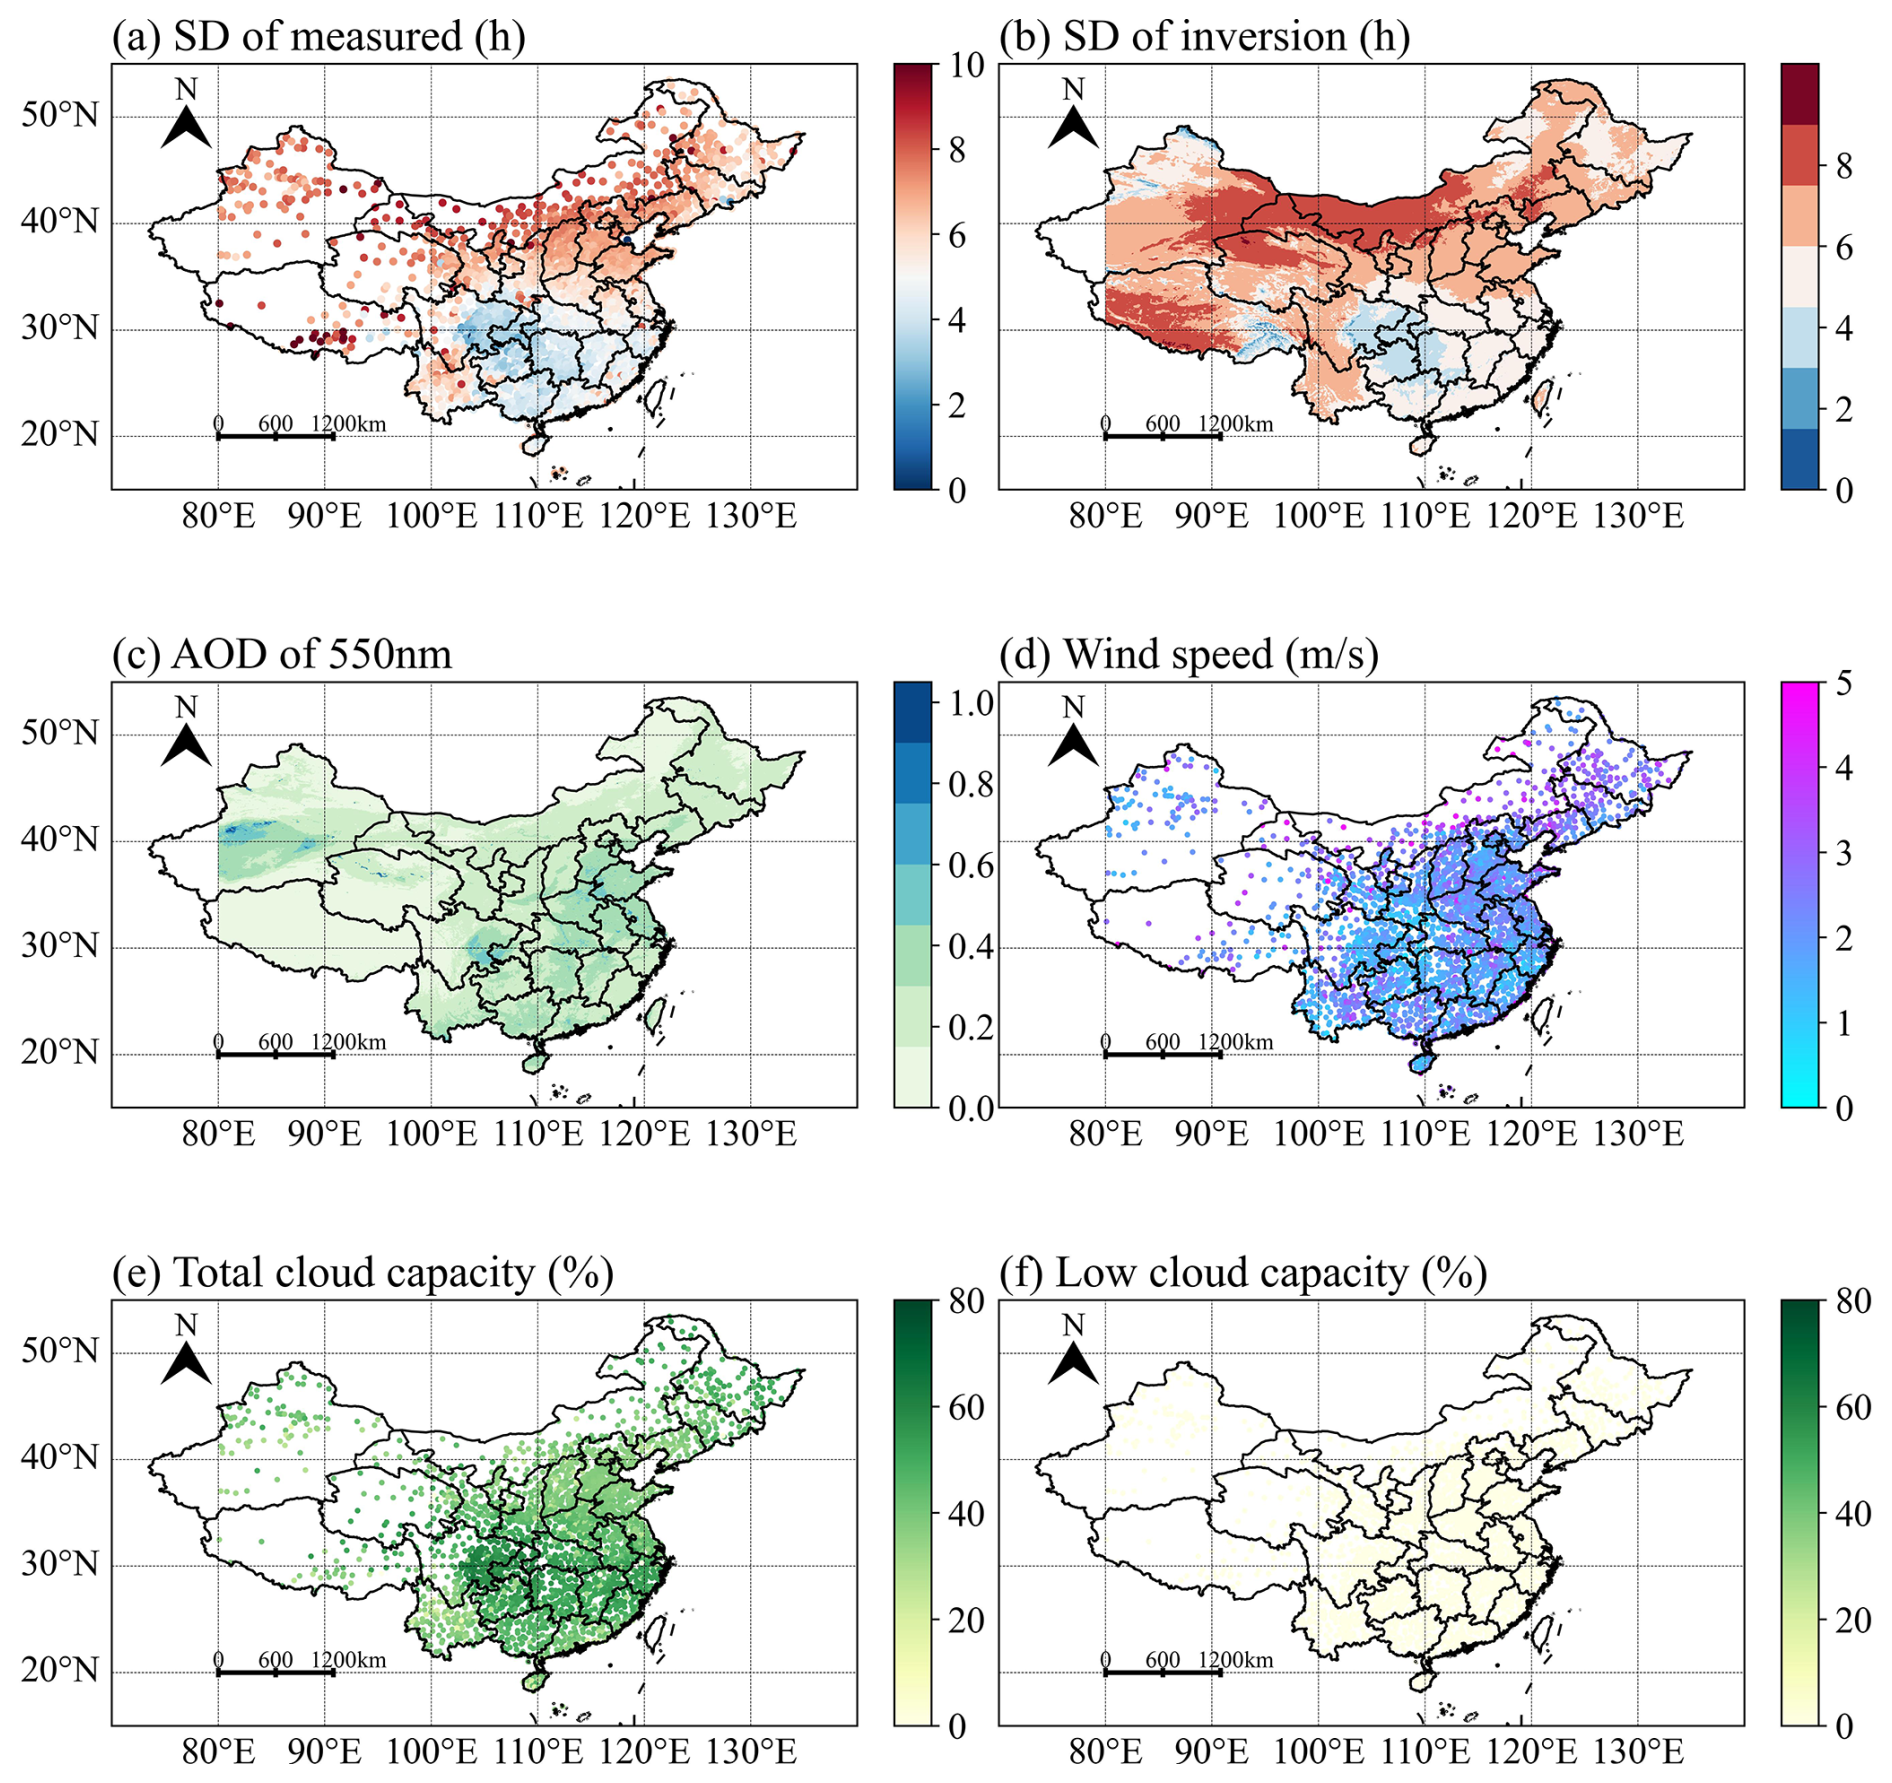
Figure 11Comparison of annual average ground measurement (a) and Himawari (b) sunshine duration (SD) in 2023, giving an annual average AOD of 550 nm (c), wind speed (d), total cloud capacity (e), and low cloud capacity (f).
Figures 10 and 11 show the annual average SD from the CMA meteorological stations and Himawari estimations in 2016 and 2023, respectively, along with the annual average AOD, wind speed, and cloud capacity. On an annual scale, ground-measured and estimated SD are more consistent in eastern and northern China, while both years have higher estimates in eastern China and lower estimates in northwestern and northeastern China. When comparing the impact factors, higher wind speed and lower AOD in these areas, both affected the SD estimation. The estimated SD appears to be overestimated (southern China) at excessively high cloud cover, especially at excessively high low-cloud cover, which was more pronounced in 2016. In 2023, the total cloud cover was higher, the low-cloud cover was lower, and the estimation error had poorer feedback on the cloud cover.
3.4 Effect of different environmental factors on SD estimation
The EOF analysis of the mean annual SD grid data in China from 2015 to 2023 and the spatial variance contribution rate of the eigenvectors in the first three EOF modes are shown in Fig. 12, where the explained variance of each mode is 30.44, 23.47, and 19.0 %, respectively, with a cumulative variance contribution of ∼ 72.91 %. The variance contribution rate of the Mode 1 eigenvectors in Fig. 12a surpassed that of the other models, making it the predominant spatial distribution in China. Mode 1 decreases from western to eastern China, and northwestern China exhibits extremely low values; however, there are exceptions in Yunnan Province. Mode 2 (Fig. 12b) exhibits a dipolar distribution, decreasing from southern to northeastern China, and Mode 3 shows a tripole distribution, decreasing from central China to the sides. Generally, it can be concluded that SD decreases from western to northern China. Figure 12d, e, and f show the time coefficients of SD from the first three models in China, where the SD time coefficients of Mode 1 (Fig. 12d) show an increasing trend from 2016 to 2023, with the minimum time coefficient in 2019 and maximum time coefficient in 2021. The SD time coefficients of Modes 2 and 3 exhibit a decreasing trend, and both are positive in 2016 and negative in 2019 (Fig. 12e, f).
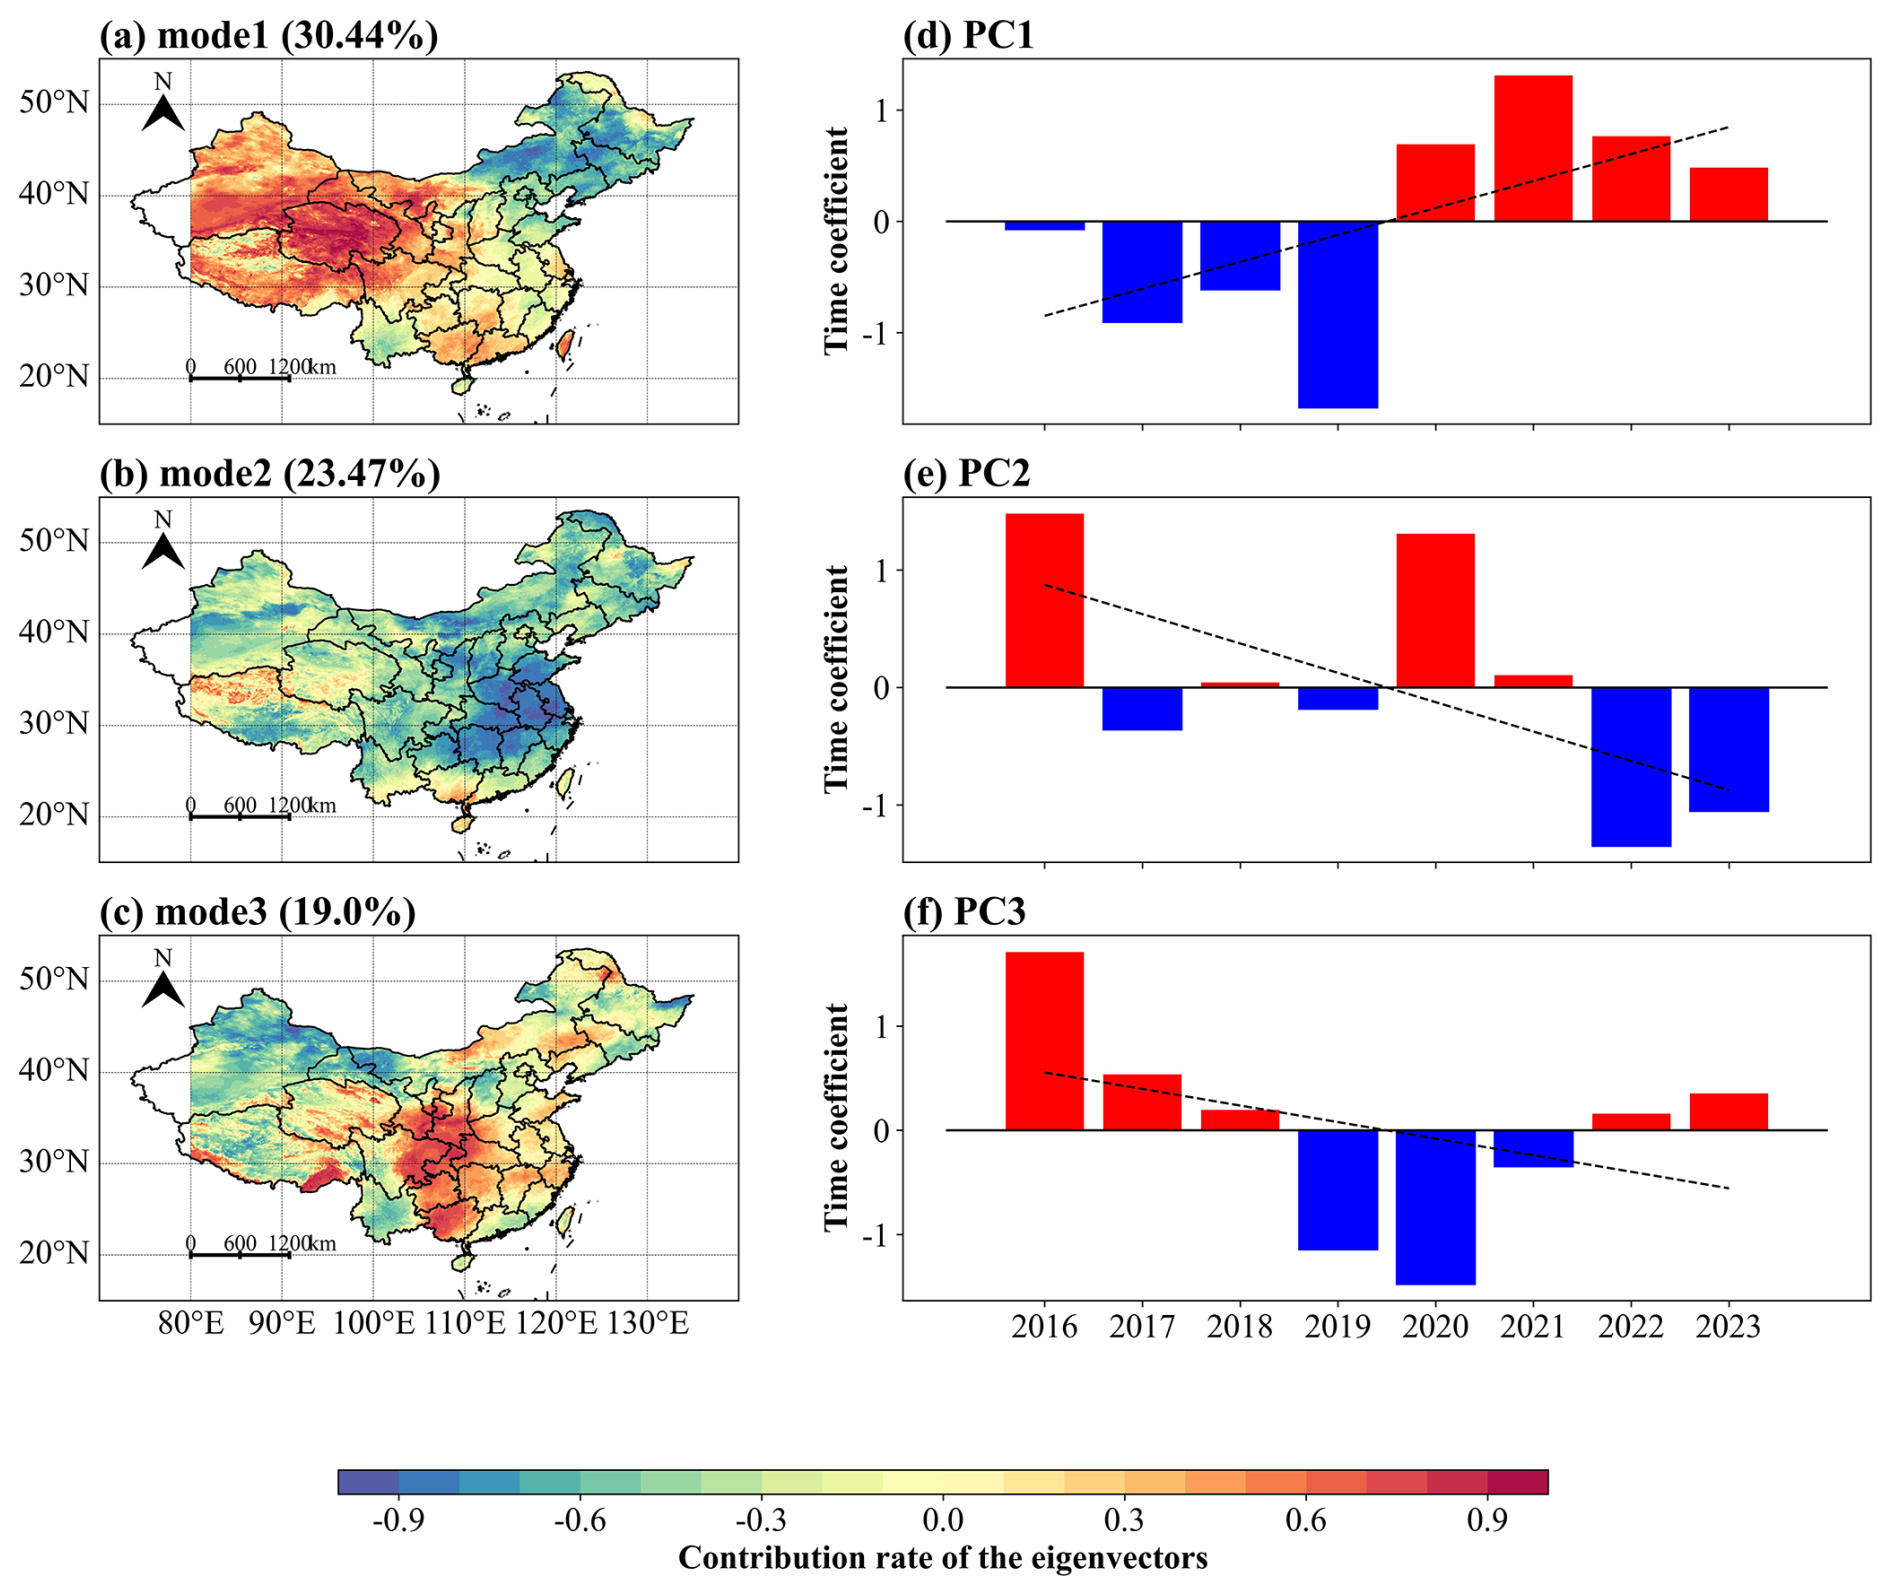
Figure 12Distribution of eigenvector contribution rates (a–c) and time coefficients (d–f) for the first three modes of sunshine duration (SD).
There is no explicit remote sensing inversion model for SD as its observation is founded upon the accumulation of radiation. Consequently, SD datasets were constructed through spatial interpolation, which results in the absence of SD datasets that are released with high spatiotemporal resolution. Here, a 5 km resolution SD dataset in China from 2016 to 2023 was established based on a time series using Himawari imagery fitted with an Ångström–Prescott model, an approach not done before by previous studies.
The time series based on the Ångström–Prescott model was used to invert the SD in China, setting the coefficients of a and b to fixed values for the entire region at different DOYs, while the suggested coefficients in this study are not comparable with the calibrated coefficients for other regions. Previous studies on the Ångström–Prescott model have confirmed that it is a reliable tool for estimating solar energy in practical applications with no marked dependence on latitude (Paulescu et al., 2016). Additionally, the accuracy of the model has a strong dependence on the season (Liu et al., 2023), and according to the results here (Figs. 4–8), the cause of this can be attributed to differences in the day and night lengths in different seasons. This work not only provides a more accurate evaluation standard for the level of radiation received on the ground but also provides better support for radiation estimation in the future. More conventional meteorological stations will be established in the future to validate and improve the Ångström–Prescott model based on a time series. It is noteworthy that the number of meteorological observation stations in southwestern China (especially in the Tibetan Plateau region) is small and distributed unevenly, and the snow in the plateau notably affects interpretation of the reflectance data from the Himawari imagery. Thus, we will consider the input of the land cover characteristics as the climatological data in following studies to improve this poor performance.
It is worth noting that there is a bias in the validation of the training and test data, where there is an overestimation at 0 SD (Fig. 3), which may be the strong light in most of the area under a DOY, leading to the Ångström–Prescott model's larger parameters and overestimation of a very small portion of the image elements that contain aerosols, clouds, and even precipitation. In addition, in the test data the estimated SD was < 0 (Fig. 7c, d), because the thicker clouds, atmospheric aerosols, and water vapour in the majority of the area on that day did not have much effect on the ground-based SD instrument (the atmospheric longwave radiation contained in the direct radiation was not affected) but had a significant effect on the AHI shortwave radiation data, resulting in an SD of < 0. After changing the image elements with SDs < 0 to 0, the validation results remained substantial (Fig. 8), indicating that this part of the radiation was essentially less than the threshold for SD observations (120 W m−2). In conclusion, because our approach is based on a time series, it is unavoidable that we will encounter input data that are not sensitive to different sky conditions. In the future, the use of relevant physical precipitation models will be considered to simulate the precipitation process at different times of the day based on radiation data. This will enable us to estimate the SD, and this aspect of the Ångström–Prescott model will be subsequently improved.
We found that temperature, moisture conditions, wind speed, and atmospheric pollutants all influenced the SD estimation, with temperature having the greatest effect on temporal variation and wind speed having a stronger effect on spatial variation than AOD and cloud capacity. However, we believe that the effects of these environmental factors are not independent but are the result of interactions (Tang et al., 2022). In densely populated and economically developed areas (eastern and southern China), where pollutant levels are higher and increased wind speeds accelerate their dispersion, this regulatory mechanism is enhanced by increasing pollutant concentrations (O'Dowd and Smith, 1993; Wang et al., 2014). An increase or decrease in wind speed affects the rate of diffusion of water vapour and pollutants in the air, which in turn affects atmospheric transparency and, ultimately, SD estimation. However, the effect of temperature on SD estimation in this study was not consistent with that in previous studies (Tang et al., 2022; Feng et al., 2019; Ren et al., 2017), which suggests that the relationship between SD, temperature, and relative humidity is complex and needs further investigation.
The EOF method analysis of the mean annual SD indicates that it decreases from western to northeastern China, consistent with the results of Tang et al. (2022) and Xiong et al. (2020) and suggesting that the pattern of industrial development between western and eastern China affects radiation levels to some extent. The EOF time coefficients show that there has been a certain degree of increase in SD in recent years, which correlates with the long-term SD analysis by Tang et al. (2022). This trend may be related to global climate change (Josefsson and Landelius, 2000), because the variation in wind speeds due to global warming has resulted in decreased cloud dissipation across mainland China (Xiong et al., 2020). In addition, the decrease in human activity in recent years (Liu et al., 2020) has contributed to the weakening of the urban rain island effect and aerosols (Glantz et al., 2006), and it appears that the latter factor is more influential in this study. However, short-term reductions in human activity cannot become the norm, and sunshine duration is bound to fluctuate due to the acceleration of the hydrological cycle.
The SD dataset is freely accessible at https://doi.org/10.57760/sciencedb.10276 (Zhang et al., 2024).
We introduced a newly developed high-resolution dataset that provides SD data for China for the period 2016–2023. We calculated the daily SD using Himawari Level 3 shortwave radiation fitted with the Ångström–Prescott model based on a time series and used ground-measured SD to evaluate the estimation performance. The validation of testing data from ground-measured SD gave favourable results, with R values > 0.5 and an average of 0.88 for all days in 2016 and 2023. We also found that temperature and wind speed dominated the Ångström–Prescott model in estimating SD. A future direction for this study would be to divide the Chinese regions into suitable areas to independently estimate and synthesise a more accurate daily SD dataset for China.
ZZ and SF designed and organised the paper. ZZ and JH prepared the related materials and ran the dataset. ZZ evaluated the accuracy of the dataset. All authors discussed the results and commented on the paper.
The contact author has declared that none of the authors has any competing interests.
Publisher’s note: Copernicus Publications remains neutral with regard to jurisdictional claims made in the text, published maps, institutional affiliations, or any other geographical representation in this paper. While Copernicus Publications makes every effort to include appropriate place names, the final responsibility lies with the authors. Regarding the maps used in this paper, please note that Figs. 1, 10, 11, and 12 contain disputed territories.
This research was supported by the National Key Research and Development Program of China (grant no. 2023YFE0122200) and the National Nature Science Foundation (grant no. 42075193).
This paper was edited by Bo Zheng and reviewed by two anonymous referees.
Ampratwum, D. B. and Dorvlo, A. S.: Estimation of solar radiation from the number of sunshine hours, Appl. Energ., 63, 161–167, https://doi.org/10.1016/S0306-2619(99)00025-2, 1999.
Ångström, A.: Solar and terrestrial radiation. Report to the international commission for solar research on actinometric investigations of sola and atmospheric radiation, Q. J. Roy. Meteor. Soc., 50, 121–126, https://doi.org/10.1002/qj.49705021008, 1924.
Bahel, V., Bakhsh, H., and Srinivasan, R.: A correlation for estimation of global solar radiation, Energy, 12, 131–135, https://doi.org/10.1016/0360-5442(87)90117-4, 1987.
Baumgartner, D., Pötzi, W., Freislich, H., Strutzmann, H., Veronig, A. M., Foelsche, U., and Rieder, H. E.: A comparison of long-term parallel measurements of sunshine duration obtained with a Campbell-Stokes sunshine recorder and two automated sunshine sensors, Theor. Appl. Climatol., 133, 263–275, https://doi.org/10.1007/s00704-017-2159-9, 2018.
Bessho, K., Date, K., Hayashi, M., Ikeda, A., Imai, T., Inoue, H., Kumagai, Y., Miyakawa, T., Murata, H., Ohno, T., Okuyama, A., Oyama, R., Sasaki, Y., Shimazu, Y., Shimoji, K., Sumida, Y., Suzuki, M., Taniguchi, H., Tsuchiyama, H., Uesawa, D., Yokota, H., and Yoshida, R.: An introduction to Himawari-8/9 – Japan's new-generation geostationary meteorological satellites, J. Meteorol. Soc. Jpn., 94, 151–183, https://doi.org/10.2151/JMSJ.2016-009, 2016.
Chang, Z., Chen, Y., Zhao, Y., Fu, J., Liu, Y., Tang, S., Han, Y., and Fan, Z.: Association of sunshine duration with acute myocardial infarction hospital admissions in Beijing, China: A time-series analysis within-summer, Sci. Total Environ., 828, 154528, https://doi.org/10.1016/j.scitotenv.2022.154528, 2022.
Chen, R., Ersi, K., Yang, J., Lu, S., and Zhao, W.: Validation of five global radiation models with measured daily data in China, Energ. Convers. Manage., 45, 1759–1769, https://doi.org/10.1016/J.ENCONMAN.2003.09.019, 2004.
Chukwujindu, N. S.: A comprehensive review of empirical models for estimating global solar radiation in Africa, Renew. Sust. Energ. Rev., 78, 955–995, https://doi.org/10.1016/J.RSER.2017.04.101, 2017.
Damiani, A., Irie, H., Horio, T., Takamura, T., Khatri, P., Takenaka, H., Nagao, T., Nakajima, T. Y., and Cordero, R. R.: Evaluation of Himawari-8 surface downwelling solar radiation by ground-based measurements, Atmos. Meas. Tech., 11, 2501–2521, https://doi.org/10.5194/amt-11-2501-2018, 2018.
Dedieu, G., Deschamps, P. Y., and Kerr, Y. H.: Satellite estimation of solar irradiance at the surface of the earth and of surface albedo using a physical model applied to Metcosat Data, J. Appl. Meteorol. Clim., 26, 79–87, https://doi.org/10.1175/1520-0450(1987)026<0079:SEOSIA>2.0.CO;2, 1987.
Elagib, N. A. and Mansell, M. G.: New approaches for estimating global solar radiation across Sudan, Energ. Convers. Manage., 41, 419–434, https://doi.org/10.1016/S0196-8904(99)00123-5, 2000.
Fan, J., Wang, X., Wu, L., Zhang, F., Bai, H., Lu, X., and Xiang, Y.: New combined models for estimating daily global solar radiation based on sunshine duration in humid regions: A case study in South China, Energ. Convers. Manage., 156, 618–625, https://doi.org/10.1016/J.ENCONMAN.2017.11.085, 2018.
Feng, Y., Zhang, X., Jia, Y., Cui, N., Hao, W., Li, H., and Gong, D.: High-resolution assessment of solar radiation and energy potential in China, Energ. Convers. Manage., 240, 114265, https://doi.org/10.1016/j.atmosenv.2022.119286, 2021.
Feng, Z., Guo, B., Ren, S., and Li, Y.: Reduction in sunshine duration and related factors over mainland China during 1961–2016, Energies, 12, 4718, https://doi.org/10.3390/en12244718, 2019.
Frouin, R. and Murakami, H.: Estimating photosynthetically available radiation at the ocean surface from ADEOS-II global imager data, J. Oceanogr., 63, 493–503, https://doi.org/10.1007/S10872-007-0044-3, 2007.
Frouin, R. and Pinker, R. T.: Estimating photosynthetically active radiation (PAR) at the earth's surface from satellite observations, Remote Sens Environ., 51, 98–107, https://doi.org/10.1016/0034-4257(94)00068-X, 1995.
Ghanghermeh, A., Roshan, G., and Halabian, A.: Projecting spatiotemporal variations of sunshine duration with regards to climate change in Iran as a step towards clean energy, Sustain. Energy Technol. Assess., 53, 102630, https://doi.org/10.1016/j.seta.2022.102630, 2022.
Glantz, P., Nilsson, D. E., and von Hoyningen-Huene, W.: Estimating a relationship between aerosol optical thickness and surface wind speed over the ocean, Atmos. Chem. Phys. Discuss., 6, 11621–11651, https://doi.org/10.5194/acpd-6-11621-2006, 2006.
Gorelick, N., Hancher, M., Dixon, M., Ilyushchenko, S., Thau, D., and Moore, R.: Google Earth Engine: Planetary-scale geospatial analysis for everyone, Remote Sens Environ., 202, 18–27, https://doi.org/10.1016/J.RSE.2017.06.031, 2017.
Gu, S., Huang, R., Yang, J., Sun, S., Xu, Y., Zhang, R., Wang, Y., Lu, B., He, T., Wang, A., Bian, G., and Wang, Q.: Exposure-lag-response association between sunlight and schizophrenia in Ningbo, China, Environ. Pollut., 247, 285–292, https://doi.org/10.1016/j.envpol.2018.12.023, 2019.
He, Y., Wang, K., Yang, K., Zhou, C., Shao, C., and Yin, C.: Homogenized daily sunshine duration over China from 1961 to 2022, Earth Syst. Sci. Data Discuss. [preprint], https://doi.org/10.5194/essd-2024-493, in review, 2024.
Hou, N., Zhang, X., Zhang, W., Wei, Y., Jia, K., Yao, Y., Jiang, B., and Cheng, J.: Estimation of Surface Downward Shortwave Radiation over China from Himawari-8 AHI Data Based on Random Forest, Remote. Sens., 12, 181, https://doi.org/10.3390/rs12010181, 2020.
Josefsson, W. and Landelius, T.: Effect of clouds on UV irradiance: As estimated from cloud amount, cloud type, precipitation, global radiation and sunshine duration, J. Geophys., 105, 4927–4935, https://doi.org/10.1029/1999JD900255, 2000.
Kim, B., Lee, K., Jee, J., and Zo, I.: Retrieval of outgoing longwave radiation at top-of-atmosphere using Himawari-8 AHI data, Remote Sens. Environ., 204, 498–508, https://doi.org/10.1016/J.RSE.2017.10.006, 2018.
Letu, H., Yang, K., Nakajima, T. Y., Ishimoto, H., Nagao, T. M., Riedi, J. C., Baran, A. J., Ma, R., Wang, T., Shang, H., Khatri, P., Chen, L., Shi, C., and Shi, J.: High-resolution retrieval of cloud microphysical properties and surface solar radiation using Himawari-8/AHI next-generation geostationary satellite, Remote Sens Environ., 239, 111583, https://doi.org/10.1016/j.rse.2019.111583, 2020.
Liang, S., Zheng, T., Liu, R., Fang, H., Tsay, S., and Running, S. W.: Estimation of incident photosynthetically active radiation from Moderate Resolution Imaging Spectrometer data, J. Geophys. Res., 111, D15208, https://doi.org/10.1029/2005JD006730, 2006.
Liu, F., Wang, X., Sun, F., and Wang, H.: Correct and remap solar radiation and photovoltaic power in China based on machine learning models, Appl. Energ., 312, 118775, https://doi.org/10.1016/j.apenergy.2022.118775, 2022.
Liu, J., Liu, J., Linderholm, H. W., Chen, D. L., Yu, Q., Wu, D., and Haginoya, S.: Observation and calculation of the solar radiation on the Tibetan Plateau, Energ. Convers. Manage., 57, 23–32, https://doi.org/10.1016/J.ENCONMAN.2011.12.007, 2012.
Liu, J., Shen, Y., Zhou, G., Liu, D., Yu, Q., and Du, J.: Calibrating the Ångström–Prescott Model with Solar Radiation Data Collected over Long and Short Periods of Time over the Tibetan Plateau, Energies, 16, 7093, https://doi.org/10.3390/en16207093, 2023.
Liu, L., Wu, Q., Li, X., Song, R., Wei, N., Liu, J., Yuan, J., Yan, S., Sun, X., Liang, Y., Li, Y., Jin, X., Wu, Y., Mei, L., Song, J., Yi, W., Pan, R., Cheng, J., and Su, H.: Sunshine duration and risks of schizophrenia hospitalizations in main urban area: Do built environments modify the association?, Sci. Total Environ., 871, 162057, https://doi.org/10.1016/j.scitotenv.2023.162057, 2023.
Liu, Q., Sha, D., Liu, W., Houser, P. R., Zhang, L., Hou, R., Lan, H., Flynn, C., Lu, M., Hu, T., and Yang, C.: Spatiotemporal Patterns of COVID-19 Impact on Human Activities and Environment in Mainland China Using Nighttime Light and Air Quality Data, Remote. Sens., 12, 1576, https://doi.org/10.3390/rs12101576, 2020.
Liu, X., Mei, X., Li, Y., Wang, Q., Zhang, Y., and Porter, J. R.: Variation in reference crop evapotranspiration caused by the Ångström–Prescott coefficient: Locally calibrated versus the FAO recommended, Agr. Water Manage., 96, 1137–1145, https://doi.org/10.1016/J.AGWAT.2009.03.005, 2009.
Lyapustin, A. and Wang, Y.: MODIS/Terra+ Aqua Land Aerosol Optical Depth Daily L2G Global 1km SIN Grid V061, NASA EOSDIS Land Processes DAAC [data set], https://doi.org/10.5067/MODIS/MCD19A2.061, 2022.
Marsz, A. A., Matuszko, D., and Styszyńska, A.: The thermal state of the North Atlantic and macro-circulation conditions in the Atlantic-European sector, and changes in sunshine duration in Central Europe, Int. J. Climatol., 42, 748–761, https://doi.org/10.1002/joc.7270, 2021.
Moradi, I.: Quality control of global solar radiation using sunshine duration hours, Energy, 34, 1–6, https://doi.org/10.1016/J.ENERGY.2008.09.006, 2009
O'Dowd, C. D. and Smith, M. H.: Physicochemical properties of aerosols over the northeast Atlantic: Evidence for wind-speed-related submicron sea-salt aerosol production, J. Geophys. Res.-Atmos., 98, 1137–1149, https://doi.org/10.1029/92JD02302, 1993.
Paulescu, M., Stefu, N., Calinoiu, D., Paulescu, E., Pop, N., Boată, R., and Mares, O.: Ångström–Prescott equation: Physical basis, empirical models and sensitivity analysis, Renew. Sust. Energ. Rev., 62, 495–506, https://doi.org/10.1016/J.RSER.2016.04.012, 2016.
Qin, S., Liu, Z., Qiu, R., Luo, Y., Wu, J., Zhang, B., Wu, L., and Agathokleous, E.: Short–term global solar radiation forecasting based on an improved method for sunshine duration prediction and public weather forecasts, Appl. Energ.,, 343, 121205, https://doi.org/10.1016/j.apenergy.2023.121205, 2023.
Ren, J., Lei, X., Zhang, Y., Wang, M., and Xiang, L.: Sunshine duration variability in haihe river basin, China, during 1966–2015, Water, 9, 770, https://doi.org/10.3390/W9100770, 2017.
Rietveld, M. R.: A new method for estimating the regression coefficients in the formula relating solar radiation to sunshine, Agr. Forest Meteorol., 19, 243–252, https://doi.org/10.1016/0002-1571(78)90014-6, 1978.
Sawada, Y., Okamoto, K., Kunii, M., and Miyoshi, T.: Assimilating Every-10-minute Himawari-8 Infrared Radiances to Improve Convective Predictability, J. Geophys. Res.-Atmos., 124, 2546–2561, https://doi.org/10.1029/2018JD029643, 2019.
Tana, G., Ri, X., Shi, C., Ma, R., Letu, H., Xu, J., and Shi, J.: Retrieval of cloud microphysical properties from Himawari-8/AHI infrared channels and its application in surface shortwave downward radiation estimation in the sun glint region, Remote Sens Environ., 290, 113548, https://doi.org/10.1016/j.rse.2023.113548, 2023.
Tang, C., Zhu, Y., Wei, Y., Zhao, F., Wu, X., and Tian, X.: Spatiotemporal characteristics and influencing factors of sunshine duration in China from 1970 to 2019, Atmosphere, 13, 2015, https://doi.org/10.3390/atmos13122015, 2022.
Tang, W., Yang, K., He, J., and Qin, J.: Quality control and estimation of global solar radiation in China, Sol. Energy, 84, 466–475, https://doi.org/10.1016/J.SOLENER.2010.01.006, 2010.
Vivar, M., Fuentes, M., Norton, M., Makrides, G., and Bustamante, I. D.: Estimation of sunshine duration from the global irradiance measured by a photovoltaic silicon solar cell, Renew. Sust. Energ. Rev., 36, 26–33, https://doi.org/10.1016/J.RSER.2014.04.045, 2014.
Wang, Y. W., Yang, Y. H., Zhou, X. Y., Zhao, N., and Zhang, J. H.: Air pollution is pushing wind speed into a regulator of surface solar irradiance in China, Environ. Res. Lett., 9, 054004, https://doi.org/10.1088/1748-9326/9/5/054004, 2014.
Wu, G., Liu, Y., and Wang, T.: Methods and strategy for modeling daily global solar radiation with measured meteorological data – A case study in Nanchang station, China, Energ. Convers. Manage., 48, 2447–2452, https://doi.org/10.1016/J.ENCONMAN.2007.04.011, 2007.
Xia, X.: Spatiotemporal changes in sunshine duration and cloud amount as well as their relationship in China during 1954–2005, J. Geophys. Res.-Atmos., 115, D00K06, https://doi.org/10.1029/2009JD012879, 2010.
Xiong, J., Wang, Z., Lai, C., Liao, Y., and Wu, X.: Spatiotemporal variability of sunshine duration and influential climatic factors in mainland China during 1959–2017, Int. J. Climatol., 40, 6282–6300, https://doi.org/10.1002/joc.6580, 2020.
Yao, W., Zhang, C., Wang, X., Zhang, Z., Li, X., and Di, H.: A new correlation between global solar radiation and the quality of sunshine duration in China, Energ. Convers. Manage., 164, 579–587, https://doi.org/10.1016/J.ENCONMAN.2018.03.037, 2018.
Yu, L., Zhang, M., Wang, L., Qin, W., Jiang, D., and Li, J.: Variability of surface solar radiation under clear skies over Qinghai-Tibet Plateau: Role of aerosols and water vapor, Atmos. Environ., 287, 119286, https://doi.org/10.1016/j.atmosenv.2022.119286, 2022.
Yu, Y., Shi, J., Wang, T., Letu, H., Yuan, P., Zhou, W., and Hu, L.: Evaluation of the Himawari-8 Shortwave Downward Radiation (SWDR) Product and its Comparison With the CERES-SYN, MERRA-2, and ERA-Interim Datasets, IEEE J. Sel. Top. Appl., 12, 519–532, https://doi.org/10.1109/JSTARS.2018.2851965, 2019.
Zhang, J., Zhao, L., Deng, S., Xu, W., and Zhang, Y.: A critical review of the models used to estimate solar radiation, Renew. Sust. Energ. Rev., 70, 314–329, https://doi.org/10.1016/J.RSER.2016.11.124, 2017.
Zhang, P., Guo, Q., Chen, B., and Feng, X.: The Chinese Next-Generation Geostationary Meteorological Satellite FY-4 Compared with the Japanese Himawari-8/9 Satellites, Adv. Meteorol. Sci. Technol., 6, 72–75, 2016 (in Chinese).
Zhang, X., Liang, S., Wild, M., and Jiang, B.: Analysis of surface incident shortwave radiation from four satellite products, Remote Sens Environ., 165, 186–202, https://doi.org/10.1016/J.RSE.2015.05.015, 2015.
Zhang, Z., Fang, S., and Han, J.: A daily sunshine duration (SD) dataset in China from Himawari AHI imagery (2016–2023) (V2), Science Data Bank [data set], https://doi.org/10.57760/sciencedb.10276, 2024.
Zhou, Y., Yu, D., Yang, Q., Pan, S., Gai, Y., Cheng, W., Liu, X., and Tang, S.: Variations of Water Transparency and Impact Factors in the Bohai and Yellow Seas from Satellite Observations, Remote Sens., 13, 514, https://doi.org/10.3390/rs13030514, 2021.