the Creative Commons Attribution 4.0 License.
the Creative Commons Attribution 4.0 License.
 | 27 Mar 2025
Gridded rainfall erosivity (2014–2022) in mainland China using 1 min precipitation data from densely distributed weather stations
Yueli Chen
Yun Xie
Xingwu Duan
Minghu Ding
The risk of water erosion in mainland China is intensifying due to climate change. A high-precision rainfall erosivity dataset is crucial for understanding the spatiotemporal patterns of rainfall erosivity and identifying key areas of water erosion. However, due to the limited spatiotemporal resolution of historical precipitation data, there are significant biases in the estimation of rainfall erosivity in China, particularly in regions with complex terrain and climatic conditions. Over the past decade, the China Meteorological Administration has continuously strengthened its ground-based meteorological observation capabilities, establishing a dense network of observation stations. These high-precision precipitation data provide a reliable basis for quantifying rainfall erosivity pattern in China. In this study, rigorous quality control was performed on the 1 min ground observation precipitation data from nearly 70 000 stations nationwide between 2014 and 2022, ultimately selecting data from 60 129 stations. Using the data from these stations, event rainfall erosivity was calculated, producing a national dataset of mean annual rainfall erosivity with a spatial resolution of 0.25°. This dataset shows that the mean annual rainfall erosivity in mainland China is approximately 1241 MJ mm ha−1 h−1 yr−1, with values exceeding 4000 MJ mm ha−1 h−1 yr−1 primarily concentrated in southern China and the southern Tibetan Plateau. The mean annual rainfall erosivity in mainland China derived from previously released datasets was found to be 31 % to 65 % higher than the value calculated in this study, and basin-level discrepancies between our findings and other studies also vary significantly. In summary, the release of this dataset enables a more accurate assessment of the current intensity of water erosion in China. The dataset is available from the National Tibetan Plateau/Third Pole Environment Data Center (https://doi.org/10.11888/Terre.tpdc.301206; Chen, 2024).
- Article
(5804 KB) - Full-text XML
-
Supplement
(832 KB) - BibTeX
- EndNote


Rainfall-induced soil erosion is a primary contributor to global soil loss, as highlighted by the Intergovernmental Panel on Climate Change (IPCC, 2019), posing a significant threat to soil functionality. This phenomenon jeopardizes various crucial aspects, including food security, water quality, and climate change mitigation (FAO and ITPS, 2015; Borrelli et al., 2020). Precipitation is the principal driver of erosion processes, influencing soil particle detachment, aggregate breakdown, and particle transport via runoff (Wischmeier and Smith, 1965, 1978). In this context, the rainfall erosivity index was introduced to quantify the potential of rainfall to cause soil loss. In the widely used Universal Soil Loss Equation (USLE) and its updated versions, the multi-year mean annual rainfall erosivity is referred to as the R factor, which links rainfall characteristics to soil loss based on extensive data collected from thousands of plot years of natural rainfall and runoff (Nearing et al., 2017). In recent years, rainfall erosivity has also been widely used in assessing ecosystem service functions, post-fire debris flows, and other environmental hazards (Diodato et al., 2020; McGuire et al., 2024; Wu et al., 2024).
Rainfall erosivity is commonly assessed by multiplying the accumulated kinetic energy (E) by the maximum 30 min rainfall intensity (I30) of a rainfall event. From a dynamic perspective, this index encapsulates the comprehensive effects of soil particle detachment and transport processes. The E of a rainfall event can be quantified using the raindrop physical parameters such as raindrop size and falling velocity measured using distrometers. However, it is challenge to obtain these parameters on a large spatial scale due to the high cost of maintaining a dense observational network of distrometers. To simplify the calculation, empirical models relating E to rainfall intensity (I) (hereafter referred to as the E–I relation) are developed based on observed raindrop fall velocity and size to estimate the E of rainfall events. The common used forms of E–I relation models include polynomial (Carter et al., 1974; Tilg et al., 2020), exponential (Kinnell, 1981; Brown and Foster, 1987; Renard et al., 1997; Mineo et al., 2019), logarithmic (Wischmeier, 1959; Wischmeier and Smith, 1978; Davison et al., 2005), and power-law (Laws, 1941; Laws and Parsons, 1943; Uijlenhoet and Stricker, 1999; Lim et al., 2015) equations. It is important to note that the accuracy of E depends not only on the models used but also on the temporal resolution of the in situ precipitation observations, considering the non-linear E–I relationship. For example, for logarithmic and exponential E–I relation models, like those used in the USLE and Revised Universal Soil Loss Equation (RUSLE), studies have shown that E values derived from 1 h in situ precipitation data are about 10 % lower than those derived from 1 min data (Agnese et al., 2006; Yin et al., 2007). In 2023, Dai et al. (2023) introduced the first global rainfall microphysics-based E values retrieved from radar reflectivity at different frequencies, showing that microphysics-based E estimates outperform those derived from commonly used empirical E–I relations, validated using ground disdrometers. Specifically, the mean annual rainfall kinetic energy calculated using the E–I method was found to be 6.17 % to 12.5 % lower than the radar remote-sensing-based E values across distinct regions worldwide.
The I30 value of a rainfall event is derived from precipitation process data, including both in situ and gridded precipitation data. In situ precipitation data with 1 min temporal resolution are the best suitable data for deriving I30 of a rain event. Precipitation data with a temporal resolution greater than 15 min may fail to capture the accurate subhourly rainfall process, resulting in underestimated I30 values (Angulo-Martínez and Beguería, 2009). For example, the I30 value derived from 1 min data is found to be approximately 1.668 times higher than that derived from hourly records in mainland China (Yin et al., 2007). As remote sensing technology and weather forecasting models advance, the temporal resolution of gridded precipitation data has greatly improved, allowing their use to derive I30 values. However, caution is needed, as I30 values may be underestimated when using gridded precipitation data. For example, the European Centre for Medium-Range Weather Forecasts Reanalysis 5 (ERA5) precipitation data underestimate I30 values by over 80 % on the Tibetan Plateau (Chen et al., 2022). Satellite-based products, such as the Integrated Multi-satellitE Retrievals for the Global Precipitation Measurement (GPM IMERG) dataset, also show significant underestimations in precipitation intensity, posing challenges in accurately identifying I30 (Freitas et al., 2020).
Based on the analysis, the variation among different E estimates derived from different data sources and methods is around 10 %. In contrast, the bias in I30 estimates from precipitation data with varying temporal resolutions exceeds 60 %. The bias in I30 for individual rainfall events is significantly greater than that for E. Therefore, the I30 estimation bias is the crucial source of inaccuracies in determining rainfall erosivity. The most reliable approach for obtaining I30 and corresponding rainfall erosivity values is to use in situ observations from densely spaced weather station networks.
Due to the limited availability of precipitation data of high temporal–spatial resolution, rainfall erosivity in China has traditionally been estimated using coarser-resolution precipitation data (limited in situ records and gridded data), such as hourly, daily, monthly, or yearly scales (Yin et al., 2015; Panagos et al., 2017; Liu et al., 2020; Yue et al., 2022; Chen et al., 2022, 2023b). Consequently, existing maps of mean annual rainfall erosivity may contain significant uncertainties, particularly in regions with complex terrain and climate conditions (Chen et al., 2022). Since 2012, the China Meteorological Administration (CMA) has developed a dense network of automatic weather stations, providing 1 min in situ precipitation records nationwide. This development offers an opportunity to better identify subhourly rainfall characteristics. By leveraging this dataset, accurate I30 values, event rainfall erosivity, and mean annual rainfall erosivity for the recent decade in mainland China can be obtained. This study aims to (1) determine mean annual rainfall erosivity values at approximately 70 000 weather stations using the standard method, (2) develop a mean annual rainfall erosivity map for mainland China by integrating values based on 1 min in situ data with values derived from hourly ERA5 reanalysis precipitation data, and (3) identify the sources of uncertainties in estimating the rainfall erosivity.
2.1 Data
2.1.1 Precipitation data
Over the past decade, approximately 70 000 weather stations have been established by the CMA, maintaining nearly 10 years of precipitation observations at 1 min intervals. To ensure the accuracy of these in situ data, the quality of records was evaluated using a data integrity index, defined as the ratio of available records to the total number of minutes in a year for each station. Records with an integrity level above 90 % for a given year were deemed suitable for calculating annual rainfall erosivity at the respective stations. Ultimately, data from 60 129 stations across the mainland China spanning 2014–2022 were used in this study.
Mainland China was divided into 16 167 grids with a spatial resolution of 0.25°. Based on this division, we analyzed the density of weather stations and the length of available data coverage at the grid scale (Fig. 1). Results indicated that the density of stations and coverage time length were significantly higher in the southeastern regions of China compared to the northwest. On a national scale, approximately 57 % of all grids had in situ precipitation observations, with an average of 6.7 stations per grid and data coverage of 5.2 years.
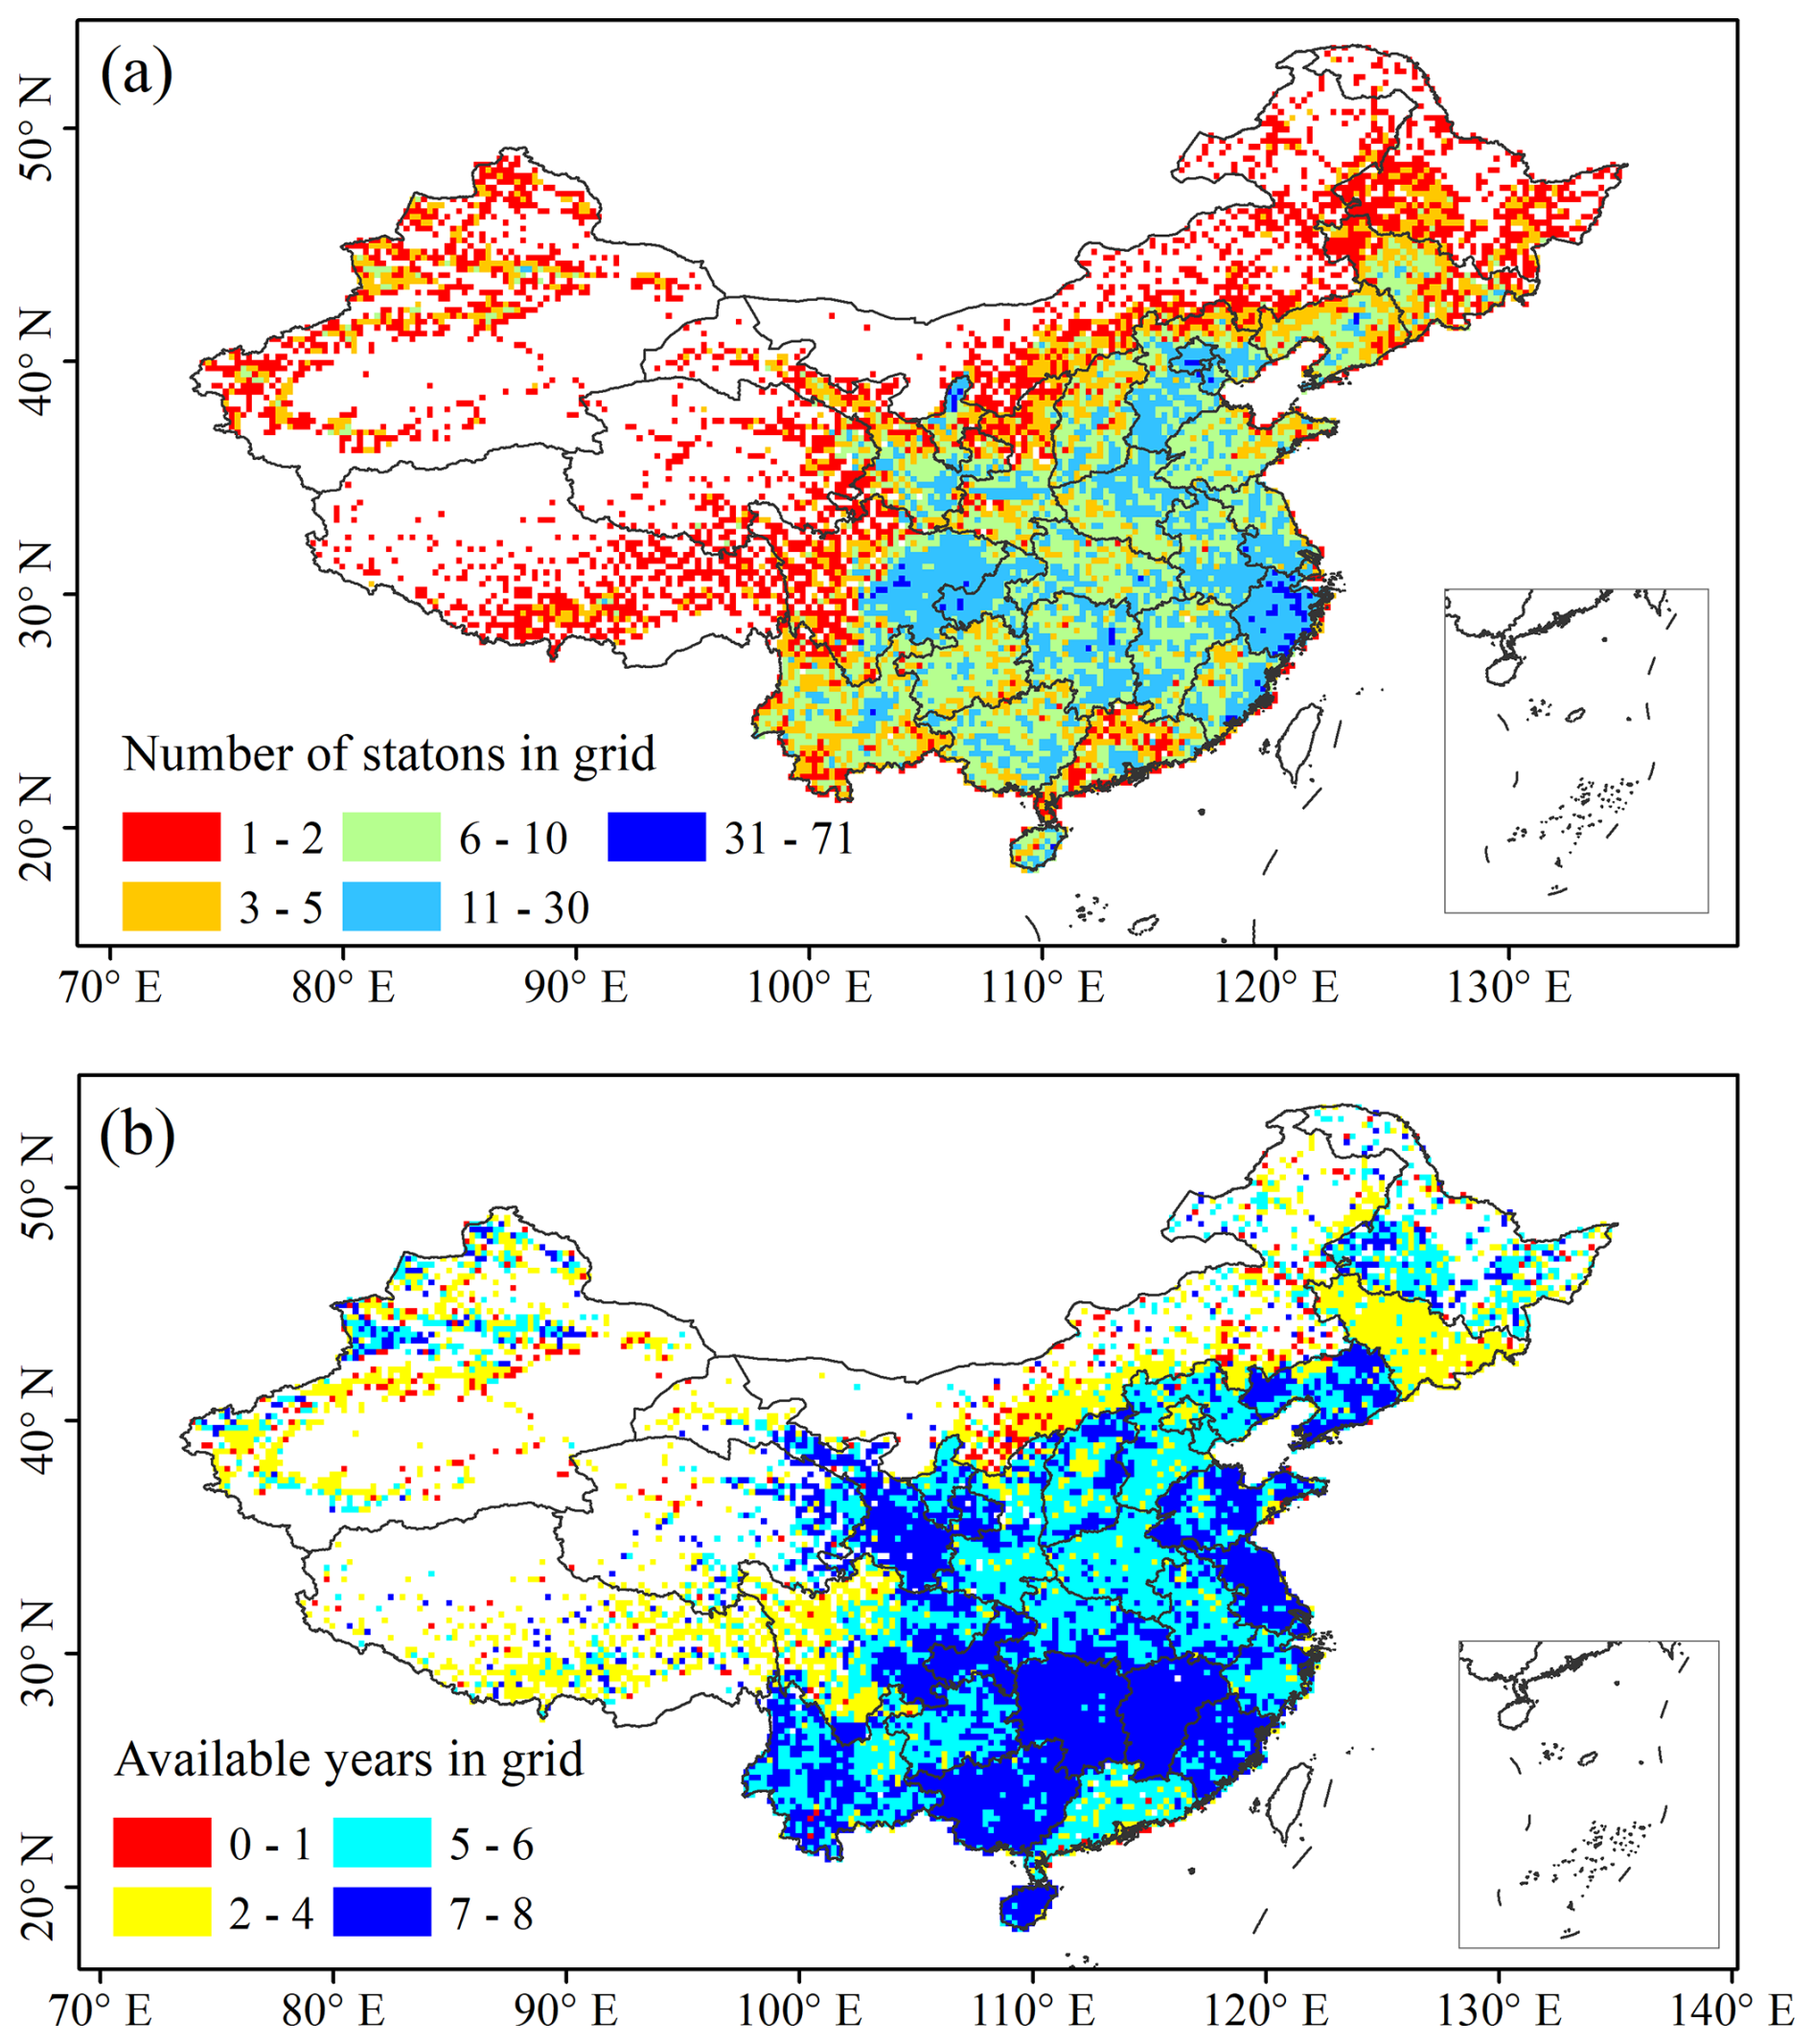
Figure 1(a) Number of available weather stations and (b) averaged coverage time length of in situ precipitation records in each 0.25° grid across mainland China.
A monthly gridded precipitation dataset, released by the National Meteorological Information Center (NMIC) of the CMA, was also employed to analyze the spatial characteristics of precipitation across China (hereafter referred to as the CMA gridded precipitation data). This dataset was particularly valuable for regions with insufficient station data, such as northwestern China. The gridded precipitation dataset is based on national weather station data and interpolated onto 0.5° grids using the thin plate spline method. This study used data from 2014 to 2022 to detect the spatial characteristics of multi-year mean annual precipitation across China.
The hourly 0.25° ERA5 reanalysis precipitation dataset was employed to calculate rainfall erosivity in the Dawang–Chayu area, located in the southern part of the Tibetan Plateau, which receives more than 1000 mm of annual precipitation but lacks 1 min precipitation records. ERA5 precipitation data include large-scale and convective precipitation consisting of rain and snow, produced by the European Centre for Medium-Range Weather Forecasts Integrated Forecasting System. This dataset, representing the latest generation of global atmospheric reanalysis, provides a higher spatial resolution compared to ERA-Interim (Hersbach et al., 2019).
2.1.2 Rainfall erosivity maps in previous studies
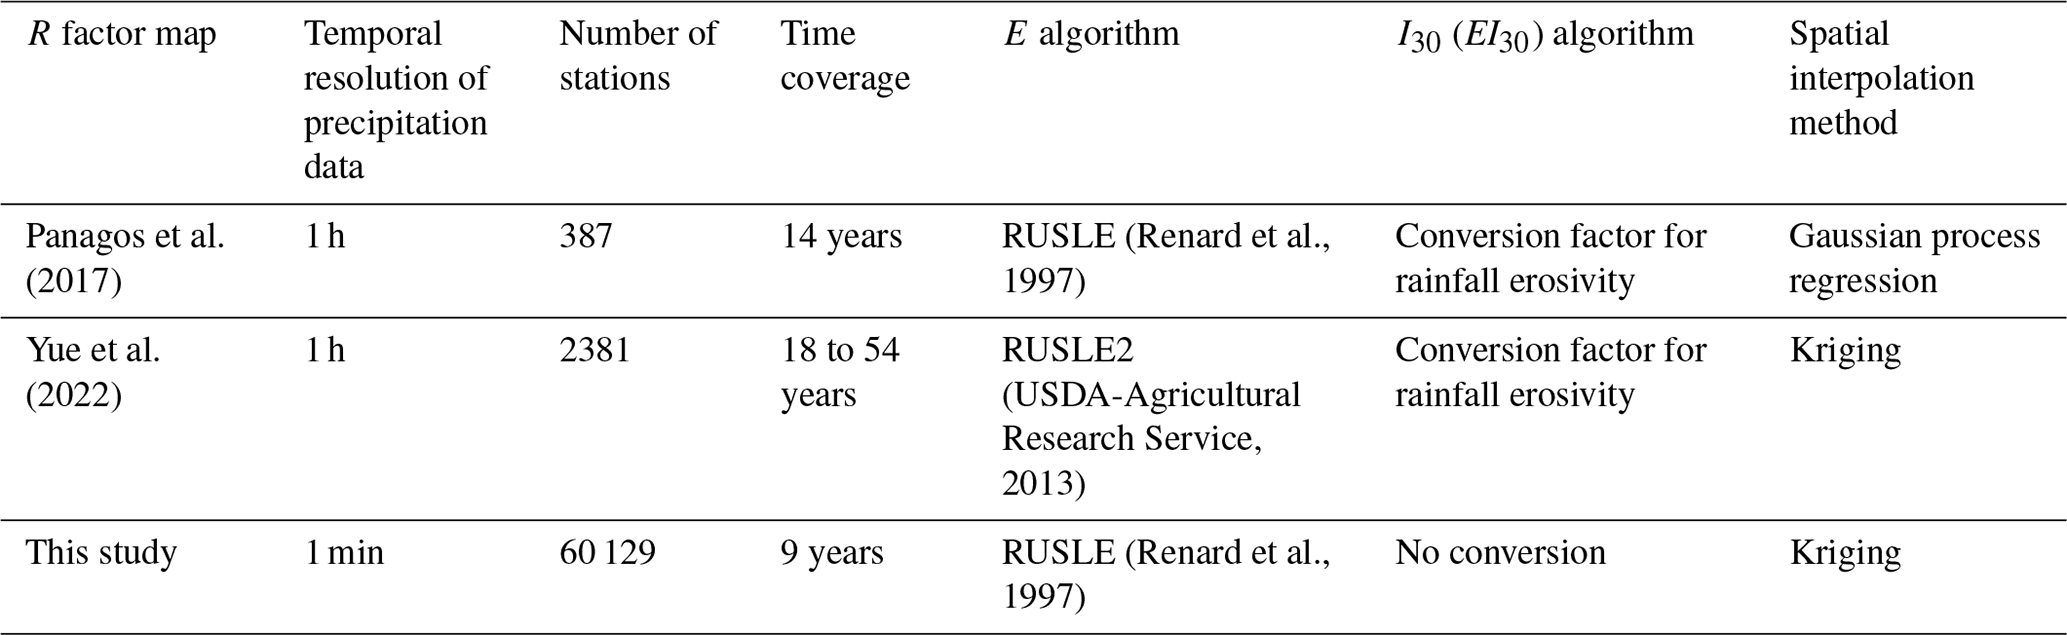
The newly developed mean annual map for mainland China, presented in the results section, is compared with previous studies. Two widely used rainfall erosivity maps from Panagos et al. (2017) and Yue et al. (2022) were selected for comparison. Panagos et al. (2017) developed the first global-scale rainfall erosivity database using hourly in situ precipitation records from 3625 stations spread across 63 countries (https://esdac.jrc.ec.europa.eu/themes/global-rainfall-erosivity, last access: 21 March 2025). The distribution of stations varies by continent, with Asia and the Middle East accounting for 1220 stations (34 % of the total) across 10 countries, including parts of Russia, China, India, and Japan. Yue et al. (2022) used hourly rainfall data from 2381 stations between 1951 and 2018 to generate a mean annual rainfall erosivity map for mainland China. This study demonstrated satisfactory performance by comparing derived values against true rainfall erosivity values calculated from 1 min rainfall data collected from 62 stations across China. In this study, the overall performance of different mean annual rainfall erosivity maps is first compared using a grid-to-grid approach. Secondly, performance by basin is also assessed. Mainland China is divided into nine basins: the Songhua and Liao River basin, Hai River basin, Huai River basin, Yellow River basin, Yangtze River basin, Pearl River basin, southeast basin, southwest basin, and continental basin (Fig. 5a; https://www.resdc.cn/data.aspx?DATAID=141, last access: 16 October 2024).
Table 1Comparison of data and methods used to generate mean annual rainfall erosivity maps.
2.2 Method for calculating rainfall erosivity
Not all rainfall processes lead to soil erosion, and it is generally believed that rainfall must exceed a certain magnitude to cause soil erosion. According to Wischmeier and Smith (1978), a continuous 6 h dry period without any rainfall is used to delineate individual rainfall events. If rainfall is interrupted for more than 6 h, subsequent rainfall is considered a separate event. Erosive rainfall events are defined as those with precipitation exceeding 12 mm (Xie et al., 2000). The rainfall erosivity (EI30) of an erosive rainfall event is calculated according to the method proposed by Brown and Foster (1987), as recommended in RUSLE:
where E (MJ ha−1) is the total energy of the erosive event, and revent (MJ mm ha−1 h−1) is the event rainfall erosivity. For 1 min in situ precipitation data, ir (mm h−1) is the rainfall intensity for the rth minute, er (MJ ha−1 mm−1) is the unit energy for the rth minute, Pr (mm) is the rainfall amount for the rth minute, n is the rainfall duration in minutes, and I30 (mm h−1) is the maximum contiguous 30 min peak intensity.
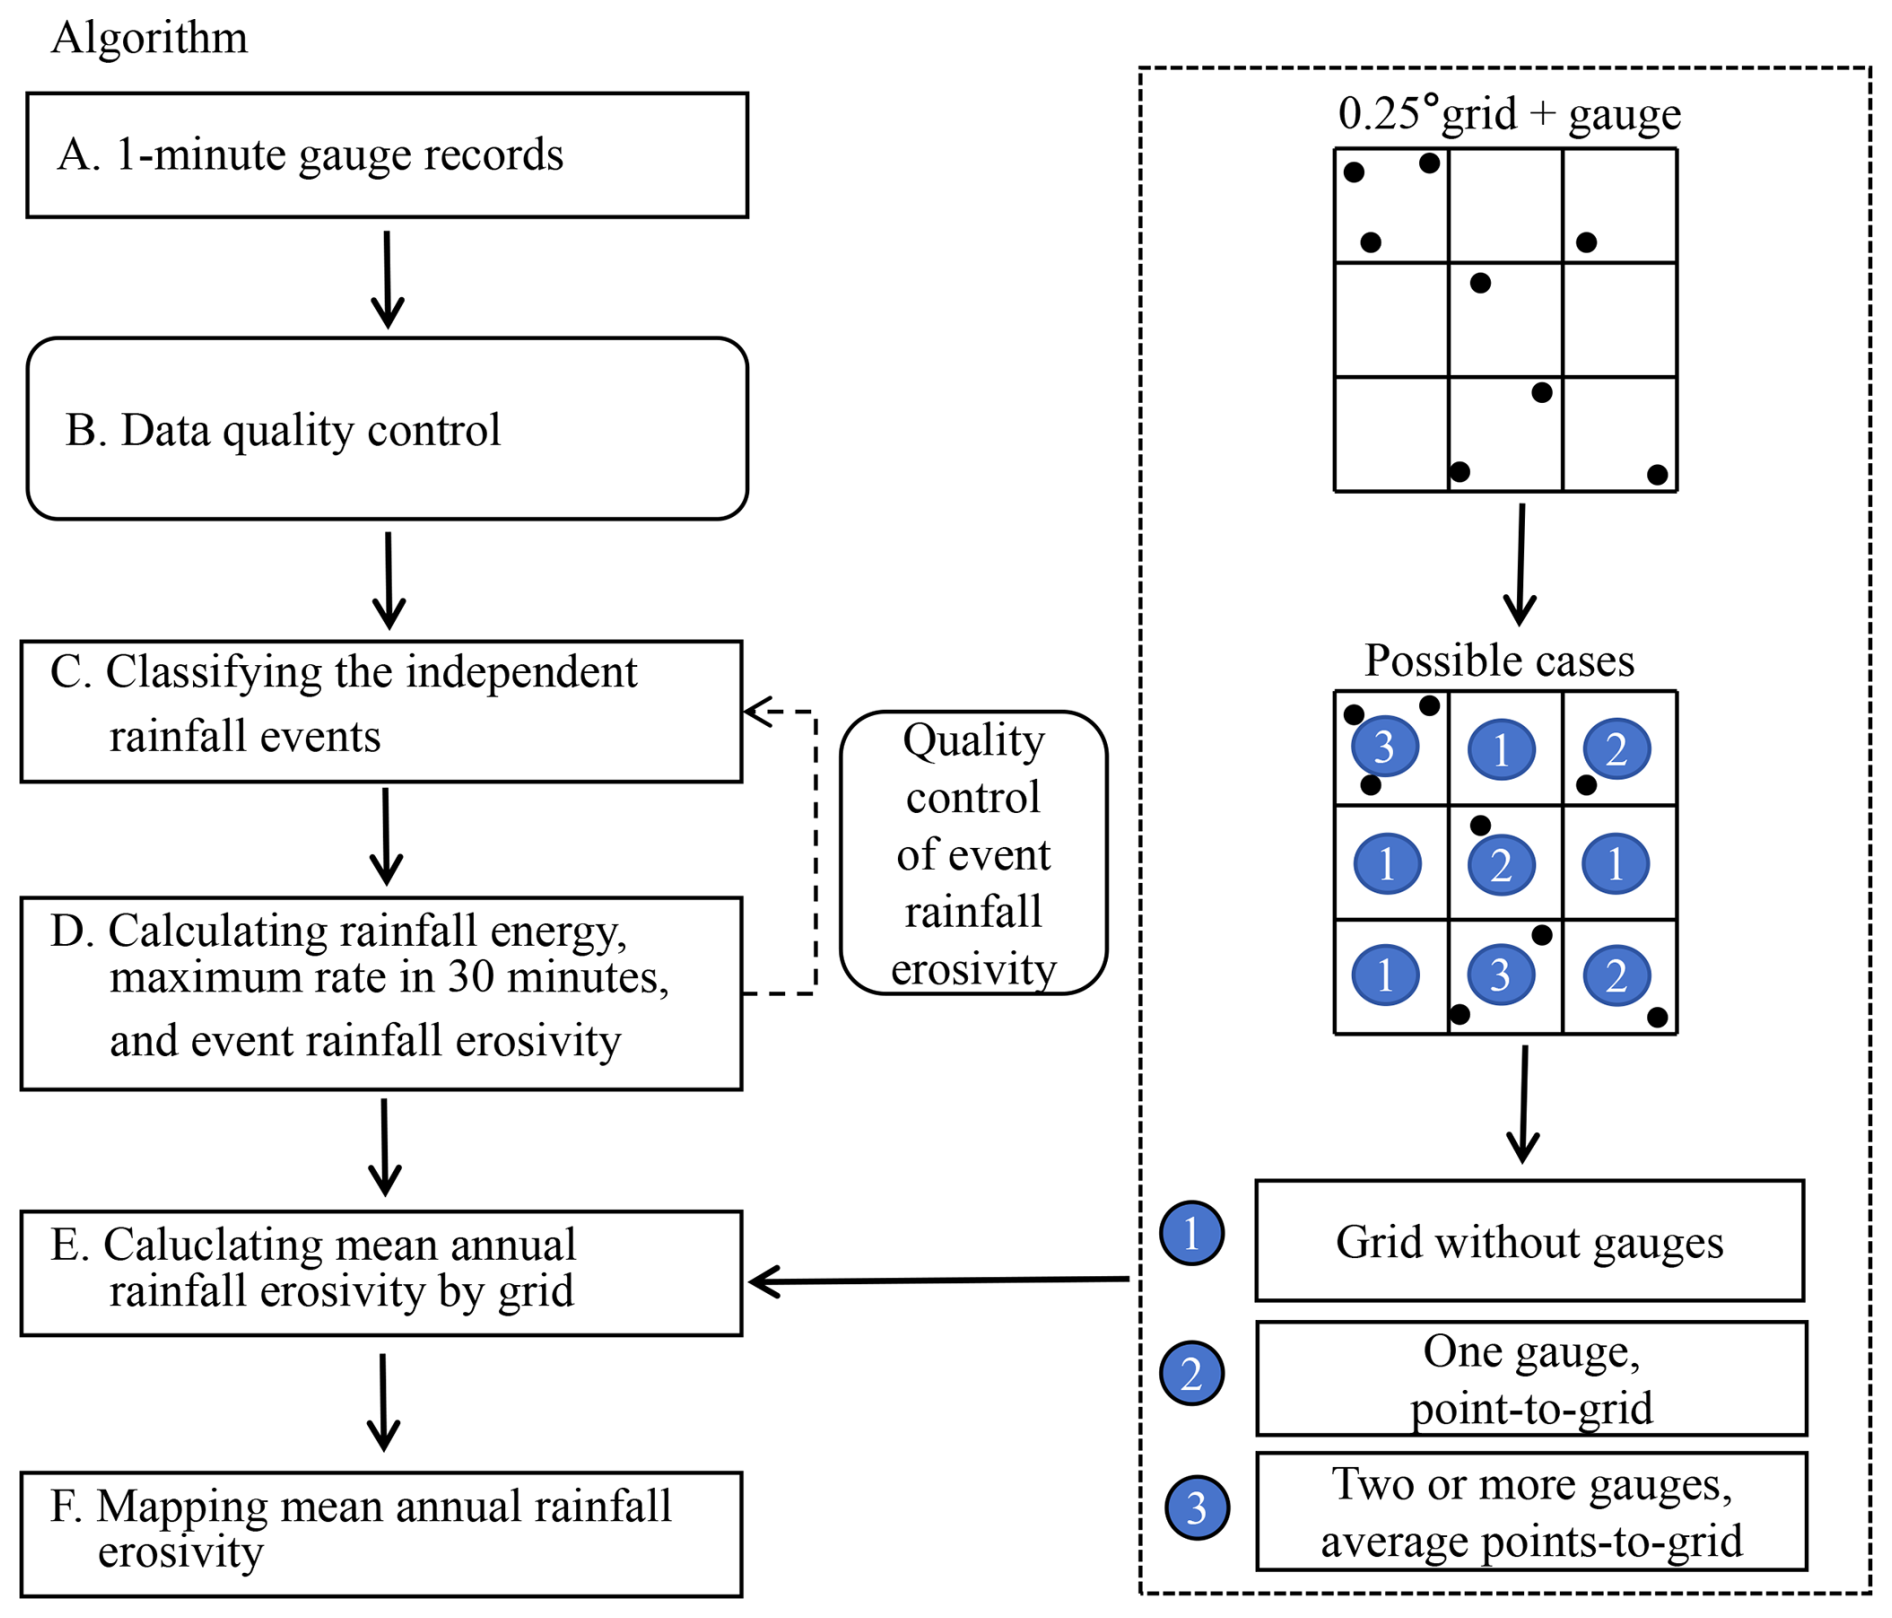
To address occasional observation errors, particularly in low-temperature environments, a quality check was conducted on the calculated event rainfall erosivity. For each station, the nearest 100 stations were selected, and the recorded events at these 101 stations were categorized into two classifications: those occurring during the warm season (April to October) and those during the cold season (including months from January to March and November to December). The median and standard deviation of event rainfall erosivity were computed separately for both seasons. The threshold value for each station was defined as the median plus 3 times the standard deviation. Any event rainfall erosivity exceeding the threshold for the respective season was considered an outlier and excluded from the annual rainfall erosivity calculation. Ultimately, annual mean rainfall erosivity at each station was aggregated using quality-checked event rainfall erosivity values. The mean annual rainfall erosivity for a grid represents the multi-station averaged value. The overall algorithm for mapping mean annual rainfall erosivity in mainland China is shown in Fig. 2.
3.1 Rainfall erosivity map
Using the methodology described in Sect. 2.2, the rainfall erosivity of erosive rainfall events was calculated for 60 129 stations across mainland China from 2014 to 2022 (Chen, 2024). The mean annual rainfall erosivity for each station was subsequently obtained, and gridded mean annual rainfall erosivity values were determined at a spatial resolution of 0.25°, representing the average mean annual rainfall erosivity values of the stations within corresponding grids (Fig. 3). The mean annual rainfall erosivity across grids with in situ observations in mainland China is 1917 MJ mm ha−1 h−1 yr−1. Overall, the southern region of China exhibits the highest mean annual rainfall erosivity, followed by the northern region. The mean annual rainfall erosivity is lowest in the arid and semiarid areas of the northwest, as well as in the Tibetan Plateau. In the southern region, the mean annual rainfall erosivity generally exceeds 2200 MJ mm ha−1 h−1 yr−1, with the highest values observed along the southeast coast, reaching over 10 000 MJ mm ha−1 h−1 yr−1. In contrast, the mean annual rainfall erosivity in the northwest and Tibetan Plateau regions is mainly below 500 MJ mm ha−1 h−1 yr−1.
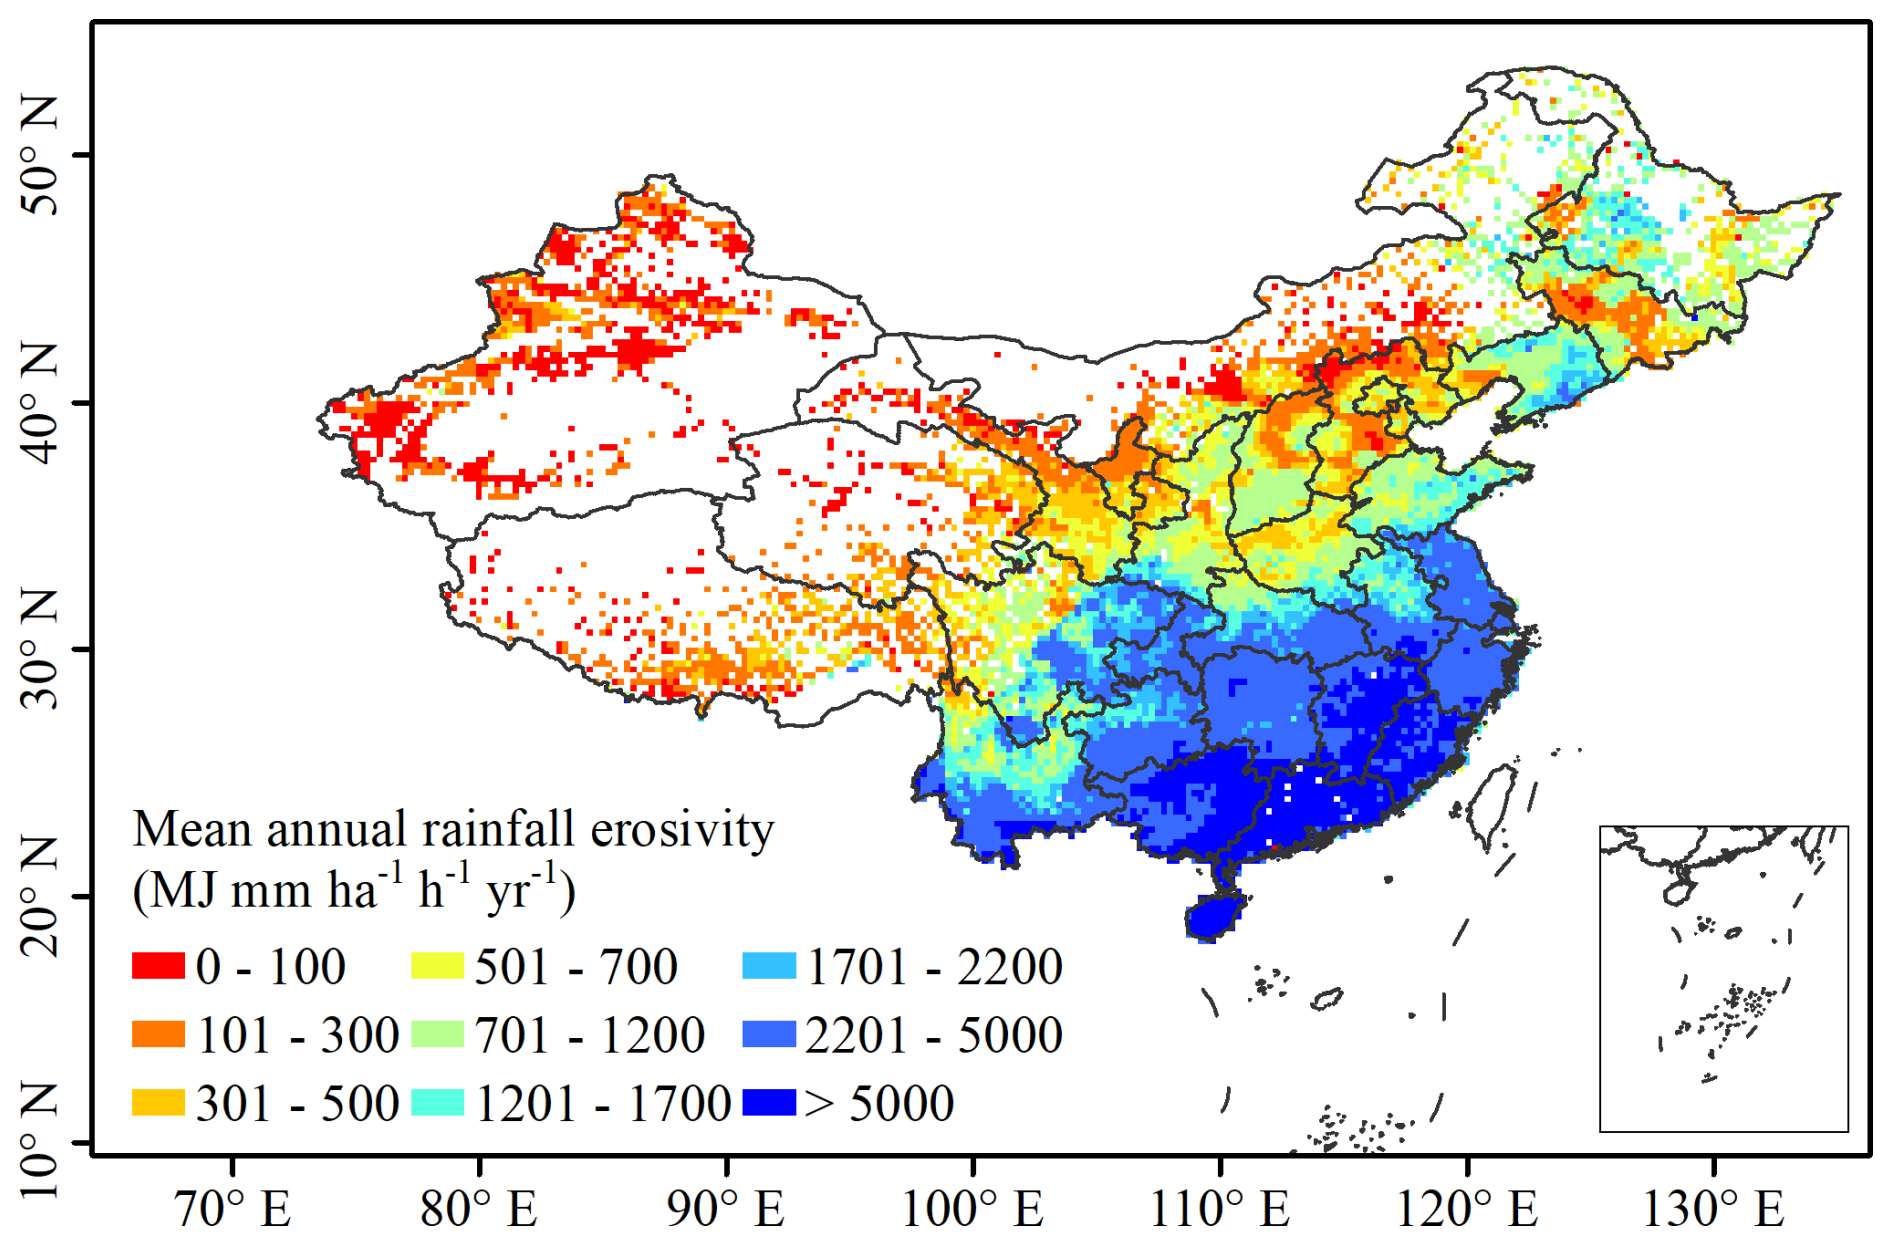
Figure 3Mean annual rainfall erosivity map in mainland China.
A spatial distribution map of the mean annual rainfall erosivity across mainland China, with a spatial resolution of 0.25°, was generated using the kriging method. Notably, large areas in the northwest and Tibetan Plateau lack ground observations, necessitating an assessment of the impact of spatial interpolation method on the accuracy of the mean annual rainfall erosivity map in these regions. Given the strong positive correlation between the annual rainfall erosivity and precipitation (Richardson et al., 1983; Renard and Freimund, 1994; Yu and Rosewell, 1996; Xie et al., 2016; Chen et al., 2024), mean gridded annual precipitation data were used to identify regions with high precipitation but no 1 min records. Figure 4a shows the spatial distribution of mean annual precipitation deriving from CMA gridded precipitation data. Most observation gaps in the northwest and Tibetan Plateau have relatively low annual precipitation, with minimal differences compared to surrounding areas with observations. However, the Dawang–Chayu area, located in the southern part of the Tibetan Plateau near the Yarlung Zangbo River grand canyon, is an exception. Precipitation in this region is primarily influenced by the southwest monsoon, which brings warm and humid airflow to the Tibetan Plateau (Chen et al., 2023a). The observed mean annual precipitation here exceeds 1800 mm, significantly higher than that in surrounding areas. Therefore, extrapolating rainfall erosivity from surrounding stations for this area is not reasonable.
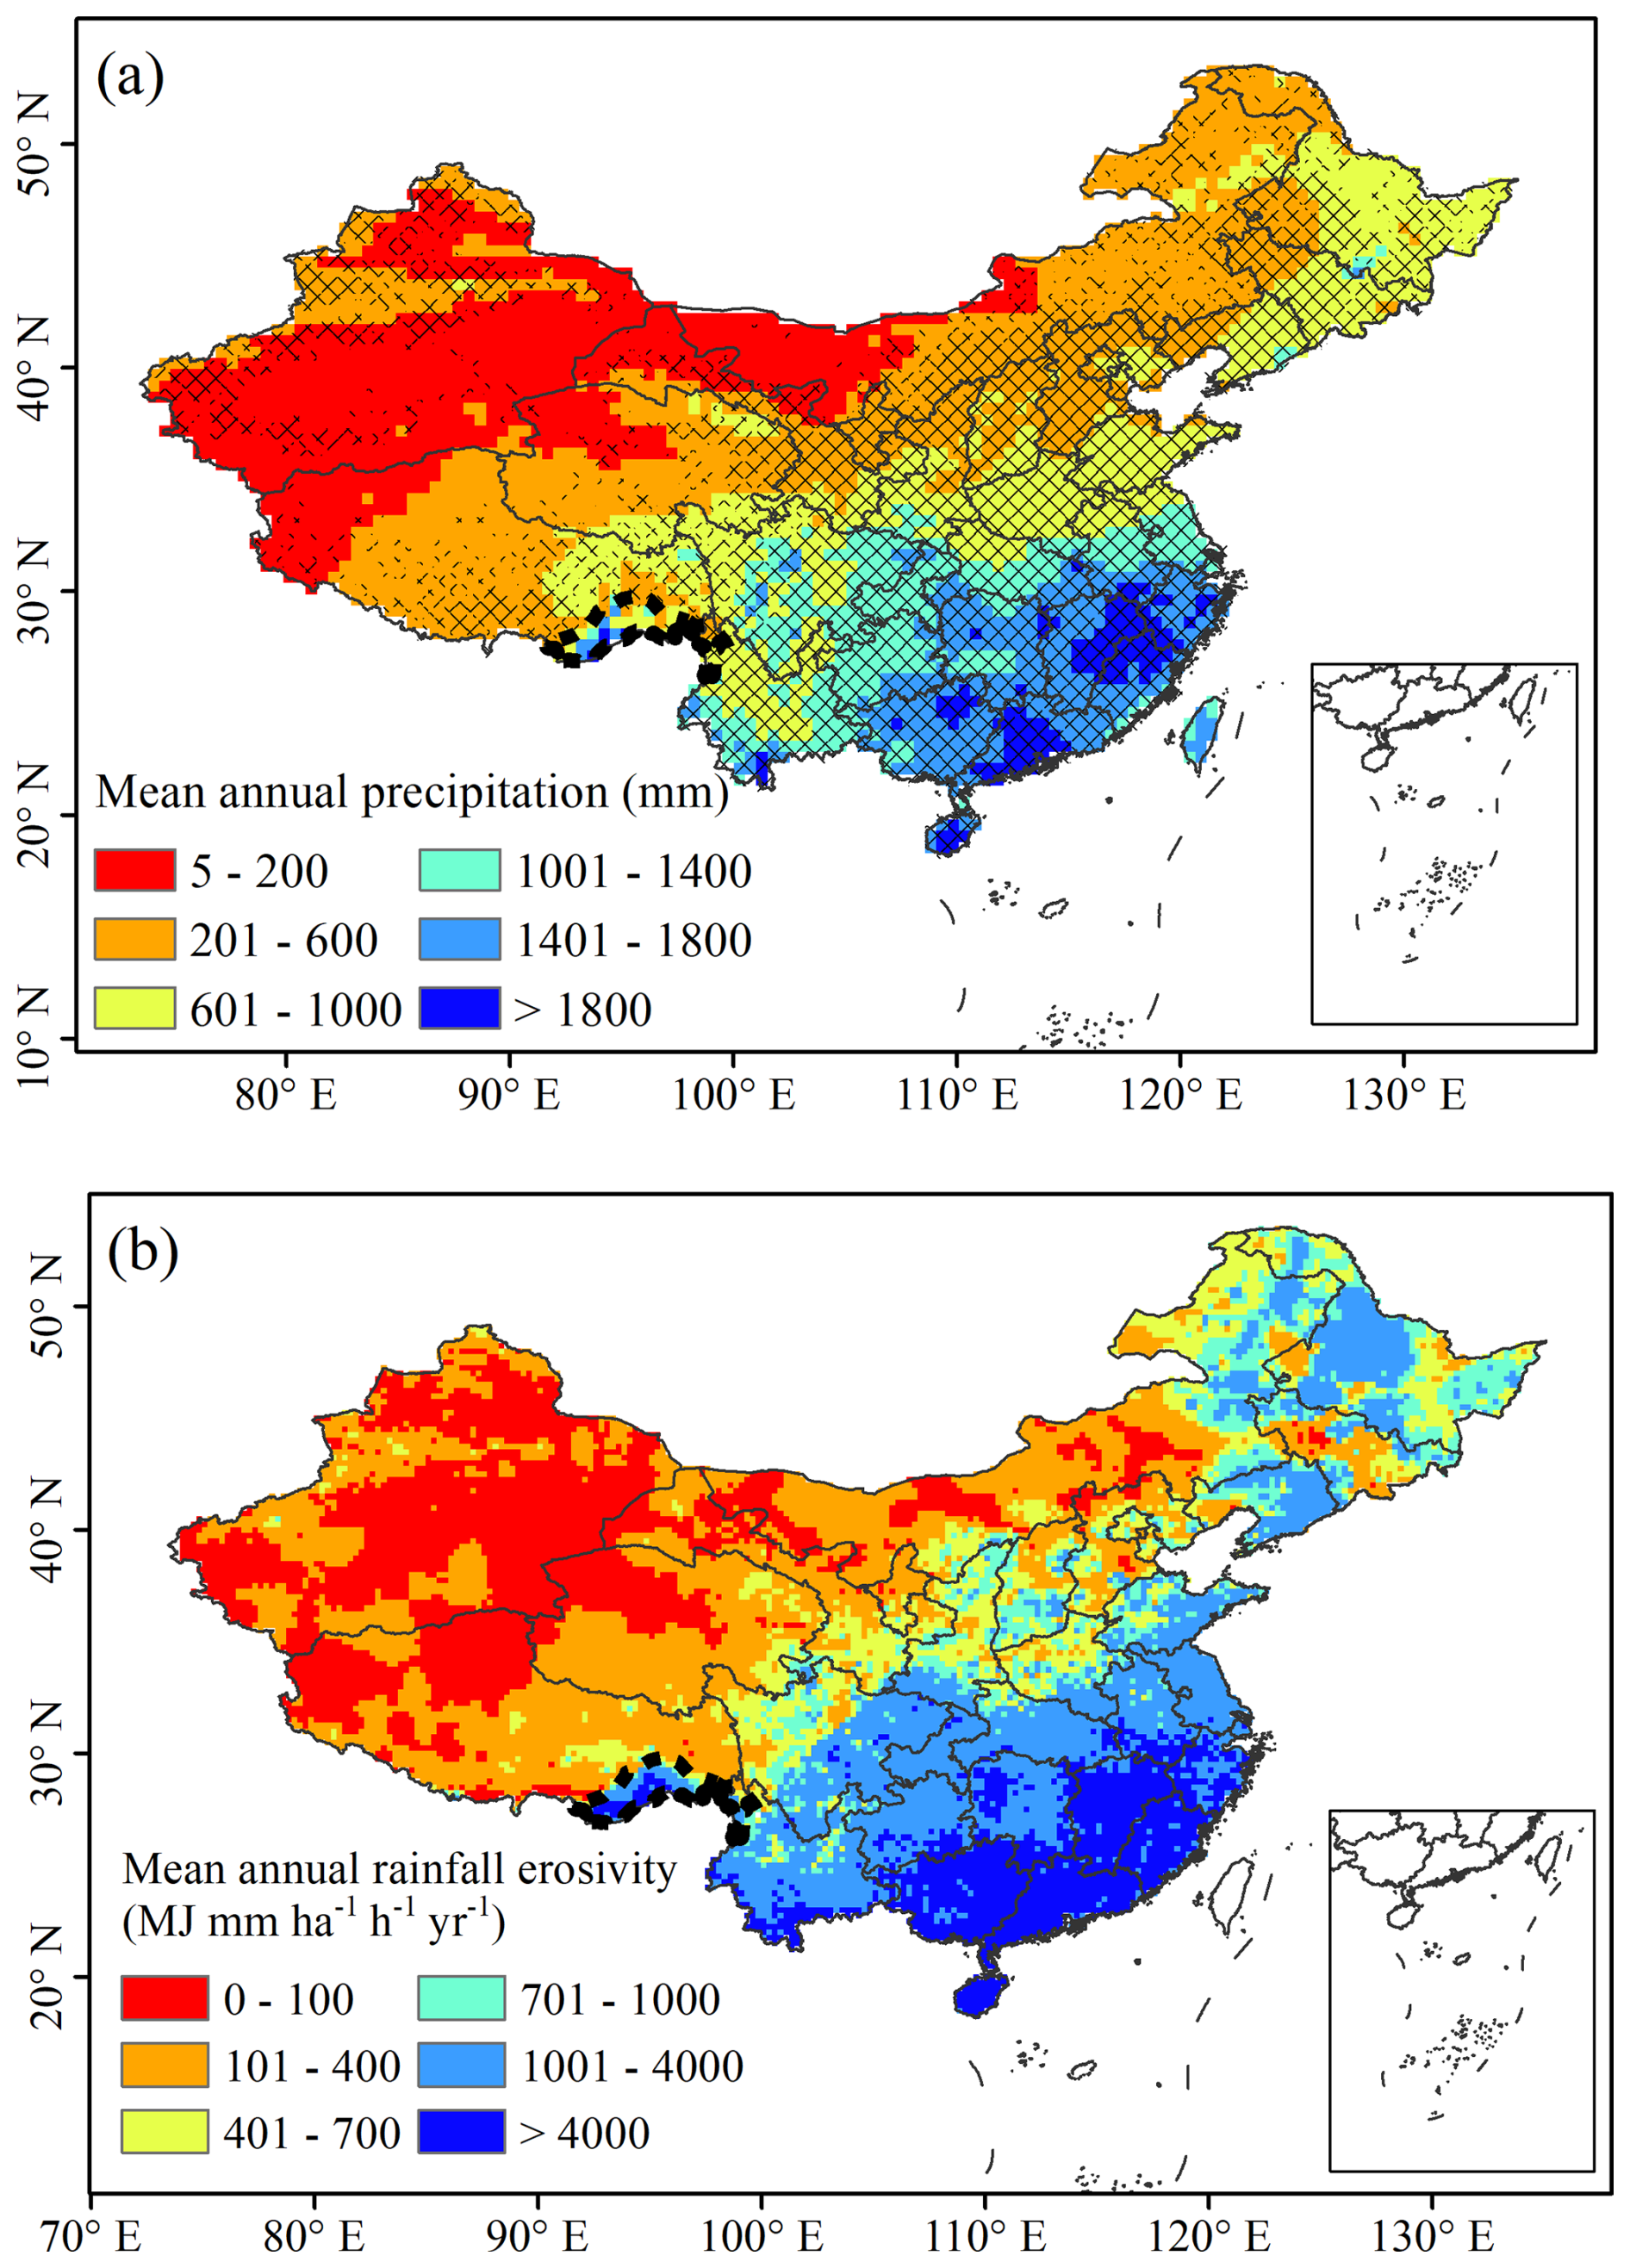
Figure 4(a) Spatial distribution of mean annual precipitation in China. Grids without crossed diagonal lines indicate areas without station records. The dashed black line marks the Dawang–Chayu region. (b) Spatial distribution of mean annual rainfall erosivity across mainland China.
To address this, hourly ERA5 reanalysis precipitation data, combined with in situ precipitation records, were used to generate a gridded dataset of annual rainfall erosivity for the Tibetan Plateau from 1950 to 2020 (Chen, 2021; Chen et al., 2022). The mean annual rainfall erosivity for the Dawang–Chayu area from 2014 to 2022 was obtained form this dataset instead of relying on direct interpolation. Figure 4b shows the integrated mean annual rainfall erosivity map for mainland China. Generally, the mean rainfall erosivity in mainland China exhibits a decreasing trend from southeast to northwest, with an overall average value of 1241 MJ mm ha−1 h−1 yr−1.
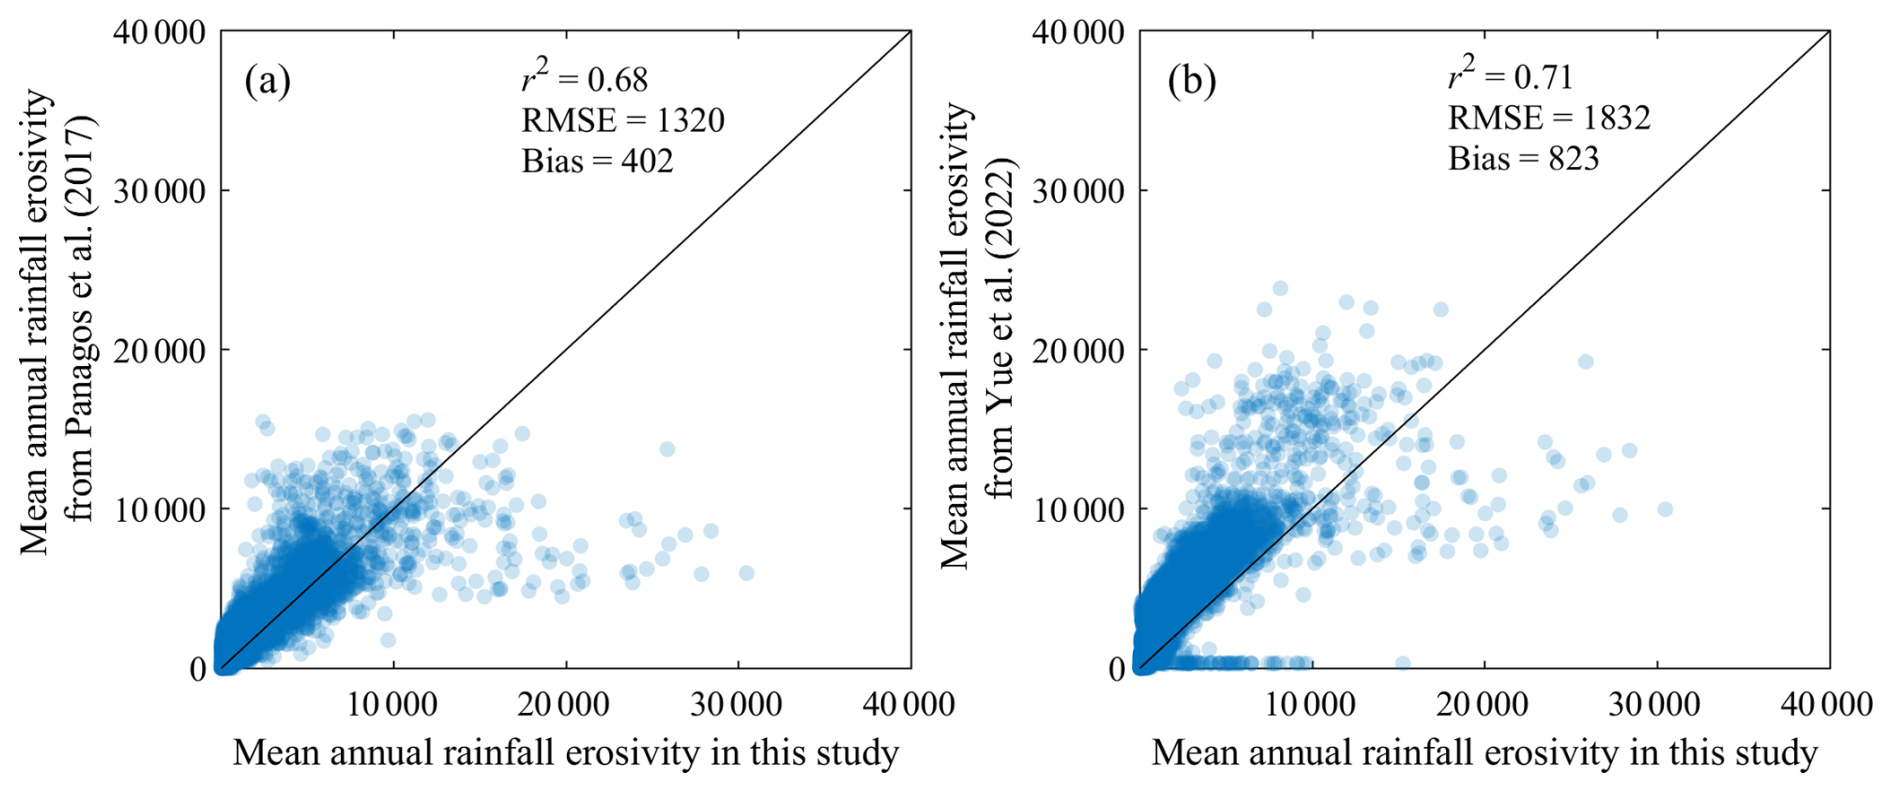
Figure 5Comparisons between the newly developed mean annual rainfall erosivity map and existing maps (Panagos et al., 2017; Yue et al., 2022) (unit: MJ mm ha−1 h−1 yr−1).
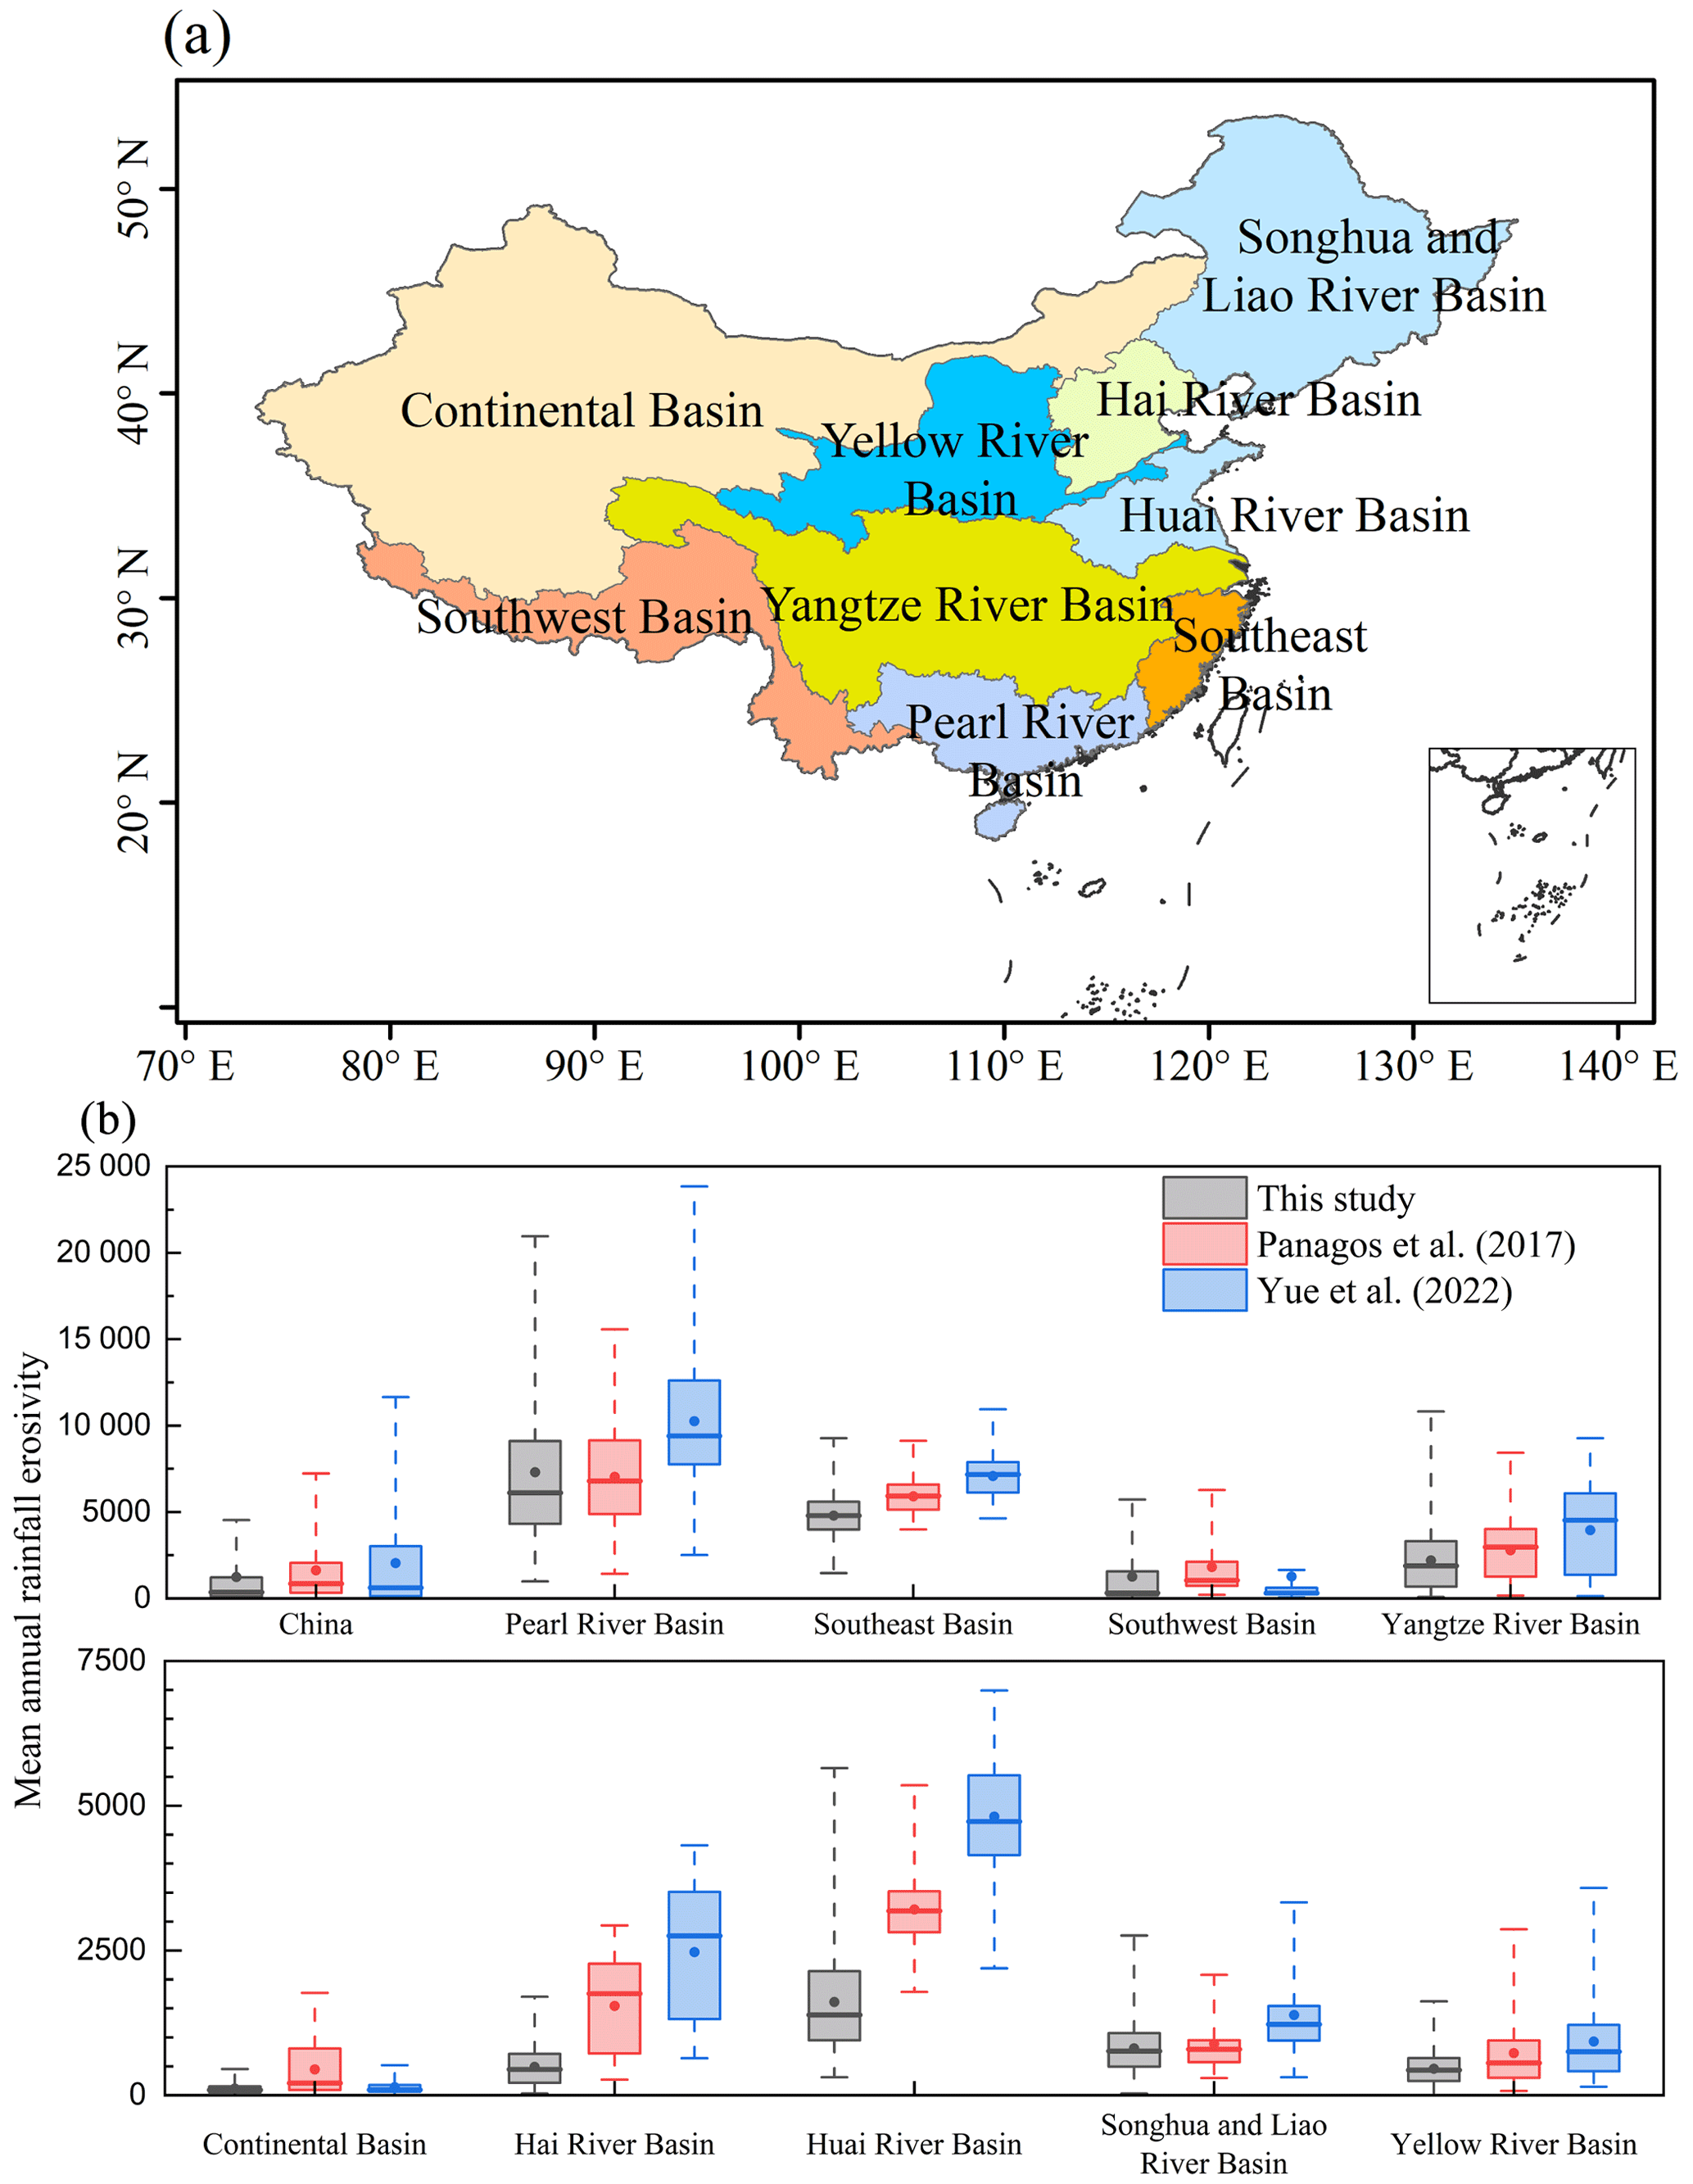
Figure 6(a) The nine basins in China and (b) boxplots of mean annual rainfall erosivity across basins (unit: MJ mm ha−1 h−1 yr−1). Grey, red, and blue boxes represent different mean annual rainfall erosivity maps from this study, Panagos et al. (2017), and Yue et al. (2022), respectively.
3.2 Comparison with previous studies
The newly generated mean annual rainfall erosivity map for mainland China is compared with the widely used maps from Panagos et al. (2017) and Yue et al. (2022). Compared to the map developed by Panagos et al. (2017), there is a good correlation in regions with mean annual rainfall erosivity below 10 000 MJ mm ha−1 h−1 yr−1. However, in areas with annual rainfall erosivity exceeding 10 000 MJ mm ha−1 h−1 yr−1, our estimates are significantly higher (Fig. 5a). When compared with the map by Yue et al. (2022), the overall correlation is good with annual rainfall erosivity less than 10 000 MJ mm ha−1 h−1 yr−1. In regions with mean annual rainfall erosivity exceeding 10 000 MJ mm ha−1 h−1 yr−1, the differences are larger, but no clear pattern is observed (Fig. 5b). In summary, our results correlate well with existing studies in areas with lower mean annual rainfall erosivity but show significant differences in high-erosivity areas.
A further comparison was conducted across the nine river basins in China (Fig. 6). The Hai and Huai river basins show the largest differences in mean and median mean annual rainfall erosivity values among the three datasets. Although some differences in performance are observed between basins, no consistent pattern emerges. These discrepancies primarily stem from variations in spatial and temporal resolution of the precipitation data and the algorithms used (Table 1). The algorithms in these studies are based on recommendations from RUSLE and RUSLE2. The E calculations of RUSLE are approximately 12 % lower than those from RUSLE2 for precipitation intensities below 35 mm h−1 but 2 % higher for intensities above 100 mm h−1 (Nearing et al., 2017). Regarding I30, 1 h precipitation data cannot accurately capture this value. Unlike other studies, this research utilized the largest set of in situ precipitation records but over a shorter time coverage. Since the R factor typically describes the potential of precipitation to cause erosion over a long-term climate scale, ideally spanning 20 years (Renard et al., 1997), using short-term data may introduce bias. Ayat et al. (2022) reported an increasing trend of extreme subhourly rainfall near Sydney, Australia, over the last 2 decades, though no similar evidence exists for hourly or daily scales. However, trends in extreme subhourly rainfall over mainland China remain unclear. This study provides the mean annual rainfall erosivity map for the past decade, acknowledging potential biases, particularly in the context of climate change.
Variations in rainfall erosivity data and algorithms are the primary reasons for discrepancies in rainfall erosivity estimation. In this section, E values for erosive precipitation events are calculated using the kinetic energy methods from RUSLE and RUSLE2, evaluating how different kinetic energy algorithms affect rainfall erosivity estimation. To assess the impact of temporal resolution of precipitation data on the accuracy of I30, I30 values for erosive rainfall events were calculated using precipitation data at different temporal resolutions (1 min vs. 1 h). A total of 300 stations across China were randomly selected, using minute-level and hour-level precipitation data from 2020–2022 for comparison.
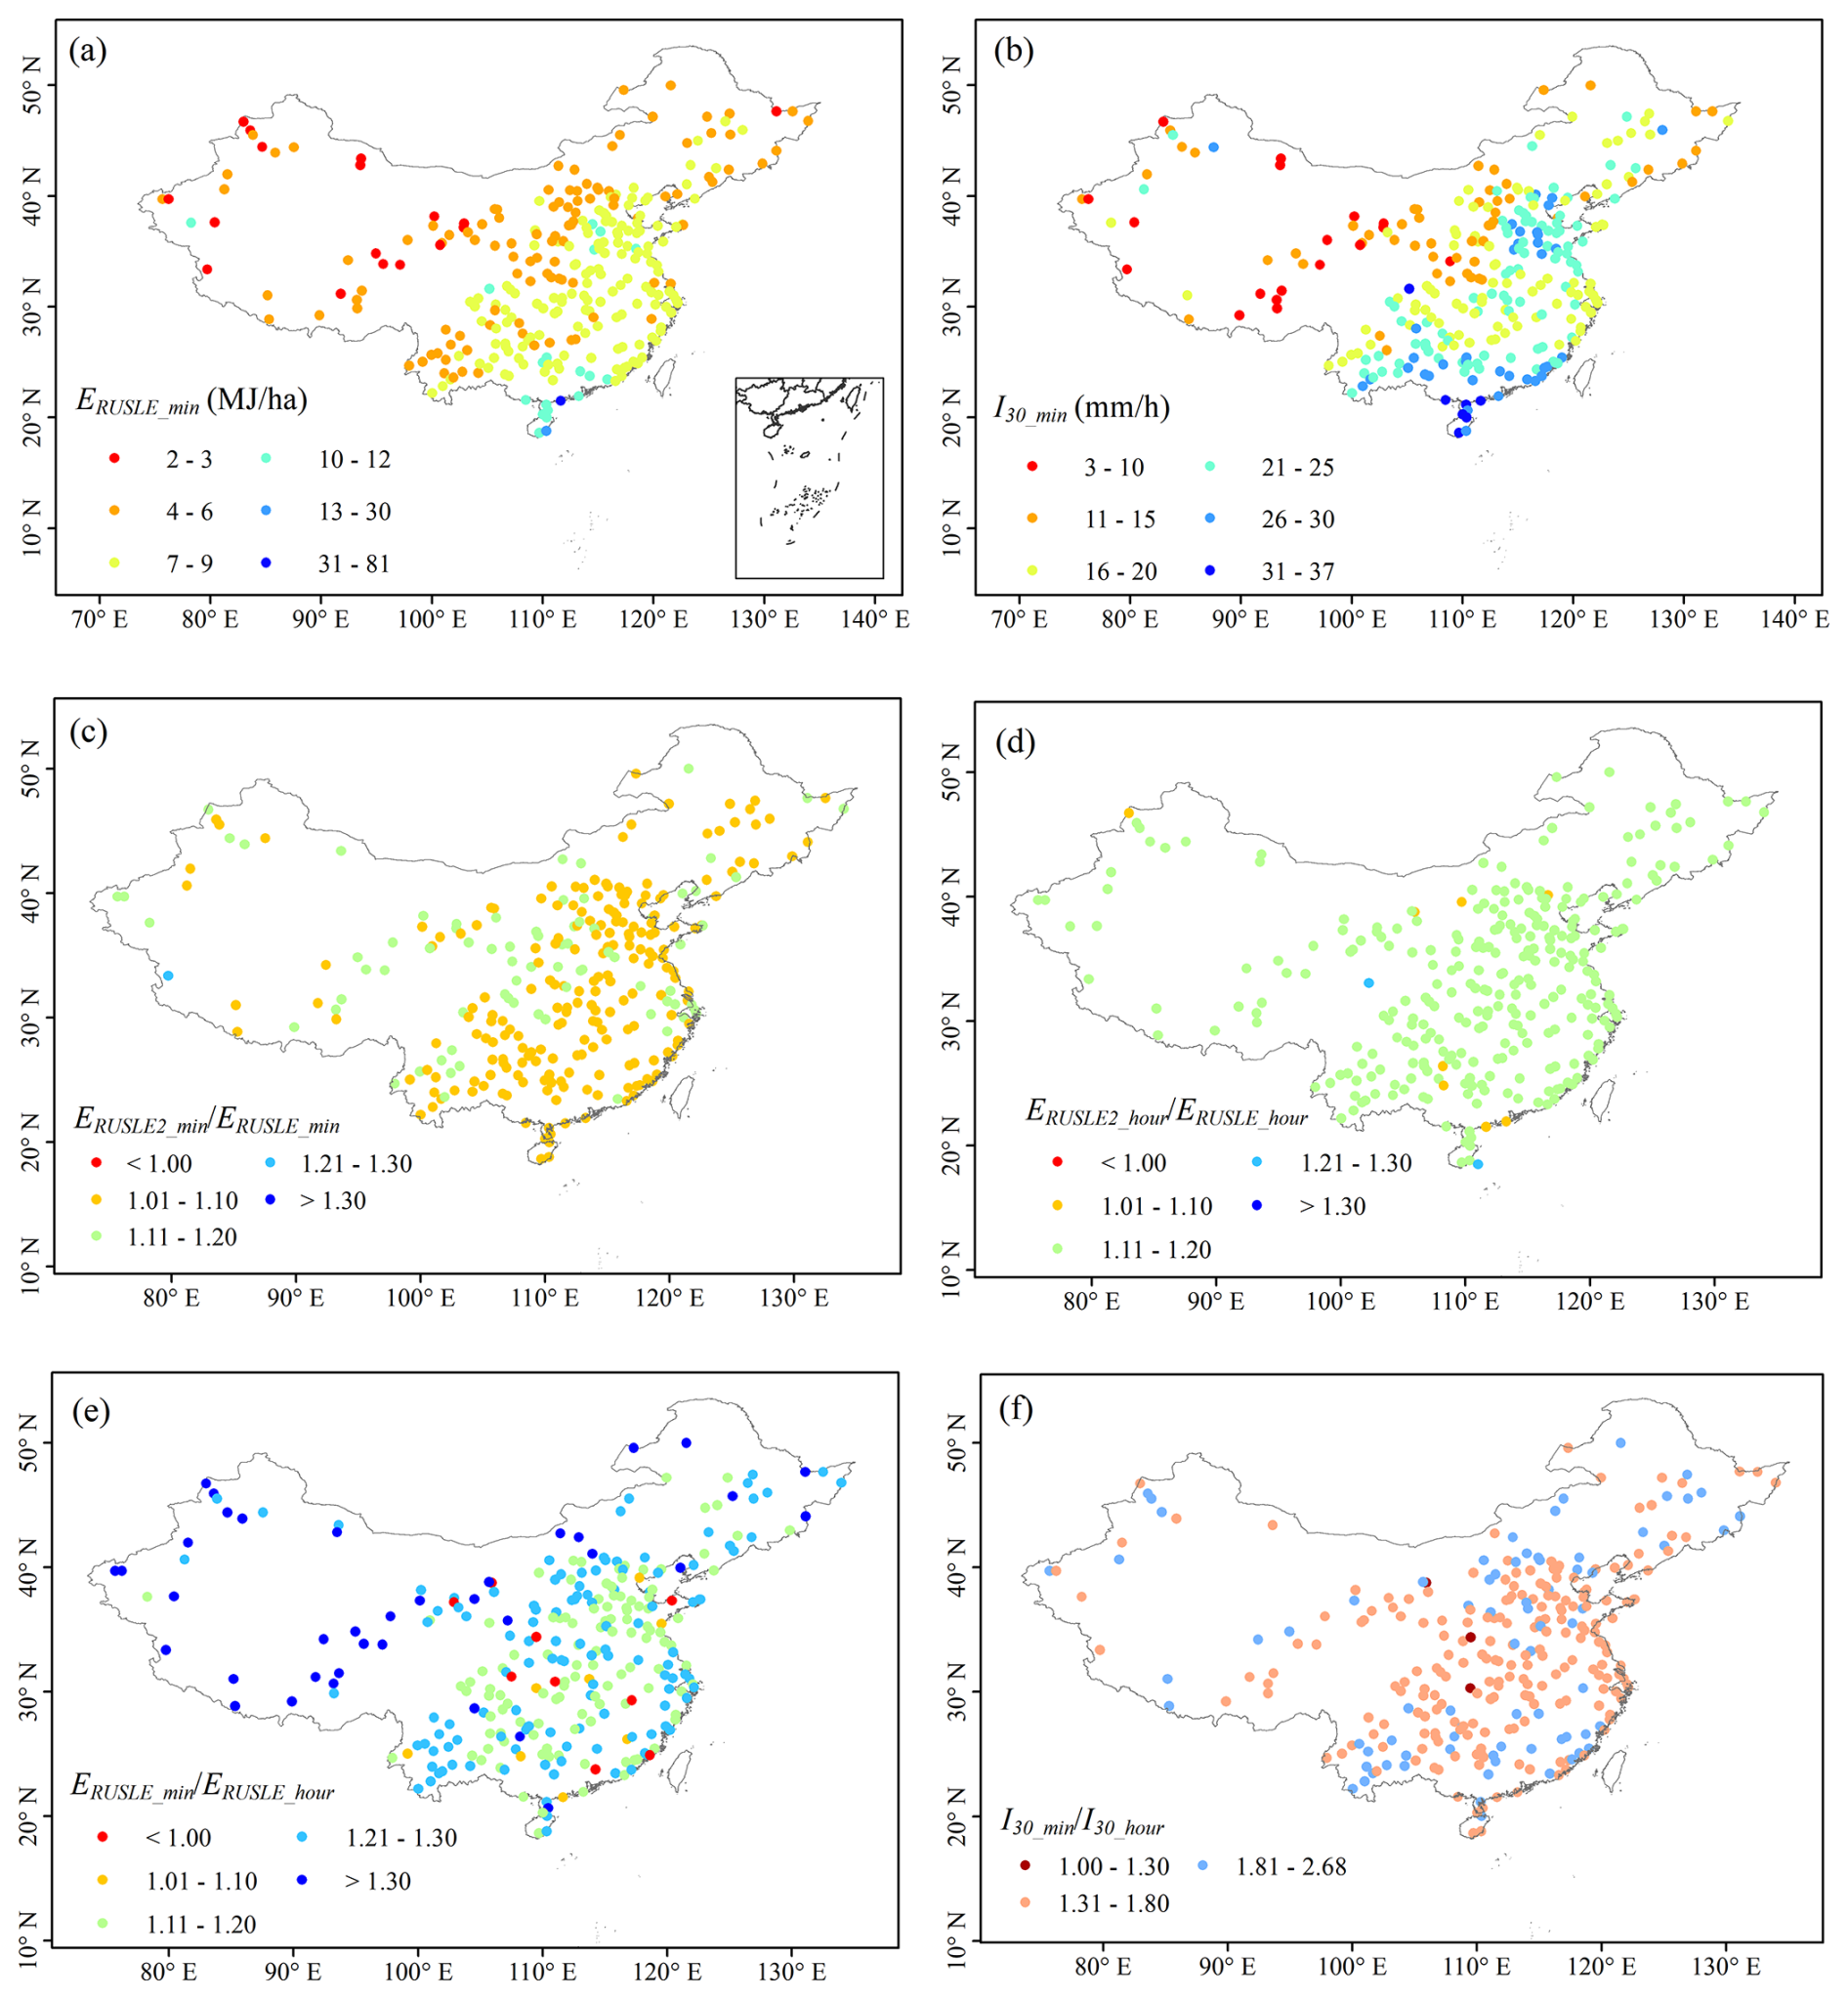
Figure 7Spatial distribution of (a) mean kinetic energy (E) and (b) maximum 30 min rainfall intensity (I30) of erosive rainfall events during 2020–2022. (c) Ratio of E calculated using RUSLE and RUSLE2 methods based on 1 min precipitation data. (d) Same as (c) but for 1 h data. (e) Ratio of E calculated using the RUSLE method for 1 min vs. 1 h data. (f) I30 calculated using 1 min vs. 1 h data. The subscript “min” indicates results based on 1 min data, while “hour” refers to 1 h data. Subscripts “RUSLE” and “RUSLE2” indicate the methods used to estimate E.
Figure 7a and b show the mean E and I30 for erosive rainfall events across mainland China during 2020–2022. The mean event E value is 6.2 MJ ha−1, ranging from 1.8 to 81.4 MJ ha−1, and shows a decreasing trend from southeast to northwest. The mean event I30 value is 18.9 mm h−1, ranging from 3.0 to 34.9 mm h−1, with two notable centers in the southern and central parts of China (Beijing–Tianjin–Hebei region; Shanxi, Henan, and Shandong provinces). Next, the differences between E computation using RUSLE and RUSLE2 were analyzed. For minute-level data, the ratio of the average event kinetic energy computed using RUSLE2 to RUSLE is approximately 1.09, while it is 1.15 for hourly data (Fig. 7c and d). The analysis was further extended to assess the impact of temporal resolution on E and I30 calculations. Based on RUSLE's kinetic energy algorithm, results show that values computed from minute-level data are 1.21 times higher than those from hourly data, with more significant differences in the northwest (Fig. 7e). The impact on I30 is even more pronounced, with minute-level data yielding values 1.72 times higher than those from hourly data (Fig. 7f). This analysis highlights that I30 values exceed E at a national scale and are more sensitive to both temporal resolution of precipitation data and algorithm selection. Accurate computation of I30 is therefore essential for reliable rainfall erosivity estimation, underscoring the importance of high-temporal-resolution data in achieving precise rainfall erosivity estimates.
The dataset is available from the National Tibetan Plateau/Third Pole Environment Data Center (https://doi.org/10.11888/Terre.tpdc.301206; Chen, 2024).
The rainfall erosivity of individual rainfall events is determined by two parameters: the E and I30. High-spatiotemporal-resolution ground precipitation data provide the most accurate calculations for both E and I30, resulting in the most reliable rainfall erosivity estimates. Accordingly, this study used nearly 10 years of 1 min in situ precipitation data from 60 129 stations to estimate the mean annual rainfall erosivity across mainland China. The main findings are as follows:
-
The mean annual rainfall erosivity across mainland China shows significant spatial variability, with a regional average of approximately 1241 MJ mm ha−1 h−1 yr−1.
-
Compared to previous studies, this newly released dataset presents lower mean annual rainfall erosivity values across mainland China by 31 %–65 %, with significant differences across various river basins.
-
With current technology, the accuracy of determining I30 during erosive rainfall events is much lower than that of E. The main source of deviation in rainfall erosivity estimation is the uncertainty in I30.
This newly developed dataset, based on high-resolution ground precipitation observations from the recent decade, can enhance the accuracy of soil erosion forecasting when combined with other factors in RUSLE or RUSLE2, such as newly released K factor maps (Gupta et al., 2024) and cover-management factors. Furthermore, rainfall erosivity can be viewed as a characteristic of rainfall events, offering spatial insights into precipitation-induced disasters in China.
The supplement related to this article is available online at https://doi.org/10.5194/essd-17-1265-2025-supplement.
YC designed the study and wrote the manuscript. YX contributed to the methodology. XD and MD contributed to the suggestions for manuscript revision.
The contact author has declared that none of the authors has any competing interests.
Publisher’s note: Copernicus Publications remains neutral with regard to jurisdictional claims made in the text, published maps, institutional affiliations, or any other geographical representation in this paper. While Copernicus Publications makes every effort to include appropriate place names, the final responsibility lies with the authors. Regarding the maps used in this paper, please note that Figs. 1, 3, 4, 6, and 7 contain disputed territories.
We are grateful to the National Meteorological Information Center for the China Meteorological Administration (http://data.cma.cn/, last access: 21 March 2025) for providing the 1 min precipitation data and the Resource and Environmental Science Data Platform for supporting the watershed data in China (https://www.resdc.cn/data.aspx?DATAID=141, last access: 21 March 2025).
This research was jointly supported by the National Natural Science Foundation of China (grant no. 42201156), the National Key Research and Development Program of China (grant no. 2021YFD1500700), and the Basic Research Fund of Chinese Academy of Meteorological Sciences (grant nos. 2023Z004, 2023Z025).
This paper was edited by Qingxiang Li and reviewed by Haicheng Zhang and two anonymous referees.
Agnese, C., Bagarello, V., Corrao, C., D'Agostino, L., and D'Asaro, F.: Influence of the rainfall measurement interval on the erosivity determinations in the Mediterranean area, J. Hydrol., 329, 39–48, https://doi.org/10.1016/j.jhydrol.2006.02.002, 2006.
Angulo-Martínez, M. and Beguería, S.: Estimating rainfall erosivity from daily precipitation records: A comparison among methods using data from the Ebro Basin (NE Spain), J. Hydrol., 379, 111–121, https://doi.org/10.1016/j.jhydrol.2009.09.051, 2009.
Ayat, H., Evans, J., Sherwood, S. C., and Soderholm, J.: Intensification of subhourly heavy rainfall, Science, 378, 655–659, https://doi.org/10.1126/science.abn8657, 2022.
Borrelli, P., Robinson, D.A., Panagos, P., Lugato, E., Yang, J. E., Alewell, C., Wuepper, D., Montanarella, L., and Ballabio, C.: Land use and climate change impacts on global soil erosion by water (2015–2070), P. Natl. Acad. Sci. USA, 117, 21994–22001, https://doi.org/10.1073/pnas.2001403117, 2020.
Brown, L. and Foster, G.: Storm erosivity using idealized intensity distributions, T. ASAE, 30, 0379–0386, https://doi.org/10.13031/2013.31957, 1987.
Carter, C. E., Greer, J. D., Braud, H. J., and Floyd, J. M.: Raindrop characteristics in south central United States, T. ASAE 17, 1033–1037, https://doi.org/10.13031/2013.37021, 1974.
Chen, Y.: A new gridded dataset of rainfall erosivity (1950–2020) in the Tibetan Plateau, National Tibetan Plateau Data Center [data set], https://doi.org/10.11888/Terre.tpdc.271833, 2021.
Chen, Y.: The rainfall erosivity in mainland China (2014–2022), National Tibetan Plateau Data Center [data set], https://doi.org/10.11888/Terre.tpdc.301206, 2024.
Chen, Y., Duan, X., Ding, M., Qi, W., Wei, T., Li, J., and Xie, Y.: New gridded dataset of rainfall erosivity (1950–2020) on the Tibetan Plateau, Earth Syst. Sci. Data, 14, 2681–2695, https://doi.org/10.5194/essd-14-2681-2022, 2022.
Chen, Y., Ding, M., Zhang, G., Wang, Y., and Li, J.: Evaluation of ERA5 Reanalysis Precipitation Data in the Yarlung Zangbo River Basin of the Tibetan Plateau, J. Hydrometeorol., 24, 1491–1507, https://doi.org/10.1175/JHM-D-22-0229.1, 2023a.
Chen, Y., Ding, M., Zhang, G., Duan, X., and Wang, C.: The possible role of fused precipitation data in detecting the spatial-temporal pattern of rainfall erosivity over the Tibetan Plateau, China, CATENA, 228, 107114, https://doi.org/10.1016/j.catena.2023.107114, 2023b.
Chen, Y. L., Wei, T., Li, J. D., Xin, Y. F., and Ding, M. H.: Future changes in global rainfall erosivity: Insights from the precipitation changes, J. Hydrol., 638, 131435, https://doi.org/10.1016/j.jhydrol.2024.131435, 2024.
Dai, Q., Zhu, J., Lv, G., Kalin, L., Yao, Y., Zhang, J., and Han, D.: Radar remote sensing reveals potential underestimation of rainfall erosivity at the global scale, Sci. Adv., 9, eadg5551, https://doi.org/10.1126/sciadv.adg5551, 2023.
Davison, P., Hutchins, M. G., Anthony, S. G., Betson, M., Johnson, C., and Lord, E. I.: The relationship between potentially erosive storm energy and daily rainfall quantity in England and Wales, Sci. Total. Environ., 344, 15–25, https://doi.org/10.1016/j.scitotenv.2005.02.002, 2005.
Diodato, N., Ljungqvist, F. C., and Bellocchi, G.: Historical predictability of rainfall erosivity: a reconstruction for monitoring extremes over Northern Italy (1500–2019), NPJ Clim. Atmos. Sci., 3, 46, https://doi.org/10.1038/s41612-020-00144-9, 2020.
FAO and ITPS: Status of the world's soil resources (SWSR) – main report, Food and agriculture Organization of the United Nations and Intergovernmental Technical Panel on soils, Rome, Italy, ISBN 978-92-5-109004-6, 2015.
Freitas, E., Coelho, V., Xuan, Y., Melo, D., Gadelha, A., Santos, E., Galvão, C., Filho, G., Barbosa, L., Huffman, G., Petersen, W., and Almeida, C.: The performance of the IMERG satellite-based product in identifying sub-daily rainfall events and their properties, J. Hydrol., 589, 125128, https://doi.org/10.1016/j.jhydrol.2020.125128, 2020.
Gupta, S., Borrelli, P., Panagos, P., and Alewell, C.: An advanced global soil erodibility (K) assessment including the effects of saturated hydraulic conductivity, Sci. Total. Environ., 908, 168249, https://doi.org/10.1016/j.scitotenv.2023.168249, 2024.
Hersbach, H., Bell, B., Berrisford, P., Horányi, A., Muñoz-Sabater, J., Nicolas, J., Radu, R., Schepers, D., Simmons, A., Soci, C., and Dee, D.: Global reanalysis: Goodbye ERA-Interim, hello ERA5, ECMWF Newsletter No. 159, https://doi.org/10.21957/vf291hehd7, 2019.
IPCC: Climate Change and Land: An IPCC Special Report on Climate Change, Desertification, Land Degradation, Sustainable Land Management, Food Security, and Greenhouse Gas Fluxes in Terrestrial Ecosystems, Cambridge University Press, Cambridge, UK and New York, NY, USA, 896 pp., https://doi.org/10.1017/9781009157988, 2019.
Kinnell, P. I. A.: Rainfall intensity-kinetic energy relationships for soil loss prediction, Soil Sci. Soc. Am. J., 45, 153–155, https://doi.org/10.2136/sssaj1981.03615995004500010033x, 1981.
Laws, J. O.: Measurements of fall-velocity of water-drops and raindrops, EOS T. Am. Geophys. Un., 22, 709–721, https://doi.org/10.1029/TR022i003p00709, 1941.
Laws, J. O. and Parsons, D. A.: The relation of raindrop size to intensity, EOS T. Am. Geophys. Un., 24, 452–460, https://doi.org/10.1029/TR024i002p00452, 1943.
Lim, Y. S., Kim, J. K., Kim, J. W., Park, B. I., and Kim, M. S.: Analysis of the Relationship between the Kinetic Energy and Intensity of Rainfall in Daejeon, Korea, Quaternary Int., 384, 107–117, https://doi.org/10.1016/j.quaint.2015.03.021, 2015.
Liu, B., Xie, Y., Li, Z., Liang, Y., Zhang, W., Fu, S., Yin, S., Wei, X., Zhang, K., Wang, Z., Liu, Y., Zhao, Y., and Guo, Q.: The assessment of soil loss by water erosion in China, Int. Soil Water Conserv., 8, 430, https://doi.org/10.1016/j.iswcr.2020.07.002, 2020.
McGuire, L. A., Ebel, B. A., Rengers, F. K., Vieira, D. C. S., and Nyman, P.: Fire effects on geomorphic processes, Nat. Rev. Earth Environ., 5, 486–503, https://doi.org/10.1038/s43017-024-00557-7, 2024.
Mineo, C., Ridolfi, E., Moccia, B., Russo, F., and Napolitano, F.: Assessment of Rainfall Kinetic-Energy-Intensity Relationships, Water, 11, 1994, https://doi.org/10.3390/w11101994, 2019.
Nearing, M. A., Yin, S., Borrelli, P., and Polyakov, V. O.: Rainfall erosivity: A historical review, CATENA, 157, 357–362, https://doi.org/10.1016/j.catena.2017.06.004, 2017.
Panagos, P., Borrelli, P., Meusburger, K., Yu, B., Klik, A., Lim, K. J., Yang, J. E, Ni, J., Miao, C., Chattopadhyay, N., Sadeghi, S. H., Hazbavi, Z., Zabihi, M., Larionov, G. A., Krasnov, S. F., Garobets, A., Levi, Y., Erpul, G., Birkel, C., Hoyos, N., Naipal, V., Oliveira, P. T. S., Bonilla, C. A., Meddi, M., Nel, W., Dashti, H., Boni, M., Diodato, N., Van, O. K., Nearing, M. A., and Ballabio, C.: Global rainfall erosivity assessment based on high-temporal resolution rainfall records, Sci. Rep., 7, 4175, https://doi.org/10.1038/s41598-017-04282-8, 2017.
Renard, K. G. and Freimund, J. R.: Using monthly precipitation data to estimate the R-factor in the revised USLE, J. Hydrol., 157, 287–306, https://doi.org/10.1016/0022-1694(94)90110-4, 1994.
Renard, K. G., Foster, G. R., Weesies, G. A., McCool, D. K., and Yoder, D. C.: Predicting Soil Erosion by Water: A Guide to Conservation Planning with the Revised Universal Soil Loss Equation (RUSLE), USDA Agricultural Handbook No. 733, USDA, Washington, DC, 384 pp., ISBN 0-16-048938-5, 1997.
Richardson, C. W., Foster, G. R., and Wright, D. A.: Estimation of Erosion Index from Daily Rainfall Amount, T. ASAE, 26, 153–156, https://doi.org/10.13031/2013.33893, 1983.
Tilg, A., Vejen, F., Hasager, C. B., and Nielsen, M.: Rainfall Kinetic Energy in Denmark: Relationship with Drop Size, Wind Speed, and Rain Rate, J. Hydrometeorol., 21, 1621–1637, https://doi.org/10.1175/JHM-D-19-0251.1, 2020.
Uijlenhoet, R. and Stricker, J. N. M.: A consistent rainfall parameterization based on the exponential raindrop size distribution, J. Hydrol., 218, 101–127, https://doi.org/10.1016/S0022-1694(99)00032-3, 1999.
USDA-Agricultural Research Service: Science documentation: Revised Universal Soil Loss Equation Version 2 (RUSLE2), USDA-Agricultural Researcher Service, Washington, D.C., 2013.
Wischmeier, W. H.: A rainfall erosion index for a universal soil loss equation, Soil Sci. Soc. Am. Proc., 23, 246–249, https://doi.org/10.2136/sssaj1959.03615995002300030027x, 1959.
Wischmeier, W. H. and Smith, D. D.: Predicting rainfall-erosion losses from cropland east of the Rocky Mountains: Guide for selection of practices for soil and water conservation, Agriculture Handbook No. 282, U.S. Department of Agriculture, Washington, D.C., 1965.
Wischmeier, W. H. and Smith, D. D.: Predicting Rainfall Erosion Losses: A Guide to Conservation Planning, Agriculture Handbook No. 537, U.S. Department of Agriculture, Washington, D.C., 1978.
Wu, S., Guo, Z., Askar, A., Li, X., Hu, Y., Li, H., and Saria, A.E.: Dynamic land cover and ecosystem service changes in global coastal deltas under future climate scenarios, Ocean Coast. Manage., 258, 107384, https://doi.org/10.1016/j.ocecoaman.2024.107384, 2024.
Xie, Y., Liu, B. Y., and Zhang, W. B.: Study on standard of erosive rainfall, J. Soil Water Conserv., 14, 6–11, https://doi.org/10.3321/j.issn:1009-2242.2000.04.002, 2000 (in Chinese).
Xie, Y., Yin, S., Liu, B., Nearing, M., and Zhao, Y.: Models for estimating daily rainfall erosivity in China, J. Hydrol., 535, 547–558, https://doi.org/10.1016/j.jhydrol.2016.02.020, 2016.
Yin, S., Xie, Y., and Wang, C.: Calculation of rainfall erosivity by using hourly rainfall data, Geogr. Res., 26, 541–547, https://www.dlyj.ac.cn/CN/10.11821/yj2007030015 (last access: 25 March 2025), 2007 (in Chinese).
Yin, S., Xie, Y., Liu, B., and Nearing, M. A.: Rainfall erosivity estimation based on rainfall data collected over a range of temporal resolutions, Hydrol. Earth Syst. Sci., 19, 4113–4126, https://doi.org/10.5194/hess-19-4113-2015, 2015.
Yu, B. and Rosewell, J. C.: A Robust Estimator of the R-factor for the Universal Soil Loss Equation, T. ASABE, 39, 559–561, https://doi.org/10.13031/2013.27535, 1996.
Yue, T., Yin, S., Xie, Y., Yu, B., and Liu, B.: Rainfall erosivity mapping over mainland China based on high-density hourly rainfall records, Earth Syst. Sci. Data, 14, 665–682, https://doi.org/10.5194/essd-14-665-2022, 2022.