the Creative Commons Attribution 4.0 License.
the Creative Commons Attribution 4.0 License.
 | 21 Feb 2024
High-resolution digital outcrop model of the faults, fractures, and stratigraphy of the Agardhfjellet Formation cap rock shales at Konusdalen West, central Spitsbergen
Peter Betlem
Thomas Birchall
Gareth Lord
Simon Oldfield
Lise Nakken
Kei Ogata
Kim Senger
Structure-from-motion (SfM) photogrammetry has become an important tool for the digitalisation of outcrops as digital outcrop models (DOMs). DOMs facilitate the mapping of stratigraphy and discontinuous structures like folds, faults, and fractures from the centimetre to kilometre scale. With pristine, treeless exposures, the outcropping strata in Svalbard, Arctic Norway, hold exceptional potential for analogue studies and are ideally suited for the acquisition of high-resolution DOMs. Here, we present the acquisition, processing, and integration of the Konusdalen West digital model data set, comprising both DOM and derived digital terrain model (DTM) data. Drone-based image acquisition took place over 2 weeks in July and August 2020. The Konusdalen West DOM and DTM cover a 0.12 km2 area and span a 170 m elevation difference. The DOM covers the upper two-thirds of the mudstone-dominated Late Jurassic–Early Cretaceous Agardhfjellet Formation. The Agardhfjellet Formation and its time equivalents are regional cap rocks for CO2 sequestration and petroleum accumulations on the Norwegian Continental Shelf. A total of 15 differential GNSS control points were used to georeference and quality assure the digital data assets, 5 of which function as reference checkpoints. SfM processing of 5512 acquired images resulted in high-confidence, centimetre-scale resolution point clouds, textured mesh (DOM), tiled model, orthomosaics, and a DTM. The confidence-filtered dense cloud features an average inter-point distance of 1.57 cm and has an average point density of 3824.9 points per metre. The five checkpoints feature root mean square errors of 2.0 cm in X, 1.3 cm in Y, 5.2 cm in Z, and 5.7 cm in XYZ. Increased confidences and densities are present along the western flank of the Konusdalen West outcrop, where a fault fracture network in mudstone-dominated strata is best exposed and photographed most extensively. Top and side view orthomosaics feature maximum resolutions of 8 mm per pixel, enabling the mapping of faults, formation members, marker beds, fractures, and other sub-centimetre features. Additional structural measurements and observations were taken in June 2021 to place the data in the geological context. Data described in this paper can be accessed at Norstore under https://doi.org/10.11582/2022.00027 (Betlem, 2022b).
- Article
(15978 KB) - Full-text XML
- BibTeX
- EndNote


Structure-from-motion (SfM) photogrammetry has become a cost- and time-effective tool for the digitalisation of outcrops (e.g. James et al., 2019; Westoby et al., 2012; Dering et al., 2019). SfM photogrammetry provides a means to digitally preserve outcrops and generate outcrop-truthed, georeferenced spatial data as digital outcrop models (DOMs) (Westoby et al., 2012; Burnham et al., 2022).
Outcrop analogue studies have supported subsurface developments by the petroleum industry and underground waste storage (e.g. CO2, nuclear waste, gas) for several decades (Howell et al., 2014; Marques et al., 2020). Subsurface data often suffer from non-uniqueness, i.e. loosely constrained solutions based on data that are often sparsely and unevenly distributed. In areas of good exposure, outcrop analogue studies provide high-resolution data with significantly better spatial constraints and absolute spatial scales (Vollgger and Cruden, 2016). Outcrop-based mapping of stratigraphy and structures like folds, faults, and fractures from the centimetre to kilometre scale is therefore pertinent to understanding geological processes, not least those affecting storage and sealing capacity (e.g. Ogata et al., 2014, 2012; Sibson, 1996; Vollgger and Cruden, 2016; Ogata et al., 2023; Betlem et al., 2023). Through SfM photogrammetry, outcrops can be digitalised to scale and geospatially referenced as DOMs to facilitate quantitative interpretation and integration with other spatial data sets (e.g. quantifying fracture orientation and spacing; (Senger et al., 2015; Betlem et al., 2023)).
Extensive methodological reviews on the application of SfM photogrammetry have been performed by, amongst others, Westoby et al. (2012), Smith et al. (2016), Dering et al. (2019), and James et al. (2019), often implementing unoccupied aerial vehicles (UAVs). SfM photogrammetry has been implemented to address a range of geomorphic (e.g. Leon et al., 2014; Rippin et al., 2015; Tonkin et al., 2016), sedimentary (e.g. Bilmes et al., 2019; Harrald et al., 2021), structural questions (e.g. Mulrooney et al., 2018; Vollgger and Cruden, 2016), even on other planets (e.g. Barnes et al., 2018) and in analogue (laboratory-scale) models (e.g. Donnadieu et al., 2003).
Despite the increased implementation of DOMs, most data and interpretations remain inaccessible (Vieira et al., 2021; Burnham et al., 2022). Few repositories, such as V3Geo (Buckley et al., 2022) and e-Rock (Cawood and Bond, 2019), enable the sharing of DOMs, yet they do not openly share the input data (e.g. photographs) and processing parameters, nor do they typically abide by FAIR (Findable, Accessible, Interoperable, Reproducible) principles (Wilkinson et al., 2016) for the complete data sets. The recently published Svalbox Digital Model Database (Svalbox DMDb) has taken the next step towards FAIR publishing of DOM data and implements many of the FAIR principles to provide full, open access to input, processing, and output data alike (Betlem et al., 2023). FAIR principles and open accessibility are essential for the reproducibility and re-evaluation of existing work, the application of new methodologies, future studies of temporal processes (e.g. weathering and climatic variation), and the conservation of geological sites as digital replicas (Burnham et al., 2022; Betlem et al., 2023).
This paper forms an important technical contribution to the digitalisation of outcrops as it outlines the best practices learned from the Svalbox DMDb (Betlem et al., 2023) and makes these available to the geoscientific community as a state-of-the-art example. Specifically, we present the acquisition, processing, and integration of the Konusdalen West digital model data set, including a high-resolution, georeferenced DOM and orthomosaics covering the faulted, mudstone-dominated Agardhfjellet Formation in Svalbard, Arctic Norway. Finally, we discuss data availability and provide ways to spatially interact with the digital data assets by integrating them with the Svalbox DMDb and by visualising the textured mesh through the SketchFab and V3Geo online viewers.
1.1 The study area and outcrop geology
The High Arctic archipelago of Svalbard (Fig. 1) is part of the uplifted northwestern margin on the Barents Shelf (Henriksen et al., 2011). The outcropping strata range from the Archean to Quaternary in age and offer a wide range of lithologies and tectonic settings. The strata in Svalbard have been shaped by several orogenic events, including the West Spitsbergen Fold and Thrust Belt (WSFTB) in the Paleogene. Early Cretaceous magmatism introduced a system of dykes, sills and lava flows into the stratigraphy, whilst glaciations and periglacial events over the last 100 kyr have shaped the present-day landscape and modern exposure patterns (Dallmann et al., 2015; Harland et al., 1997; Henriksen et al., 2011; Senger et al., 2014). Following the last ice advances, approximately two-thirds of the archipelago remains covered by glaciers, with the remainder affected by periglacial processes and permafrost and featuring almost no vegetation (Humlum et al., 2003).
Petroleum and coal exploration boreholes have contributed significantly to our understanding of the stratigraphic evolution of both Svalbard and the greater Barents Shelf (Senger et al., 2019). The Longyearbyen CO2 Lab drilled eight fully cored wells in central Spitsbergen to assess a heavily fractured Mesozoic reservoir and cap rock, comprising the Wilhelmøya Subgroup and Janusfjellet Subgroup, respectively. The drilling provided wire-line, stratigraphic, petrophysical, geophysical, and geochemistry data (Olaussen et al., 2019, and references therein), yet current top seal integrity remains difficult to ascertain with borehole data alone (Birchall et al., 2020; Huq et al., 2017). Geological constraints and inputs are needed to ascertain what may happen following injection. The Konusdalen West outcrop, covering the lower part of the cap rock, is ideally suited for this and forms an important analogue to assess the impact of faults and fractures on fluid flow in mudstone-dominated sequences (e.g. Ogata et al., 2012).
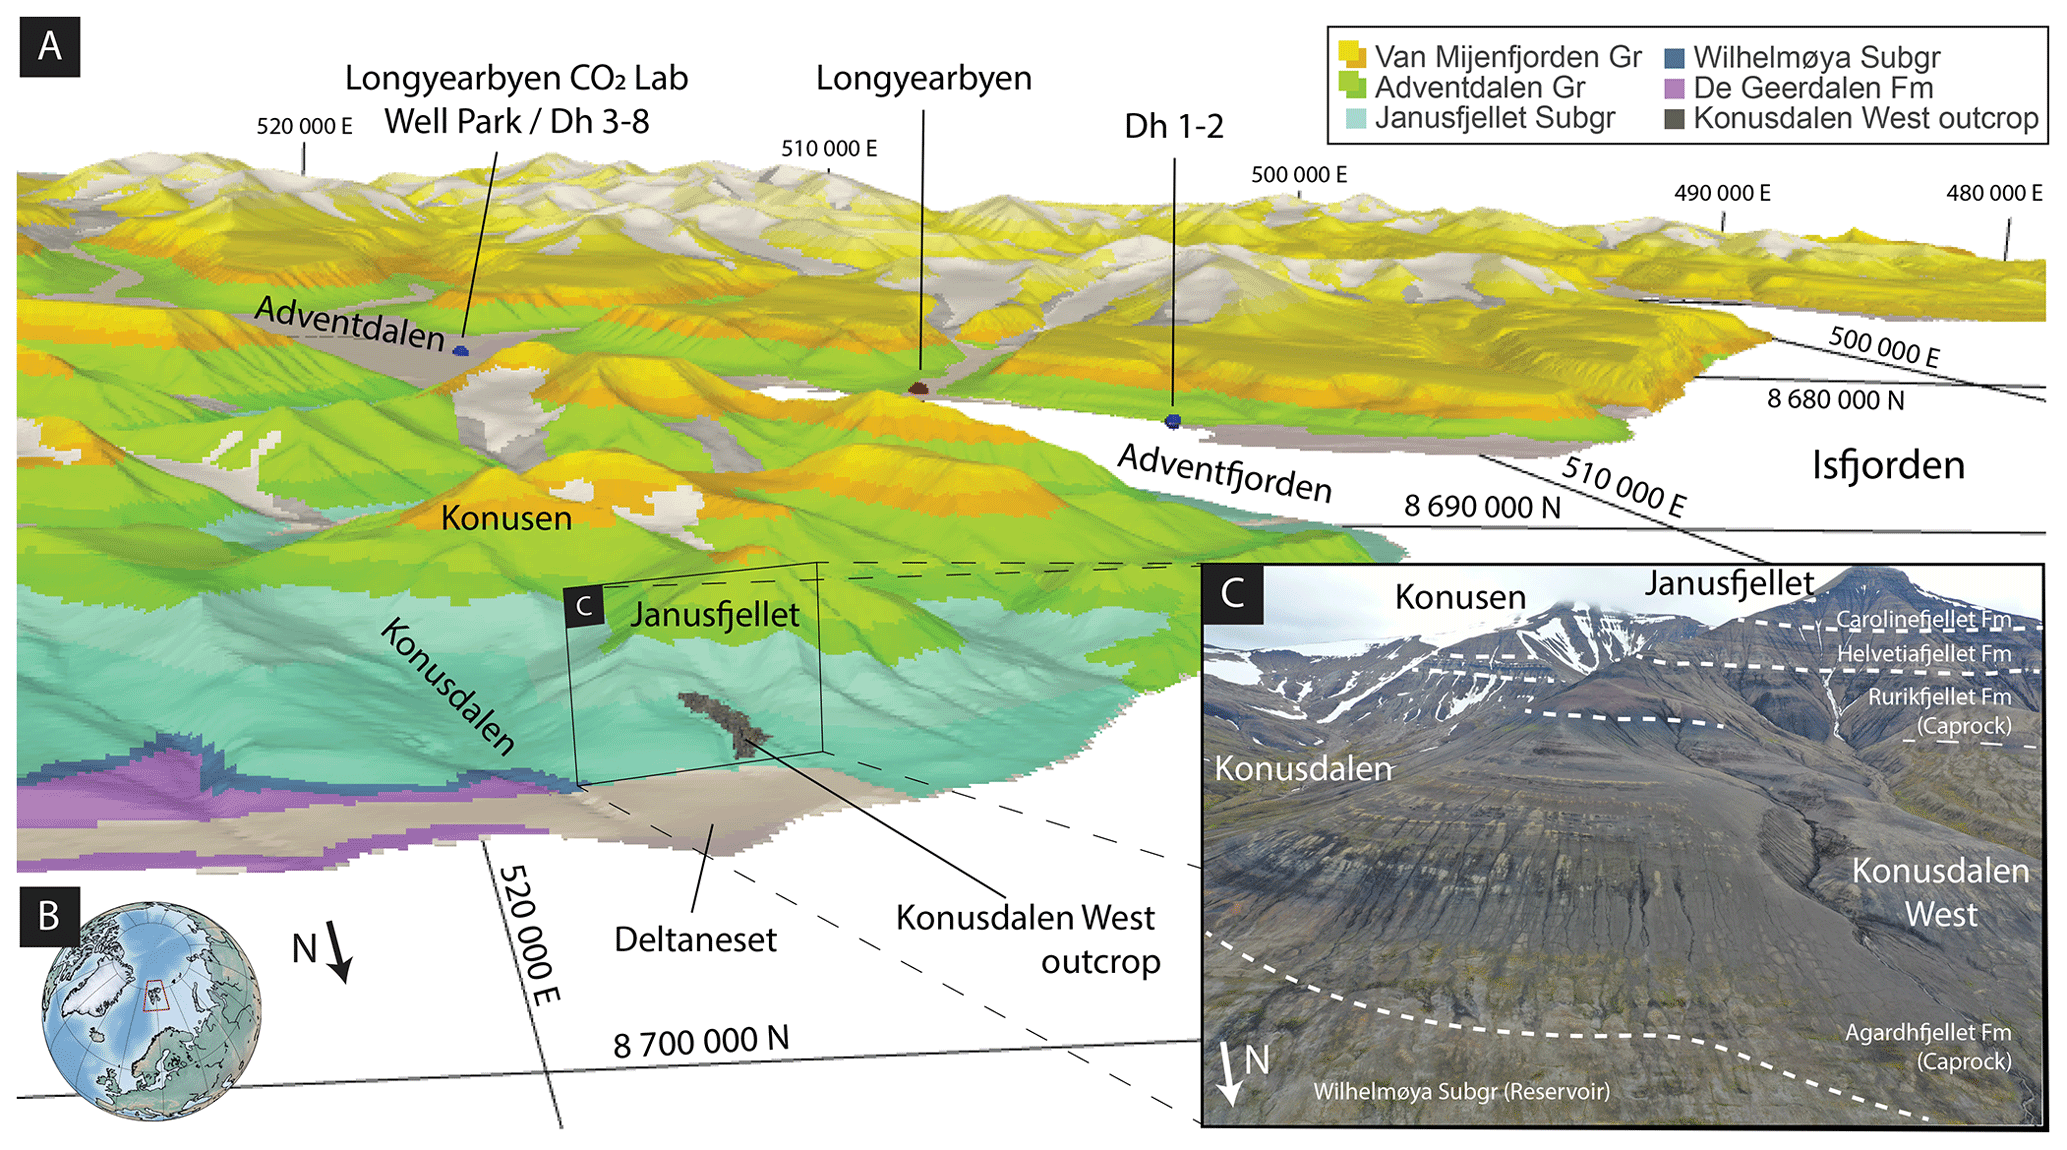
Figure 1Location and geology of the Longyearbyen CO2 Lab reservoir, cap rock, and overburden successions in Svalbard (b). The locations of the outcropping Konusdalen West exposures at Deltaneset and the city of Longyearbyen, and both drill sites of the Longyearbyen CO2 Lab are highlighted (a). The inset (c) shows an overview photo of the study area. Geological map (1:250 000) and digital terrain model (50 m resolution) are courtesy of Norwegian Polar Institute (2014) and Norwegian Polar Institute (2016), respectively. The grid uses the WGS 84/UTM Zone 33N (EPSG:32633) projection.
The fractured reservoir sections targeted by the Longyearbyen CO2 Lab belong to the Upper Triassic to Middle Jurassic Kapp Toscana Group. The sandstone-dominated De Geerdalen Formation and overlying Wilhelmøya Subgroup represent paralic and deltaic depositions, respectively (Mulrooney et al., 2018). These are overlain by 450 m thick, regional, shale-dominated cap rock successions belonging to the Janusfjellet Subgroup (Koevoets et al., 2019b; Braathen et al., 2012; Olaussen et al., 2019). The Janusfjellet Subgroup comprises the Late Jurassic–Early Cretaceous Agardhfjellet and Early Cretaceous Rurikfjellet formations (Collignon and Hammer, 2012; Dypvik et al., 1991; Grundvåg et al., 2017; Mørk et al., 1999; Koevoets et al., 2019b).
The Agardhfjellet Formation was formed mostly under dysoxic to anoxic conditions, periodically experiencing oxygenation of the water column (Collignon and Hammer, 2012). It forms the cap rock immediately overlying the targeted reservoir of the Longyearbyen CO2 Lab and crops out at Deltaneset, some 15 km northwest of Longyearbyen (Fig. 1) (Braathen et al., 2012; Olaussen et al., 2019). Here, the cap rock is host to several potential seal bypass systems, including igneous and sedimentary intrusions, faults, and folds, that may affect the flow of fluids through the cap rock (e.g. Ogata et al., 2023; Betlem et al., 2023; Betlem, 2023a, and references therein). Time-equivalent stratigraphic intervals of the Agardhfjellet Formation are widespread across the Barents Sea and are prolific regional source rocks in addition to being the top seal of several oil and gas fields on the Norwegian continental shelf (e.g. Spencer et al., 2008).
Within our study area, the Agardhfjellet Formation is up to 250 m thick and can be subdivided into four member units (Dypvik et al., 1991; Koevoets et al., 2019a, b). The Oppdalen Member is a fining-upward unit of Bathonixian–Oxfordian age, deposited in a shallow marine environment. The Lardyfjellet Member overlies the Oppdalen Member and consists of black paper shales with scattered carbonate concretions. The first appearance of silt–sand beds and the disappearance of black shales mark the transition into the Oppdalssåta Member. The Upper Kimmeridgian Oppdalssåta Member comprises several upward-coarsening sandstone and sandy shale units, of which the last marks the end of the member. The Slottsmøya Member (Lower Volgian–Ryazanian) consists of black paper shales, developing slightly coarsening-upwards sequences in the upper part.
The Paleocene–Eocene evolution of the West Spitsbergen Fold and Thrust Belt (WSFTB) resulted in a series of eastward-transported thrust sheets rooted in sub-horizontal décollement zones along weaker evaporite and shale intervals, including the Agardhfjellet and Rurikfjellet formations (Ogata et al., 2012). Considerable lateral variation of the formation is observed throughout Spitsbergen, both in total thickness and in the relative thicknesses of its members. Tectonic disturbances of the mechanically weak Agardhfjellet Formation are likely to have occurred through the WSFTB (Braathen et al., 1995; Bergh et al., 1997).
The Rurikfjellet Formation features several coarsening-upward units deposited in a marine shelf to prodeltaic and shoreline delta front environments (Dypvik et al., 1991; Grundvåg et al., 2017). Transition from the Agardhfjellet Formation into the Rurikfjellet Formation is marked by the Myklegardfjellet Bed, a distinct and easily observable clay unit (Dypvik et al., 1991).
2.1 UAV surveying
UAV-based acquisition of the outcrop was conducted over 2 weeks in July and August 2020. We used a DJI Mavic 2 Pro drone with a Hasselblad L1D-20c camera (10.26 mm focal length; 20 MP images) with built-in GNSS positioning to image the Konusdalen West outcrop at a mean flight altitude of 30.62 m (median 29.8, SD 5.72 m). Maximum flight velocity was kept at 1.1 m s−1, with image acquisition triggered automatically at 5 s intervals, which resulted in 5512 images (Fig. 2, Table A1 in the Appendix).
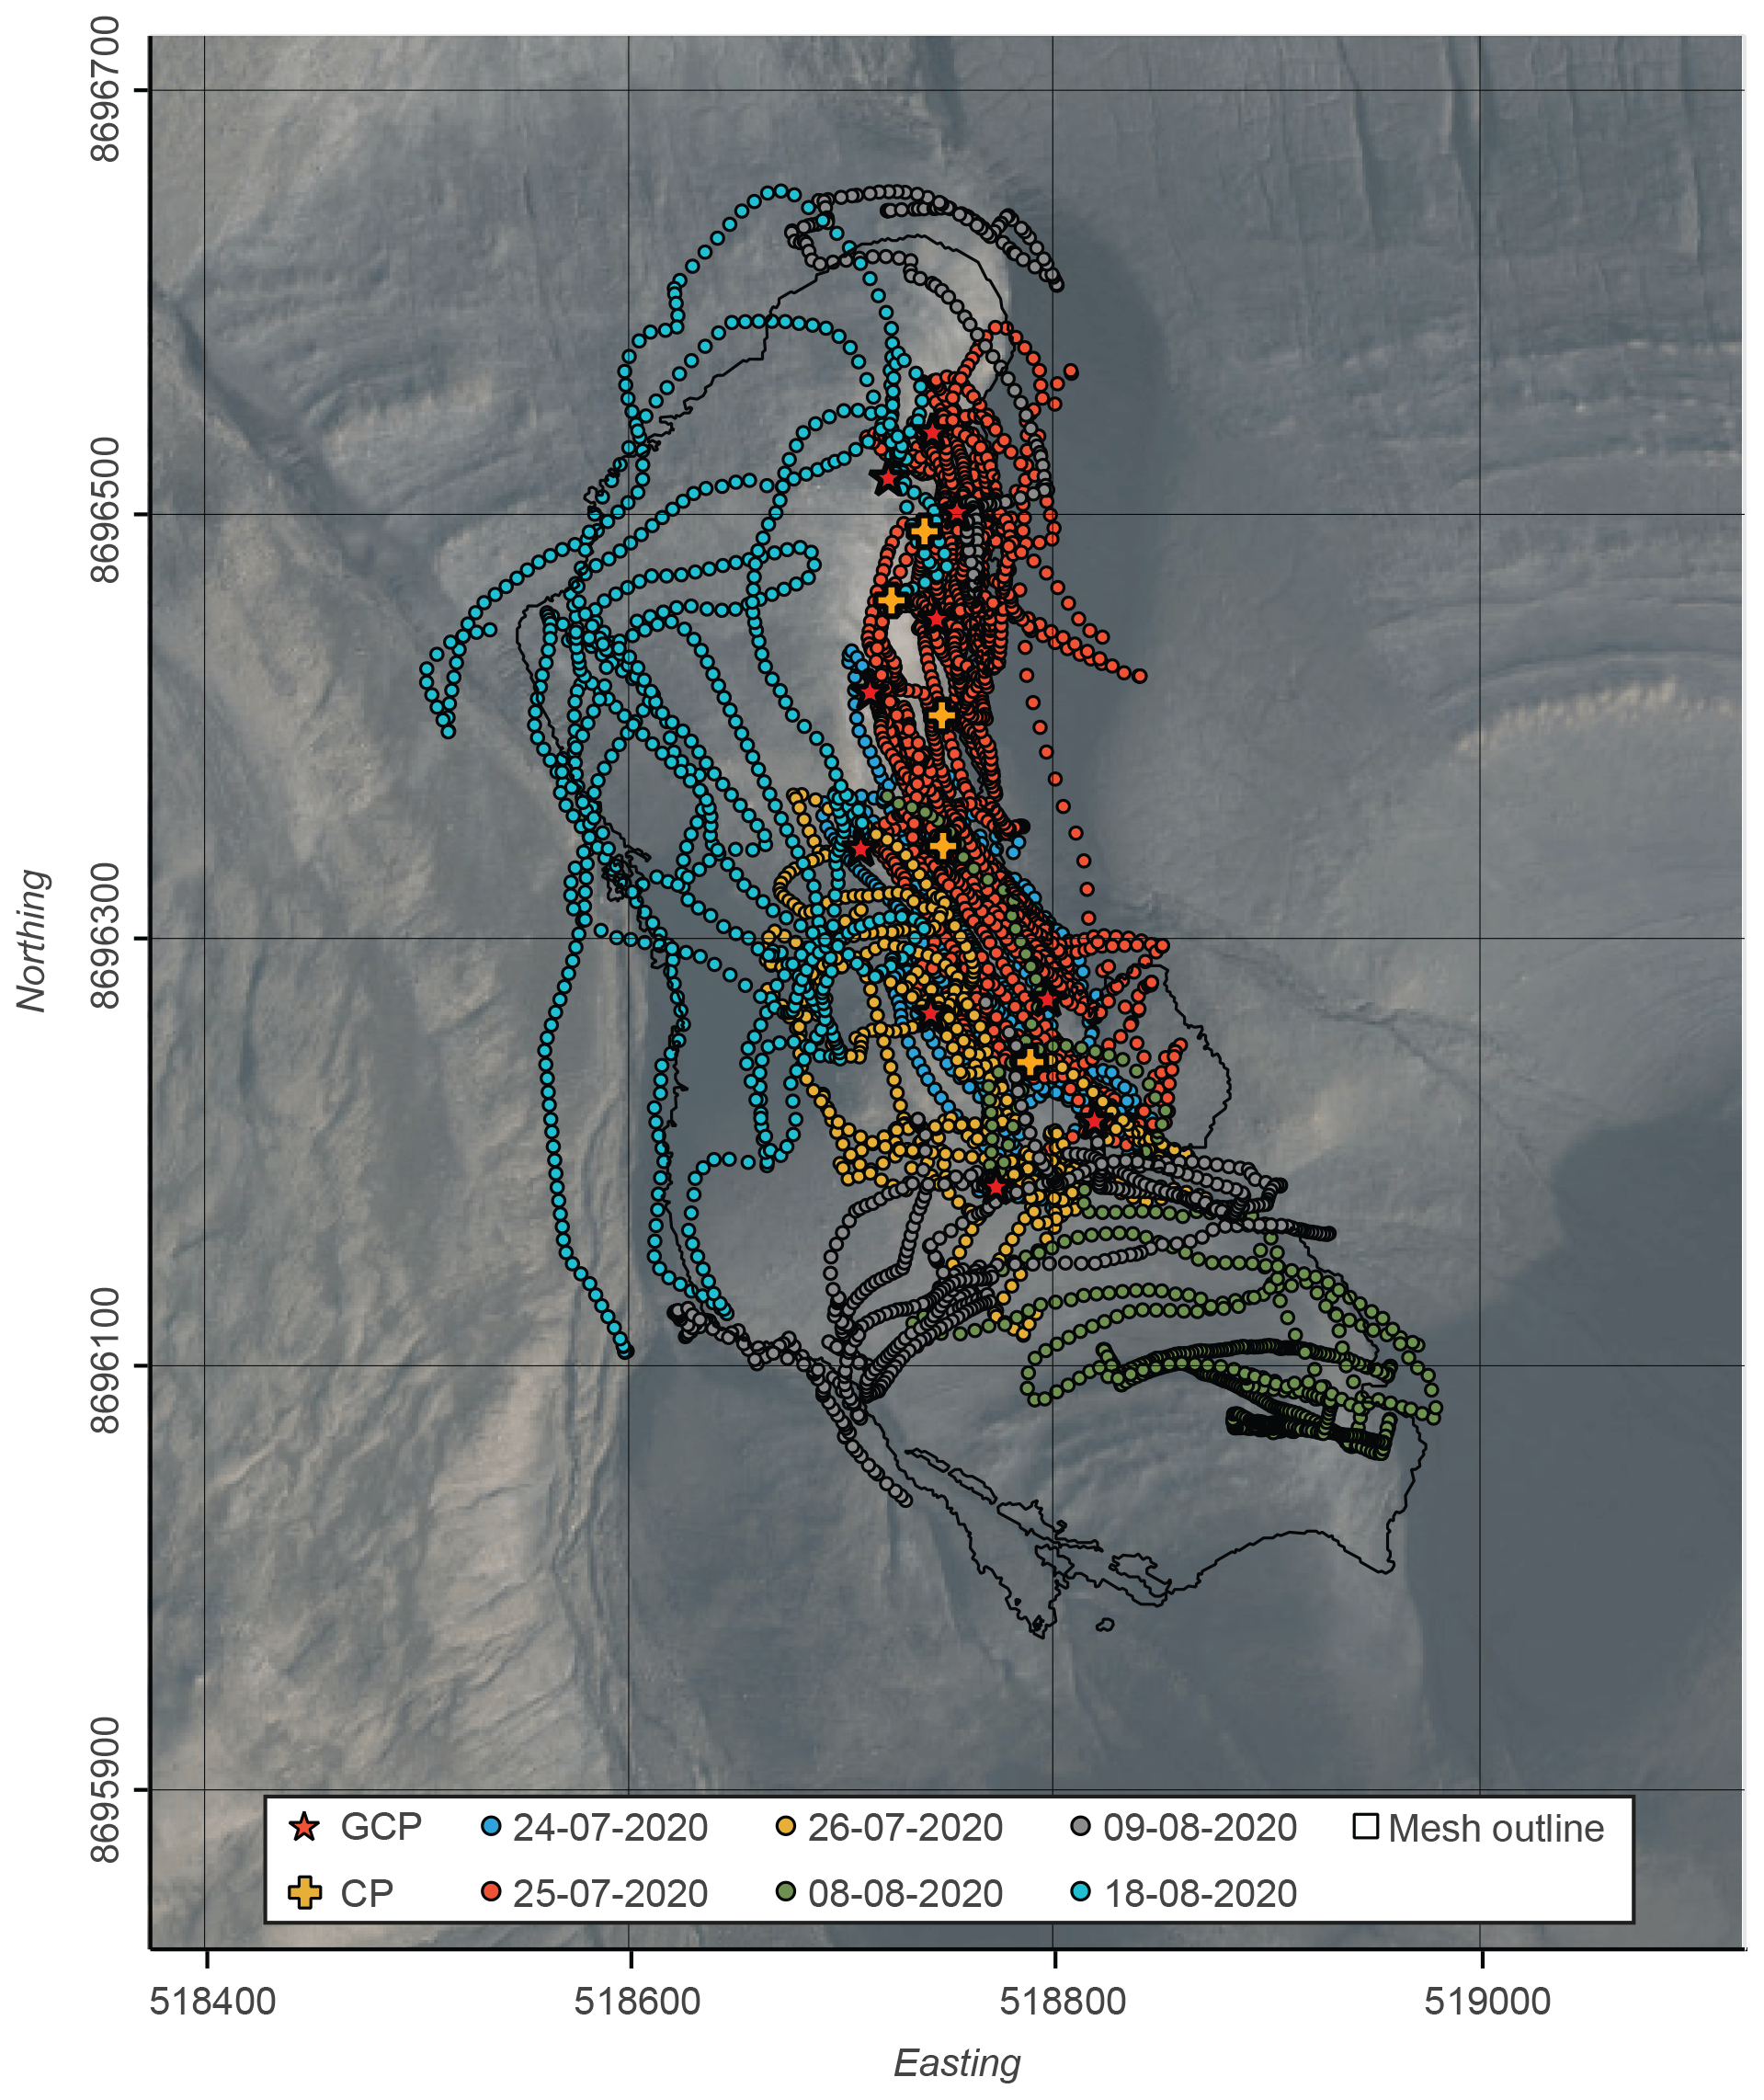
Figure 2Targeted area and control point and image acquisition locations. Images are grouped by acquisition date. GCP: ground control point; CP: check point. Background orthophoto is courtesy of Norwegian Polar Institute (2017). Map uses the WGS 84/UTM Zone 33N (EPSG:32633) projection.
2.2 Ground control points and structural location measurements
A total of 15 control points were laid out around the eastern slope of the best-exposed part of the Konusdalen West outcrop (Fig. 2). Control point locations were measured prior to the UAV survey in August 2020 using a LEICA Viva GS16 receiver with LEIGS antenna (pole length: 1.80 m). Each location was measured for at least 30 s and calibrated against the long observation base station in Longyearbyen (LYRS; TRIMBLE NETR9 receiver with TRM41249.00 antenna), approximately 15 km southwest of the study area ( N, E, and 495.682 m WGS84 ellipsoidal height; 8683937.5685N, 509048.1382E, and 463.4025 m orthogonal height (WGS84/UTM Zone 33N with Earth Gravitational Model 2008, EGM2008)) using a post-processing static approach. Post-processing performance of the Leica Viva GS16 system is rated at 3 mm + 0.1 ppm horizontal and 3.5 mm + 0.4 ppm vertical accuracy (Leica Geosystems AG, 2016). This translates to an overall accuracy at the targeted field site of ±1.8 mm horizontally and ±9.5 mm vertically. The 1 s interval base station data were retrieved from the Norwegian Mapping Authority (Kartverket) in the RNX2 and RNX3 formats. The Leica Infinity software package (v3.6.0.35318; 64 bit) was used for processing, implementing EGM2008 (Pavlis et al., 2008) for the calculation of orthogonal heights from the measured WGS84 ellipsoidal heights. In accordance with the guidelines proposed by Dering et al. (2019) and James et al. (2019), 10 markers were used as ground control points (GCPs) for calibration of the point cloud. The remaining five were used as check points (CPs).
The use of ArUcO markers enabled the automated analysis and control point detection in the images by using the OpenCV ArUcO library (Bradski, 2000; Garrido-Jurado et al., 2014). The automated_metashape package (v1.1.10, Betlem, 2022a) streamlined the integration thereof with Agisoft Metashape through the use of the Metashape Python API. The ArUcO markers implemented the DICT_6X6_250 encoding. Each automated control point marker placement was subsequently checked and, where needed, manually refined to ensure the highest precision and accuracy.
We measured additional fault and fracture orientation data with a handheld compass in June 2021. The measurements followed excavation of up to half a metre of material and were located with the Leica Viva GS16 system. The structural measurements supplement and constrain digital annotations and provide additional surface elevation reference data.
All recorded coordinates are provided in Tables 1 and C1, including model errors, using the WGS84/UTM Zone 33N coordinate system (EPSG:32633) and orthogonal heights (altitudes) derived from EGM2008 (Pavlis et al., 2008).
2.3 Point cloud, orthophoto mosaic, and digital outcrop models
Image processing and surface reconstruction were performed using Agisoft Metashape (formerly PhotoScan, v1.7.2.12040). Metashape is a commercial software that implements automatic feature detection, image matching, and modelling using SfM algorithms, and it is frequently used for model reconstruction (e.g. Tinkham and Swayze, 2021; Zhou et al., 2020; Kingsland, 2020). Agisoft does not disclose the exact algorithms used in the processing but does refer to Hirschmuller (2007) and Hiep et al. (2009).
Processing was performed in local-area-network (LAN) mode at six dedicated workstations (Table B1) and proceeded according to the latest US Geological Survey (USGS) coastal imagery processing guidelines (Over et al., 2021). For a schematic summary of the steps involved, the reader is referred to Fig. 1 in Over et al. (2021). Minor deviations from the workflow and processing parameters are discussed below.
We quality controlled all images prior to processing and additionally used Metashape's inbuilt image-assessing tool to quantify image quality. Four images did not pass the specified cutoff of 0.5 and were disabled. Image location metadata for flights 23–25 featured erroneous altitude data in excess of 100 m above the recorded flight paths. Location metadata for these images (n=748) were disabled prior to the photo alignment step. The sparse-point cloud was generated using the highest setting (i.e. 4-times-upscaled image) through two consecutive iterations to re-align any non-aligned images, leaving four unaligned. Subsequent camera optimisation only utilised the high-precision GCP data, disabling all image location metadata and unpinned (implicit, blue flags) GCP points to ensure the most accurate georeferencing. Tie points were filtered on reconstruction uncertainty (level = 15, one optimisation, removed 16 021 109 points, disabled four cameras), projection accuracy (level = 2, one optimisation, removed 2 497 962 points, disabled three cameras), and reprojection error (level = 0.3, seven optimisations, removed 4 650 001 points, disabled two cameras). A camera alignment optimisation step followed each filtering step. The depth maps and dense-point clouds were processed using the half-image scale, and mild filtering of the generated depth maps was applied. No changes were made to the automatically generated bounding box.
The dense cloud was trimmed based on confidence (retaining point confidence, removed 1 034 950 382 points) to improve overall quality. The trimmed dense cloud featured as input for the generation of a (textured) mesh, tiled model, and digital terrain model (DTM). Contours were extracted from the DTM at 5 m steps across the 85–255 m interval. The mesh and DTM were used for the generation of several orthomosaics, including top-down and viewpoints aligned with the key geological features of interest. A processing report detailing additional processing parameters is made available as part of the data set (Betlem, 2022b).
2.4 Point cloud, vertex, and data operations
We analysed point cloud and mesh data using Python's Point Data Abstraction Library, PDAL (PDAL Contributors, 2018; Butler et al., 2021, v. 2.2.0/2.4.2 (python-pdal) ). Point cloud data were exported as single .LAS files, while mesh data were PDAL-converted from the .obj file format to the .LAS file format. Point cloud and mesh data were subsequently split into 1 m2 bins from the (500 000, 8 680 000) grid origin using the PDAL splitter filter. Points per bin, extent, and bin centres were calculated for both tie points and dense-cloud data. Mean confidence was additionally calculated for each 1 m2 binned interval. Outlines were calculated with PDAL's hexbin filter, specifying an edge_length of 0.6204 units (m). Slopes and aspects were calculated from the DTM data through the use of OSGeo and GDAL/OGR (Rouault et al., 2022, v. 3.2.1). Functional scripting examples can be found in the Appendix and include point and vertex densities, boundary estimates, and error calculations.
2.5 Delineation and structural measurements of geological features in the point cloud and digital terrain models
Metre-scale geological features were interpreted as georeferenced 3D features on the dense-point cloud, textured mesh, and tiled model through the use of Metashape's built-in polygon tool. Published sedimentary logs (Koevoets et al., 2016, 2019a) helped with the integration of the model into its geological context and aided the placement of formation and member boundaries. Marker beds and faults were traced only where clearly visible along the entire DOM and confirmed in the field. Fracture sets were analysed and classified through use of the NetworkGT software (Nyberg et al., 2018). Dip angles were calculated from the interpolated planes through line traces with at least three points, i.e. 3D data. The same methodology was applied to along-fault groupings of differential GNSS (dGNSS) field measurements (Table C1) to obtain interpolated fault planes and structural information.
2.6 Accuracy assessment and misalignment
Accuracy assessment implemented the error associated with the geometric accuracy of the dense cloud and digital terrain model (DTM). We calculated mean and root-mean-square errors (RMSEs) for both the GCPs and CPs and employed differential augmentation of the global navigation satellite system (dGNSS) to constrain the lateral and vertical accuracy of the DTM at the control points. The altitude–DTM difference was, in addition, calculated for dGNSS data recorded for structural measurements and against available 5 m resolution DTM reference data (Norwegian Polar Institute, 2014).
2.7 Visualisation and data integration
We employed the WGS 84/UTM Zone 33N (EPSG:32633) projection. The Norwegian Polar Institute provided geological maps with 1:250 000 and 1:100 000 scales (Norwegian Polar Institute, 2016). We used Python's Bokeh, HoloViews (Stevens et al., 2015), and Scientific colour maps 7.0 (Crameri et al., 2020) libraries for the visualisation of the data as georeferenced maps. Given computational and file size limitations, the DTM, aspect, slope, and orthomosaic data were downsampled prior to visualisation. In line with file size limitations and publishing policy, a decimated copy of the textured mesh (5 M faces) was filtered onto a connected component size (99 %) prior to submission to V3Geo and SketchFab.
3.1 Point clouds and control points
The initial tie point set (i.e. sparse cloud) consists of 29 492 561 points following camera alignment, trimmed to 6 323 579 points through error-reducing, camera optimisation steps (Fig. 3). Tie point multiplicity, i.e. the average number of images where the point has been measured, of the processed point cloud is calculated as 3.81. The processed sparse cloud features an RMSE reprojection error value of 0.12 pixels and a maximum reprojection error of 0.88 pixels.
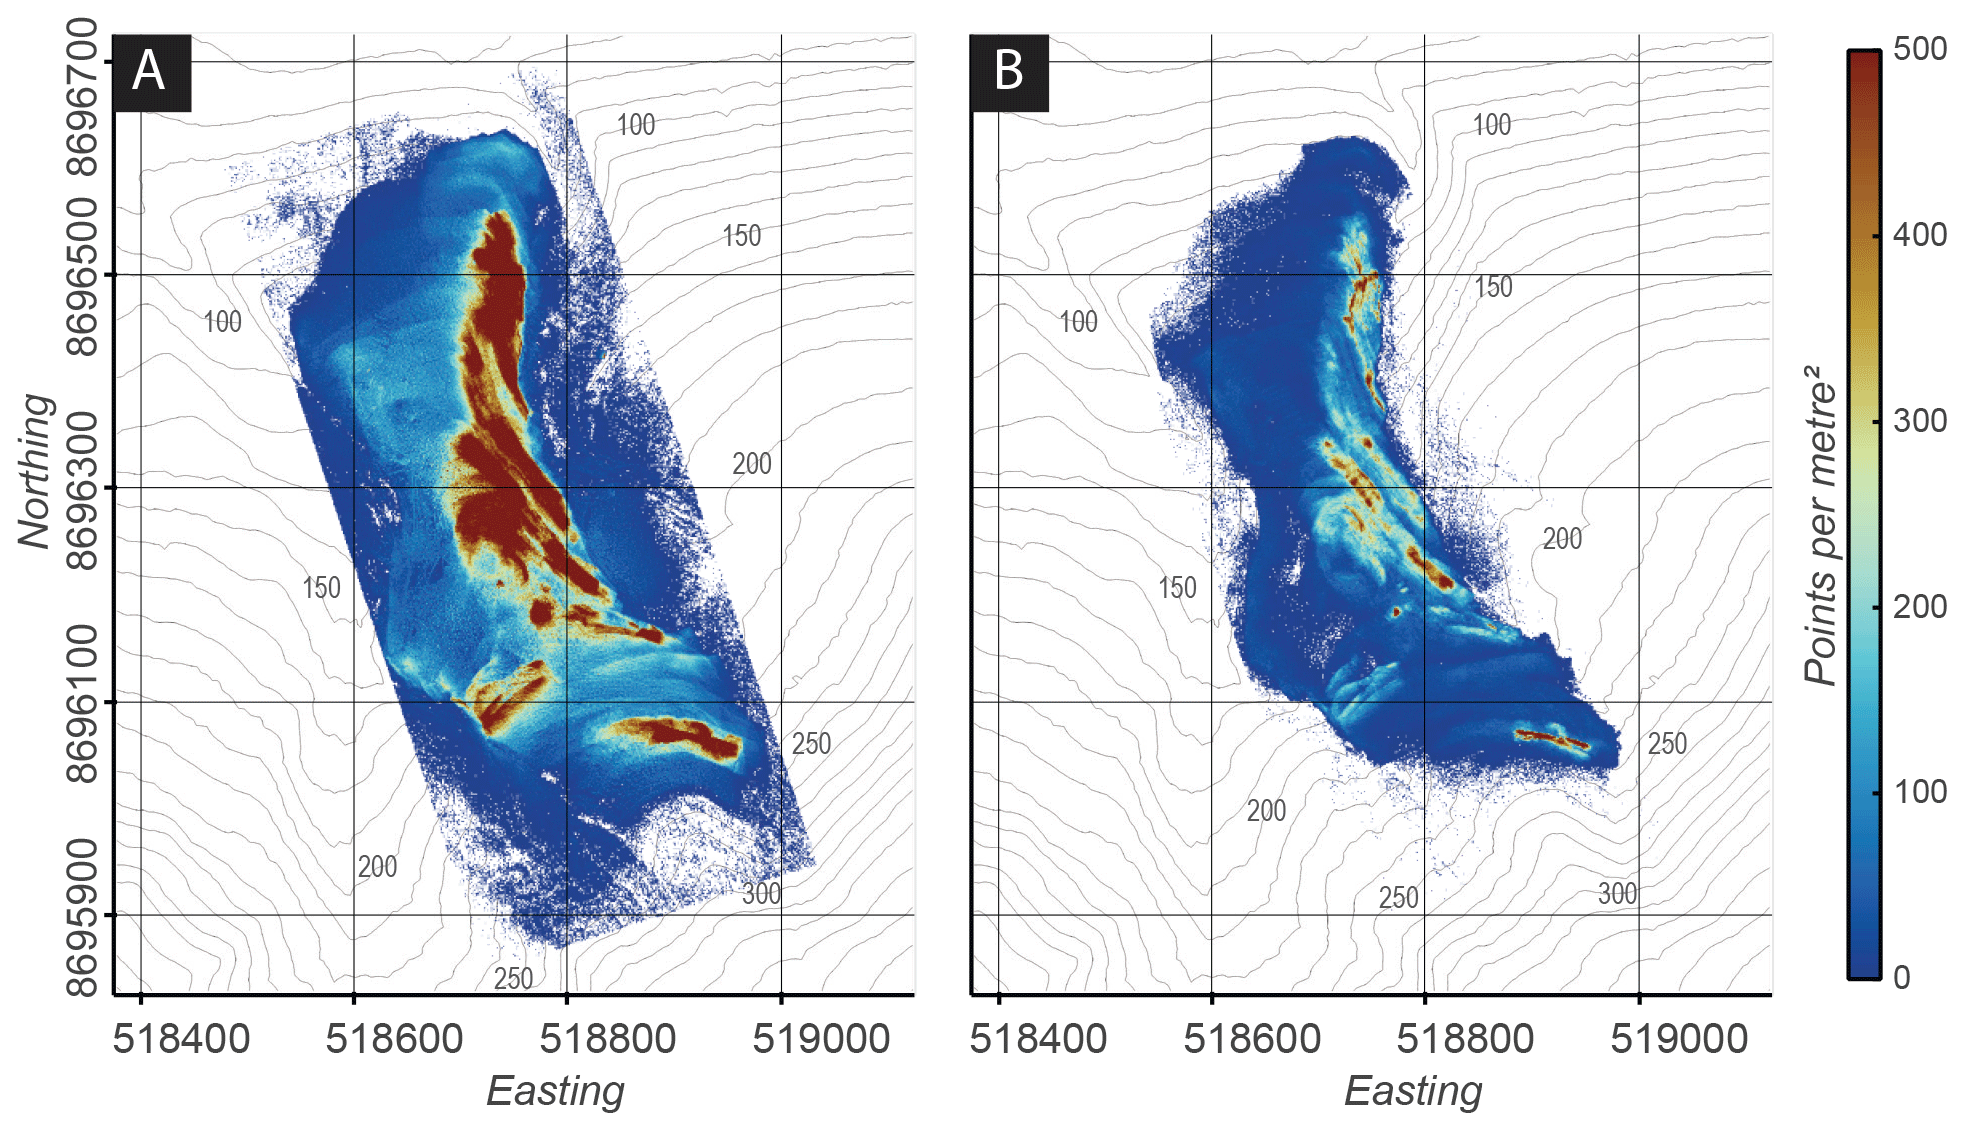
Figure 3Sparse cloud point density maps, featuring both the raw tie point set (a) and the optimised point cloud (b). Highest point densities are found close to control points and steeper sections. Maps use the WGS 84/UTM Zone 33N (EPSG:32633) projection. Elevation contours generated from Norwegian Polar Institute (2014).
The full-extent dense-point cloud (Fig. 4) consists of 1 543 094 332 points and features an average point-to-point distance of 1.26 cm and 6222 points per square metre density (SD 4767 points per square metre), covering a total area of 0.245 km2. Full-extent dense cloud confidence ranges from 1 to 194, with confidence values above 9 considered to be high.
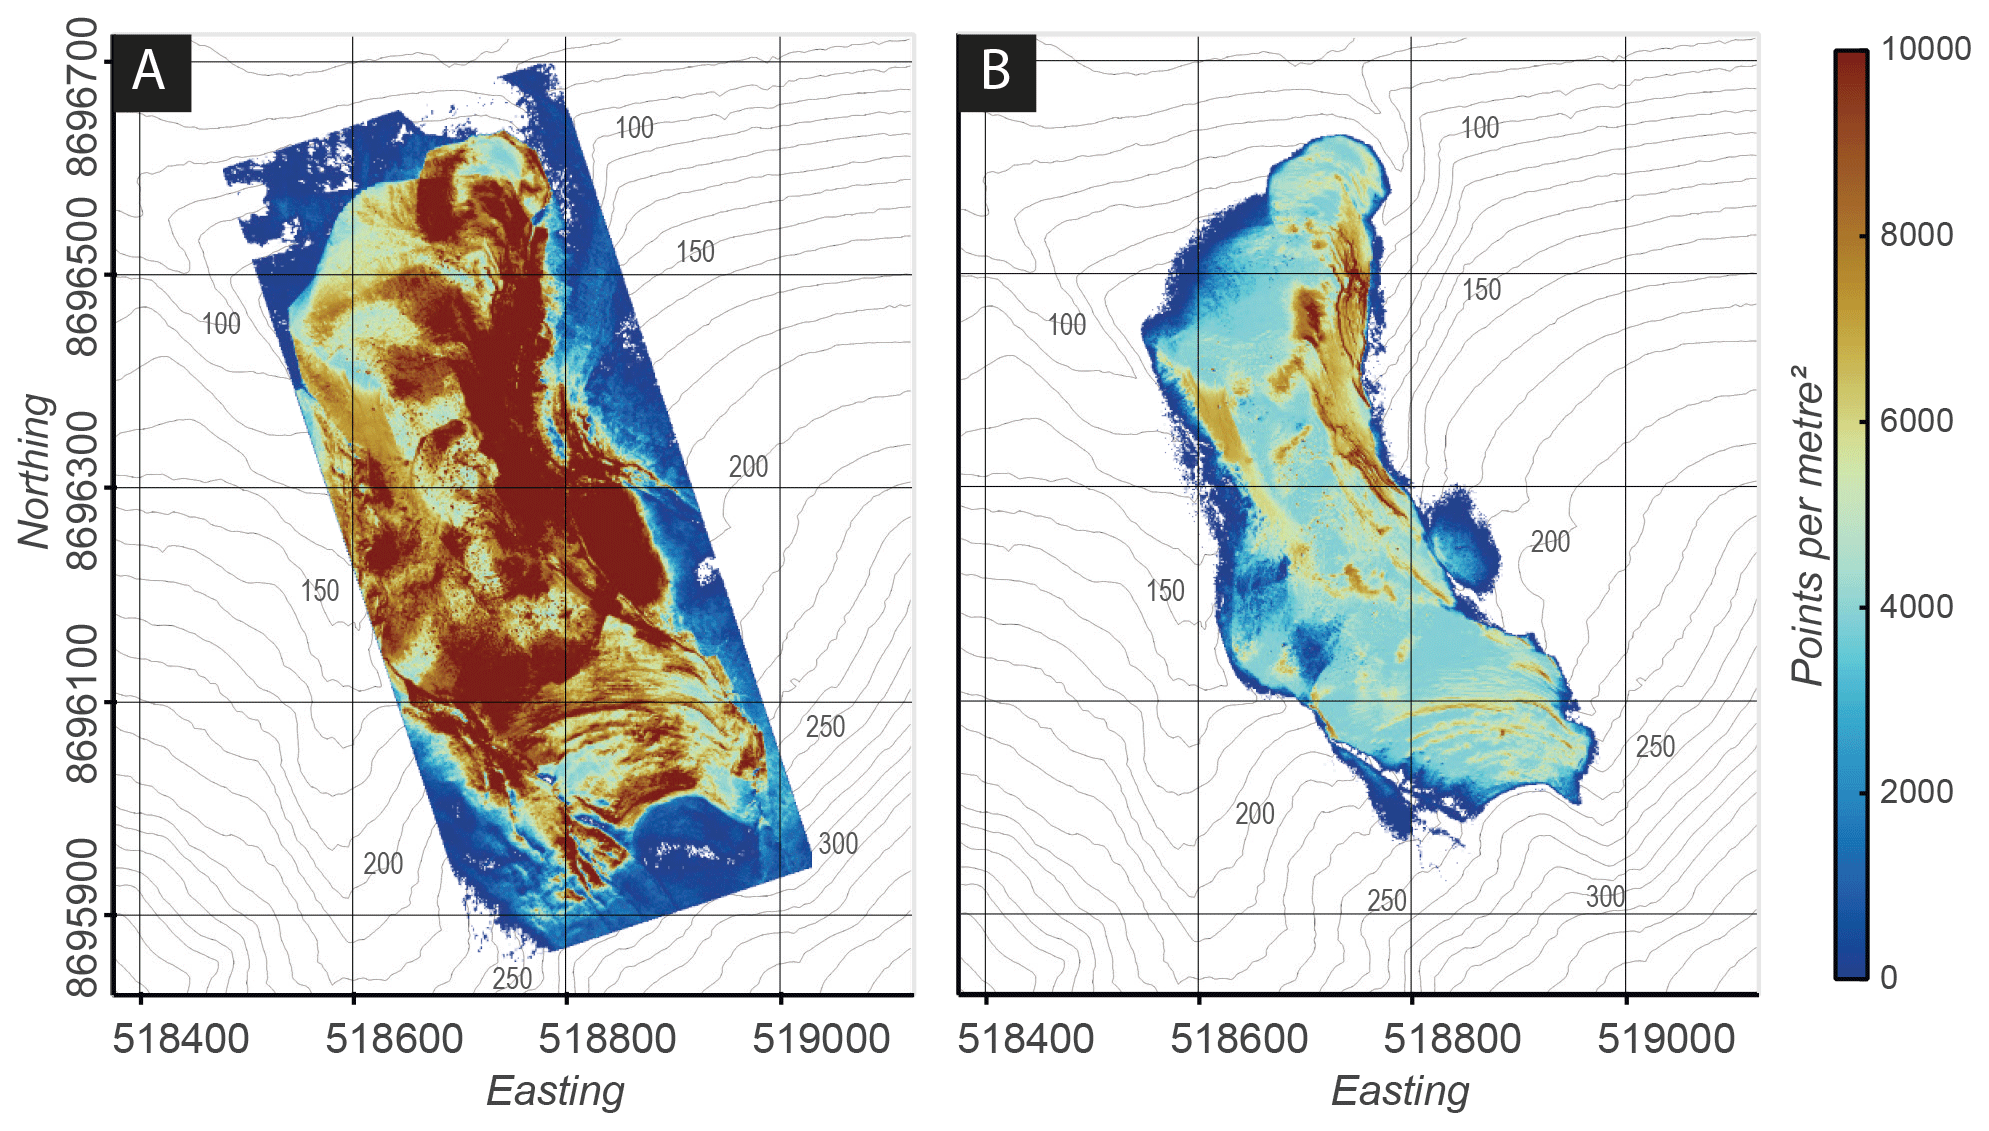
Figure 4Dense-cloud point density maps, featuring both the raw point set (a) and the confidence-filtered point cloud (b). Highest densities are found close to control points and steeper sections. Maps use the WGS 84/UTM Zone 33N (EPSG:32633) projection. Elevation contours generated from Norwegian Polar Institute (2014).
Point exclusion of low-confidence points led to an improvement in the mean confidence from 12.92 (SD 19.83) to 34.54 (SD 22.1) for the reduced dense cloud (508 143 950 points), mainly through the removal of points closer to the edges of the surveyed area (Fig. 4). The filtered dense cloud has an average point-to-point distance of 1.57 cm and features an average point density of 3824.9 points per square metre (SD 2215.4 points per square metre).
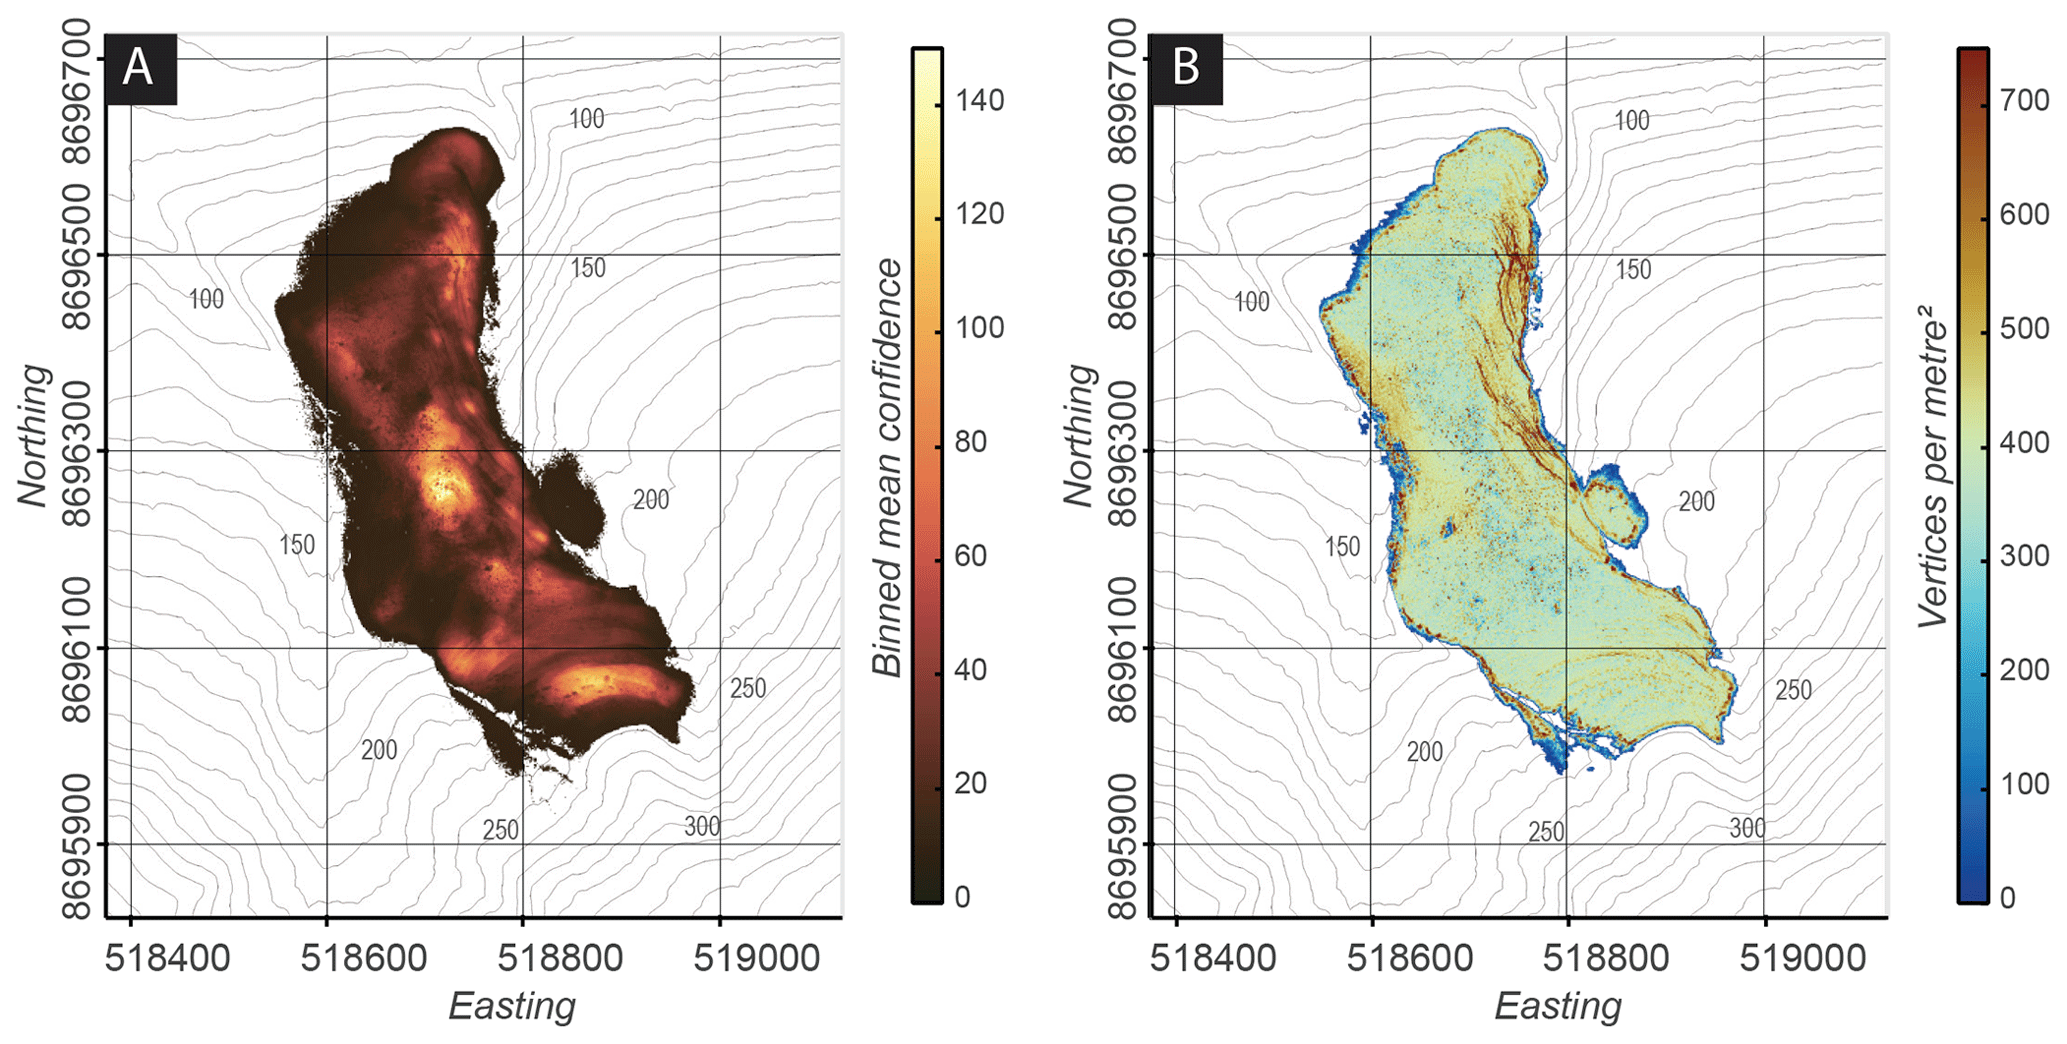
Figure 5Dense-cloud point confidence and mesh vertex density maps. The high-confidence dense cloud (a) was used as input for generation of the mesh (b) and other products. Maps use Maps use the WGS 84/UTM Zone 33N (EPSG:32633) projection. Elevation contours generated from Norwegian Polar Institute (2014).
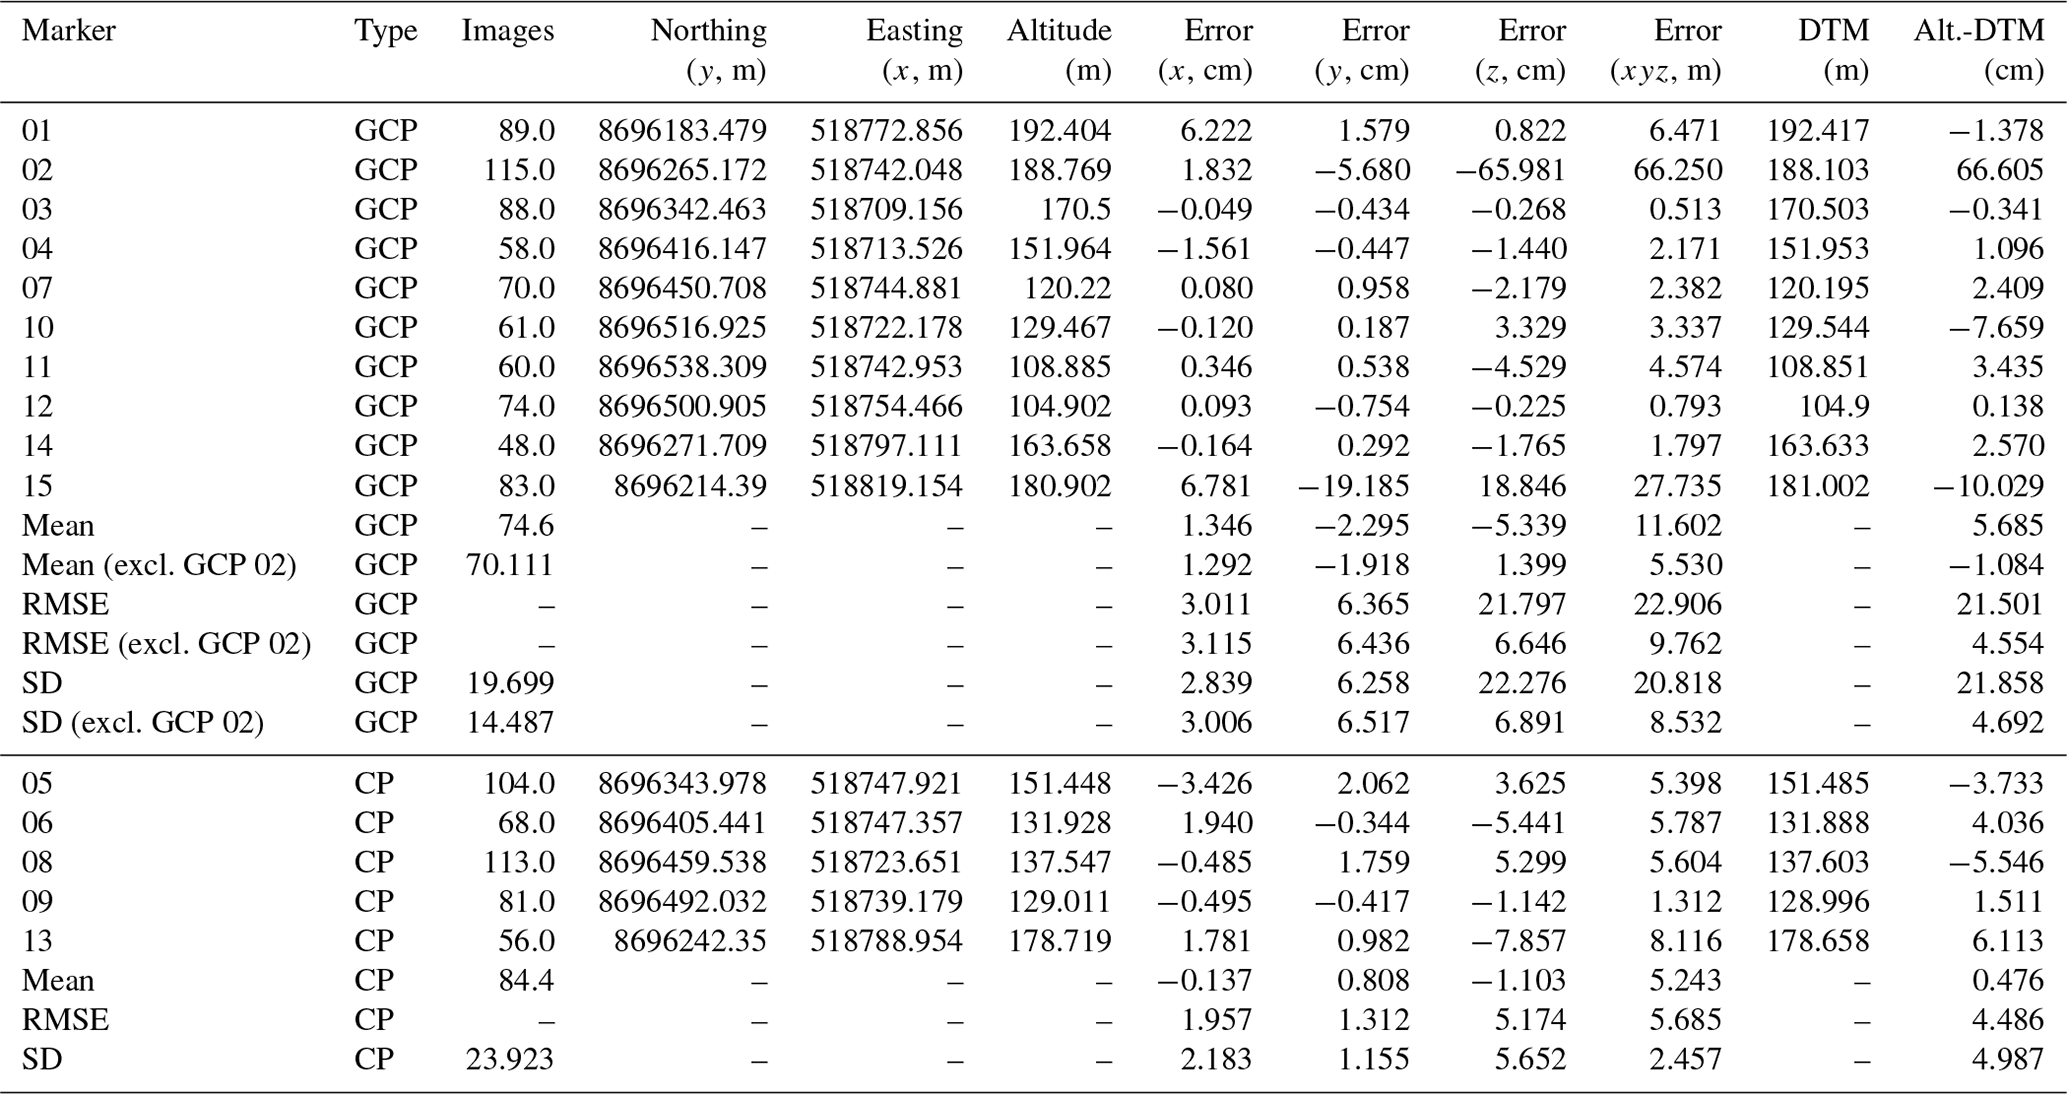
The spatial accuracy of the point cloud was assessed using five independent CPs, disabled during point cloud generation and camera optimisation (Table 1). All GCPs and CPs besides GCP 15 and CP 02 featured a post-processed phase fixed point solution, i.e. fixed PP. Post-processing of GCP 15 and CP 02 resulted in less accurate code solutions, i.e. code PP. Overall CP RMSE is 1.96 cm in X, 1.31 cm in Y, and 5.17 cm in Z, with the overall XYZ error calculated at 5.69 cm (mean: 5.24 cm, SD: 2.46 cm). Slightly larger errors were observed for the GCPs (Table 1). Overall GCP RMSE of the 10 points is 3.01 cm in X, 6.37 cm in Y, and 21.80 cm in Z, with the overall XYZ error at 22.90 cm (mean: 11.60 cm, SD: 20.82 cm). Removal of 2σ outliers, i.e. GCP 2, lowered the RMSE to 9.76 cm (mean: 5.53 cm, SD: 8.53 cm), bringing the calculated errors in line with the RMSE XYZ error calculated for the CPs.
Table 1Ground control points (GCPs) and check points (CPs) used for high-resolution georeferencing. Easting and northing given in the EPSG:32633 reference system. Heights are the calculated ortho-heights using Earth Gravitational Model 2008 (Pavlis et al., 2008).
The sparse- and dense-point clouds featured very high point densities near control points and across steeper terrain intervals. Both are partly biased by the here-employed sampling and processing methods. Neither, however, affect the quality of the model following the confidence-enhancing processing steps. Firstly, control points feature increased point densities as additional photographs were taken to streamline and improve automated marker detection, i.e. sampling bias. Secondly, the method of reporting point densities along the horizontal plane does not properly account for (sub-)vertical features, where points follow a vertical rather than horizontal distribution in three-dimensional space. Cliff sections and steeper slopes, for instance, thus appeared to be more pronounced in the horizontal dense-point cloud density projections, though they did not actually contain a higher point density, as also evident from manual inspections.
Areas further away from the best-exposed, eastern slope of the Konusdalen West outcrop generally featured lower point densities. The southernmost part, for example, features a lower imaging density than the densely photographed eastern side (Fig. 2). The density drop in the southwest is similarly caused by a lower imaging density. Decreased point densities were also observed on the shadow sides of obscuring features. Overall camera obscurement, however, remained minimal, being very localised and often smaller than 0.25 m2 and well below the 1 m2 area used for binned interval calculations as shown in Figs. 3 and 4. The occurrence of rocks and boulders provides additional data on the composition and mechanical stability of the slope. Such data may also be of use to researchers from other disciplines, enabling better integration of future multi-disciplinary workflows.
3.2 Digital terrain model, outcrop model, and orthomosaics
The textured mesh features a mean vertex density of 395.29 vertices per square metre, a factor of 10 lower than that recorded for the dense cloud, and covers an area of 0.12 km2 (Fig. 5). Vertex density ranges from 1 to 3458 vertices per square metre (SD 150.89 vertices per square metre), with higher values observed in parts corresponding to steeper sections and more competent lithologies with higher quartz content. Vertex density and resolution are more than sufficient for digital annotation and quantitative measurements of the outcrop.
Interpolation of the dense cloud enabled the generation of a DTM (Fig. 6) with a 1.6 cm per pixel resolution. The DTM features a range in elevation from 84.36 to 256.23 m. For evaluating the elevation accuracy of the DTM, elevations were compared with the GPCs and/or GCs, structural measurement locations obtained by dGNSS (Table 1), and existing DTM data available from the Norwegian Polar Institute (i.e. the reference, Norwegian Polar Institute, 2014). Point-altitude–DTM differences range from −10.03 to 66.61 cm (3.44 cm, excluding outliers) for the GCPs and −5.55 to 6.11 cm for the CPs. GCPs feature a mean altitude–DTM error, standard deviation, and RMSE of 5.69 (−1.08) cm, 21.86 (4.70) cm, and 21.50 (4.56) cm, respectively, when compared to the here-generated DTM, with the error in brackets stemming from outlier removal, i.e. GCP 02. CPs feature a mean altitude–DTM error, standard deviation, and RMSE of 0.48, 4.99, and 4.49 cm, respectively.
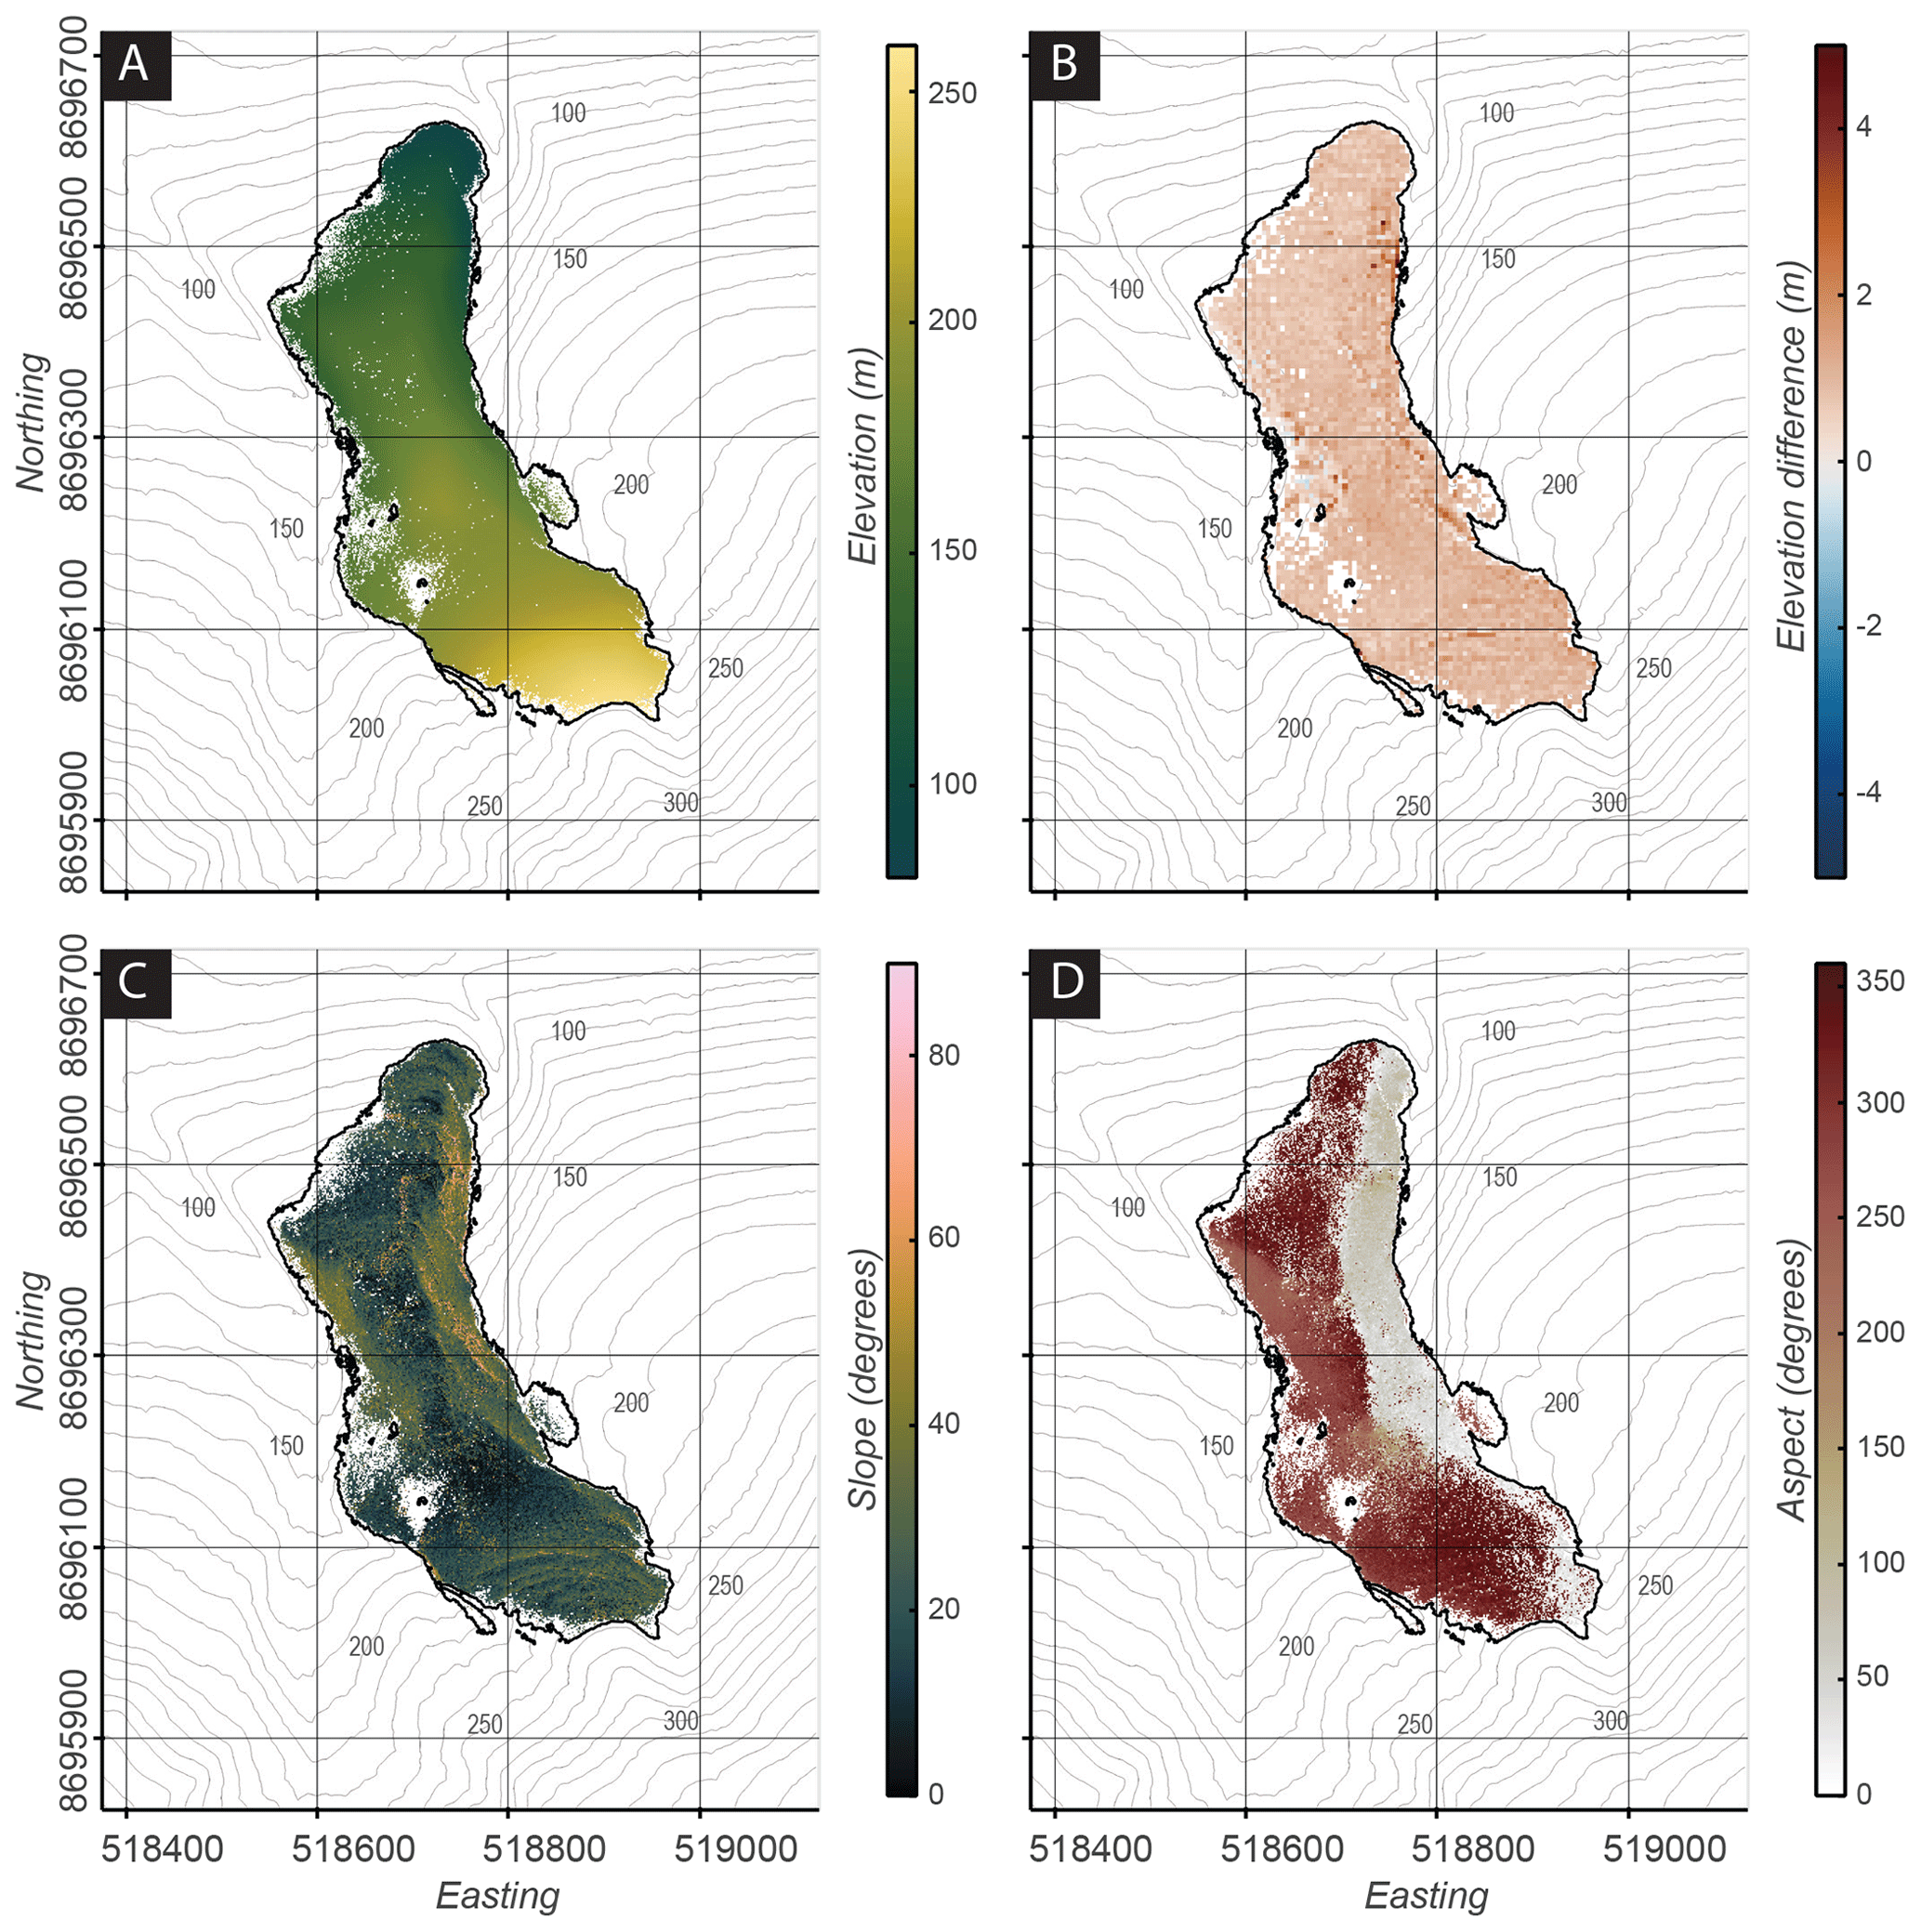
Figure 6Digital terrain model (DTM) and related products. The difference between the Konusdalen West DTM and existing DTM reference data (Norwegian Polar Institute, 2014) is shown in (b). DOM-derived slopes and aspect of the Konusdalen West exposure are shown in (c) and (d), respectively. Maps use the WGS 84/UTM Zone 33N (EPSG:32633) projection. Elevation contours generated from Norwegian Polar Institute (2014).
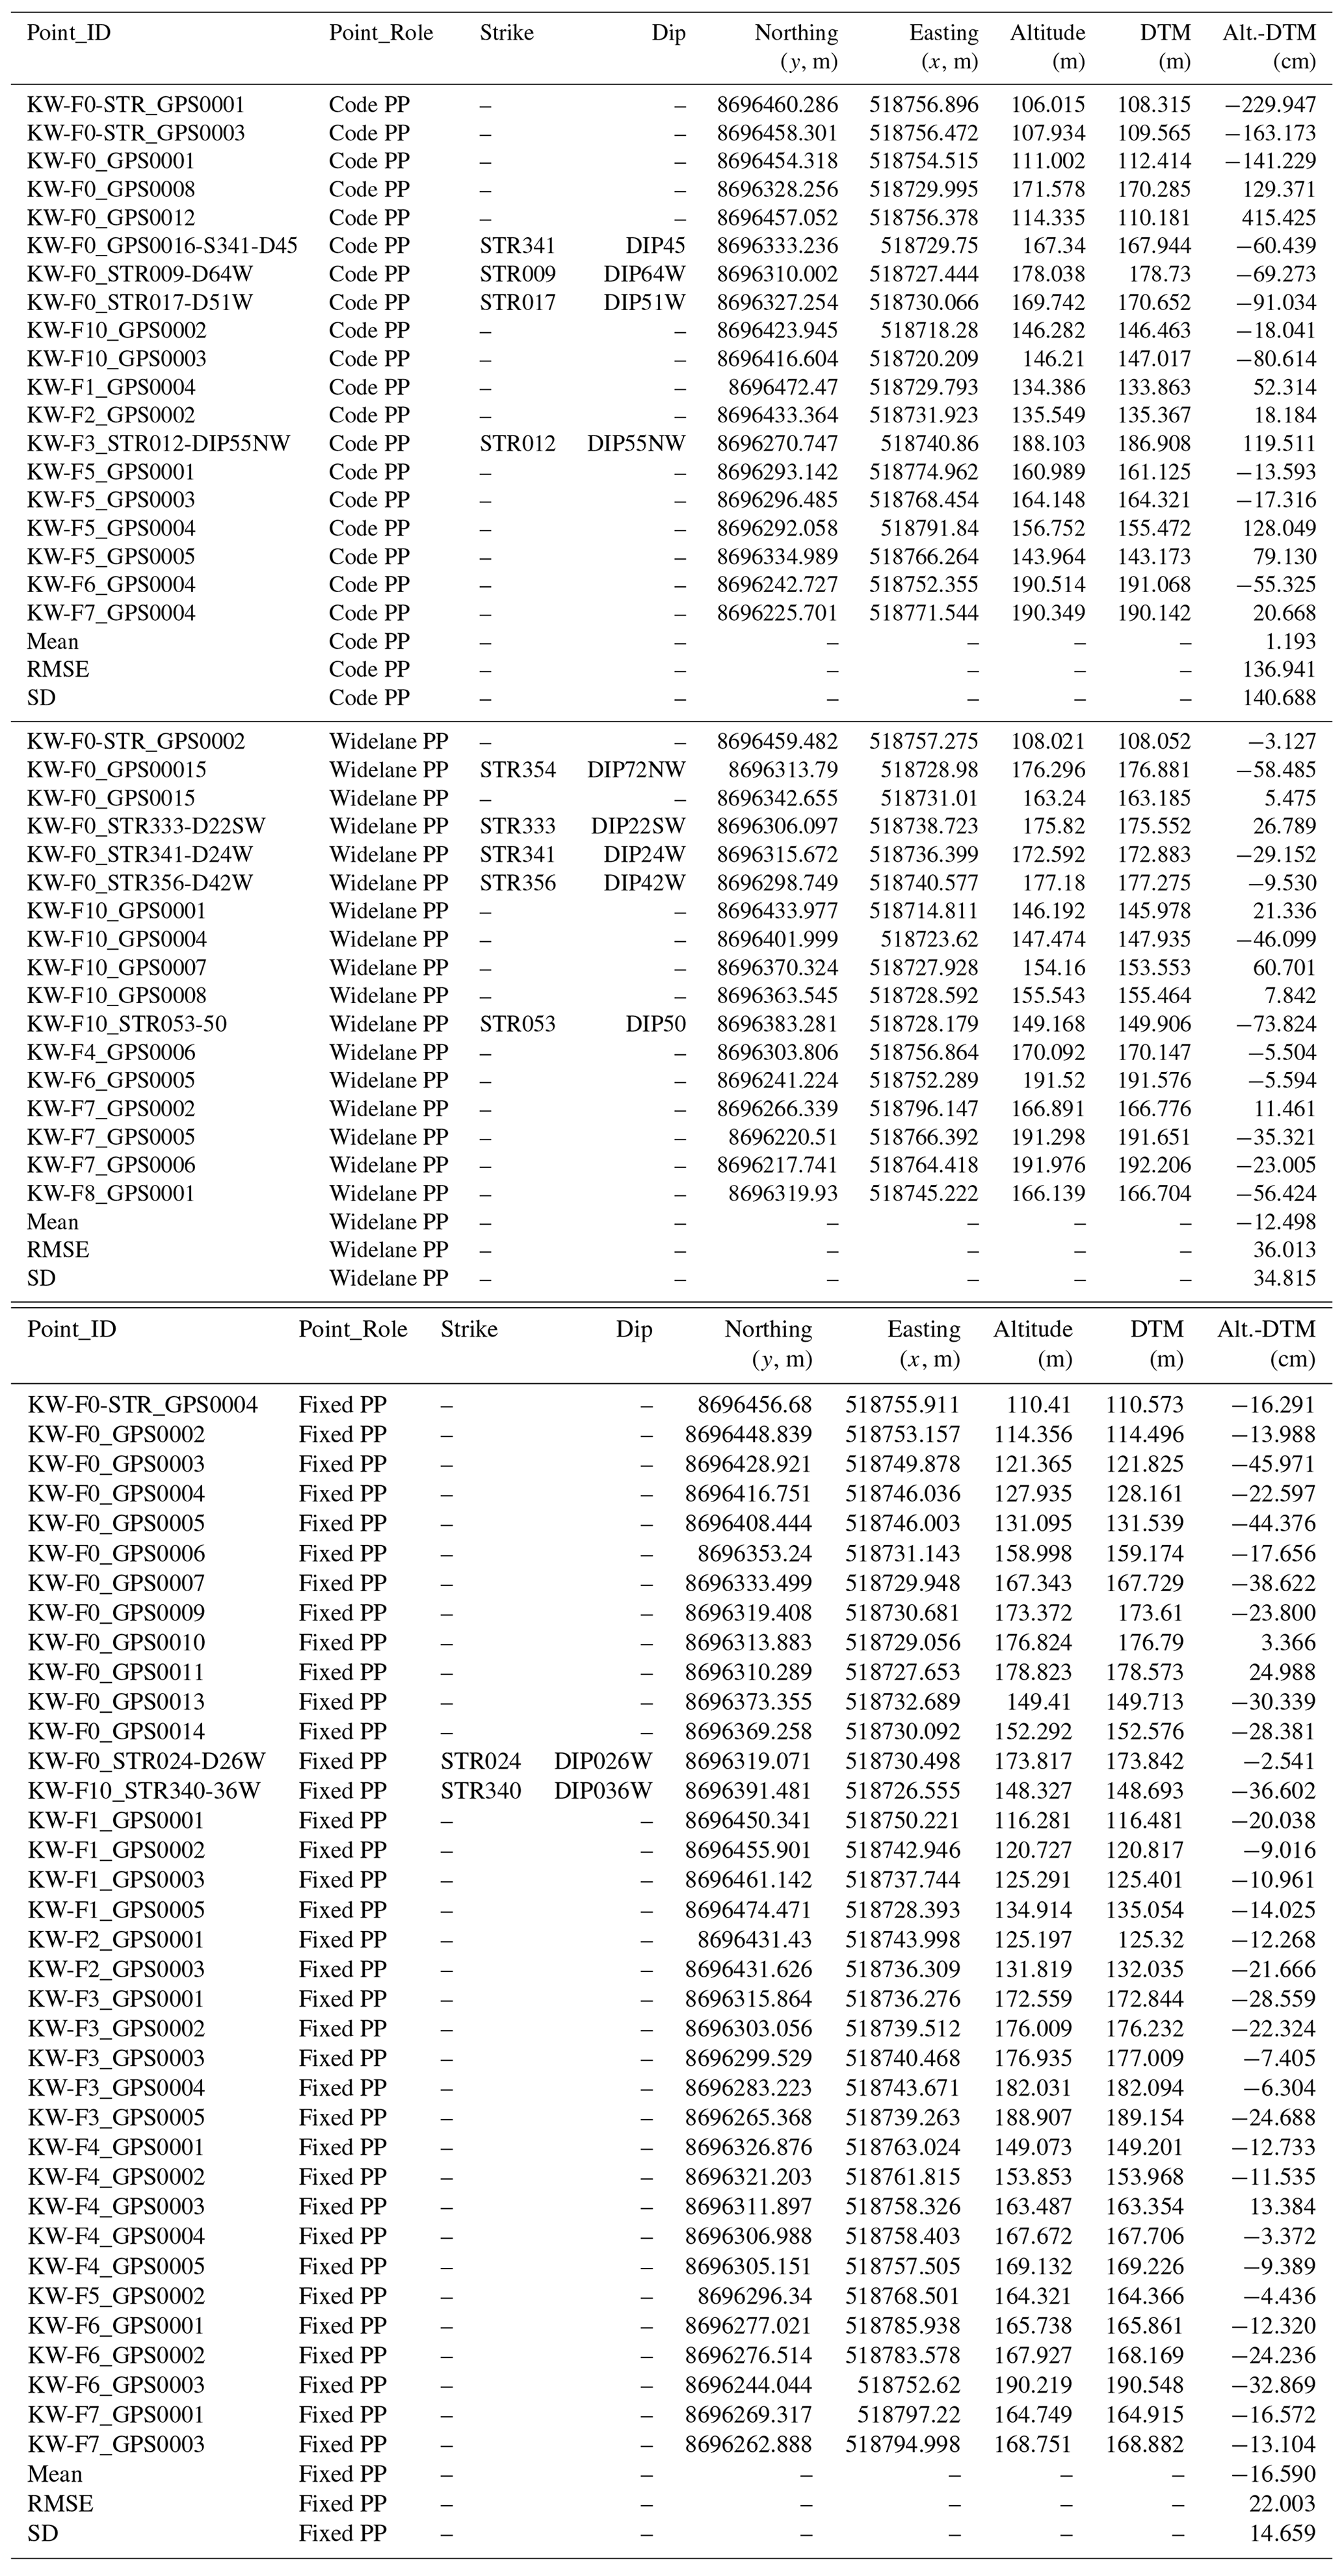
An additional 72 points were measured to constrain fault locations and orientations in the outcrop, so-called ground-truthing points (Table C1, Fig. 2). Post-processing of the points led to 19 code PP, 17 wide-lane PP, and 36 fixed PP solutions, with wide-lane PP being slightly less accurate than fixed PP solutions (Table C1). Altitude comparison with the DTM yields absolute mean errors of between 1.19 and 16.59 cm. Accompanying RMSE errors show a larger spread, ranging from 1.37 m for code PP to 0.22 m for fixed PP solutions. As is also the case for the control points, errors are largest in the lowermost part of the outcrop close to the stream, where GNSS coverage is affected by horizon obstruction in the gulley. The ground-truthing points show larger errors than those recorded for the GCPs and/or CPs. Measured a year after the UAV survey, the error difference may be indicative of geological processes (e.g. active-layer freeze–thaw) acting on the outcrop, as also evidenced from the comparison with the published 5 m resolution DTM reference (Norwegian Polar Institute, 2014).
The Konusdalen West DTM differs, on average, by +0.927 m (SD 0.38 m) from the reference (Fig. 6). The largest positive deviations (< 5.11 m) are observed along the steepest section at the outcrop's eastern side. A few negative deviations (> −0.73 m) are found towards the west. The differences fall within the 2 to 5 m range listed for the standard deviation of the reference data set (Norwegian Polar Institute, 2014) and suggest that both DTMs are in agreement.
The DTM is of high enough quality for the generation of slope and aspect maps (Fig. 6) and high-resolution orthomosaics. The latter (e.g. Figs. 7b, 9) complement the data package with view-specific resolutions of up to 8 mm per pixel, which is twice as detailed as what is available for the DTM. Figure 7b depicts the highest resolution afforded by the data package. Fractures and other observations up to sub-centimetre scales can be identified and annotated as georeferenced features.
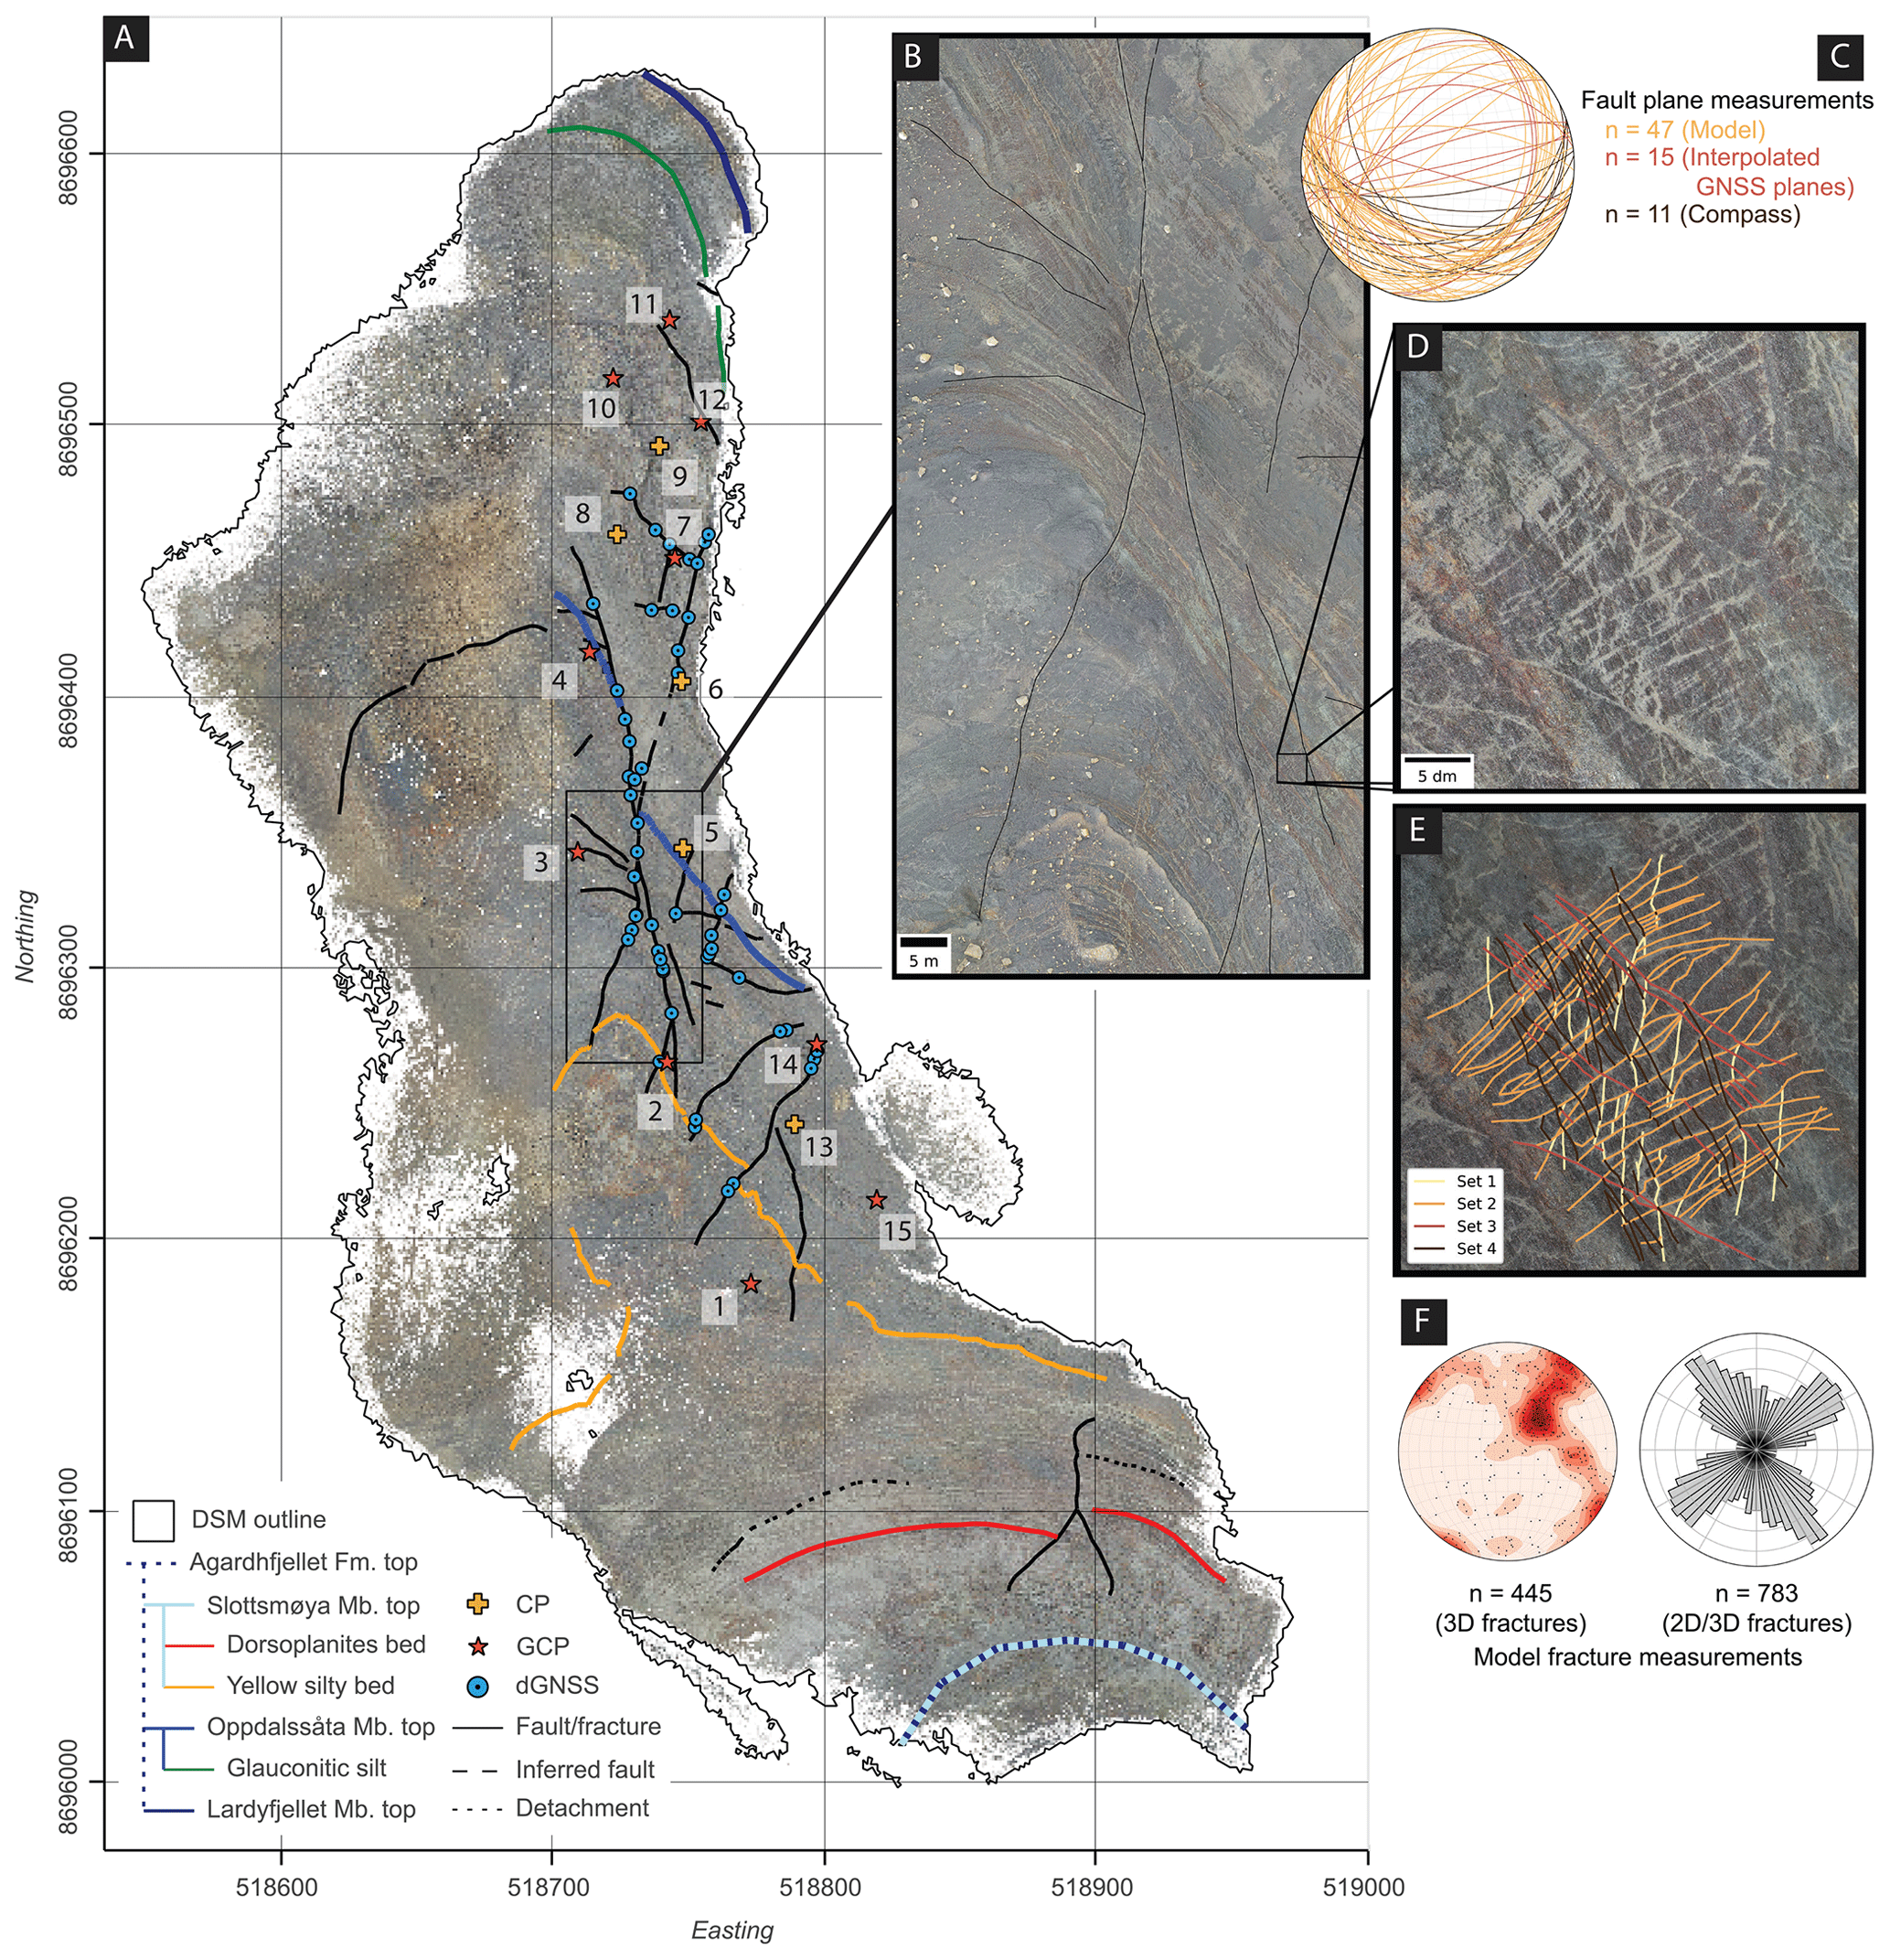
Figure 7High-resolution orthomosaics, stratigraphic units, and structural measurements across the study area. (a) Top-down view orthomosaic of the outcrop, including control point locations and basic interpretations. Control points are subdivided into dGNSS points, ground control points, and check points. (b) The 50 m × 100 m zoom-in shows the lower part of the Slottsmøya Member, including major structural elements. (c) Stereonet of field and model structural measurements of the faults. Compass measurements are supplemented by GNSS point plane measurements and model measurements. (d) The orthomosaic is of high enough resolution to identify and delineate sub-centimetre-scale features, as with the annotated fracture sets show in (e). (f) Stereonet of model-picked fractures from the sub-vertical part of the outcrop and rose diagram of model-picked fracture orientations across (e). Only 3D or multi-segment fractures were included in the stereonet. Maps use the WGS 84/UTM Zone 33N (EPSG:32633) projection.
The outline of the DTM visualises minor gaps in the data sets, including lower data coverage toward the edges of the model. The presence of two larger, low-density areas is also marked in Fig. 7 by interior polygons and is a result of insufficient image coverage due to operator selection of better exposure and manually operated UAV flights.
Topographic challenges and the remoteness of the site prevented the use of autonomous drone missions. Like most of Svalbard, the study area does not have telecommunication coverage, ruling out internet-supported, advanced flight-planning services. Offline solutions exist but do not adjust the flight path to account for elevation changes and require high-resolution terrain models to be available. The outcrop covers approximately 170 m of elevation difference and features several near-vertical sections next to a narrow gulley (Fig. 6), further complicating automation and consistency of image acquisition.
Few other low-confidence, low-point- or low-vertex-density areas exist and are shared by all worked-up products, i.e, DTM, DOM, and orthomosaics. We deem these mainly to be a result of confidence-enhancing filtering steps that were applied to the tie points and dense cloud, a necessity in the processing workflow to assure output accuracy.
Confidence and density remain highest in the area covered by GCPs and/or CPs, focused on by a higher proportion of flights. Even in areas affected by quality reductions, the data remain of sufficient quality for a quantitative assessment at lower resolutions and inherently capture enough evidence for future users to have a realistic expectation of data availability.
The high-quality DOM data allow quantitative interpretation of the entire outcrop, including deciphering the sedimentological and structural evolution of the area. When combined with local geoscientific data sets and fault core architecture observations, the quantifiable data sets combine into a powerful tool that lends itself to detailed integrated studies of the outcrop.
4.1 Stratigraphic–structural integration
The Konusdalen West DOM spans the middle-upper successions of the Agardhfjellet Formation. The model covers the Slottsmøya, Oppdalssåta, and Lardyfjellet members and displays internal bed characteristics in detail, as highlighted by Figs. 7 and 9. The stratigraphic boundaries and structural features have all been annotated directly in the digital model data. The points, lines, and polygons are generated as fully georeferenced 3D data and can be easily exported, visualised, and processed by other tool sets. A brief geoscientific integration is provided by the discussion that follows, an important aspect of the applicability of the geospatial annotations and data sets.
The lower limit of the outcrop sits atop a thick, inconspicuous succession of black shales beyond the lower limits of the model. At the very base of the DOM, a glauconitic bed and limestone concretions mark the transition from the Lardyfjellet to the Oppdalssåta members. Only the uppermost 10 m of the Lardyfjellet Member's succession of dark shale, siderite horizons, and lenses is exposed and visible within the model (Dypvik et al., 1991; Mørk et al., 1999; Koevoets et al., 2019a). The transition into the Oppdalssåta Member coincides with the start of coarsening-upwards packages that span the lower half of the Konusdalen West outcrop. The coarsening-upwards shale, siltstone, and sandstone packages come in 10 to 15 m thick intervals. The member is considered to represent the coarsest-grained interval of the Agardhfjellet Formation (Dypvik et al., 1991; Dypvik and Harris, 2001; Koevoets et al., 2019a).
An approximately 10 m thick black-shale interval overlain by a 1 m thick silty sandstone marks the transition into the Slottsmøya Member. The Slottsmøya Member consists of dark-grey to black-silty mudstone and discontinuous silty beds, including an abundance of siderite and dolomite interbeds and yellow-to-red sideritic concretions (Koevoets et al., 2019a). The member can be separated into three parts, with their transitions demarcated by the Yellow Silty and Dorsoplanites beds, both annotated in the Konusdalen West DOM and orthomosaics (Collignon and Hammer, 2012). The succession below the Yellow Silty Bed is dominated by siderite beds. The sequence above grades from a (paper) shale into a very fine sandstone succession commonly abundant with ammonites, i.e. the Dorsoplanites Bed. The upper limit of the Konusdalen West DOM coincides with the Myklegardfjellet Bed and the transition into the shales of the Rurikfjellet Formation.
Field and digital measurements identified at least two dozen mainly northeast–southwest-trending normal and east–west antithetic faults within the Oppdalssåta and lower Slottsmøya members (Figs. 7c, 9; Nakken, 2020). These orientations are consistent with faulting affecting the Wilhelmøya Subgroup reservoir and the Lardyfjellet and Oppdalen members of the Agardhfjellet Formation. Faulting in both sequences has been attributed to Palaeogene transpression during and following the evolution of the WSFTB (Mulrooney et al., 2018; Ogata et al., 2014). The Slottsmøya Member sequences up to the Dorsoplanites Bed show evidence of strong shearing, exemplified by multiple detachment planes and numerous associated, steeply dipping thrust faults. The shear zone is a well-documented phenomenon in the upper Agardhfjellet and lower Rurikfjellet formations, one of two main detachment zones affecting the reservoir and cap rock of the Longyearbyen CO2 Lab-targeted reservoir cap rock system (Ogata et al., 2014; Braathen et al., 1997; Bergh et al., 1997).
Exposed fault lengths vary between 1 m and a few tens of metres, while offsets range from the centimetre to decametre scale. Faults are generally disconnected, with the exception of a large, through-going fault that offsets a smaller, north–south-striking fault at 8.5 m across the Oppdalssåta Member, as seen in Fig. 7b. Continuation of the two faults into the lower half of the Slottsmøya Member is characterised by a splay-like structure that continues past the Yellow Silty Bed. Shallow excavation along the fault plane of the through-going fault provided insights into the thickness variations and heterogeneities within the fault core. Thickness increased with fault displacement and more competent host rock (up to 1.5 m). The fault core remained narrow (ø: < 10 cm) within intervals dominated by black shales.
4.2 Field and digital data across scales
With sub-centimetre-scale resolutions, the digital data assets support the extraction of structural and sedimentological data across a range of scales. For instance, the large fault plane can be traced in the DOM and orthomosaics even across the shale-rich intervals by identifying alterations in the surface. Orientations derived from this largely agree with those measured in the field (Fig. 7c). Due to surface and scree cover, the fault core architecture itself remained inaccessible in the surface reconstructions. As in the field, the network of anastomosing shale gouge membranes, intensely fractured shale lenses, and fault breccia, as seen in Fig. 8, were only visible across excavated cross-sections. Larger features, where exposed at the surface, could be distinguished from both field observations and digital assets alike. Iron-cemented carbonate lenses were found in the lower-middle sequences of the Oppdalssåta Member, where such beds are abundant. The lenses were oriented in an elongate manner parallel to the fault axis and were intensely fractured.
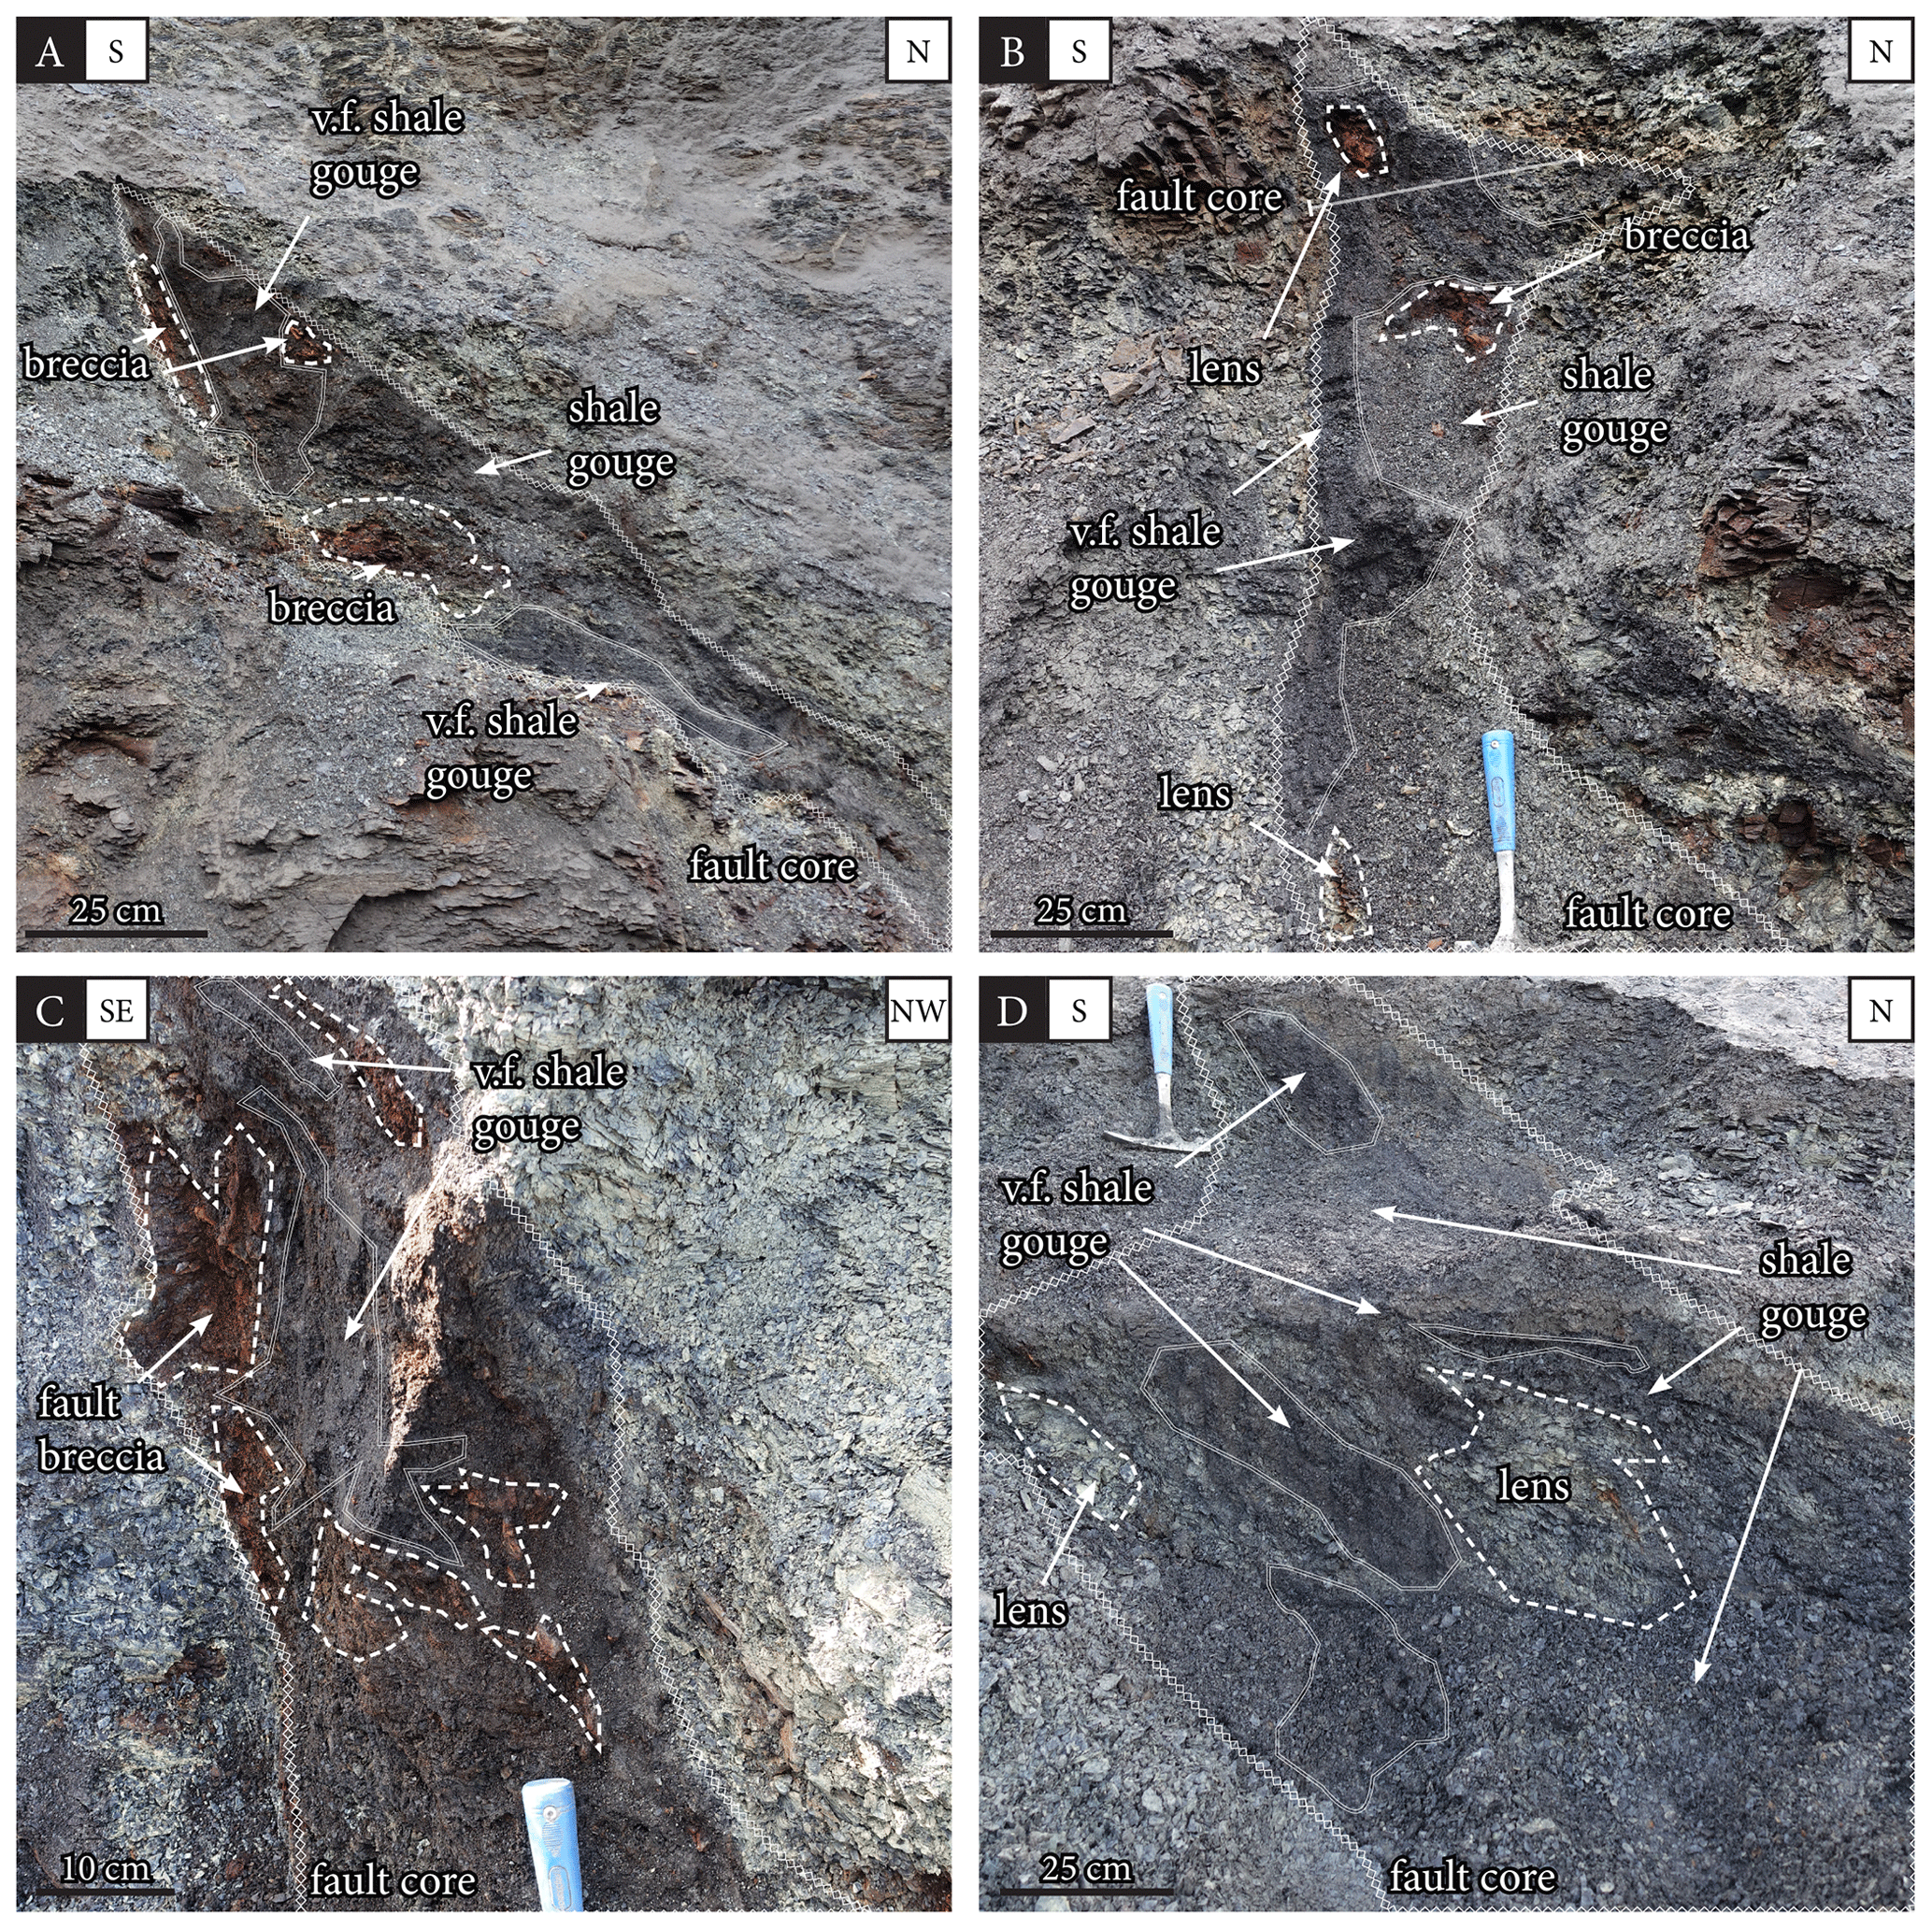
Figure 8Fault core architectures at different points in the Konusdalen West outcrop. Fault core thickness varies depending on host rock lithology. Fault breccia and heavily fractured lenses are encompassed by fine to very fine shale membranes. Image locations are indicated in Fig. 9.
The digital and tiled models of the Konusdalen West outcrop are of high enough quality to map individual fractures with apertures smaller than 1 cm, as shown in Fig. 7d–e. Open fractures and light-coloured, mineralised veins following lineaments are found throughout the digitalised interval in three primary fracture sets, covering north–south-, northeast–southwest-, and northwest–southeast-striking orientations. Digital fracture tracing enables the quantification, validation, and modelling of these networks, as well as the extraction of orientations and fracture sets, as shown in Fig. 7d–f (Betlem et al., 2023). Although this contribution implemented the fracture analysis tool NetworkGT, other fracture analysis tools such as FracPaQ exist and have been used in this and similar settings (e.g. through FracPaQ, Healy et al., 2017; Rizzo et al., 2020, 2021). Fracture analysis facilitates a comprehensive appraisal of the fracture network and its associated permeability, capturing the intricate details of fracture size, density distribution, and connectivity. Recent work by Rizzo et al. (2023) illustrates this potential as it implements an earlier iteration of the Konusdalen West DOM that details the extraction of quantitative data on the fault and fracture network across the lowermost cap rock. Specifically, Rizzo et al. (2023) integrated the DOM-derived fracture network with laboratory-based, stress permeability data to model upscaled permeability and fluid leakage potential across two windows in the outcrop, targeting the Slottsmøya Member splay-like structure and the silty cliff formers in the upper and lower parts of the outcrop, respectively.
4.3 The Longyearbyen CO2 Lab: DOMs and carbon sequestration
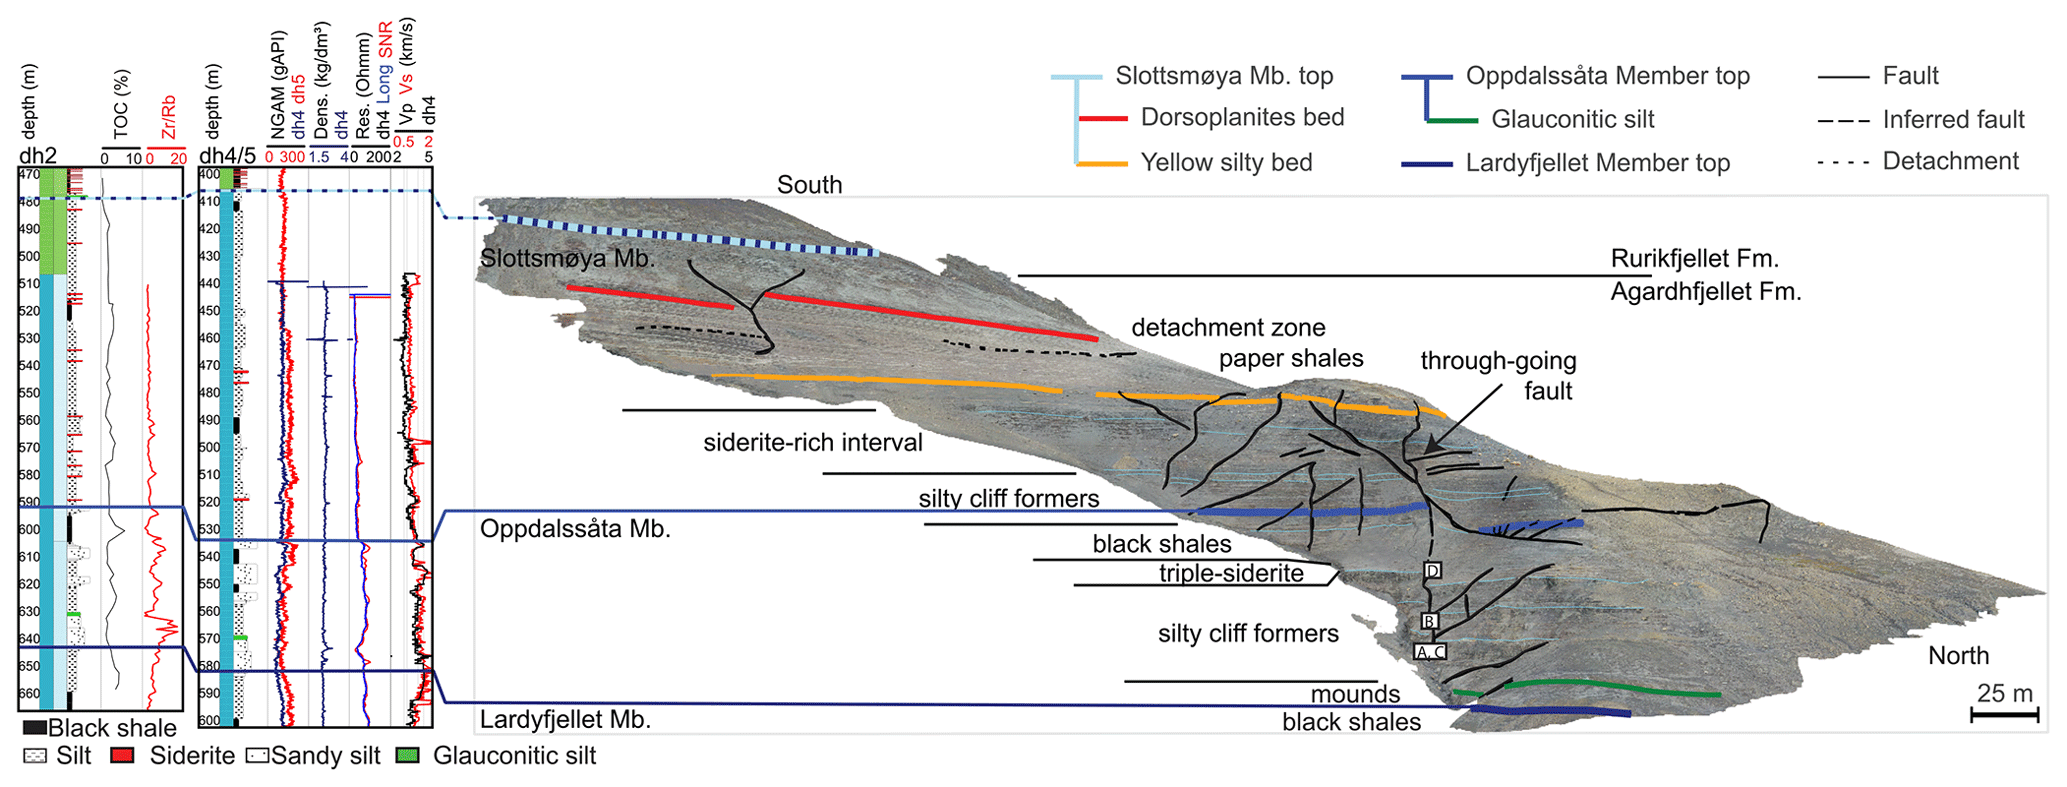
Figure 9Side view orthomosaic of the Konusdalen West DOM coupled with selected borehole data and borehole–outcrop integrations. Borehole data are courtesy of the Longyearbyen CO2 Lab, supplemented by data from Koevoets et al. (2019a). Labels (a)–(d) depict the locations of the images of Fig. 8.
Digital outcrop analysis coupled with multi-physical data and laboratory measurements can be used to create accurate coupled geological models. The Konusdalen West DOM can be directly integrated with the data available through the Longyearbyen CO2 Lab that include borehole and drill core data (Fig. 9) (Schaaf et al., 2017; Nakken, 2020; Løvlie, 2020; Ogata et al., 2012, 2014). The digital data assets further complement the extensive set of available fracture data that cover both the outcrop (e.g. Løvlie, 2020; Nakken, 2020; Ogata et al., 2014) and drill cores from the fully cored cap rock sequences (Ogata et al., 2014; Olaussen et al., 2019). This forms an ideal starting point for stratigraphic correlation at the bed resolution that enables the generation of high-resolution, outcrop-truthed geo-models suitable for numerical modelling, the mapping of discretised fracture networks, appraisal of fluid flow, and the constraint of the damage zone around faults. These, in turn, can inform the design and operation of gas storage projects, enabling more effective containment strategies, improving risk assessments, and ultimately leading to more successful storage initiatives. In this context, the Konusdalen West DOM is key to the appraisal of a regionally important cap rock.
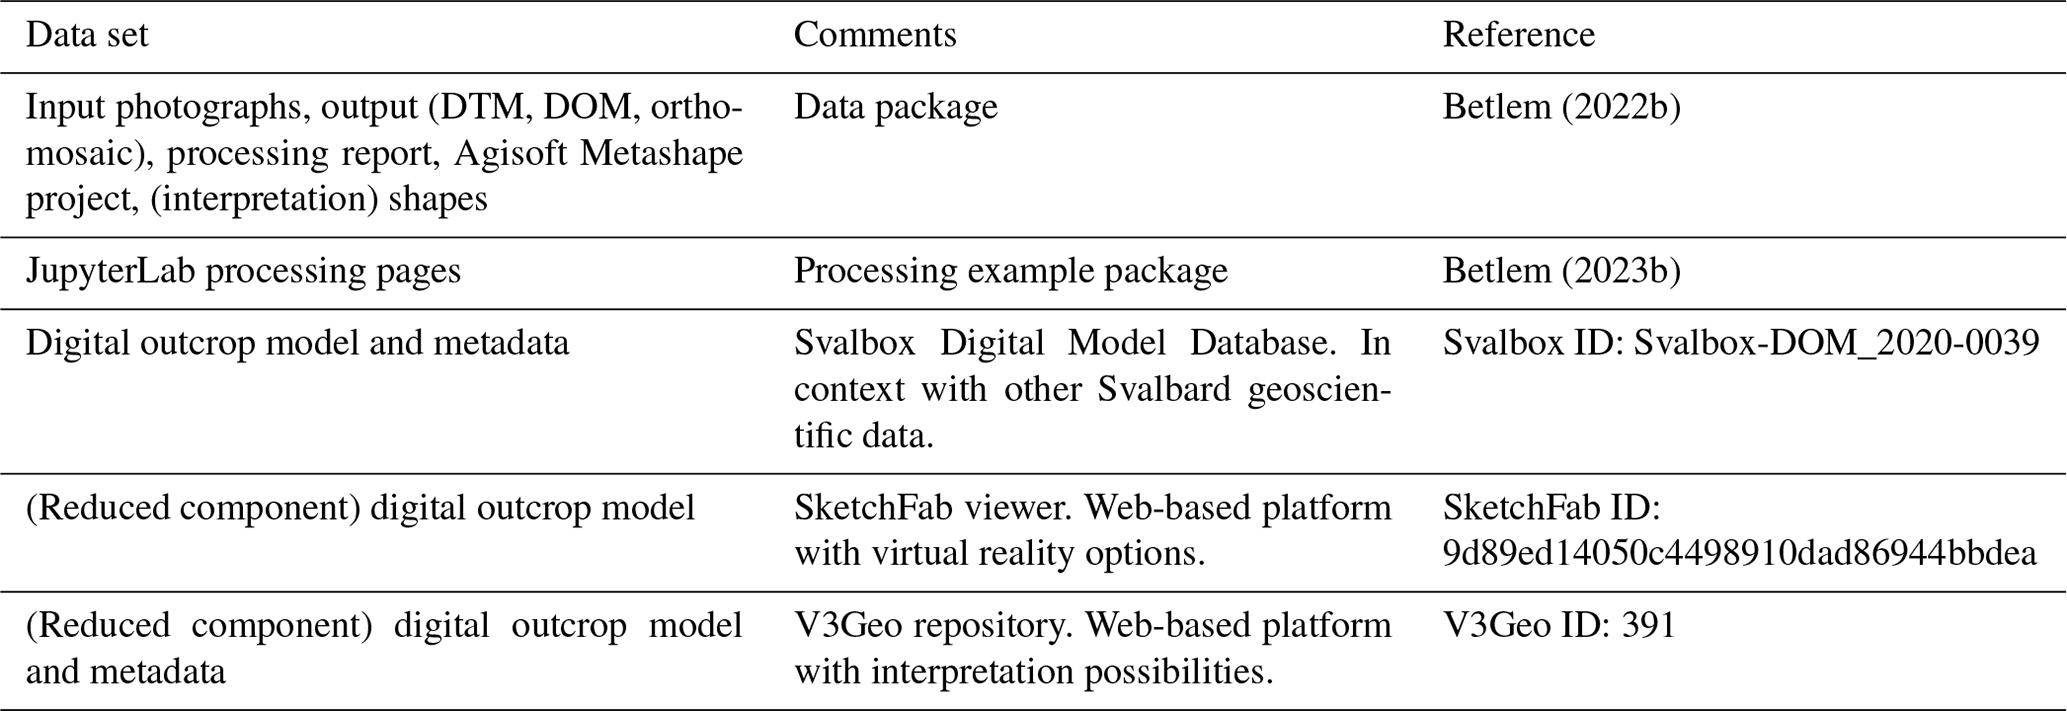
The full Konusdalen West model, including input photographs; the processing report; and textured, tiled and surface models, can be freely downloaded from the Norwegian National Infrastructure for Research Data Research Data Archive (Norstore; https://doi.org/10.11582/2022.00027, Betlem, 2022b). Visualisation and interpretation are possible through freeware (e.g. Agisoft's Viewer, Blender) and commercial software like LIME (Buckley et al., 2019) and VRGS (Hodgetts et al., 2015). Reduced-size textured models and corresponding metadata are available online through the Svalbox Digital Model Database (Betlem et al., 2023), SketchFab, and V3Geo (Buckley et al., 2022), Table 2.
The full data set (Betlem, 2022b) consists of the following files and zipped archives:
-
a representative overview image file of the outcrop
-
processing reports in PDF and HTML format
-
data.zip archive containing input UAV imagery, including disabled photos, and input differential GNSS data, including GCP coordinates, field measurements, and related errors
-
metashape.zip archive containing the Agisoft Metashape project featuring sparse- and dense-point clouds, mesh-including textures, tiled model, DTM, and orthomosaics
-
export.zip archive containing exported DOM, DTM, and orthomosaic data, as well as geopackages with delineation and structural measurements of geological features in EPSG:32633 and local CRS (EPSG:4978).
The JupyterLab processing pages and examples have been uploaded to the Zenodo data repository under https://doi.org/10.5281/zenodo.10182529 (Betlem, 2023b).
We present high-resolution digital models of the faulted, shale-dominated, Agardhfjellet Formation cap rock succession in Svalbard. The Konusdalen West digital outcrop model (DOM) has been ground truthed via dGNSS and has been processed according to community standards to improve confidence and reduce errors. The digital models feature maximum resolutions of 8 mm per pixel and outlier-removed, overall spatial accuracies of less than 10 cm. The (textured) surface models and orthomosaics enable the deciphering of the sedimentological and structural evolution of the area, including the delineation of sub-centimetre-scale features such as fractures. Areas of reduced quality stem mainly from operator selection of better exposures, i.e. the eastern and best-exposed part of the outcrop, and confidence-increasing processing. The quality of the otherwise pristine, faulted, mudstone-dominated outcrop is not affected. Further, the data capture the presence of obscuring features in high detail, which can be used to help constrain the composition and mechanical stability of the slope. The Konusdalen West model is suitable input for accurate, high-resolution fracture mapping and geo-modelling, especially when combined with available regional and Longyearbyen CO2 Lab data sets. As time-equivalent stratigraphic intervals of the Konusdalen West outcrop are prolific regional sources and cap rocks in the Barents Sea, the presented data are invaluable for structural, analogue cap rock appraisal and fluid flow studies.
Table A1Flight counts, image IDs, counts, and other acquisition metadata. Flight metadata for flights 23–25 were disabled owing to inaccurate altitude recordings.
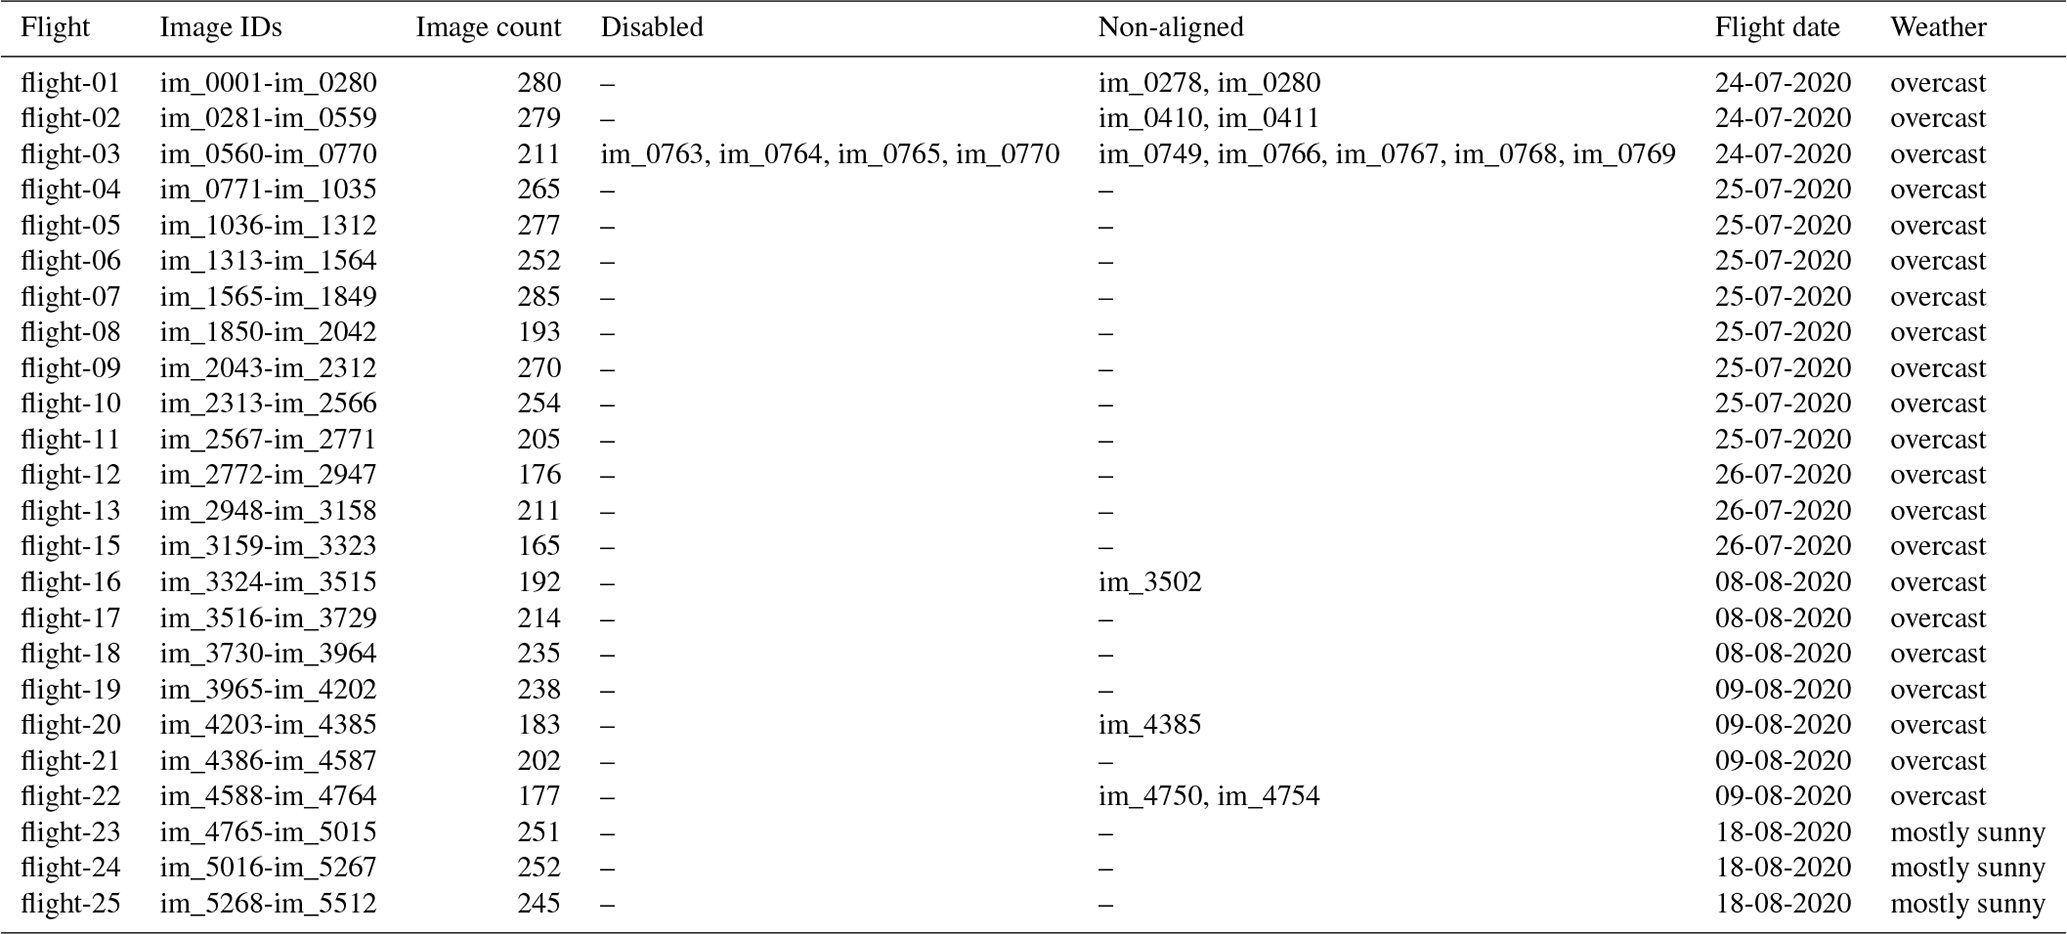
Table B1Machine specifications of the machines used for the SfM photogrammetry processing.
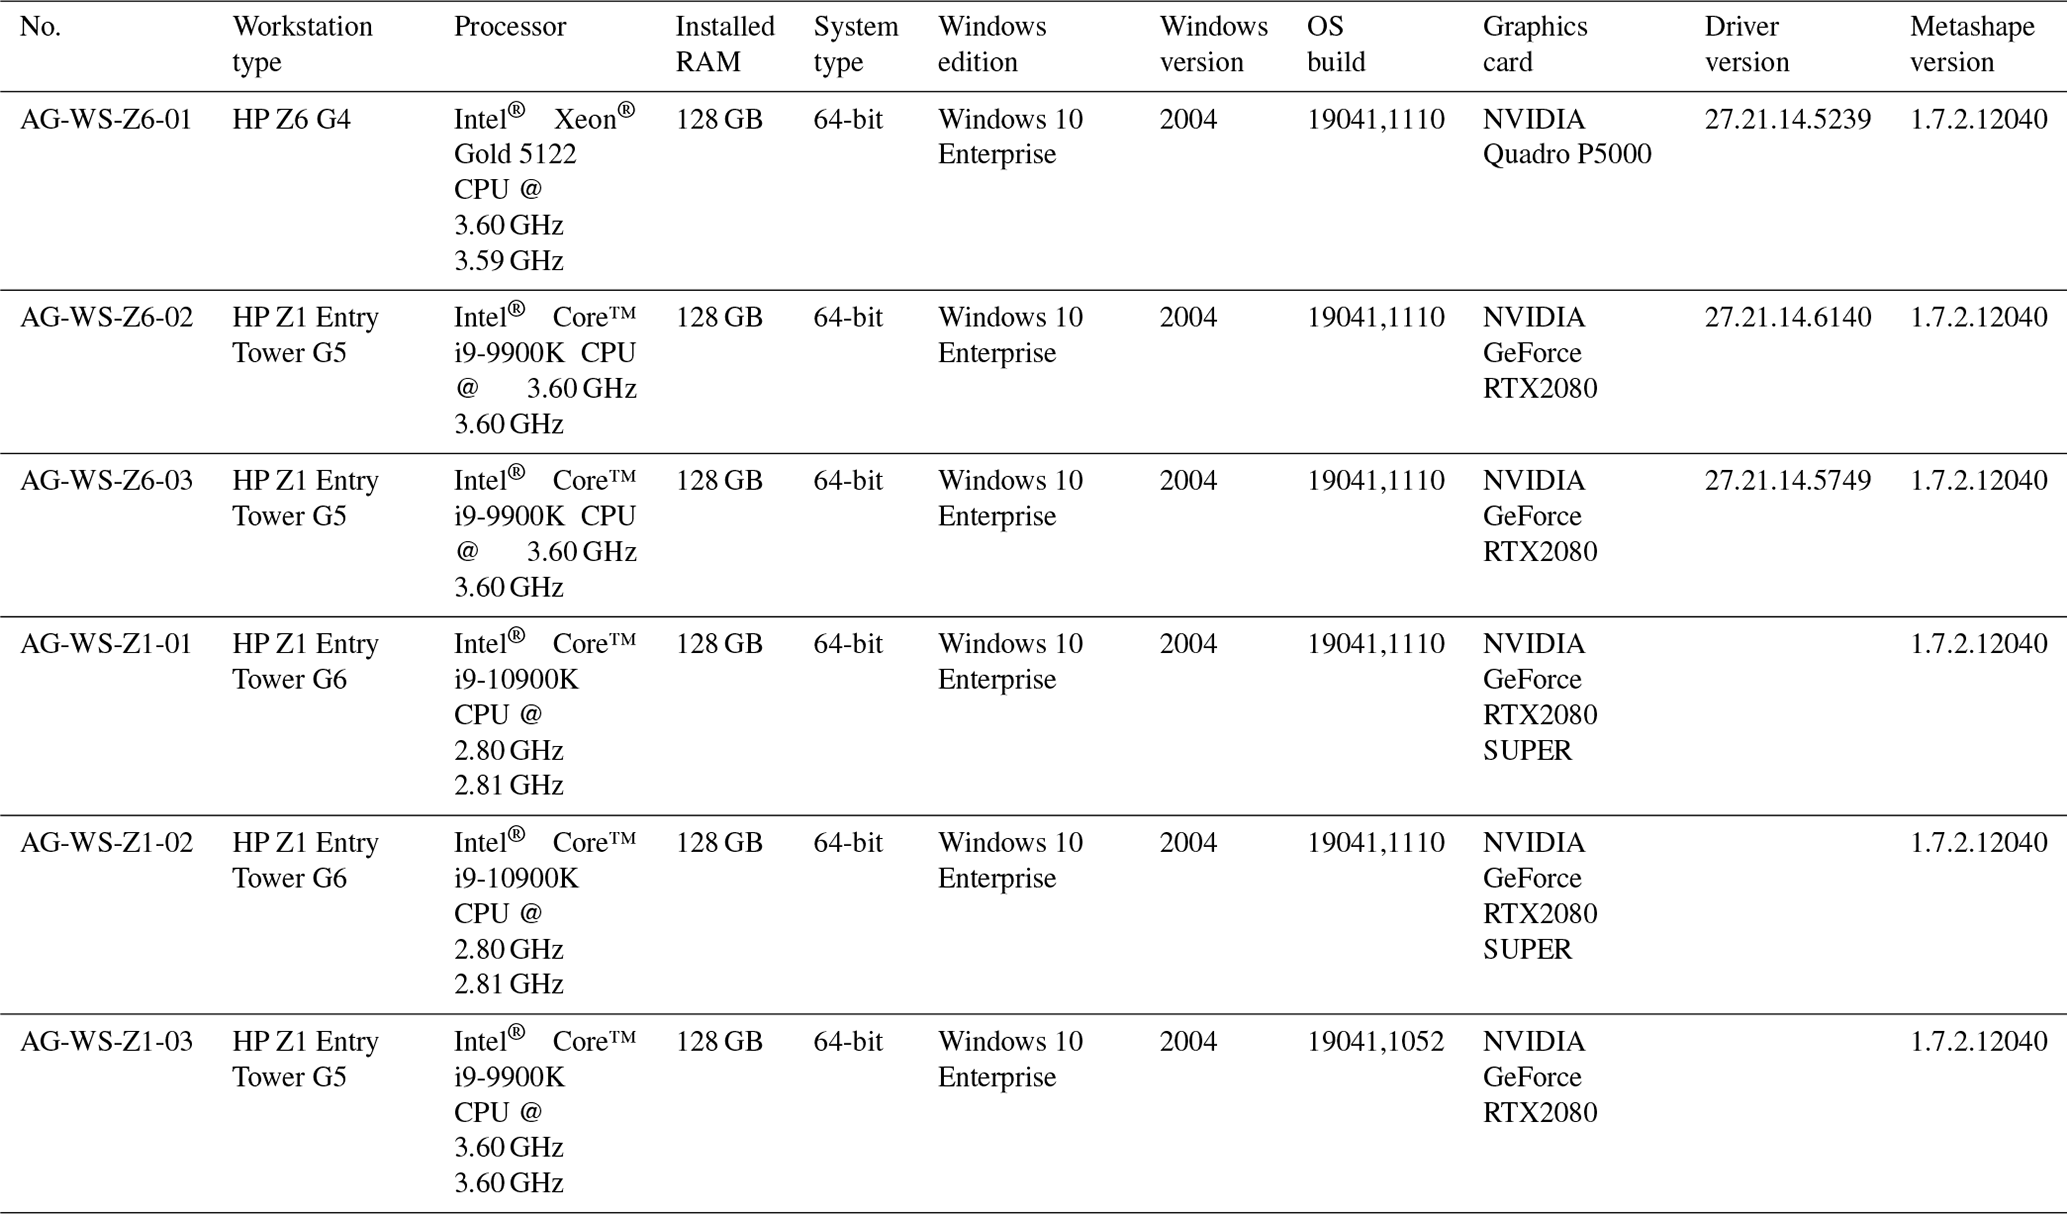
Table C1Structural measurements and ground truthing of selected faults, acquired in the summer of 2021. Easting and northing given in the WGS 84/UTM Zone 33N (EPSG:32633) projection. The calculated orthogonal heights use the Earth Gravitational Model 2008 (Pavlis et al., 2008).
PB: conceptualisation, data curation, formal analysis, funding acquisition, investigation, methodology, project administration, software, validation, visualisation, writing – original draft preparation, writing – review and editing. TB: formal analysis, investigation, methodology, validation, writing – review and editing. GL: formal analysis, investigation, validation, writing – review and editing. SO: formal analysis, funding acquisition, investigation, methodology, validation, writing – review and editing. LN: conceptualisation, funding acquisition, investigation. KO: conceptualisation, funding acquisition, supervision, visualisation, writing – review and editing. KS: conceptualisation, funding acquisition, supervision, writing – review and editing.
The contact author has declared that none of the authors has any competing interests.
Publisher's note: Copernicus Publications remains neutral with regard to jurisdictional claims made in the text, published maps, institutional affiliations, or any other geographical representation in this paper. While Copernicus Publications makes every effort to include appropriate place names, the final responsibility lies with the authors.
We sincerely appreciate the data provided by the UNIS CO2 Lab and the educational licenses provided by Schlumberger (Petrel), Cegal (Blueback plugins) and Advanced Logic Technology (WellCAD). We further thank our colleagues, in particular Nil Rodes, Aleksandra Smyrak-Sikora, Julian Janocha, Richard Hann, and Karoline Løvlie, for the meaningful discussions and their support during the three extensive field campaigns, some plagued by polar bears. Finally, we thank David Tanner, Niklas W. Schaaf, an anonymous reviewer and our editor Kirsten Elger for the constructive feedback that improved the original paper.
This research has been supported by the Norwegian CCS Research Centre (NCCS; industry partners and The Research Council of Norway (RCN); grant no. 257579) and the Research Centre for Arctic Petroleum Exploration (ARCEx; industry partners and RCN; grant no. 228107), in addition to three Svalbard Science Forum Arctic Field Grants (RCN grant nos. 295627, 310638 and 322259).
This paper was edited by Kirsten Elger and reviewed by David Tanner and one anonymous referee.
Barnes, R., Gupta, S., Traxler, C., Ortner, T., Bauer, A., Hesina, G., Paar, G., Huber, B., Juhart, K., Fritz, L., Nauschnegg, B., Muller, J.-P., and Tao, Y.: Geological Analysis of Martian Rover-Derived Digital Outcrop Models Using the 3-D Visualization Tool, Planetary Robotics 3-D Viewer-PRo3D, Earth Space Sci., 5, 285–307, https://doi.org/10.1002/2018EA000374, 2018. a
Bergh, S. G., Braathen, A., and Andresen, A.: Interaction of Basement-Involved and Thin-Skinned Tectonism in the Tertiary Fold-Thrust Belt of Central Spitsbergen, Svalbard1, AAPG Bull., 81, 637–661, https://doi.org/10.1306/522B43F7-1727-11D7-8645000102C1865D, 1997. a, b
Betlem, P.: Automated Metashape Package, Zenodo [code], https://doi.org/10.5281/zenodo.6448154, 2022a. a
Betlem, P.: Svalbox-DOM_2020-0039, Norstore [data set], https://doi.org/10.11582/2022.00027, 2022b. a, b, c, d, e
Betlem, P.: De-Risking Top Seal Integrity: Imaging Heterogeneity across Shale-Dominated Cap Rock Sequences, Ph.D. thesis, Faculty of Mathematics and Natural Sciences, University of Oslo, No. 2667, ISSN 1501-7710, http://hdl.handle.net/10852/105611, 2023a. a
Betlem, P.: Svalbox-DOM_2020-0039: Supplementary Material and Processing Examples, Zenodo [code], https://doi.org/10.5281/zenodo.10182529, 2023b. a, b
Betlem, P., Rodés, N., Birchall, T., Dahlin, A., Smyrak-Sikora, A., and Senger, K.: Svalbox Digital Model Database: A Geoscientific Window into the High Arctic, Geosphere, 19, 1640–1666, https://doi.org/10.1130/GES02606.1, 2023. a, b, c, d, e, f, g, h
Bilmes, A., D'Elia, L., Lopez, L., Richiano, S., Varela, A., Alvarez, M. d. P., Bucher, J., Eymard, I., Muravchik, M., Franzese, J., and Ariztegui, D.: Digital Outcrop Modelling Using “Structure-from- Motion” Photogrammetry: Acquisition Strategies, Validation and Interpretations to Different Sedimentary Environments, J. South Am. Earth Sci., 96, 102325, https://doi.org/10.1016/j.jsames.2019.102325, 2019. a
Birchall, T., Senger, K., Hornum, M., Olaussen, S., and Braathen, A.: Underpressure of the Barents Shelf: Causes and Implications for Hydrocarbon Exploration, AAPG Bull., 104, 2267–2295, https://doi.org/10.1306/02272019146, 2020. a
Braathen, A., Bergh, S. G., and Maher Jr., H. D.: Structural Outline of a Tertiary Basement-cored Uplift/Inversion Structure in Western Spitsbergen, Svalbard: Kinematics and Controlling Factors, Tectonics, 14, 95–119, https://doi.org/10.1029/94TC01677, 1995. a
Braathen, A., Berc, S. G., and Maher, H. D.: Thrust Kinematics in the Central Part of the Tertiary Transpressional Fold-Thrust Belt in Spitsbergen, Geological Survey of Norway, 433, 32–33, 1997. a
Braathen, A., Bælum, K., Christiansen, H. H., Dahl, T., Eiken, O., Elvebakk, H., Hansen, F., Hanssen, T. H., Jochmann, M., and Johansen, T. A.: The Longyearbyen CO2 Lab of Svalbard, Norway-initial Assessment of the Geological Conditions for CO2 Sequestration, Norw. J. Geol., 92, 353–376, 2012. a, b
Bradski, G.: The OpenCV Library, Dr. Dobb's J., 25, 120–123, 2000. a
Buckley, S. J., Ringdal, K., Naumann, N., Dolva, B., Kurz, T. H., Howell, J. A., and Dewez, T. J.: LIME: Software for 3-D Visualization, Interpretation, and Communication of Virtual Geoscience Models, Geosphere, 15, 222–235, https://doi.org/10.1130/GES02002.1, 2019. a
Buckley, S. J., Howell, J. A., Naumann, N., Lewis, C., Chmielewska, M., Ringdal, K., Vanbiervliet, J., Tong, B., Mulelid-Tynes, O. S., Foster, D., Maxwell, G., and Pugsley, J.: V3Geo: A Cloud-Based Repository for Virtual 3D Models in Geoscience, Geosci. Commun., 5, 67–82, https://doi.org/10.5194/gc-5-67-2022, 2022. a, b
Burnham, B. S., Bond, C., Flaig, P. P., van der Kolk, D. A., and Hodgetts, D.: Outcrop Conservation: Promoting Accessibility, Inclusivity, and Reproducibility through Digital Preservation, Sediment. Record, 20, 5–14, 2022. a, b, c
Butler, H., Chambers, B., Hartzell, P., and Glennie, C.: PDAL: An Open Source Library for the Processing and Analysis of Point Clouds, Comput. Geosci., 148, 104680, https://doi.org/10.1016/j.cageo.2020.104680, 2021. a
Cawood, A. J. and Bond, C. E.: eRock: An Open-Access Repository of Virtual Outcrops for Geoscience Education, GSA Today, 28, 36–37, 2019. a
Collignon, M. and Hammer, Ø.: Petrography and Sedimentology of the Slottsmøya Member at Janusfjellet, Central Spitsbergen., Norw. J. Geol., 92, 89–101, 2012. a, b, c
Crameri, F., Shephard, G. E., and Heron, P. J.: The Misuse of Colour in Science Communication, Nat. Commun., 11, 5444, https://doi.org/10.1038/s41467-020-19160-7, 2020. a
Dallmann, W. K., Atakan, K., Blomeier, D., Bond, D., Christiansen, H., Elvevold, S., Forwick, M., Gerland, S., Grundvåg, S.-A., Hagen, J.-O., Hormes, A., Jernas, P. E., Kohler, J., Laberg, J. S., Majka, J., Mørk, A., Nasuti, A., Nuth, C., Olaussen, S., Olesen, O., Ottesen, R. T., Pavlov, V., Pavlova, O., Piepjohn, K., Reymert, P. K., Salvigsen, O., Sander, G., Storheim, B. M., Sundjord, A., and Vorren, T. O.: Geoscience Atlas of Svalbard, Rapport 148, Norsk Polar Institutt, Tromsø, Norway, ISBN 978-82-7666-312-9, 2015 a
Dering, G. M., Micklethwaite, S., Thiele, S. T., Vollgger, S. A., and Cruden, A. R.: Review of Drones, Photogrammetry and Emerging Sensor Technology for the Study of Dykes: Best Practises and Future Potential, J. Volcanol. Geoth. Res., 373, 148–166, https://doi.org/10.1016/j.jvolgeores.2019.01.018, 2019. a, b, c
Donnadieu, F., Kelfoun, K., van Wyk de Vries, B., Cecchi, E., and Merle, O.: Digital Photogrammetry as a Tool in Analogue Modelling: Applications to Volcano Instability, J. Volcanol. Geoth. Res., 123, 161–180, https://doi.org/10.1016/S0377-0273(03)00034-9, 2003. a
Dypvik, H. and Harris, N. B.: Geochemical Facies Analysis of Fine-Grained Siliciclastics Using Th/U, Zr/Rb and (Zr+Rb)/Sr Ratios, Chem. Geol., 181, 131–146, https://doi.org/10.1016/S0009-2541(01)00278-9, 2001. a
Dypvik, H., Eikeland, T. A., Backer-Owe, K., Andresen, A., Johanen, H., Elverhøi, A., Nagy, J., Haremo, P., and Biærke, T.: The Janusfjellet Subgroup (Bathonian to Hauterivian) on Central Spitsbergen: A Revised Lithostratigraphy, Polar Res., 9, 21–44, https://doi.org/10.1111/j.1751-8369.1991.tb00400.x, 1991. a, b, c, d, e, f
Garrido-Jurado, S., Muñoz-Salinas, R., Madrid-Cuevas, F. J., and Marín-Jiménez, M. J.: Automatic Generation and Detection of Highly Reliable Fiducial Markers under Occlusion, Pattern Recogn., 47, 2280–2292, https://doi.org/10.1016/j.patcog.2014.01.005, 2014. a
Grundvåg, S. A., Marin, D., Kairanov, B., Śliwińska, K. K., Nøhr-Hansen, H., Jelby, M. E., Escalona, A., and Olaussen, S.: The Lower Cretaceous Succession of the Northwestern Barents Shelf: Onshore and Offshore Correlations, Mar. Petrol. Geol., 86, 834–857, https://doi.org/10.1016/j.marpetgeo.2017.06.036, 2017. a, b
Harland, W. B., Anderson, L. M., Manasrah, D., Butterfield, N. J., Challinor, A., Doubleday, P. A., Dowdeswell, E. K., Dowdeswell, J. A., Geddes, I., Kelly, S. R., Lesk, E. L., Spencer, A. M., and Stephens, C. F.: The Geology of Svalbard, vol. 17, Geological Society London, London, ISBN 978-1-897799-93-2, 1997. a
Harrald, J. E. G., Coe, A. L., Thomas, R. M., and Hoggett, M.: Use of Drones to Analyse Sedimentary Successions Exposed in the Foreshore, P. Geolo. Assoc., 132, 253–268, https://doi.org/10.1016/j.pgeola.2021.02.001, 2021. a
Healy, D., Rizzo, R. E., Cornwell, D. G., Farrell, N. J. C., Watkins, H., Timms, N. E., Gomez-Rivas, E., and Smith, M.: FracPaQ: A MATLAB™ Toolbox for the Quantification of Fracture Patterns, J. Struct. Geol., 95, 1–16, https://doi.org/10.1016/j.jsg.2016.12.003, 2017. a
Henriksen, E., Ryseth, A. E., Larssen, G. B., Heide, T., Rønning, K., Sollid, K., and Stoupakova, A. V.: Chapter 10 Tectonostratigraphy of the Greater Barents Sea: Implications for Petroleum Systems, Geological Society, London, Memoirs, 35, 163–195, https://doi.org/10.1144/M35.10, 2011. a, b
Hiep, V. H., Keriven, R., Labatut, P., and Pons, J.-P.: Towards High-Resolution Large-Scale Multi-View Stereo, in: IEEE Conference on Computer Vision and Pattern Recognition (20–25 June 2009), IEEE, Miami, FL, USA, 1430–1437, https://doi.org/10.1109/CVPR.2009.5206617, 2009. a
Hirschmuller, H.: Stereo Processing by Semiglobal Matching and Mutual Information, IEEE T. Pattern Anal., 30, 328–341, 2007. a
Hodgetts, D., Seers, T., Head, W., and Burnham, B. S.: High Performance Visualisation of Multiscale Geological Outcrop Data in Single Software Environment, in: 77th EAGE Conference and Exhibition 2015, vol. 2015, European Association of Geoscientists & Engineers, Madrid, Spain, 1–5, ISSN 2214-4609, https://doi.org/10.3997/2214-4609.201412862, 2015. a
Howell, J. A., Martinius, A. W., and Good, T. R.: The Application of Outcrop Analogues in Geological Modelling: A Review, Present Status and Future Outlook, Geol. Soc. Lond. Spec. Publ., 387, 1–25, https://doi.org/10.1144/SP387.12, 2014. a
Humlum, O., Instanes, A., and Sollid, J. L.: Permafrost in Svalbard: A Review of Research History, Climatic Background and Engineering Challenges, Polar Res., 22, 191–215, https://doi.org/10.1111/j.1751-8369.2003.tb00107.x, 2003. a
Huq, F., Smalley, P. C., Mørkved, P. T., Johansen, I., Yarushina, V., and Johansen, H.: The Longyearbyen CO2 Lab: Fluid Communication in Reservoir and Caprock, Int. J. Greenh. Gas Con., 63, 59–76, https://doi.org/10.1016/j.ijggc.2017.05.005, 2017. a
James, M. R., Chandler, J. H., Eltner, A., Fraser, C., Miller, P. E., Mills, J. P., Noble, T., Robson, S., and Lane, S. N.: Guidelines on the Use of Structure-from-Motion Photogrammetry in Geomorphic Research, Earth Surf. Proc. Land., 44, 2081–2084, https://doi.org/10.1002/esp.4637, 2019. a, b, c
Kingsland, K.: Comparative Analysis of Digital Photogrammetry Software for Cultural Heritage, Digital Applications in Archaeology and Cultural Heritage, 18, e00157, https://doi.org/10.1016/j.daach.2020.e00157, 2020. a
Koevoets, M. J., Abay, T. B., Hammer, Ø., and Olaussen, S.: High-Resolution Organic Carbon–Isotope Stratigraphy of the Middle Jurassic–Lower Cretaceous Agardhfjellet Formation of Central Spitsbergen, Svalbard, Palaeogeogr. Palaeocl., 449, 266–274, https://doi.org/10.1016/j.palaeo.2016.02.029, 2016. a
Koevoets, M. J., Hammer, Ø., Olaussen, S., Senger, K., and Smelror, M.: Integrating Subsurface and Outcrop Data of the Middle Jurassic to Lower Cretaceous Agardhfjellet Formation in Central Spitsbergen, Norw. J. Geol., 99, 213–246, https://doi.org/10.17850/njg98-4-01, 2019a. a, b, c, d, e, f
Koevoets, M. K., Hammer, Ø., and Little, C. T. S.: Palaeoecology and Palaeoenvironments of the Middle Jurassic to Lowermost Cretaceous Agardhfjellet Formation (Bathonian-Ryazanian), Spitsbergen, Svalbard, Norw. J. Geol., 99, 17–40, https://doi.org/10.17850/njg99-1-02, 2019b. a, b, c
Leica Geosystems AG: Leica Viva GS16 Data Sheet, https://leica-geosystems.com/-/media/files/leicageosystems/products/datasheets/leica_viva_gs16_gnss_smart_antenna_ds.ashx (last access: 7 February 2024) 2016. a
Leon, J. X., Heuvelink, G. B. M., and Phinn, S. R.: Incorporating DEM Uncertainty in Coastal Inundation Mapping, PLOS ONE, 9, e108727, https://doi.org/10.1371/journal.pone.0108727, 2014. a
Løvlie, K. H.: Structural Deformation and Mineralogy of the Agardhfjellet and Rurikfjellet Formations in Central Spitsbergen, Svalbard, MSc Thesis, University of Oslo, Oslo, http://hdl.handle.net/10852/79780, 2020. a, b
Marques, A., Horota, R. K., de Souza, E. M., Kupssinskü, L., Rossa, P., Aires, A. S., Bachi, L., Veronez, M. R., Gonzaga, L., and Cazarin, C. L.: Virtual and Digital Outcrops in the Petroleum Industry: A Systematic Review, Earth-Sci. Rev., 208, 103260, https://doi.org/10.1016/j.earscirev.2020.103260, 2020. a
Mørk, A., Dallmann, W. K., Dypvik, H., Johannessen, E. P., Larssen, G. B., Nagy, J., Nøttvedt, A., Olaussen, S., Pchelina, T. M., and Worsley, D.: Mesozoic Lithostratigraphy, in: Lithostratigraphic lexicon of Svalbard, Upper Palaeozoic to Quaternary bedrock, Review and recommendations for nomenclature use, edoted by: Dallmann, W. K., Norwegian Polar Institute, 127–214, 1999. a, b
Mulrooney, M. J., Larsen, L., Van Stappen, J. F., Rismyhr, B., Senger, K., Braathen, A., Olaussen, S., Mørk, M. B. E., Ogata, K., and Cnudde, V.: Fluid Flow Properties of the Wilhelmøya Subgroup, a Potential Unconventional CO2 Storage Unit in Central Spitsbergen, Norw. J. Geol., 99, 85–116, https://doi.org/10.17850/njg002, 2018. a, b, c
Nakken, L.: Structural Evolution of the Lower Agardhfjellet Formation, in Central Spitsbergen: Implications for Caprock Integrity, MSc Thesis, University of Oslo, Oslo, Norway, http://hdl.handle.net/10852/79781, 2020. a, b, c
Norwegian Polar Institute: Terrengmodell Svalbard (S0 Terrengmodell), Norwegian Polar Institute [data set], https://doi.org/10.21334/NPOLAR.2014.DCE53A47, 2014. a, b, c, d, e, f, g, h, i, j
Norwegian Polar Institute: Geological Map of Svalbard (1:250000), Norwegian Polar Institute [data set], https://doi.org/10.21334/NPOLAR.2016.616F7504, 2016. a, b
Norwegian Polar Institute: NP_Ortofoto_Svalbard_WMTS_25833, Norwegian Polar Institute [data set], https://geodata.npolar.no/arcgis/rest/services/Basisdata/NP_Ortofoto_Svalbard_WMTS_25833/MapServer (last access: 19 February 2024), 2017. a
Nyberg, B., Nixon, C. W., and Sanderson, D. J.: NetworkGT: A GIS Tool for Geometric and Topological Analysis of Two-Dimensional Fracture Networks, Geosphere, 14, 1618–1634, https://doi.org/10.1130/GES01595.1, 2018. a
Ogata, K., Senger, K., Braathen, A., Tveranger, J., and Olaussen, S.: The Importance of Natural Fractures in a Tight Reservoir for Potential CO2 Storage: A Case Study of the Upper Triassic-middle Jurassic Kapp Toscana Group (Spitsbergen, Arctic Norway), Geol. Soc. Lond. Spec. Publ., 374, 395–415, https://doi.org/10.1144/SP374.9, 2012. a, b, c, d
Ogata, K., Senger, K., Braathen, A., Tveranger, J., and Olaussen, S.: Fracture Systems and Mesoscale Structural Patterns in the Siliciclastic Mesozoic Reservoir-Caprock Succession of the Longyearbyen CO2 Lab Project: Implications for Geological CO2 Sequestration in Central Spitsbergen, Svalbard, Norw. J. Geol., 94, 121–154, 2014. a, b, c, d, e, f
Ogata, K., Weert, A., Betlem, P., Birchall, T., and Senger, K.: Shallow and Deep Subsurface Sediment Remobilization and Intrusion in the Middle Jurassic to Lower Cretaceous Agardhfjellet Formation (Svalbard), Geosphere, 19, 801–822, https://doi.org/10.1130/GES02555.1, 2023. a, b
Olaussen, S., Senger, K., Braathen, A., Grundvåg, S.-A., and Mørk, A.: You Learn as Long as You Drill; Research Synthesis from the Longyearbyen CO2 Laboratory, Svalbard, Norway, Norw. J. Geol., 99, 157–188, https://doi.org/10.17850/njg008, 2019. a, b, c, d
Over, J.-S. R., Ritchie, A. C., Kranenburg, C. J., Brown, J. A., Buscombe, D. D., Noble, T., Sherwood, C. R., Warrick, J. A., and Wernette, P. A.: Processing coastal imagery with Agisoft Metashape Professional Edition, version 1.6 – Structure from motion workflow documentation: U.S. Geological Survey Open-File Report 2021–1039, 46 pp., https://doi.org/10.3133/ofr20211039, 2021. a, b
Pavlis, N., Kenyon, S., Factor, J., and Holmes, S.: Earth Gravitational Model 2008, in: SEG Technical Program Expanded Abstracts 2008, SEG Technical Program Expanded Abstracts, Society of Exploration Geophysicists, Tulsa, Olkahoma,761–763, https://doi.org/10.1190/1.3063757, 2008. a, b, c, d
PDAL Contributors: PDAL Point Data Abstraction Library, Zenodo [code], https://doi.org/10.5281/zenodo.2556738, 2018. a
Rippin, D. M., Pomfret, A., and King, N.: High Resolution Mapping of Supra-Glacial Drainage Pathways Reveals Link between Micro-Channel Drainage Density, Surface Roughness and Surface Reflectance, Earth Surf. Proc. Land., 40, 1279–1290, https://doi.org/10.1002/esp.3719, 2015. a
Rizzo, R., Forbes Inskip, N., Fazeli, H., Betlem, P., Bisdom, K., Kampman, N., Snippe, J., Senger, K., Doster, F., and Busch, A.: Modelling Geological Co2 Leakage: Integrating Fracture Permeability and Fault Zone Outcrop Analysis, SSRN [preprint], https://doi.org/10.2139/ssrn.4571419, 2023. a, b
Rizzo, R. E., Fazeli, H., Maier, C., March, R., Egya, D., Doster, F., Kubeyev, A., Kampman, N., Bisdom, K., Snippe, J., Senger, K., Betlem, P., Phillips, T., Inskip, N. F., Esegbue, O., and Busch, A.: Understanding Fault and Fracture Networks to De-Risk Geological Leakage from Subsurface Storage Sites, in: 1st Geoscience & Engineering in Energy Transition Conference, European Association of Geoscientists & Engineers, Strasbourg, France,vol. 2020, 1–5, ISSN 2214-4609, https://doi.org/10.3997/2214-4609.202021016, 2020. a
Rizzo, R. E., Fazeli, H., Doster, F., Kampman, N., Bisdom, K., Snippe, J., Senger, K., Betlem, P., and Busch, A.: Role of fault and fracture networks to de-risk geological leakage from subsurface energy sites, EGU General Assembly 2021, online, 19–30 Apr 2021, EGU21-8517, https://doi.org/10.5194/egusphere-egu21-8517, 2021. a
Rouault, E., Warmerdam, F., Schwehr, K., Kiselev, A., Butler, H., Łoskot, M., Szekeres, T., Tourigny, E., Landa, M., Miara, I., Elliston, B., Kumar, C., Plesea, L., Morissette, D., Jolma, A., and Dawson, N.: GDAL, Zenodo [code], https://doi.org/10.5281/zenodo.6352176, 2022. a
Schaaf, N. W., Senger, K., Mulrooney, M. J., Ogata, K., Braathen, A., and Olaussen, S.: Towards Characterization of Natural Fractures in a Caprock Shale: An Integrated Borehole-Outcrop Study of the Agardhfjellet For-mation, Svalbard, Arctic Norway, in: Norwegian Geological Society Winter Conference, Oslo, https://doi.org/10.13140/RG.2.2.23744.74249/1, 2017. a
Senger, K., Tveranger, J., Ogata, K., Braathen, A., and Planke, S.: Late Mesozoic Magmatism in Svalbard: A Review, Earth-Sci. Rev., 139, 123–144, https://doi.org/10.1016/j.earscirev.2014.09.002, 2014. a
Senger, K., Buckley, S. J., Chevallier, L., Fagereng, Å., Galland, O., Kurz, T. H., Ogata, K., Planke, S., and Tveranger, J.: Fracturing of Doleritic Intrusions and Associated Contact Zones: Implications for Fluid Flow in Volcanic Basins, J. Afr. Earth Sci., 102, 70–85, https://doi.org/10.1016/j.jafrearsci.2014.10.019, 2015. a
Senger, K., Brugmans, P., Grundvåg, S.-A., Jochmann, M., Nøttvedt, A., Olaussen, S., Skotte, A., and Smyrak-Sikora, A.: Petroleum, Coal and Research Drilling Onshore Svalbard: A Historical Perspective, Norw. J. Geol., 99, 3, https://doi.org/10.17850/njg99-3-1, 2019. a
Sibson, R. H.: Structural Permeability of Fluid-Driven Fault-Fracture Meshes, J. Struct. Geol., 18, 1031–1042, https://doi.org/10.1016/0191-8141(96)00032-6, 1996. a
Smith, M., Carrivick, J., and Quincey, D.: Structure from Motion Photogrammetry in Physical Geography, Prog. Phys. Geogr., 40, 247–275, https://doi.org/10.1177/0309133315615805, 2016. a
Spencer, A. M., Briskeby, P. I., Christensen, L. D., Foyn, R., Kjolleberg, M., Kvadsheim, E., Knight, I., Rye-Larsen, M., and Williams, J.: Petroleum Geoscience in Norden-exploration, Production and Organization, Episodes, 31, 115–124, 2008. a
Stevens, J.-L. R., Rudiger, P., and Bednar, J. A.: HoloViews: Building Complex Visualizations Easily for Reproducible Science, in: Proceedings of the 14th Python in Science Conference, Citeseer, 59–66, https://doi.org/10.25080/Majora-7b98e3ed-00a, 2015. a
Tinkham, W. T. and Swayze, N. C.: Influence of Agisoft Metashape Parameters on UAS Structure from Motion Individual Tree Detection from Canopy Height Models, Forests, 12, 250, https://doi.org/10.3390/f12020250, 2021. a
Tonkin, T. N., Midgley, N. G., Cook, S. J., and Graham, D. J.: Ice-Cored Moraine Degradation Mapped and Quantified Using an Unmanned Aerial Vehicle: A Case Study from a Polythermal Glacier in Svalbard, Geomorphology, 258, 1–10, https://doi.org/10.1016/j.geomorph.2015.12.019, 2016. a
Vieira, G., Mora, C., Pina, P., Ramalho, R., and Fernandes, R.: UAV-based very high resolution point cloud, digital surface model and orthomosaic of the Chã das Caldeiras lava fields (Fogo, Cabo Verde), Earth Syst. Sci. Data, 13, 3179–3201, https://doi.org/10.5194/essd-13-3179-2021, 2021. a
Vollgger, S. A. and Cruden, A. R.: Mapping Folds and Fractures in Basement and Cover Rocks Using UAV Photogrammetry, Cape Liptrap and Cape Paterson, Victoria, Australia, J. Struct. Geol., 85, 168–187, https://doi.org/10.1016/j.jsg.2016.02.012, 2016. a, b, c
Westoby, M. J., Brasington, J., Glasser, N. F., Hambrey, M. J., and Reynolds, J. M.: “Structure-from-Motion” Photogrammetry: A Low-Cost, Effective Tool for Geoscience Applications, Geomorphology, 179, 300–314, https://doi.org/10.1016/j.geomorph.2012.08.021, 2012. a, b, c
Wilkinson, M. D., Dumontier, M., Aalbersberg, I. J., Appleton, G., Axton, M., Baak, A., Blomberg, N., Boiten, J.-W., da Silva Santos, L. B., Bourne, P. E., Bouwman, J., Brookes, A. J., Clark, T., Crosas, M., Dillo, I., Dumon, O., Edmunds, S., Evelo, C. T., Finkers, R., Gonzalez-Beltran, A., Gray, A. J. G., Groth, P., Goble, C., Grethe, J. S., Heringa, J., 't Hoen, P. A. C., Hooft, R., Kuhn, T., Kok, R., Kok, J., Lusher, S. J., Martone, M. E., Mons, A., Packer, A. L., Persson, B., Rocca-Serra, P., Roos, M., van Schaik, R., Sansone, S.-A., Schultes, E., Sengstag, T., Slater, T., Strawn, G., Swertz, M. A., Thompson, M., van der Lei, J., van Mulligen, E., Velterop, J., Waagmeester, A., Wittenburg, P., Wolstencroft, K., Zhao, J., and Mons, B.: The FAIR Guiding Principles for Scientific Data Management and Stewardship, Sci. Data, 3, 160018, https://doi.org/10.1038/sdata.2016.18, 2016. a
Zhou, Y., Daakir, M., Rupnik, E., and Pierrot-Deseilligny, M.: A Two-Step Approach for the Correction of Rolling Shutter Distortion in UAV Photogrammetry, ISPRS J. Photogramm., 160, 51–66, https://doi.org/10.1016/j.isprsjprs.2019.11.020, 2020. a