the Creative Commons Attribution 4.0 License.
the Creative Commons Attribution 4.0 License.
 | 20 Feb 2024
Paleo±Dust: quantifying uncertainty in paleo-dust deposition across archive types
Nicolás J. Cosentino
Gabriela Torre
Fabrice Lambert
Samuel Albani
François De Vleeschouwer
Aloys J.-M. Bory
Mineral dust aerosol concentrations in the atmosphere varied greatly on glacial–interglacial timescales. The greatest changes in global dust activity occurred in response to changes in orbital parameters (which affect dust emission intensity through glacial activity) and the lifetime of dust in the atmosphere (caused by changes in the global hydrological cycle). Long-term changes in the surface dust deposition rate are registered in geological archives such as loess, peats, lakes, marine sediments, and ice. Data provided by these archives are crucial for guiding simulations of dust and for better understanding the natural global dust cycle. However, the methods employed to derive paleo-dust deposition rates differ markedly between archives and are subject to different sources of uncertainty. Here, we present Paleo±Dust, an updated compilation of bulk and <10 µm paleo-dust deposition rates with quantitative 1σ uncertainties that are inter-comparable among archive types. Paleo±Dust incorporates a total of 285 pre-industrial Holocene (pi-HOL) and 209 Last Glacial Maximum (LGM) dust flux constraints from studies published until December 2022, including, for the first time, peat records. We also recalculate previously published dust fluxes to exclude data from the last deglaciation and thus obtain more representative constraints for the last pre-industrial interglacial and glacial end-member climate states. Based on Paleo±Dust, the global LGM:pi-HOL ratio of <10 µm dust deposition rates is 3.1 ± 0.7 (1σ). We expect Paleo±Dust to be of use for future paleoclimate dust studies and simulations using Earth system models of high to intermediate complexity. Paleo±Dust is publicly accessible at https://doi.org/10.1594/PANGAEA.962969 (Cosentino et al., 2024).
- Article
(3978 KB) - Full-text XML
-
Supplement
(393 KB) - BibTeX
- EndNote


Mineral dust aerosols interact with climate through multiple mechanisms at different timescales, constituting a long-recognized, relevant component of the Earth system. However, although some of the dust–climate interactions are well understood in principle, many remain relatively unconstrained quantitatively, to the point where it is still unknown whether the net radiative effect of dust implies net cooling or warming in the present day (Kok et al., 2023). Thus, dust remains an important contributor to past and future climate change uncertainty (e.g., Andreae et al., 2005; Sherwood et al., 2020).
Both natural and anthropogenic processes are responsible for present-day dust emissions (Ginoux et al., 2012; Stanelle et al., 2014; Chen et al., 2018). To constrain naturally induced changes in the dust cycle (a prerequisite to disentangle the present-day, human-induced component), one can turn to pre-industrial records of dust activity. Based on such records spanning the last several hundreds of thousands of years, it has been shown that the most dramatic changes in dust activity have taken place at glacial–interglacial timescales (Lambert et al., 2008; Simonsen et al., 2019; Struve et al., 2022), although significant variability is present at all timescales (Lovejoy and Lambert, 2019). Thus, global observational datasets of past dust activity for the pre-industrial Holocene and last glacial periods are key to constraining the natural processes involved in dust–climate interactions through multiproxy comparisons, their use in guiding Earth system simulations of past climates, and as a tool for model–data comparisons.
Paleo-dust archives include continental (i.e., loess-paleosol sequences, lake, peat, and ice) and marine sediments. The dust dynamics parameter that may be calculated from information preserved in these deposits is the dust deposition rate, from which other aspects of the dust cycle must be inferred, such as atmospheric dust concentrations and the dust emission rate, typically through Earth system simulations. Each archive type has its strengths and weaknesses in terms of spatial representativity and how well they preserve dust (Albani et al., 2015), and it is only through a combination of constraints from all these archives that a spatially extensive coverage of paleo-dust activity can be achieved. The degree of coverage is important due to the presence of short-scale variability in dust emissions associated with the uneven distribution of dust sources as well as spatially abrupt changes in dust deposition fluxes associated with precipitation-controlled wet deposition and with dry deposition controlled by the distances to dust sources.
Several compilations of paleo-dust deposition fluxes exist that combine constraints from different archive types (Mahowald et al., 1999, 2006; Kohfeld and Harrison, 2001; Tegen et al., 2002; Maher et al., 2010; Albani et al., 2014, 2015; Lambert et al., 2015) or specialize in marine sediment cores (Kohfeld et al., 2013; Kienast et al., 2016). These compilations have allowed data–model comparisons (Hopcroft et al., 2015; Kienast et al., 2016; Ohgaito et al., 2018; Otto-Bliesner et al., 2020; Braconnot et al., 2021; Krätschmer et al., 2022), the tuning of modeled dust emission rates against observed dust deposition rates (Mahowald et al., 2006; Albani et al., 2014, 2015, 2016; Albani and Mahowald, 2019; Braconnot et al., 2021), and simulations with intermediate-complexity biogeochemistry models (Lambert et al., 2015, 2021; Heinemann et al., 2019). One key aspect missing from these compilations, except the Holocene compilation by Albani et al. (2015), is a quantification of the uncertainty in paleo-dust deposition rates. This is essential for compilations derived from multiple archive types, as each of these is subject to different sources of uncertainty. Explicit site-specific uncertainties in paleo-dust deposition rates may be used for selecting subsets of observations against which to compare dust simulations, weighting observations for dust emission tuning purposes, or deriving distributions of global interpolations, for example through bootstrapping, Monte Carlo experiments, or Bayesian approaches.
During the 7 years since the last paleo-dust compilation was published (that of Kienast et al., 2016), there has been significant progress in the global coverage of paleo-dust proxies. Here, we update the previous compilations of global paleo-dust deposition flux and grain size observations with the newest data. Moreover, three improvements are introduced. First, given the expected high variability of dust deposition fluxes during the transition between the last glacial period and the current interglacial (compared to that within any of those periods), we exclude any data corresponding to the last deglaciation to more precisely quantify dust deposition fluxes during the last glacial and current interglacial end-member climate states. Second, we derive site-specific, quantitative uncertainties of bulk and <10 µm paleo-dust deposition fluxes for both Holocene and last glacial observations. Third, we include, for the first time, dust deposition rate observations from peat bogs.
The manuscript is organized as follows: Sect. 2 details our methodology in constructing Paleo±Dust, Sect. 3 presents the main results, Sect. 4 describes the structure of the datasets, and Sect. 5 presents some concluding remarks.
2.1 Dust mass accumulation rate
The mean dust mass accumulation rate (DMAR) for a given time window at a location on the surface of the Earth may be quantified as follows by dating two horizons along a vertical sedimentary profile (ttop,tbottom), measuring the profile thickness between these two horizons (hthick), the mean dry bulk density (DBD) between these two horizons, and the mass fraction represented by atmospherically derived mineral dust not associated with direct volcanic ash fall (i.e., dust), henceforth defined as the eolian content (EC):
where . Given that the bulk DMAR may be very sensitive to small, local dust sources, we also define a finer-grained DMAR, which is more representative of deposition of far-traveled dust derived from the main dust sources globally. A 10 µm dust diameter is used to define this finer-grained dust fraction, as this is either the uppermost- or intermediate-bin threshold diameter that is found in the greatest number of CMIP6 Earth system models with dust representation (Zhao et al., 2022), thus facilitating model–data comparisons. It is also the recommended definition for the threshold between the coarse and super-coarse size ranges of dust (Adebiyi et al., 2023). The fraction of DMAR that corresponds to dust particles less than 10 µm in diameter (DMAR10) is simply
where f10 is the <10 µm dust mass fraction. This is the approach to calculating paleo-dust deposition fluxes used for all continental archives (i.e., loess-paleosol sequences, lakes, peat, and ice) and for a few sediment cores in the marine realm. Most DMAR constraints from marine sediment cores use the 230Th normalization technique, which is, for the most part, independent of the profile chronology, as discussed further in Sect. 2.8.
The absolute error of DMAR (σDMAR) and DMAR10 (σDMAR10) can be expressed as
and
where σhthick, σDBD, σEC, σtbottom, σttop, and σf10 are the absolute errors of hthick, DBD, EC, tbottom, ttop, and f10, respectively. All errors reported in Paleo±Dust are Gaussian 1σ uncertainties.
Our approach to assigning uncertainties to the components of DMAR combines objective and subjective considerations. On the one hand, when measurement uncertainties are reported in the original studies, these uncertainties are used. One example is the use of 232Th as a dust proxy to calculate EC in marine sediments. This method requires the normalization of measured 232Th in marine sediments to the mean global concentration of 232Th in dust: the variability of this normalizing value provides a means to calculate the uncertainty in EC. Instead, when uncertainties are not reported, these are defined based on the distribution of reported relative uncertainties for sites of the same archive type (conservatively choosing the 75th percentile of this distribution). On the other hand, when the uncertainty of any component of DMAR is not reported, it is assigned. Assigning uncertainty is more problematic, as the true uncertainty is usually not known. This is the case for example for uncertainties in chronologies of loess-paleosol sequences derived through pedostratigraphy. In such cases, we assign higher subjective uncertainties to methods deemed more uncertain (based on the literature and the authors' experience). This combination of approaches implies that reported DMAR uncertainties in Paleo±Dust should be considered to reflect the relative uncertainties among sites (more so than the exact uncertainties for each site). Sections 2.3–2.8 expand on these considerations for each archive type and DMAR component.
2.2 Criteria for the inclusion of sites
Previous compilations of paleo-DMAR served as the starting point for the construction of Paleo±Dust. A literature search was performed to include new sites for studies published until (and including) December 2022. Recent advances in the study of peat bogs as a dust archive (e.g., De Vleeschouwer et al., 2014; Kylander et al., 2016, 2018; Marx et al., 2018; Sjöström et al., 2020) have allowed the inclusion of this archive type in a dust compilation for the first time.
2.2.1 Time span
One of the main objectives of Paleo±Dust is to compile global constraints on DMAR for the ongoing interglacial and last glacial periods. In particular, Paleo±Dust compiles observations for the pre-industrial Holocene (pi-HOL; between the year 1850 CE and 11.7 ka) and the Last Glacial Maximum (LGM; between 19.0 and 26.5 ka) (Clark et al., 2009). We thus exclude observations of DMAR for the present day and recent past as well as for the last deglaciation (11.7–19.0 ka) to represent DMAR due to natural processes for the two main quasi-equilibrium climate states at glacial–interglacial timescales. Whether this may be achieved or not for any particular site will depend on the sampling resolution along the vertical profile for dating. In order to include a site in Paleo±Dust, it needs to be possible to define a sub-section of the full sampled vertical section of a sedimentological archive whose time interval falls mostly (i.e., ≥75 %) within either the pi-HOL or LGM as previously defined. Another criterion that needs to be fulfilled is that the site's time window is resolved within uncertainty: if and , then that DMAR constraint is discarded.
Each entry in Paleo±Dust is associated with a specific time window within pi-HOL or LGM defined by tbottom and ttop. This allows the selection of subsets of data that include or exclude a specific time range of interest. As most of the previous compilations only reported general time periods (e.g., Holocene, Late Holocene, LGM, last glacial), the original references of each entry in these compilations were revisited to extract exact values for tbottom and ttop. Given the imposed age criteria described above, most of the reported DMAR values in these compilations are different from those reported in Paleo±Dust for the same site, as a different set of samples from each site may have been used in this study to calculate DMAR.
2.2.2 Geomorphological setting
The most important consideration when selecting sites for Paleo±Dust is that the lithogenic fraction of the sediment should be dominated by atmospheric deposition or that it is possible to estimate the atmospherically derived lithogenic fraction quantitatively. The site's geomorphological setting largely controls this. Sites of loess deposits with a massive structure reflective of the deposition of dust from the atmosphere are included in the database, while loessoid sites consisting of loess reworked by either fluvial or slope processes are excluded (e.g., Pye, 1995). Peat usually consists of an upper ombrotrophic section where lithogenic materials are exclusively supplied by the atmosphere and a lower minerotrophic section where lithogenic materials are also supplied laterally by groundwater (e.g., Shotyk, 1996). Only the ombrotrophic sections of peat sections are considered in this study. In the case of lake sediments, non-eolian lithogenic material may be advected into a studied site through fluvial inlets or via slope processes within the lake basin, a process known as lake sediment focusing (e.g., Blais and Kalff, 1995). We only included lake sites from endorheic basins, and we discarded sites that lack a quantification of the fraction of lithogenic material advected through lake sediment focusing. With respect to marine sediments, we excluded sites located in continental margins, as they may be influenced by riverine inputs, as well as high-latitude sites potentially influenced by ice-rafted debris (e.g., Kienast et al., 2016). In both cases, exceptions were made for sites where these non-eolian lithogenic inputs are quantified. Other marine sites may be affected by sediment focusing; that is, the lateral submarine transport of non-eolian sediment. The 230Th normalization method can be used to isolate the eolian lithogenic component in these cases (e.g., Francois et al., 2004). Finally, polar ice cores are retrieved from upland landscape positions, and, for those sites that are located far from local lithogenic sources (those included in Paleo±Dust), their lithogenic materials are assumed to be wind blown (i.e., Albani et al., 2015).
For loess, the local geomorphology and topography can enhance the dust deposition rate by focusing wind-blown material onto the surfaces of windward escarpments (e.g., Comola et al., 2019), which may translate into a higher local loess DMAR than the mean regional value (e.g., Xiong et al., 2015). This effect cannot be easily identified in the profile, particularly when a regional loess stratigraphy against which to compare the local stratigraphy is not available in the literature. In general, upland loess sites are considered to be less prone to topography-induced enhancements in mass accumulation rates (Kohfeld and Harrison, 2003). We therefore performed a case-by-case evaluation of the geomorphological setting of each loess site and discarded sites only when this potential problem was suggested explicitly in the original studies.
Conversely, the preservation potential of loess sites located in topographic lows within high-relief environments may be limited due to slope or fluvial erosional processes that disrupt the continuity of the loess stratigraphy, generating hiatuses. These erosional hiatuses may be evident in the field or may only be discerned through high-resolution dating (e.g., Stevens et al., 2018; Volvakh et al., 2022). For these reasons, we restricted the analyzed vertical extents of loess-paleosol profiles to sections with no intervening erosional hiatuses. We also completely excluded sites that have a loess stratigraphy that considerably deviates from a well-defined regional loess stratigraphy in regions where such a reference regional loess stratigraphy is available (based on the original authors' assessment).
2.3 Uncertainty in top and bottom ages
Direct absolute dating of the sedimentary units of interest is the main tool for defining a chronology for dust records. The two most popular techniques are 14C and optically stimulated luminescence (OSL) dating. When tbottom and ttop were obtained by direct absolute dating, the reported 1σ uncertainties are used (Fig. 1). If the dating uncertainty was not reported, relative uncertainties of 3.4 %, 9.1 %, and 13.1 % are assigned to 14C-, OSL-, and thermoluminescence-based age determinations. These values represent the 75th percentile of the distribution of the relative uncertainty in the age measured via 14C (N=83), OSL (N=129), and thermoluminescence (N=20), respectively, for the sites included in Paleo±Dust. Absolute ages are usually reported as years before present, where the reference age (0 yr BP) may be the year of sampling or a fixed year (e.g., 1950 CE). We do not homogenize reported ages across studies so that they are referenced to the same year. Given that we focus on mean LGM and pi-HOL dust deposition rates, this does not introduce a significant uncertainty.
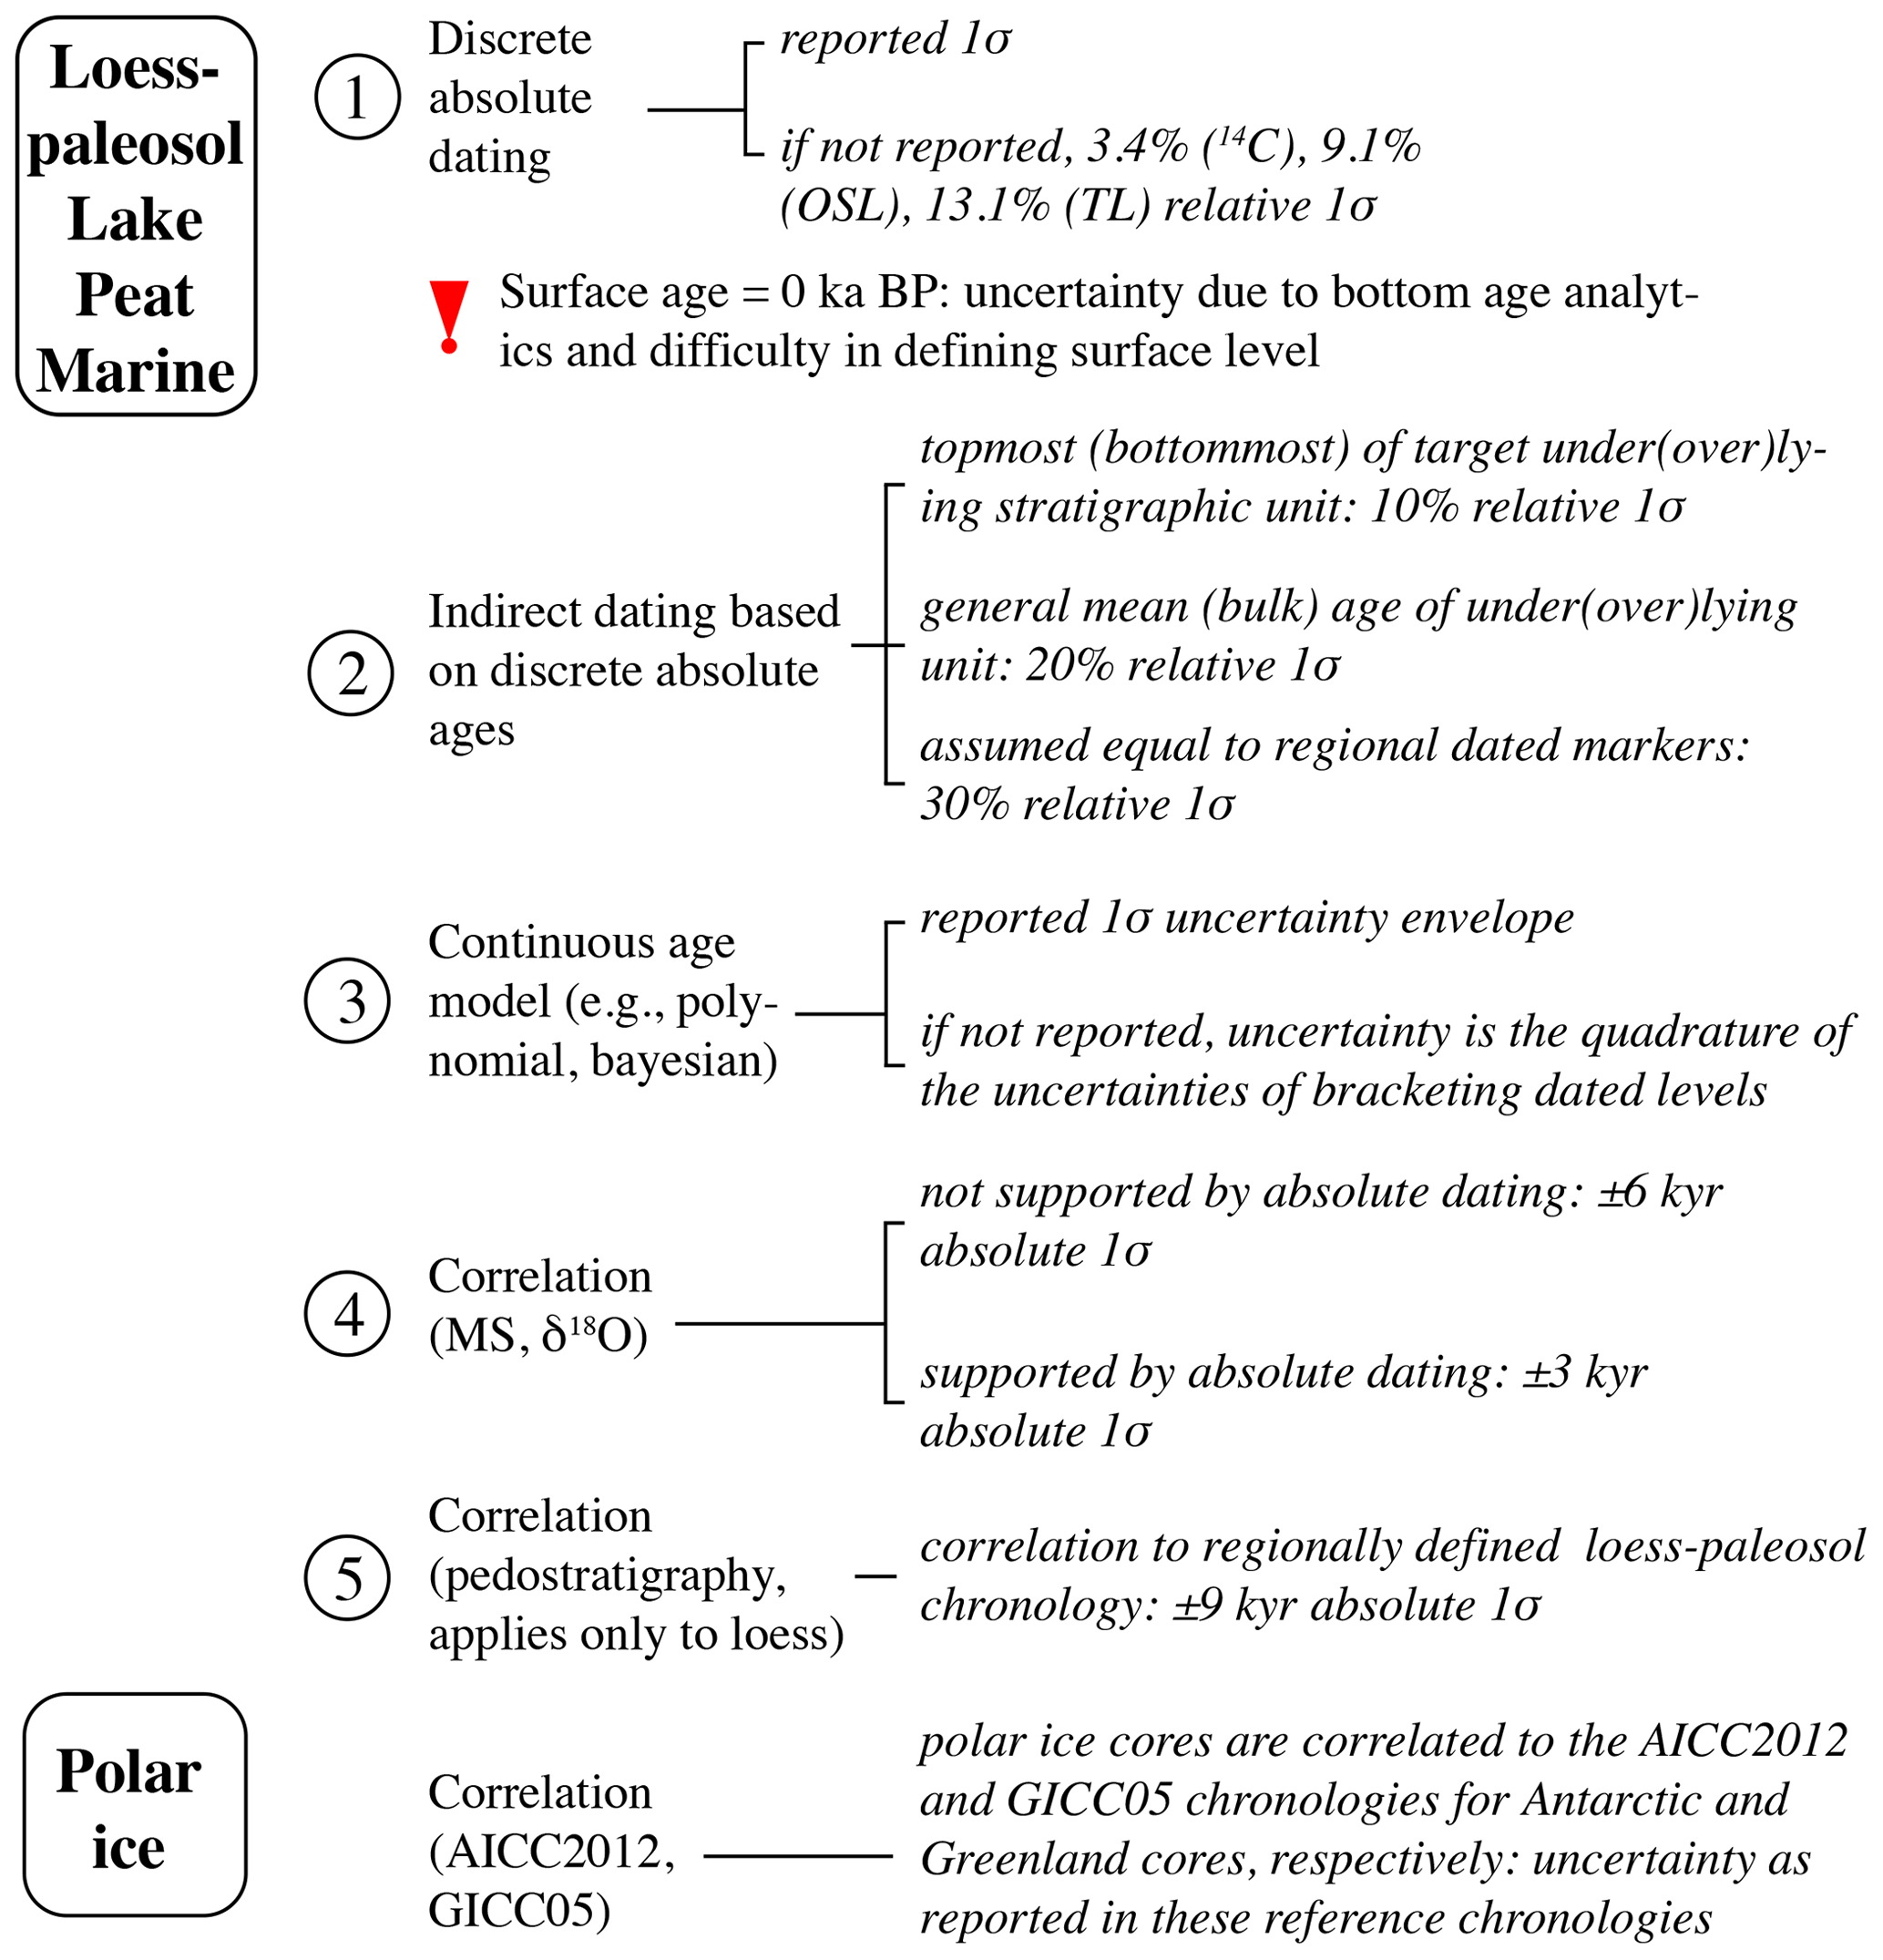
Figure 1Criteria for assigning uncertainty to the top and bottom ages. OSL: optically stimulated luminescence, TL: thermoluminescence, AICC2012: Antarctic Ice Core Chronology 2012 (Veres et al., 2013), GICC05: Greenland Ice Core Chronology 2005 (Svensson et al., 2008).
If a study presents a continuous age model and this model includes, for example, the full LGM age interval (26.5–19.0 ka), then tbottom is defined as 26.5 ka and ttop is defined as 19 ka (Fig. 1). If the study reports the modeled errors in these interpolated ages, we use these reported values. If it does not, we calculate the errors in tbottom and ttop as the L2 norm of the errors of the two closest bracketing measured ages. The advantage of this error is that it is higher than the error of either measured age. This extra uncertainty can be thought of as being due to the interpolation.
When no absolute ages are available and the chronology is defined based on the correlation of a sediment parameter with any given reference record – for example, the correlation of the magnetic susceptibility signal in marine sediment cores or loess-paleosol profiles to the oxygen isotope record of marine benthic foraminifera (e.g., Lisiecki and Raymo, 2005) – then a considerably higher relative error is assigned (Kohfeld and Harrison, 2003; Fig. 1). Wiers et al. (2019) quantified the uncertainty in the chronology of a Late Pleistocene Arctic marine sediment core obtained by correlating magnetic properties in the core with global patterns of δ18O in benthic foraminifera. They found a high absolute error during the ongoing interglacial and last glacial periods of approximately ± 6 kyr, which remained relatively constant during this time span. We apply this same absolute error to ttop and/or tbottom obtained through such correlations (Fig. 1). When these chronologies are also supported by absolute dating, we instead assume a considerably lower absolute error of ± 3 kyr. In the case of loess, chronologies may also be defined based on pedostratigraphy, by assuming that loess and paleosol units can be correlated to glacial and interglacial periods, respectively, as defined by marine isotope stratigraphy (Kohfeld and Harrison, 2003). Only pi-HOL dust deposition rates were obtained through this method (N=11, all from China; Kohfeld and Harrison, 2003), as the LGM period cannot be discriminated from the encompassing last glacial period in terms of any pedostratigraphic unit. An evaluation of the uncertainty in the chronologies of these sites would require validation against absolute dates, which are not available for these sites. Moreover, to the best of our knowledge, there are no similar validation studies for other sites that we could use as a model. We thus compensate for this lack of validation by assigning a higher absolute uncertainty compared to magnetic correlations (±9 kyr).
For the specific case where the surface of a sedimentary unit was one of the bounding surfaces for a DMAR constraint and no continuous age model was available, ttop is assumed to be 0 ka, and the uncertainty in this assumption is related to the difficulty in defining the surface level and quantified in the following way (Fig. 1): if, for example, tbottom is dated at 1.0 ± 10 % ka at 15 cm depth, then, in 1 cm centered at the top surface, the time span covered is 0.067 kyr, assuming a linear relationship between age and depth. Then the age of the surface is fully contained within 0 ka ± (0.067/2) ka. Translating this absolute time interval to an equivalent 1σ uncertainty interval, we multiply by 68.27 % and get 0 ka ± (0.067/2) × 0.6827 ka. Finally, we multiply this 1σ interval by 1.1, which corresponds to the relative age uncertainty for tbottom in our example (=10 %). The final surface age is 0.000 ka ± 0.025 ka (1σ). This procedure includes the uncertainty due to the difficulty in defining the surface level and the uncertainty due to the dating method.
Finally, all polar ice core DMAR constraints in Paleo±Dust were obtained based on correlation to a common chronology for each of the polar regions: the 2012 Antarctic Ice Core Chronology (AICC2012, Veres et al., 2013) for Antarctic ice cores and the 2005 Greenland Ice Core Chronology (GICC05, Svensson et al., 2008) for Greenland ice cores. In both cases, uncertainties in ages are as reported for each chronologic framework.
2.4 Uncertainty in sediment profile thickness
As , where hbottom and htop are the measured depths of the bottom and top layers, respectively, the error of the sedimentary thickness between dated layers is
where is the error of the measured depth to a dated layer beneath the surface level.
The uncertainty in measuring layer depth is associated with the fact that the sample obtained for dating has a finite vertical height, defined by the amount of sample mass required to perform dating. If, for example, loess sampling for dating is carried out by inserting horizontal corers 2 cm in diameter into the vertical face of the sedimentary profile, then the full sample within ±1 cm of the center of the corer is included. We may translate this total depth range into an equivalent range with 1σ uncertainty by multiplying by 0.6827, resulting in an absolute 1σ uncertainty in depth (σh) of ±0.6827 cm. If not reported, we assumed a horizontal corer diameter of 7.9 cm, which is the mean value reported for loess sites in Paleo±Dust. For lake, marine, peat, and polar ice sampling where coring is performed vertically from the surface, the relevant quantity from which to calculate σh is the height of each sample in the vertical direction along the corer, or, in other words, the thickness obtained after field operations in the laboratory. If not reported, we assumed a sample height of 2 cm for marine sediment and peat bog records and 7.9 cm for lake sediment samples (the mean reported value for sample height in Paleo±Dust in all cases). All ice core sites in Paleo±Dust have a reported sample height.
When the site chronology is based on magnetic susceptibility, σh is calculated as , where hMS is the depth interval between susceptibility measurements.
2.5 Uncertainty in dry bulk density
In a study of forest soils in California, it was found that between three and 17 samples were needed to estimate the mean soil DBD to ±10 % at a 95 % confidence level (Han et al., 2016). Here, a significantly higher DBD relative uncertainty of 15 % (for 1σ) is assumed for sites with no reported DBD uncertainty, given that several sites have less than three DBD determinations, and a greater variety of sediment and soil types are considered in this compilation compared to the study by Han et al. (2016). If, instead, the measurement error is reported in the original study, then this value is used. Finally, if DBD was measured but could only be estimated visually from a figure in the original study, a greater uncertainty of 20 % is used. The same uncertainty is assigned when the DBD was assumed equal to that at a site near (<100 km away) to where it was measured.
If DBD was not measured and no nearby sites with measured densities are available, a DBD value of 1.45 g cm−3 and an uncertainty of 30 % are used for loess and lake sites, except for loess sites in the Chinese Loess Plateau and in East Central Europe (west of 21.5∘ E), where mean values of 1.48 g cm−3 (Kohfeld and Harrison, 2003) and of 1.497 g cm−3 (Újvári et al., 2010; Peric et al., 2020) are preferred, respectively. For peat bog sites, when DBD is not measured (N=5), the mean value of the DBD among all sites with DBD measurements globally is used (=0.12 g cm−3, N=18). No assumption about the DBD of marine sediment cores is required, as DBD was always measured at sites that require the DBD for the derivation of DMAR (those not based on 230Th normalization).
For polar ice cores, the density is taken to be that of ice: 916,750 g m−3. This value is assumed to have a small variation of ±50 g m−3, which translates into a 1σ variability of ±50 g m g m−3. This approach is justified by the fact that the density of ice remains almost constant with depth below approximately 100 m depth from the surface (e.g., Gerland et al., 1999).
2.6 Uncertainty in the mass fraction of dust
The calculation of EC and its uncertainty depends strongly on the type of dust archive considered (Fig. 2).
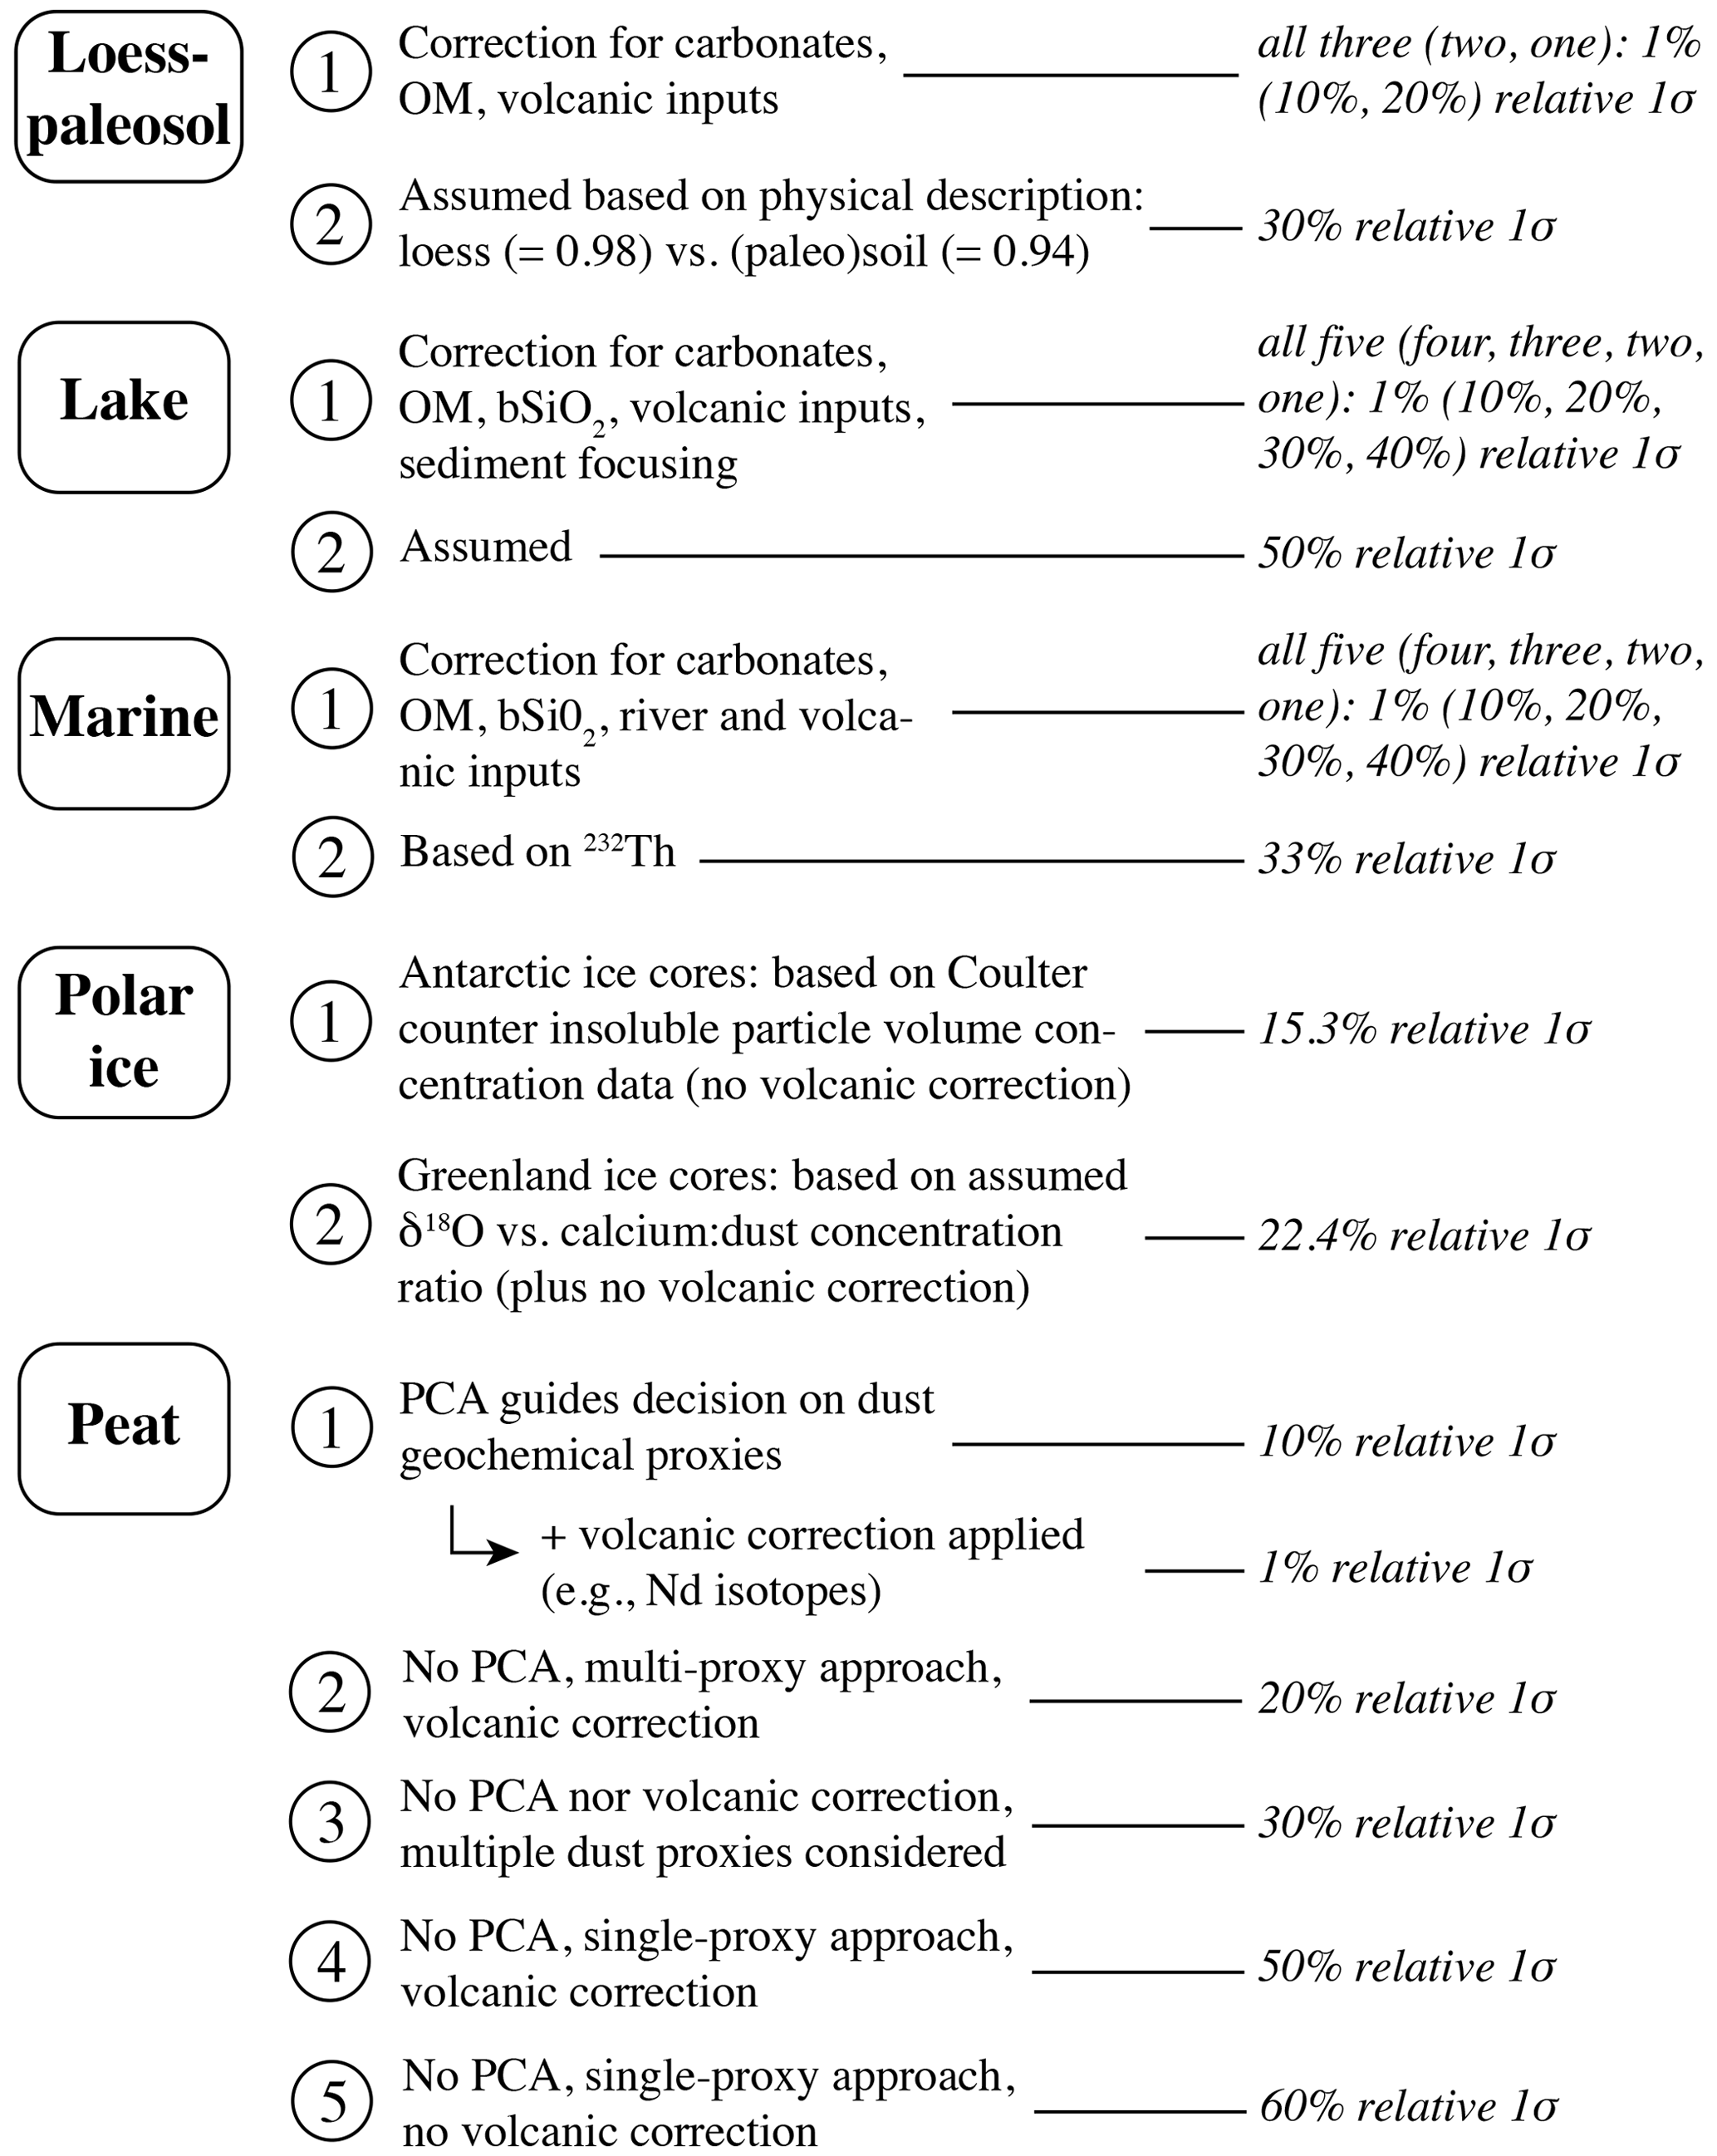
Figure 2Criteria for assigning uncertainty to the non-volcanic dust fraction. OM: organic matter, bSiO2: biogenic silica, PCA: principal component analysis.
2.6.1 Loess-paleosol sequences
In loess studies with a focus on dust dynamics, EC is usually assumed to be 1; that is, loess is assumed to be fully composed of eolian dust. However, while organic particles present in dust sources may be transported by wind and later deposited in the same manner as lithic particles (Muhs et al., 2014), here we assume that organic matter in loess is post-depositional in origin (e.g., Hatté et al., 2001), and we subtract the total organic carbon (TOC) to calculate EC. Instead, in some regions, carbonates constitute a significant fraction of airborne dust (Scheuvens and Kandler, 2014), which supports the interpretation that carbonates in loess are dominantly primary; that is, they are derived from dust sources (e.g., Li et al., 2013; Meng et al., 2019). However, carbonates in loess have also been shown to be authigenic (e.g., Da et al., 2023). Unfortunately, for most published studies it is not possible to calculate the contributions of primary and authigenic carbonates to the total carbonate content (TCC) of loess. We thus assume that 50 % of the carbonate present in loess is primary while 50 % is authigenic. Furthermore, previous research has shown that wet climates during interglacials tend to deplete 10 % of the carbonates in soils (by weight), while no loss occurs during glacial periods (Meng et al., 2015, 2018; Zhang et al., 2023). We account for this post-depositional loss of carbonates in Holocene loess-paleosol sections in our EC calculations.
The relative 1σ uncertainty in EC is assumed to be 10 % (20 %) if both (either) TOC and (or) TCC are (is) reported (Fig. 2). If both TOC and TCC are available and there is also a quantification of volcanic inputs, then the relative uncertainty is reduced to 1 %. Instead, when neither TOC nor TCC data are available, loess-paleosol units are classified as either organic carbon rich or organic carbon poor based on the physical description of the unit of interest, and the sum of TOC and TCC is assigned a value of 6 wt % or 2 wt %, respectively. These correspond, respectively, to the first and third quartiles of the sum of TOC and TCC for sites in Paleo±Dust where both TOC and TCC were determined (N=28). In addition, when TOC is not determined, values of 0.2 wt % and 1 wt % are assumed for LGM and pi-HOL sites, based on previous studies (Yang et al., 2015). In these cases where both TOC and TCC are assumed, the relative uncertainty in EC is highest at 30 %.
2.6.2 Lake sediment cores
The procedure for calculating EC in lake sediment cores is similar to that for loess deposits, except that biogenic silica is an extra sediment component that can be very relevant in terms of mass and needs to be corrected for (Fig. 2). Another effect to consider in lake sediment cores is sediment focusing, by which local sediments from the lake catchment can contribute to the siliciclastic mass. Some lake sediment studies isolate long-range dust from local catchment sediment, for example, through grain size end-member modeling, trace element geochemistry (Petherick et al., 2009), or corrections that consider lake bathymetry (Arcusa et al., 2020). Given the greater number of corrections required to calculate EC, the maximum potential relative uncertainty in EC is greater than that for loess records (i.e., 50 % versus 30 %).
2.6.3 Marine sediment cores
A few studies of dust using marine sediment records calculate EC based on the same principles as used with loess and lake sediment cores: by subtracting the carbonate, organic matter, and biogenic silica mass fractions and, when available, correcting for volcanic inputs (Fig. 2). However, most studies that look at dust archived in marine sediment cores use isotope 232Th measurements to calculate EC, assuming a global mean concentration of 232Th in dust of 14.0 ± 4.6 ppm (Kienast et al., 2016; Ouyang et al., 2022). The relative 1σ uncertainty in this mean value (i.e., 33 %) is used as the uncertainty in EC when calculated based on 232Th. Studies that used a different global mean value of 232Th concentration in dust are recalculated with this value.
When cores are extracted close to the continents, a significant fraction of the siliciclastic mass may be due to riverine inputs. Following Singh et al. (2011) and Kienast et al. (2016), we excluded sites located less than 300 km from the coast except for the equatorial Atlantic Ocean off the coast of Brazil, for which this distance is 600 km (Holocene) and 800 km (LGM). This rule does not hold for studies that isolate dust from riverine contributions to terrigenous sediment (e.g., McGee et al., 2013).
Another potential terrigenous component that may obscure dust signals in marine sediment cores is ice-rafted debris. Here, we follow Kienast et al. (2016) and exclude marine sediment cores that are potentially affected by ice-rafted debris with high probability; that is, sites located poleward of 55∘ N in the North Pacific, poleward of 50∘ N in the North Atlantic, and poleward of 50∘ S in the southern oceans. These same latitudinal thresholds are applied to both pi-HOL and LGM paleo-dust sites. While the polar fronts may have changed latitudinally over time (and thus the extent of the influence of ice-rafted debris may have too), there is no evidence of this from the relationship between latitude and paleo-lithogenic fluxes in marine sediment cores (Kienast et al., 2016). Sites located poleward of these latitudinal thresholds are kept when lithogenic fluxes are confirmed to be mostly due to eolian dust, for example, through the measurement of n-alkanes, a proxy for continent-derived materials (e.g., Lamy et al., 2014).
2.6.4 Polar ice cores
The value of EC was calculated for the two Antarctic ice cores included in Paleo±Dust (for both pi-HOL and LGM) based on Coulter counter insoluble particle volume concentration data, assuming an insoluble particle density of 2.5 g cm−3 (Delmonte et al., 2005). The relative 1σ uncertainty in Antarctic EC is 15.3 %, which represents the L2 norm of a 11.4 % error component due to uncertainty in the insoluble particle density (2.0–2.8 g cm−3, Kohfeld and Harrison, 2001), a 10 % error component due to the lack of a volcanic input correction, and a 2 % component derived from replicate Coulter counter measurements (Fig. 2).
In the case of Greenland ice cores, EC is based on δ18O and Ca2+ concentration data. Sample depths with δ18O <−40 ‰ (cold periods) are assigned a Ca-to-dust ratio of 0.095, while sample depths with δ18O >−37 ‰ are assigned a Ca-to-dust ratio of 0.26 (Steffensen, 1997; Ruth et al., 2002), with a linear interpolation for in-between values of δ18O (Albani et al., 2015). The uncertainty in EC is assumed to be 22.4 %, which is the L2 norm of a 10 % uncertainty component due to possible volcanic inputs (just as for the Antarctic cores) and 20 % due to a combination of analytical and Ca2+ proxy uncertainties (Fig. 2; Albani et al., 2015).
2.6.5 Peat cores
Multiple ways to calculate EC in peat bogs are reported in the literature. One way is to measure the fraction of non-combustible mineral ash in total dry peat mass, which we can approximate as the siliciclastic mass fraction (e.g., Martínez Cortizas et al., 2020). A preferred approach is to use the concentration of one (e.g., Sharifi et al., 2018) or multiple (e.g., Pratte et al., 2020) conservative lithogenic elements that are not subject to post-depositional mobilization and have no anthropogenic source, such as Sc, Zr, Y, and the rare earth elements (REEs), typically normalized to the mean concentration of these elements in the upper continental crust. Irrespective of the method employed, the lowest relative uncertainty in the calculation of EC is assigned to cases where the choice of the dust proxy or combination of dust proxies is based on a principal component analysis (PCA, Fig. 2). This is because EC is sensitive to the choice of the geochemical proxy for dust (Shotyk et al., 2002; Eléonore Resongles, personal communication, 2023), and a PCA analysis usually provides the best way to identify the element or set of elements that best represents atmospherically derived lithogenic fluxes. However, high discrepancies in DMAR calculated with different elements that were all found to be associated with dust based on PCA analyses have also been reported (Kylander et al., 2016). This stresses the need to carefully select the elements to be used for DMAR calculations based on the site-specific element behavior. Specifically, it is recommended that when multiple elements are identified as the optimal dust proxy, the DMAR should be calculated based on the combination of those elements (e.g., based on the sum of the REEs, Sc, Y, and Zr if all these elements are identified as being equally suitable to represent dust).
To be consistent with the choice of uncertainties in EC for loess-paleosol sequences, lakes, and marine sediments, a relative uncertainty of 10 % is assigned to PCA-supported EC calculations for peat bogs (Fig. 2). If no PCA analysis is available, DMAR calculated based on multiple elemental proxies is preferred over a single-proxy approach, including the case where the single proxy is the non-combustible ash fraction. Moreover, when independent information is available that allows the identification of samples with high inputs of direct volcanic ash fall, such as that based on Nd isotopes (e.g., Vanneste et al., 2015), a correction is applied in which the high DMAR values for those samples are replaced by background DMAR values in the same profile.
2.7 Uncertainty in the <10 µm dust mass fraction
We assign the lowest uncertainty to f10 when it is calculated from a full volumetric grain size distribution (Fig. 3). This uncertainty is associated with the reproducibility of measurements (∼ 0.7 % after the propagation of each bin's uncertainty) based on laser-diffraction determinations of 135 South American loess samples from three sites dated to between 8–53 ka (Coppo et al., 2022a), as well as with the use of different laser-diffraction devices and assumptions about their optical settings (19.9 %) based on measurements of loess samples from East Central Europe (Varga et al., 2019). We thus assign a 20 % relative uncertainty to f10 when it is calculated from full grain size distributions using laser diffraction devices. Coulter counters measure particle volume more accurately than laser diffraction devices (Simonsen et al., 2018), so volumetric grain size distributions and f10 values that are measured by this technique are arguably more accurate as well. We thus assign a lower relative uncertainty of 5 % to f10 when it is calculated from Coulter counter measurements. This specific value of 5 % is, however, arbitrary, as the authors are not aware of studies that quantified sources of uncertainty of Coulter counter-derived grain sizes. In many cases where such measurements were carried out, the full-size distribution data were not published and f10 was not reported in the original study. Albani et al. (2015) compiled these distributions for a number of Holocene sites published previously to 2015. Also, Albani et al. (2014) compiled f10 values for Holocene and LGM dust archive sites published prior to 2014. For all these sites, f10 is retrieved from these studies. For the rest of the sites in Paleo±Dust, if data are not available but the grain size distribution is plotted in the original study, we estimated f10 visually, adding an extra 10 % of uncertainty (30 % in total). To perform this visual estimation, we used a vector graphics editor (Adobe Illustrator) to draw two polygons: one that encompassed the area under the curve of the volumetric grain size distribution for all measured particle sizes and one for sizes <10 µm. We calculated f10 as the ratio of the latter to the former area. Greater uncertainty (30 %) is associated with f10 when it is calculated from reported grain size bin volumetric abundances (e.g., clay, silt) because either grain size was determined using the sieve and pipette method or the full grain size distribution is not reported. Also, a higher uncertainty was assigned when f10 is calculated from a reported mean or median value (40 %). To derive f10 in these cases (from the mean, median, or bins), we used the average grain size distribution from the Coppo et al. (2022a) dataset to obtain linear least-square regression equations for f10 vs. mean (R2=0.71), f10 vs. median (R2=0.81), and f10 vs. f20 (R2=0.88), among others (see site-specific notes for more details), except when f10 calculated from the mean grain size was retrieved directly from Albani et al. (2014). When no grain size measurements are available for a given site, only for nearby sites (<100 km away) that are comparable in terms of their geomorphological setting, then the same value for f10 is used in both sites, with an extra 10 % uncertainty added for the site with no data. The same is true for sites that include grain size data for a different time window than the one considered.
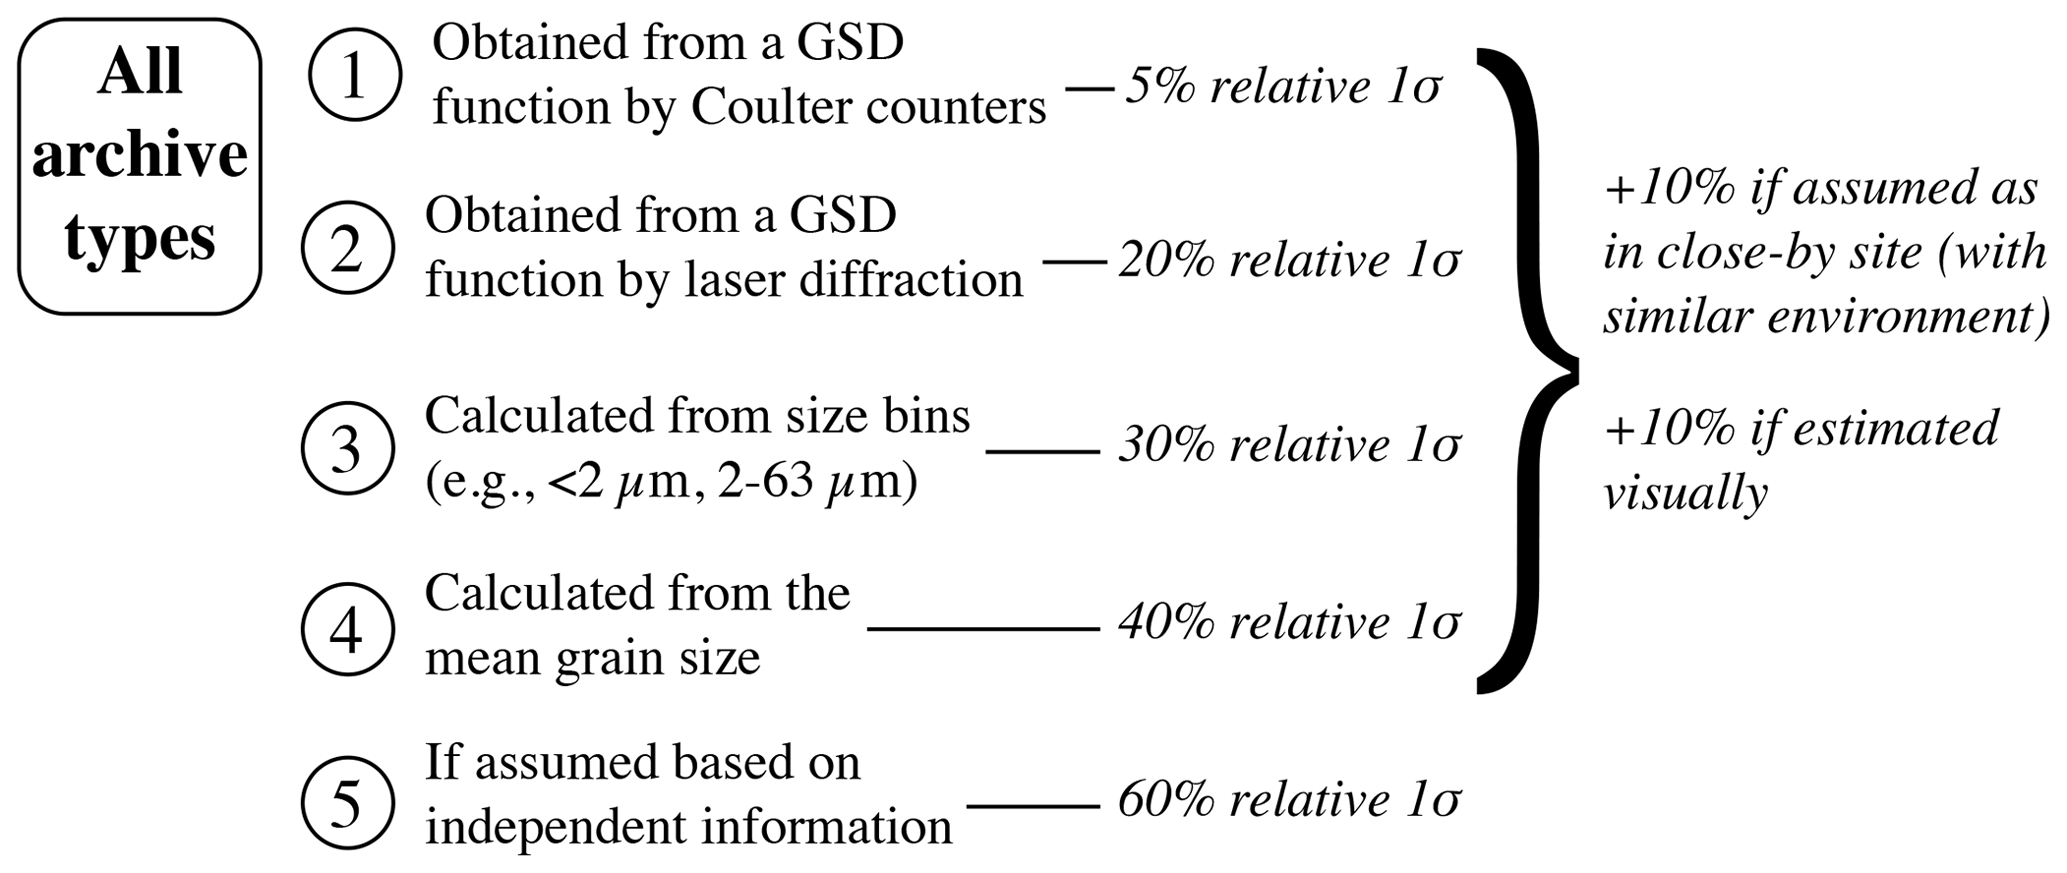
Figure 3Criteria for assigning uncertainty to the <10 µm grain size fraction. GSD: grain size distribution.
For marine sediment cores, it is rarely the case that grain size information is available (only 6 % of sites). For sites with no grain size information, if they are within 500 km from a site with grain size measurements, and provided the two sites have similar bathymetries and are not separated by significant bathymetric features, then the same f10 value is used for both sites, with an extra 10 % uncertainty added for the site with no measurements. For all other marine sediment sites, f10 values are assumed based on their downwind distance from known dust sources. If sites are located >2000 (1000–2000, <1000) km downwind from known dust sources south of 15∘ S, we assume that f10=1.00 (0.75, 0.50) ± 60 %. For locations in the ocean north of 15∘ S where dust sources are more intense, these threshold distances are instead 3000 and 1500 km. The downwind directions from dust sources are qualitatively defined based on Holocene and LGM dust deposition maps from Mahowald et al. (2006), although dust sources not considered in this study, such as Alaska, are also considered.
2.8 The use of thorium-230 normalization for total sediment flux calculations in marine sediment cores
It has long been recognized that the traditional method of obtaining lithogenic mass accumulation rates between two dated horizons in marine sediment cores (e.g., Mortlock et al., 1991) cannot be directly attributed to pelagic sedimentation from the water column due to the process of sediment focusing, which is the lateral transport of sediment acting on the seafloor and along different depths in the ocean. Instead, the majority of lithogenic flux estimations from studies of marine sediment cores that are interested in the vertical fluxes of particles use the 230Th normalization method, which accounts for sediment focusing and provides estimations of pelagic mass accumulation rates. This method was first proposed by Bacon (1984) and is fully described in Francois et al. (2004). Briefly, the main assumption of the method is that the flux of scavenged 230Th to the seafloor is equal to the decay production rate of 230Th from 234U dissolved in the overlying water column. This is a reasonable assumption given the short residence time of 230Th in ocean water and the fact that its removal from the dissolved pool occurs mostly through adsorption to sediments derived vertically in the water column, a process known as proximal scavenging.
For the case of marine sediment cores, DMAR is calculated using the 230Th normalization technique as the product of the sediment bulk mass accumulation rate (SBMAR) and EC:
where
Here, β230 is the decay constant of 234U (and the production constant of 230Th) throughout the water column, with a value of 2.562 × 10⁻⁵ dpm cm−3 kyr−1 (Costa et al., 2020); z is the water depth to a given site; and Th_230 is the decay-corrected excess 230Th activity (in dpm g−1).
Another advantage of the 230Th normalization method is that it provides DMAR estimates that are, for the most part, independent of the chronology of sediment accumulation. This is particularly relevant for high-resolution DMAR studies, as large uncertainties exist for DMAR when using the traditional method if estimates are attempted for two horizons located close to each other in age.
The relative uncertainty in deriving SBMAR based on the 230Th normalization method is 30 % (Fig. 4), based on calibration studies (Henderson et al., 1999; Scholten et al., 2001; Yu et al., 2001a, b).
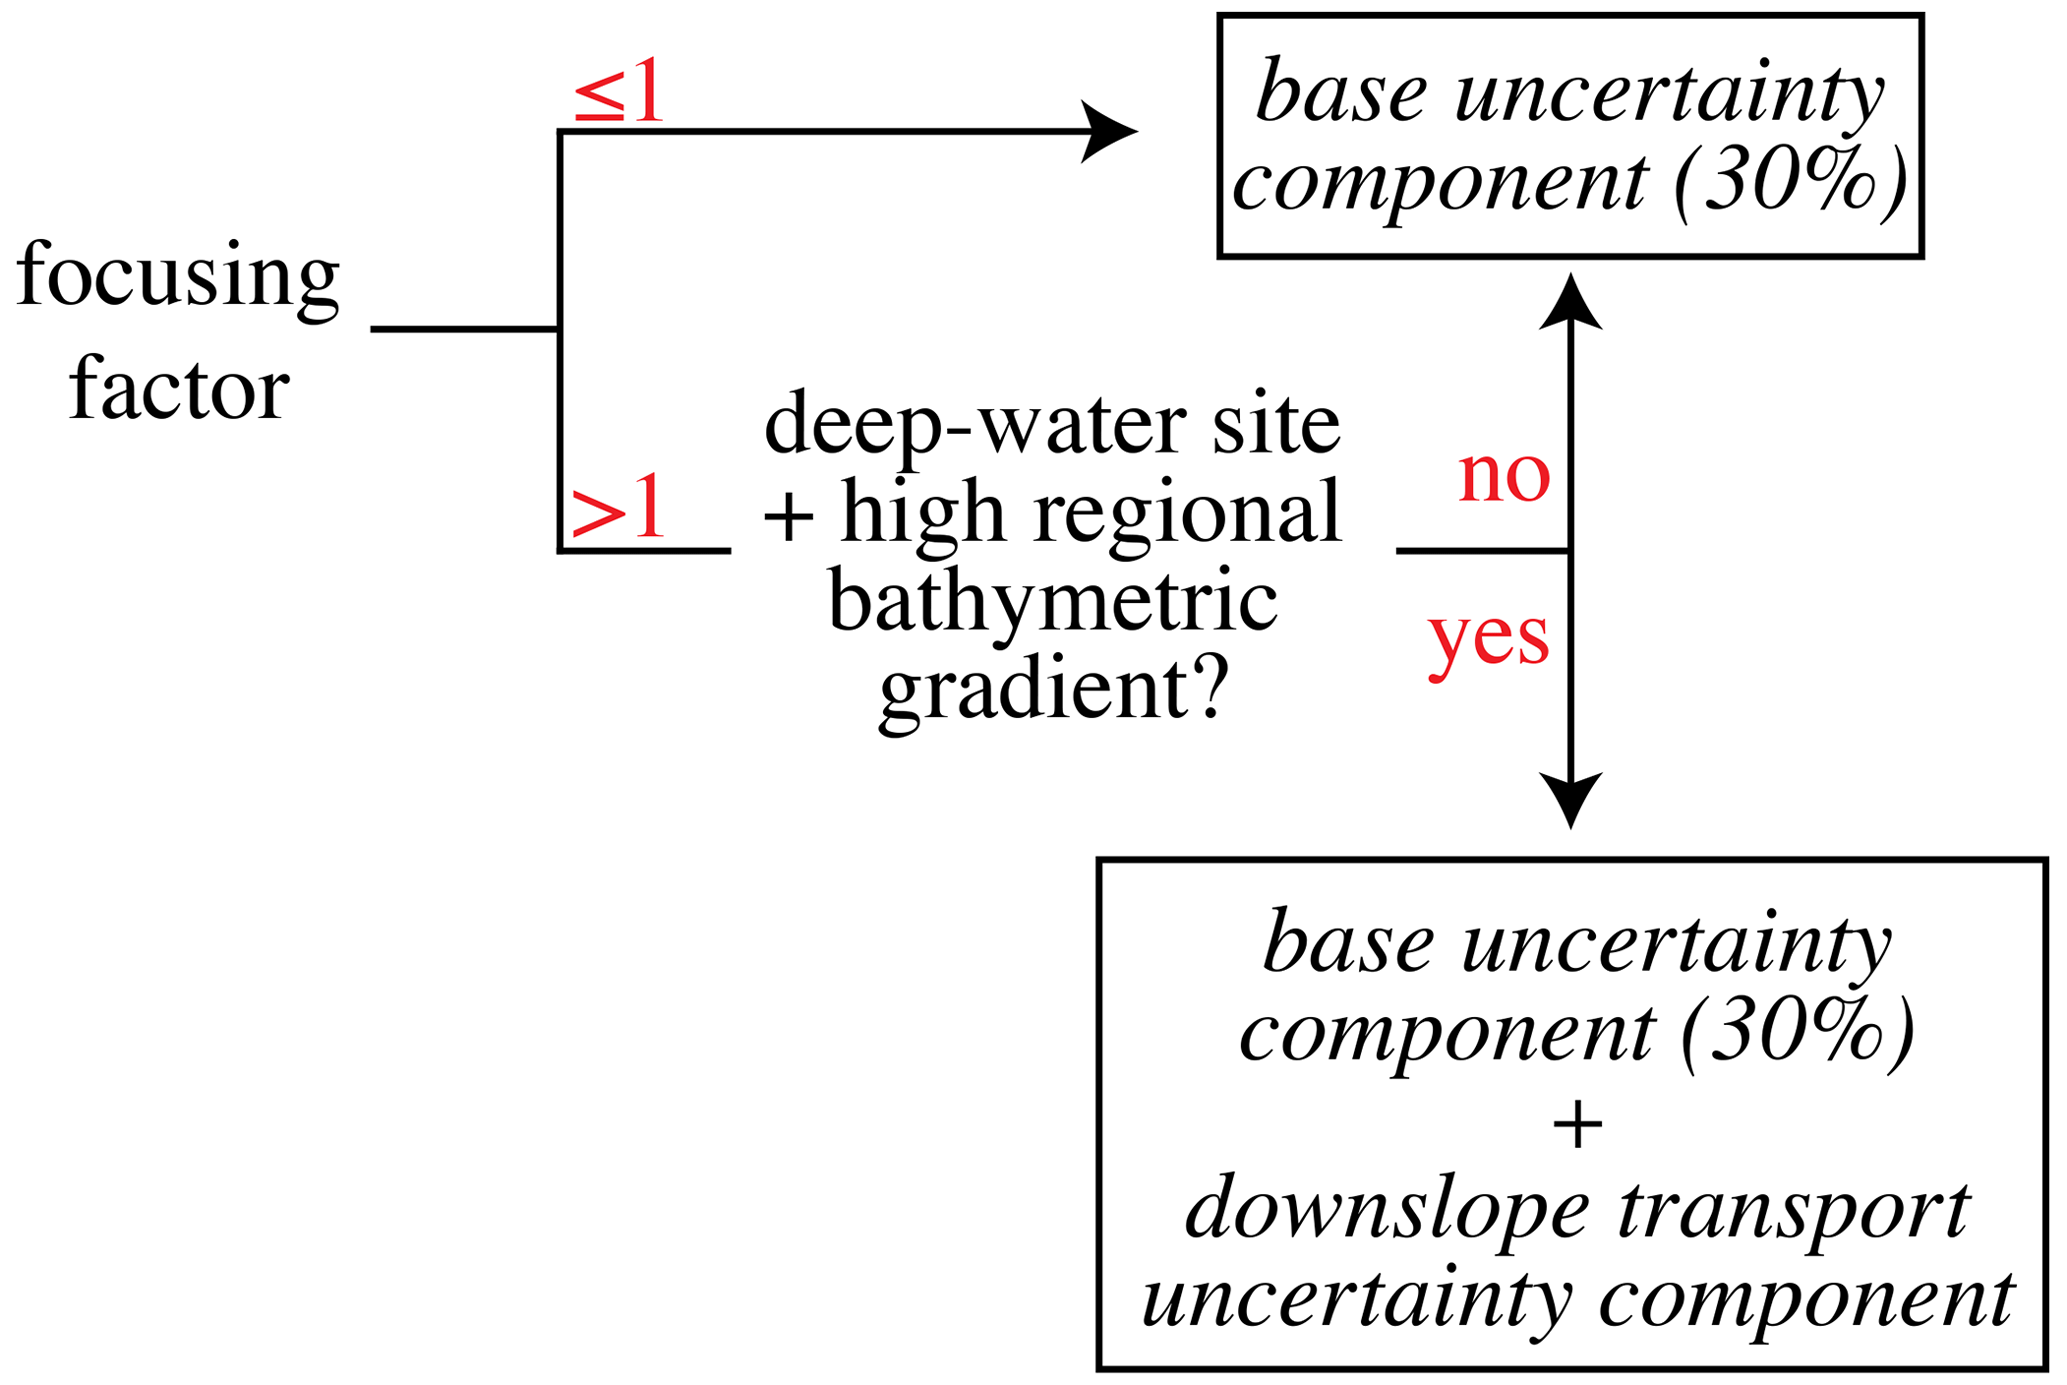
Figure 4Criteria for assigning uncertainty to the sediment bulk mass accumulation rate when using the 230Th normalization technique for deriving dust fluxes from marine sediment cores.
2.8.1 Extra uncertainty in DMAR due to downslope sediment flow
If particles settling into the studied site directly from the overlying water column have the same 230Th activity as particles that have previously been advected laterally for some distance, then Eq. (1) can be used as discussed before to calculate the pelagic SBMAR. This is typically the case when laterally advected sediment is resuspended by bottom currents from a position in the seafloor at a similar water depth compared to the studied site (Francois et al., 2004). However, when the 230Th activities of the sediment components differ, inaccuracies may appear in the calculation of pelagic SBMAR. In principle, this may be the case when laterally advected sediment is originated at positions on the seafloor that are shallower than the studied site (note the dependence of SBMAR on the water depth in Eq. 1) and transported by either downslope bottom currents or by intermediate nepheloid currents (Francois et al., 2004). This is favored in regions of the seafloor with high regional bathymetric gradients, such as along the continental slope or in the open ocean close to bathymetric features (e.g., seamounts, aseismic ridges).
Only a few studies have carried out bathymetric analyses to derive explicit corrections to their SBMAR estimates to account for this potential effect of downslope sediment flow. One such example is from a site located at the foot of the Sierra Leone Rise in the equatorial Atlantic Ocean (EN066-29GGC, Francois et al., 1990). Based on a detailed analysis of the surrounding bathymetry, those authors defined a worst-case scenario in which all laterally transported sediment originated from the topmost part of the rise (with the greatest possible difference in water depth from the studied site and thus the greatest deviation in 230Th activity). In this scenario, the true pelagic SBMAR was overestimated by 36.5 % compared to the SBMAR calculated with Eq. (1) (Francois et al., 1990). Nonetheless, the true overestimation was probably lower, as a more realistic scenario is one in which laterally transported sediment was not fully derived from the top of the rise but partially from different steps along the rise at different water depths (Francois et al., 1990).
Instead, a study that looked at six cores <50 km from each other in the Juan de Fuca Ridge found no systematic differences in 230Th-normalized sediment fluxes, despite the hundred-meter-scale relief between sites (Costa and McManus, 2017). Whether this is an indication of the lack of sensitivity of 230Th-normalized sediment fluxes to downslope sediment flow at a global level remains to be determined. Because of this uncertainty, we did not attempt to apply corrections to 230Th-normalized DMAR estimates from marine sediment cores to account for this effect here. Another reason for not doing so is that it would require an in-depth, site-specific bathymetric analysis, which is out of the scope of this study. Instead, we raised the uncertainty in SBMAR for those sites that have probably experienced sediment focusing through downslope flow. We did so for sites that (i) are located at positions on the seafloor with high regional bathymetric gradients, (ii) are located at relatively deep positions compared to their surroundings, and (iii) have experienced sediment focusing. We evaluated the first two criteria by using GEBCO_2022, a global bathymetric grid at 15 arcsec horizontal resolution (GEBCO Compilation Group, 2022). For each marine sediment core site in Paleo±Dust, we took a 5∘ latitude by 5∘ longitude area centered at the site and calculated the difference between the 5th and 95th percentiles in bathymetry for all GEBCO_2022 grid cells located in that area. We also calculated this value for a reference marine sediment core site: EN066-29GGC (Francois et al., 1990). Any given marine sediment core site in Paleo±Dust where this 5th–95th percentile difference was equal to or higher than half of the 5th–95th difference for the reference site was considered to satisfy condition (i). Condition (ii) was satisfied for those sites located at a water depth of at least the median of that of the area defined for each site. Finally, condition (iii) was satisfied for those sites with a sediment focusing factor greater than 1, where the focusing factor is the ratio of laterally advected to vertical sediment flux, as defined by Francois et al. (2004) and retrieved for each site either from the original study or from the compilation by Costa et al. (2020).
Those sites that passed the above criteria were assigned an extra uncertainty component for SBMAR, which was calculated for each site based on a realistic scenario for reference site EN066-29GGC (half of the worst-case scenario, Francois et al., 1990), and proportionally to the site's focusing factor. The L2 norm was used to combine this extra uncertainty component to the base relative uncertainty component of 30 % common to all SBMAR estimates for marine sediment cores arising from 230Th normalization (Fig. 4).
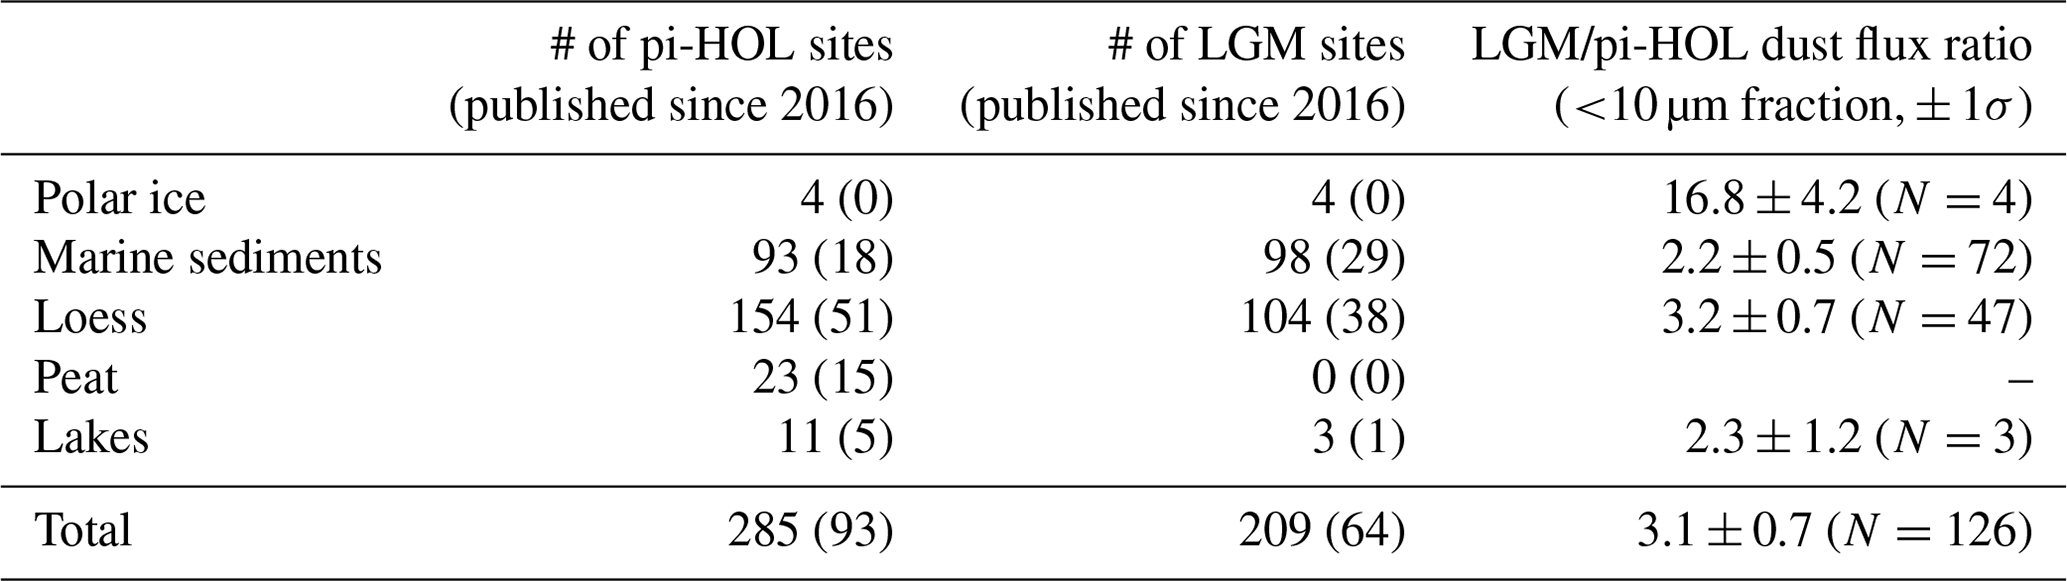
Paleo±Dust consists of a total of 285 pi-HOL and 209 LGM sites, of which approximately a third are sites published since 2016 and not included in previous paleo-dust deposition flux compilations (Table 1). Of all the sites, 52 % correspond to loess, 39 % to marine sediment cores, 4.7 % to peat cores, 2.6 % to lake cores, and 1.6 % to polar ice cores. All peat sites are new to this compilation, with 65 % of the sites published since 2016. Loess is the archive type with the highest number of new sites published since 2016 (89), and, except for peat sites, it is also the archive type with the highest percentage of new sites (35 %). All DMAR determinations from peat sites are for the pi-HOL, which can be explained by the fact that the vast majority of peat bogs globally only started to form during the last deglaciation (Yu et al., 2010).
Table 1Number of sites in Paleo±Dust for the pre-industrial Holocene (pi-HOL, year 1850 CE–11.7 ka) and Last Glacial Maximum (LGM, 19.0–26.5 ka) with a dust deposition rate determination. For the mean LGM/pi-HOL dust flux ratio (<10 µm fraction) calculations, only sites with both pi-HOL and LGM determinations were considered.
While there are several studies that report dust measurements in non-polar ice caps and mountain glaciers for the pi-HOL and LGM, the reported quantity is the particle number concentration in all cases (Fisher, 1979; Thompson et al., 1989, 1995, 1997, 1998; Clifford et al., 2019; Beaudon et al., 2022) except for a site on the Penny ice cap for which the mass concentration is reported (Zdanowicz et al., 2000). Many of these studies also lack grain size data. The derivation of mass deposition rate from particle number concentration alone is not straightforward and requires several assumptions (Kohfeld and Harrison, 2001), including the grain size distribution and the distribution of particle density with grain size. We thus follow Kohfeld and Harrison (2001) and do not derive dust deposition rates in these cases. Thus, no ice cores from non-polar sites are included in Paleo±Dust.
There is a clear Southern versus Northern Hemisphere asymmetry in the number of sites in Paleo±Dust (Fig. 5a–b). This is mostly evident in the number of continental dust archives. There are only a few loess studies from the Pampean region in South America, the main loess belt in the Southern Hemisphere, from which DMAR estimates can be obtained (Kemp et al., 2004; Torre et al., 2019; Coppo et al., 2022b). South American loess is restricted to latitudes <40∘ S, and thus it only archives dust from low- to mid-latitude sources in South America as well as from northernmost Patagonia. Emissions from southernmost Patagonia's main dust sources during the pi-HOL are captured by peat bogs on the Malvinas Islands (Monteath et al., 2022) and possibly also peat bogs located to the east of the Andes (Vanneste et al., 2015, 2016). These latter studies report on sites that are located upwind of the main present-day dust sources but have captured pi-HOL dust from smaller sources in the region. Instead, the bulk of dust emissions from central and southern Patagonia (40–50∘ S) since the LGM are largely unconstrained due to a lack of loess deposits downwind. It is thus critical that marine sediment cores are drilled in the open ocean off the eastern Patagonian coast with a focus on constraining dust fluxes. Elsewhere in the Southern Hemisphere, there is a complete dearth of DMAR estimates from loess or loess-like deposits in Australia, and only one pi-HOL DMAR estimate in southern Africa (Brunotte et al., 2009). In the Northern Hemisphere, the high latitudes in Asia (i.e., Siberia) constitute the area with the scarcest coverage of DMAR constraints. In turn, Europe is the region with the highest number of new DMAR estimates since 2016.
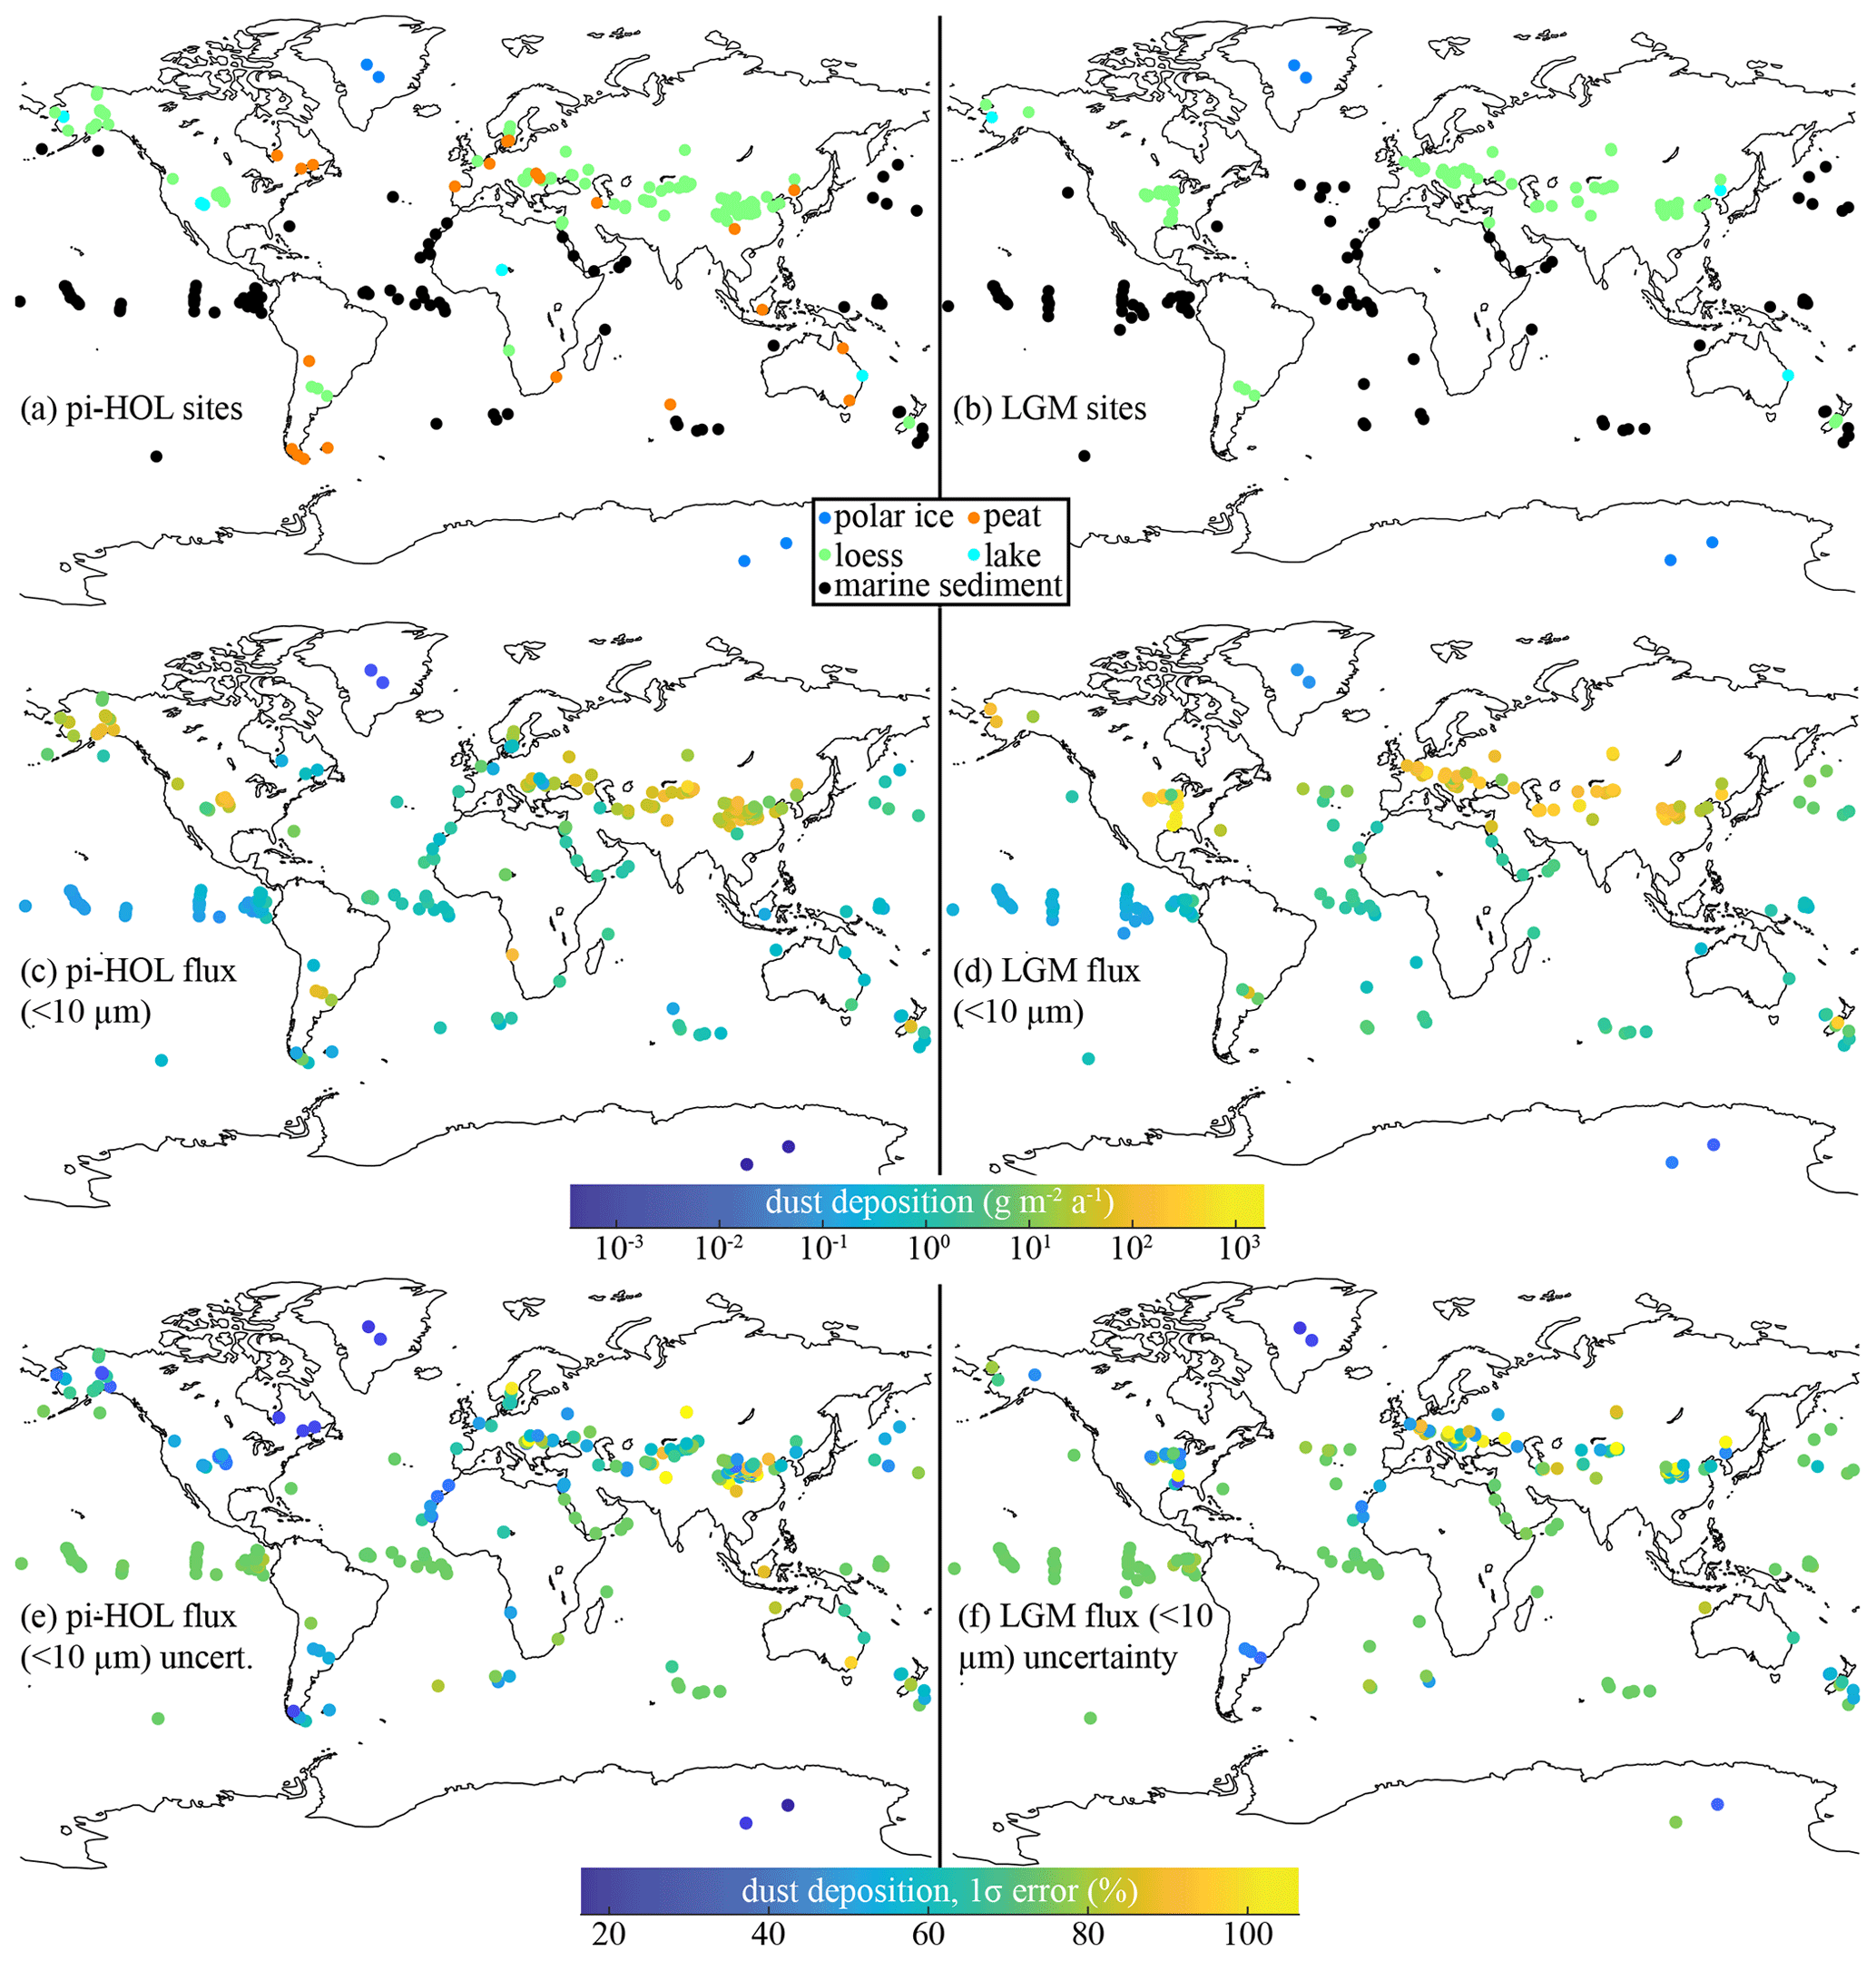
Figure 5Distributions of (a) the sites for the pre-industrial Holocene (pi-HOL) time period and (b) the sites for the Last Glacial Maximum (LGM) time period, the (c) pi-HOL and (d) LGM <10 µm dust deposition rates, and the (e) pi-HOL and (f) LGM <10 µm dust deposition rate uncertainties. The coastlines in all panels correspond to those of the present day.
Based on 126 sites with paired LGM and pi-HOL DMAR determinations (Fig. 5c–d), the global LGM:pi-HOL ratios of DMAR and DMAR10 are 3.3 ± 0.7 and 3.1 ± 0.7, respectively (1σ, Table 1). The latter value is equivalent within error to that determined exclusively based on loess DMAR10 determinations (3.2 ± 0.7, N=47). Based exclusively on intermediate-range dust deposition as archived in marine sediments, this ratio is significantly lower, albeit within the same order of magnitude (2.2 ± 0.5, N=72). Finally, based only on dust archived in polar ice cores, this ratio goes up dramatically to 16.8 ± 4.2, although this is based on only four sites. Three processes are responsible for higher LGM/pi-HOL dust deposition rate ratios for polar ice cores compared to loess: (1) the effect of dust transport in the atmosphere and dry deposition, by which small changes in dust emission intensity translate to small changes in close-to-source dust deposition and to bigger changes in remote dust deposition (Lambert et al., 2008); (2) the effect of mid-latitude precipitation on wet scavenging of dust en route to the poles (Markle et al., 2018), whose variability at glacial–interglacial timescales may imply an amplification of dust deposition rate variability at the poles compared to the low latitudes; and (3), specifically for the Southern Hemisphere, the activation or intensification of dust emissions from Patagonian sources at higher latitudes (compared to the present day) during the LGM implied more efficient transport of dust to Antarctica (Andersen et al., 1998; Petit et al., 1999; Lambert et al., 2008; Albani et al., 2012).
Relative 1σ uncertainties in DMAR and DMAR10 mostly range between 23 %–99 % and 38 %–105 %, respectively (5 %–95 % percentiles, Fig. 5e–f). The least uncertain archive type for DMAR and DMAR10 is polar ice (median: 23 % and 25 %, respectively, N=8), while the most uncertain types are marine sediments (44 % and 74 %, N=191) and loess (45 % and 68 %, N=258). However, the differences in median relative uncertainty among archive types are significantly lower than the differences among individual sites across archive types. There are no significant differences in uncertainty for LGM vs. pi-HOL DMAR and DMAR10. The DMAR10 determinations with the greatest uncertainties (the top 5 % percentile, with values >105 %) all correspond to loess deposits that lack several determinations, and so many assumptions are made (e.g., <10 µm grain size fraction, density, organic content, carbonate content), and/or have ttop and tbottom values that are distinct within error but very close to each other.
All Paleo±Dust files are included in the Supplement (supplementary_data.zip). This consists of two main tab-delimited text files containing the most important variables for each site (i.e., main_piHOL_tab.txt, main_LGM_tab.txt), two extra supporting tab-delimited text files with an expanded set of intermediate variables used to calculate the main set of variables (i.e., supporting_piHOL_tab.txt, supporting_LGM_tab.txt), and two separate text files (i.e., site_specific_notes_references.txt, site_ references.txt) containing site-specific observations and a list of references from where the necessary data were extracted.
The two main text files each contain 10 variables: locality (“siteName_region”), type (i.e., “ice-core”, “marine”, “loess”, “lake”, or “peat”), lat_N (i.e., latitude in degrees north between −90 and 90 to two decimal places), lon_E (i.e., longitude in degrees east between −180 and 180 to two decimal places), top-age_kaBP and bottom-age_kaBP (i.e., ttop and tbottom, respectively, in thousands of years before present to two decimal places), DMAR_g/m2/a and DMAR-1sigma_ g/m2/a (i.e., mean DMAR and 1σ σDMAR for the defined age bracket, respectively, in g m−2 a−1 to three significant figures), and DMAR10_g/m2/a and DMAR10-1sigma_g/m2/a (i.e., mean DMAR10 and 1σ σDMAR10 for the defined age bracket, respectively, in g m−2 a−1 to three significant figures).
The two supporting text files each contain 24 variables, corresponding to the same 10 variables as the main files plus 14 extra variables: first_appeared_in_dataset (i.e., reference to the compilation where the site first appeared), top-age-1sigma_kaBP and bottom-age-1sigma_ kaBP (i.e., 1σ σttop and σtbottom, respectively, in thousands of years before present to two decimal places), thickness_m (i.e., hthick defined by the age bracket, in m to two decimal places), depth-1sigma_ cm (i.e., 1σ uncertainty of the depth below the surface of the dated layers in cm to two decimal places), DBD_g/m3 and DBD-1sigma_g/m3 (i.e., DBD and 1σ σDBD, respectively, in g m−3 to no decimal places), SBMAR_g/m2/a and SBMAR-1sigma_g/m2/a (i.e., SBMAR and its 1σ uncertainty, respectively, only for type “marine”, in g m−2 a−1 to three decimal places), EC_adim and EC-1sigma_adim (i.e., EC (as a number between 0 and 1) and 1σ σEC, respectively, both to three significant figures), f10_adim and f10-1sigma_adim (i.e., f10 (as a number between 0 and 1) and 1σ σf10, respectively, both to three decimal places), and flag-marine-sed-downslope (i.e., a flag exclusive to type “marine”, where 1 means that the site is prone to contamination by downslope sediment movement and 0 means the site is not prone to such contamination).
The Paleo±Dust data files are available in the Supplement (supplementary_data.zip). They are also available in the PANGAEA open access repository (https://doi.org/10.1594/PANGAEA.962969, Cosentino et al., 2024).
Paleo±Dust is an updated global paleo-dust deposition rate compilation for mean pi-HOL and LGM climate states that includes quantitative estimates of uncertainties. Paleo-dust flux measurements from peat bog cores are included in a paleo-dust compilation for the first time. By excluding deglaciation dust fluxes, Paleo±Dust better isolates mean interglacial and glacial dust fluxes than previous datasets. Site-specific age brackets allow the sub-sampling of mean dust deposition constraints for specific time windows of interest. Grain size information was extracted from the original studies to derive fluxes of dust with <10 µm diameter particles.
The main feature of Paleo±Dust is the inclusion of site-specific dust flux uncertainties that are consistent across paleo-dust archive types, i.e., that can be used to gauge the relative accuracy of dust flux constraints between sites of different geologic nature. These new uncertainty data may also be of use as a criterion for selecting a subset of samples for comparison against dust simulation output, to tune dust emission in Earth system models using dust deposition flux data and a weighted approach based on the uncertainty of proxy data, or to construct distribution-based global interpolation maps of paleo-dust deposition rates through Bayesian approaches or Monte Carlo or bootstrapping experiments for use, for example, as input for biogeochemical models.
The supplement related to this article is available online at: https://doi.org/10.5194/essd-16-941-2024-supplement.
Based on the CRediT taxonomy, the following are the individual contributors' roles: NJC: conceptualization, data curation, formal analysis, funding acquisition, investigation, methodology, visualization, writing – original draft preparation, writing – review and editing, GT: data curation, methodology, writing – review and editing, FL: conceptualization, funding acquisition, methodology, supervision, writing – review and editing, SA: conceptualization, methodology, supervision, writing – review and editing, FDV: conceptualization, writing – review and editing, AJMB: conceptualization, writing – review and editing.
The contact author has declared that none of the authors has any competing interests.
Publisher’s note: Copernicus Publications remains neutral with regard to jurisdictional claims made in the text, published maps, institutional affiliations, or any other geographical representation in this paper. While Copernicus Publications makes every effort to include appropriate place names, the final responsibility lies with the authors.
We thank Daniel Muhs, Daniela Constantin, Thomas Stevens, Steve Pratte, and Gaël Le Roux for providing us with highly valuable data. We also thank Gabor Újvári and an anonymous reviewer for improving the manuscript with their constructive comments. This research was financed by the project ANID-FONDECYT-POSTDOCTORADO2020-3200085 and by a 2022 INQUA Fellowship, both awarded to Nicolás Juan Cosentino, and by the project ANID-FONDECYT-REGULAR2023-1231682 awarded to Fabrice Lambert. The discussions that resulted in this paper also benefited from meeting travel grants from the project CLIMAT-AmSud 22-CLIMAT-01.
This research has been supported by the Agencia Nacional de Investigación y Desarrollo (grant nos. ANID-FONDECYT-POSTDOCTORADO2020-3200085 and ANID-FONDECYT-REGULAR2023-1231682).
This paper was edited by Xingchen Wang and reviewed by Gabor Ujvari and one anonymous referee.
Adebiyi, A., Kok, J. F., Murray, B. J., Ryder, C. L., Stuut, J.-B. W., Kahn, R. A., Knippertz, P., Formenti, P., Mahowald, N. M., García-Pando, C. P., Klose, M., Ansmann, A., Samset, B. H., Ito, A., Balkanski, Y., Di Biagio, C., Romanias, M. N., Huang, Y., and Meng, J.: A review of coarse mineral dust in the Earth system, Aeolian Res., 60, 100849, https://doi.org/10.1016/j.aeolia.2022.100849, 2023.
Albani, S. and Mahowald, N. M.: Paleodust insights into dust impacts on climate, J. Climate, 32, 7897–7913, https://doi.org/10.1175/JCLI-D-18-0742.1, 2019.
Albani, S., Mahowald, N. M., Delmonte, B., Maggi, V., and Winckler, G.: Comparing modeled and observed changes in mineral dust transport and deposition to Antarctica between the Last Glacial Maximum and current climates, Clim. Dynam., 38, 1731–1755, https://doi.org/10.1007/s00382-011-1139-5, 2012.
Albani, S., Mahowald, N. M., Perry, A. T., Scanza, R. A., Zender, C. S., Heavens, N. G., Maggi, V., Kok, J. F., and Otto-Bliesner, B. L.: Improved dust representation in the Community Atmosphere Model, J. Adv. Model. Earth Sy., 6, 541–570, https://doi.org/10.1002/2013MS000279, 2014.
Albani, S., Mahowald, N. M., Winckler, G., Anderson, R. F., Bradtmiller, L. I., Delmonte, B., François, R., Goman, M., Heavens, N. G., Hesse, P. P., Hovan, S. A., Kang, S. G., Kohfeld, K. E., Lu, H., Maggi, V., Mason, J. A., Mayewski, P. A., McGee, D., Miao, X., Otto-Bliesner, B. L., Perry, A. T., Pourmand, A., Roberts, H. M., Rosenbloom, N., Stevens, T., and Sun, J.: Twelve thousand years of dust: the Holocene global dust cycle constrained by natural archives, Clim. Past, 11, 869–903, https://doi.org/10.5194/cp-11-869-2015, 2015.
Albani, S., Mahowald, N. M., Murphy, L. N., Raiswell, R., Moore, J. K., Anderson, R. F., McGee, D., Bradtmiller, L. I., Delmonte, B., Hesse, P. P., and Mayewski, P. A.: Paleodust variability since the Last Glacial Maximum and implications for iron inputs to the ocean, Geophys. Res. Lett., 43, 3944–3954, https://doi.org/10.1002/2016GL067911, 2016.
Andersen, K. K., Armengaud, A., and Genthon, C.: Atmospheric dust under glacial and interglacial conditions, Geophys. Res. Lett., 25, 2281–2284, https://doi.org/10.1029/98GL51811, 1998.
Andreae, M. O., Jones, C. D., and Cox, P. M.: Strong present-day aerosol cooling implies a hot future, Nature, 435, 1187–1190, https://doi.org/10.1038/nature03671, 2005.
Arcusa, S. H., McKay, N. P., Routson, C. C., and Munoz, S. E.: Dust-drought interactions over the last 15,000 years: A network of lake sediment records from the San Juan Mountains, Colorado, Holocene, 30, 559–574, https://doi.org/10.1177/0959683619875192, 2020.
Bacon, M. P.: Glacial to interglacial changes in carbonate and clay sedimentation in the Atlantic Ocean estimated from 230Th measurements, Isotope Geosci., 2, 97–111, https://doi.org/10.1016/0009-2541(84)90183-9, 1984.
Beaudon, E., Sheets, J. M., Martin, E., Sierra-Hernández, M. R., Mosley-Thompson, E., and Thompson, L. G.: Aeolian dust preserved in the Guliya ice cap (northwestern Tibet): A promising paleo-environmental messenger, Geosciences, 12, 366, https://doi.org/10.3390/geosciences12100366, 2022.
Blais, J. M. and Kalff, J.: The influence of lake morphometry on sediment focusing, Limnol. Oceanogr., 40, 582–588, https://doi.org/10.4319/lo.1995.40.3.0582, 1995.
Braconnot, P., Albani, S., Balkanski, Y., Cozic, A., Kageyama, M., Sima, A., Marti, O., and Peterschmitt, J.-Y.: Impact of dust in PMIP-CMIP6 mid-Holocene simulations with the IPSL model, Clim. Past, 17, 1091–1117, https://doi.org/10.5194/cp-17-1091-2021, 2021.
Brunotte, E., Maurer, B., Fischer, P., Lomax, J., and Sander, H.: A sequence of fluvial and aeolian deposits (desert loess) and palaeosoils covering the last 60ka in the Opuwo basin (Kaokoland/Kunene Region, Namibia) based on luminescence dating, Quatern. Int., 196, 71–85, https://doi.org/10.1016/j.quaint.2008.06.008, 2009.
Chen, S., Jiang, N., Huang, J., Xu, X., Zhang, H., Zang, Z., Huang, K., Xu, X., Wei, Y., Guan, X., Zhang, X., Luo, Y., Hu, Z., and Feng, T.: Quantifying contributions of natural and anthropogenic dust emission from different climatic regions, Atmos. Environ., 191, 94–104, https://doi.org/10.1016/j.atmosenv.2018.07.043, 2018.
Clark, P. U., Dyke, A. S., Shakun, J. D., Carlson, A. E., Clark, J., Wohlfarth, B., Mitrovica, J. X., Hostetler, S. W., and McCabe, A. M.: The Last Glacial Maximum, Science, 325, 710–714, https://doi.org/10.1126/science.1172873, 2009.
Clifford, H. M., Spaulding, N. E., Kurbatov, A. V., More, A., Korotkikh, E. V., Sneed, S. B., Handley, M., Maasch, K. A., Loveluck, C. P., Chaplin, J., McCormick, M., and Mayewski, P. A.: A 2000 year Saharan dust event proxy record from an ice core in the European Alps, J. Geophys. Res.-Atmos., 124, 12882–12900, https://doi.org/10.1029/2019JD030725, 2019.
Comola, F., Giometto, M. G., Salesky, S. T., Parlange, M. B., and Lehning, M.: Preferential deposition of snow and dust over hills: Governing processes and relevant scales, J. Geophys. Res.-Atmos., 124, 7951–7974, https://doi.org/10.1029/2018JD029614, 2019.
Coppo, R., Cosentino, N. J., Torre, G., del Rio, I., Sawakuchi, A. O., Berman, A. L., Koester, E., Delmonte, B., and Gaiero, D. M.: Pampean loess chronology, physical, chemical, and provenance characterization, Version 1.0, Interdisciplinary Earth Data Alliance (IEDA) [data set], https://doi.org/10.26022/IEDA/112531, 2022a.
Coppo, R., Cosentino, N. J., Torre, G., del Rio, I., Sawakuchi, A. O., Berman, A. L., Koester, E., Delmonte, B., and Gaiero, D. M.: Coeval minimum south American and maximum Antarctic last glacial maximum dust deposition: A causal link?, Quaternary Sci. Rev., 295, 107768, https://doi.org/10.1016/j.quascirev.2022.107768, 2022b.
Cosentino, N. J., Torre, G., Lambert, F., Albani, S., De Vleeschouwer, F., and Bory, A. J.-M.: Paleo±Dust: Quantifying uncertainty in paleo-dust deposition across archive types, PANGAEA [data set], https://doi.org/10.1594/PANGAEA.962969, 2024.
Costa, K. and McManus, J.: Efficacy of 230Th normalization in sediments from the Juan de Fuca Ridge, northeast Pacific Ocean, Geochim. Cosmochim. Ac., 197, 215–225, https://doi.org/10.1016/j.gca.2016.10.034, 2017.
Costa, K. M., Hayes, C. T., Anderson, R. F., Pavia, F. J., Bausch, A., Deng, F., Dutay, J.-C., Gibert, W., Heinze, C., Henderson, G., Hillaire-Marcel, C., Hoffmann, S., Jaccard, S. L., Jacobel, A. W., Kienast, S. S., Kipp, L., Lerner, P., Lippold, J., Lund, D., Marcantonio, F., McGee, D., McManus, J. F., Mekik, F., Middleton, J. L., Missiaen, L., Not, C., Pichat, S., Robinson, L. F., Rowland, G. H., Roy-Barman, M., Tagliabue, A., Torfstein, A., Winckler, G., and Zhou, Y.: 230Th normalization: New insights on an essential tool for quantifying sedimentary fluxes in the modern and Quaternary ocean, Paleoceanography and Paleoclimatology, 35, e2019PA003820, https://doi.org/10.1029/2019PA003820, 2020.
Da, J., Li, G. K., and Ji, J.: Seasonal changes in the formation time of pedogenic carbonates on the Chinese Loess Plateau during Quaternary glacial cycles, Quaternary Sci. Rev., 305, 108008, https://doi.org/10.1016/j.quascirev.2023.108008, 2023.
Delmonte, B., Petit, J. R., Krinner, G., Maggi, V., Jouzel, J., and Udisti, R.: Ice core evidence for secular variability and 200-year dipolar oscillations in atmospheric circulation over East Antarctica during the Holocene, Clim. Dynam., 24, 641–654, https://doi.org/10.1007/s00382-005-0012-9, 2005.
De Vleeschouwer, F., Ferrat, M., McGowan, H., Vanneste, H., and Weiss, D.: Extracting paleodust information from peat geochemistry, Past Global Changes (PAGES) Magazine, 22, 88–89, 2014.
Fisher, D. A.: Comparison of 105 years of oxygen isotope and insoluble impurity profiles from the Devon Island and Camp Century ice cores, Quaternary Res., 11, 299–305, https://doi.org/10.1016/0033-5894(79)90077-2, 1979.
Francois, R., Bacon, M. P., and Suman, D. O.: Thorium 230 profiling in deep-sea sediments: High-resolution records of flux and dissolution of carbonate in the equatorial Atlantic during the last 24,000 years, Paleoceanography and Paleoclimatology, 5, 761–787, https://doi.org/10.1029/PA005i005p00761, 1990.
Francois, R., Frank, M., Rutgers van der Loeff, M. M., and Bacon, M. P.: 230Th normalization: An essential tool for interpreting sedimentary fluxes during the late Quaternary, Paleoceanography and Paleoclimatology, 19, PA1018, https://doi.org/10.1029/2003PA000939, 2004.
GEBCO Compilation Group: GEBCO 2022 Grid [data set], https://doi.org/10.5285/e0f0bb80-ab44-2739-e053-6c86abc0289c, 2022.
Gerland, S., Oerter, H., Kipfstuhl, J., Wilhelms, F., Miller, H., and Miners, W. D.: Density log of a 181 m long ice core from Berkner Island, Antarctica, Ann. Glaciol., 29, 215–219, https://doi.org/10.3189/172756499781821427, 1999.
Ginoux, P., Prospero, J. M., Gill, T. E., Hsu, N. C., and Zhao, M.: Global-scale attribution of anthropogenic and natural dust sources and their emission rates based on MODIS Deep Blue aerosol products, Rev. Geophys., 50, RG3005, https://doi.org/10.1029/2012RG000388, 2012.
Han, Y., Zhang, J., Mattson, K. G., Zhang, W., and Weber, T. A.: Sample sizes to control error estimates in determining soil bulk density in California forest soils, Soil Sci. Soc. Am. J., 80, 756–764, https://doi.org/10.2136/sssaj2015.12.0422, 2016.
Hatté, C., Antoine, P., Fontugne, M., Lang, A., Rousseau, D.-D., and Zöller, L.: δ13C of loess organic matter as a potential proxy for paleoprecipitation, Quaternary Res., 55, 33–38, https://doi.org/10.1006/qres.2000.2191, 2001.
Heinemann, M., Segschneider, J., and Schneider, B.: CO2 drawdown due to particle ballasting by glacial aeolian dust: an estimate based on the ocean carbon cycle model MPIOM/HAMOCC version 1.6.2p3, Geosci. Model Dev., 12, 1869–1883, https://doi.org/10.5194/gmd-12-1869-2019, 2019.
Henderson, G. M., Heinze, C., Anderson, R. F., Winguth, A. M. E.: Global distribution of the 230Th flux to ocean sediments constrained by GCM modelling, Deep-Sea Res., Pt. I, 46, 1861–1893, https://doi.org/10.1016/S0967-0637(99)00030-8, 1999.
Hopcroft, P. O., Valdes, P. J., Woodward, S., and Joshi, M. M.: Last glacial maximum radiative forcing from mineral dust aerosols in an Earth system model, J. Geophys. Res.-Atmos., 120, 8186–8205, https://doi.org/10.1002/2015JD023742, 2015.
Kemp, R. A., Toms, P. S., King, M., and Kröhling, D. M.: The pedosedimentary evolution and chronology of Tortugas, a Late Quaternary type-site of the northern Pampa, Argentina, Quatern. Int., 114, 101–112, https://doi.org/10.1016/S1040-6182(03)00045-4, 2004.
Kienast, S. S., Winckler, G., Lippold, J., Albani, S., and Mahowald, N. M.: Tracing dust input to the global ocean using thorium isotopes in marine sediments: ThoroMap, Global Biogeochem. Cy., 30, 1526–1541, https://doi.org/10.1002/2016GB005408, 2016.
Kohfeld, K. E. and Harrison, S. P.: DIRTMAP: the geological record of dust, Earth-Sci. Rev., 54, 81–114, https://doi.org/10.1016/S0012-8252(01)00042-3, 2001.
Kohfeld, K. E. and Harrison, S. P.: Glacial-interglacial changes in dust deposition on the Chinese Loess Plateau, Quaternary Sci. Rev., 22, 1859–1878, https://doi.org/10.1016/S0277-3791(03)00166-5, 2003.
Kohfeld, K. E., Graham, R. M., de Boer, A. M., Sime, L. C., Wolff, E. W., Le Quéré, C., and Bopp, L.: Southern Hemisphere westerly wind changes during the Last Glacial Maximum: paleo-data synthesis, Quaternary Sci. Rev., 68, 76–95, https://doi.org/10.1016/j.quascirev.2013.01.017, 2013.
Kok, J. F., Storelvmo, T., Karydis, V. A., Adebiyi, A. A., Mahowald, N. M., Evan, A. T., He, C., and Leung, D. M.: Mineral dust aerosol impacts on global climate and climate change, Nature Reviews Earth & Environment, 4, 71–86, https://doi.org/10.1038/s43017-022-00379-5, 2023.
Krätschmer, S., van der Does, M., Lamy, F., Lohmann, G., Völker, C., and Werner, M.: Simulating glacial dust changes in the Southern Hemisphere using ECHAM6.3-HAM2.3, Clim. Past, 18, 67–87, https://doi.org/10.5194/cp-18-67-2022, 2022.
Kylander, M. E., Martínez-Cortizas, A., Bindler, R., Greenwood, S. L., Mörth, C.-M., and Rauch, S.: Potentials and problems of building detailed dust records using peat archives: An example from Store Mosse (the “Great Bog”), Sweden, Geochim. Cosmochim. Ac., 190, 156–174, https://doi.org/10.1016/j.gca.2016.06.028, 2016.
Kylander, M. E., Martínez-Cortizas, A., Bindler, R., Kaal, J., Sjöström, J. K., Hansson, S. V., Silva-Sánchez, N., Greenwood, S. L., Gallagher, K., Rydberg, J., Mörth, C.-M., and Rauch, S.: Mineral dust as a driver of carbon accumulation in northern latitudes, Sci. Rep-UK, 8, 6876, https://doi.org/10.1038/s41598-018-25162-9, 2018.
Lambert, F., Delmonte, B., Petit, J. R., Bigler, M., Kaufmann, P. R., Hutterli, M. A., Stocker, T. F., Ruth, U., Steffensen, J. P., and Maggi, V.: Dust-climate couplings over the past 800,000 years from the EPICA Doce C ice core, Nature, 452, 616–619, https://doi.org/10.1038/nature06763, 2008.
Lambert, F., Tagliabue, A., Shaffer, G., Lamy, F., Winckler, G., Farias, L., Gallardo, L., and De Pol-Holz, R.: Dust fluxes and iron fertilization in Holocene and Last Glacial Maximum climates, Geophys. Res. Lett., 42, 6014–6023, https://doi.org/10.1002/2015GL064250, 2015.
Lambert, F., Opazo, N., Ridgwell, A., Winckler, G., Lamy, F., Shaffer, G., Kohfeld, K., Ohgaito, R., Albani, S., and Abe-Ouchi, A.: Regional patterns and temporal evolution of ocean iron fertilization and CO2 drawdown during the last glacial termination, Earth Planet. Sc. Lett., 554, 116675, https://doi.org/10.1016/j.epsl.2020.116675, 2021.
Lamy, F., Gersonde, R., Winckler, G., Esper, O., Jaeschke, A., Kuhn, G., Ullermann, J., Martinez-Garcia, A., Lambert, F., and Kilian, R.: Increased dust deposition in the Pacific Southern Ocean during glacial periods, Science, 343, 403–407, https://doi.org/10.1126/science.1245424, 2014.
Li, G., Chen, J., and Chen, Y.: Primary and secondary carbonate in Chinese loess discriminated by trace element composition, Geochim. Cosmochim. Ac., 103, 26–35, https://doi.org/10.1016/j.gca.2012.10.049, 2013.
Lisiecki, L. E. and Raymo, M. E.: A Pliocene-Pleistocene stack of 57 globally distributed benthic δ18O records, Paleoceanography and Paleoclimatology, 20, PA1003, https://doi.org/10.1029/2004PA001071, 2005.
Lovejoy, S. and Lambert, F.: Spiky fluctuations and scaling in high-resolution EPICA ice core dust fluxes, Clim. Past, 15, 1999–2017, https://doi.org/10.5194/cp-15-1999-2019, 2019.
Maher, B. A., Prospero, J. M., Mackie, D., Gaiero, D., Hesse, P. P., and Balkanski, Y.: Global connections between aeolian dust, climate and ocean biogeochemistry at the present day and at the last glacial maximum, Earth-Sci. Rev., 99, 61–97, https://doi.org/10.1016/j.earscirev.2009.12.001, 2010.
Mahowald, N. M., Kohfeld, K., Hansson, M., Balkanski, Y., Harrison, S. P., Prentice, I. C., Schulz, M., and Rodhe, H.: Dust sources and deposition during the last glacial maximum and current climate: A comparison of model results with paleodata from ice cores and marine sediments, J. Geophys. Res.-Atmos., 104, 15895–15916, https://doi.org/10.1029/1999JD900084, 1999.
Mahowald, N. M., Muhs, D. R., Levis, S., Rasch, P. J., Yoshioka, M., Zender, C. S., and Luo, C.: Change in atmospheric mineral aerosols in response to climate: Last glacial period, preindustrial, modern, and doubled carbon dioxide climates, J. Geophys. Res.-Atmos., 111, D10202, https://doi.org/10.1029/2005JD006653, 2006.
Markle, B. R., Steig, E. J., Roe, G. H., Winckler, G., and McConnell, J. R.: Concomitant variability in high-latitude aerosols, water isotopes and the hydrologic cycle, Nat. Geosci., 11, 853–859, 2018.
Martínez Cortizas, A., López-Costas, O., Orme, L., Mighall, T., Kylander, M. E., Bindler, R., and Gallego Sala, A.: Holocene atmospheric dust deposition in NW Spain, Holocene, 30, 507–518, https://doi.org/10.1177/0959683619875193, 2020.
Marx, S. K., Kamber, B. S., McGowan, H. A., Petherick, L. M., McTainsh, G. H., Stromsoe, N., Hooper, J. N., and May, J.-H.: Palaeo-dust records: A window to understanding past environments, Global Planet. Change, 165, 13–43, https://doi.org/10.1016/j.gloplacha.2018.03.001, 2018.
McGee, D., deMenocal, P. B., Winckler, G., Stuut, J. B. W., and Bradtmiller, L. I.: The magnitude, timing and abruptness of changes in North African dust deposition over the last 20,000 yr, Earth Planet. Sc. Lett., 371–372, 163–176, https://doi.org/10.1016/j.epsl.2013.03.054, 2013.
Meng, X., Liu, L., Balsam, W., Li, S., He, T., Chen, J., and Ji, J.: Dolomite abundance in Chinese loess deposits: A new proxy of monsoon precipitation intensity, Geophys. Res. Lett., 42, 10391–10398, https://doi.org/10.1002/2015GL066681, 2015.
Meng, X., Liu, L., Wang, X. T., Balsam, W., Chen, J., and Ji, J.: Mineralogical evidence of reduced East Asian summer monsoon rainfall on the Chinese loess plateau during the early Pleistocene interglacials, Earth Planet. Sc. Lett., 486, 61–69, https://doi.org/10.1016/j.epsl.2017.12.048, 2018.
Meng, X., Liu, L., Zhao, W., He, T., Chen, J., and Ji, J.: Distant Taklimakan Desert as an important source of aeolian deposits on the Chinese Loess Plateau as evidenced by carbonate minerals, Geophys. Res. Lett., 46, 4854–4862, https://doi.org/10.1029/2018GL081551, 2019.
Monteath, A., Hughes, P., Cooper, M., Groff, D., Scaife, R., and Hodgson, D.: Late glacial-Holocene record of Southern Hemisphere westerly wind dynamics from the Falkland Islands, South Atlantic Ocean, Geology, 50, 880–885, https://doi.org/10.1130/G49805.1, 2022.
Mortlock, R. A., Charles, C. D., Froelich, P. N., Zibello, M. A., Saltzman, J., Hays, J. D., and Burckle, L. H.: Evidence for lower productivity in the Antarctic Ocean during the last Glaciation, Nature, 351, 220–223, https://doi.org/10.1038/351220a0, 1991.
Muhs, D. R., Prospero, J. M., Baddock, M. C., and Gill, T. E.: Identifying sources of aeolian mineral dust: Present and past, in: Mineral dust, edited by: Knippertz, P. and Stuut, J. B., Springer, Durdrecht, https://doi.org/10.1007/978-94-017-8978-3_3, 2014.
Ohgaito, R., Abe-Ouchi, A., O'ishi, R., Takemura, T., Ito, A., Hajima, T., Watanabe, S., and Kawamiya, M.: Effect of high dust amount on surface temperature during the Last Glacial Maximum: a modelling study using MIROC-ESM, Clim. Past, 14, 1565–1581, https://doi.org/10.5194/cp-14-1565-2018, 2018.
Otto-Bliesner, B. L., Brady, E. C., Tomas, R. A., Albani, S., Bartlein, P. J., Mahowald, N. M., Shafer, S. L., Kluzek, E., Lawrence, P. J., Leguy, G., Rothstein, M., and Sommers, A. N.: A comparison of the CMIP6 midHolocene and lig127k Simulations in CESM2, Paleoceanography and Paleoclimatology, 35, e2020PA003957, https://doi.org/10.1029/2020PA003957, 2020.
Ouyang, S., Duan, Z., Lin, W., and Luo, Y.: Revisit of thorium-based dust fluxes and their implications for the iron fertilization hypothesis, J. Oceanogr., 78, 49–62, https://doi.org/10.1007/s10872-021-00626-1, 2022.
Peric, Z. M., Markovic, S. B., Sipos, G., Gavrilov, M. B., Thiel, C., Zeeden, C., and Murray, A. S.: A post-IR IRSL chronology and dust mass accumulation rates of the Nosak loess-palaeosol sequence in northeastern Serbia, Boreas, 49, 841–857, https://doi.org/10.1111/bor.12459, 2020.
Petherick, L. M., McGowan, H. A., and Kamber, B. S.: Reconstructing transport pathways for late Quaternary dust from eastern Australia using the composition of trace elements of long traveled dusts, Geomorphology, 105, 67–79, https://doi.org/10.1016/j.geomorph.2007.12.015, 2009.
Petit, J.-R., Jouzel, J., Raynaud, D., Barkov, N. I., Barnola, J. M., Basile, I., Bender, M., Chappellaz, J., Davisk, M., Delaygue, G., Delmotte, M., Kotlyakov, V. M., Legrand, M., Lipenkov, V. Y., Lorius, C., Pepin, L., Ritz, C., Saltzmank, E., and Stievenard, M.: Climate and atmospheric history of the past 420,000 years from the Vostok ice core, Antarctica, Nature, 399, 429–436, https://doi.org/10.1038/20859, 1999.
Pratte, S., Bao, K., Sapkota, A., Xhang, W., Shen, J., Le Roux, G., and De Vleeschouwer, F.: 14 kyr of atmospheric mineral dust deposition in north-eastern China: A record of palaeoclimatic and palaeoenvironmental changes in the Chinese dust source regions, Holocene, 30, 492–506, https://doi.org/10.1177/0959683619892661, 2020.
Pye, K.: The nature, origin and accumulation of loess, Quaternary Sci. Rev., 14, 653–667, https://doi.org/10.1016/0277-3791(95)00047-X, 1995.
Ruth, U., Wagenbach, D., Bigler, M., Steffensen, J. P., Röthlisberger, R., and Miller, H.: High-resolution microparticle profiles at NorthGRIP, Greenland: case studies of the calcium-dust relationship, Ann. Glaciol., 35, 237–242, https://doi.org/10.3189/172756402781817347, 2002.
Scheuvens, D., and Kandler, K.: On composition, morphology, and size distribution of airborne mineral dust, in: Mineral Dust, edited by: Knippertz, P. and Stuut, J. B., Springer, Dordrecht, https://doi.org/10.1007/978-94-017-8978-3_2, 2014.
Scholten, J. C., Fietzke, J., Vogler, S., Rutgers van der Loeff, M. M., Mangini, A., Koeve, W., Waniek, J., Stoffers, P., Antia, A., and Kuss, J.: Trapping efficiencies of sediment traps from the deep eastern North Atlantic: the 230Th calibration, Deep-Sea Res. Pt. II, 48, 2383–2408, https://doi.org/10.1016/S0967-0645(00)00176-4, 2001.
Sharifi, A., Murphy, L. N., Pourmand, A., Clement, A. C., Canuel, E. A., Naderi Beni, A., Lahijani, H. A. K., Delanghe, D., and Ahmady-Birgani, H.: Early-Holocene greening of the Afro-Asian dust belt changed sources of mineral dust in West Asia, Earth Planet. Sc. Lett., 481, 30–40, https://doi.org/10.1016/j.epsl.2017.10.001, 2018.
Sherwood, S. C., Webb, M. J., Annan, J. D., Armour, K. C., Forster, P. M., Hargreaves, J. C., Hegerl, G., Klein, S. A., Marvel, K. D., Rohling, E. J., Watanabe, M., Andrews, T., Braconnot, P., Bretherton, C. S., Foster, G. L., Hausfather, Z., von der Heydt, A. S., Knutti, R., Mauritsen, T., Norris, J. R., Proistosescu, C., Rugenstein, M., Schmidt, G. A., Tokarska, K. B., and Zelinka, M. D.: An assessment of Earth's climate sensitivity using multiple lines of evidence, Rev. Geophys., 58, e2019RG000678, https://doi.org/10.1029/2019RG000678, 2020.
Shotyk, W.: Natural and anthropogenic enrichments of As, Cu, Pb, Sb and Zn in ombrotrophic versus minerotrophic peat bog profiles, Jura Mountains, Switzerland, Water Air Soil Pollut., 90, 375–405, https://doi.org/10.1007/BF00282657, 1996.
Shotyk, W., Krachler, M., Martinez-Cortizas, A., Cheburkin, A. K., and Emons, H.: A peat bog record of natural, pre-anthropogenic enrichments of trace elements in atmospheric aerosols since 12 370 14C yr BP, and their variation with Holocene climate change, Earth Planet Sc. Lett., 199, 21–37, https://doi.org/10.1016/S0012-821X(02)00553-8, 2002.
Simonsen, M. F., Cremonesi, L., Baccolo, G., Bosch, S., Delmonte, B., Erhardt, T., Kjær, H. A., Potenza, M., Svensson, A., and Vallelonga, P.: Particle shape accounts for instrumental discrepancy in ice core dust size distributions, Clim. Past, 14, 601–608, https://doi.org/10.5194/cp-14-601-2018, 2018.
Simonsen, M. F., Baccolo, G., Blunier, T., Borunda, A., Delmonte, B., Frei, R., Goldstein, S., Grinsted, A., Kjær, H. A., Sowers, T., Svensson, A., Vinther, B., Vladimirova, D., Winckler, G., Winstrup, M., and Vallelonga, P.: East Greenland ice core dust record reveals timing of Greenland ice sheet advance and retreat, Nat. Commun., 10, 4494, https://doi.org/10.1038/s41467-019-12546-2, 2019.
Singh, A. K., Marcantonio, F., and Lyle, M.: Sediment focusing in the Panama Basin, Eastern Equatorial Pacific Ocean, Earth Planet. Sc. Lett., 309, 33–44, https://doi.org/10.1016/j.epsl.2011.06.020, 2011.
Sjöström, J. K., Martínez Cortizas, A., Hansson, S. V., Silva Sánchez, N., Bindler, R., Rydberg, J., Mörth, C.-M., Ryberg, E. E., and Kylander, M. E.: Paleodust deposition and peat accumulation rates – Bog size matters, Chem. Geol., 554, 119795, https://doi.org/10.1016/j.chemgeo.2020.119795, 2020.
Stanelle, T., Bey, I., Raddatz, T., Reick, C., and Tegen, I.: Anthropogenically induced changes in twentieth century mineral dust burden and the associated impact on radiative forcing, J. Geophys. Res.-Atmos., 119, 13526–13546, https://doi.org/10.1002/2014JD022062, 2014.
Steffensen, J. P.: The size distribution of microparticles from selected segments of the Greenland Ice Core Project ice core representing different climatic periods, J. Geophys. Res.-Oceans, 102, 26755–26763, https://doi.org/10.1029/97JC01490, 1997.
Stevens, T., Buylaert, J.-P., Thiel, C., Újvári, G., Yi, S., Murray, A. S., Frechen, M., and Lu, H.: Ice-volume-forced erosion of the Chinese Loess Plateau global Quaternary stratotype site, Nat. Commun., 9, 983, https://doi.org/10.1038/s41467-018-03329-2, 2018.
Struve, T., Longman, J., Zander, M., Lamy, F., Winckler, G., and Pahnke, K.: Systematic changes in circumpolar dust transport to the Subantarctic Pacific Ocean over the last two glacial cycles, P. Natl. Acad. Sci. USA, 119, e2206085119, https://doi.org/10.1073/pnas.2206085119, 2022.
Svensson, A., Andersen, K. K., Bigler, M., Clausen, H. B., Dahl-Jensen, D., Davies, S. M., Johnsen, S. J., Muscheler, R., Parrenin, F., Rasmussen, S. O., Röthlisberger, R., Seierstad, I., Steffensen, J. P., and Vinther, B. M.: A 60 000 year Greenland stratigraphic ice core chronology, Clim. Past, 4, 47–57, https://doi.org/10.5194/cp-4-47-2008, 2008.
Tegen, I., Harrison, S. P., Kohfeld, K., Prentice, I. C., Coe, M., and Heimann, M.: Impact of vegetation and preferential source areas on global dust aerosols: Results from a model study, J. Geophys. Res.-Atmos., 107, 4576, https://doi.org/10.1029/2001JD000963, 2002.
Thompson, L. G., Mosley-Thompson, E., Davis, M. E., Bolzan, J. F., Dai, J., Klein, L., Yao, T., Wu, X., Xie, Z., and Gundestrup, N.: Holocene–Late Pleistocene climatic ice core records from Qinghai-Tibetan Plateau, Science, 246, 474–477, https://doi.org/10.1126/science.246.4929.474, 1989.
Thompson, L. G., Mosley-Thompson, E., Davis, M. E., Lin, P.-N., Henderson, K. A., Cole-Dai, J., Bolzan, J. F., and Liu, K.-B.: Late Glacial Stage and Holocene tropical ice core records from Huascarán, Peru, Science, 269, 46–50, https://doi.org/10.1126/science.269.5220.46, 1995.
Thompson, L. G., Yao, T., Davis, M. E., Henderson, K. A., Mosley-Thompson, E., Lin, P.-N., Beer, J., Synal, H.-A., Cole-Dai, J., and Bolzan, J. F.: Tropical climate instability: The Last glacial cycle from a Qinghai-Tibetan ice core, Science, 276, 1821–1825, https://doi.org/10.1126/science.276.5320.1821, 1997.
Thompson, L. G., Davis, M. E., Mosley-Thompson, E., Sowers, T. A., Henderson, K. A., Zagorodnov, V. S., Lin, P.-N., Mikhalenko, V. N., Campen, R. K., Bolzan, J. F., Cole-Dai, J., and Francou, B.: A 25,000-year tropical climate history from Bolivian ice cores, Science, 282, 1858–1864, https://doi.org/10.1126/science.282.5395.1858, 1998.
Torre, G., Gaiero, D. M., Sawakuchi, A. O., del Rio, I., and Coppo, R.: Revisiting the chronology and environmental conditions for the accretion of late Pleistocene-early Holocene Pampean loess (Argentina), Quaternary Sci. Rev., 213, 105–119, https://doi.org/10.1016/j.quascirev.2019.04.018, 2019.
Újvári, G., Kovács, J., Varga, G., Raucsik, B., and Markovic, S. B.: Dust flux estimates for the Last Glacial Period in East Central Europe based on terrestrial records of loess deposits: a review, Quaternary Sci. Rev., 29, 3157–3166, https://doi.org/10.1016/j.quascirev.2010.07.005, 2010.
Vanneste, H., De Vleeschouwer, F., Martínez-Cortizas, A., von Scheffer, C., Piotrowska, N., Coronato, A., and Le Roux, G.: Late-glacial elevated dust deposition linked to westerly wind shifts in southern South America, Sci. Rep-UK, 5, 11670, https://doi.org/10.1038/srep11670, 2015.
Vanneste, H., De Vleeschouwer, F., Bertrand, S., Martínez-Cortizas, A., Vanderstraeten, A., Mattielli, N., Coronato, A., Piotrowska, N., Jeandel, C., and Le Roux, G.: Elevated dust deposition in Tierra del Fuego (Chile) resulting from Neoglacial Darwin Cordillera glacier fluctuations, J. Quaternary Sci., 31, 713–722, https://doi.org/10.1002/jqs.2896, 2016.
Varga, G., Gresina, F., Újvári, G., Kovács, J., and Szalai, Z.: On the reliability and comparability of laser diffraction grain size measurements of paleosols in loess records, Sediment. Geol., 389, 42–53, https://doi.org/10.1016/j.sedgeo.2019.05.011, 2019.
Veres, D., Bazin, L., Landais, A., Toyé Mahamadou Kele, H., Lemieux-Dudon, B., Parrenin, F., Martinerie, P., Blayo, E., Blunier, T., Capron, E., Chappellaz, J., Rasmussen, S. O., Severi, M., Svensson, A., Vinther, B., and Wolff, E. W.: The Antarctic ice core chronology (AICC2012): an optimized multi-parameter and multi-site dating approach for the last 120 thousand years, Clim. Past, 9, 1733–1748, https://doi.org/10.5194/cp-9-1733-2013, 2013.
Volvakh, N. E., Kurbanov, R. N., Zykina, V. S., Murray, A. S., Stevens, T., Költringer, C. A., Volvakh, A. O., Malikov, D. G., Taratunina, N. A., and Buylaert, J.-P.: First high-resolution luminescence dating of loess in Western Siberia, Quat. Geochronol., 73, 101377, https://doi.org/10.1016/j.quageo.2022.101377, 2022.
Wiers, S., Snowball, I., O'Regan, M., and Almqcist, B.: Late Pleistocene chronology of sediments from the Yermak Plateau and uncertainty in dating based on geomagnetic excursions, Geochem. Geophy. Geosy., 20, 3289–3310, https://doi.org/10.1029/2018GC007920, 2019.
Xiong, L.-Y., Tang, G.-A., Strobl, J., and Zhu, A.: Paleotopographic controls on loess deposition in the Loess Plateau of China, Earth Surf. Proc. Land., 41, 1155–1168, https://doi.org/10.1002/esp.3883, 2015.
Yang, S., Ding, Z., Li, Y., Wang, X., Jiang, W., and Huang, X.: Warming-induced northwestward migration of the East Asian monsoon rain belt from the Last Glacial Maximum to the mid-Holocene, P. Natl. Acad. Sci. USA, 112, 13178–13183, https://doi.org/10.1073/pnas.1504688112, 2015.
Yu, E.-F., Francois, R., Bacon, M. P., and Fleer, A. P.: Fluxes of 230Th and 231Pa to the deep sea: implications for the interpretation of excess 230Th and profiles in sediments, Earth Planet. Sc. Lett., 191, 219–230, https://doi.org/10.1016/S0012-821X(01)00410-1, 2001a.
Yu, E.-F., Francois, R., Bacon, M. P., Honjo, S., Fleer, A. P., Mangnanini, S. J., Rutgers van der Loeff, M. M., and Ittekot, V.: Trapping efficiency of bottom-tethered sediment traps estimated from the intercepted fluxes of 230Th and 231Pa, Deep Sea Res. Pt. I, 48, 865–889, https://doi.org/10.1016/S0967-0637(00)00067-4, 2001b.
Yu, Z., Loisel, J., Brosseau, D. P., Beilman, D. W., and Hunt, S. J.: Global peatland dynamics since the Last Glacial Maximum, Geophys. Res. Lett., 37, L13402, https://doi.org/10.1029/2010GL043584, 2010.
Zdanowicz, C. M., Zielinski, G. A., Wake, C. P., Fisher, D. A., and Koerner, R. M.: A Holocene record of atmospheric dust deposition on the Penny ice cap, Baffin Island, Canada, Quaternary Res., 53, 62–69, https://doi.org/10.1006/qres.1999.2091, 2000.
Zhang, Z., Zheng, Z., Meng, X., Lai, Z., Hou, Y., and Ji, J.: Gradually increasing precipitation since 20 ka as evidenced by loess dolomite abundance in the Ili Basin, Central Asia, Catena, 232, 107420, https://doi.org/10.1016/j.catena.2023.107420, 2023.
Zhao, A., Ryder, C. L., and Wilcox, L. J.: How well do the CMIP6 models simulate dust aerosols?, Atmos. Chem. Phys., 22, 2095–2119, https://doi.org/10.5194/acp-22-2095-2022, 2022.