the Creative Commons Attribution 4.0 License.
the Creative Commons Attribution 4.0 License.
 | 07 Feb 2024
A 7-year record of vertical profiles of radar measurements and precipitation estimates at Dumont d'Urville, Adélie Land, East Antarctica
Valentin Wiener
Marie-Laure Roussel
Christophe Genthon
Étienne Vignon
Jacopo Grazioli
Alexis Berne
Studying precipitation falling over Antarctica is crucial as snowfall represents the main water input term for the polar cap. However, precipitation observations still remain scarce – and, more particularly, in the atmospheric column – due to numerous experimental issues related to the white continent. This paper aims at helping to close this observation gap by presenting 7 years of Micro Rain Radar (Metek MRR-2) data at the Dumont d'Urville station in coastal Adélie Land, East Antarctica. Statistics are calculated on three radar variables (equivalent reflectivity, mean Doppler velocity and signal-to-noise ratio (SNR)) to outline the main characteristics of the radar dataset. Seasonal and interannual variabilities are also investigated, but no significant temporal trends are detected, except for the seasonal mean Doppler velocity, which is higher in summer and lower in winter.
We then use the snowfall rate (S) data from a collocated snow gauge to estimate the MRR precipitation profile from the radar equivalent reflectivity (Ze) through a locally derived Ze–S relation. We find the relation Ze=43.3S0.88. The processing method used to obtain this relation, data quality and uncertainty considerations are discussed in the paper.
In order to give an example of application of the dataset, a brief statistical comparison of the MRR precipitation rate along the vertical with model data from the ERA5 reanalysis and the LMDZ climate model is performed, which notably shows that models underestimate heavy precipitation events.
All datasets are available on the PANGAEA database with the associated DOI: https://doi.org/10.1594/PANGAEA.962727 (Wiener et al., 2023).
- Article
(5511 KB) - Full-text XML
- BibTeX
- EndNote


Precipitation is the largest input term for the surface mass balance of the Antarctic ice sheet (Christopher et al., 1997; Krinner et al., 2007). It originates from evaporation over the surrounding oceans, advection of water vapor to and over the ice sheet by the atmospheric circulation, then condensation and fall of condensed water to the surface. Various atmospheric processes determine how much water vapor effectively condensates above the ice sheet, how much falls all the way down to the surface, and how much remains at the surface and effectively contributes to accumulation and, thus, the ice sheet mass balance. Thomas et al. (2017) estimated from ice cores that the Antarctic surface mass balance have increased on average by 14±2.8 Gt per decade since 1900.
Even concentrating on precipitation proper (ignoring post-deposition processes) raises a number of issues that may be ignored in the most direct approaches to precipitation studies. In fact, many studies, and many available climatologies of precipitation, focus on precipitation at the surface (e.g., the Global Precipitation Climatology Project (GPCP), Adler et al., 2018). This is sensible, as many issues with precipitation relate to the surface water budget, water resources at the surface and mass balance of continental water bodies such as lakes and ice caps. One practical reason for concentrating on surface precipitation is that it can be measured with ground-based instruments such as snow gauges (e.g., Seefeldt et al., 2021). The fate of precipitation in the atmospheric column, on the other hand, is more elusive due to the difficulty of monitoring the atmosphere along the vertical dimension. Satellite-borne radars such as CloudSat, which operated from 2006 to 2011, enabled the observation of precipitation above Antarctica on a continental scale (Palerme et al., 2014), but with limited temporal resolution (one orbit every 5 d), limited spatial coverage (north of 82∘ S), and without information below 1300 m above ground level. Grazioli et al. (2017b) showed the importance of low-level processes such as the sublimation of precipitation due to the dry air flowing from the Antarctic plateau, which was estimated to reduce snowfall by 17 % on average all over the continent, although other studies (Alexander et al., 2023; Bracci et al., 2022a) find higher values of local snowfall reduction (up to 50 %) from surface remote sensing data at two coastal stations. This process can bias satellite estimates of precipitation at the surface and raises the necessity of ground-based measurements of the atmospheric column.
Ground-based remote sensing using profiling techniques, such as meteorological radars and lidars, can provide valuable additional data. Instrumental challenges (cost, technical expertise, energy requirements) tend to limit these applications to specific sites and contexts, e.g., for operational meteorology, or weather and hydrological risk predictions. The recent availability of affordable, compact, low power consumption, relatively easy to use precipitation profiling radars has been a game changer for the study of the Antarctic precipitation in the atmospheric column rather than at the surface only. This has opened the possibility of studying and documenting the processes occurring in the atmospheric column, from which surface precipitation results. This has important added value for understanding the precipitation physics and evaluating meteorological and climate models. Numerical models are essential tools to forecast future climate changes, including the future contribution of Antarctic precipitation evolution to global sea-level change. If Antarctica was to melt entirely, the global sea-level would rise by about 60 m (Church et al., 2008). This will not happen in the foreseeable future, but the fact that realizing that just 1 % of this potential would raise global sea level by 60 cm is a major source of concern (IPCC, Pörtner et al., 2022). Conversely, an increase in accumulation due to increasing precipitation over the continent, which was ,for example, estimated at 51±11 Gt yr−1 between 1991 and 2005 by Lenaerts et al. (2018), has a mitigating effect on the sea-level rise. Medley and Thomas (2019) estimated that precipitation over Antarctica has moderated the sea-level rise by 2.5 mm per decade since 1979.
In recent years, Antarctica has significantly benefited from new approaches to observe precipitation. Measuring solid precipitation using traditional gauge methods is difficult (see SPICE project, Nitu et al., 2018). It is particularly difficult in Antarctica, where the main issues of solid precipitation measurements are exacerbated; strong winds in the peripheral regions (Turner et al., 2009 found more than 60 wind events of storm force or larger per year, i.e., over 24.5 m s−1, in three coastal stations), very low precipitation rates in the interior (estimated at 36 mm yr−1 above 2250 m and north of 82∘ S by Palerme et al., 2014), problems with frost deposition on instruments and low temperatures impacting electronic components.
Over the last decade, several research groups have deployed a new generation of light precipitation radars at Antarctic stations: at Princess Elisabeth (longitude, latitude and altitude, respectively, 23.4∘, −72.0∘, 1392 m a.s.l., deployed in 2010, mostly seasonal, Gorodetskaya et al., 2015), Mario Zucchelli (164.1∘, −74.7∘, 10 m a.s.l., deployed in December 2016, mostly seasonal, Bracci et al., 2022b), Dumont d'Urville (140.0∘, −66.7∘, 41 m a.s.l., started in November 2015, Grazioli et al., 2017a, b; Genthon et al., 2018), and more recently at the Concordia station (123.3∘, −75.1∘, 3233 m a.s.l., Di Natale et al., 2022) and at the Davis station (78.0∘, −68.6∘, 27 m a.s.l., Alexander et al., 2023). Radars are not influenced by most of the problems that affect the measurement of solid precipitation with gauges, but there are other issues. The main one is that indirect information, such as radar reflectivity resulting from the backscattering of microwaves by hydrometeors, has to be converted into hydrometeor distributions and concentrations in the atmosphere, then to mass and fall speed to retrieve a precipitation flux (Peters et al., 2002). This involves hypotheses and tuning. In addition, these radars have been initially developed and are provided with processing tools designed for liquid precipitation. Obviously, for Antarctica, this has to be revised to access solid precipitation (Maahn and Kollias, 2012).
In this paper, we present 7 years of vertical profiling of precipitation at the Dumont d'Urville station in Adélie Land, East Antarctica using a Metek Micro-Rain Radar (MRR-2) precipitation profiler. The setting, instruments, data processing methods and datasets are presented in Sect. 2. The main characteristics of the MRR dataset, including variability, statistics and extremes, are presented in Sect. 3.1. In Sect. 3.2, the mean MRR snowfall profile is derived from an empirical and local Ze–S relation, enabling a vertical comparison with two climate models in Sect. 3.3 as an example of the application of the dataset. A general conclusion with information on data access and format is provided in Sect. 6.
2.1 Micro Rain Radar
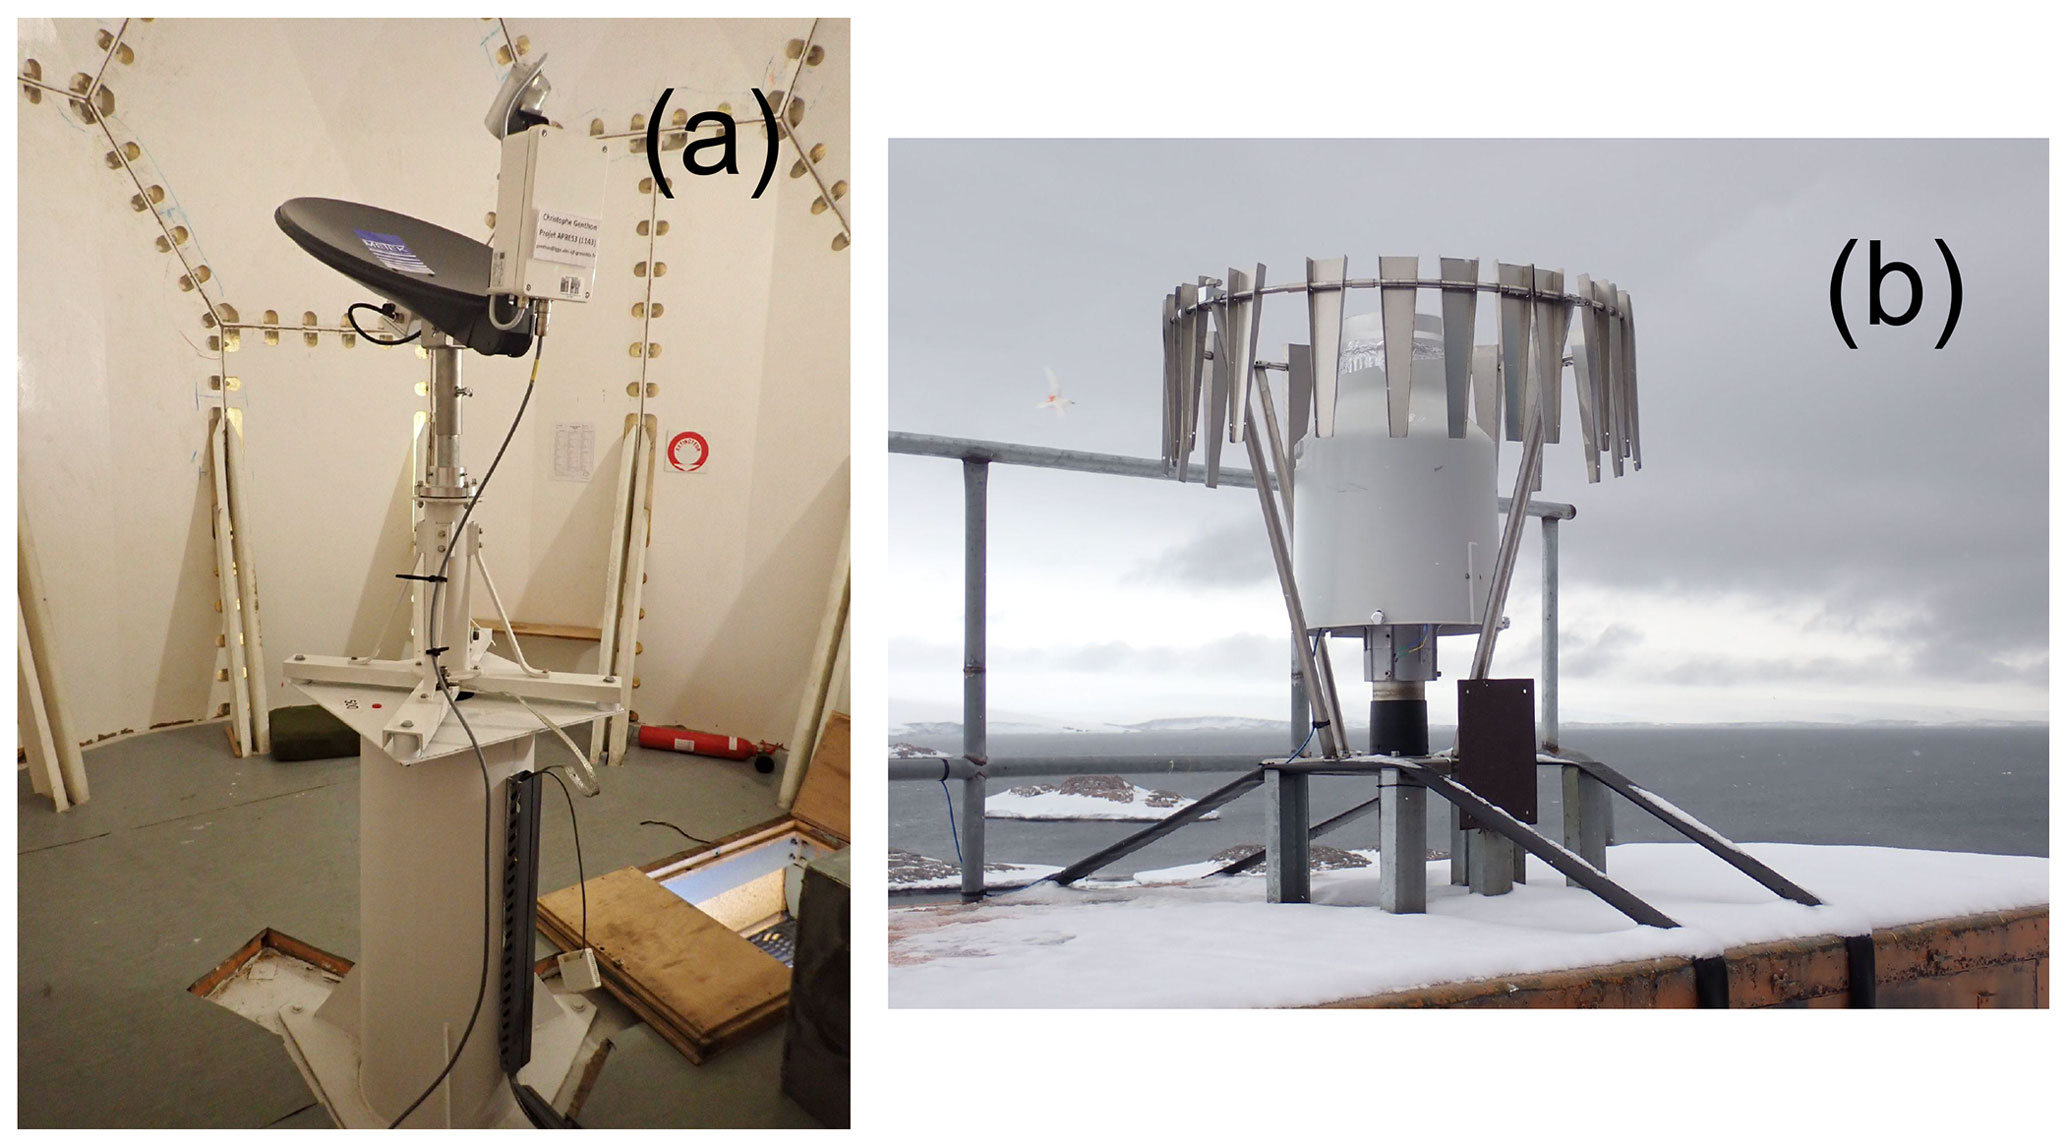
A Micro Rain Radar (Metek MRR-2, see Fig. 2a) transmitting in the K-band at 24 GHz was deployed at the Dumont d'Urville Antarctic station in late 2015. Grazioli et al. (2017a) and Genthon et al. (2018) describe the setting, processing and first set of data from the instrument. The Dumont d'Urville (DDU) station is located on the Petrels Island (longitude: 140.0014∘, latitude: −66.6628∘, 41 m a.s.l., see Fig. 1), about 5 km off the coast of Adélie Land. As precipitation is essentially associated with synoptic extra-tropical cyclones there (Jullien et al., 2020), observations at DDU are representative of precipitation at the nearby coast of the Antarctic ice sheet. Setting the radar at DDU rather than on the ice sheet has the advantages that it provides easy permanent access to power and network, as well as servicing if necessary. It is installed within an unheated radome that protects the instruments from the fierce winds that blow in the region. On the other hand, the radome induces some attenuation of the radar transmitted and reflected electromagnetic waves and, thus, some reduction of the sensitivity. This is, in particular, discussed in Grazioli et al. (2017a), which describes the first year of MRR data, in Durán-Alarcón et al. (2019), which compares 2 years of the DDU MRR to another MRR deployed at the Princess Elizabeth station (longitude: 23.35∘, latitude −71.95∘), and lastly in Roussel et al. (2023), which presents an analysis of precipitation at DDU during the YOPP (Year Of Polar Prediction) Southern Hemisphere special observing period (see Bromwich et al., 2020). However, no accumulated snow on the radome is reported by the winter-over staff, thanks to the strong winds and the radome's domed shape. A consequence of good operating conditions at DDU station is that, to the authors' knowledge, and although it was not the first MRR deployed in Antarctica, the DDU MRR offers the longest quasi continuous data series for the Antarctic region so far.
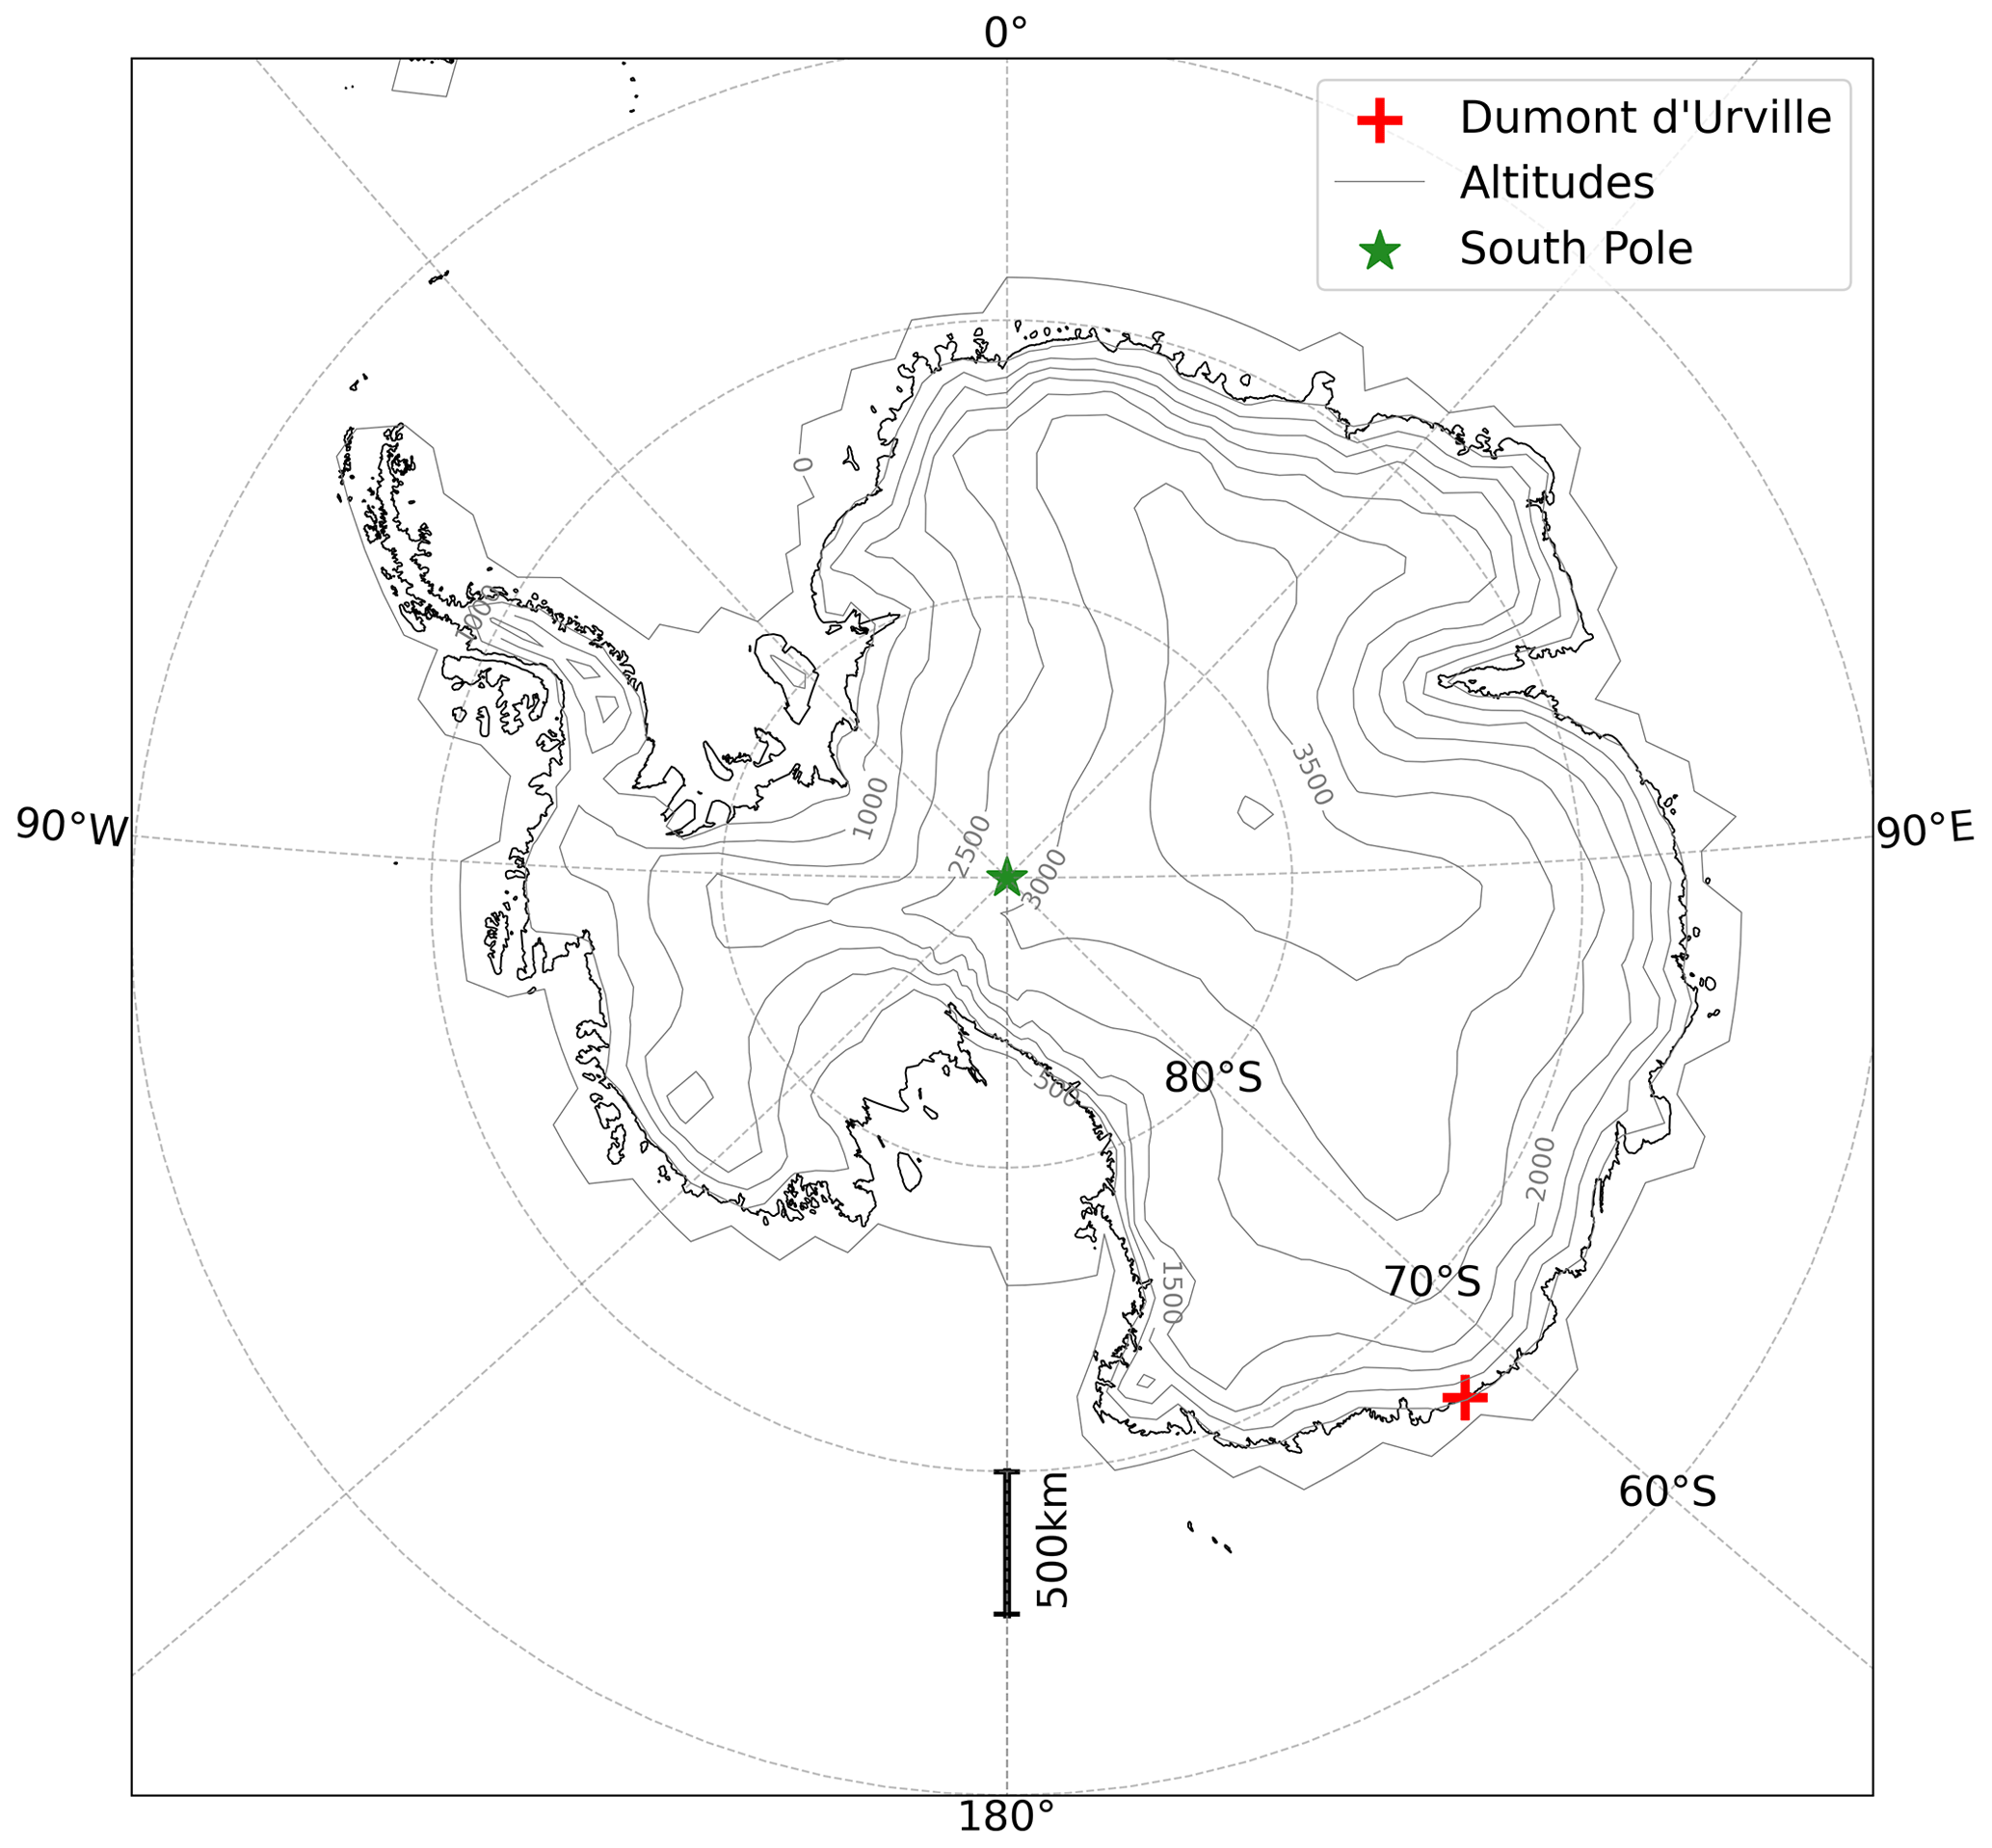
Figure 1Topography of the Antarctic ice sheet and location of the Dumont d'Urville station.
As most of the precipitation at DDU falls as snow, the MRR data have been processed using the Maahn and Kollias (2012) processing algorithm for snowfall, hereafter referred to as MK12. MK12 is especially suited for low signal-to-noise ratio (SNR) measurements such as those obtained in snowfall, as it improves noise removal and allows the detection of weak updrafts thanks to a dynamic dealiasing procedure. The equivalent reflectivity Ze in dBz, mean Doppler velocity W in m s−1 and SNR in dB are derived from the MRR minute-averaged raw spectrum, providing profiles of up to 3 km a.g.l. with a vertical resolution of 100 m. The two lowest and highest gates (below 300 m and above 2900 m) are considered too noisy by the algorithm and are, therefore, discarded from this study. A quality flag described in the metadata is also provided to give information about masked spectra not kept by the MK12 processing algorithm. We define the mean Doppler velocity as positive downward.
Due to various technical issues, the MRR was out of operation out of about 6.4 % of the total number of minutes in the record. This occurred, e.g., during maintenance or power outages. Furthermore, 0.1 % of the precipitating timesteps (i.e., when the minute reflectivity is not null along the vertical) are discarded as the quality flag indicates a raw spectrum dealiasing failure. Lastly, equivalent reflectivities lower than −5 dBz are also discarded, in accordance with the threshold recommended by Maahn and Kollias (2012), removing 10.5 % of the precipitating 1 min timesteps. For a full description of this method, which has been used in numerous studies of snowfall in Antarctica (e.g., Scarchilli et al., 2020; Alexander et al., 2023) or in the Arctic (e.g., Chellini et al., 2022), we refer the reader to Maahn and Kollias (2012).
Because the MRR is located inside a radome that has not been optimized for the K-band, the signal is significantly attenuated. This was quantified by Grazioli et al. (2017a) by comparison with a nearby X-band radar. The regression between the measured reflectivity values at X- and K-bands exhibited a slope close to 1 and an offset of about 6 dBz (to be added to the MRR data). This offset was confirmed by Durán-Alarcón et al. (2019) by comparison with a second MRR deployed at DDU outside of the radome for a short period of time. In the present paper, the radome attenuation is, hence, corrected by adding 6 dBz to the MRR reflectivity values.
Finally, the equivalent reflectivity, mean Doppler velocity and SNR are averaged hourly, in accordance with the integration time recommended by Durán-Alarcón et al. (2019) for climatological analysis, in order to remove short time perturbations while keeping enough data for statistical significance. Hours with less than 10 valid minute timesteps were discarded to avoid spurious spikes.
2.2 Snow gauge
Along with the MRR, an OTT Pluvio2 (model 400 cm2) weighing gauge (with a wind shield, see Fig. 2b) was deployed during the austral summer campaign 2015–2016 at Dumont d'Urville. Hydrometeors falling into the bucket are measured by a very sensitive weighing system and converted into mm water equivalent. The weighing gauge hourly snowfall in mm h−1 is then obtained by summing the 1 min bucket mass changes over 1 h. These data are used in Sect. 3.2 to derive MRR snowfall profiles. Various limitations affect the gauge data, which are also discussed in Sect. 3.2. The gauge was deployed in the 2015–2016 austral summer campaign, then removed in February 2016 and reinstalled in January 2017 and used until today. However, it was out of order between December 2021 and December 2022 inclusive. These two main gaps are taken into account in the computation of the MRR snowfall estimates in Sect. 3.2. For more information about the DDU snow gauge, we refer the reader to Grazioli et al. (2017a) and Genthon et al. (2018). The MRR and snow-gauge data range from November 2015 to June 2023 and the instruments are still in operation.
2.3 Météo-France Observations
Hourly surface meteorological variables such as 2 m temperature, 10 m wind speed and direction, and 2 m relative humidity with respect to liquid are provided by the Meteo-France weather station at Dumont d'Urville, from January 2015 to June 2023 inclusive. They are used in Sect. 3.2 for the computation of the MRR snowfall profile as a quality-control filter for the weighing gauge data.
2.4 Models data
2.4.1 The ERA5 reanalysis
ERA5 is produced by the European Centre for Medium-Range Weather Forecasts (ECMWF) and is an atmospheric reanalysis which combines a weather forecast model with meteorological observations from a large number of sources, through a 4-D data assimilation system. It provides various meteorological variables over ∼30 km resolution with 137 vertical levels, from 1979 to nowadays (Hersbach et al., 2020). ERA5 supersedes ERA Interim, which stopped being produced in 2019.
While surface precipitation has been archived, the forecasted solid precipitation fluxes at the midpoint of the vertical layers in the model were saved in the reanalysis archives at the time of the data extraction. To allow a comparison with radar vertical profiles of precipitation, we use the method to recalculate ERA5 snowfall rates described in Roussel et al. (2023), Sect. S3. Hourly data from November 2015 to December 2021 inclusive were extracted at the grid point nearest Dumont d'Urville, of longitude 140.0∘ and latitude −66.8∘.
2.4.2 The LMDZ general circulation model
The LMDZ model was developed at the Laboratoire de Météorologie Dynamique (LMD) in Paris and is the atmospheric component of the Institut Pierre-Simon Laplace climate model (IPSL-CM, https://cmc.ipsl.fr/ipsl-climate-models/ipsl-cm6/, last access: 26 July 2023), an atmosphere–land–ocean–sea ice global climate model used in particular for the Coupled Model Intercomparison Project exercises. The Z in LMDZ stands for its zooming capability, i.e., a refinement of the mesh around an area of interest. Hourdin et al. (2020) describes the general model, and Madeleine et al. (2020) the clouds and precipitation physics. This model has already been used for various studies in Antarctica (Krinner et al., 2019; Vignon et al., 2018) and, in particular, in Lemonnier et al. (2021), which opens the way to the evaluation of the representation of the Antarctic precipitation in the model.
We use a simulation ranging from November 2015 to December 2021 inclusive with a 96×95 horizontal grid and 95 vertical levels. The grid is refined around Adélie Land, resulting in a resolution of approximately 50 km in the zoom center (see Fig. S1 of Roussel et al., 2023, for a map of the grid). The run was nudged with wind, temperature and humidity by the ERA5 reanalysis outside of the zoom area. For further details, we refer the reader to the very similar configuration in Roussel et al. (2023), which compared the precipitation at the surface and along the vertical of LMDZ and five other climate models with the DDU MRR and snow gauge during the YOPP period. We evaluate the model physics used for the Sixth Coupled Model Intercomparison Project exercise (CMIP-6), which has not been specifically adapted and calibrated to Antarctic precipitation. Hourly precipitation profiles are simply extracted at the grid cell nearest DDU of longitude 140.4∘ and latitude −66.6∘, as the most accurate representation of snowfall amounts is that of the closest grid point regardless of the surface type (Roussel et al., 2023).
3.1 Characteristics of the 7-year record
In this section, before estimating the precipitation flux from the radar data in Sect. 3.2, the hourly averaged equivalent reflectivity Ze, the mean Doppler velocity W and the signal-to-noise ratio SNR are analyzed for the whole 7 year period, from November 2015 to June 2023 inclusive. The derivation of these variables with the MK12 processing method is described in Sect. 2.1.
Figure 3 presents the daily averaged 7 years of MRR reflectivity profiles, giving an overview of individual precipitation events and variability with respect to intensity over the whole period. The timeseries is quasi continuous except for several interruptions identified on the figure by gray zones.
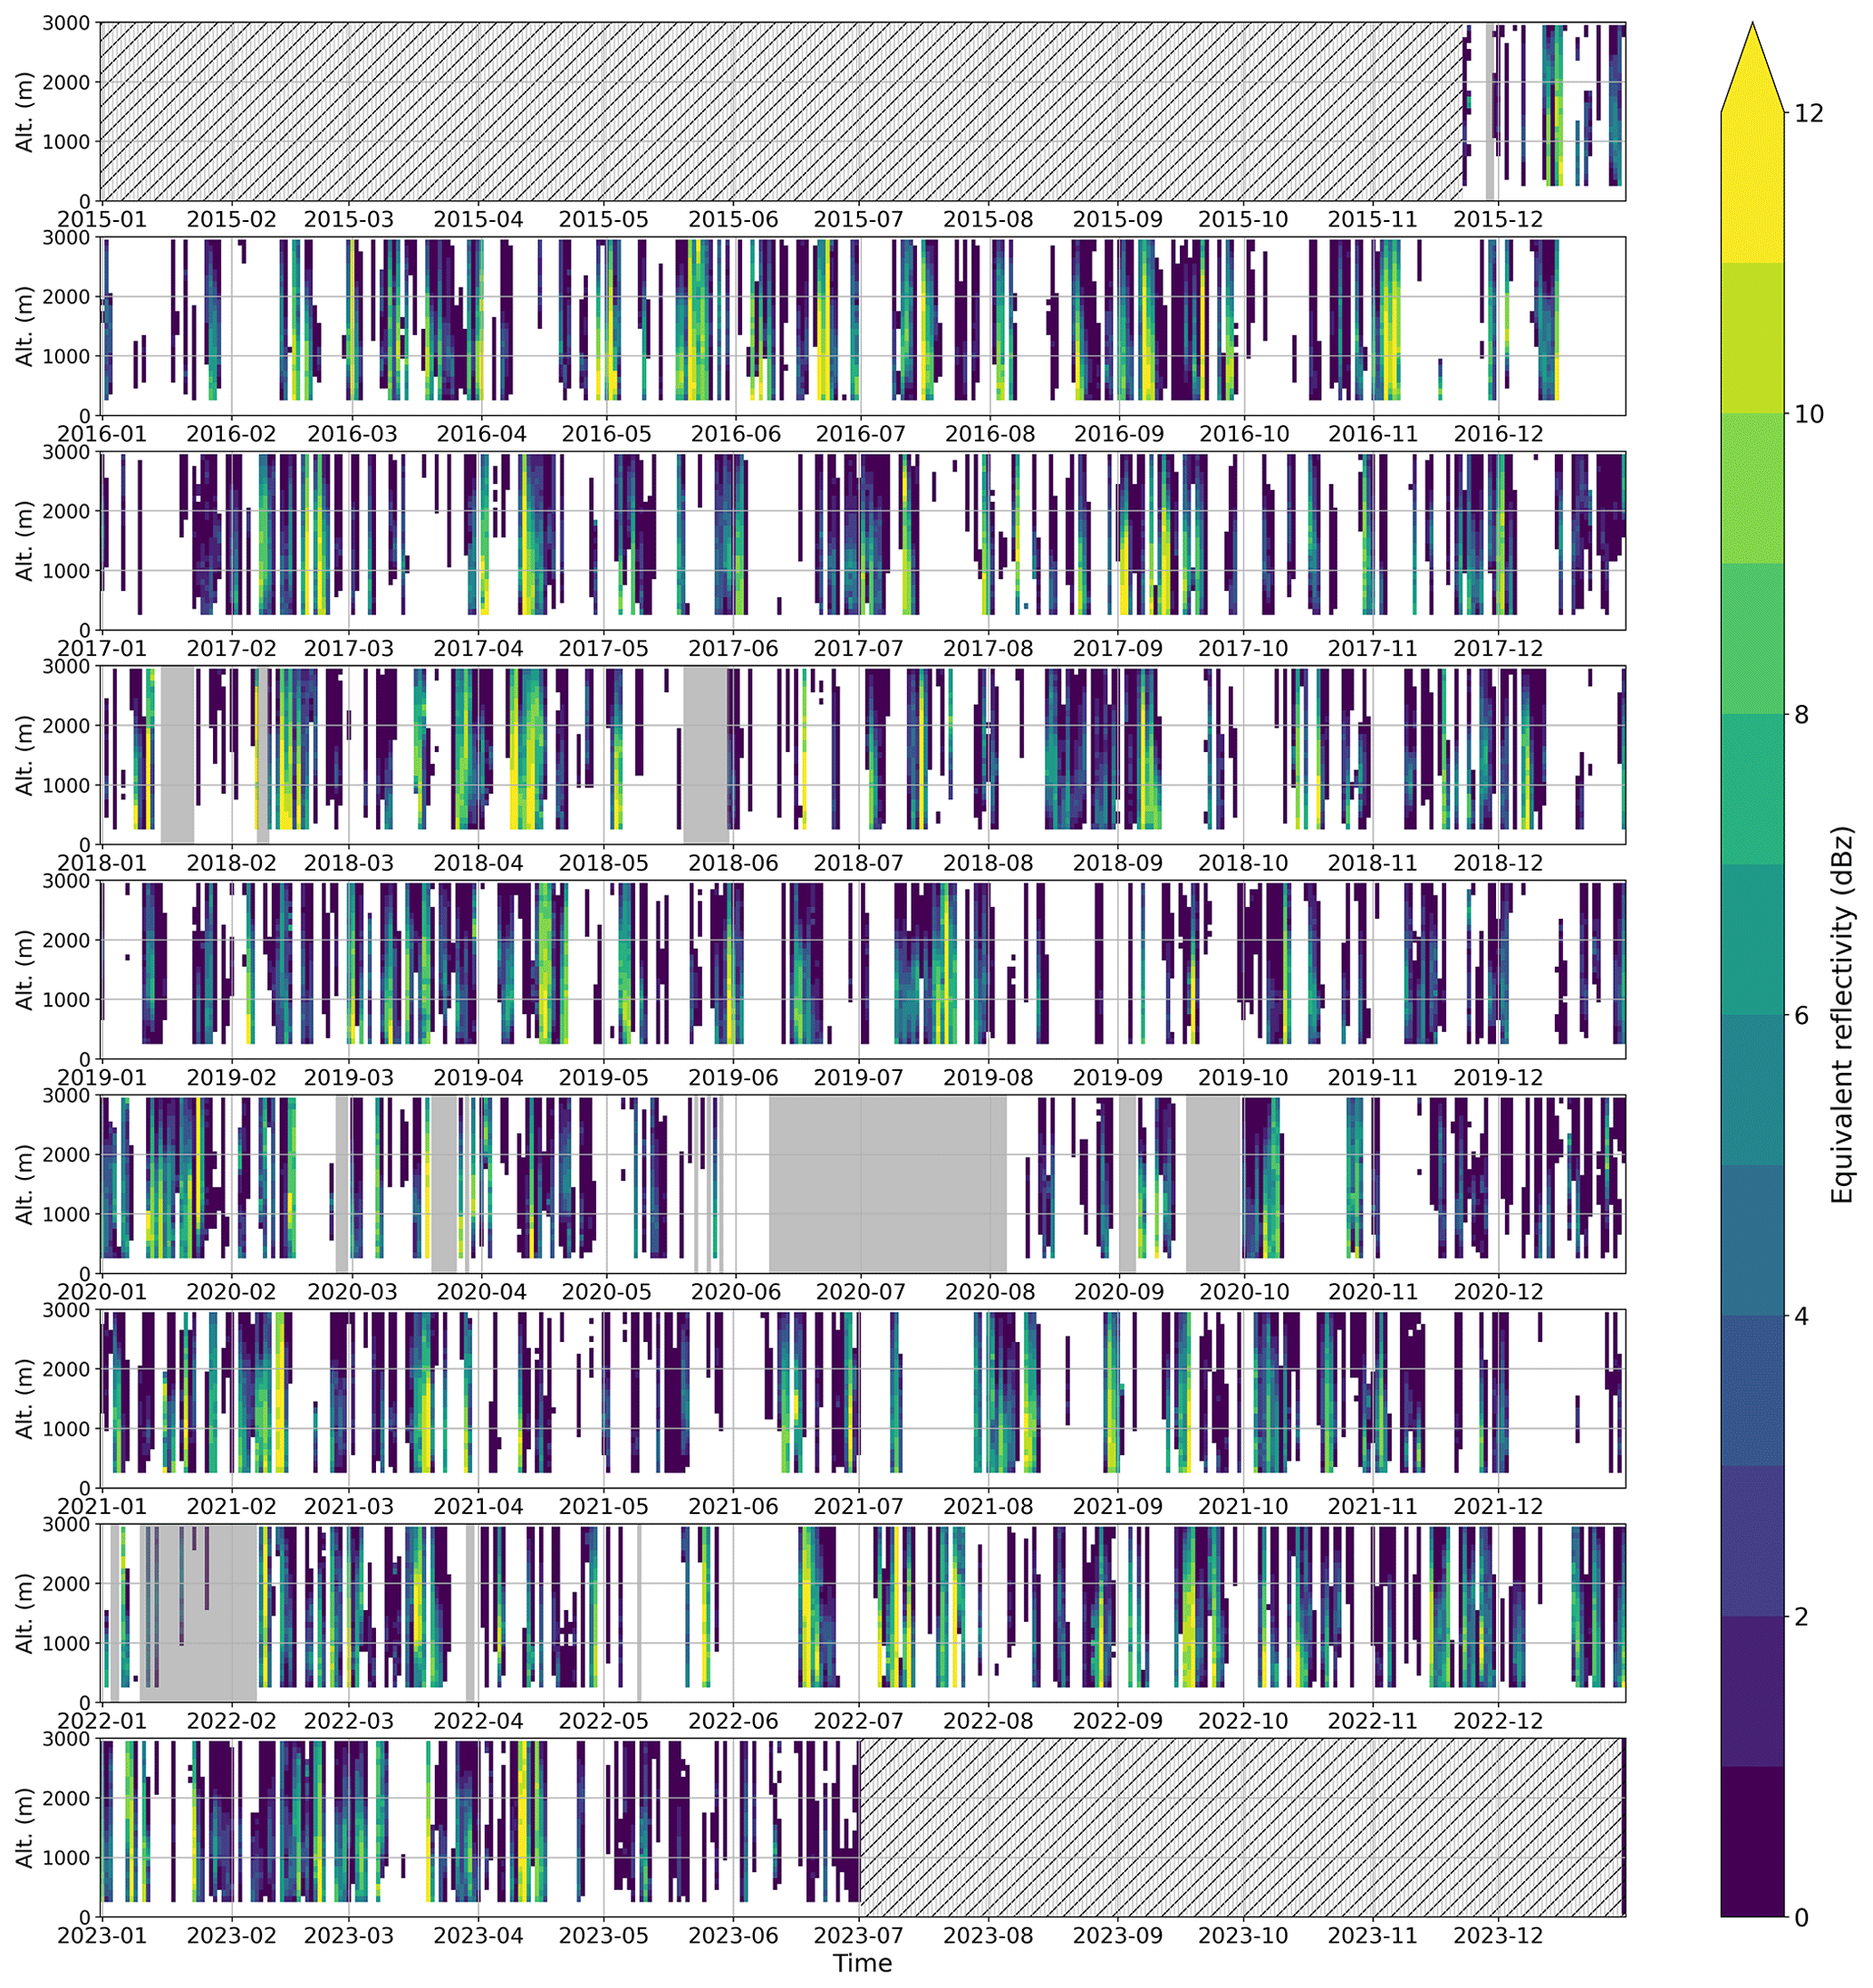
Figure 3MRR equivalent reflectivity in dBz. Stripes indicate periods during which the MRR was not in operation. Periods with more than 10 % of missing data are shown in gray shading.
2-D joint distributions of equivalent reflectivity, mean Doppler velocity and SNR are presented in Fig. 4a–c. The percentage of occurrence of those variables along each radar gate is color coded (left blank for occurrences below 1 %), the median is shown with the solid-dotted black line, and the 5th, 25th, 75th and 95th quantiles are shown with the dashed gray lines.
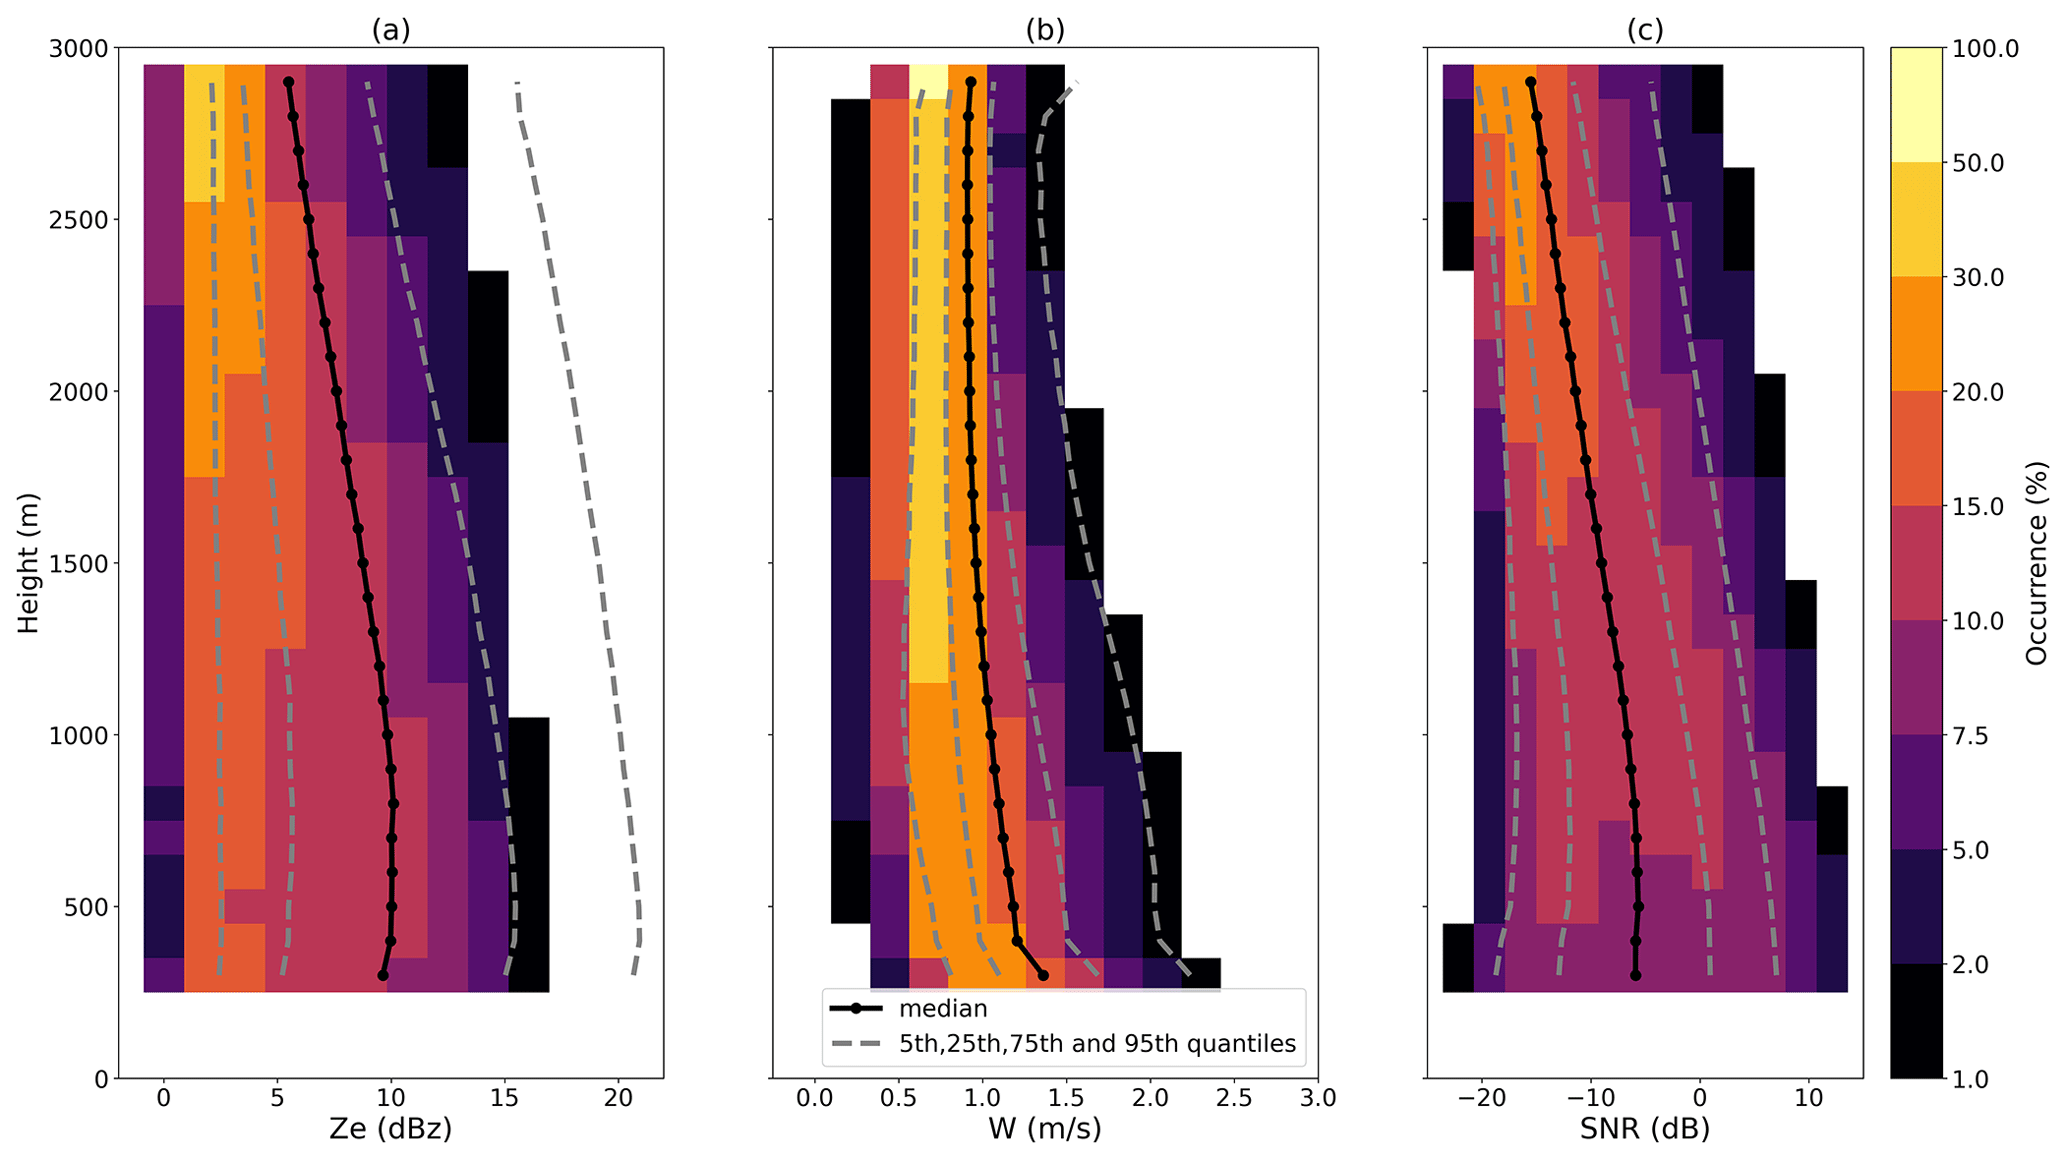
Figure 4Median (solid-dotted black line) and 5th, 25th, 75th and 95th quantiles (dashed gray lines) of the equivalent reflectivity Ze (Fig. 3a), the mean Doppler velocity W (Fig. 3b) and the signal-to-noise ratio SNR (Fig. 3c). The shading represents the occurrence along each radar gate (left blank below 1 %). Pay attention to the non-linear colorbar.
The median equivalent reflectivity in Fig. 4a ranges from 5.5 dBz in altitude, then increases as ice crystals grow through deposition and aggregation and densify through riming (Planat et al., 2021) towards a maxima of 10.2 dBz at 800 m. Then, reflectivity decreases slightly to 9.7 dBz at 300 m due to snowflake sublimation by low-level dry air blowing from the plateau (katabatic flow). The physics of this process is discussed in Grazioli et al. (2017b). The 95th quantile exceeds 20 dBz in the lower gates, indicating the occurrence of rare but heavy snowfall events. There is no equivalent reflectivity below 1 dBz, as K-band reflectivities lower than −5 dBz have been discarded, and an offset of +6 dBz was added to correct for radome attenuation (see Sect. 2.2). Hence, the radome attenuation correction reduces the MRR sensitivity.
The mean Doppler velocity median decreases with height, going from 1.4 m s−1 at 300 m to 0.9 m s−1 at 2900 m. Even the 95th quantile does not exceed 2.5 m s−1, supporting that rain events are very rare. In fact, only 0.7 % of the hourly mean Doppler velocities exceed 3 m s−1. Vignon et al. (2021) found that the Dumont d'Urville station experiences on average only 1.8 d of rainfall per year, although their projections from seven climate models indicate that rainfall events in coastal Antarctica will increase in frequency and intensity in the next decades.
All quantiles show a sharp increase of approximately 0.2 m s−1 at the lowest gate, which is probably due to noise in the signal, such as the near-field effect, and despite the MK12 data quality masking. The 95th quantile also shows a suspicious increase of the same magnitude at the highest gate (2900 m), probably due to noise in the signal. Most mean Doppler velocities above 2000 m are smaller than 1 m s−1. There are a few rare events of negative W in altitude (75 over 12 253 h timesteps) corresponding to weak updrafts, whose detection was made possible by the MK12 algorithm (see Sect. 2.1).
The SNR median in Fig. 4c is constant below 500 m and then decreases steadily with height, going from a ratio of −6.0 to −15.6 dB. Most signal-to-noise ratios above 2000 m are below −10 dB. The SNR median is rather low, because the MRR has a high noise level and solid precipitation corresponds to lower reflectivity than rainfall. It should be noted that the SNR 95th quantile ranges between 0 and +10 dB, indicating that heavy events fully stand out from the noise.
Overall, the 2D joint distributions shown in Fig. 4 concur with Fig. 4a, d and g of Durán-Alarcón et al. (2019), which plotted those three variables for the same instrument, although for a shorter period (2 years).
The maximum value of the equivalent reflectivity Ze reached 31 dBz at 1900 m on 9 February 2022 at 06:00 pm UTC during a short and intense precipitation outburst of about 10 min, surrounded by longer and less intense events. The corresponding mean Doppler velocity exceeded 6 m s−1, which suggests the presence of rain in altitude. Unfortunately, this event occurred during local night, and rain was not reported by Météo-France staff at the station, although surface temperatures went above 0 ∘C for a few hours around that time. The snow gauge was not operating (see Sect. 2.2) and cannot give further information about the magnitude of this event.
A reliable maximum value of the mean Doppler velocity could not be estimated because of various nonphysical peaks detected by the algorithm and resulting from an imperfect dealiasing. Those peaks are not correctly filtered out by the data quality masking of the MK12 algorithm. However, they do not seem to significantly shift the median and quantiles of Fig. 4b, except for the lowermost and uppermost gates (300 and 2900 m).
Interannual variability for the 7 years of data is investigated in Fig. 5, which presents the median yearly profiles from 2016 to 2022 of the equivalent reflectivity, mean Doppler velocity and SNR from the hourly averaged data (8760 data points each year). Year 2023 is not shown as it was not complete at the time of extraction. We characterize the interannual variability over those 7 years as the maximum profile minus the minimal profile. The equivalent reflectivity variability is 3 dBz (30 % of the median profile) and is rather constant along the vertical; the mean Doppler velocity variability is 0.2 m s−1 near 300 m (15 % of the median profile) and decreases towards 0.05 m s−1 in altitude; the SNR variability is 3 dB (50 % of the average profile). There is no statistically significant temporal trend of those variables over the 7 years of data (not shown).
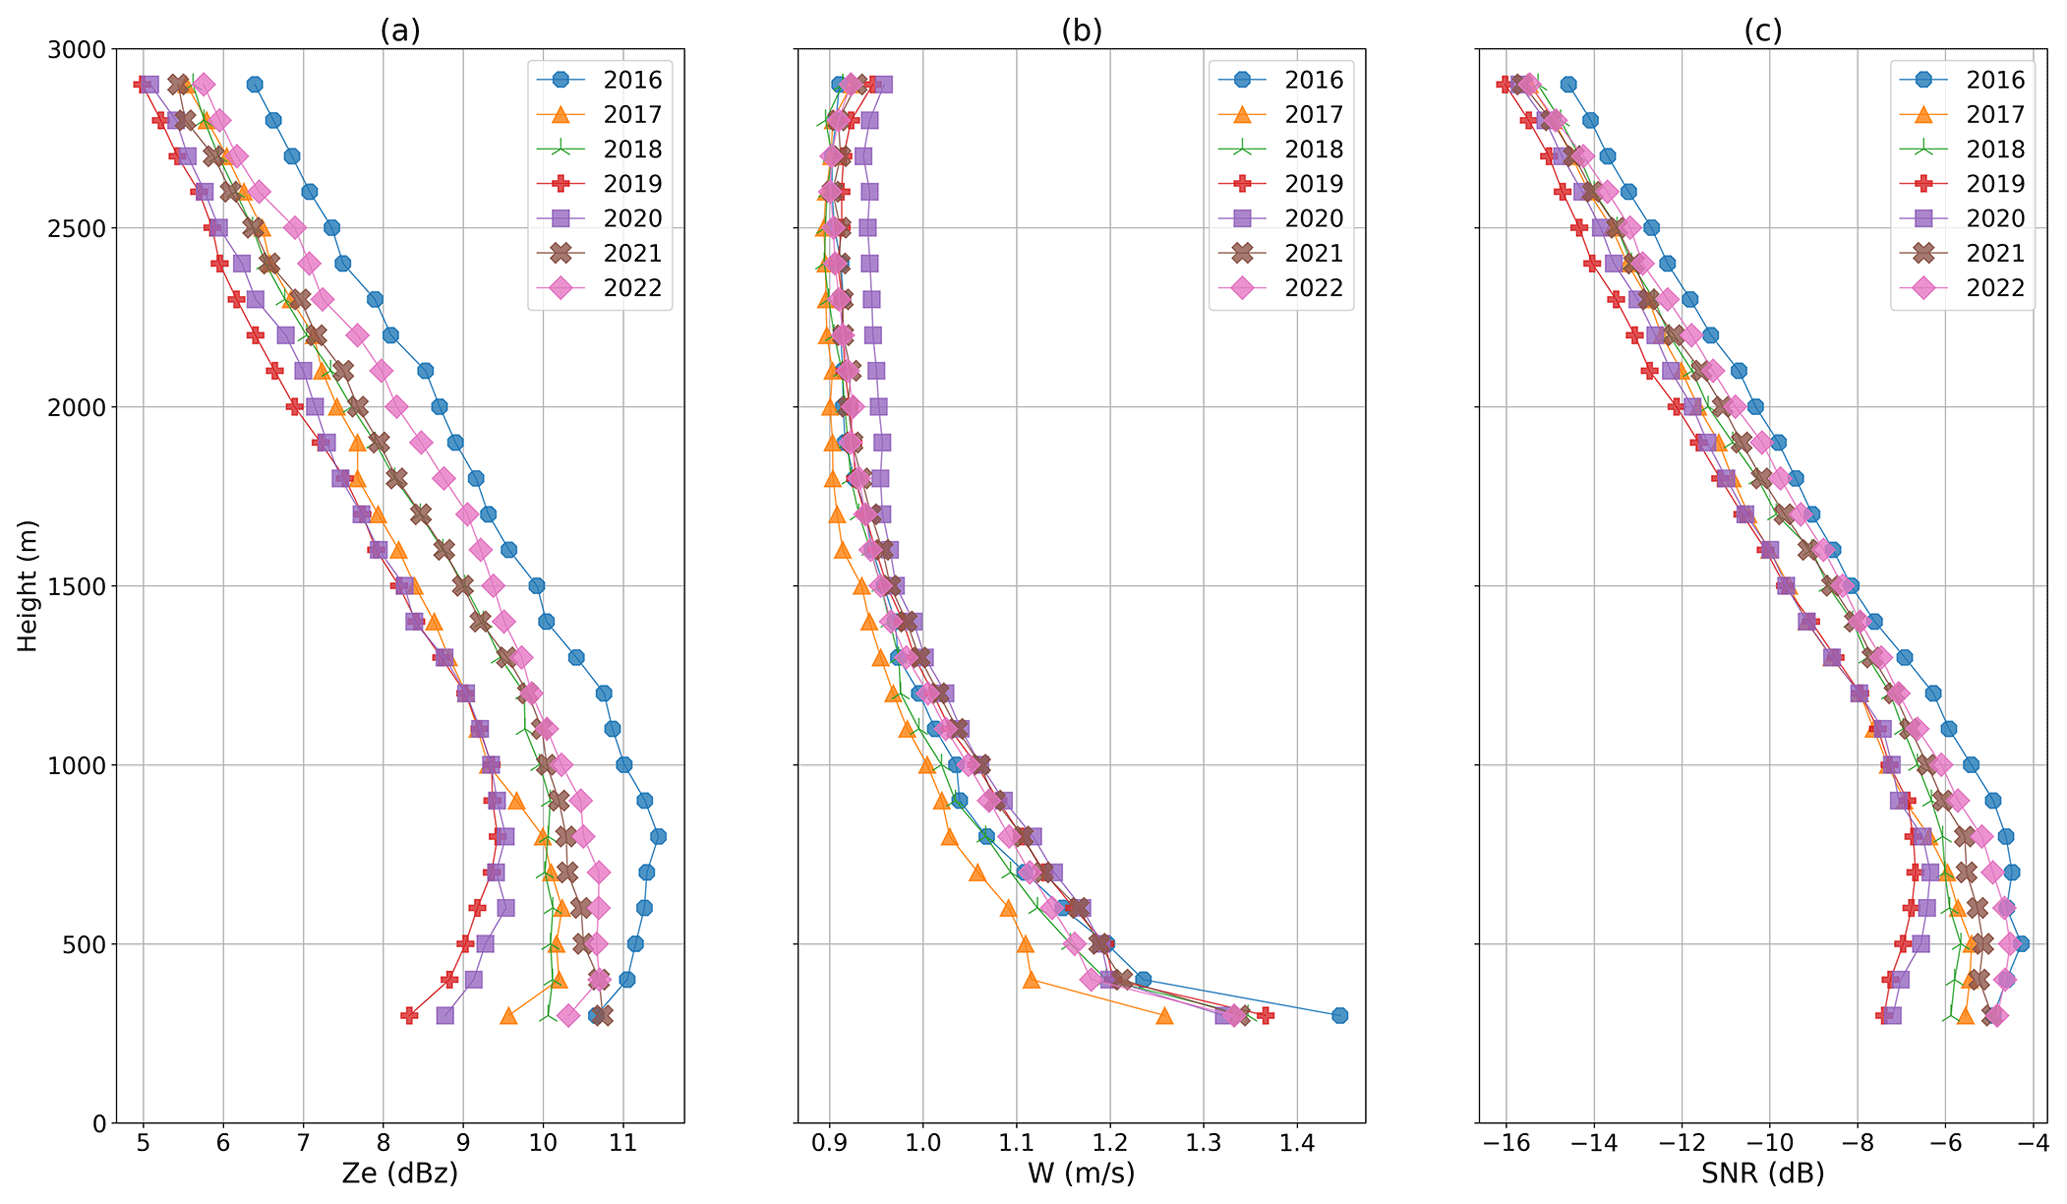
Figure 5Yearly median profiles of the MRR equivalent reflectivity (a), mean Doppler velocity (b) and SNR (c).
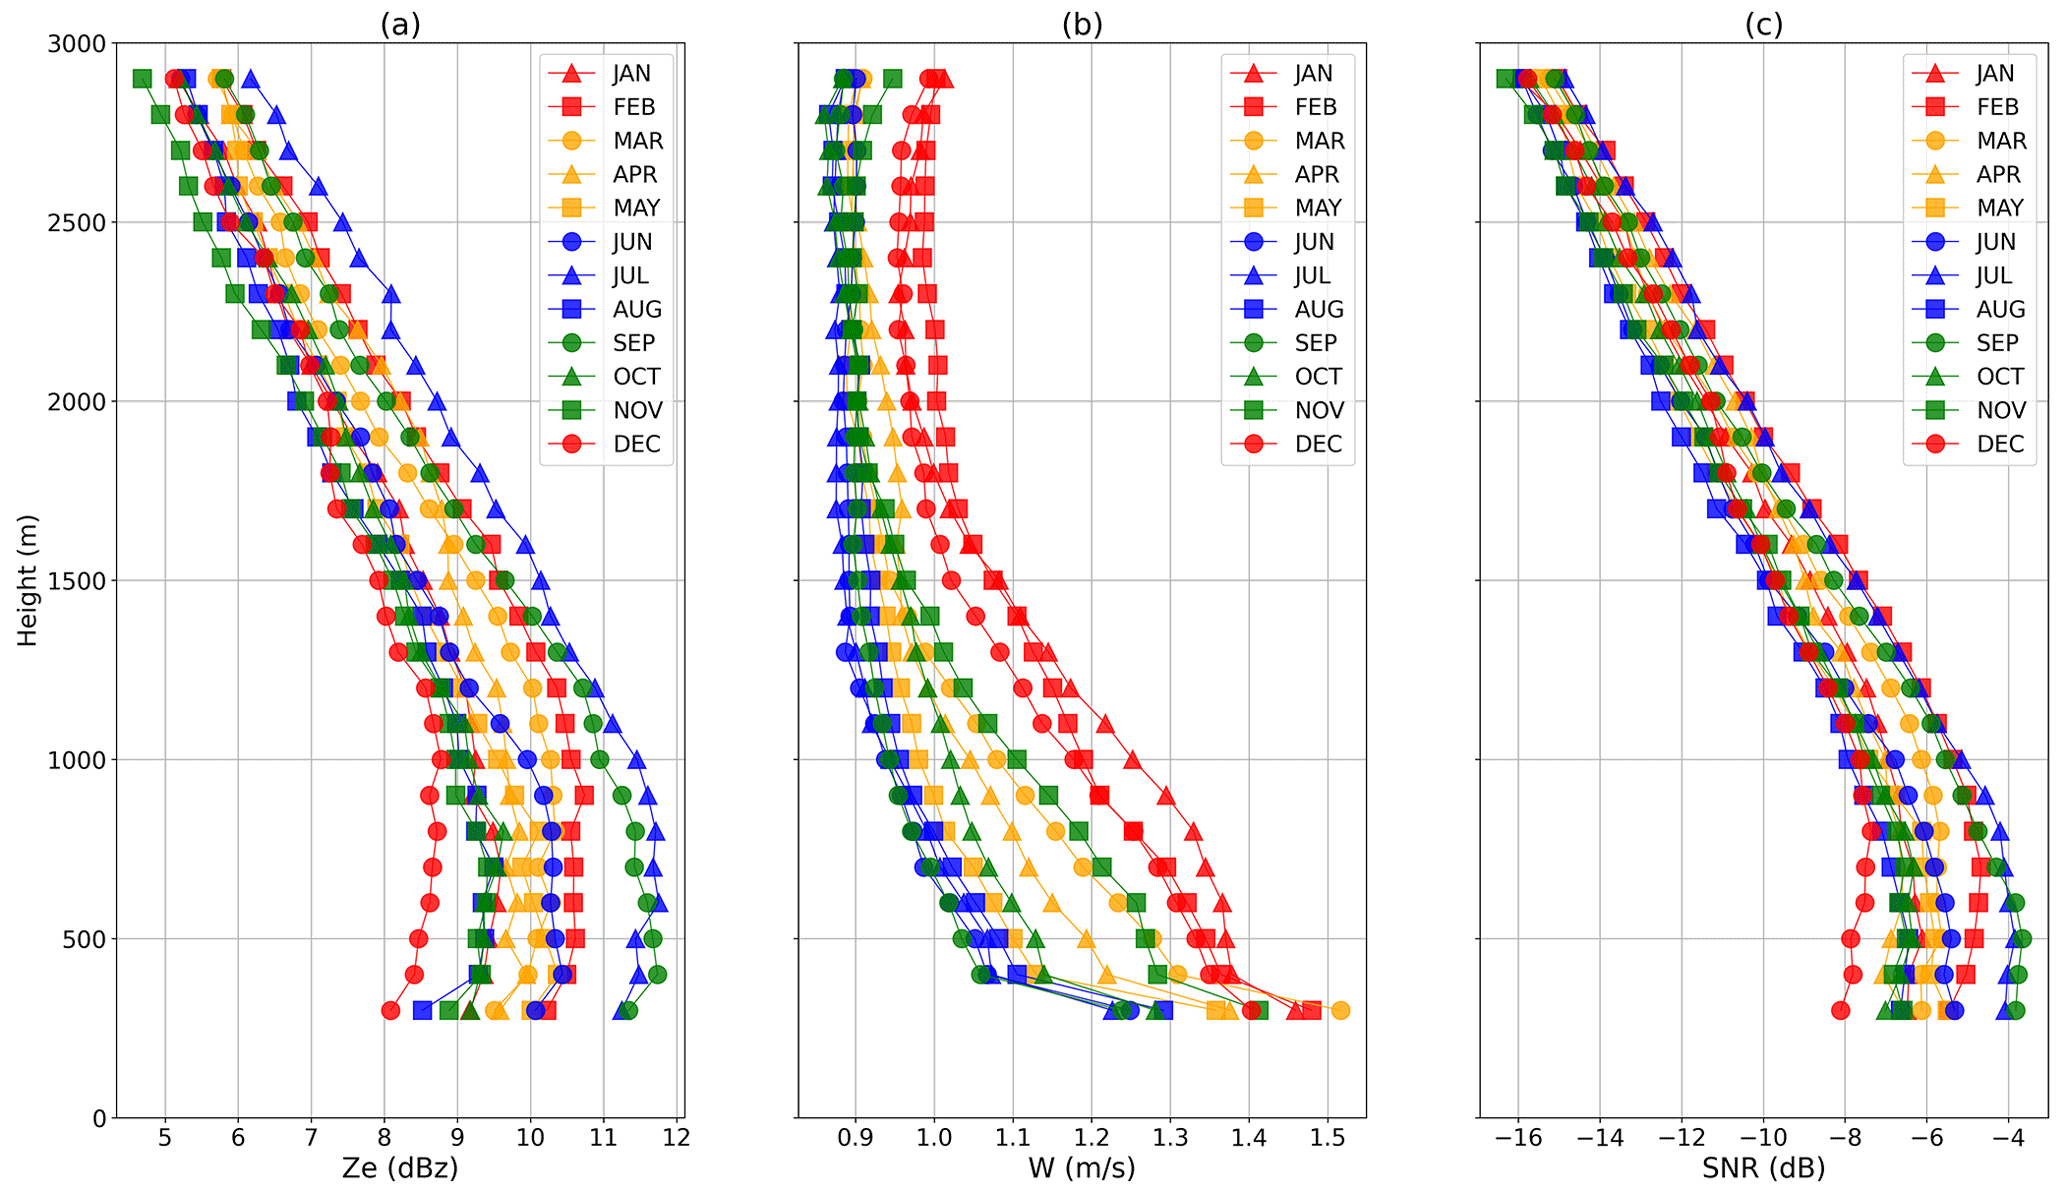
Figure 6Monthly median profiles of the MRR equivalent reflectivity (a), mean Doppler velocity (b) and SNR (c).
Seasonal variability is then considered in Fig. 6 for the same variables, whose medians have been computed for each month over the 7 years of data, thus providing a first estimation of the MRR climatology (around 5500 data points for each month). Here, again, no visible trend is identifiable in Fig. 6a and c for the equivalent reflectivity and the signal-to-noise ratio. Seasonal variability for those variables, if any, is masked by the substantial interannual variability seen above.
In contrast, a clear seasonal signal of the mean Doppler velocity appears throughout all the columns in Fig. 6b. Ice crystals and snowflakes fall more slowly in winter (June to September) than in summer (December to February), with inter-seasons in the middle values. Indeed, relatively warmer and moister conditions in summer favor aggregation and riming, thus increasing the snowflakes' density and fall speed (Garrett and Yuter, 2014). This signal remains when removing 1 year from the period at a time (not shown), supporting that it is robust to interannual variability.
If we characterize seasonal variability as the maximal profile minus the minimal profile in Fig. 6, the equivalent reflectivity variability is 3.5 dBz (around 40 % of the median profile) at 300 m and decreases slightly with altitude; the mean Doppler velocity variability is 0.3 m s−1 at 300 m (21 % of the median profile) and is divided by 2 in altitude; whereas the SNR seasonal variability is 4.1 dB at 300 m (70 % of the median profile) and only 1.4 dB in altitude.
Both interannual and seasonal variability are larger near the surface than in altitude. In fact, we expect differences between precipitation events to emerge during the aggregation and riming processes (Planat et al., 2021) and, thus, be more pronounced in the lower gates. Moreover, turbulence in the katabatic layer (below 1 km or so) is likely to impact the hydrometeors' fall speed and to increase the mean Doppler velocity variability. To quantify this effect, the spectrum width recorded by the MRR can be used to estimate turbulence in the lower levels as described in Appendix A of Vignon et al. (2020); such a study is beyond the scope of this paper.
3.2 Estimation of snowfall rate profiles from the MRR data
3.2.1 Derivation of the Ze–S relation
In this section, the MRR snowfall rate profile is calculated by means of a power law relationship between the equivalent radar reflectivity Ze (in mm6 m−3) and the snowfall rate S (in mm h−1), i.e., Ze=aSb (Eq. 1), whose parameters a (prefactor) and b (exponent) are estimated using the weighing gauge snowfall S (see Sect. 2.2). This is a common methodology for retrieving snowfall rates from radar reflectivities (e.g., Grazioli et al., 2017a; Scarchilli et al., 2020; Souverijns et al., 2017; Schoger et al., 2021). Theoretical considerations about snowflakes' shape, mass and velocity are discussed in Matrosov (2007) and Matrosov et al. (2009). The equivalent reflectivity Ze at the usable gate closest to the surface (300 m a.g.l.) is processed as described in Sect. 2.1, except that it is converted in linear units (mm6 m−3) before the hourly averaging. The gauge hourly snowfall is computed as described in Sect. 2.2. We refer the reader to Sect. 6 for the processing code. The regression period spans from November 2015 to June 2023 included, which corresponds to a 5.5-year period when taking into account the two gaps in the snow-gauge data mentioned in Sect. 2.2; 9456 h precipitating timesteps common for both instruments remain to perform the regression.
At this stage, the scatter plot exhibits a large amount of statistical noise with many outliers (see the gray dots in Fig. 7). This issue motivated the application of several filters to reduce the noise. We present and use two of them in the following, along with their impact on the power-law parameters, as they were considered both mandatory and sufficient to obtain a robust regression.
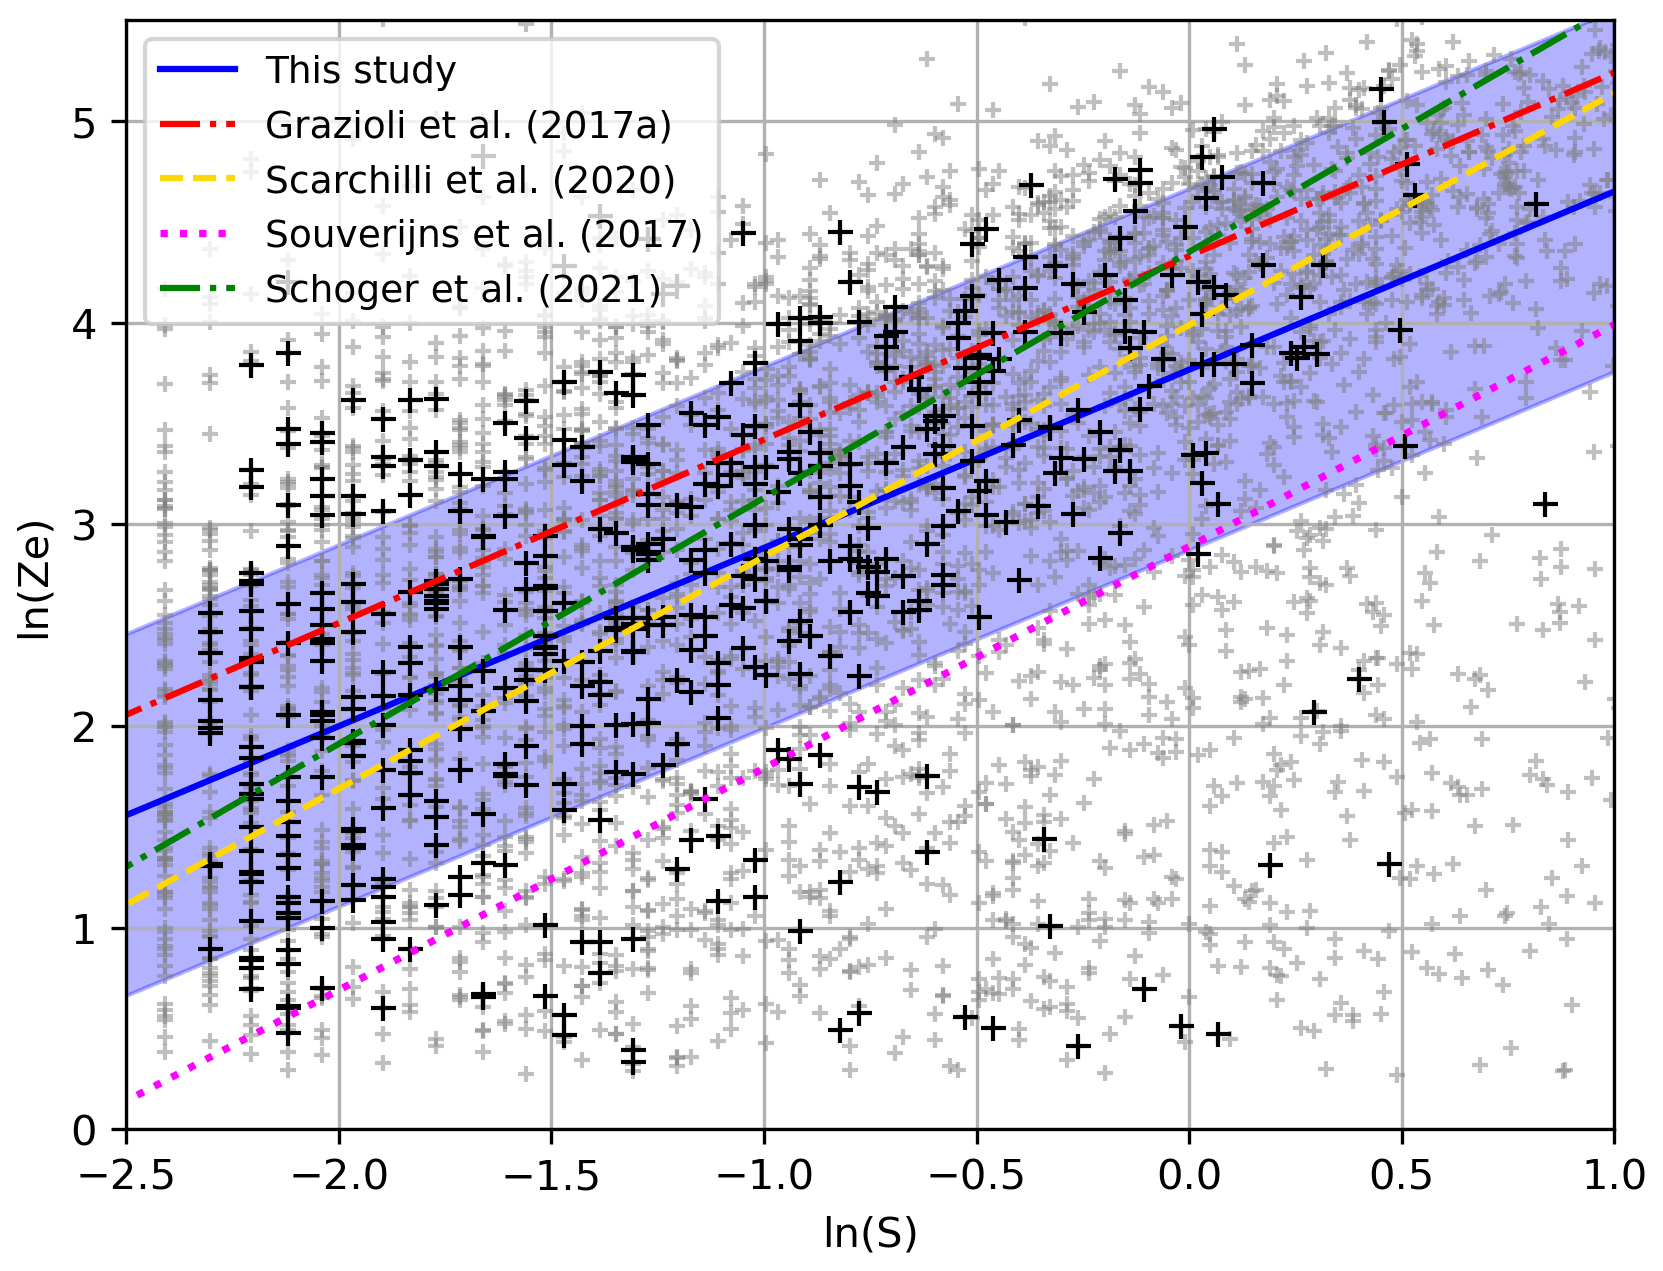
Figure 7MRR equivalent reflectivity and gauge snowfall rate scatter plot (black crosses) in log space filtered as described above, and the resulting Ze–S relation derived with a robust quantile regression (solid blue line). The blue shading represents the regression RMSE. Ze–S relations from Grazioli et al. (2017a) (red dash-dotted line), Scarchilli et al. (2020) (dashed yellow line), Souverijns et al. (2017) (magenta dotted line) and Schoger et al. (2021) (dash-dotted green line) are also represented. Small gray dots represent data points that have been filtered out.
Wind is the main source of uncertainty of snow-gauge measurements at Dumont d'Urville. It makes the gauge vibrate, destabilizing its weighing system and leading to spurious precipitation records. Moreover, snow that has already precipitated may be remobilized from the surface into the atmosphere by the wind and fall into the gauge bucket, leading to largely overestimated snowfall rates and accumulation. Sugiura et al. (2003) showed that blowing snow can lead to an overestimation of precipitation by 6 % to 130 % due to the increased number of aeolian snow particles in the atmosphere, a result supported by numerous very large snow-gauge hourly snowfall rates suspiciously corresponding to low MRR reflectivities. In addition, blowing snow particles are smaller than snowfall particles (Nishimura and Nemoto, 2005, Naaim-Bouvet et al., 2014) as they originate from shattered snowflakes, and therefore have a different radar signature since radar reflectivity is dependent on diameter to the sixth power. This impacts the Ze–S relation as part of the reflectivity signal and does not correspond to precipitation.
Hourly wind speed provided by the Météo-France weather station (see Sect. 2.3) is thus used to discard all data points corresponding to winds above 7 m s−1, in accordance with the threshold used in Scarchilli et al. (2020).
As a second filter, weighing gauge hourly snowfall lower than 0.1 mm h−1 and exceeding 12 mm h−1 have been discarded to avoid, respectively, biases due to the instrument sensitivity and unrealistic values caused by maintenance operations on the bucket, the second threshold originating from the snow-gauge documentation.
Data points removed by the application of these two filters are shown by the small gray crosses in Fig. 7. The impact of the filters on the Ze–S relation is discussed further below.
Hourly surface temperatures provided by Météo-France were also investigated to prevent liquid precipitation (above 0 ∘C) from impacting the Z–S relation, defined exclusively for snowfall. However, very few data points were affected by this filter, and the impact on the parameters was negligible, which is consistent with the rare rainfall occurrence found in Sect. 3.1 from the mean Doppler velocity. Therefore, this filter was not retained in the final Ze–S relation computation.
Daily occurrences of blizzard and blowing snow from Météo-France weather reports were also tested as a filter, but proved too coarse to efficiently clean out the noise in the correlation cloud. Again, this filter was not retained in the computation.
Only 503 data points remain after the application of these two filters, but they are quite evenly spread over the whole period (not shown). A significant amount of information is thus lost in the filtering process, but we consider it mandatory to extract the signal from the noise.
The 503-data point cloud resulting from the two filters described above still visually exhibits a dozen outliers, likely to affect fits based on root mean square error minimization. It was, therefore, decided to convert Eq. (1) in log space, and to fit the resulting equation
with a quantile linear regression method more robust to outliers compared to the standard least squares method (Pedregosa et al., 2011).
Figure 7 presents the resulting scatter plot after filtering and the linear fit in log space. Converted back into linear space, the relation obtained is Ze=43.3S0.88, with a R2 score in log space of 0.27. We estimate the regression uncertainty as the RMSE, plotted in blue shading in Fig. 7. When the filter based on the wind speed threshold is deactivated, there is much more noise in the scatter plot, and the R2 score drops to 0.10, whereas parameters a and b change by −5 % and −20 %. Thus, this filter allows us to remove a significant amount of outliers corresponding to high snow-gauge snowfall and low MRR reflectivity values typical of blowing snow conditions, with a major impact on the R2 score and the regression slope b (see Eq. 2). When the filter based on the snow-gauge values is deactivated, parameters a and b decrease by −26 % and −32 %. Although the R2 score is better (0.33) without this filter, it was retained, as the weighing gauge snowfall very low values with high relative incertitude (>10 %) lead to a less realistic regression, as can be seen by the significant impact on the parameters. We chose to convert the Ze–S relation in log space, and using a robust quantile linear regression, as by reducing the impact of outliers, this leads to a regression that better fits the data, with almost no change to the R2 score (<0.01). Parameter a (b) changes by +17 % (+15 %) compared with the standard linear regression, which is quite significant.
Compared to the Ze–S relation Ze=76S0.91 found by Grazioli et al. (2017a) (plotted with a dashed red line in Fig. 7) from the same instruments, although for a much shorter period, the slope b is very similar (inside the 95th confidence interval [0.78–1.09]) while the fit has an offset due to the much lower prefactor (outside the 95th confidence interval [69–83]), leading to a negative R2 score. When our Ze–S relation is derived over the same period as Grazioli (from 22 November 2015 to 29 January 2016), although the small number of data points does not allow us to apply the filters, the two parameters fall back inside the 95 % confidence interval: a=73.7 and b=1.05. Small discrepancies persist due to different data processing methods such as the conversion of the Ze–S relation in log space, the use of a robust quantile linear regression, or the initial processing of S and Ze. Over the whole period, the parameters found in this study lead to higher MRR snowfall values than Grazioli et al. (2017a), as a given equivalent reflectivity corresponds to a higher gauge snowfall. These considerations could be of interest for future studies using the DDU MRR as an observation reference, as up to now, only parameters from Grazioli et al. (2017a) derived for a 2-month period in austral summer have been used (e.g., Lemonnier et al., 2019; Jullien et al., 2020; Roussel et al., 2023).
The Ze–S relation of Scarchilli et al. (2020) Ze=54S1.15 (although for an integration time of 5 min) shown with a dashed yellow line in Fig. 7 fits the data fairly well, although its R2 score is lower (0.20), as it does not take into account the outliers located in the lower right corner of the scatter plot. The relation Ze=18S1.10 of Souverijns et al. (2017), shown with a dotted magenta line, is outside our uncertainty range, shown with blue shading, with a negative R2 score. Likewise, our parameters a and b are both outside their uncertainty range ([11–43], [0.97–1.17]). This significant difference can be due to the location of the Princess Elizabeth station, 173 km off the coast at the other end of Antarctica with drier conditions and smaller particle diameters, the much shorter sampling period (January to May 2016) or the instrument used as snowfall reference (the Precipitation Imager Package). Interestingly, the relation Ze=77.61S1.22 of Schoger et al. (2021)(shown with a dash-dotted green line) better fits our data despite the fact that their MRR is deployed at the other end of the world (Ny-Ålesund, Svalbard in the Arctic), which could be related to more similar meteorological conditions. The prefactor value a=43.3 found by this study is consistent with those of the theoretical Ze–S relations of Matrosov et al. (2009), which range from 28 to 136, although the corresponding exponents exceed 1. However, definitive conclusions cannot be drawn for a or b individually, as they are not independent.
Despite the restrictive filtering steps listed above, the regression score R2 in log space remains low (0.27), which is mainly due to outliers in the lower right corner of the scatter plot and probably not linked with blowing snow, as they have not been filtered out by the wind speed threshold. Furthermore, the precipitation flux at DDU may be explained by factors other than radar reflectivity. Other explanatory variables, potentially season-dependent, could be used to derive better precipitation estimates. This important issue will be addressed again in Sect. 6.
3.2.2 Sensitivity to integration time
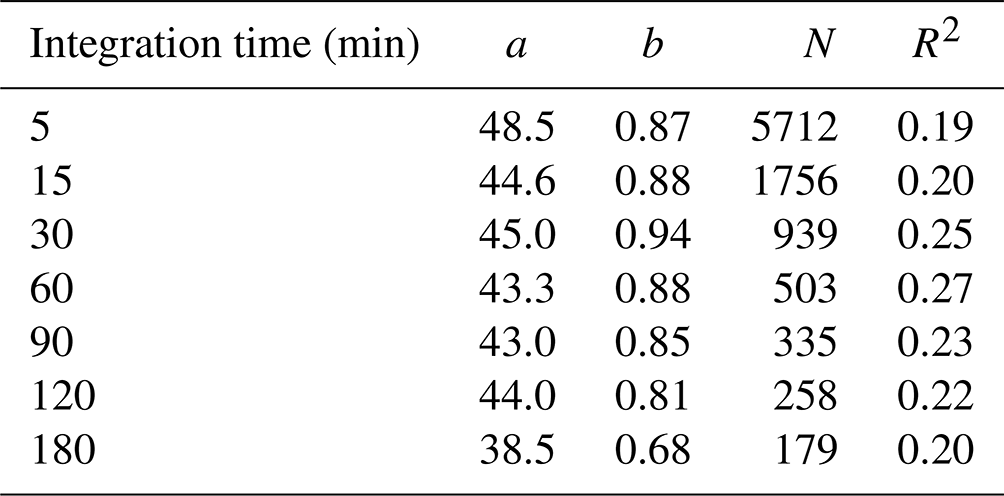
Interestingly, the Ze–S relation obtained with the data processing detailed previously is robust to the choice of the integration time. Table 1 presents the values of parameters a, b, the number of data points N and the score R2 for different integration times. The hourly wind speed filter from Météo-France was linearly interpolated in time when the integration time was below 60 min. Although the shorter (5 min) and longer (180 min) integration times differ from the average with lower R2 scores due to, respectively, too much noise and undersampling effects, the parameters a and b are approximately independent of the integration time. The hourly integration time exhibits the higher R2 score.
Table 1Impact of the integration time on parameters a and b, the number of data points N and the R2 score.
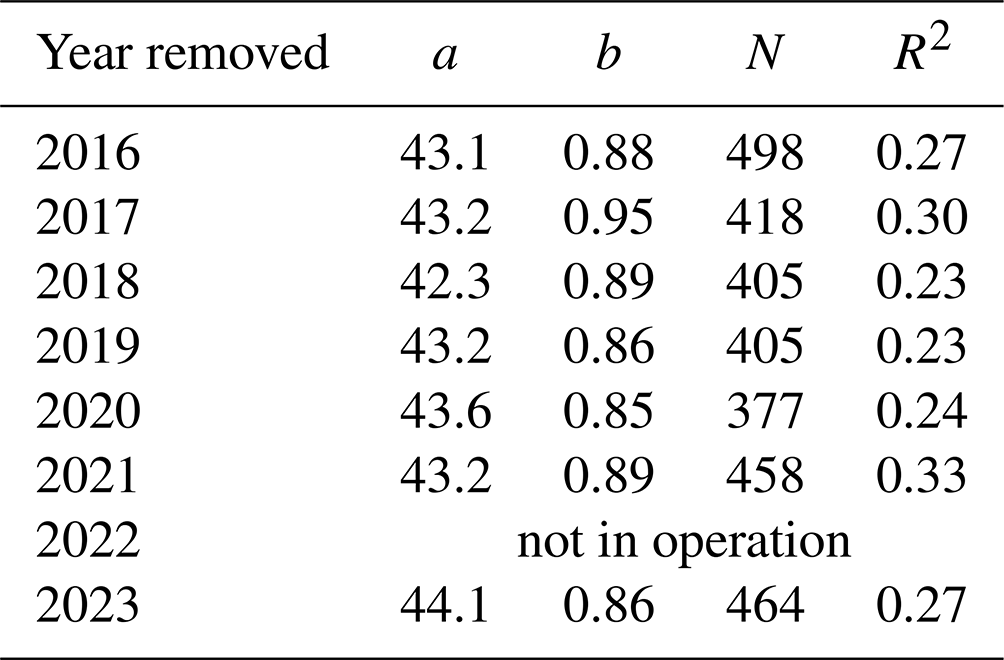
Sensitivity of the Ze–S relation to interannual variability was also assessed by removing 1 year at a time in the computation. The prefactor a varies between 42.3 and 44.1, whereas the exponent b varies between 0.85 and 0.95 (see Table 2). As these variations remain within 10 % relative difference, this result supports that the derived Ze–S relation is also robust to interannual changes in the recordings.
Table 2Impact of the interannual variability on parameters a and b, the number of data points N and the R2 score.
In Sect. 3.3, the MRR snowfall profile is computed by inverting the equation Ze=aSb
with the parameters found for the whole dataset with an integration time of 1 h. Doing so, we assume that the Z–S relationship derived using the MRR data at 300 m is representative for the entire profile (up to 3 km), which may not hold true when there is a large change in the hydrometeors' structure and type along the vertical.
3.3 Example of application to model evaluation
In this section, we show how the hourly MRR snowfall computed from the Ze–S relation described in Sect. 3.2 can be used to evaluate the vertical profiles of precipitation as simulated by numerical models. The MRR is compared to the ERA5 reanalysis and the LMDZ model (described in Sect. 2.4) for the period ranging from 1 December 2015 to 1 January 2022.
Firstly, the median and quantiles profiles of the three datasets in coastal Adélie Land are investigated. The model profiles are precipitation threshold-sensitive, as they produce a large number of very small precipitation events (below 0.01 mm h−1). Palerme et al. (2014) proposed a threshold of 0.07 mm per 6 h to optimize the comparison of ERA-Interim precipitation rates with CloudSat observations, which was also used in Roussel et al. (2023) for model evaluation. Converted to mm h−1, the model threshold is 0.012 mm h−1. The MRR snowfall threshold is derived from the equivalent reflectivity sensitivity of −5 dBz, i.e., +1 dBz taking into account radome attenuation (see Sect. 2.1) and mm6 m−3 in linear units. Equation (3) with the parameters a and b found in Sect. 3.2 gives a MRR threshold of 0.019 mm h−1. To avoid sampling period biases due to MRR missing data, only precipitating times (i.e., with a precipitation rate above the thresholds defined above) for the three datasets have been retained, corresponding to 3717 data points. Figure 8 shows the profiles medians (solid lines with dots) and the 10th and 90th quantiles (dotted lines).
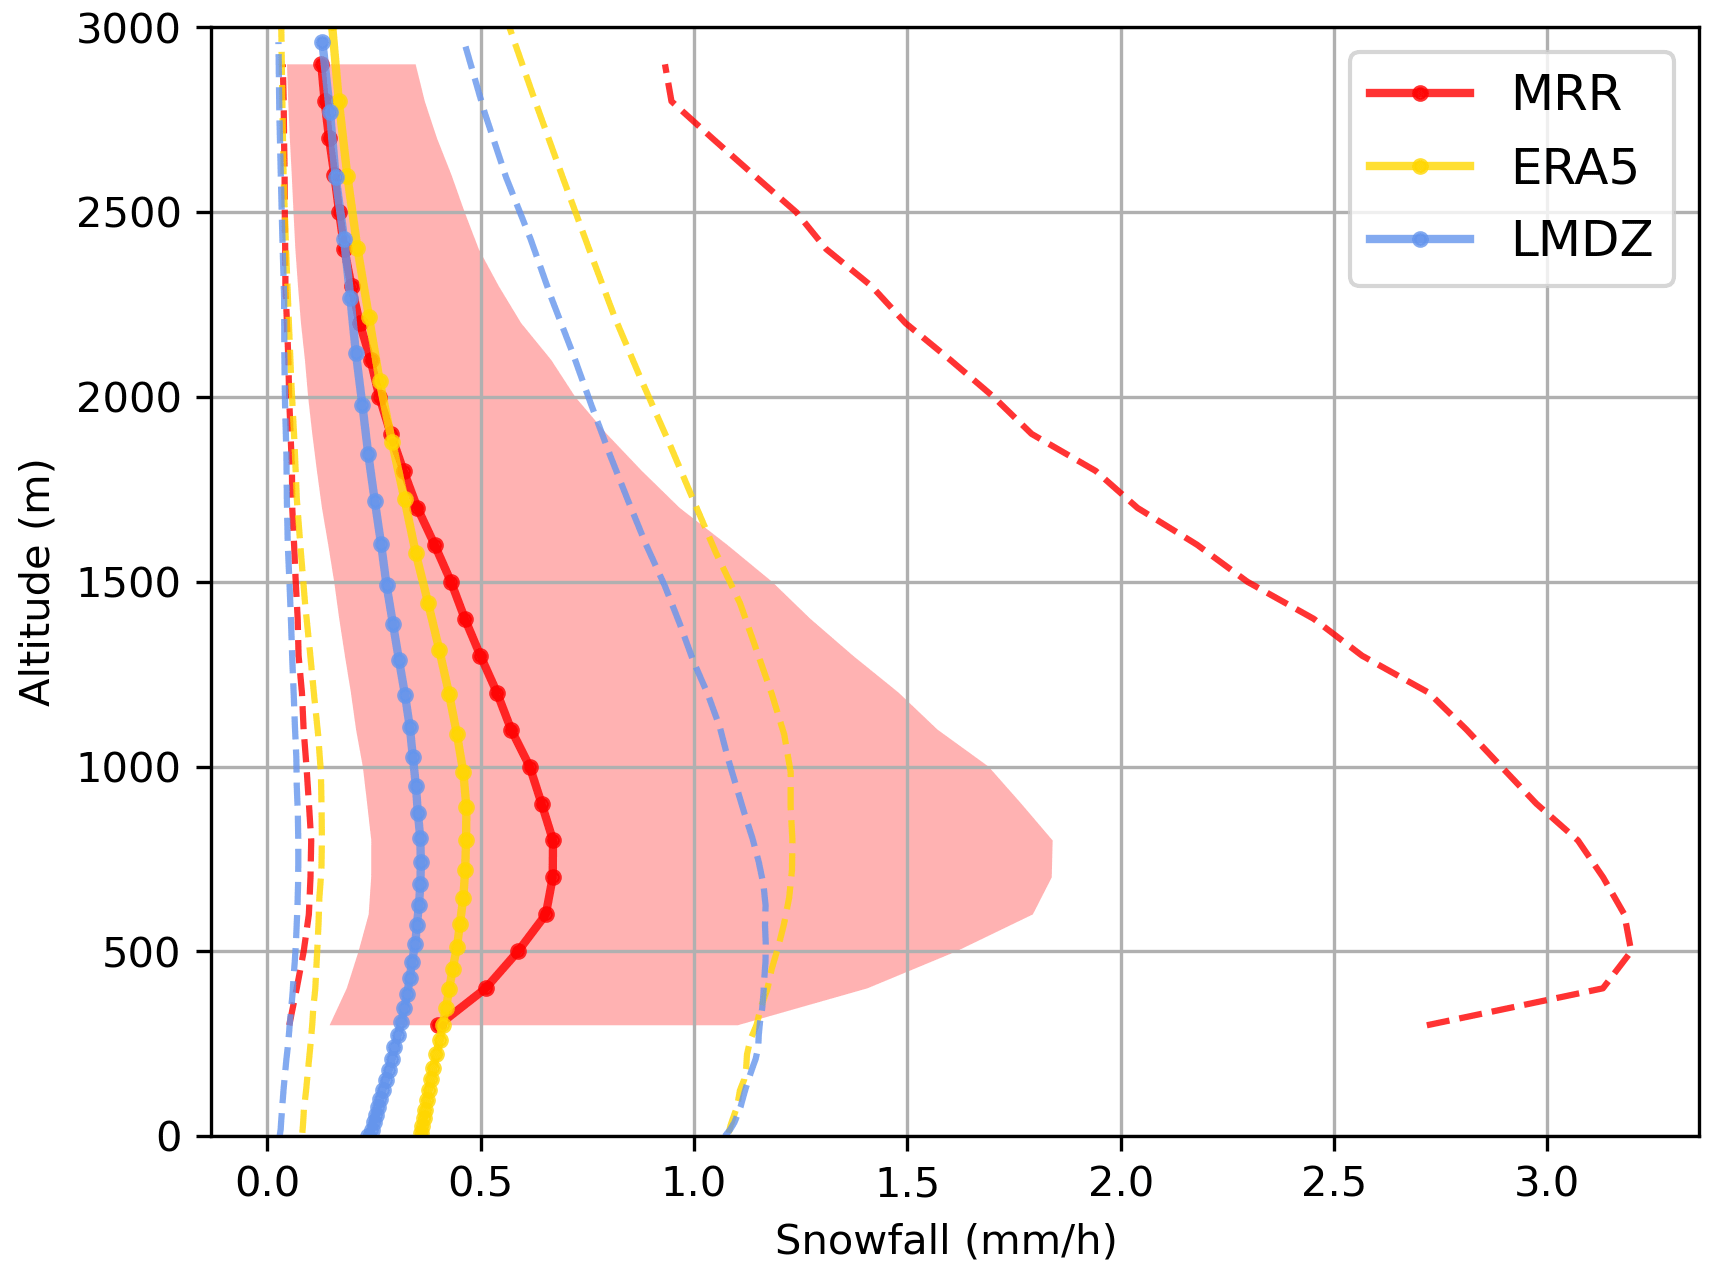
Figure 8Median (solid line with dots), 10th quantile and 90th quantile (dashed line) vertical profiles for the MRR (in red), ERA5 (in yellow) and LMDZ (in blue) for the 3717 h data points of common precipitating timesteps.
The MRR 90th quantile stands out rather strikingly, peaking more than twice as large as the corresponding ERA5 and LMDZ profiles, while its median and 10th quantile remain of similar magnitude. This result suggests that models struggle to simulate heavy events. Maximum precipitation values reached at the surface (at 300 m for the MRR) for that period are consistent with that statement: ERA5 attains only 2.7 mm h−1 and LMDZ 4.6 mm h−1, whereas the MRR reaches 30 mm h−1.
Although ERA5 and LMDZ reproduce the increase in precipitation from the top (3 km) down to a maximum around 800 m, as well as the decrease at the bottom due to sublimation of snowflakes, the slopes are not steep enough compared to the MRR. This suggests that auto-conversion of ice crystals into snowfall as well as sublimation due to the katabatic flow may be underestimated in the models, which is an issue that was already raised for ECMWF-IFS and LMDZ by Grazioli et al. (2017b) with 1 year of data of the same instrument. Yet, the altitudes of maximum precipitation in ERA5 and LMDZ correspond fairly well to the observations, with an ERA5 median profile peaking at 890 m and LMDZ at 740 m, while the MRR peaks at 800 m. Although the MRR data do not extend below 300 m, the slopes of the model profiles below 800 m substantially overestimate surface precipitation because of too-weak sublimation. If sublimation is defined as the relative difference of the median snowfall rate between the altitude of maximum precipitation and 300 m (including for the models), the MRR sublimation is 40 %, whereas ERA5 (LMDZ) sublimation is only 12 % (13 %). This MRR sublimation is quite similar to that of Alexander et al. (2023), who found a sublimation of 50 % for a MRR deployed at the Davis station and that of Bracci et al. (2022a), who found an order 30 %–40 % for a MRR deployed at the Mario Zucchelli station.
The underestimation of strong event intensity by the models has a big impact on the total snow accumulation. Indeed, Fig. 1 of Turner et al. (2019) indicates that extreme precipitation events contribute by more than 50 % to total accumulation near the DDU region. In the present dataset, almost 50 % of the MRR total accumulation is due to snowfall larger than 2 mm h−1, whereas this contribution drops below 5 % for ERA5 and LMDZ (not shown). This result is consistent with Fig. 11 of Grazioli et al. (2017a) (upper panel) for 1 year using the same instrument, although the contribution of MRR snowfall rates larger than 2 mm h−1 is only 30 %. This difference can be explained by the larger MRR snowfall rates found by this study through the revised Ze–S relation (see Sect. 3.2).
At the end of the period, after the gaps in the MRR dataset have been removed, the MRR yearly average accumulation at 300 m is 1060 mm yr−1. It is larger than ERA5 by 44 % with 737 mm yr−1 and larger than LMDZ by 53 % with 691 mm yr−1 for the same period and altitude. However, the models' accumulation at 300 m may be underestimated due to their too smooth profile shape (see Fig. 8). Conversely, the MRR snowfall rate may be overestimated due to remaining outliers in the Ze–S computation, despite the restrictive processing method described in Sect. 3.2. Grazioli et al. (2017a) estimated yearly accumulation from October 2015 to October 2016 of between 740 and 989 mm yr−1, i.e., 23 % less on average than this study, which is again consistent with the lower snowfall rates obtained with the Grazioli et al. (2017a) Ze–S relation. Even so, precipitation has a high degree of interannual variability (see Fig. 5a), and two different periods cannot be directly compared. Also, it is important to keep in mind that the accumulation at the surface is probably much lower than 1060 mm yr−1 because of precipitation sublimation below the MRR lowest gate at 300 m. Snow-gauge accumulation is not presented here, as it is largely overestimated due to contamination by blowing snow (not shown).
On the other hand, the precipitation occurrence of the models is higher than the MRR, with 29 % of hourly precipitating timesteps for ERA5, 22 % for LMDZ and only 15 % for the MRR. Model snowfall events are also longer with a median of 13 h (14 h) for ERA5 (LMDZ) compared to 7 h for the MRR. However, this higher occurrence of model precipitation is not enough to compensate for the larger MRR accumulation.
Data are available on the PANGAEA server here: https://doi.org/10.1594/PANGAEA.962727 (Wiener et al., 2023). The MRR 1 min profiles of the source variables (equivalent reflectivity, mean Doppler velocity, SNR and quality flag) are stored in zipped netCDF files from 23 November 2015 to 1 July 2023 (one file per year). The MRR hourly snowfall profiles computed in Sect. 3.2 from the relation Ze=43.3S0.88 along with the gauge 1 min snowfall accumulation and the hourly wind speed and temperature from Météo-France observations are also available for the same period.
The processing code in Python used for the derivation of the Ze–S relation can be accessed here (https://gitlab.in2p3.fr/valentin.wiener/ze-s-relation-mrr.git, Wiener, 2023). The latest MRR data can be retrieved upon direct request to Valentin Wiener.
We have presented 7 years of data from a Micro Rain Radar (MRR) deployed at the Dumont d'Urville station in Antarctica. A statistical analysis outlines the main characteristics of the MRR vertical profiles of the equivalent reflectivity, mean Doppler velocity and signal-to-noise ratio, concurring with the results of Durán-Alarcón et al. (2019). No interannual or seasonal trends have been clearly identified in the MRR profiles, except for the seasonal mean Doppler velocity, which is larger in summer and smaller in winter, suggesting an enhanced aggregation process. Nonetheless, the sample period is still too short (7 years) to possibly exhibit such climatic trends.
A Ze–S relation has been derived from the dataset to retrieve precipitation profiles, thus allowing us to refine the relation found by Grazioli et al. (2017a) for the same instrument but built in one summer season only. Despite a large amount of noise, the 7 year period made it possible to apply restrictive filters robust to integration time and interannual variability. The uncertainty of the Ze–S relation is estimated as its RMSE in log space. The results have been compared with those in the literature, and particularly with the relation of Grazioli et al. (2017a), with whom an offset probably due to the sampling period has been found, leading to smaller MRR snowfall rates than those in this study. However, Ze–S relations in the literature still present a significant degree of uncertainty, which makes it difficult to draw final conclusions. Although we chose to be very cautious, the R2 score remains low, and other processing methods may be applied to the raw data (see data availability below) by future users. For instance, other explanatory variables such as temperature, wind speed, or the mean Doppler velocity of hydrometeors could be combined to the equivalent reflectivity to better constrain the Ze–S relation, but such considerations are beyond the scope of this study.
This Ze–S relation allowed the evaluation of two climate models (ERA5 and LMDZ) along the vertical as an application example of the dataset. Models showed profiles that were too smooth, both in altitude and time, with a large underestimation of intense snowfall events compared to the MRR leading to an accumulation that was twice as small. The weaker sublimation of precipitation by the models is not enough to compensate for their smaller accumulation.
We believe that the 7 years of data presented in this paper are a great opportunity to evaluate and optimize climate models by fostering future studies on the parameterization of snowfall along the vertical in Antarctica, as well as the representation of the katabatic layer and its impact on precipitation sublimation. The dataset can also be used to complement and validate satellite products by providing ground-based information, for instance to evaluate the effect of the blind range near the ground level to obtain more accurate surface precipitation estimates.
VW: resources, data curation, investigation, methodology, writing. MLR: resources, review. CG: instrument setting, writing, review, validation. ÉV: investigation, review. JG: instrument setting, methodology, review. AB: instrument setting, methodology, review, validation.
The contact author has declared that none of the authors has any competing interests.
Publisher's note: Copernicus Publications remains neutral with regard to jurisdictional claims made in the text, published maps, institutional affiliations, or any other geographical representation in this paper. While Copernicus Publications makes every effort to include appropriate place names, the final responsibility lies with the authors.
The LMDZ simulation was performed using HPC resources from the IDRIS (Institut du Développement et des Ressources en Informatique Scientifique, CNRS, France), projects RLMD AD010107632R1. This study benefited from the ESPRI computing and data center (https://mesocentre.ipsl.fr, last access: 28 September 2022), which is supported by CNRS, Sorbonne Université, Ecole Polytechnique, and CNES, as well as through national and international grants. We thank Claudio Durán-Alarcón for sharing his script for the MRR raw data processing and Jean-Louis Dufresne for sharing the DDU snow-gauge data, with an instructive critical insight. We also thank IPEV (the French polar institute) for support to program CALVA, and CNES for support to program EECLAT. Finally, we gratefully thank Pauline Jaunet, Laurent Baudchon and Météo-France for preparing and sharing the DDU weather station data.
This paper was edited by Iolanda Ialongo and reviewed by two anonymous referees.
Adler, R. F., Sapiano, M. R., Huffman, G. J., Wang, J.-J., Gu, G., Bolvin, D., Chiu, L., Schneider, U., Becker, A., Nelkin, E., Xie, P., Ferraro, R., Shin, D.-B.: The Global Precipitation Climatology Project (GPCP) monthly analysis (new version 2.3) and a review of 2017 global precipitation, Atmosphere, 9, 138, 2018. a
Alexander, S., Protat, A., Berne, A., and Ackermann, L.: Radar-derived snowfall microphysical properties at Davis, Antarctica, J. Geophys. Res.-Atmos., 128, e2022JD038389, https://doi.org/10.1029/2022JD038389, 2023. a, b, c, d
Bracci, A., Baldini, L., Roberto, N., Adirosi, E., Montopoli, M., Scarchilli, C., Grigioni, P., Ciardini, V., Levizzani, V., and Porcù, F.: Evidence of sublimation in the vertical profiles of radar reflectivity and its impact on snowfall estimation at the ground at Mario Zucchelli Antarctic Station, in: 2022 3rd URSI Atlantic and Asia Pacific Radio Science Meeting (AT-AP-RASC), 29 May–3 June 2022 at Gran Canaria, Spain, 1–4, https://doi.org/10.23919/AT-AP-RASC54737.2022.9814266, 2022a. a, b
Bracci, A., Baldini, L., Roberto, N., Adirosi, E., Montopoli, M., Scarchilli, C., Grigioni, P., Ciardini, V., Levizzani, V., and Porcù, F.: Quantitative Precipitation Estimation over Antarctica Using Different Ze-SR Relationships Based on Snowfall Classification Combining Ground Observations, Remote Sens.-Basel, 14, 82, https://doi.org/10.3390/rs14010082, 2022b. a
Bromwich, D. H., Werner, K., Casati, B., Powers, J. G., Gorodetskaya, I. V., Massonnet, F., Vitale, V., Heinrich, V. J., Liggett, D., Arndt, S., Barja, B., Bazile, E., Carpentier, S., Carrasco, J. F., Choi, T., Choi, Y., Colwell, S. R., Cordero, R. R., Gervasi, M., Haiden, T., Hirasawa, N., Inoue, J., Jung, T., Kalesse, H., Kim, S.-J., Lazzara, M. A., Manning, K. W., Norris, K., Park, S.-J., Reid, P., Rigor, I., Rowe, P. M., Schmithüsen, H., Seifert, P., Sun, Q., Uttal, T., Zannoni, M., and Zou, X.: The Year of Polar Prediction in the Southern Hemisphere (YOPP-SH), B. Am. Meteorol. Soc., 101, E1653–E1676, https://doi.org/10.1175/BAMS-D-19-0255.1, 2020. a
Chellini, G., Gierens, R., and Kneifel, S.: Ice Aggregation in Low-Level Mixed-Phase Clouds at a High Arctic Site: Enhanced by Dendritic Growth and Absent Close to the Melting Level, J. Geophys. Res.-Atmos., 127, e2022JD036860, https://doi.org/10.1029/2022JD036860, 2022. a
Christopher, K. J., John, T., and King, J. C.: Antarctic meteorology and climatology, Cambridge atmospheric and space science series, Cambridge University Press, Cambridge, ISBN-10:0521039843 ISBN-13:978-0521039840, 1997. a
Church, J. A., White, N., Hunter, J., and Lambeck, K.: A post-IPCC AR4 update on sea level rise, Antarctic Climate & Ecosystems CRC, MB01_080911, 11 pp., 2008. a
Di Natale, G., Turner, D. D., Bianchini, G., Del Guasta, M., Palchetti, L., Bracci, A., Baldini, L., Maestri, T., Cossich, W., Martinazzo, M., and Facheris, L.: Consistency test of precipitating ice cloud retrieval properties obtained from the observations of different instruments operating at Dome C (Antarctica), Atmos. Meas. Tech., 15, 7235–7258, https://doi.org/10.5194/amt-15-7235-2022, 2022. a
Durán-Alarcón, C., Boudevillain, B., Genthon, C., Grazioli, J., Souverijns, N., van Lipzig, N. P. M., Gorodetskaya, I. V., and Berne, A.: The vertical structure of precipitation at two stations in East Antarctica derived from micro rain radars, The Cryosphere, 13, 247–264, https://doi.org/10.5194/tc-13-247-2019, 2019. a, b, c, d, e
Garrett, T. J. and Yuter, S. E.: Observed influence of riming, temperature, and turbulence on the fallspeed of solid precipitation, Geophys. Res. Lett., 41, 6515–6522, 2014. a
Genthon, C., Berne, A., Grazioli, J., Durán Alarcón, C., Praz, C., and Boudevillain, B.: Precipitation at Dumont d'Urville, Adélie Land, East Antarctica: the APRES3 field campaigns dataset, Earth Syst. Sci. Data, 10, 1605–1612, https://doi.org/10.5194/essd-10-1605-2018, 2018. a, b, c
Gorodetskaya, I. V., Kneifel, S., Maahn, M., Van Tricht, K., Thiery, W., Schween, J. H., Mangold, A., Crewell, S., and Van Lipzig, N. P. M.: Cloud and precipitation properties from ground-based remote-sensing instruments in East Antarctica, The Cryosphere, 9, 285–304, https://doi.org/10.5194/tc-9-285-2015, 2015. a
Grazioli, J., Genthon, C., Boudevillain, B., Duran-Alarcon, C., Del Guasta, M., Madeleine, J.-B., and Berne, A.: Measurements of precipitation in Dumont d'Urville, Adélie Land, East Antarctica, The Cryosphere, 11, 1797–1811, https://doi.org/10.5194/tc-11-1797-2017, 2017a. a, b, c, d, e, f, g, h, i, j, k, l, m, n, o
Grazioli, J., Madeleine, J.-B., Gallée, H., Forbes, R. M., Genthon, C., Krinner, G., and Berne, A.: Katabatic winds diminish precipitation contribution to the Antarctic ice mass balance, P. Natl. Acad. Sci. USA, 114, 10858–10863, https://doi.org/10.1073/pnas.1707633114, 2017b. a, b, c, d
Hersbach, H., Bell, B., Berrisford, P., Hirahara, S., Horányi, A., Muñoz-Sabater, J., Nicolas, J., Peubey, C., Radu, R., Schepers, D., Simmons, A., Soci, C., Abdalla, S., Abellan, X., Balsamo, G., Bechtold, P., Biavati, G., Bidlot, J., Bonavita, M., De Chiara, G., Dahlgren, P., Dee, D., Diamantakis, M., Dragani, R., Flemming, J., Forbes, R., Fuentes, M., Geer, A., Haimberger, L., Healy, S., Hogan, R. J., Hólm, E., Janisková, M., Keeley, S., Laloyaux, P., Lopez, P., Lupu, C., Radnoti, G., de Rosnay, P., Rozum, I., Vamborg, F., Villaume, S., and Thépaut, J.-N.: The ERA5 global reanalysis, Q. J. Roy. Meteor. Soc., 146, 1999–2049, https://doi.org/10.1002/qj.3803, 2020. a
Hourdin, F., Rio, C., Grandpeix, J.-Y., Madeleine, J.-B., Cheruy, F., Rochetin, N., Jam, A., Musat, I., Idelkadi, A., Fairhead, L., Foujols, M.-A., Mellul, L., Traore, A.-K., Dufresne, J.-L., Boucher, O., Lefebvre, M.-P., Millour, E., Vignon, É., Jouhaud, J., Diallo, F. B., Lott, F., Gastineau, G., Caubel, A., Meurdesoif, Y., and Ghattas, J.: LMDZ6A: The atmospheric component of the IPSL climate model with improved and better tuned physics, J. Adv. Model. Earth Sy., 12, e2019MS001892, https://doi.org/10.1029/2019MS001892, 2020. a
Jullien, N., Vignon, É., Sprenger, M., Aemisegger, F., and Berne, A.: Synoptic conditions and atmospheric moisture pathways associated with virga and precipitation over coastal Adélie Land in Antarctica, The Cryosphere, 14, 1685–1702, https://doi.org/10.5194/tc-14-1685-2020, 2020. a, b
Krinner, G., Magand, O., Simmonds, I., Genthon, C., and Dufresne, J. L.: Simulated Antarctic precipitation and surface mass balance at the end of the twentieth and twenty-first centuries, Clim. Dynam., 28, 215–230, 2007. a
Krinner, G., Beaumet, J., Favier, V., Deque, M., and Brutel-Vuilmet, C.: Empirical run-time bias correction for Antarctic regional climate projections with a stretched-grid AGCM, J. Adv. Model. Earth Sy., 11, 64–82, 2019. a
Lemonnier, F., Madeleine, J.-B., Claud, C., Genthon, C., Durán-Alarcón, C., Palerme, C., Berne, A., Souverijns, N., van Lipzig, N., Gorodetskaya, I. V., L'Ecuyer, T., and Wood, N.: Evaluation of CloudSat snowfall rate profiles by a comparison with in situ micro-rain radar observations in East Antarctica, The Cryosphere, 13, 943–954, https://doi.org/10.5194/tc-13-943-2019, 2019. a
Lemonnier, F., Chemison, A., Krinner, G., Madeleine, J.-B., Claud, C., and Genthon, C.: Evaluation of coastal Antarctic precipitation in LMDz6 global atmospheric model using ground-based radar observations, Arctic and Antarctic Research, 67, 147–164, 2021. a
Lenaerts, J. T., Fyke, J., and Medley, B.: The signature of ozone depletion in recent Antarctic precipitation change: A study with the Community Earth System Model, Geophys. Res. Lett., 45, 12931–12939, 2018. a
Maahn, M. and Kollias, P.: Improved Micro Rain Radar snow measurements using Doppler spectra post-processing, Atmos. Meas. Tech., 5, 2661–2673, https://doi.org/10.5194/amt-5-2661-2012, 2012. a, b, c, d
Madeleine, J.-B., Hourdin, F., Grandpeix, J.-Y., Rio, C., Dufresne, J.-L., Vignon, E., Boucher, O., Konsta, D., Cheruy, F., Musat, I., Idelkadi, A., Fairhead, L., Millour, E., Lefebvre, M.-P., Mellul, L., Rochetin, N., Lemonnier, F., Touzé-Peiffer, L., and Bonazzola, M.: Improved representation of clouds in the atmospheric component LMDZ6A of the IPSL-CM6A Earth system model, J. Adv. Model. Earth Sy., 12, e2020MS002046, https://doi.org/10.1029/2020MS002046, 2020. a
Matrosov, S. Y.: Modeling backscatter properties of snowfall at millimeter wavelengths, J. Atmos. Sci., 64, 1727–1736, 2007. a
Matrosov, S. Y., Campbell, C., Kingsmill, D., and Sukovich, E.: Assessing snowfall rates from X-band radar reflectivity measurements, J. Atmos. Ocean. Tech., 26, 2324–2339, 2009. a, b
Medley, B. and Thomas, E.: Increased snowfall over the Antarctic Ice Sheet mitigated twentieth-century sea-level rise, Nat. Clim. Change, 9, 34–39, 2019. a
Naaim-Bouvet, F., Bellot, H., Nishimura, K., Genthon, C., Palerme, C., Guyomarc'h, G., and Vionnet, V.: Detection of snowfall occurrence during blowing snow events using photoelectric sensors, Cold Reg. Sci. Technol., 106, 11–21, 2014. a
Nishimura, K. and Nemoto, M.: Blowing snow at Mizuho station, Antarctica, Philos. T. Roy. Soc. A, 363, 1647–1662, 2005. a
Nitu, R., Roulet, Y.-A., Wolff, M., Earle, M., Reverdin, A., Smith, C., Kochendorfer, J., Morin, S., Rasmussen, S., Wong, K., Alastrué, J., Arnold, L., Baker, B., Buisán, S., Collado, J., Colli, M., Collins, B., Gaydos, A., Hannula, H.-R., Hoover, J., Joe, P., Kontu, A., Laine, T., Lanza, L., Lanzinger, E., Lee, G., Lejeune, Y., Leppänen, L., Mekis, E., Panel, J.-M., Poikonen, A., Ryu, S., Sabatini, F., Theriault, J., Yang, D., Genthon, C., van den Heuvel, F., Hirasawa, F. N., Konishi, H., Motoyoshi, H., Nakai, S., Nishimura, K., Senese, A., and Yamashita, K.: WMO Solid Precipitation Intercomparison Experiment (SPICE) (2012–2015), World Meteorological Organization, http://hdl.handle.net/20.500.11765/10839, 2018. a
Palerme, C., Kay, J. E., Genthon, C., L'Ecuyer, T., Wood, N. B., and Claud, C.: How much snow falls on the Antarctic ice sheet?, The Cryosphere, 8, 1577–1587, https://doi.org/10.5194/tc-8-1577-2014, 2014. a, b, c
Pedregosa, F., Varoquaux, G., Gramfort, A., Michel, V., Thirion, B., Grisel, O., Blondel, M., Prettenhofer, P., Weiss, R., Dubourg, V., Vanderplas, J., Passos, A., Cournapeau, D., Brucher, M., Perrot, M., and Duchesnay, E.: Scikit-learn: Machine Learning in Python, J. Mach. Learn. Res., 12, 2825–2830, 2011. a
Peters, G., Fischer, B., and Andersson, T.: Rain observations with a vertically looking Micro Rain Radar (MRR), Boreal Environ. Res., 7, 353–362, 2002. a
Planat, N., Gehring, J., Vignon, É., and Berne, A.: Identification of snowfall microphysical processes from Eulerian vertical gradients of polarimetric radar variables, Atmos. Meas. Tech., 14, 4543–4564, https://doi.org/10.5194/amt-14-4543-2021, 2021. a, b
Pörtner, H.-O., Roberts, D., Tignor, M., Poloczanska, E., Mintenbeck, K., Alegría, A., Craig, M., Langsdorf, S., Löschke, S., Möller, V., Okem, A., and Rama, B.: Climate Change 2022: Impacts, Adaptation, and Vulnerability. Contribution of Working Group II to the Sixth Assessment Report of the Intergovernmental Panel on Climate Change, Cambridge University Press, https://doi.org/10.1017/9781009325844.001, 2022. a
Roussel, M.-L., Wiener, V., Genthon, C., Vignon, E., Bazile, E., Agosta, C., Berne, A., Durán-Alarcón, C., Dufresne, J.-L., and Claud, C.: Assessing the simulation of snowfall at Dumont d'Urville, Antarctica, during the YOPP-SH special observing campaign, Q. J. Roy. Meteor. Soc., 149, 1391–1406, https://doi.org/10.1002/qj.4463, 2023. a, b, c, d, e, f, g
Scarchilli, C., Ciardini, V., Grigioni, P., Iaccarino, A., De Silvestri, L., Proposito, M., Dolci, S., Camporeale, G., Schioppo, R., Antonelli, A., Baldini, L., Roberto, N., Argentini, S., Bracci, A., and Frezzotti, M.: Characterization of snowfall estimated by in situ and ground-based remote-sensing observations at Terra Nova Bay, Victoria Land, Antarctica, J. Glaciol., 66, 1006–1023, 2020. a, b, c, d, e
Schoger, S. Y., Moisseev, D., von Lerber, A., Crewell, S., and Ebell, K.: Snowfall-rate retrieval for k-and w-band radar measurements designed in hyytiälä, finland, and tested at ny-Ålesund, svalbard, Norway, J. Appl. Meteorol. Clim., 60, 273–289, 2021. a, b, c
Seefeldt, M. W., Low, T. M., Landolt, S. D., and Nylen, T. H.: Remote and autonomous measurements of precipitation for the northwestern Ross Ice Shelf, Antarctica, Earth Syst. Sci. Data, 13, 5803–5817, https://doi.org/10.5194/essd-13-5803-2021, 2021. a
Souverijns, N., Gossart, A., Lhermitte, S., Gorodetskaya, I. V., Kneifel, S., Maahn, M., Bliven, F. L., and van Lipzig, N. P.: Estimating radar reflectivity-Snowfall rate relationships and their uncertainties over Antarctica by combining disdrometer and radar observations, Atmos. Res., 196, 211–223, 2017. a, b, c
Sugiura, K., Yang, D., and Ohata, T.: Systematic error aspects of gauge-measured solid precipitation in the Arctic, Barrow, Alaska, Geophys. Res. Lett., 30, 1192, https://doi.org/10.1029/2002GL015547, 2003. a
Thomas, E. R., van Wessem, J. M., Roberts, J., Isaksson, E., Schlosser, E., Fudge, T. J., Vallelonga, P., Medley, B., Lenaerts, J., Bertler, N., van den Broeke, M. R., Dixon, D. A., Frezzotti, M., Stenni, B., Curran, M., and Ekaykin, A. A.: Regional Antarctic snow accumulation over the past 1000 years, Clim. Past, 13, 1491–1513, https://doi.org/10.5194/cp-13-1491-2017, 2017. a
Turner, J., Chenoli, S. N., Abu Samah, A., Marshall, G., Phillips, T., and Orr, A.: Strong wind events in the Antarctic, J. Geophys. Res.-Atmos., 114, D18103, https://doi.org/10.1029/2008JD011642, 2009. a
Turner, J., Phillips, T., Thamban, M., Rahaman, W., Marshall, G. J., Wille, J. D., Favier, V., Winton, V. H. L., Thomas, E., Wang, Z., van den Broeke, M., Hosking, J. S., and Lachlan-Cope, T.: The dominant role of extreme precipitation events in Antarctic snowfall variability, Geophys. Res. Lett., 46, 3502–3511, 2019. a
Vignon, E., Hourdin, F., Genthon, C., Van de Wiel, B. J., Gallee, H., Madeleine, J.-B., and Beaumet, J.: Modeling the dynamics of the atmospheric boundary layer over the Antarctic Plateau with a general circulation model, J. Adv. Model. Earth Sy., 10, 98–125, 2018. a
Vignon, É., Picard, G., Durán-Alarcón, C., Alexander, S. P., Gallée, H., and Berne, A.: Gravity wave excitation during the coastal transition of an extreme katabatic flow in Antarctica, J. Atmos. Sci., 77, 1295–1312, 2020. a
Vignon, É., Roussel, M.-L., Gorodetskaya, I., Genthon, C., and Berne, A.: Present and future of rainfall in Antarctica, Geophys. Res. Lett., 48, e2020GL092281, https://doi.org/10.1029/2020GL092281, 2021. a
Wiener, V.: Ze-S relation computation, GitLab [code], https://gitlab.in2p3.fr/valentin.wiener/ze-s-relation-mrr.git, last access: 21 October 2023. a
Wiener, V., Genthon, C., and Berne, A.: 7 years of Micro Rain Radar (METEK MRR-2) data at the Dumont d'Urville station, coastal Adélie Land, Antarctica, PANGAEA [data set], https://doi.org/10.1594/PANGAEA.962727, 2023. a, b