the Creative Commons Attribution 4.0 License.
the Creative Commons Attribution 4.0 License.
 | 06 Feb 2024
Long-term monthly 0.05° terrestrial evapotranspiration dataset (1982–2018) for the Tibetan Plateau
Ling Yuan
Cunbo Han
Binbin Wang
Weiqiang Ma
Evapotranspiration (ET) plays a crucial role in the water balance of the Tibetan Plateau (TP), often referred to as the “Asian water tower” region. However, accurately monitoring and comprehending the spatial and temporal variations of ET components (including soil evaporation Es, canopy transpiration Ec, and intercepted water evaporation Ew) in this remote area remains a significant challenge due to the limited availability of observational data. This study generates a 37-year dataset (1982–2018) of monthly ET components for the TP using the MOD16-STM (MOD16 soil texture model). This model utilizes up-to-date soil properties, meteorological data, and remote sensing datasets. The estimated ET results strongly correlate with measurements from nine flux towers, demonstrating a low root mean square error of 13.48 mm per month, a mean bias of 2.85 mm per month, a coefficient of determination of 0.83, and an index of agreement of 0.92. The annual average ET for the entire TP, defined as elevations higher than 2500 m, is approximately 0.93(± 0.037) × 103 Gt yr−1. The predominant contributor to ET on the TP is Es, accounting for 84 % of the total ET. Our findings reveal a noteworthy upward trend in ET in most central and eastern parts of the TP, with a rate of approximately 1–4 mm yr−1 (p<0.05) and a significant downward trend with rates between −3 and 1 mm yr−1 in the northwestern part of TP during the period from 1982 to 2018. The average annual increase in ET for the entire TP over the past 37 years is approximately 0.96 mm yr−1. This upward trend can be attributed to the TP's warming and wetting climate conditions. The MOD16-STM ET dataset demonstrates a reliable performance across the TP compared to previous research outcomes. This dataset is valuable for research on water resource management, drought monitoring, and ecological studies. The entire dataset is freely accessible through the Science Data Bank (https://doi.org/10.11922/sciencedb.00020, Ma et al., 2021) and the National Tibetan Plateau Data Center (TPDC) (https://doi.org/10.11888/Terre.tpdc.271913, Yuan, 2021).
- Article
(15918 KB) - Full-text XML
- BibTeX
- EndNote


The Tibetan Plateau (TP) (24–40∘ N, 70–105∘ E) is often referred to as the “Asian water tower”, owing to its distinctive geographical and ecological characteristics, as acknowledged in studies by Immerzeel et al. (2010, 2020), Yao et al. (2012), and Xu et al. (2019). Within this region, evapotranspiration (ET) plays a vital role in the overall water balance. The TP predominantly features grassland (covering more than 47 % of the area) and sparse vegetation or bare soil (surrounding over 33 %), as indicated by the Moderate Resolution Imaging Spectroradiometer (MODIS) land cover dataset (MCD12C1) (Fig. 1c). Arid or semi-arid conditions mostly characterize this vast expanse. The TP is currently undergoing significant changes in its hydrological cycle, driven by global warming, as documented in studies by Yang et al. (2014), Kuang and Jiao (2016), and Zohaib et al. (2017). Nevertheless, accurately monitoring the spatial and temporal fluctuations in ET on the TP remains a formidable challenge due to the intricate environmental conditions of the TP. Moreover, understanding how ET patterns on the TP will evolve in the context of global warming is essential for assessing the impacts of these changes on the local population's livelihoods.
In recent years, various datasets for estimating ET on the TP have been developed, including the complementary relationship (CR) model (Ma et al., 2019; G. X. Wang et al., 2020), the surface energy balance system (SEBS) model (Chen et al., 2014, 2021; Zhong et al., 2019; Han et al., 2017, 2021), and the Penman–Monteith model with remote sensing (RS-PM) (Wang et al., 2018; Song et al., 2017; Chang et al., 2018; Ma and Zhang, 2022). However, a considerable variance exists among these TP ET products (Peng et al., 2016; Baik et al., 2018; Li et al., 2018; Khan et al., 2018). Studies have utilized eddy-covariance measurements (Shi and Liang, 2014; You et al., 2017; Yang et al., 2019; Ma et al., 2020) and reanalysis datasets (Shi and Liang, 2014; Dan et al., 2017; Yang et al., 2019; de Kok et al., 2020) to investigate ET on the TP. A recent study by Han et al. (2021) produced the region's 18-year ET dataset (2001–2018). Enhancements of the canopy conduction algorithm in the Penman–Monteith model have led to improved ET estimates in previous research (Leuning et al., 2010; Zhang et al., 2010; Li et al., 2015; Y. Zhang et al., 2016, 2019; Gan et al., 2018). However, these ET products tend to perform poorly in TP areas with sparse vegetation and arid to semi-arid climates (Zhang et al., 2010; Li et al., 2014b; Song et al., 2017; Baik et al., 2018; Li et al., 2018; Khan et al., 2018).
The limitations of the MOD16 Penman–Monteith model in arid to semi-arid TP regions are primarily due to its failure to consider the dominant role of topsoil texture and topsoil moisture in governing Es processes (Yuan et al., 2021). Accurately separating and validating ET components on the TP remains challenging, even though total ET estimates tend to align across different products (Lawrence et al., 2007; Blyth and Harding, 2011; Miralles et al., 2016). The TP is primarily characterized by short and sparse vegetation, and soil moisture is crucial in ET estimation for this region. Several studies have used the Penman–Monteith algorithm to estimate ET on the TP (Wang et al., 2018; Ma and Zhang, 2022). However, these studies have not accounted for the effects of soil moisture (SM) on evaporation resistance and stomatal conductance.
The enhanced Penman–Monteith model, MOD16-STM (MOD16 soil texture model), has been developed to address these limitations. MOD16-STM redefines the modules for Es to consider the impacts of SM on soil evaporation resistance. This modification is based on eddy-covariance (EC) observations conducted on the TP (Yuan et al., 2021), offering a promising opportunity to estimate ET components in this region accurately. Es often dominates ET in sparsely vegetated areas, especially in arid and semi-arid regions with large bare soil areas (Wilcox et al., 2003; Kool et al., 2014; Wang et al., 2018; Ma et al., 2015a, b; Ma and Zhang, 2022). Previous studies have highlighted that 20 % to 40 % of global ET is attributed to Es (Lawrence et al., 2007; Schlesinger and Jasechko, 2014; Wei et al., 2017). Bare soil surface evaporation is a rapid process influenced by shallow surface water (Koster and Suarez, 1996). Es is primarily controlled by water diffusion in the soil (Good et al., 2015; Yuan et al., 2021). Accurately quantifying and separating Es is crucial for enhancing our understanding of water and energy cycles on the TP. However, quantifying ET and its components remains challenging due to the influence of atmospheric demand, soil moisture conditions, and complex interactions between heterogeneous vegetation and soil properties (Merlin et al., 2016; Wu et al., 2017; Philips et al., 2017; Lehmann et al., 2018). MOD16-STM holds the potential to generate a remote sensing Es and ET component dataset covering the satellite era since 1980. In this study, the MOD16-STM model, acknowledging its limitations, was employed to estimate a long-term ET and ET components dataset spanning 37 years (1982–2018) (Yuan et al., 2021).
A preferable approach involves directly estimating ET based on topsoil moisture, significantly impacting the TP's surface water exchange. Thus, leveraging the advantages of the MOD16-STM model for ET estimation on the TP, this study aimed to achieve two main objectives: (1) develop a 37-year (1982–2018) monthly ET dataset for the TP at a 0.05∘ × 0.05∘ spatial resolution and (2) quantify the spatial distribution and spatiotemporal variability of ET and its components across the TP.
2.1 Study area
The Tibetan Plateau, located between 25–40∘ N and 74–104∘ E, spans approximately 2.5×10⁶ km2 and consists of land above 2500 m in altitude (Fig. 1a). This region, as indicated by the FAO drought index dataset, represents the largest landform unit in Eurasia and encompasses hyper-arid, arid, semi-arid, and sub-humid climate zones (Fig. 1b). The land cover types primarily include mixed forests, grasslands, bare soil, glaciers, and snow-covered areas (see Fig. 1c). The topsoil predominantly consists of sandy loam, loam, and clay (Fig. 1d). The annual average temperature in the region ranges from approximately −3.1 to 4.4 ∘C. Average annual precipitation gradually increases from less than 50 mm in the northwest to over 1000 mm in the southeast, with the most precipitation occurring during summer (Ding et al., 2017). Over time, the TP has undergone significant environmental changes (Chen et al., 2015), including increased precipitation, decreased wind speed (wind), fewer snow days, reduced radiation, thawing permafrost, glacier melting, and increased vegetation (Kang et al., 2010; Yao et al., 2012; Yang et al., 2014; Kuang and Jiao, 2016; Bibi et al., 2018; Chen et al., 2019).
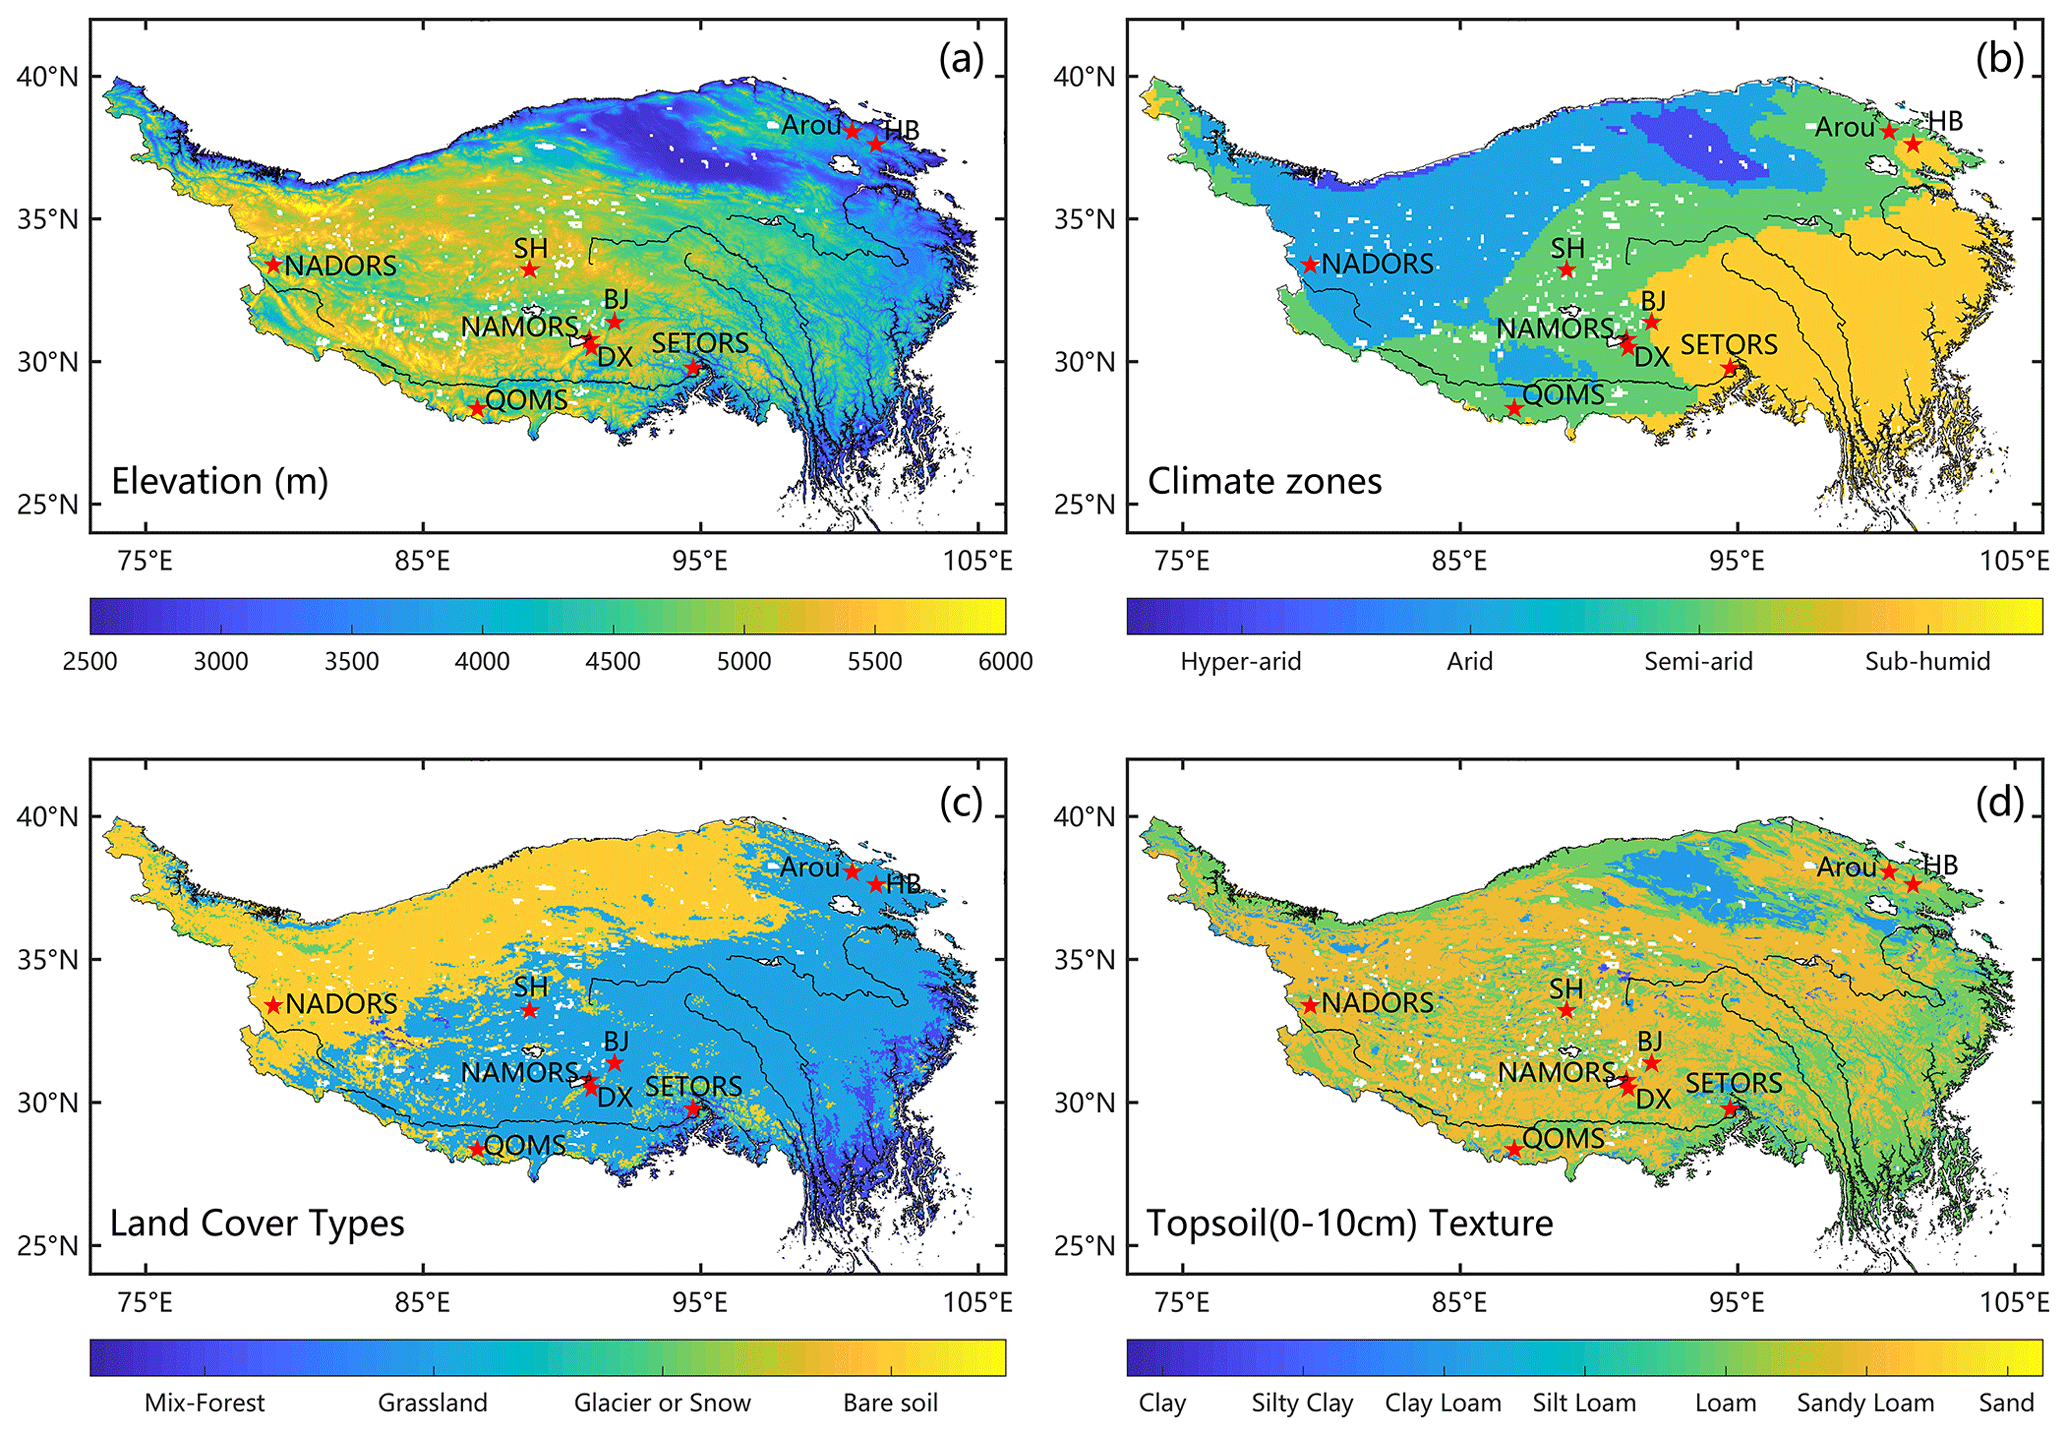
Figure 1Maps of the (a) topography (STRM), (b) climate zones (FAO aridity index), (c) land cover types (MCD12C1), and (d) soil textures (HWSD) in the study area. The red dots indicate the flux site locations.
2.2 Generation of a long-term series of monthly ET products
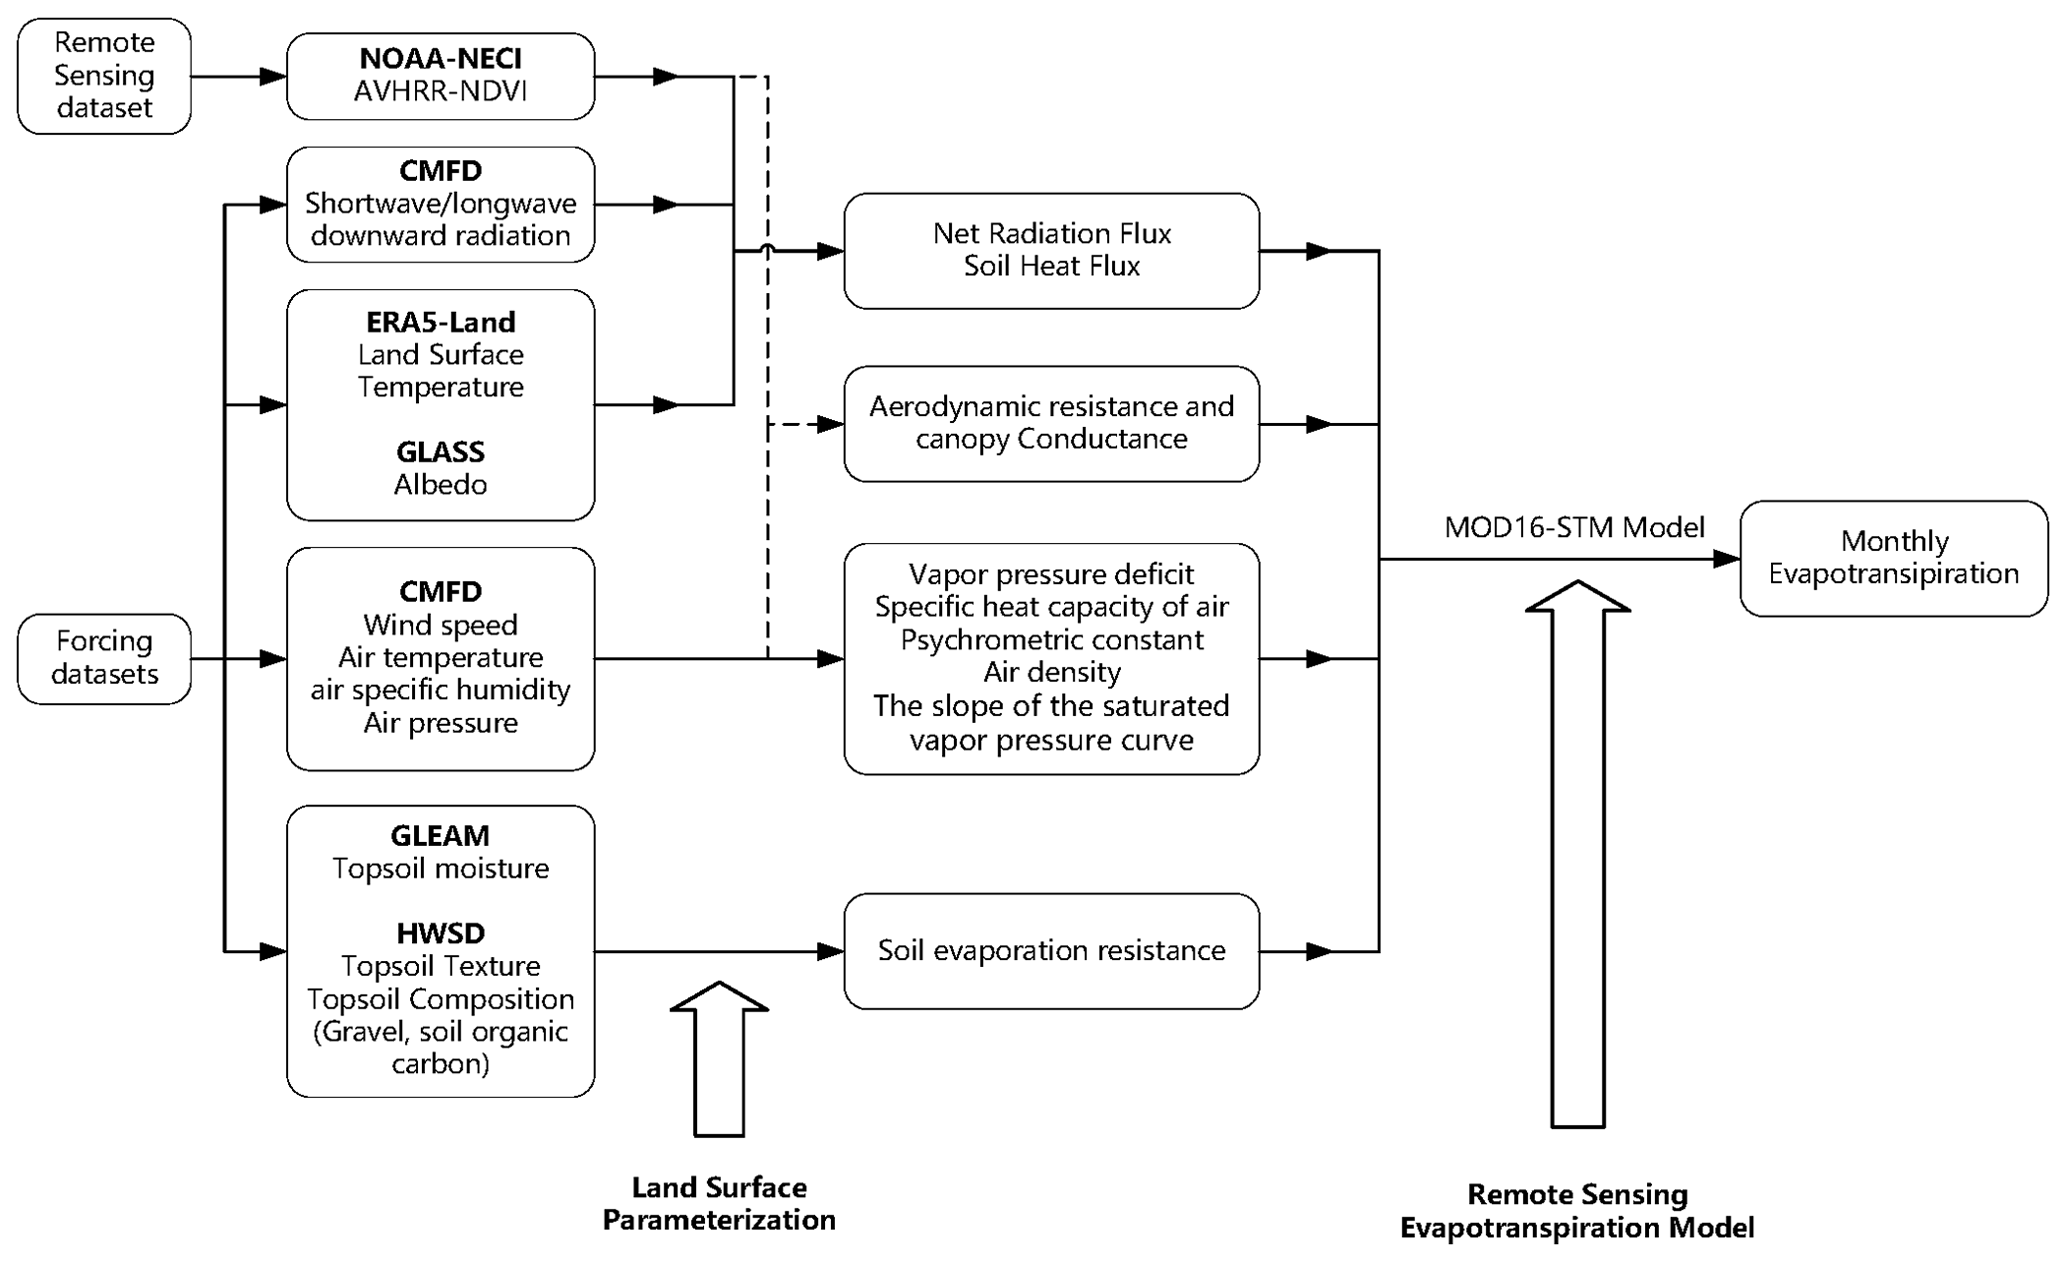
This study introduces a novel dataset comprising a long-term series of monthly ET generated using the MOD16-STM model. The process of calculating monthly ET with the MOD16-STM model and the associated driving datasets is illustrated in Fig. 2.
2.2.1 Description of MOD16-STM ET model
The MOD16-STM model computes the ET components using the Penman–Monteith equation as follows (Monteith, 1965; Mu et al., 2007, 2011):
The total ET combines three distinct components: Ec,Es, and Ew (wet surface evaporation). For a more detailed explanation of the calculations for Ewet_s (evaporation from wet soil) and Ewet_c (evaporation from wet canopy), you can refer to Yuan et al. (2021). Here, ra (s m−1) is the aerodynamic resistance, rc (s m−1) is the aerodynamic resistance of water vapor of the canopy, and rs (s m−1) is the surface (or canopy) resistance. Yuan et al. (2021) optimized MOD16 ra based on the Monin–Obukhov similarity theory (MOST) and calibrated the empirical values of rc for grassland underlying surfaces. They also pointed out that the topsoil moisture content directly affects the value of rs, indirectly influencing the Es process. Therefore, this study extended this optimization algorithm from the site scale to the regional scale. The variables used in the above equations are defined as follows:
-
Rn represents the net radiation flux (W m−2).
-
G0 denotes the soil heat flux (W m−2).
-
ρa is the density of the air (kg m−3).
-
Cp stands for the specific heat capacity of the air (J kg−1 K−1).
-
VPD represents the vapor pressure deficit (hPa).
-
Δ represents the slope of the saturated vapor pressure curve (hPa K−1).
-
γ is the psychrometric constant (hPa K−1), calculated as , where λ is the latent heat of vaporization (J kg−1), and Ma and Mw are the molecular masses of dry air and wet air, respectively.
-
ra signifies the aerodynamic resistance (s m−1).
-
rs represents the surface (or canopy) resistance (s m−1).
-
Fwet is the relative surface wetness.
-
The vegetation cover fraction (fc) is estimated using the NDVI (Normalized Difference Vegetation Index):
Rn and G0 are calculated as follows:
Here, SWD is the downward shortwave radiation, α is land surface albedo, LWD is the downward longwave radiation, σ represents the Stefan–Boltzmann constant (5.67×10⁻⁸ W m−2 K−4), ε is emissivity, and LST is the land surface temperature. Ic (= 0.05) and Is (= 0.315) are the ratios of ground heat flux and net radiation for surfaces with full vegetation cover (Su, 2002) and bare soil (determined by NDVI < 0.25 in this study) (Yuan et al., 2021), respectively. When the air temperature (Ta) is below 5 ∘C, photosynthesis and transpiration processes are not active, and, therefore, Ec is not considered in the calculations. When the land surface temperature is below 0 ∘C, the sublimation equation is derived by modifying the surface energy balance equation using the Clausius–Clapeyron equation, accounting for the equilibrium of water vapor in both liquid and frozen states. It is important to note that this study did not estimate the evaporation from water surfaces. Previous research has extensively examined water surface evaporation from lakes on the Tibetan Plateau in detail (Wang et al., 2020). Therefore, this study focuses on land ET estimation, excluding water surface evaporation.
Numerous prior studies have employed optimized conductance to estimate Ec (Jarvis, 1976; Irmak and Mutiibwa, 2010; Zhang et al., 2010; Leuning et al., 2010; Li et al., 2013, 2015), as well as Es (Sun, 1982; Camillo and Gurney, 1986; Sellers et al., 1996; Sakaguchi and Zeng, 2009; Ortega-Farias et al., 2010; Tang and Riley, 2013). This study computed the ra using the MOST (Thom, 1972; Liu et al., 2007).
where k represents von Karman's constant (0.41), zh and zm denote the measurement heights for Ta and wind, and d0 represents the displacement height. The stability correction functions for momentum (ψm) and heat transfer (ψh) can be computed using universal parts. These correction terms' mathematical expressions (Eqs. 8–12) are as follows (Högström, 1996; Paulson, 1970).
For stable conditions,
For unstable conditions,
For neutral conditions,
In Eqs. (8)–(11), the following variables and parameters are defined: , , y= (1–)0.5, and yo= (1–11.6 )0.5 (Högström, 1996; Paulson, 1970). Here, L represents the Obukhov length (m), calculated as (kg T∗), where g=9.8 m s−2, T∗ is the fractional temperature (K), and u∗ denotes the friction velocity (m s−1). T∗ is further defined as , where θs can be approximated using the LST, and . The parameterization of u∗ and L has been successfully applied in previous studies on the TP (Chen et al., 2013). z0h represents the roughness length for heat transfer (m). A parameterization scheme for z0h developed by Yang et al. (2008) has been widely utilized in remote sensing land surface fluxes and land surface models (LSMs) across the TP (Biermann et al., 2014; Chen et al., 2013; Ma et al., 2015a). This scheme has also been employed in the current study for consistency.
where v is the fluid kinematic viscosity, v=1.328 × 10, P0=1013 hPa, and T0=273.15 K. The roughness height for momentum transfer (z0m) was determined based on canopy height (hc), following the method outlined by Chen et al. (2013). The water saturation degree of surface soil (SM) is utilized to impose soil classification and soil texture constraints on the rs and Es estimates (Yuan et al., 2021), as follows:
Here, the parameters a and b are empirical coefficients that vary based on different soil textures, as documented in Table 1. The estimation of θsat, which considers soil organic content (SOC) and gravel content, can be obtained using the Soc-Vg scheme (Chen et al., 2012; Zhao et al., 2018), and its calculation is as follows:
where θsat,m represents the porosity of the mineral soil and can be calculated as .489–0.00126⋅ %sand (Cosby et al., 1984). Additionally, θsat,sc is the porosity of the SOC. It is assumed to be 0.9 m3 m−3 in this study, as per the work of Farouki (1981) and Letts et al. (2000). The variables Vsoc and Vg denote the volumetric fractions of the SOC and gravel, respectively, and their calculation is as follows:
In these equations, ρp represents the mineral particle density and is set at 2700 kg m−3, while ρsoc is the bulk density of organic matter, maintained at 130 kg m−3. Also, msoc and mg denote the percentages of organic matter and gravel within the topsoil layer.
There are many parameters in Eqs. (7)–(17). Some parameters have already been assessed for their importance in ET estimation by Yuan et al. (2021). There are too many studies on investigating the empirical parameters in Eqs. (7)–(13). We will not repeat these analyses again. The parameterization method of θsat in the estimation of rs in this study is composed of various empirical parameters (ρp, ρsoc, and θsat,sc) for different soil types. We have conducted a uncertainty analysis of the estimated θsat and sensitivity of its uncertainty to the changes of empirical parameters. The impact of the empirical parameters on the estimation of ET is illustrated in Fig. A1a–c. The results indicate that with a 20 % uncertainty range in the estimated parameters ρp, ρsoc, and θsat,sc for θsat, the loss in estimating ET is only below 3 %. Thus, the conclusion is drawn that the estimation of ET is not sensitive to uncertainty in the three parameters. Figure A2 also shows the accuracy of the estimated θsat by the method used in this paper. Additionally, a sensitivity analysis is conducted on the empirical parameters a and b for calculating rs. Keeping θsat and SM constant, rs exhibits exponential changes with variations in a and b, leading to significant fluctuations in the estimation of ET. Within a 20 % range of variation in a and b, the maximum loss in ET exceeded 50 % in Fig. A1d–e. Therefore, it is essential to perform significance tests on the fitting results of the empirical parameters a and b, as well as independent validation of the final ET estimates. The performance of soil surface resistance rs estimated by the MOD16-STM model at the site scale is demonstrated in Fig. 3. The observations at the 10 stations show that the soil surface resistance exponentially decreases with the increasing SM. The MOD16-STM has caught this exponential law. It has a coefficient of determination (R2) higher than 0.34, which may enable the model to estimate the TP ET reasonably.
This demonstrates that the parameterized method of θsat maintains a high level of consistency with the observed values. The sensitivity test show that the factors that have a significant impact on rs and ET are the topsoil moisture and soil organic matter content. Figure A3 present the impact of soil organic matter content on θsat and ET estimation at different soil types. Hereby, we have collected the most updated soil texture and soil moisture data to estimate the soil evaporation resistance.
Table 1Parameters a and b were based on different soil textures used to calculate surface soil resistances.
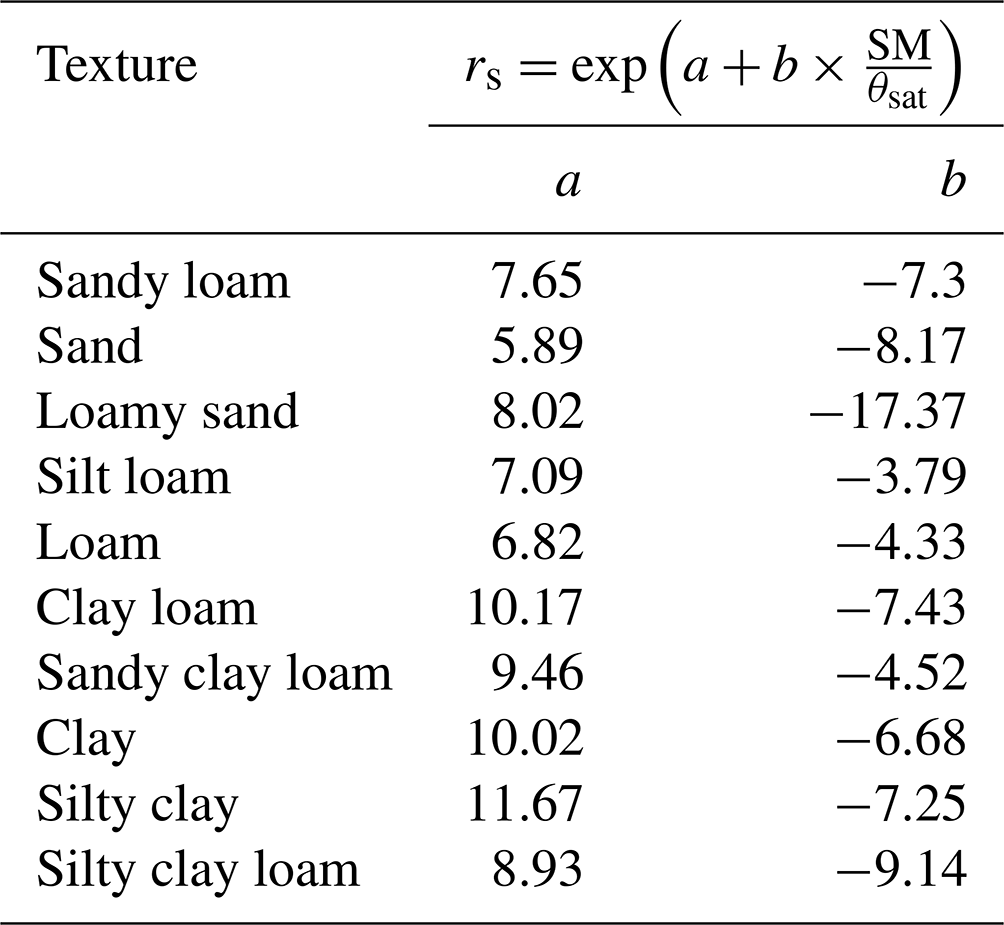
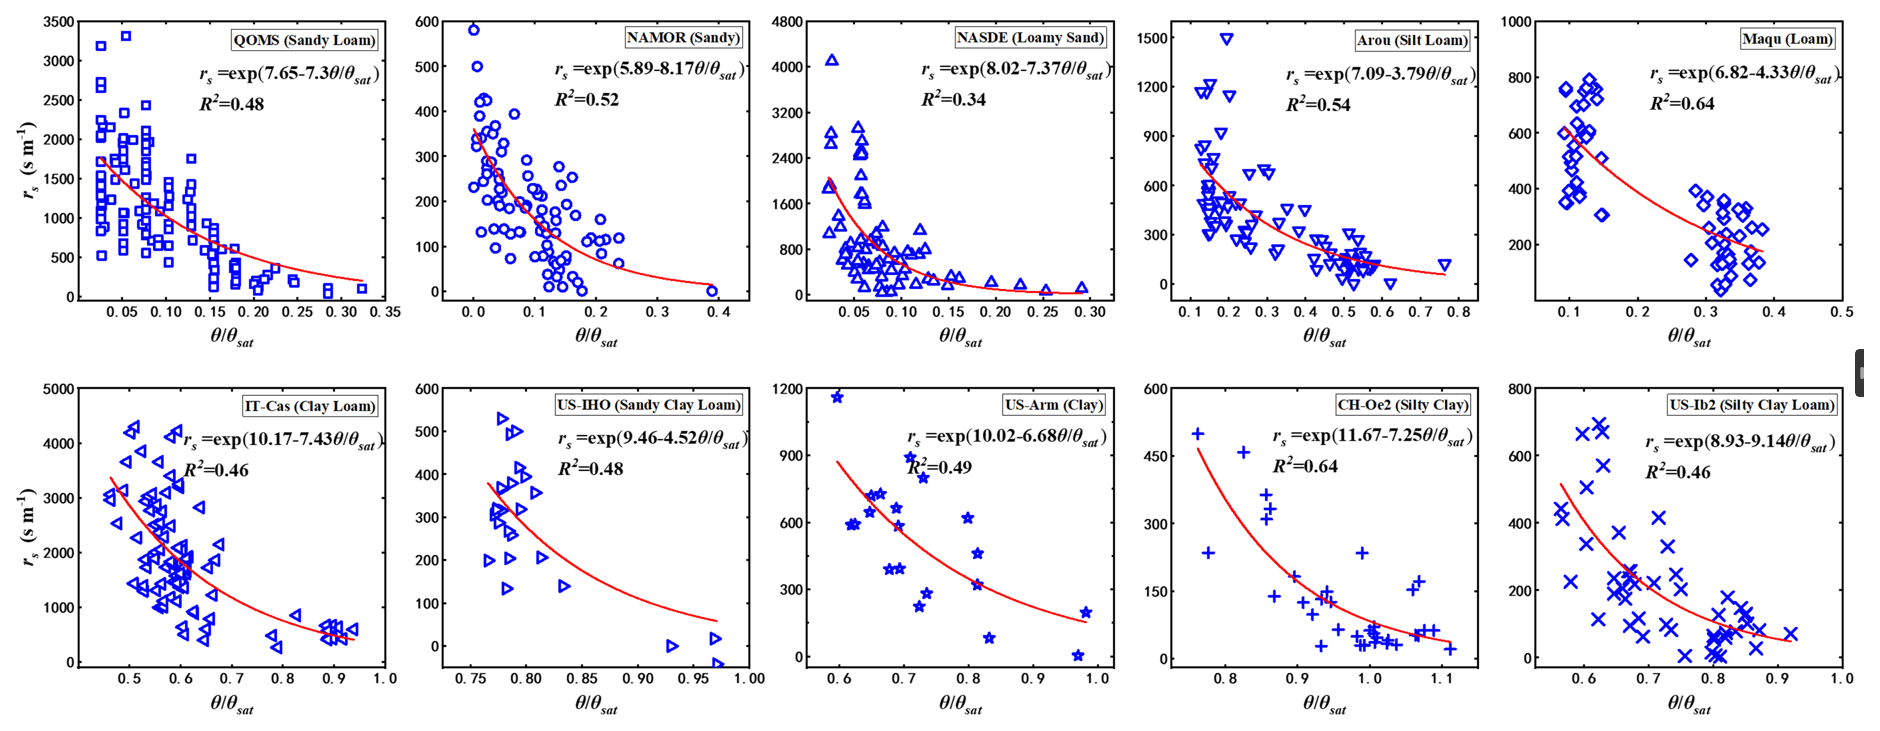
Figure 3The scatter point relationship between soil surface resistance (rs) and SM observed at QOMS (sandy loam), NAMOR (sandy), NASDE (loamy sand), Arou (silt loam), Maqu (loam), IT-CAS (clay loam), US-IHO (sandy clay loam), US-Arm (clay), CH-Oe2 (silty clay), and US-Ib2 (silty clay loam). The red curves show the equations used by the MOD16-STM model. The site information is given in Tables 3 and A1.
2.2.2 Input data for calculating the TP ET
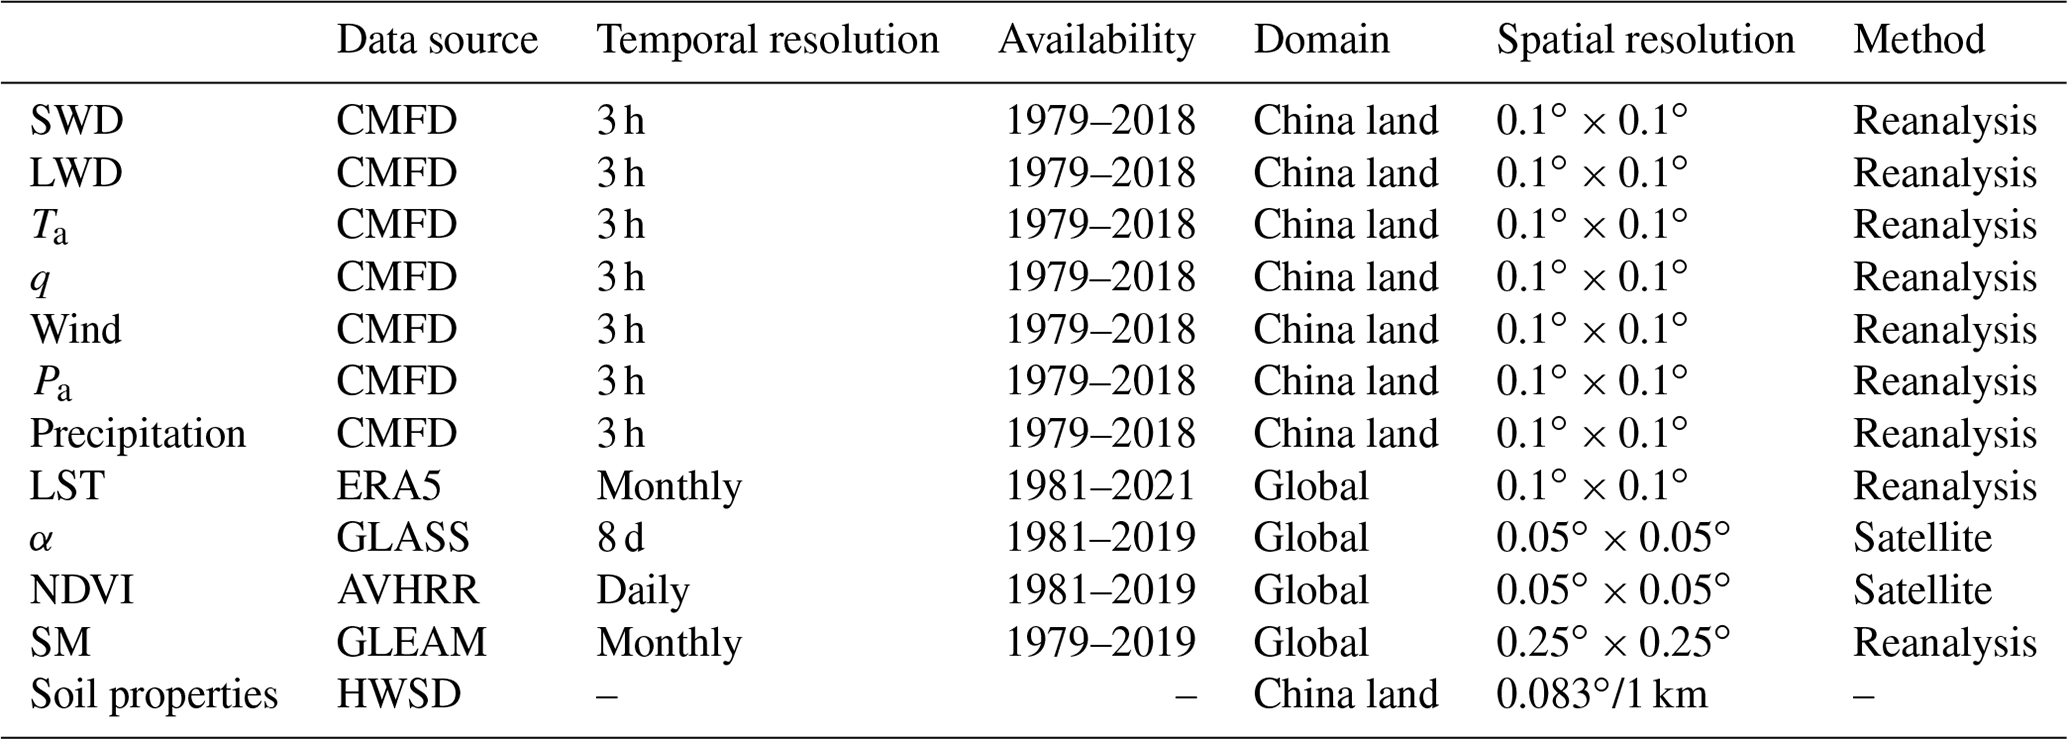
The MOD16-STM model relies on various remote sensing datasets, reanalysis datasets, and meteorological forcing datasets to estimate monthly ET across the TP. Specific datasets are carefully selected to minimize spatial and temporal gaps in the final product (Table 2). Here is a breakdown of the critical datasets and their sources:
-
Monthly meteorological forcing data, including wind, Ta, air specific humidity (q), Pa, SWD, and LWD, were obtained from the China Meteorological Forcing Dataset (CMFD) with a 0.1∘ spatial resolution from 1982–2018. This data source was accessed from the National Tibetan Plateau Data Center (Yang et al., 2010; He et al., 2020). CMFD can be downloaded from TPDC (https://data.tpdc.ac.cn/, last access: 1 February 2024).
-
LST and precipitation data were sourced from ERA5-Land, which provides data with a spatial resolution of 0.1∘ and a monthly temporal resolution. These datasets were obtained from the European Centre for Medium-Range Weather Forecasts (ECWMF).
-
Albedo (α) data, with a spatial resolution of 0.05∘ and an 8 d temporal resolution, were derived from the Global Land Surface Satellite (GLASS) dataset (Liang et al., 2021).
-
A long-term NDVI dataset, with a spatial resolution of 0.05∘ and daily temporal resolution, was acquired from the National Oceanic and Atmospheric Administration's National Centers for Environmental Information (NOAA-NCEI) (https://www.ncei.noaa.gov/products/climate-data-records/normalized-difference-vegetation-index, last access: 1 February 2024). This dataset calculates the canopy height and leaf area index (LAI) (Chen et al., 2013).
-
A topsoil moisture dataset for the 0–10 cm depth, with a spatial resolution of 0.25∘ and a monthly temporal resolution, was obtained from the Global Land Evaporation Amsterdam Model (GLEAM) (Miralles et al., 2011).
-
Upward longwave radiation (LWU) was derived from LST using the Stefan–Boltzmann law. The emissivity of mixed pixels was calculated based on the specific emissivity values for vegetated and bare land surfaces, following Sobrino et al. (2004).
-
Soil texture and soil property data were obtained from the Harmonized World Soil Database v1.2 (HWSD) (Wieder et al., 2014). These data were used to calculate soil evaporation resistance.
Daily and 8 d input data were averaged over the temporal scale to create monthly datasets to ensure consistency. The average value was considered invalid if the ratio of valid data in any given month was below 90 %. Additionally, the spatial resolutions of all input datasets were interpolated to a standard 0.05∘ spatial resolution using a widely used bilinear interpolation method.
Table 2Input datasets are used to calculate the ET on the Tibetan Plateau.
2.3 Validation methods
2.3.1 Model validation at site scale
Limited stations on the TP make it impossible to collect ET observations at all kinds of soil textures. We have collected datasets from 17 flux sites outside the TP (Table A1 in Appendix A). Five sites are used to verify the relationship between soil surface resistance and SM. This result is presented in Fig. 3. The other 12 verification sites include 10 different soil textures (sandy loam, sand, loamy sand, silt loam, loam, clay loam, sandy clay loam, clay, silty clay, and silty clay loam) and three surface cover types (grassland, evergreen forest, and cropland) (Table A1). These 12 sites are used to do model validation at the site scale. When evaluating the MOD16-STM at the site scale, the meteorological forcing data come from the station measurement. This helps us to minimize the simulation uncertainty due to the errors in the model forcing datasets. This methodology can allow us to diagnose the model's limitation in representing the evapotranspiration process. Figure A4 shows that MOD16-STM can capture the ET variations at the 12 sites. Table A2 also lists the statistical values of the daily ET estimation. Since these sites include all kinds of soil textures and different canopy covers, we believe the MOD16-STM model could be applied to the TP regional scale.
2.3.2 ET product evaluation
The remote sensing ET product is validated through comparison with flux tower observations on the TP. Table 3 lists details of nine flux stations on the TP used for the ET product evaluation. These stations belong to ChinaFLUX (Dang-Xiong site (DX), Hai-Bei site (HB), Yu et al., 2006; L. M. Zhang et al., 2019), the Tibetan Observation and Research Platform (TORP) (BJ, NADORS, SETORS, QOMS, NAMORS, and Shuang-Hu (SH), Ma et al., 2020), and the Heihe Watershed Allied Telemetry Experimental Research (HiWATER) (Arou, Liu et al., 2011, 2018; Che et al., 2019) networks. The nine stations are in areas with three different land cover types: alpine meadow, alpine steppe, and Gobi. Half-hourly flux data measured by eddy covariance from the nine stations are collected. It is important to note that the energy balance closure ratio (ECR) indicates whether the sum of sensible heat (H), latent heat (LE), and soil heat flux (G0) matches the Rn. Half-hourly data are screened and corrected accordingly to ensure the reliability of eddy-covariance measurements. Half-hourly LE data are corrected using the Bowen ratio energy balance correction method (Chen et al., 2014).
Table 3Details of the nine flux observation stations on the TP used for the ET product evaluation.
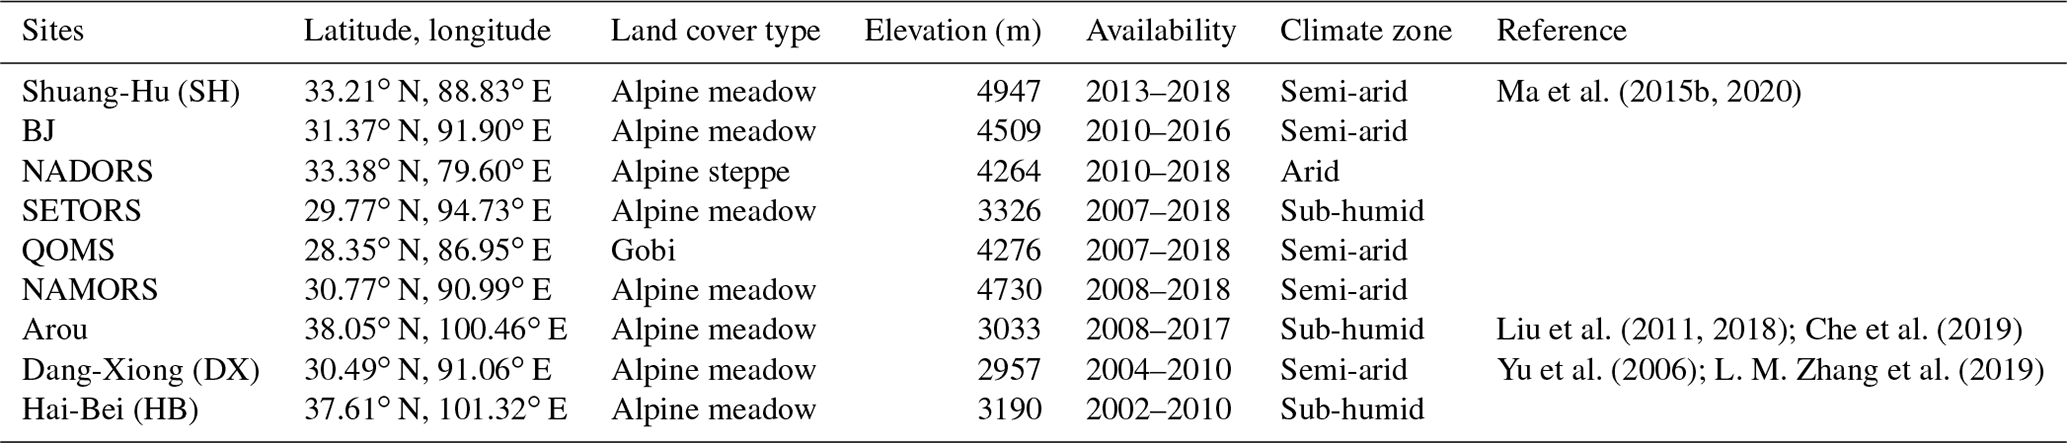
In the validation process, the half-hourly LEcor data obtained from all the flux sites are subjected to further processing, including conversion to daily and monthly averages, while employing a stringent quality control procedure. Daily values are null if derived from valid data points amounting to less than 80 % in a single day. Similarly, monthly average values are disregarded in the validation if they are derived from valid data points accounting for less than 80 % of observations for that month. This approach ensured the robustness of the validation process.
2.4 Accuracy metrics
The accuracy of the modeled ET was assessed by comparing the pixel values (Mi), corresponding to the latitude and longitude of the flux site, with the flux tower measurements (Gi). Several statistical metrics are employed for validation, including the coefficient of determination (R2), a measure of the proportion of the variance in the observed data (Gi) that is explained by the modeled data (Mi). A higher R2 value indicates a stronger linear relationship between the two datasets. The mean bias (MB) represents the average difference between the modeled ET (Mi) and the observed flux tower measurements (Gi). Positive MB values suggest overestimation by the model, while negative values indicate underestimation. The root mean square error (RMSE) measures the standard deviation of the differences between modeled and observed values (Mi−Gi). A smaller RMSE implies greater accuracy in the model's predictions. The index of agreement (IOA) indicates the degree of agreement between modeled and observed data, with a value of 1 indicating perfect agreement. Higher IOA values indicate better agreement between the two datasets. The equations for these parameters are as follows:
The subscript i denotes individual samples, and n is the total number of samples used in the assessment. The significance of each parameter helps evaluate the model's performance in estimating ET.
3.1 Evaluation of ET products against flux tower measurements
The reliability of remote-sensing-based ET estimates is often questioned without ground measurement verification. This study compares the simulated monthly ET rates from the 0.05∘ grid where each EC site is located with the flux tower observational data to validate the MOD16-STM ET results. The validation outcomes for monthly MOD16-STM ET, using flux tower data, are illustrated in Fig. 4. The modeled ET exhibits excellent performance and high consistency across the TP compared to ET observations.
Specifically, the grassland sites (SETORS, Arou, DX, and HB) display strong agreement, with R2 and IOA values exceeding 0.82 and 0.95, respectively. The NAMORS site has the lowest performance, with the highest RMSE (17.8 mm per month) and the lowest R2 and IOA (0.63 and 0.87, respectively). On average, the mean R2 and IOA values exceed 0.83 and 0.93, respectively. All R2 values pass the significance test at the p<0.05 level. The mean values of the absolute bias (| MB |) and RMSE values are less than 3 and 14 mm per month. It is important to note that positive MB values indicate an overestimation of ET, particularly during the dry season over barren land (QOMS, DX, SH, and NADORS) (Fig. 4). Conversely, underestimation occurs at higher ET rates in the summer, likely because the soil is close to saturation, leading to an overestimation of rsand underestimation of Es and ET. Generally, the time series of ET variations at the nine flux tower stations exhibit seasonal and annual periodic variations (Fig. 5). The site-scale validation results demonstrate that MOD16-STM ET provides accurate estimates in the TP region.
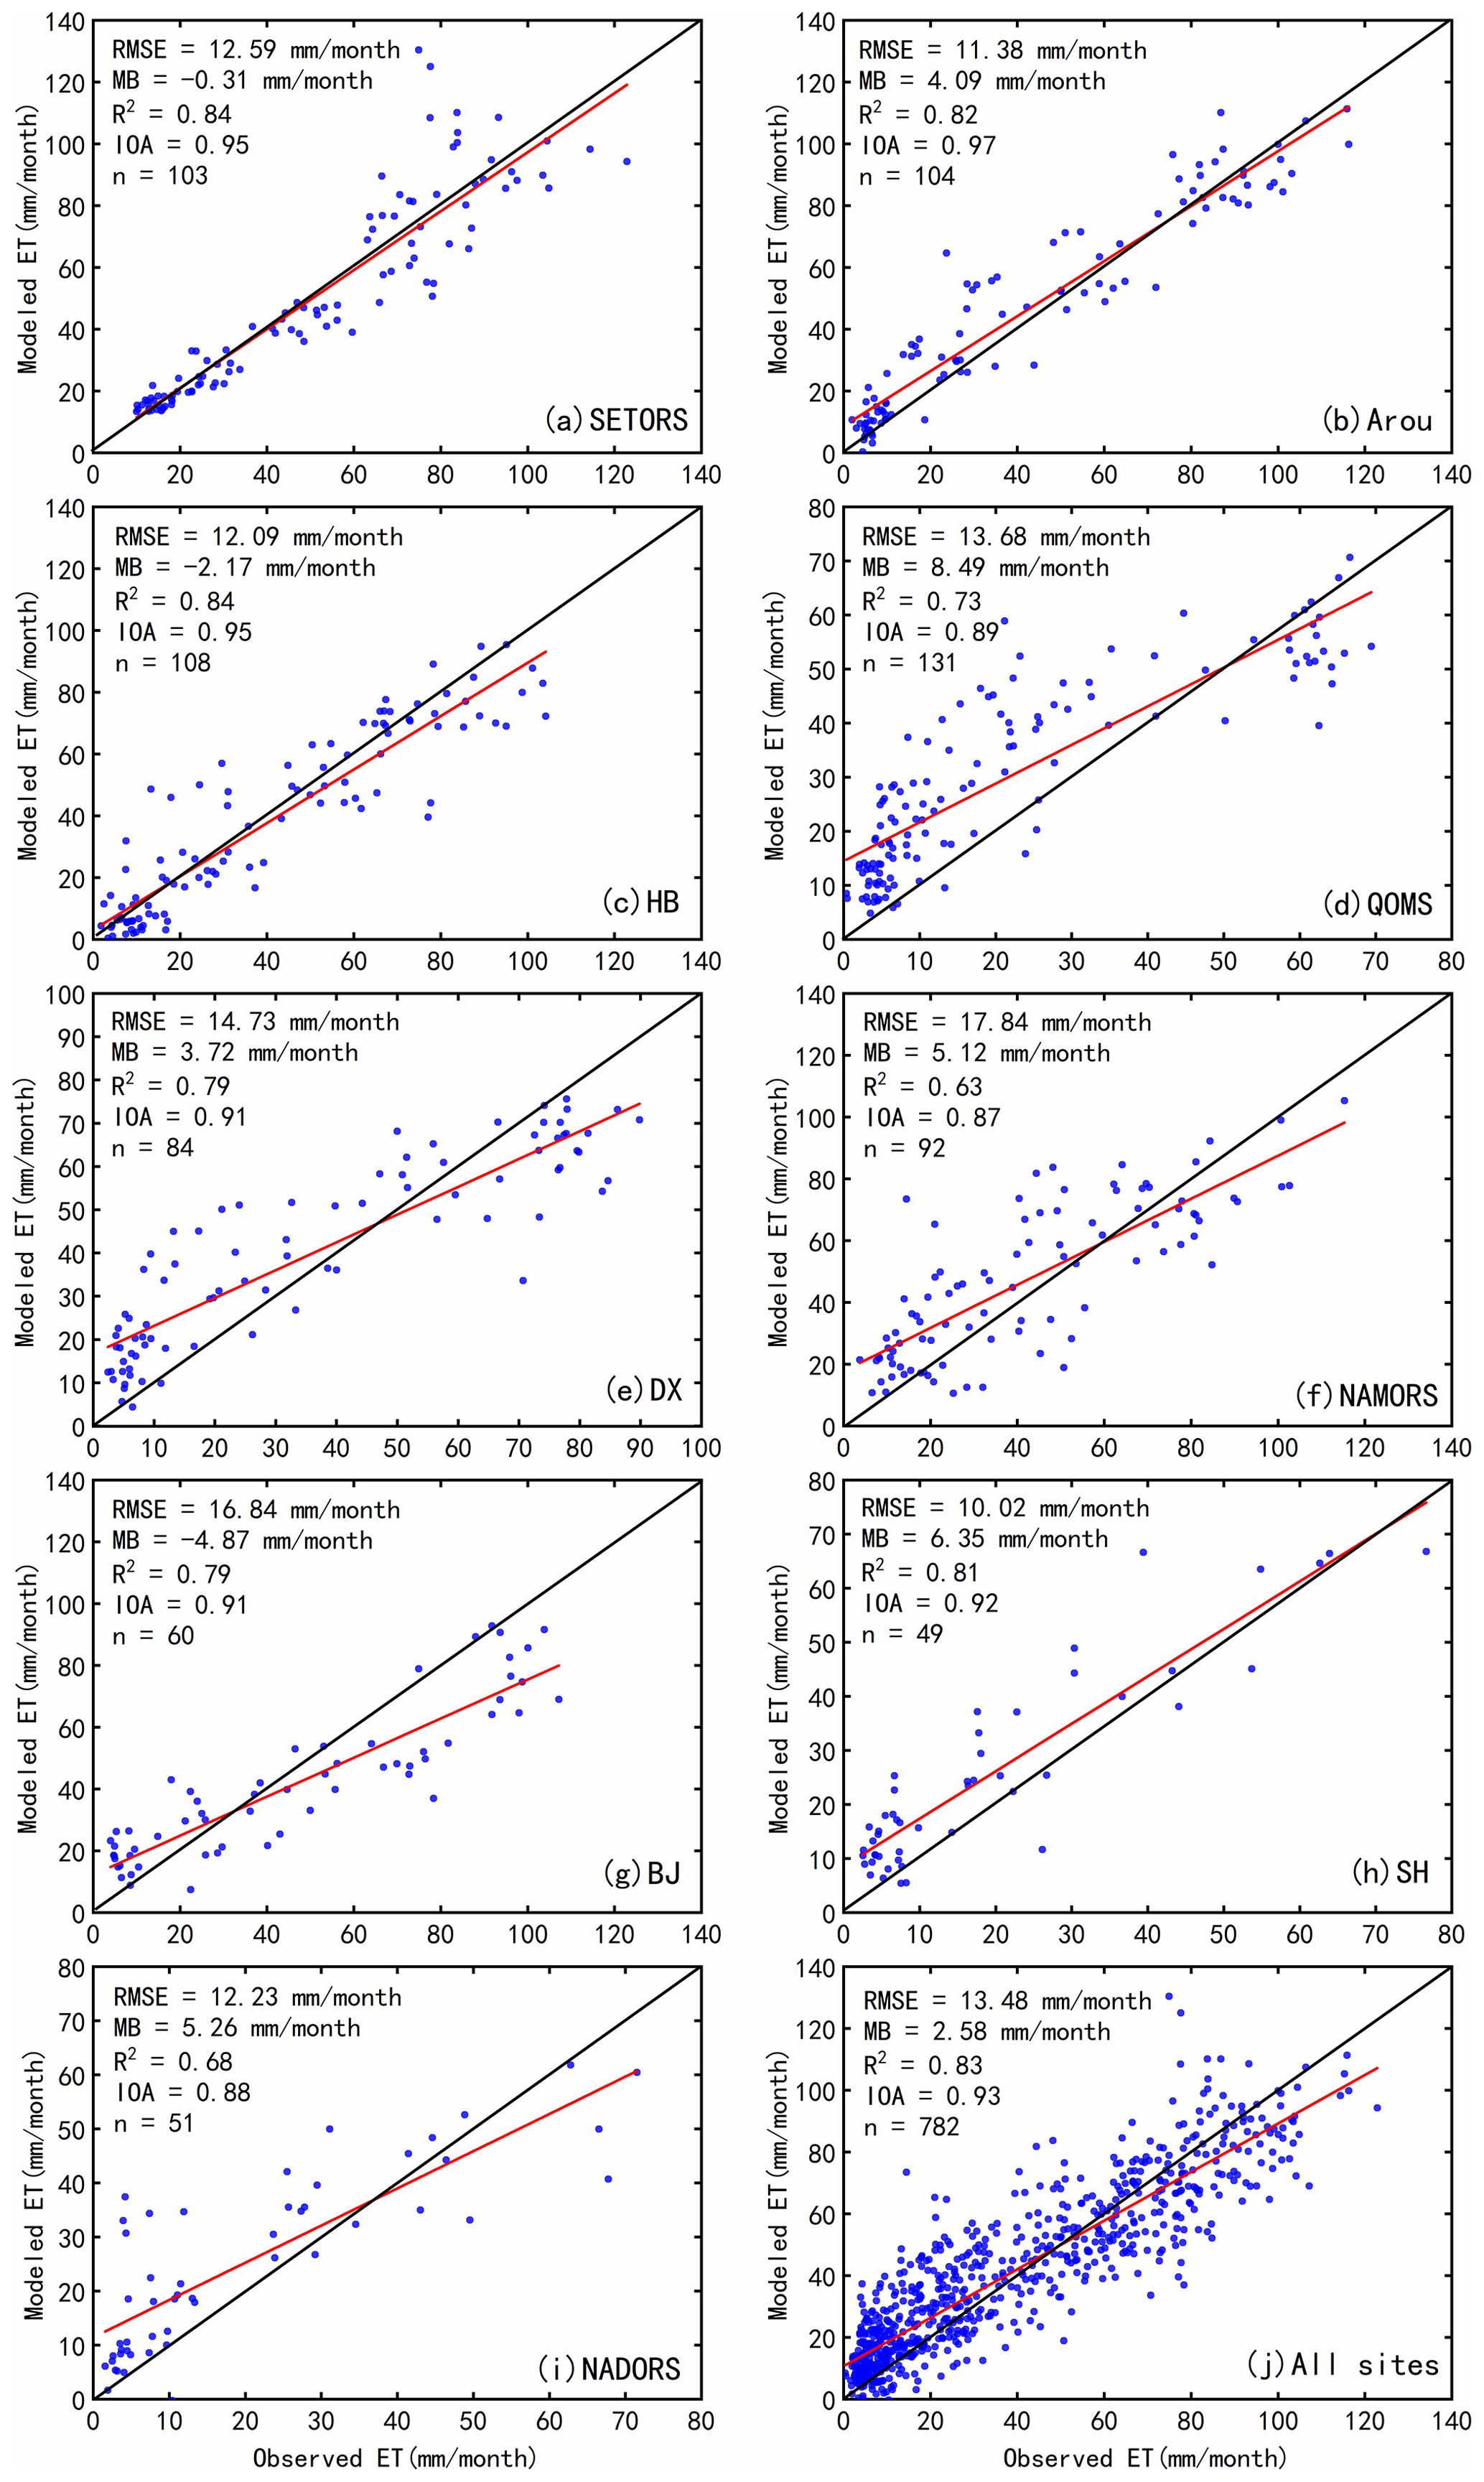
Figure 4The validation of the MOD16-STM monthly ET at (a) SETORS, (b) Arou, (c) HB, (d) QOMS, (e) DX, (f) NAMORS, (g) BJ, (h) SH, (i) NADORS, and (j) all sites.
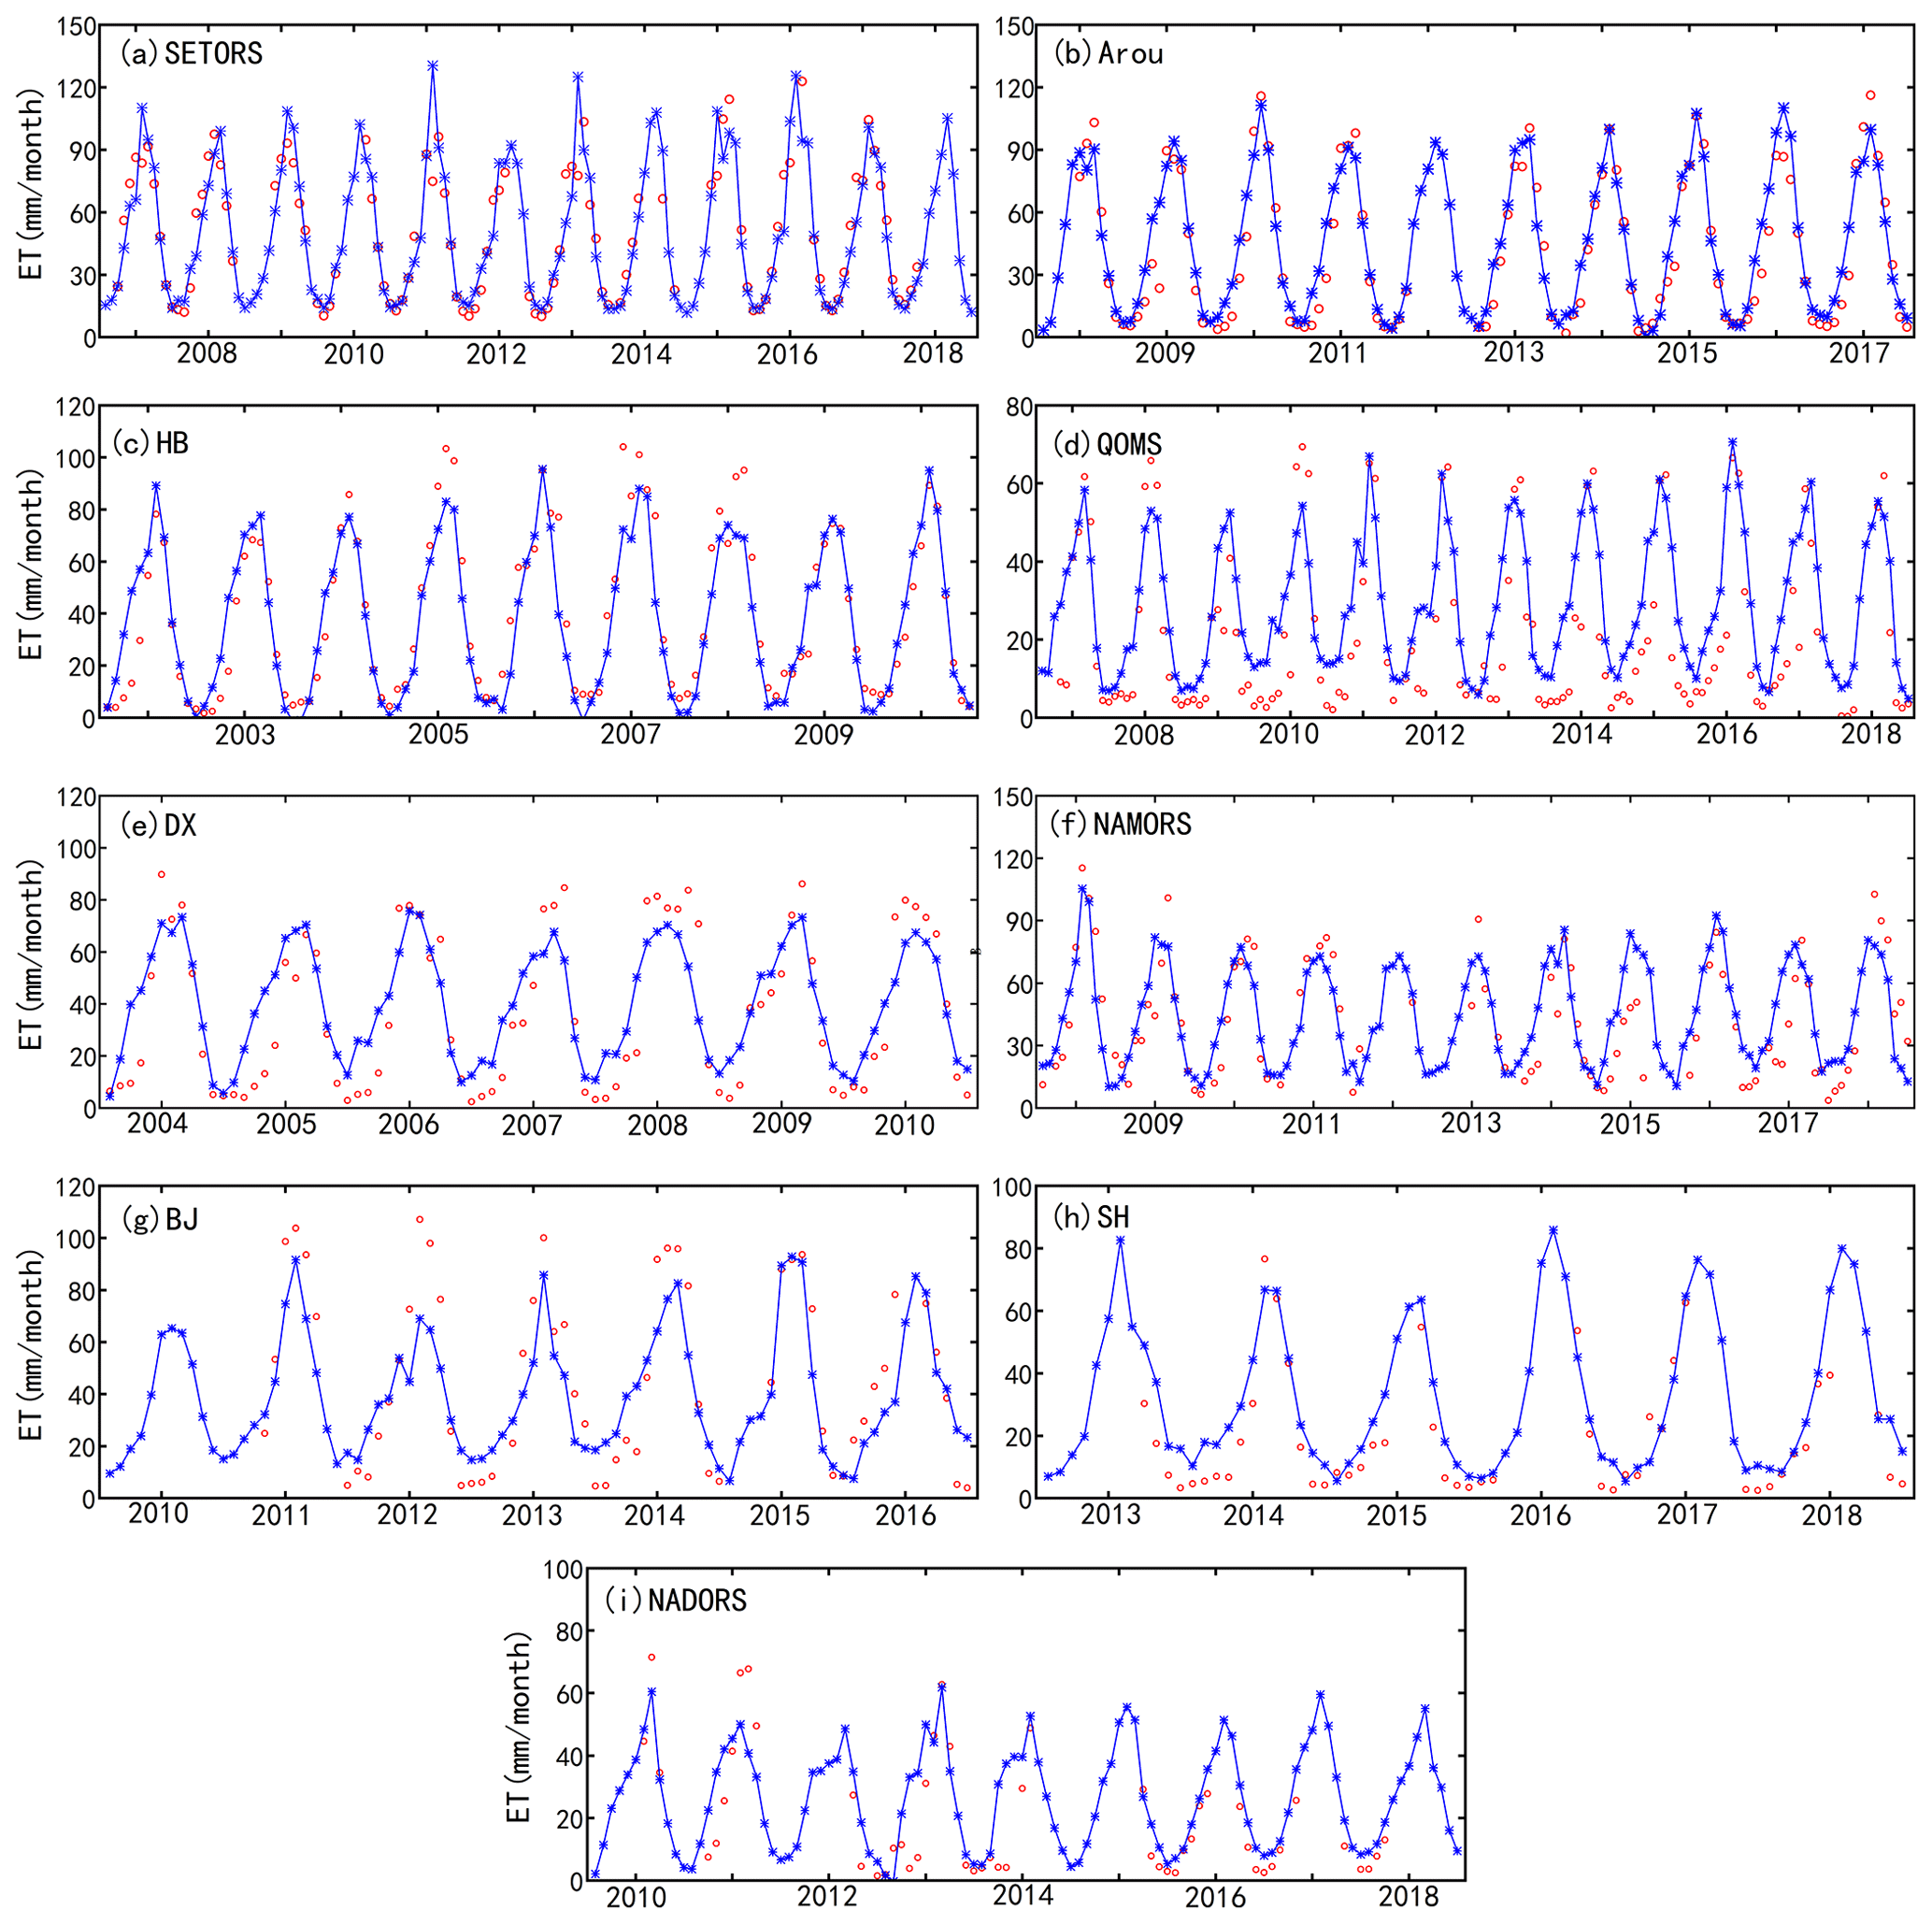
Figure 5Time-series variations in the MOD16-STM simulated ET (solid blue line with “*” marks) and flux-tower-observed ET (red circles) at (a) SETORS, (b) Arou, (c) HB, (d) QOMS, (e) DX, (f) NAMORS, (g) BJ, (h) SH, and (i) NADORS.
3.2 Spatial pattern of the multiyear averaged ET across TP
Figure 6 displays the spatial distribution of the average annual ET and its three components across the TP. ET exhibits a decreasing trend from southeast to northwest, with the highest values exceeding 1000 mm yr−1 in the southeastern TP (the Hengduan Mountains) and the lowest values of less than 100 mm yr−1 in the Qaidam Basin and northwestern TP. This spatial pattern of annual ET closely mirrored that of the aridity index (Fig. 1b), which is influenced by atmospheric demand and water supply. The sub-humid zone, covering approximately 32.9 % of the TP, contributes the highest proportion (43 % of the TP's total ET) compared to other climate zones. Es dominates the central and western TP, with its spatial distribution closely resembling the overall ET. The spatial distributions of Ec and Ew are in line with the distribution of vegetation. High values of Ec (> 200 mm yr−1) and Ew (> 50 mm yr−1) are primarily concentrated in densely vegetated areas such as the Hengduan Mountains in the southeastern TP.
The multiyear average ET for each season on the TP is depicted in Fig. 6, covering spring (March, April, and May), summer (June, July, and August), autumn (September, October, and November), and winter (December, January, and February). The estimated ET reflects the general seasonal patterns quite accurately. During spring, the average ET is higher than in autumn, ranging from 20 to 250 mm per month in spring and from 20 to 150 mm per month in autumn. This difference can be attributed to the increase in surface water generated by the thawing of permafrost and snow and ice melting as temperatures rise in spring, intensifying surface evaporation processes. Additionally, vegetation transpiration increases during the growing season. In summer, ET exceeds 200 mm per month over most TP, except for large areas in the northwestern TP where ET remains below 100 mm per month. Conversely, in winter, lower ET values are observed primarily in the densely vegetated southeastern region of the TP due to reduced water availability (precipitation) and lower Ta across the entire TP during this season.
Over the TP, the multiyear seasonal ET averages across the entire TP are as follows: 90.79 ± 3.16 mm yr−1 (0.23(± 0.0081) × 103 Gt yr−1) in spring, 152.05 ± 8.44 mm yr−1 (0.38(± 0.021) × 103 Gt yr−1) in summer, 71.96 ± 2.86 mm yr−1 (0.18(± 0.0074) × 103 Gt yr−1) in autumn, and 30.54 ± 1.85 mm yr−1 (0.077(± 0.0047) × 103 Gt yr−1) in winter. The multiyear average ET is 346.5 ± 13.2 mm yr−1, representing both the mean and standard deviation, which characterizes interannual variability. This corresponds to approximately 0.88(± 0.034) × 103 Gt yr−1. Among its components, Es accounted for 292.36 ± 10.39 mm yr−1 (0.74(± 0.027) × 103 Gt yr−1), Ec amounted to 47.85 ± 3.34 mm yr−1 (0.12(± 0.006) × 103 Gt yr−1), and Ew is 7.07 ± 2.89 mm yr−1 (0.02(± 0.001) × 103 Gt yr−1). Notably, Es constitutes the majority of ET on the TP, exceeding 84 %. Wang et al. (2020) accurately estimated that the water evaporated from all plateau lakes is 0.0517 Gt yr−1. Therefore, utilizing the area-weighted average method, the annual average water evaporation across the entire TP is approximately 0.93(± 0.037) × 103 Gt yr−1. Furthermore, the TP has an average annual rainfall of about 1.8 × 10³ Gt yr−1, estimated by Jiang et al. (2023). Approximately 53 % of the TP's precipitation returns to the atmosphere through ET (Zhang et al., 2020).
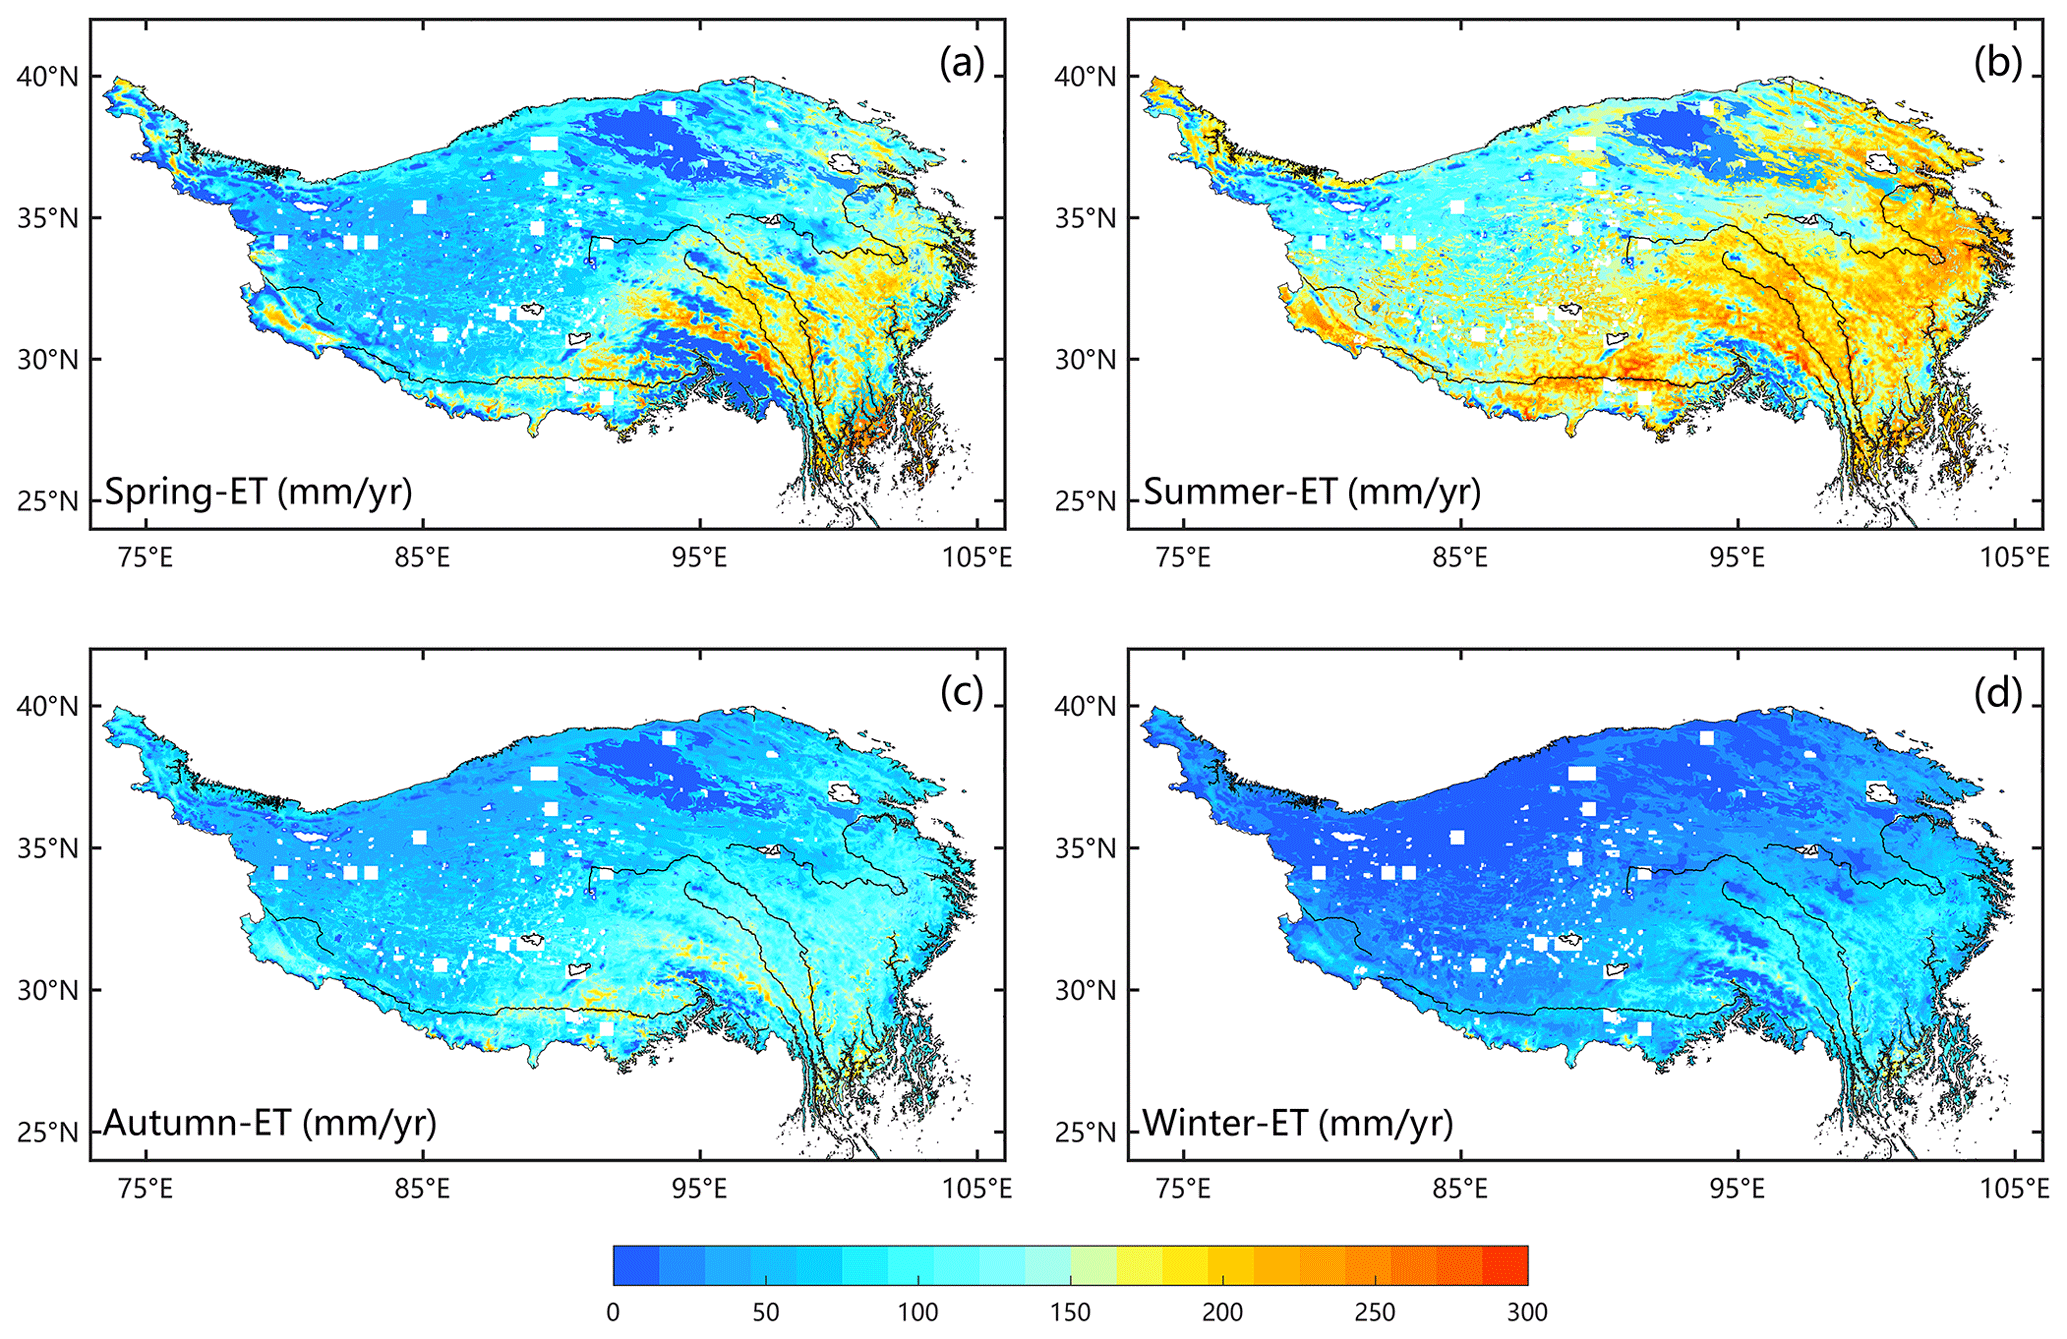
Figure 6Spatial distributions of the multiyear (1982–2016) mean seasonal ET in (a) spring, (b) summer, (c) autumn, and (d) winter across the TP.
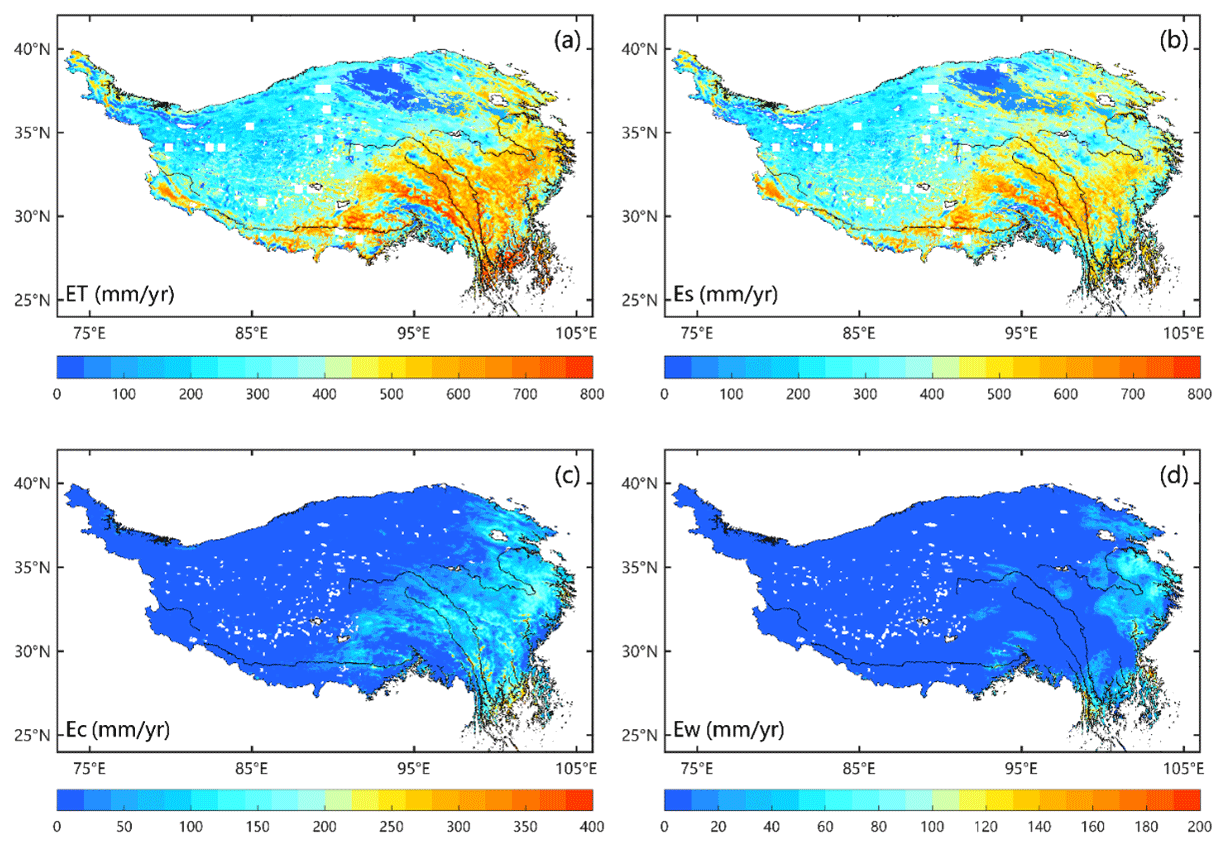
Figure 7Spatial pattern of the multiyear (1982–2018) mean annual (a) ET (evapotranspiration), (b) Es (soil evaporation), (c) Ec (canopy transpiration), and (d) Ew (intercepted water evaporation) across the TP.
3.3 Temporal variations in ET across TP
Quantifying variations in ET, both inter- and intra-annual, holds significant importance in understanding monsoon phenomena and studying climate change patterns on the TP. Figure 7 presents the spatial distribution of annual ET and its component trends from 1982 to 2018. These trends exhibit spatial heterogeneity across the TP. The annual ET has seen a significant increase, with rates ranging from 1 to 4 mm yr−1 (p<0.05), primarily in the central and eastern TP, encompassing more than 86 % of the TP. Conversely, there has been a notable decrease in annual ET, with rates ranging from −3 to −1 mm yr−1 in the northwestern TP. Similarly, the trends for Es mirror those of ET, albeit with slightly lower magnitudes (1–3 mm yr−1, p<0.05). Ec and Ew have shown slightly increasing trends of 0–2 mm yr−1 (p<0.05). When averaged across the entire TP, ET, Es, and Ec exhibited significant increases during the period from 1982 to 2018, with rates of 0.96 mm yr−1, 0.64 mm yr−1, and 0.44 mm yr−1, respectively (p<0.05; see Fig. 8). Seasonally, positive, and significant trends are observed in all seasons for ET (Fig. 9), with the strongest trends occurring in summer (0.46 mm yr−1). Furthermore, multisource ET products indicate that most regions of the TP have exhibited consistent ET changes over the past 30 years (Yin et al., 2013; Peng et al., 2016; Wang et al., 2018; Ma et al., 2019; G. X. Wang et al., 2020; Li et al., 2021; Ma and Zhang, 2022).
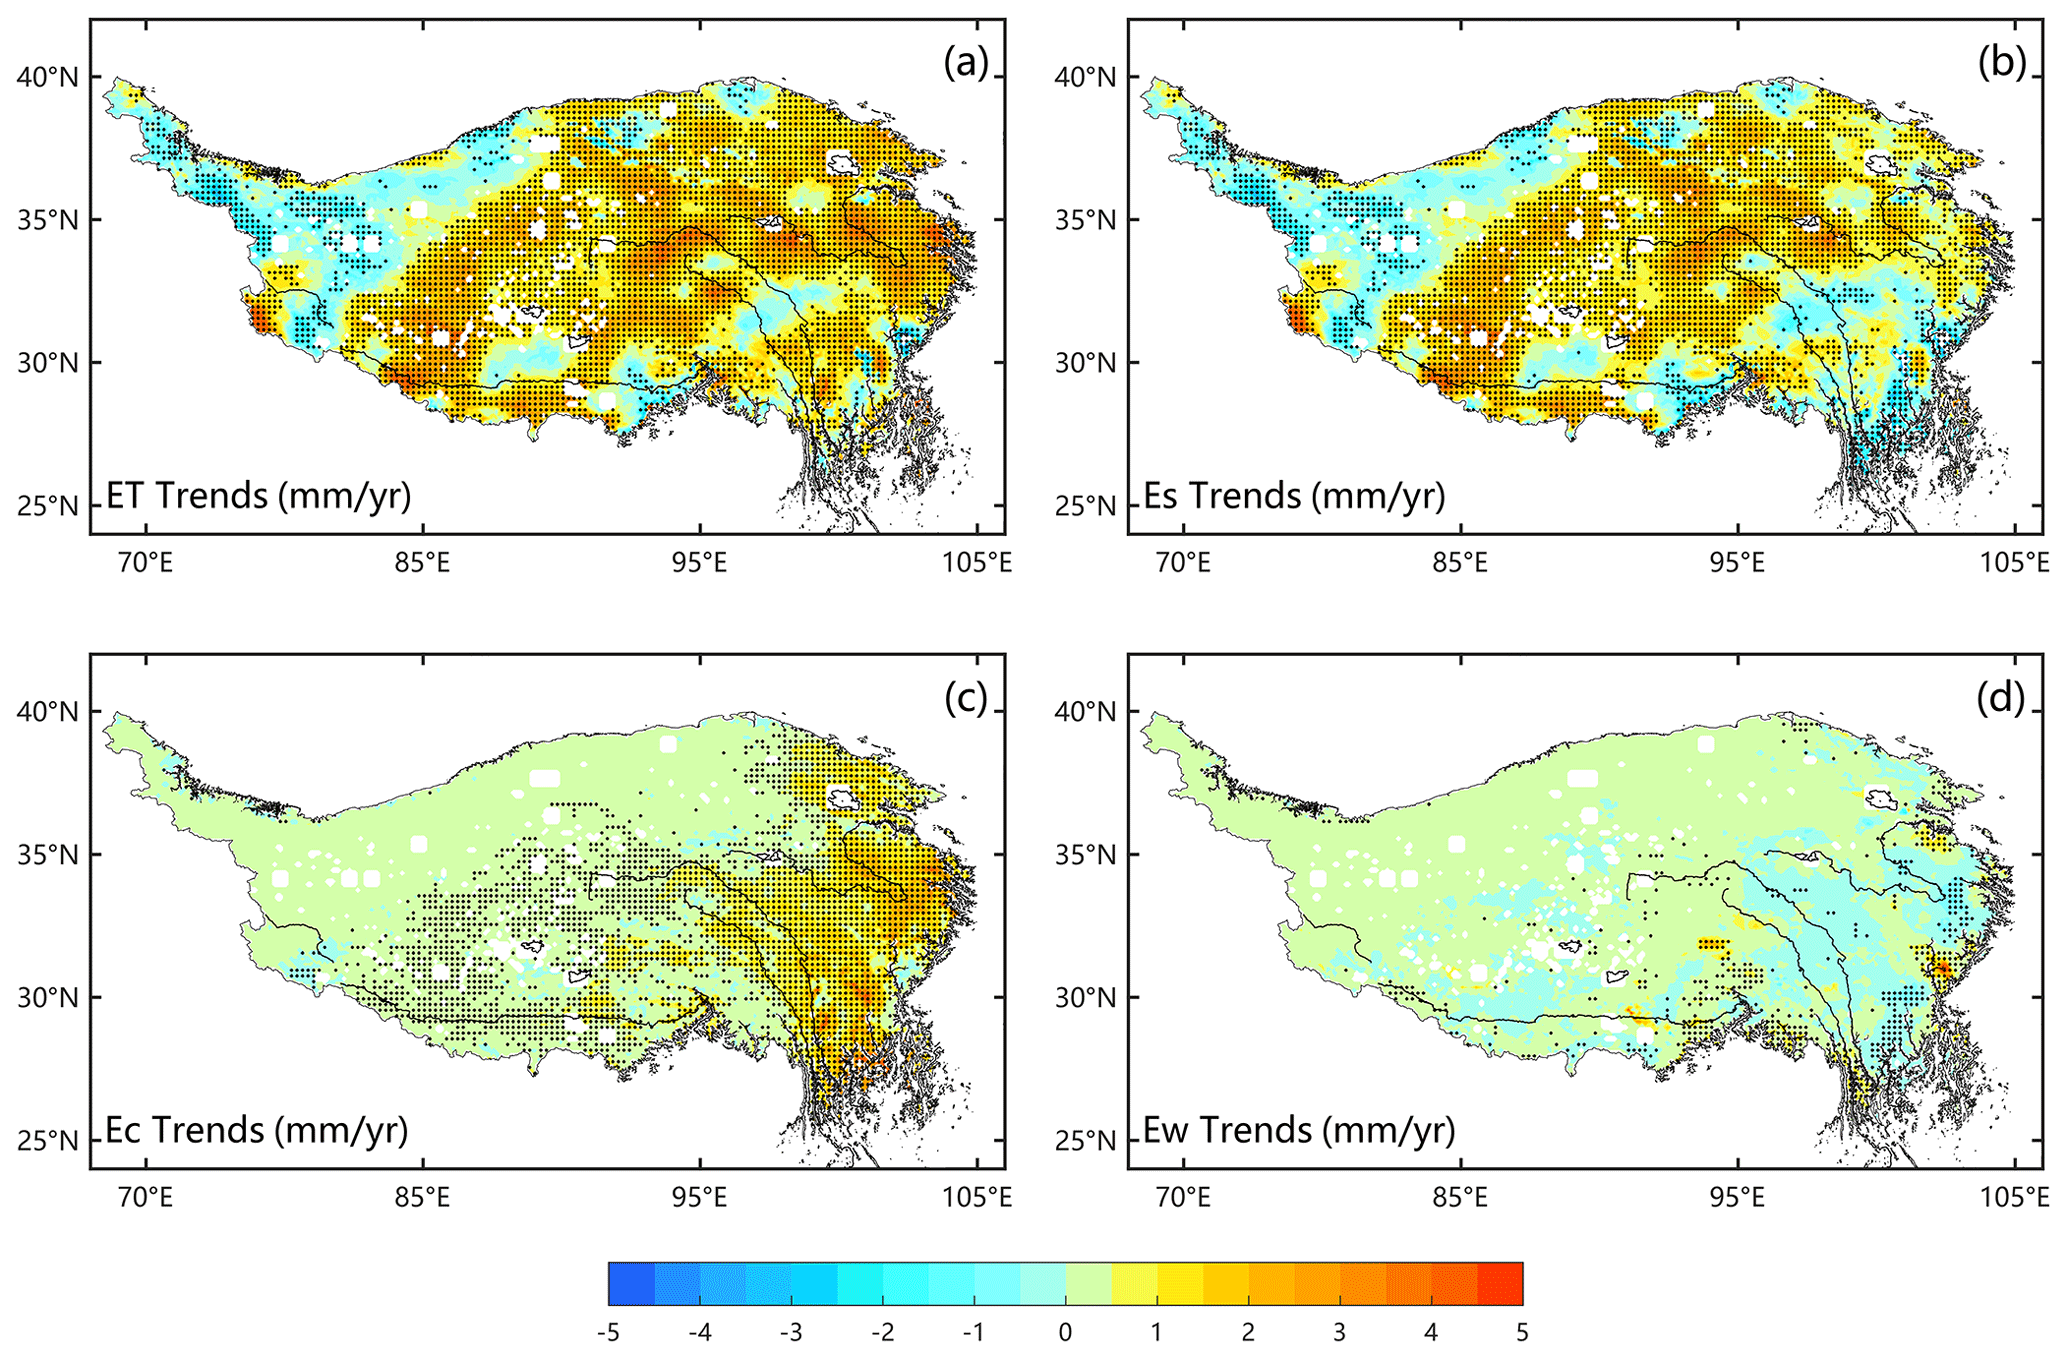
Figure 8Spatial patterns of the trends (1982–2018) of the annual (a) ET (evapotranspiration), (b) Es (soil evaporation), (c) Ec (canopy transpiration), and (d) Ew (intercepted water evaporation) across the TP. The stippling on the maps indicates the statistically significant trends (p<0.05).
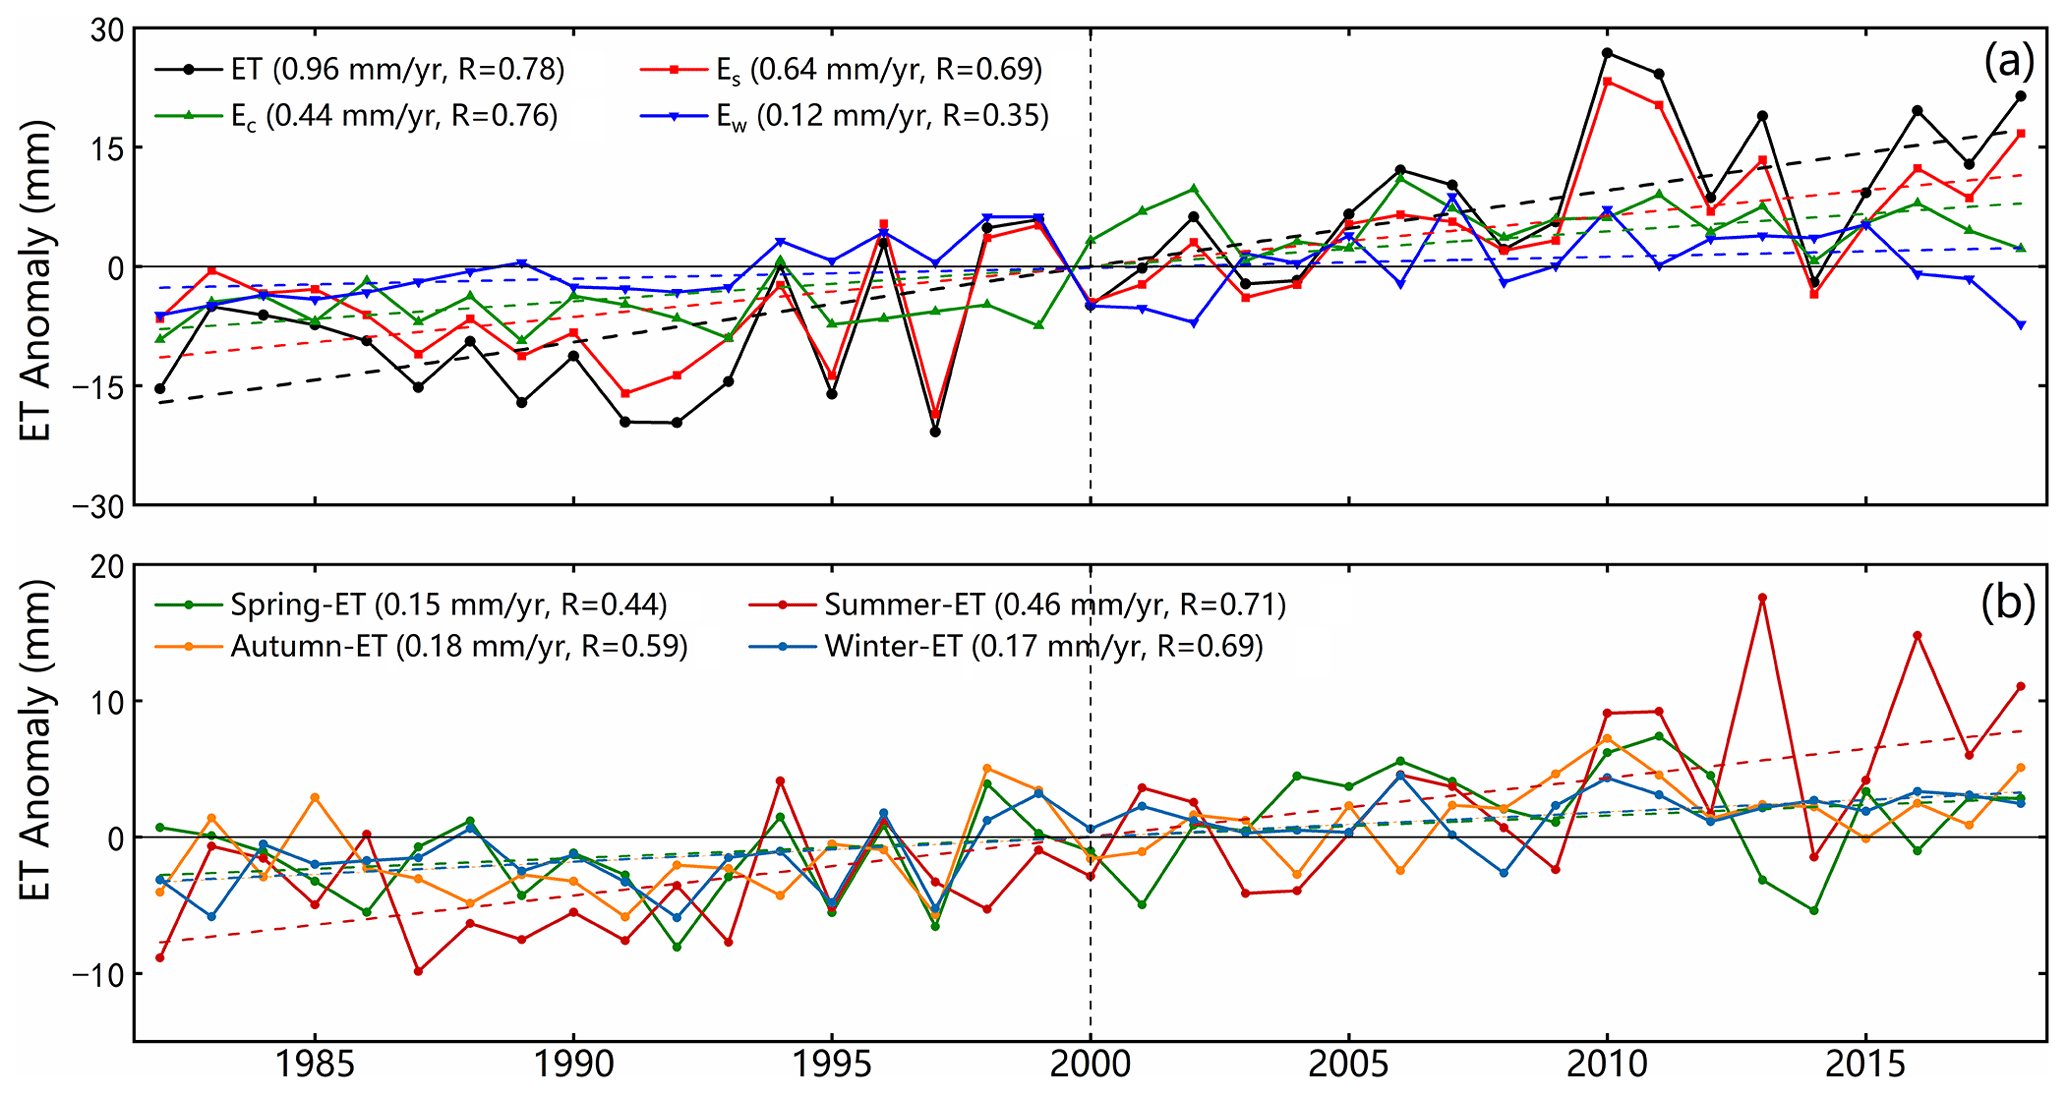
Figure 9Time series of the (a) anomalies in the annual ET and its three components and (b) anomalies in seasonal mean ET. The least-squares fitted linear trends are demonstrated by the dashed colored lines.
The rise in ET across the entire TP from 1982 to 2018 can be attributed to the concurrent warming and increased precipitation experienced in this region during the same period. Since the 1980s, the TP has undergone a general trend of greening, warming, and heightened precipitation, as illustrated in Fig. 10. ET has consistently increased over the past 4 decades, but there was a notable shift in climate factors around 2000. From 1982 to 2000, ET showed a continuous increase, accompanied by a rapid decline in wind speed, while the Rn remained relatively stable. However, between 2000 and 2018, there was a sharp decrease in Rn alongside an unchanged wind speed, but ET continued to rise during this period.
Consequently, Rn and wind speed are not the dominant factors driving annual variations in ET. The significant increases in Ta, SM, and precipitation have coincided with the greening of the land surface over the last 2 decades. These factors collectively contribute to the observed increase in ET. In the most recent decade, the substantial growth in SM has emerged as the primary control factor for ET growth.
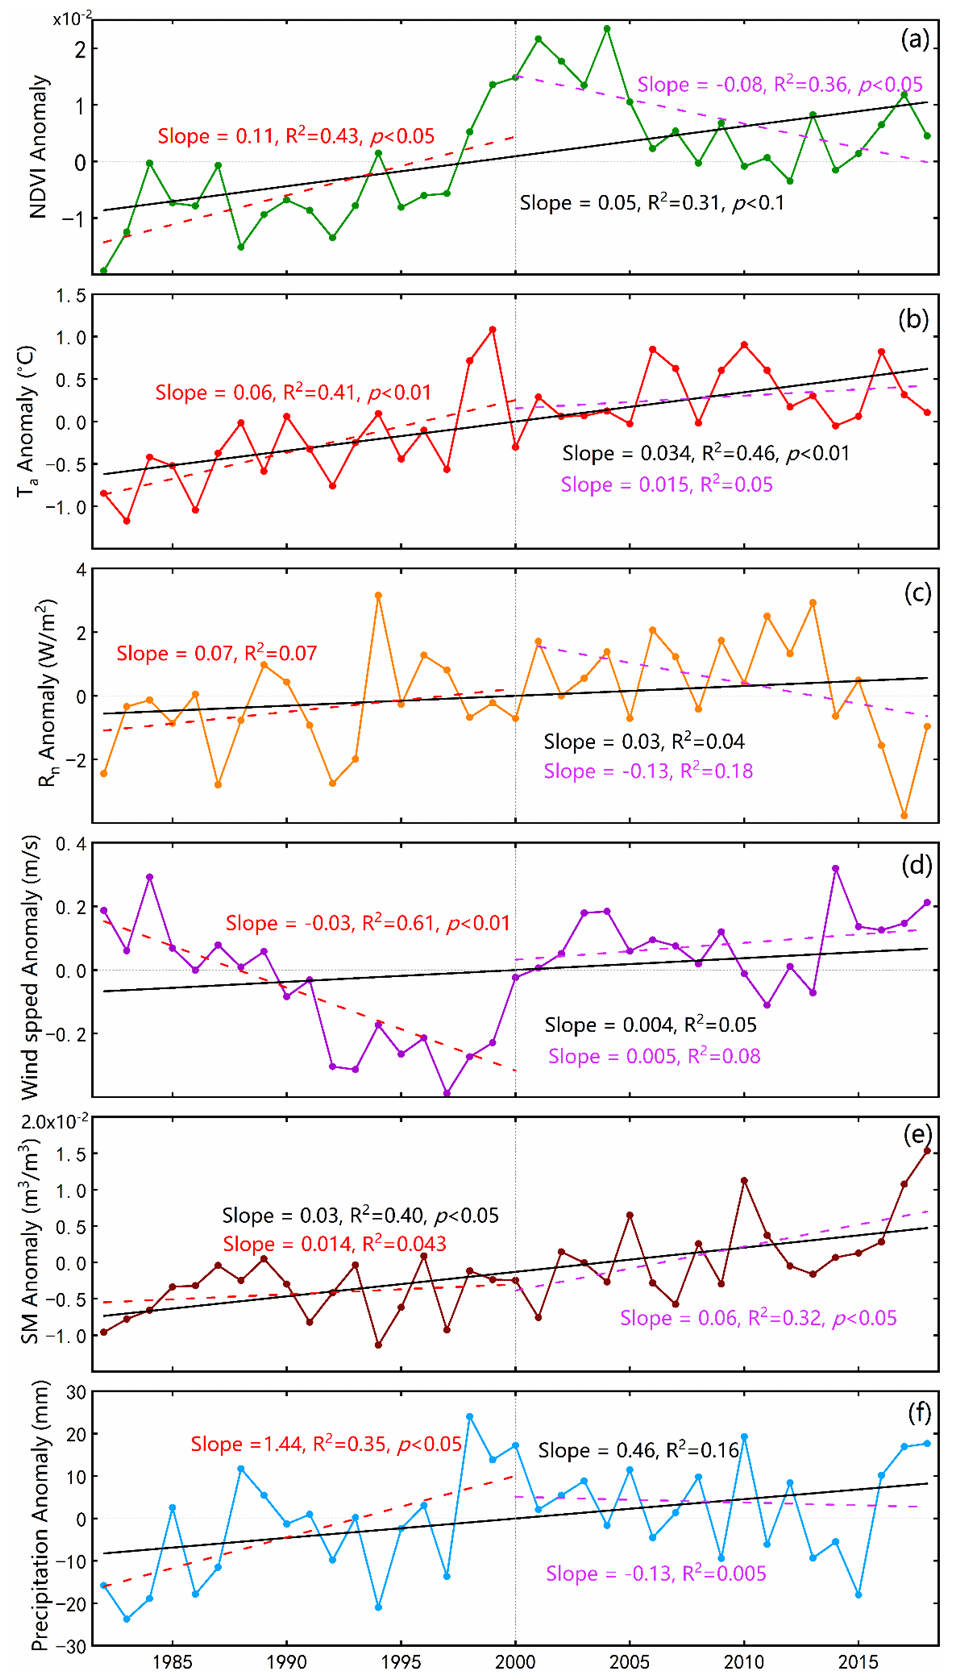
Figure 10Time series of the annual anomalies in the (a) NDVI, (b) Ta, (c) Rn, (d) u, (e) SM, and (f) precipitation and their least-squares fitted linear trends during two periods of 1982–2000 and 2000–2018.
In summary, the increase in ET over the TP can be attributed to multiple factors. The rise in available surface water plays a significant role throughout the study. Additionally, there is evidence of a general increase in precipitation across the TP (Fig. 10). The combined impact of warming (shown by Ta in Fig. 10) and vegetation greening (shown by NDVI in Fig. 10) further facilitates the opening of vegetation stomata, promoting increased vegetation transpiration. Warming the land surface and increased wind speeds enhance the efficiency of turbulent water exchange between the land and atmosphere. Furthermore, land surface warming accelerates the melting permafrost and glaciers on the TP. The surface wetting and the thickening of the active soil layer facilitate water transport from the lower soil layers to the upper layers. These environmental changes, such as water availability, precipitation patterns, vegetation dynamics, and temperature trends, all contribute to the increase in ET over the TP.
3.4 Comparison of the MOD16-STM product to other ET products over the TP
We have compared the accuracy of the MOD16-STM product and other available TP region datasets. It is shown in Fig. 11. The MOD16-STM ET model demonstrates high performance on the TP, with an average R2 value of 0.87 and an average RMSE of 13.48 mm per month. Wang et al. (2018) evaluated a modified PML model for ET estimation on the TP, reporting R2 values exceeding 0.85 and RMSE values lower than 14 mm per month. The spatially averaged ET for 1982–2012 is 378.1 mm yr−1. G. X. Wang et al. (2020) assessed the performance of the generalized nonlinear complementary principle for ET estimation based on flux tower observations from the TP. Their results indicated an R2 of 0.93 and a RMSE of 0.40 mm d−1. The spatially averaged ET during 1982–2014 is 398.3 mm yr−1. Han et al. (2021) used a combination of the effective aerodynamic roughness length and the surface energy balance model to estimate ET for the entire TP from 2001 to 2018 (Han-ET). They found good agreement between modeled and in situ-measured values (R2>0.81, RMSE < 14.5 mm per month), and the average annual ET is approximately 496 ± 23 mm, which is higher than the 346.5 ± 13.2 mm obtained in this study (Fig. 12). The discrepancy can be attributed to differences in models and periods used in the two studies. Ma and Zhang (2022) also employed the PML_V2 model to estimate ET on the TP (PML), yielding R2 and RMSE values ranging from 0.4 to 0.9 and 0.3 to 0.8 mm d−1, respectively. The 35-year mean annual ET rates from PML-Ma resulted in an average value of 353 ± 24 mm yr−1 for the entire TP. Notably, the proportion of soil evaporation estimated by PML-Ma was approximately 64 % of the total ET, which is lower than the estimated 84 % in this study. The primary reason for this difference may be attributed to variations in land cover classification. The MODIS land cover classification largely categorizes the land surface in the northwestern TP as bare soil, increasing the proportion of soil evaporation.
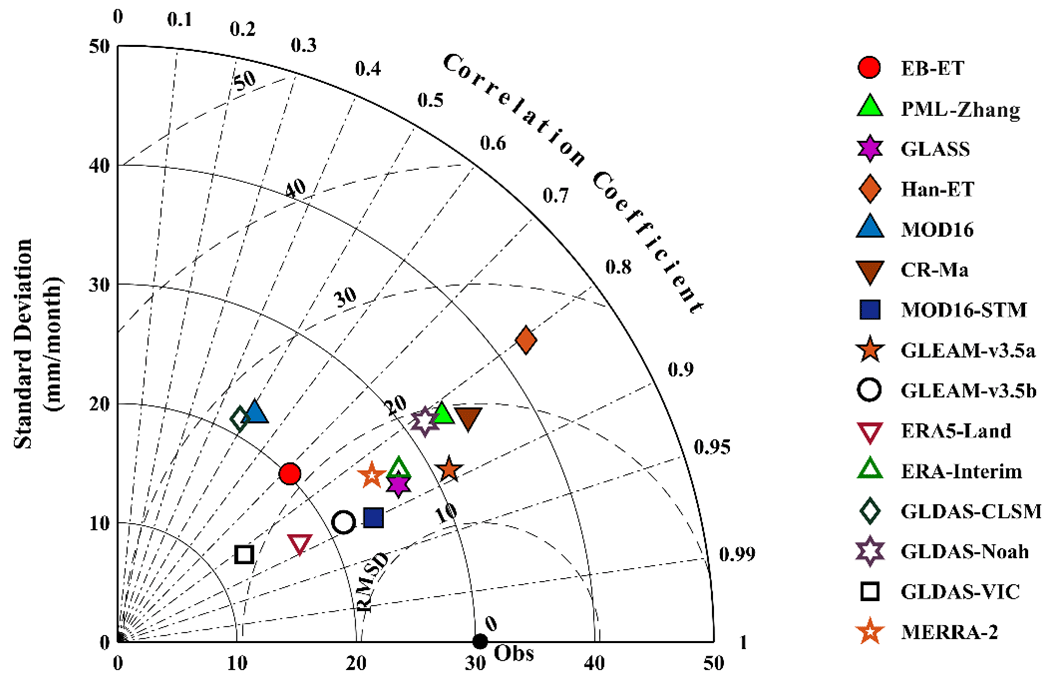
Figure 11Taylor diagram of the monthly scale ET dataset validated with flux ET observations.
4.1 Cross-comparison of the spatial distribution of ET on the TP
A cross-comparison of the multi-year average values of various ET products is conducted to assess the differences and consistency in their spatial patterns. From the spatial distribution of annual average ET (Fig. 12), all the ET products for the TP exhibit a decreasing trend from southeast to northwest, consistent with the transition in surface types from forests to grasslands and bare soil. In the region of the Hengduan Mountains, all products show high values (> 600 mm yr−1) due to the dense vegetation and ample precipitation. However, significant absolute differences are observed among these 15 ET products. There are high differences among the products in the sparsely vegetated western and central TP regions. In the central TP region, the Han-ET product exhibits the highest annual ET (> 600 mm yr−1), while GLDAS-VIC has the lowest (approximately 35 to 50 mm yr−1). In the northwestern TP, EB-ET, GLDAS, MERR-2, and GLEAM-v3.5a products display low values (< 50 mm yr−1), while others range between 100 and 300 mm yr−1. In the extremely arid Qiangtang Plateau, all products show low values due to limited available surface water. ERA-Interim, ERA5-Land, PML-Zhang, CR-Ma, MOD16-STM, and GLEAM-v3.5b have relatively balanced distributions in the central and western TP regions (200–350 mm yr−1). There are high differences in the distribution of ET among the products in the downstream area of the Yarlung Tsangpo River. The spatial resolution of our product is 0.05∘. This might be the reason that MOD16-STM has low ET for this topographically complex region. It is worth noting that MOD16 ET product has many missing values in the northwestern TP region, making it inadequate for a comprehensive assessment of ET across the entire TP.
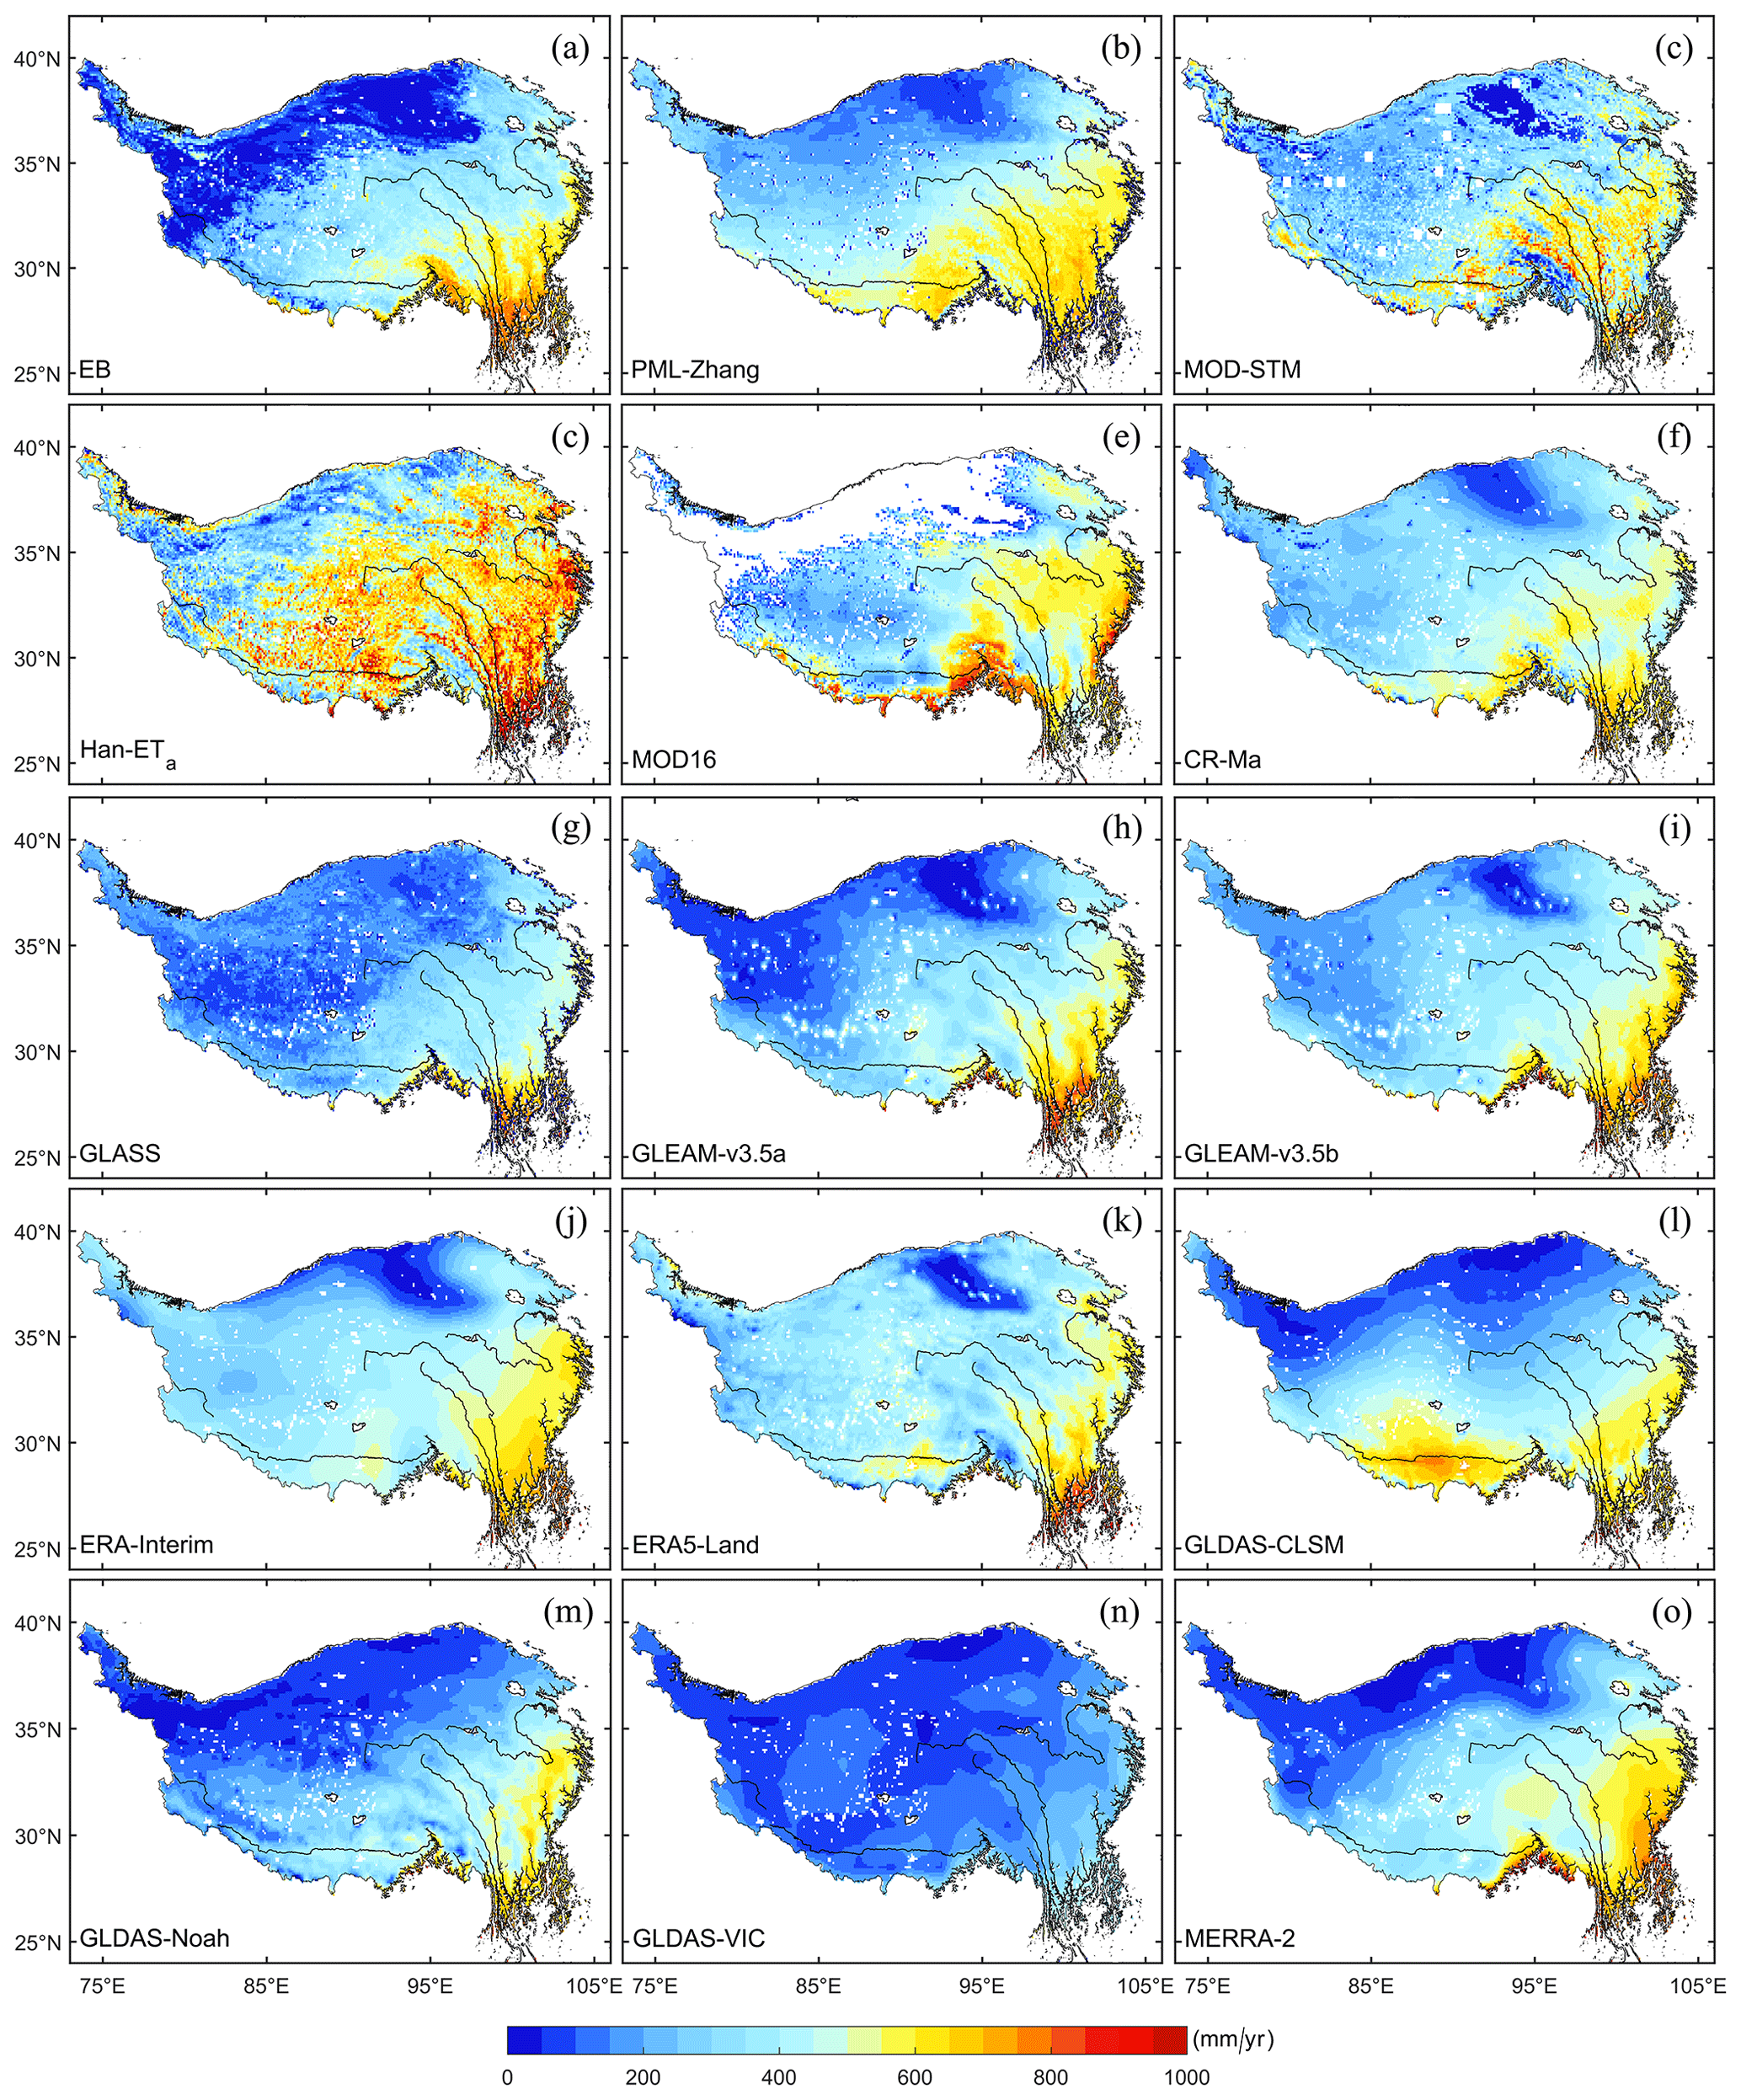
Figure 12Spatial distribution of annual averaged ET on the TP during 2000 to 2014 derived from 15 products.
4.2 ET components' partitioning
It is also necessary to conduct a comparative validation of ET components to enhance the practicality of the data generated in this study. Unfortunately, there are no measured ET component data publicly available at the moment. Comparative validation can be conducted based on existing research findings. Cui et al. (2020) estimated the Ec ET at the Nagqu station (31.37∘ N, 91.90∘ E; 4509 m above sea level) in the central region of the TP using laser spectroscopy and chamber methods. During the observation period, the isotopic-based Ec ET ranged from 15 % to 73 %, with an average value of 43 %. We calculated Ec ET from our dataset at the same location and time period (June and July). The values of Ec ET from MOD16-STM are in the range of 13.1 % to 62.6 %. The average of Ec ET is 38.4 % ± 4.7 %, which has a difference of 4.6 % relative to isotopic estimation. Our Ec ET estimation is close to the observation at Nagqu. Guo et al. (2017) also pointed out that Ec constituted less than half of total ET (41 % annually, 29 % during monsoon) in the Magazangbu catchment over the TP.
Moreover, we assess the similarities and differences between MOD16-STM and GLEAM-v3.5a ET components on the TP. Figure 13 shows that GLEAM's Es values are generally smaller than our estimation throughout the TP region. The most recent results from Zheng et al. (2022) also suggest that the GLEAM product underestimates global Es outputs. Conversely, GLEAM's Ec values are overestimated in the central and eastern TP. The differences in Ew are minimal because the values in that region are inherently small. Previous research has indicated that in the central TP region, Es ET accounts for over 60 % (Cui et al., 2020), and the average Es ET ratio across the entire region exceeds 65 % (Wang et al., 2018). The reason for the relatively higher Es in the central TP is that this region primarily consists of high-altitude grassland as the underlying surface. In the summer, the dominant processes are Ec and Es, but in the winter Es becomes the predominant process. Consequently, the proportion of Es is higher over the entire year. GLEAM's results show that the Ec process predominates in the central TP, which differs somewhat from the findings of this study. Zheng et al. (2022) also indicate that the Es process predominates in the central TP, exceeding 300 mm yr−1. Therefore, the ET components in this study, when compared with previous research, are more in line with the actual conditions in the TP.
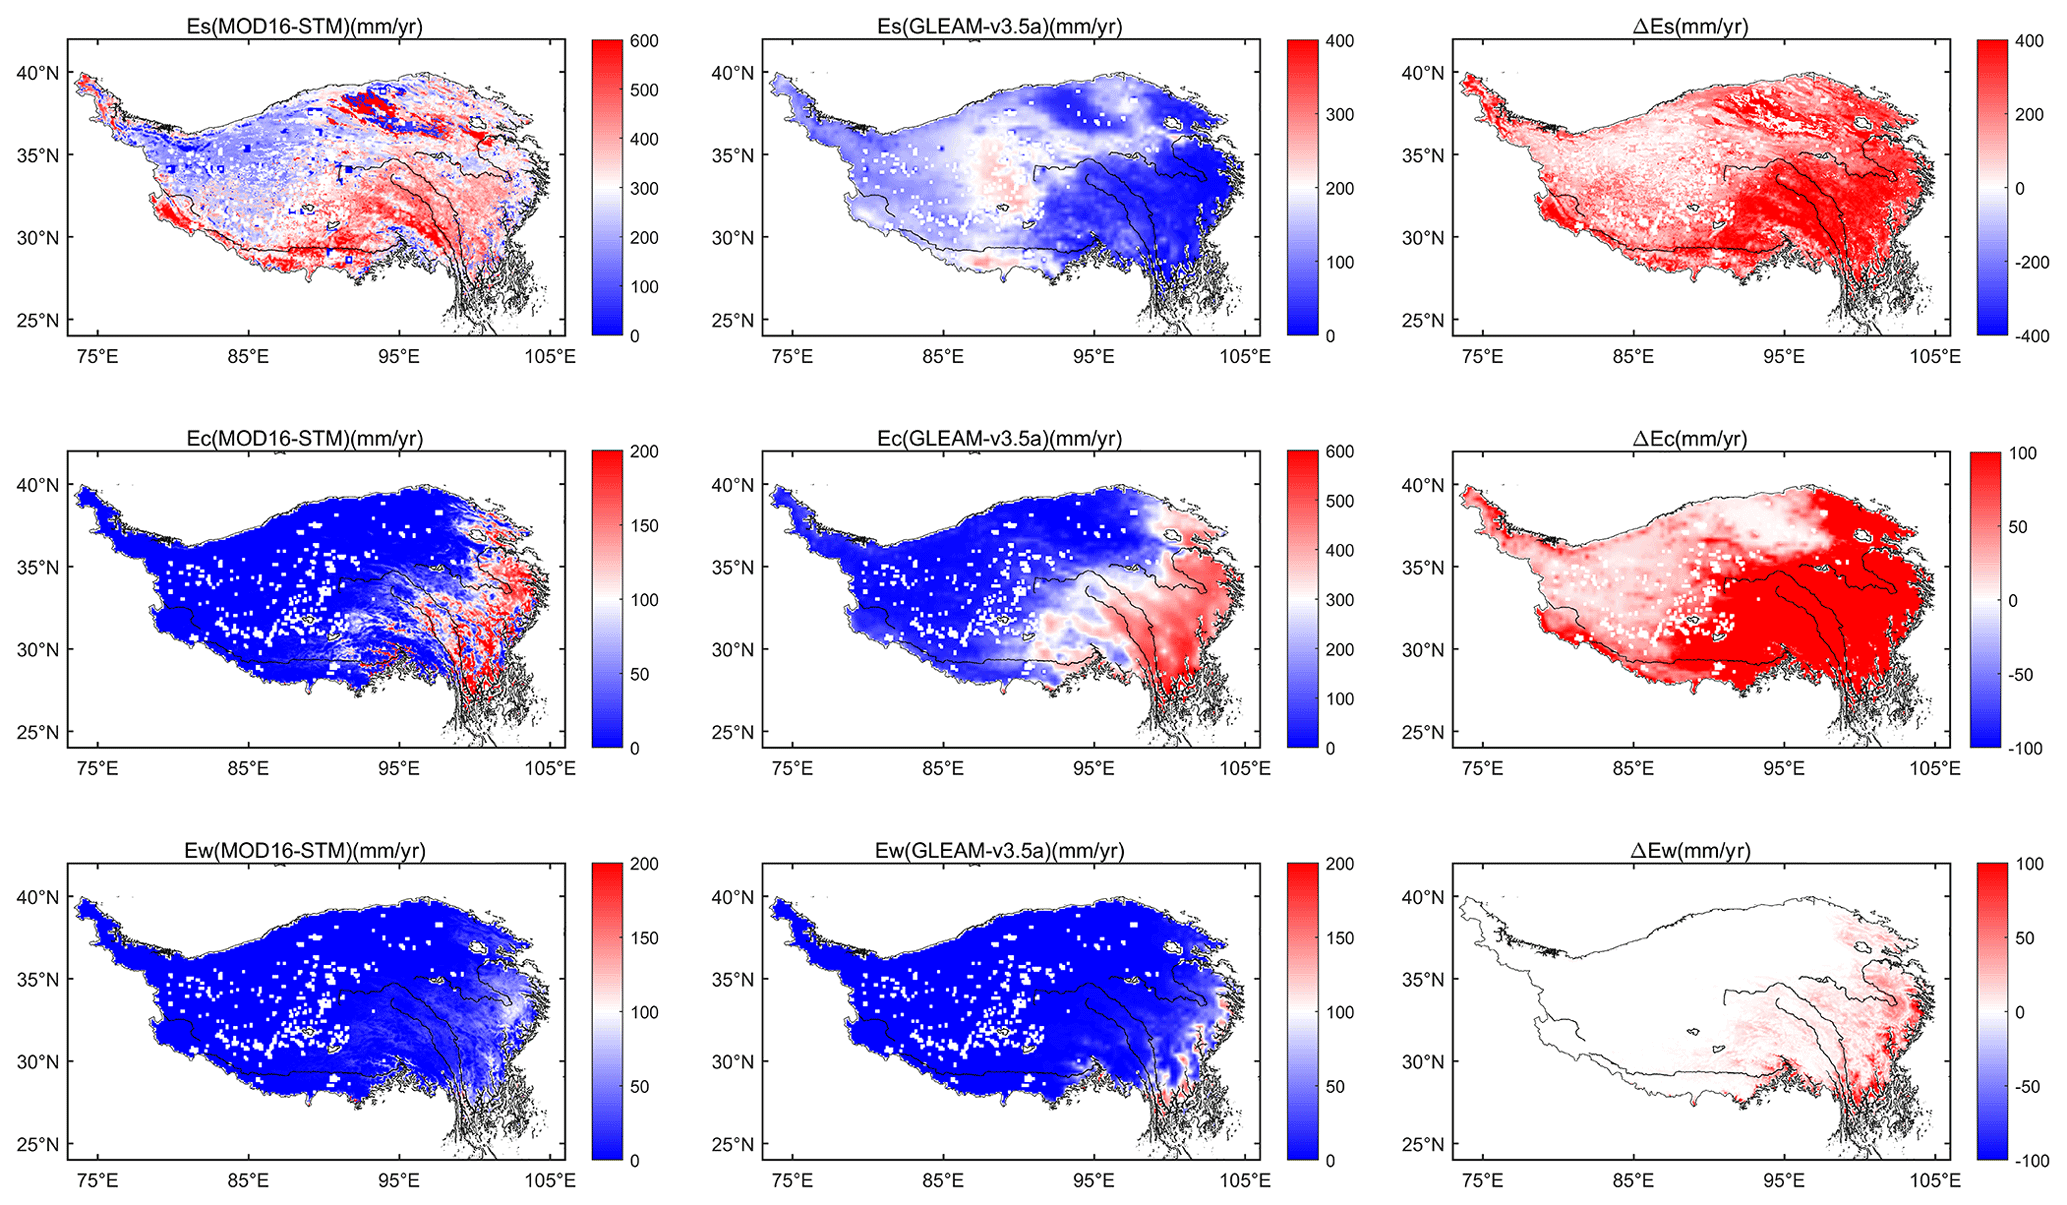
Figure 13Spatial comparison of ET components and their differences (MOD16-STM minus GLEAM-v3.5a).
4.3 Discrepancy in the estimation of annual ET over the TP
Figure 14 provides a comprehensive overview of the periods covered by various ET datasets and their annual ET estimations for the TP. Yao et al. (2013) estimated TP's ET (PT-Yao) in China using a satellite-driven modified Priestley–Taylor algorithm, constrained by NDVI and apparent thermal inertia derived from temperature changes. Their reported mean annual ET for the TP is approximately 320 mm yr−1. Song et al. (2017) estimated TP's ET (PM-Song) from 2000 to 2010 using the improved Penman–Monteith method and meteorological and satellite remote sensing data at a 1 km spatial resolution. They concluded that the average annual ET on the TP is 350.3 mm yr−1. Additionally, 18 mean annual ET values are estimated using existing ET products (PML-Zhang (Y. Zhang et al., 2019), EB-ET (Chen et al., 2019), CR-Ma (Ma et al., 2019), CMIP6-ssp126 (Eyring et al., 2016), GLDAS-Noah (Rodell et al., 2004), GLASS (Liang et al., 2021), GLEAM-v3.5b (Miralles et al., 2011, 2016), ERAR-Land (Muñoz-Sabater et al., 2021), MTE (Jung et al., 2010), PM-Li (Li et al., 2014a, b), LPJ-Yin (Yin et al., 2013)) and are included for comparison. Han-ET, ERA5-Land, and CMIP6 produce the highest values (> 400 mm yr−1), while LPJ-Yin, GLASS, EB-ET, GLDAS, and GLEAM values are less than 300 mm yr−1. The results demonstrate substantial variability in the TP's estimated mean annual ET values. These differences are influenced by objective factors such as data accuracy, limitations of validation method, and algorithm flaws. The ensemble mean of all datasets yields an annual ET of 348.6 mm yr−1, with the MOD16-STM model's estimation (346.5 mm yr−1) being the closest to this ensemble mean. Overall, the MOD16-STM ET model again demonstrates acceptable TP performance.
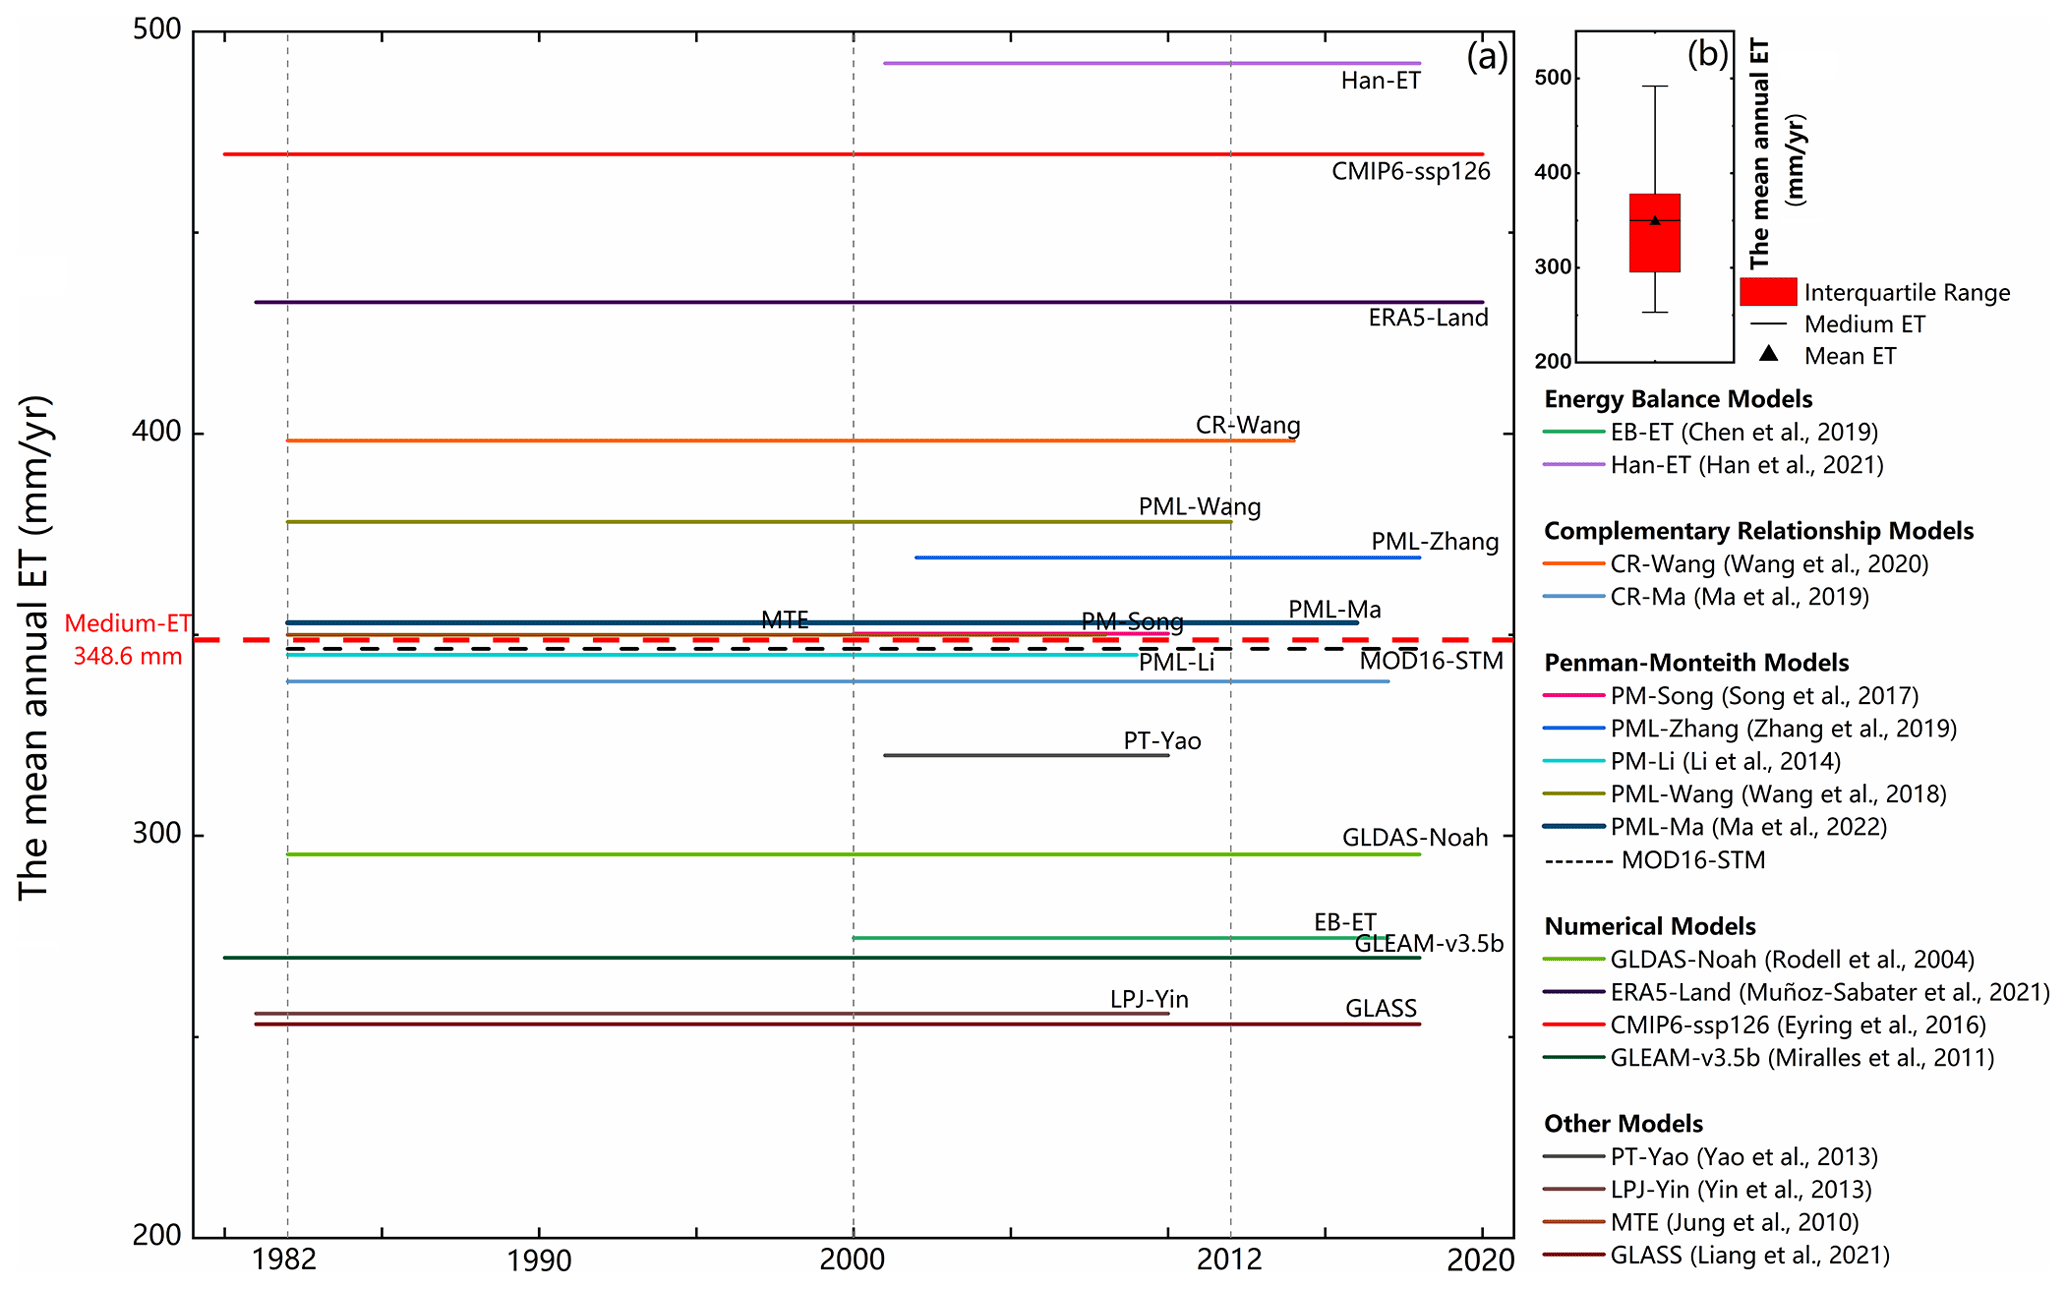
Figure 14(a) The annual mean ET values of 18 datasets. The x axis is the time coverage of the ET datasets, and the y axis is the multiyear mean value. (b) The bars denote the mean values and variations of the annual ET.
4.4 Errors caused by objective factors
The MOD16-STM and other models rely on remote sensing and reanalysis data as primary input sources. However, it is essential to acknowledge the inherent uncertainty in these datasets (Ramoelo et al., 2014). For example, the topsoil water content from satellite data includes some errors (Liu et al., 2021). This indicates that SM from GLEAM may introduce uncertainties into our ET estimation. Some studies have documented the greening of the TP. Figure 10a demonstrated a significant decrease in NDVI after 2000, contrasting with the NDVI changes reported by Wang et al. (2022). This inconsistency highlights the considerable uncertainty in the NDVI data.
Additionally, LST plays a fundamental role in calculating the surface energy balance. Consequently, errors in ERA5 LST can also bring uncertainty to the ET estimation. This study used a threshold value of NDVI (0.25) to categorize land surfaces as bare soil or canopy-covered pixels. This threshold value may misclassify bare soil and grassland on the TP. The land cover mismatches between the reality and the land surface types in the MOD16-STM ET model can also introduce errors into the model simulation.
It is worth noting that flux towers used for validation typically cover areas ranging from a few hundred square meters to several square kilometers. These validation sites' representativeness depends on observation instrument height, turbulence intensity, topography, environment, and vegetation conditions. While site-scale evaluations of the MOD16-STM ET are conducted in this study, it is essential to recognize the uncertainties stemming from the limited number of validation sites. Future research should consider validation across various land cover types, climate zones, elevations, and seasons to provide a more comprehensive assessment of model performance.
While the MOD16 model directly estimates ET, bypassing the need for calculating sensible heat, it still relies on empirical coefficients, particularly those redefined for different soil textures. However, the remaining empirical parameters, such as CL (the mean potential and stomatal conductance per unit leaf area), can introduce uncertainties into simulation results. Thus, future studies should prioritize parameterizing these empirical factors based on physical processes to reduce simulation uncertainties. It is crucial to consider the influence of physical processes related to deeper soil water and heat transfer on resistance. The MOD16-STM algorithm's accuracy is highly dependent on higher-precision soil moisture products. Since a substantial portion of the TP is covered by permafrost and seasonally frozen soil, assessing soil moisture conditions during freezing and thawing periods becomes challenging. Consequently, it is essential to employ observations during freeze–thaw periods to validate the model's applicability.
In summary, enhancing the model by incorporating physical parameterizations, especially for empirical coefficients, and accounting for the complexities of soil moisture variations in frozen regions will reduce uncertainties in ET simulation results in future research.
The monthly ET dataset presented and analyzed in this article has been released. It is freely available at the Science Data Bank (https://doi.org/10.11922/sciencedb.00020, Ma et al., 2021) and the National Tibetan Plateau Data Center (TPDC) (https://doi.org/10.11888/Terre.tpdc.271913, Yuan, 2021). The dataset is published under the Creative Commons Attribution 4.0 International (CC BY 4.0) license.
In this study, we have developed a 37-year (1982–2018) monthly ET dataset with a high spatial resolution (0.05∘) for the TP using the newly developed MOD16-STM model. This dataset covers the entire study area with high spatial resolution and a long time series, making it a valuable resource for climate studies. Then, we investigated ET's spatial distribution and temporal trends across the TP. Key findings are summarized in the following.
The ET product generated by the MOD16-STM model exhibits strong performance on the TP. Compared to flux tower observation data, the model achieves high R2 and IOA values of 0.83 and 0.93, respectively, with an RMSE of 13.48 mm per month and a modest bias (MB) of 2.58 mm per month. This ET dataset holds potential applications in water resource management, drought monitoring, and ecological studies.
The ET on the TP displays spatial heterogeneity and temporal variations driven by a combination of atmospheric demand and water supply. Generally, annual ET decreases from the southeastern to the northwestern regions of the TP. Es accounts for over 84 % of the annual ET, and the estimated multiyear mean annual ET on the TP for 1982–2018 is 346.5 ± 13.2 mm. This corresponds to an annual water evaporation of about 0.93 ± 0.037 Gt from the entire TP.
Significant temporal trends are observed in the ET. Most parts of the central and eastern TP exhibit increasing trends of about 1 to 4 mm yr−1 (p<0.05), whereas the northwestern TP shows a decreasing trend of −3 to −1 mm yr−1 (p<0.05). Averaged across the entire TP, the ET increased significantly at a rate of 0.96 mm yr−1 (p<0.05) from 1982 to 2018. This increase in ET over the entire TP from 1982 to 2018 can be attributed to the warming and wetting of the climate during this period.
These findings contribute to a better understanding of the ET dynamics on the Tibetan Plateau and provide a valuable dataset for climate research and related applications.
Table A1Basic information about the five test sites (which are used to test the relationship between soil surface resistance (rs) and SM in the MOD16-STM model) and 12 verification sites (used for the MOD16-STM model evaluation at site scale). All the stations are located outside of the Tibetan Plateau.
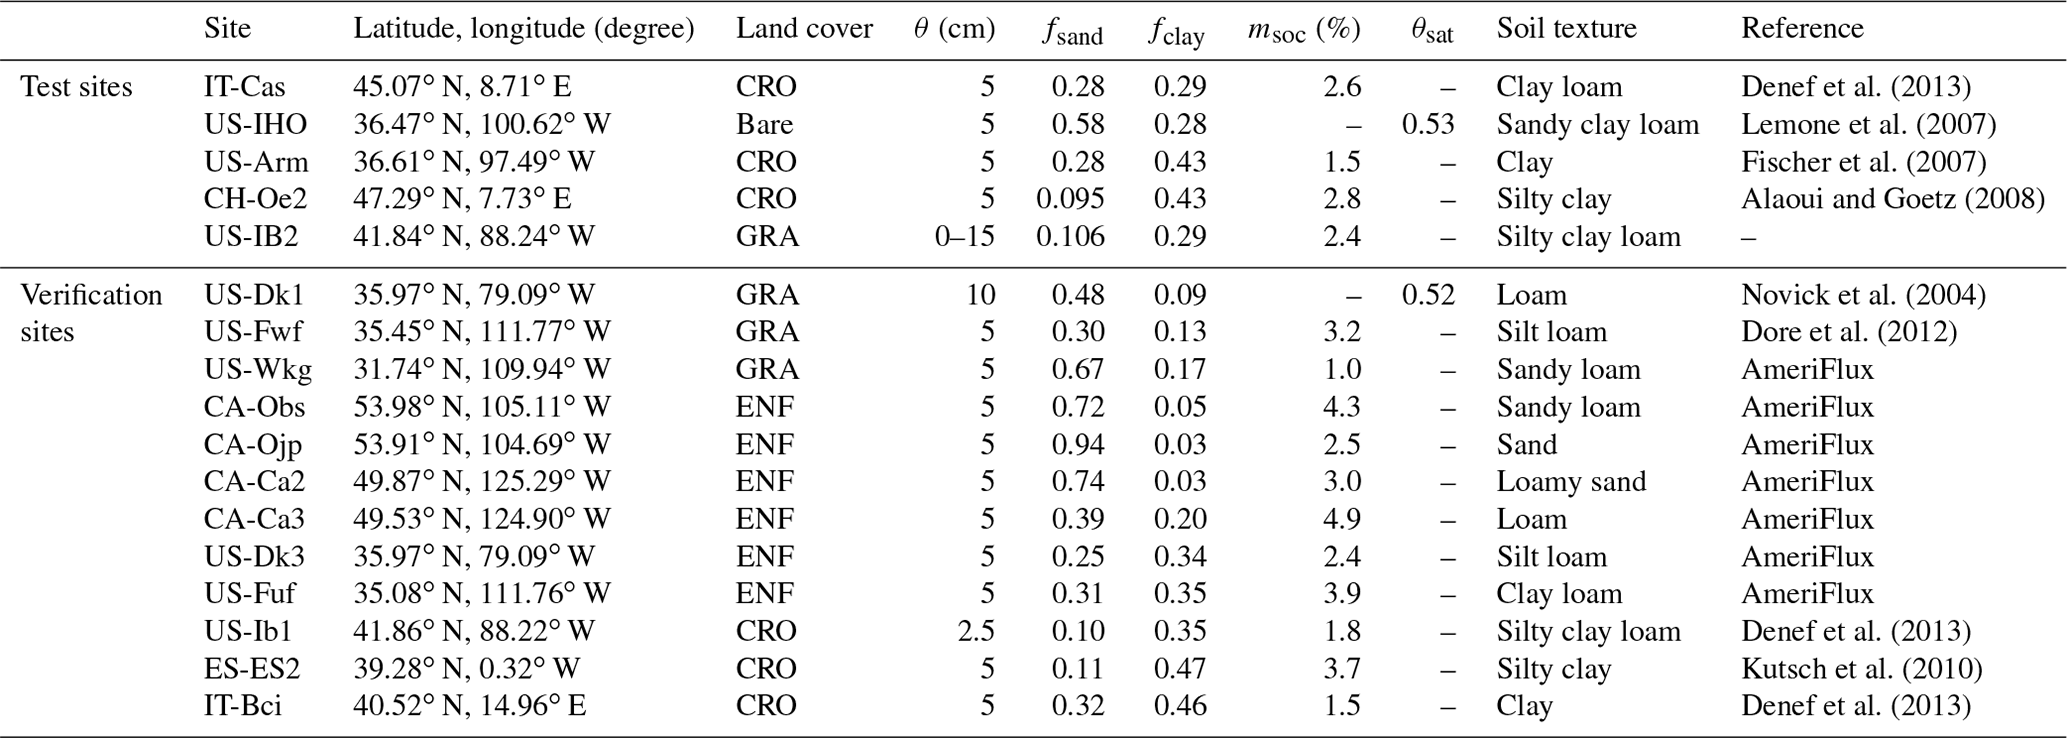
Table A2Assessment results of the daily ET (mm d−1) simulated by the MOD16-STM model at the 12 verification sites. The in situ meteorological observation data drive this simulation.
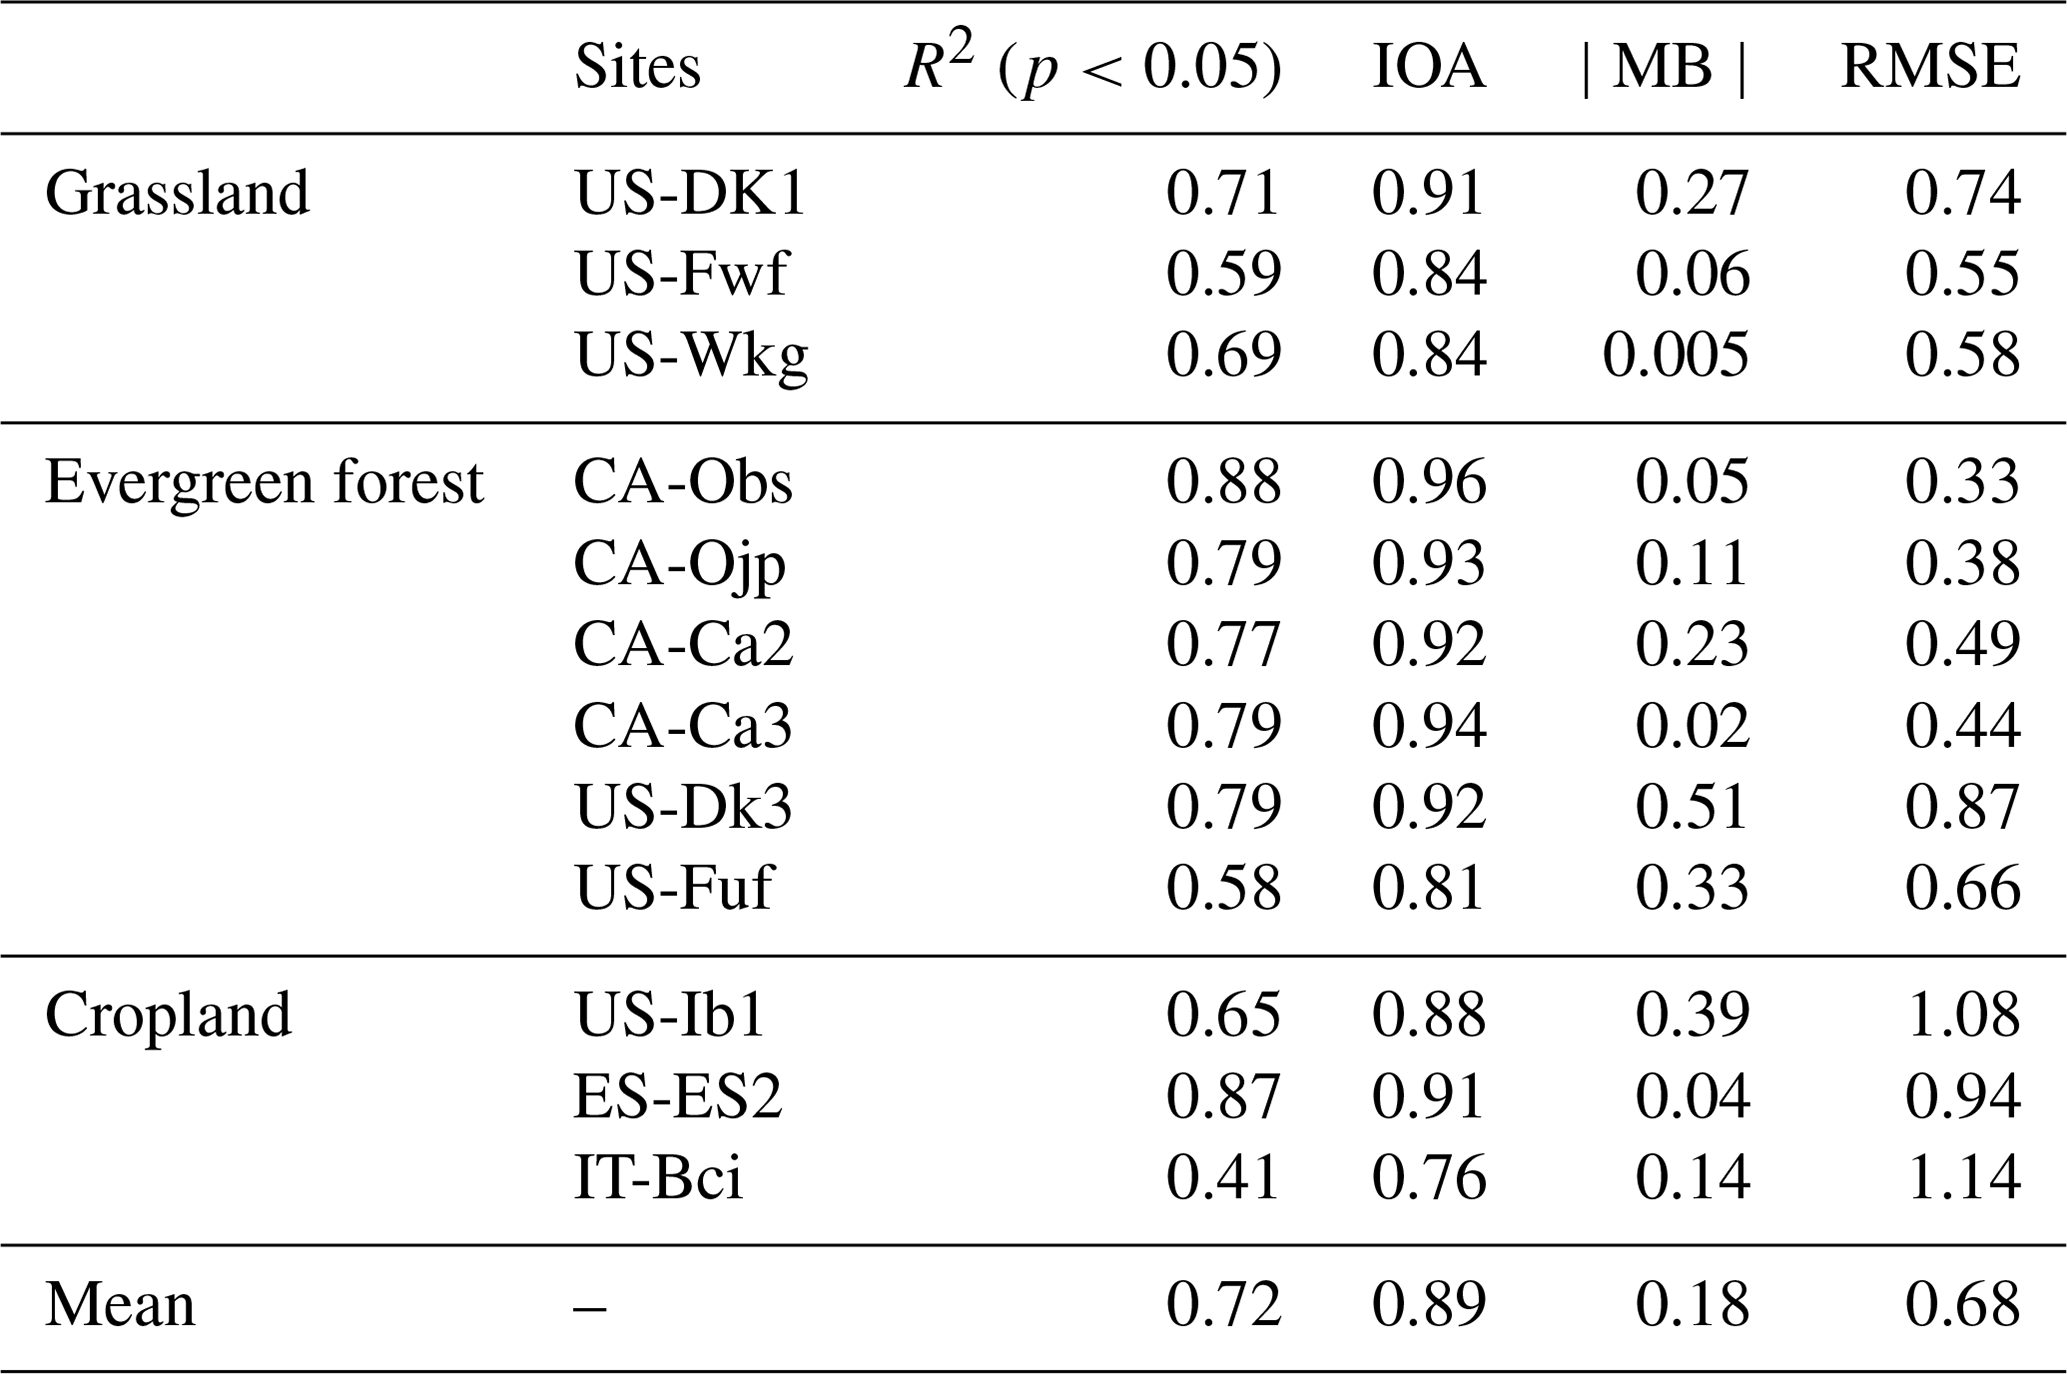
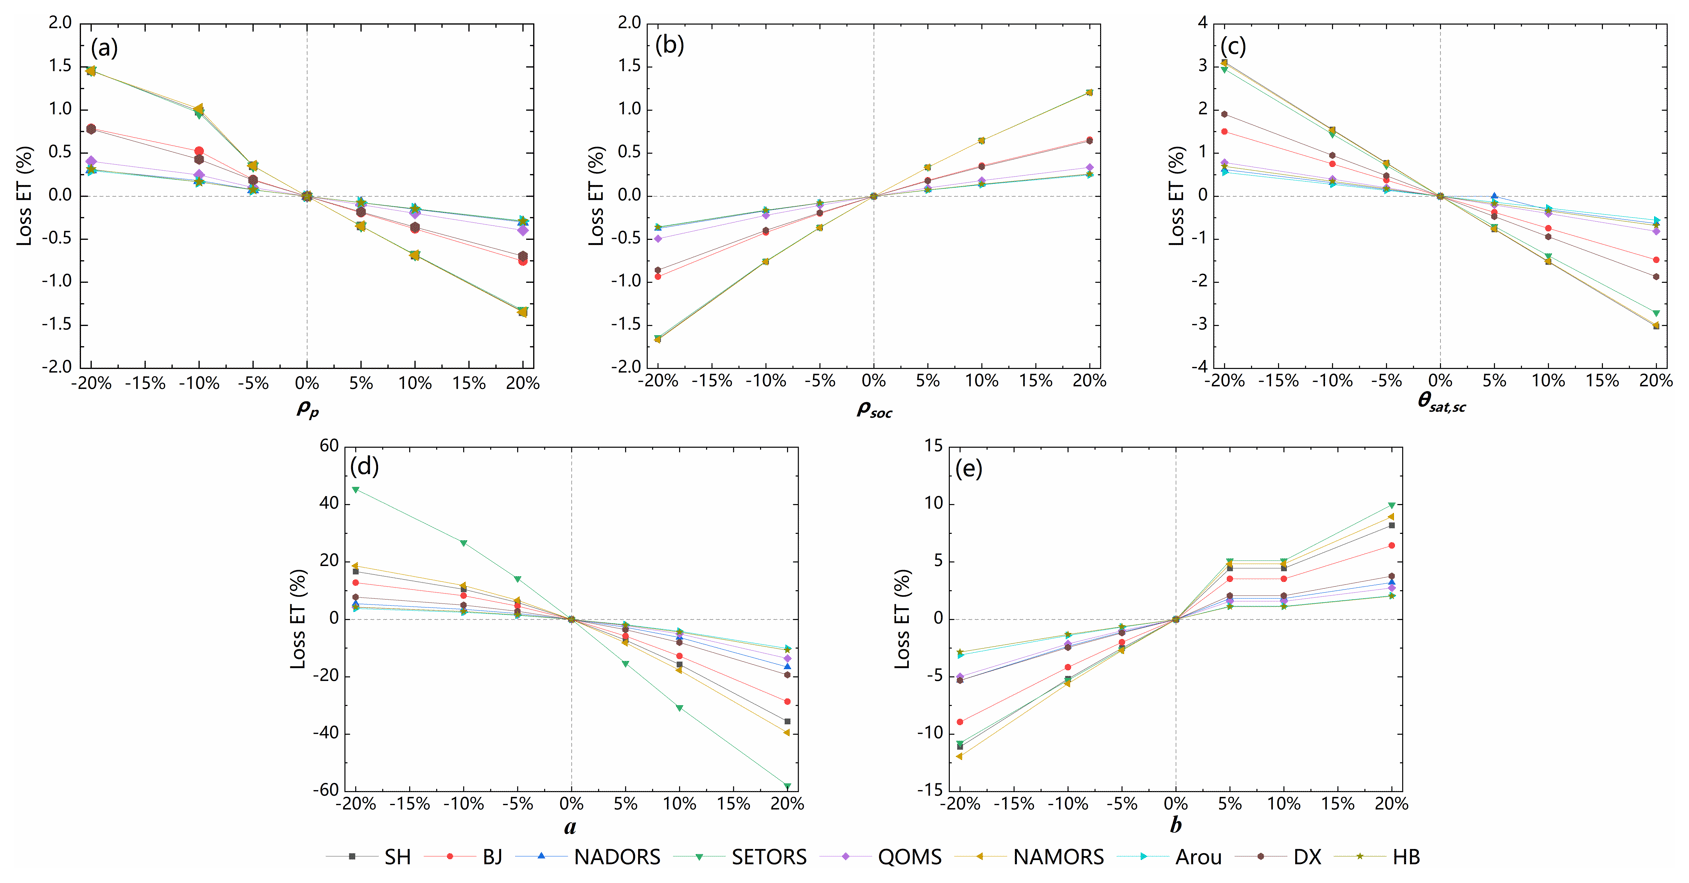
Figure A1A sensitivity analysis of the impact of the uncertainty in the empirical parameters (ρp, ρsoc, θsat,sc, a and b) on the estimation of ET (test in August 2018).
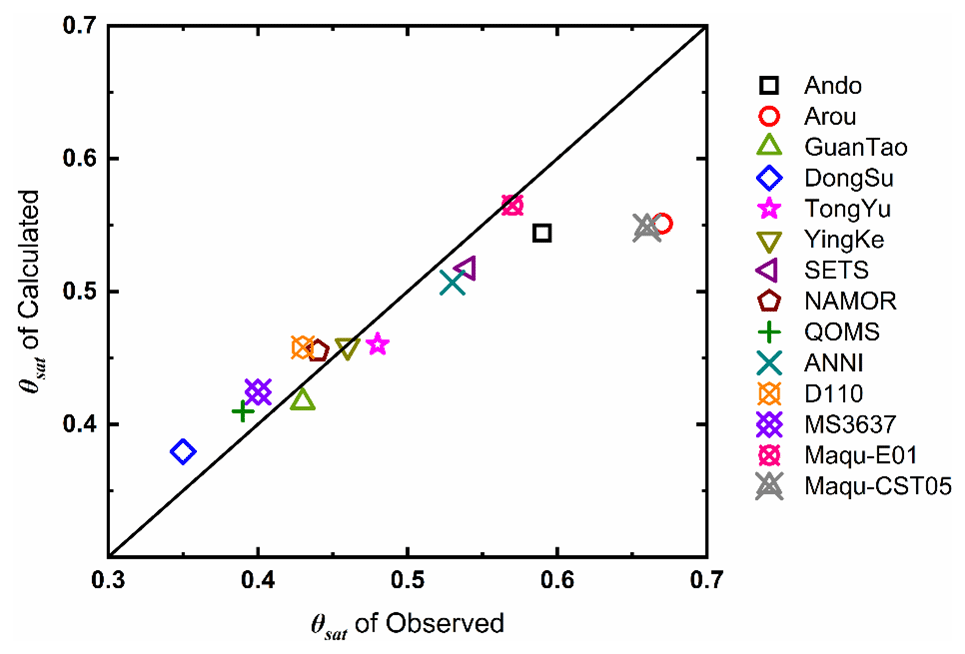
Figure A2Validation of the consistency between the estimated and the observed values for θsat over the TP.
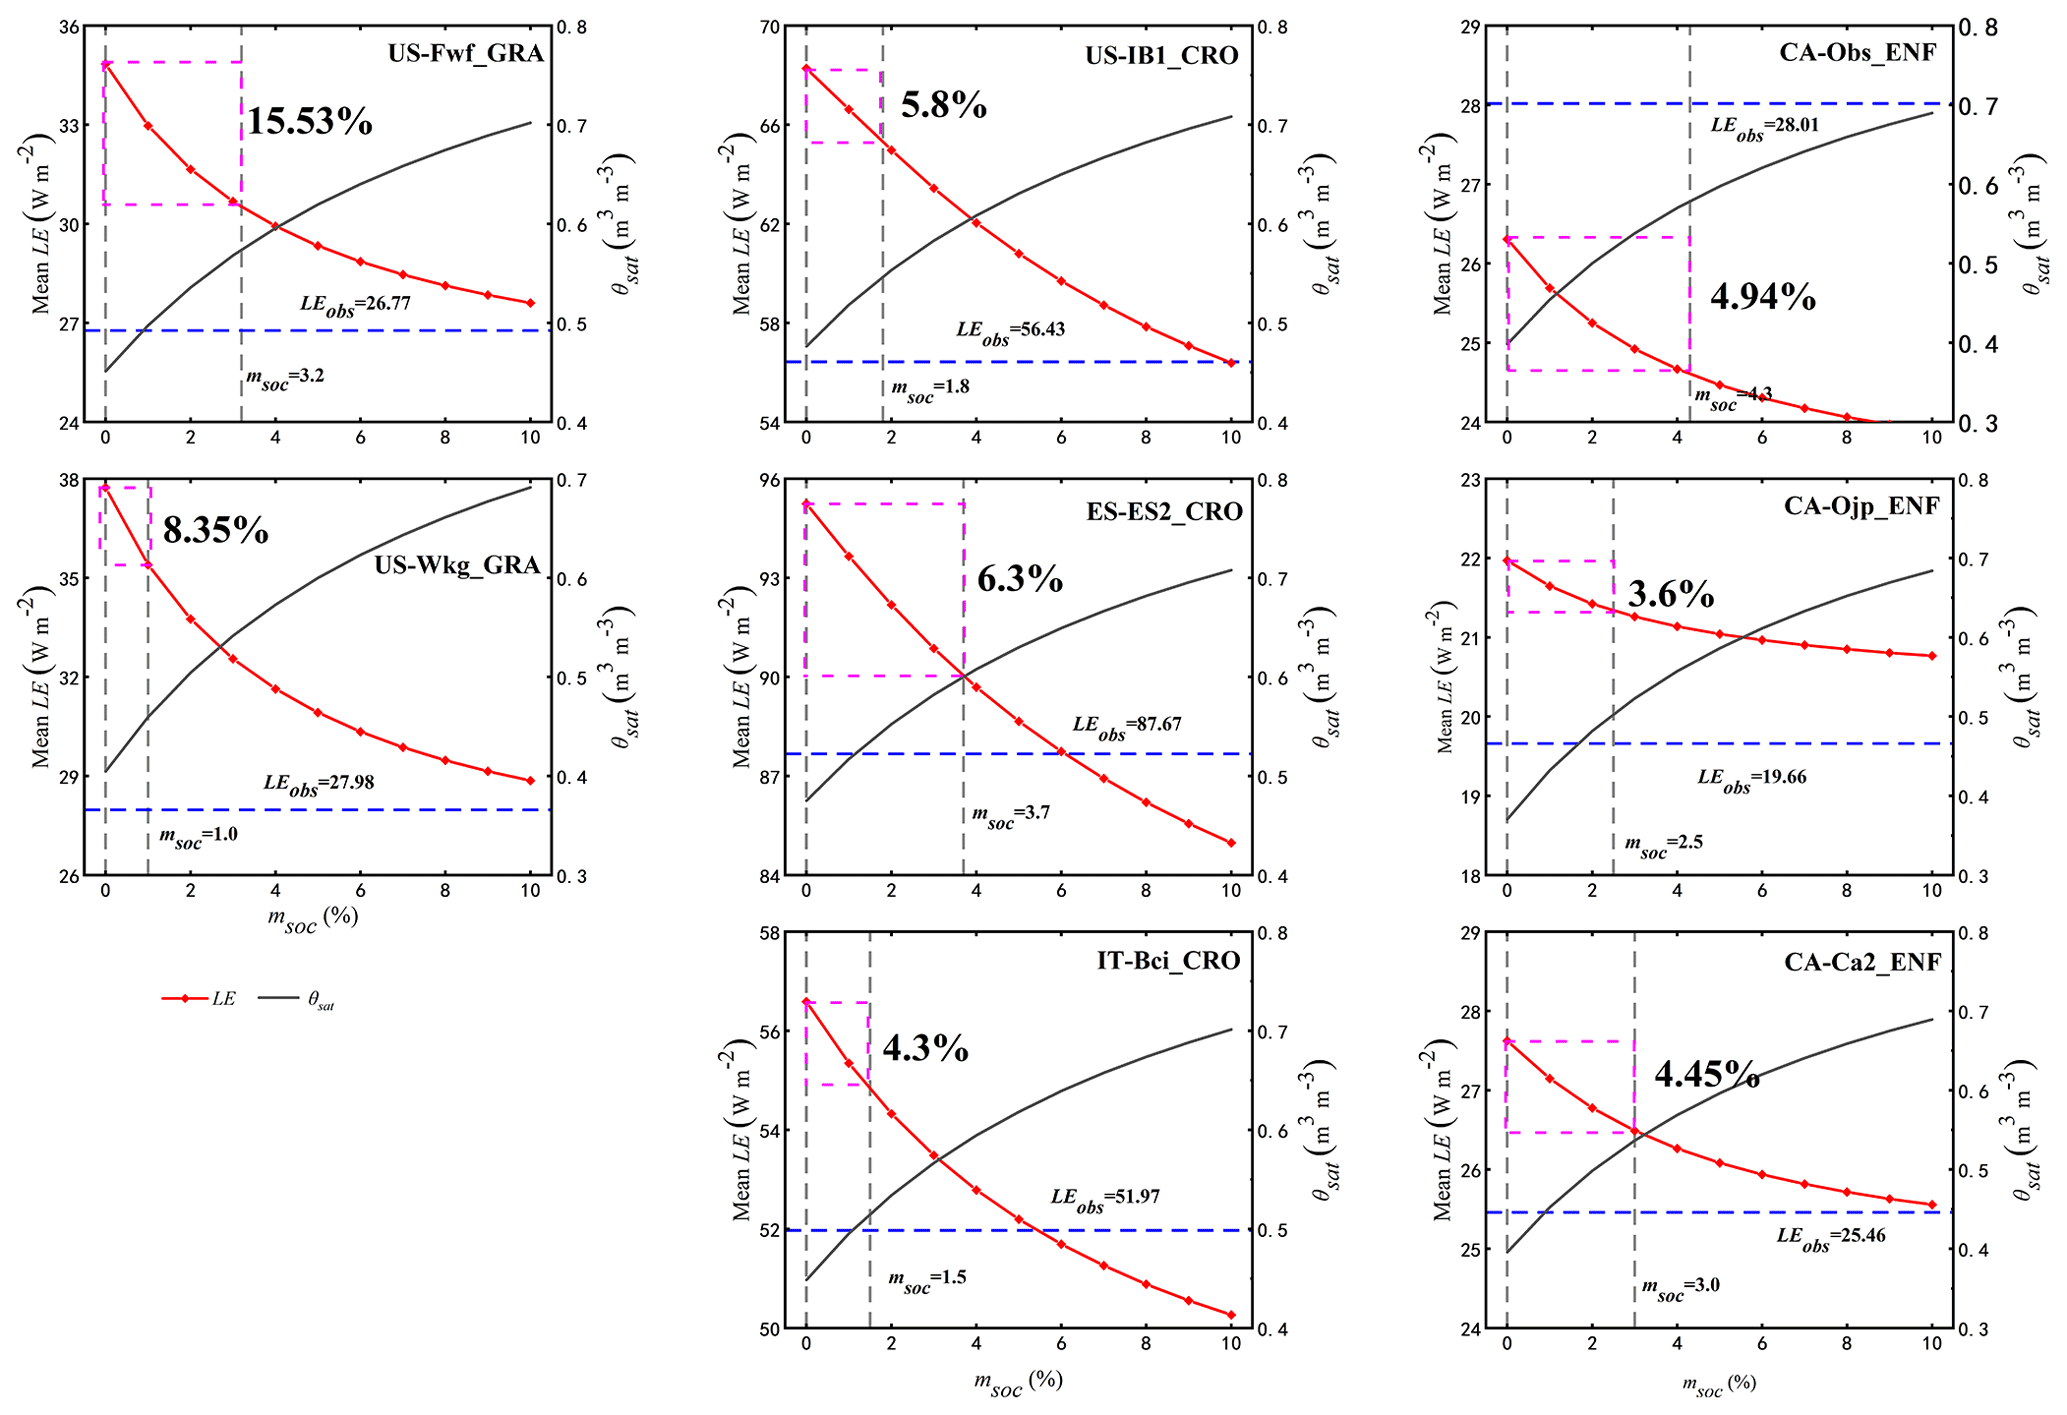
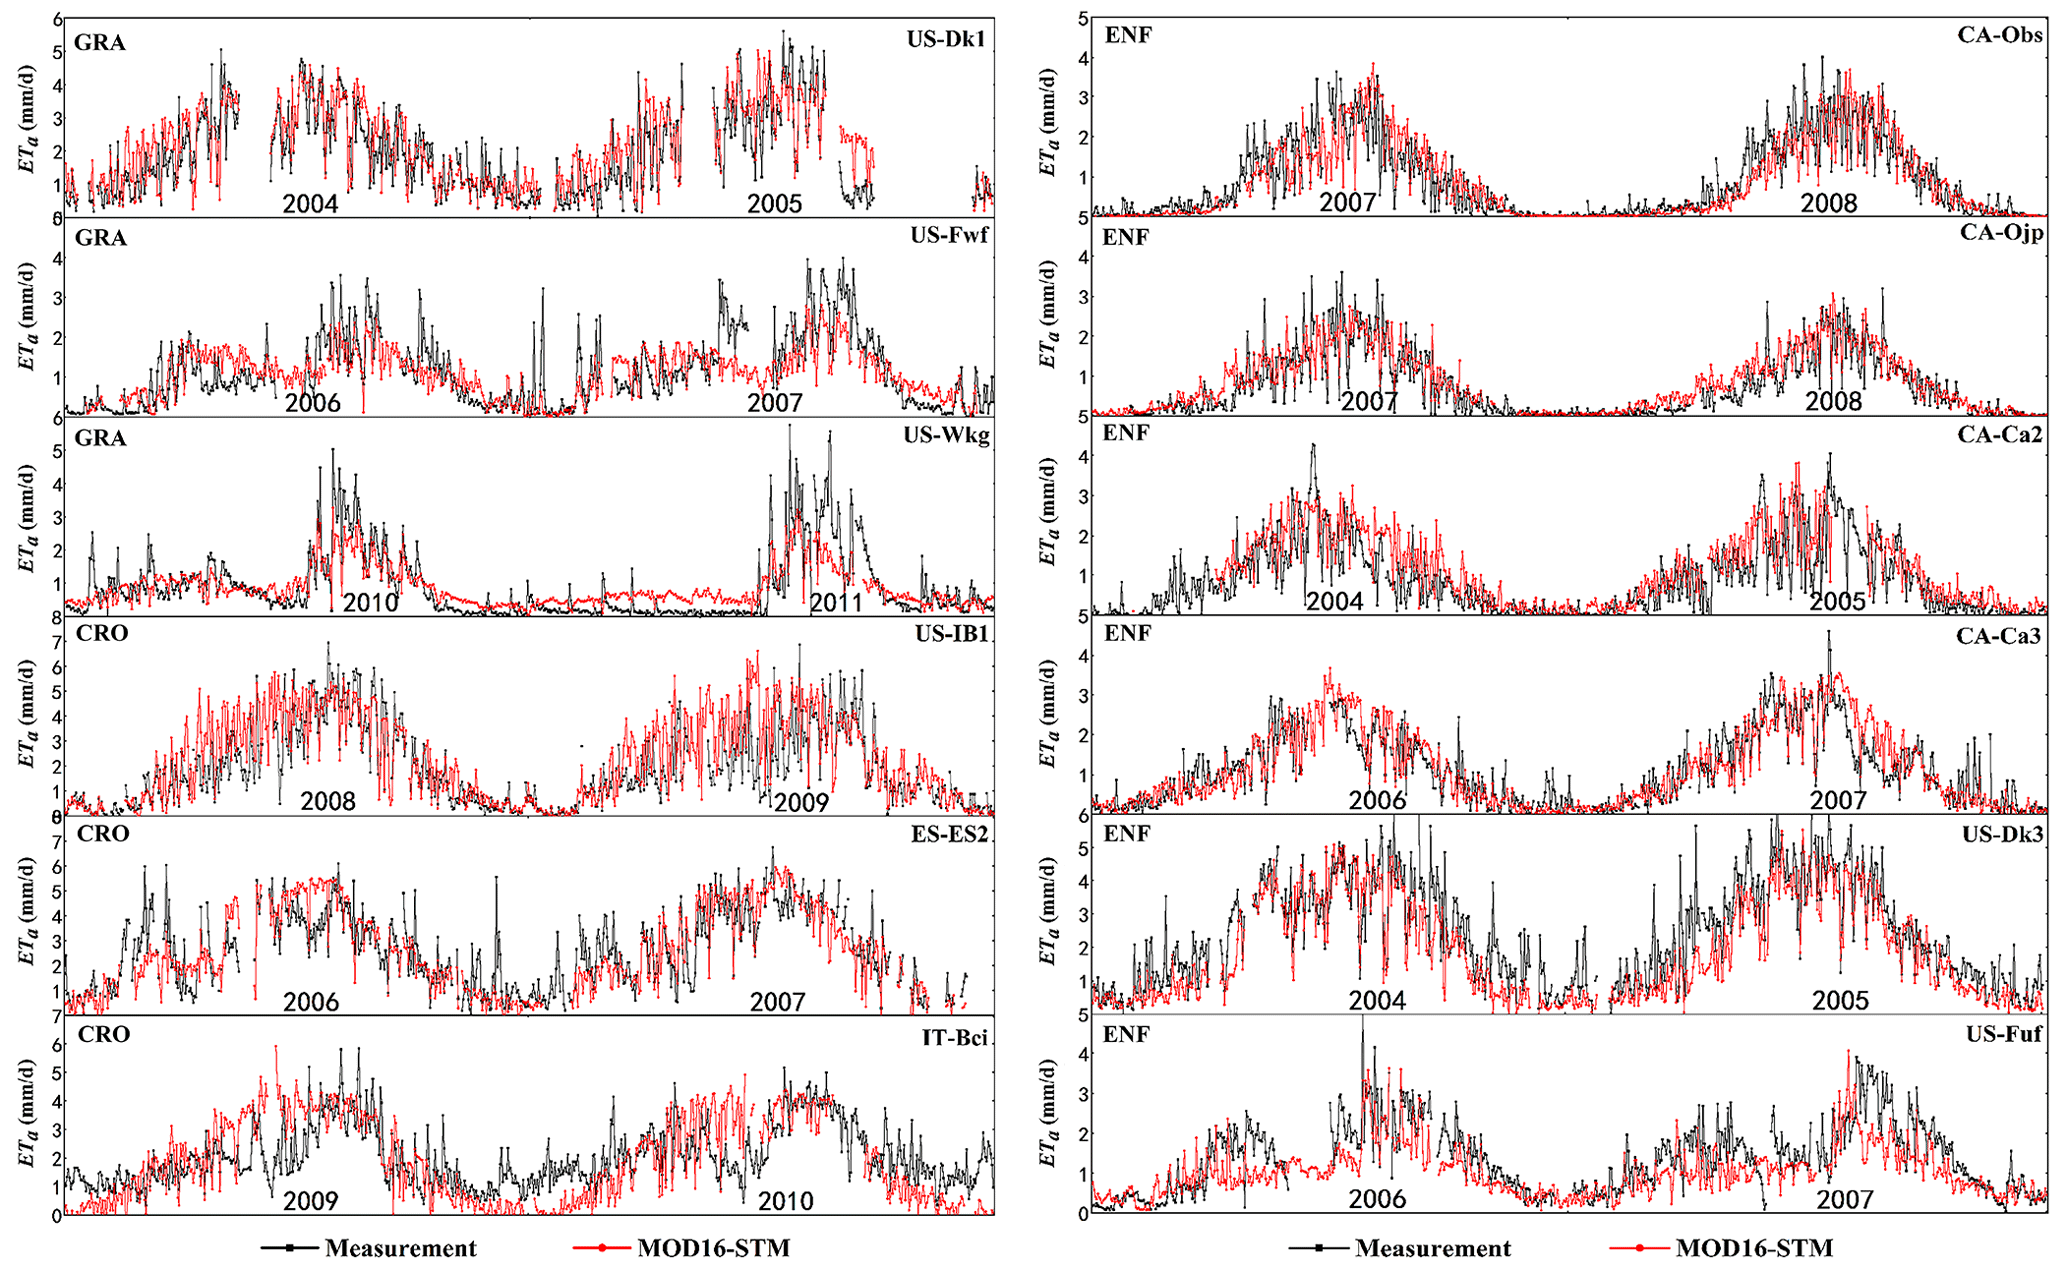
Figure A4Time-series comparisons of the daily ET estimated by the MOD16-STM model and observations at the 12 verification sites, which include three grassland sites (US-DK1, US-Fwf, and US-Wkg), three cropland sites (US-IB1, ES-ES2, and IT-Bci), and six evergreen forest sites (CA-Obs, CA-Ojp, CA-Ca2, CA-Ca3, US-DK3, and US-Fuf), respectively.
YMM, LY, and XLC led the writing of this paper and acknowledge responsibility for the experimental data and results. LY, XLC, and YMM drafted the document, and LY led the consolidation of the input and simulation dataset. XLC revised the manuscript. This paper was written in cooperation with all the co-authors.
The contact author has declared that none of the authors has any competing interests.
Publisher's note: Copernicus Publications remains neutral with regard to jurisdictional claims made in the text, published maps, institutional affiliations, or any other geographical representation in this paper. While Copernicus Publications makes every effort to include appropriate place names, the final responsibility lies with the authors.
This article is part of the special issue “Extreme environment datasets for the three poles”. It is not associated with a conference.
We are grateful for the datasets provided by ChinaFLUX (http://www.chinaflux.org/, last access: 1 February 2024), AmeriFlux (https://ameriflux.lbl.gov/, last access: 1 February 2024), GHG-Europe (http://www.europe-fluxdata.eu/ghg-europe, last access: 1 February 2024), the National Tibetan Plateau Data Center (https://data.tpdc.ac.cn/zh-hans/data, last access: 1 February 2024), the European Centre for Medium-Range Weather Forecasts (ECWMF) (https://www.ecmwf.int/, last access: 1 February 2024), NOAA-NCEI (https://www.ncei.noaa.gov/products/climate-data-records/normalized-difference-vegetation, last access: 1 February 2024), the Global Land Evaporation Amsterdam Model (https://www.gleam.eu/, last access: 1 February 2024), and the National Earth System Science Data Sharing Infrastructure (http://glass-product.bnu.edu.cn/, last access: 1 February 2024). The authors would like to thank all their colleagues at the observation stations on the TP for their maintenance of the instruments.
This study is funded by the Second Tibetan Plateau Scientific Expedition and Research (STEP) Program (2019QZKK0103 and 2019QZKK0105) and the National Natural Science Foundation of China (42230610, 91837208, 41975009).
This paper was edited by Yuyu Zhou and reviewed by Tianbao Zhao and three anonymous referees.
Alaoui, A. and Goetz, B.: Dye tracer and infiltration experiments to investigate macropore flow, Geoderma, 144, 279–286, https://doi.org/10.1016/j.geoderma.2007.11.020, 2008.
Baik, J., Liaqat, U. W., and Choi, M.: Assessment of satellite- and reanalysis-based evapotranspiration products with two blending approaches over the complex landscapes and climates of Australia, Agr. Forest Meteorol., 263, 388–398, https://doi.org/10.1016/j.agrformet.2018.09.007, 2018.
Bibi, S., Wang, L., Li, X., Zhou, J., Chen, D., and Yao, T.: Climatic and associated cryospheric, biospheric, and hydrological changes on the Tibetan Plateau: a review, Int. J. Climatol., 38, 1–17, https://doi.org/10.1002/joc.5411, 2018.
Biermann, T., Babel, W., Ma, W., Chen, X., Thiem, E., Ma, Y., and Foken, T.: Turbulent flux observations and modeling over a shallow lake and a wet grassland in the Nam Co basin, Tibetan Plateau, Theor. Appl. Climatol., 116, 301–316, https://doi.org/10.1007/s00704-013-0953-6, 2014.
Blyth, E. and Harding, R. J.: Methods to separate observed global evapotranspiration into the interception, transpiration, and soil surface evaporation components, Hydrol. Process., 25, 4063–4068, https://doi.org/10.1002/hyp.8409, 2011.
Camillo, P. J. and Gurney, R. J.: A resistance parameter for bare soil evaporation models, Soil Sci., 141, 95–105, https://doi.org/10.1097/00010694-198602000-00001, 1986.
Chang, Y., Qin, D., Ding, Y., Zhao, Q., and Zhang, S.: A modified MOD16 algorithm to estimate evapotranspiration over the alpine meadow on the Tibetan Plateau, China, J. Hydrol., 561, 16–30, https://doi.org/10.1016/j.jhydrol.2018.03.054, 2018.
Che, T., Li, X., Liu, S., Li, H., Xu, Z., Tan, J., Zhang, Y., Ren, Z., Xiao, L., Deng, J., Jin, R., Ma, M., Wang, J., and Yang, X.: Integrated hydrometeorological, snow and frozen-ground observations in the alpine region of the Heihe River Basin, China, Earth Syst. Sci. Data, 11, 1483–1499, https://doi.org/10.5194/essd-11-1483-2019, 2019.
Chen, D., Xu, B., Yao, T., Guo, Z., Cui, P., Chen, F., Zhang, R., Zhang, X., Zhang, Y., Fan, J., Hou, Z., and Zhang, T.: Assessment of past, present, and future environmental changes on the Tibetan Plateau, Kexue Tongbao/Chinese Sci. Bull., 60, 3025–3035, https://doi.org/10.1360/N972014-01370, 2015.
Chen, X., Su, Z., Ma, Y., Yang, K., Wen, J., and Zhang, Y.: An Improvement of Roughness Height Parameterization of the Surface Energy Balance System (SEBS) over the Tibetan Plateau, J. Appl. Meteorol. Clim., 52, 607–622, https://doi.org/10.1175/JAMC-D-12-056.1, 2013.
Chen, X., Su, Z., Ma, Y., Liu, S., Yu, Q., and Xu, Z.: Development of a 10-year (2001–2010) 0.1° data set of land-surface energy balance for mainland China, Atmos. Chem. Phys., 14, 13097–13117, https://doi.org/10.5194/acp-14-13097-2014, 2014.
Chen, X., Massman, W. J., and Su, Z.: A Column Canopy-Air Turbulent Diffusion Method for Different Canopy Structures, J. Geophys. Res.-Atmos., 124, 488–506, https://doi.org/10.1029/2018JD028883, 2019.
Chen, X., Su, Z., Ma, Y., Trigo, I., and Gentine, P.: Remote Sensing of Global Daily Evapotranspiration based on a Surface Energy Balance Method and Reanalysis Data, J. Geophys. Res.-Atmos., 126, e2020JD032873, https://doi.org/10.1029/2020JD032873, 2021.
Chen, Y., Yang, K., Tang, W., Qin, J., and Zhao, L.: Parameterizing soil organic carbon's impacts on soil porosity and thermal parameters for Eastern Tibet grasslands, Sci. China Earth Sci., 55, 1001–1011, https://doi.org/10.1007/s11430-012-4433-0, 2012.
Chen, Y., Xia, J., Liang, S., Feng, J., Fisher, J. B., Li, X., Li, X., Liu, S., Ma, Z., Miyata, A., Mu, Q., Sun, L., Tang, J., Wang, K., Wen, J., Xue, Y., Yu, G., Zha, T., Zhang, L., Zhang, Q., Zhao, T., Zhao, L., and Yuan, W.: Comparison of satellite-based evapotranspiration models over terrestrial ecosystems in China, Remote Sens. Environ., 140, 279–293, https://doi.org/10.1016/j.rse.2013.08.045, 2014.
Cosby, B. J., Hornberger, G. M., Clapp, R. B., and Ginn, T. R.: A Statistical Exploration of the Relationships of Soil Moisture Characteristics to the Physical Properties of Soils, Water Resour. Res., 20, 682–690, https://doi.org/10.1029/WR020i006p00682, 1984.
Cui, J., Tian, L., Wei, Z., Huntingford, C., Wang, P., Cai, Z., and Wang, L.: Quantifying the Controls on Evapotranspiration Partitioning in the Highest Alpine Meadow Ecosystem, Water Resour. Res., 56, https://doi.org/10.1029/2019WR024815, 2020.
Dan, J., Gao, Y., and Zhang, M.: testing and Attributing Evapotranspiration Deviations Using Dynamical Downscaling and Convection-Permitting Modeling over the Tibetan Plateau, Water, 13, 2096, https://doi.org/10.3390/w13152096, 2017.
de Kok, R. J., Kraaijenbrink, P. D. A., Tuinenburg, O. A., Bonekamp, P. N. J., and Immerzeel, W. W.: Towards understanding the pattern of glacier mass balances in High Mountain Asia using regional climatic modelling, The Cryosphere, 14, 3215–3234, https://doi.org/10.5194/tc-14-3215-2020, 2020.
Denef, K., Galdo, I. D., Venturi, A., and Cotrufo, M. F.: Assessment of Soil C and N Stocks and Fractions across 11European Soils under Varying Land Uses, Open J. Soil Sci., 03, 297–313, https://doi.org/10.4236/ojss.2013.37035, 2013.
Dore, S., Montes-Helu, M., Hart, S. C., Hungate, B. A., Koch, G. W., Moon, J. B., Finkral, A., and Kolb, T. E.: Recovery of ponderosa pine ecosystem carbon and water fluxes from thinning and stand-replacing fire, Glob. Change Biol., 18, 3171–3185, https://doi.org/10.1111/j.1365-2486.2012.02775.x, 2012.
Ding, J., Chen, L., Ji, C., Hugelius, G., Li, Y., Liu, L., Qin, S., Zhang, B., Yang, G., Li, F., Fang, K., Chen, Y., Peng, Y., Zhao, X., He, H., Smith, P., Fang, J., and Yang, Y.: Decadal soil carbon accumulation across Tibetan permafrost regions, Nat. Geosci., 10, 420–424, https://doi.org/10.1038/ngeo2945, 2017.
Eyring, V., Bony, S., Meehl, G. A., Senior, C. A., Stevens, B., Stouffer, R. J., and Taylor, K. E.: Overview of the Coupled Model Intercomparison Project Phase 6 (CMIP6) experimental design and organization, Geosci. Model Dev., 9, 1937–1958, https://doi.org/10.5194/gmd-9-1937-2016, 2016.
Farouki, O. T.: The thermal properties of soils in cold regions, Cold Reg. Sci. Technol., 5, 67–75, https://doi.org/10.1016/0165-232X(81)90041-0, 1981.
Fischer, M. L., Billesbach, D. P., Berry, J. A., Riley, W. J., and Torn, M. S.: Spatiotemporal variations in growing season exchanges of CO2, H2O, and sensible heat in agricultural fields of the Southern Great Plains, Earth Interact., 11, 1–12, https://doi.org/10.1175/EI231.1, 2007.
Gan, R., Zhang, Y., Shi, H., Yang, Y., Eamus, D., Cheng, L., Chiew, F., and Yu, Q.: Use of satellite leaf area index estimating evapotranspiration and gross assimilation for Australian ecosystems, Ecohydrology, 11, e1974, https://doi.org/10.1002/eco.1974, 2018.
Good, S. P., Noone, D., and Bowen, G.: Hydrologic connectivity constrains partitioning of global terrestrial water fluxes, Science, 349, 175–177, https://doi.org/10.1126/science.aaa5931, 2015.
Guo, X., Tian, L., Wang, L., Yu, W., and Qu, D.: River recharge sources and the partitioning of catchment evapotranspiration fluxes as revealed by stable isotope signals in a typical high-elevation arid catchment, J. Hydrol., 549, 616–630, https://doi.org/10.1016/j.jhydrol.2017.04.037, 2017.
Han, C., Ma, Y., Chen, X., and Su, Z.: Trends of land surface heat fluxes on the Tibetan Plateau from 2001 to 2012, Int. J. Climatol., 37, 4757–4767, https://doi.org/10.1002/joc.5119, 2017.
Han, C., Ma, Y., Wang, B., Zhong, L., Ma, W., Chen, X., and Su, Z.: Long-term variations in actual evapotranspiration over the Tibetan Plateau, Earth Syst. Sci. Data, 13, 3513–3524, https://doi.org/10.5194/essd-13-3513-2021, 2021.
He, J., Yang, K., Tang, W., Lu, H., Qin, J., Chen, Y., and Li, X.: The first high-resolution meteorological forcing dataset for land process studies over China, Sci. Data., 7, 25, https://doi.org/10.1038/s41597-020-0369-y, 2020.
Högström, U.: Review of some basic characteristics of the atmospheric surface layer, Bound. Lay. Meteorol., 78, 215–246, https://doi.org/10.1007/BF00120937, 1996.
Immerzeel, W. W., Van Beek, L. P. H., and Bierkens, M. F. P.: Climate change will affect the Asian water towers, Science, 328, 1382–1385, https://doi.org/10.1126/science.1183188, 2010.
Immerzeel, W. W., Lutz, A. F., Andrade, M., Bahl, A., Biemans, H., Bolch, T., Hyde, S., Brumby, S., Davies, B., Elmore, A., Emmer, A., Feng, M., Fernández, A., Haritashya, U., Kargel, J., Koppes, M., Kraaijenbrink, P., Kulkarni, A., Mayewski, P., Nepal, S., Pacheco, P., Painter, T., Pellicciotti, F., Rajaram, H., Rupper, S., Sinisalo, A., Shrestha, A., Viviroli, D., Wada, Y., Xiao, C., Yao, T., and Baillie, J. E. M.: Importance and vulnerability of the world' 's water towers, Nature, 577, 364–369, https://doi.org/10.1038/s41586-019-1822-y, 2020.
Irmak, S. and Mutiibwa, D.: On the dynamics of canopy resistance: Generalized linear estimation and relationships with primary micrometeorological variables, Water Resour. Res., 46, W08526, https://doi.org/10.1029/2009WR008484, 2010.
Jarvis, P. G.: The Interpretation of the Variations in Leaf Water Potential and Stomatal Conductance Found in Canopies in the Field, Philos. T. R. Soc. Lond. B., 273, 593–610, https://doi.org/10.1098/rstb.1976.0035, 1976.
Jiang, Y., Yang, K., Qi, Y., Zhou, X., He, J., Lu, H., Li, X., Chen, Y., Li, X., Zhou, B., Mamtimin, A., Shao, C., Ma, X., Tian, J., and Zhou, J.: TPHiPr: a long-term (1979–2020) high-accuracy precipitation dataset (1/30°, daily) for the Third Pole region based on high-resolution atmospheric modeling and dense observations, Earth Syst. Sci. Data, 15, 621–638, https://doi.org/10.5194/essd-15-621-2023, 2023.
Jung, M., Reichstein, M., Ciais, P., Seneviratne, S. I., Sheffield, J., Goulden, M. L., Bonan, G., Cescatti, A., Chen, J., De Jeu, R., Dolman, A., Eugster, W., Gerten, D., Gianelle, D., Gobron, N., Heinke, J., Kimball, J., Law, B., Montagnani, L., Mu, Q., Mueller, B., Oleson, K., Papale, D., Richardson, A., Roupsard, O., Running, S., Tomelleri, E., Viovy, N., Weber, U., Williams. C., Wood, E., Zaehle, S., and Zhang, K.: Recent decline in the global land evapotranspiration trend due to limited moisture supply, Nature, 467, 951–954, https://doi.org/10.1038/nature09396, 2010.
Kang, S., Xu, Y., You, Q., Flügel, W. A., Pepin, N., and Yao, T.: Review of climate and cryospheric change in the Tibetan Plateau, Environ. Res. Lett., 5, 015101, https://doi.org/10.1088/1748-9326/5/1/015101, 2010.
Khan, M. S., Liaqat, U. W., Baik, J., and Choi, M.: Stand-alone uncertainty characterization of GLEAM, GLDAS, and MOD16 evapotranspiration products using an extended triple collocation approach, Agr. Forest Meteorol., 252, 256–268, https://doi.org/10.1016/j.agrformet.2018.01.022, 2018.
Kuang, X. and Jiao, J. J.: Review on climate change on the Tibetan plateau during the last half century, J. Geophys. Res.-Atmos., 121, 3979–4007, https://doi.org/10.1002/2015JD024728, 2016.
Kutsch, W. L., Aubinet, M., Buchmann, N., Smith, P., Osborne, B., Eugster, W., Wattenbach, M., Schrumpf, M., Schulze, E., Tomelleri, E., Ceschia, E., Bernhofer, C., Béziat, P., Carrara, A., Di Tommasi, P., Grunwald, T., Jones, M., Magliulo, V., Moureaux, C., Olioso, A., Sanz, M., Saunders, M., S?gaard, H., and Ziegler, W.: The net biome production of full crop rotations in Europe, Agr. Ecosyst. Environ., 139, 336–345, https://doi.org/10.1016/j.agee.2010.07.016, 2010.
Kool, D., Agam, N., Lazarovitch, N., Heitman, J. L., Sauer, T. J., and Ben-Gal, A.: A review of approaches for evapotranspiration partitioning, Agr. Forest Meteorol., 184, 56–70, https://doi.org/10.1016/j.agrformet.2013.09.003, 2014.
Koster, R. D. and Suarez, M. J.: The Influence of Land Surface Moisture Retention on Precipitation Statistics, J. Climate, 9, 2551–2567, https://doi.org/10.1175/1520-0442(1996)009<2551:TIOLSM>2.0.CO;2, 1996.
Lawrence, D. M., Thornton, P. E., Oleson, K. W., and Bonan, G. B.: The Partitioning of Evapotranspiration into Transpiration, Soil Evaporation, and Canopy Evaporation in a GCM: Impacts on Land–Atmosphere Interaction, J. Hydrometeorol., 8, 862–880, https://doi.org/10.1175/JHM596.1, 2007.
Lehmann, P., Merlin, O., Gentine, P., and Or, D.: Soil texture effects on surface resistance to bare soil evaporation, Geophys. Res. Lett., 45, 10398–10405, https://doi.org/10.1029/2018GL078803, 2018.
Lemone, M. A., Chen, F., Alfieri, J. G., Cuenca, R. H., Hagimoto, Y., Blanken, P., Niyogi, D., Kang, S., Davis, K., and Grossman, R. L.: NCAR/CU surface, soil, and vegetation observations during the International H2O Project 2002 field campaign, B. Am. Meteorol. Soc., 88, 65–81, https://doi.org/10.1175/BAMS-88-1-65, 2007.
Letts, M. G., Comer, N. T., Roulet, N. T., Skarupa, M. R., and Verseghy, D. L.: Parametrization of peatland hydraulic properties for the Canadian land surface scheme, Atmos. Ocean., 38, 141–160, https://doi.org/10.1080/07055900.2000.9649643, 2000.
Leuning, R., Zhang, Y. Q., Rajaud, A., Cleugh, H., and Tu, K.: A simple surface conductance model to estimate regional evaporation using MODIS leaf area index and the Penman–Monteith equation, Water Resour. Res., 44, W10419, https://doi.org/10.1029/2007WR006562, 2010.
Li, S., Hao, X., Du, T., Tong, L., Zhang, J., and Kang, S.: A coupled surface resistance model to estimate crop evapotranspiration in the arid region of northwest China, Hydrol. Process., 28, 2312–2323, https://doi.org/10.2136/vzj2018.04.0072, 2013.
Li, S., Zhang, L., Kang, S., Tong, L., Du, T., Hao, X., and Zhao, P.: Comparison of several surface resistance models for estimating crop evapotranspiration over the entire growing season in arid regions, Agr. Forest Meteorol., 208, 1–15, https://doi.org/10.1016/j.agrformet.2015.04.002, 2015.
Li, S., Wang, G., Sun, S., Chen, H., Bai, P., Zhou, S., Huang, Y., Wang, J., and Deng, P.: Assessment of Multisource Evapotranspiration Products over China Using Eddy Covariance Observations, Remote Sens., 10, 1692, https://doi.org/10.3390/rs10111692, 2018.
Li, S., Wang, G., Sun, S., Fiifi Tawia Hagan, D., Chen, T., Dolman, H., and Liu, Y.: Long-term changes in evapotranspiration over China and attribution to climatic drivers during 1980–2010, J. Hydrol., 59, https://doi.org/10.1016/j.jhydrol.2021.126037, 2021.
Li, X., Liang, S., Yuan, W., Yu, G., Cheng, X., Chen, Y., Zhao, T., Feng, J., Ma, Z., Ma, M., Liu, S., Chen, J., Shao, C., Li, S., Zhang, X., Zhang, Z., Sun, G., Chen, S., Ohta, T., Varlagin, A., Miyata, A., Takagi, K., Saiqusa, N., and Kato, T.: Estimation of evapotranspiration over the terrestrial ecosystems in China, Ecohydrology, 7, 139–149, https://doi.org/10.1002/eco.1341, 2014a.
Li, X., Wang, L., Chen, D., Yang, K., and Wang, A.: Seasonal evapotranspiration changes (1983–2006) of four large basins on the Tibetan Plateau, J. Geophys. Res.-Atmos., 119, 13079–13095, https://doi.org/10.1002/2014JD022380, 2014b.
Liang, S., Cheng, J., Jia, K., Jiang, B., Liu, Q., Xiao, Z., Yao, Y., Yuan, W., Zhang, X., Zhao, X., and Zhou, J.: The global land surface satellite (GLASS) product suite, B. Am. Meteorol. Soc., 102, E323–E337, https://doi.org/10.1175/BAMS-D-18-0341.1, 2021.
Liu, J., Chai, L., Dong, J., Zheng, D., Wigneron, J. P., Liu, S., Zhou, J., Xu, T., Yang, S., Song, Y., Qu, Y., and Lu, Z.: Uncertainty analysis of eleven multisource soil moisture products in the third pole environment based on the three-corned hat method, Remote Sens. Environ., 255, 112225, https://doi.org/10.1016/j.rse.2020.112225, 2021.
Liu, S., Lu, L., Mao, D., and Jia, L.: Evaluating parameterizations of aerodynamic resistance to heat transfer using field measurements, Hydrol. Earth Syst. Sci., 11, 769–783, https://doi.org/10.5194/hess-11-769-2007, 2007.
Liu, S. M., Xu, Z. W., Wang, W. Z., Jia, Z. Z., Zhu, M. J., Bai, J., and Wang, J. M.: A comparison of eddy-covariance and large aperture scintillometer measurements with respect to the energy balance closure problem, Hydrol. Earth Syst. Sci., 15, 1291–1306, https://doi.org/10.5194/hess-15-1291-2011, 2011.
Liu, S. M., Li, X., Xu, Z. W., Che, T., Xiao, Q., Ma, M. G., Liu, Q. H., Jin, R., Guo, J. W., Wang, L. X., Wang, W. Z., Qi, Y., Li, H. Y., Xu, T. R., Ran, Y. H., Hu, X. L., Shi, S. J., Zhu, Z. L., Tan, J. L., Zhang, Y., and Ren, Z. G.: The Heihe Integrated Observatory Network: A Basin-Scale Land Surface Processes Observatory in China, Vadose Zone J., 17, 180072, https://doi.org/10.2136/vzj2018.04.0072, 2018.
Ma, N. and Zhang, Y.: Increasing Tibetan Plateau terrestrial evapotranspiration primarily driven by precipitation, Agr. Forest Meteorol., 317, 108887, https://doi.org/10.1016/j.agrformet.2022.108887, 2022.
Ma, N., Zhang, Y., Guo, Y., Gao, H., Zhang, H., and Wang, Y.: Environmental and biophysical controls on the evapotranspiration over the highest alpine steppe, J. Hydrol., 529, 980–992, https://doi.org/10.1016/j.jhydrol.2015.09.013, 2015a.
Ma, N., Zhang, Y., Xu, C.-Y., and Szilagyi, J.: Modeling actual evapotranspiration with routine meteorological variables in the data-scarce region of the Tibetan Plateau: Comparisons and implications, J. Geophys. Res.-Biogeo., 120, 1638–1657, https://doi.org/10.1002/2015JG003006, 2015b.
Ma, N., Szilagyi, J., Zhang, Y., and Liu, W.: Complementary-Relationship-Based Modeling of Terrestrial Evapotranspiration Across China During 1982–2012: Validations and Spatiotemporal Analyses, J. Geophys. Res.-Atmos., 124, 4326–4351, https://doi.org/10.1029/2018JD029850, 2019.
Ma, Y., Hu, Z., Xie, Z., Ma, W., Wang, B., Chen, X., Li, M., Zhong, L., Sun, F., Gu, L., Han, C., Zhang, L., Liu, X., Ding, Z., Sun, G., Wang, S., Wang, Y., and Wang, Z.: A long-term (2005–2016) dataset of hourly integrated land–atmosphere interaction observations on the Tibetan Plateau, Earth Syst. Sci. Data, 12, 2937–2957, https://doi.org/10.5194/essd-12-2937-2020, 2020.
Ma, Y., Chen, X., and Yuan, L.: Long term variations of monthly terrestrial evapotranspiration over the Tibetan Plateau (1982–2018)[DS/OL], V2, Science Data Bank [data set], CSTR:31253.11.sciencedb.00020, https://doi.org/10.11922/sciencedb.00020 2021.
Merlin, O., Stefan, V. G., Amazirh, A., Chanzy, A., Ceschia, E., Er-Raki, S., and Khabba, S.: Modeling soil evaporation efficiency in a range of soil and atmospheric conditions using a meta-analysis approach, Water Resour. Res., 52, 3663–3684, https://doi.org/10.1002/2015WR018233, 2016.
Miralles, D. G., Holmes, T. R. H., De Jeu, R. A. M., Gash, J. H., Meesters, A. G. C. A., and Dolman, A. J.: Global land-surface evaporation estimated from satellite-based observations, Hydrol. Earth Syst. Sci., 15, 453–469, https://doi.org/10.5194/hess-15-453-2011, 2011.
Miralles, D. G., Jiménez, C., Jung, M., Michel, D., Ershadi, A., McCabe, M. F., Hirschi, M., Martens, B., Dolman, A. J., Fisher, J. B., Mu, Q., Seneviratne, S. I., Wood, E. F., and Fernández-Prieto, D.: The WACMOS-ET project – Part 2: Evaluation of global terrestrial evaporation data sets, Hydrol. Earth Syst. Sci., 20, 823–842, https://doi.org/10.5194/hess-20-823-2016, 2016.
Monteith, J. L.: Evaporation and environment, Symp. Soc. Exp. Biol., 19, 205–234, 1965.
Mu, Q., Heinsch, F. A., Zhao, M., and Running, S. W.: Development of a global evapotranspiration algorithm based on MODIS and global meteorology data, Remote Sens. Environ., 111, 519–536, https://doi.org/10.1016/j.rse.2007.04.015, 2007.
Mu, Q., Zhao, M., and Running, S. W.: Improvements to a MODIS global terrestrial evapotranspiration algorithm, Remote Sens. Environ., 115, 1781–1800, https://doi.org/10.1016/j.rse.2011.02.019, 2011
Muñoz-Sabater, J., Dutra, E., Agustí-Panareda, A., Albergel, C., Arduini, G., Balsamo, G., Boussetta, S., Choulga, M., Harrigan, S., Hersbach, H., Martens, B., Miralles, D. G., Piles, M., Rodríguez-Fernández, N. J., Zsoter, E., Buontempo, C., and Thépaut, J.-N.: ERA5-Land: a state-of-the-art global reanalysis dataset for land applications, Earth Syst. Sci. Data, 13, 4349–4383, https://doi.org/10.5194/essd-13-4349-2021, 2021.
Novick, K. A., Stoy, P. C., Katul, G. G., Ellsworth, D. S., Siqueira, M. B. S., Juang, J., and Oren, R.: Carbon dioxide and water vapor exchange in a warm temperate grassland, Oecologia, 138, 259–274, https://doi.org/10.1007/s00442-003-1388-z, 2004.
Ortega-Farias, S., Poblete-Echeverría, C., and Brisson, N.: Parameterization of a two-layer model for estimating vineyard evapotranspiration using meteorological measurements, Agr. Forest Meteorol., 150, 276–286, https://doi.org/10.1016/j.agrformet.2009.11.012, 2010.
Paulson, C. A.: The Mathematical Representation of Wind Speed and Temperature Profiles in the Unstable Atmospheric Surface Layer, J. Appl. Meteorol., 9, 857–861, https://doi.org/10.1175/1520-0450(1970)009<0857:tmrows>2.0.co;2, 1970.
Peng, J., Loew, A., Chen, X., Ma, Y., and Su, Z.: Comparison of satellite-based evapotranspiration estimates over the Tibetan Plateau, Hydrol. Earth Syst. Sci., 20, 3167–3182, https://doi.org/10.5194/hess-20-3167-2016, 2016.
Phillips, T. J., Klein, S. A., Ma, H. Y., Tang, Q., Xie, S., Williams, I. N., Joseph, A., David, R., and Margaret, S.: Using ARM observations to evaluate climate model simulations of land-atmosphere coupling on the U.S. Southern Great Plains, J. Geophys. Res.-Atmos., 122, 11524–11548, https://doi.org/10.1002/2017JD027141, 2017.
Ramoelo, A., Majozi, N., Mathieu, R., Jovanovic, N., Nickless, A., and Dzikiti, S.: Validation of Global Evapotranspiration Product (MOD16) using Flux Tower Data in the African Savanna, South Africa, Remote Sens.-Basel, 6, 7406–7423, https://doi.org/10.3390/rs6087406, 2014.
Rodell, M., Houser, P. R., Jambor, U., Gottschalck, J., Mitchell, K., Meng, C. J., Arsenault, K., Cosgrovem B., Radakovich, J., Bosilovich, M., Entin, J., Walker, J., Lohmann, D., and Toll, D.: The Global Land Data Assimilation System, B. Am. Meteorol. Soc., 85, 381–394, https://doi.org/10.1175/BAMS-85-3-381, 2004.
Sakaguchi, K. and Zeng, X.: Effects of soil wetness, plant litter, and under-canopy atmospheric stability on ground evaporation in the Community Land Model (CLM3.5), J. Geophys. Res.-Atmos., 114, https://doi.org/10.1029/2008JD010834, 2009.
Schlesinger, W. H. and Jasechko, S.: Transpiration in the global water cycle, Agr. Forest Meteorol., 189–190, 115–117, https://doi.org/10.1016/j.agrformet.2014.01.011, 2014.
Sellers, P. J., Randall, D. A., Collatz, G. J., Berry, J. A., Field, C. B., Dazlich, D. A., and Bounoua, L.: A Revised Land Surface Parameterization (SiB2) for Atmospheric GCMS. Part I: Model Formulation, J. Climate, 9, 676–705, https://doi.org/10.1175/1520-0442(1996)009<0676:ARLSPF>2.0.CO;2, 1996.
Shi, Q. and Liang, S.: Surface-sensible and latent heat fluxes over the Tibetan Plateau from ground measurements, reanalysis, and satellite data, Atmos. Chem. Phys., 14, 5659–5677, https://doi.org/10.5194/acp-14-5659-2014, 2014.
Sobrino, J. A., Jiménez-Muñoz, J. C., and Paolini, L.: Land surface temperature retrieval from LANDSAT TM 5, Remote Sens. Environ., 90, 434–440, https://doi.org/10.1016/j.rse.2004.02.003, 2004.
Song, L., Zhuang, Q., Yin, Y., Zhu, X., and Wu, S.: Spatio-temporal dynamics of evapotranspiration on the Tibetan Plateau from 2000 to 2010, Environ. Res. Lett., 12, 014011, https://doi.org/10.1088/1748-9326/aa527d, 2017.
Su, Z.: The Surface Energy Balance System (SEBS) for estimation of turbulent heat fluxes, Hydrol. Earth Syst. Sci., 6, 85–100, https://doi.org/10.5194/hess-6-85-2002, 2002.
Sun, S. F.: Moisture and heat transport in a soil layer forced by atmospheric conditions, Master thesis, Dept. of Civil Engineering, University of Connecticut, 72, 1982.
Tang, J. Y. and Riley, W. J.: A new top boundary condition for modeling surface diffusive exchange of a generic volatile tracer: theoretical analysis and application to soil evaporation, Hydrol. Earth Syst. Sci., 17, 873–893, https://doi.org/10.5194/hess-17-873-2013, 2013.
Thom, A. S.: Momentum, mass and heat exchange of vegetation, Q. J. Roy. Meteor. Soc., 98, 124–134, https://doi.org/10.1002/qj.49709841510, 1972.
Wang, B., Ma, Y., Su, Z., Wang, Y., and Ma, W.: Quantifying the evaporation amounts of 75 high-elevation large dimictic lakes on the Tibetan Plateau, Sci. Adv., 6, eaay8558, https://doi.org/10.1126/sciadv.aay8558, 2020.
Wang, G., Lin, S., Hu, Z., Lu, Y., Sun, X., and Huang, K.: Improving Actual Evapotranspiration Estimation Integrating Energy Consumption for Ice Phase Change Across the Tibetan Plateau, J. Geophys. Res.-Atmos., 125, e2019JD031799, https://doi.org/10.1029/2019JD031799, 2020.
Wang, W., Li, J., Yu, Z., Ding, Y., Xing, W., and Lu, W.: Satellite retrieval of actual evapotranspiration in the Tibetan Plateau: components partitioning, multi-decadal trends and dominated factors identifying, J. Hydrol., 559, 471–485, https://doi.org/10.1016/j.jhydrol.2018.02.065, 2018.
Wang, Y., Lv, W., Xue, K., Wang, S., Zhang, L., Hu, R., Zeng, H., Xu, X., Li, Y., Jiang, L., Hao, Y., Du, J., Sun, J., Dorji, T., Piao, S., Wang, C., Luo, C., Zhang, Z., Chang, X., Zhang, M., Hu, Y., Wu, T., Wang, J., Li, B., Liu, P., Zhou, Y., Wang, A., Dong, S., Zhang, X., Gao, Q., Zhou, H., Shen, M., Wilkes, A., Miehe, G., Zhao, X., and Niu, H.: Grassland changes and adaptive management on the Qinghai–Tibetan Plateau, Nat. Rev. Earth. Environ., 3, 668–683, https://doi.org/10.1038/s43017-022-00330-8, 2022.
Wei, Z., Yoshimura, K., Wang, L., Miralles, D. G., Jasechko, S., and Lee, X.: Revisiting the contribution of transpiration to global terrestrial evapotranspiration, Geophys. Res. Lett., 44, 2792–2801, https://doi.org/10.1002/2016GL072235, 2017.
Wieder, W. R., Boehnert, J., Bonan, G. B., and Langseth, M.: Regridded Harmonized World Soil Database v1.2. Data set, Oak Ridge National Laboratory Distributed Active Archive Center [data set], Oak Ridge, Tennessee, USA, https://doi.org/10.3334/ORNLDAAC/1247, 2014.
Wilcox, B. P., Breshears, D. D., and Seyfried, M. S.: Water balance on rangelands, in: Encyclopedia of Water Science, edited by: Stewart, B. A. and Howell, T. A., Marcel Dekker Inc, New York, 791–794, http://www.cprl.ars.usda.gov/wmru/pdfs/DekkerEvettTDR.pdf (last access: 1 February 2024), 2003.
Wu, C., Hu, B. X., Huang, G., and Zhang, H.: Effects of climate and terrestrial storage on the temporal variability of actual evapotranspiration, J. Hydrol., 549, 388–403, https://doi.org/10.1016/j.jhydrol.2017.04.012, 2017.
Xu, X., Dong, L., Zhao, Y., and Wang, Y.: Effect of the Asian Water Tower over the Qinghai-Tibet Plateau and the characteristics of atmospheric water circulation, Kexue Tongbao/Chinese Science Bulletin, 64, 2830–2841, https://doi.org/10.1360/TB-2019-0203, 2019.
Yang, K., Koike, T., Ishikawa, H., Kim, J., Li, X., Liu, H., Liu S., Ma Y., and Wang, J.: Turbulent flux transfer over bare-soil surfaces: Characteristics and parameterization, J. Appl. Meteorol. Clim., 47, 276–290, https://doi.org/10.1175/2007JAMC1547.1, 2008.
Yang, K., He, J., Tang, W., Qin, J., and Cheng, C. C. K.: On downward shortwave and longwave radiations over high altitude regions: Observation and modeling in the Tibetan Plateau, Agr. Forest Meteorol., 150, 38–46, https://doi.org/10.1016/j.agrformet.2009.08.004, 2010.
Yang, K., Wu, H., Qin, J., Lin, C., Tang, W., and Chen, Y.: Recent climate changes over the Tibetan Plateau and their impacts on energy and water cycle: A review, Global Planet. Change, 112, 79–91, https://doi.org/10.1016/j.gloplacha.2013.12.001, 2014.
Yang, Y., Liu, Y., Li, M., Hu, Z., and Ding, Z.: Assessment of reanalysis flux products based on eddy covariance observations over the Tibetan Plateau, Theor. Appl. Climatol., 138, 275–292, https://doi.org/10.1007/s00704-019-02811-1, 2019.
Yao, T., Thompson, L., Yang, W., Yu, W., Gao, Y., Guo, X., Yang, X., Duan, K., Zhao, H., Xu, B., Pu, J., Lu, A., Xiang, Y., Kattel, D., and Joswiak, D.: Different glacier status with atmospheric circulations in Tibetan Plateau and surroundings, Nat. Clim. Change, 2, 663–667, https://doi.org/10.1038/nclimate1580, 2012.
Yao, Y., Liang, S., Cheng, J., Liu, S., Fisher, J. B., Zhang, X., Jia, K., Zhao, X., Qin, Q., Zhao, B., Han, S., Zhou, G., Li, Y., and Zhao, S.: MODIS-driven estimation of terrestrial latent heat flux in China based on a modified Priestley-Taylor algorithm, Agr. Forest Meteorol., 171–172, 187–202, https://doi.org/10.1016/j.agrformet.2012.11.016, 2013.
Yin, Y., Wu, S., Zhao, D., Zheng, D., and Pan, T.: Modeled effects of climate change on actual evapotranspiration in different eco-geographical regions in the Tibetan Plateau, J. Geogr. Sci., 23, 195–207, https://doi.org/10.1002/eco.1341, 2013.
You, Q., Xue, X., Peng, F., Dong, S., and Gao, Y.: Surface water and heat exchange comparison between alpine meadow and bare land in a permafrost region of the Tibetan Plateau, Agric. For. Meteorol., 232, 48–65, https://doi.org/10.1016/j.agrformet.2016.08.004, 2017.
Yu, G. R., Wen, X. F., Sun, X. M., Tanner, B. D., Lee, X., and Chen, J. Y.: Overview of ChinaFLUX and evaluation of its eddy covariance measurement, Agr. Forest Meteorol., 137, 125–137, https://doi.org/10.1016/j.agrformet.2006.02.011, 2006.
Yuan, L.: A Monthly 0.05∘ Terrestrial Evapotranspiration Dataset (1982–2018) for the Tibetan Plateau, National Tibetan Plateau/Third Pole Environment Data Center [data set], https://doi.org/10.11888/Terre.tpdc.271913, 2021.
Yuan, L., Ma, Y., Chen, X., Wang, Y., Li, Z.: An enhanced MOD16 evapotranspiration model for the Tibetan Plateau during the unfrozen season, J. Geophys. Res.-Atmos., 126, e2020JD032787, https://doi.org/10.1029/2020JD032787, 2021.
Zhang, G., Yao, T., Xie, H., Yang, K., Zhu, L., Shum, C. K., Bolch, T., Yi, S., Allen, S., Jiang, L., Chen, W., and Ke, C.: Response of Tibetan Plateau lakes to climate change: Trends, patterns, and mechanisms, Earth-Sci. Rev., 28, 103269, https://doi.org/10.1016/j.earscirev.2020.103269, 2020.
Zhang, K., Kimball, J. S., Nemani, R. R., and Running, S. W.: A continuous satellite-derived global record of land surface evapotranspiration from 1983 to 2006, Water Resour. Res., 46, W09522, https://doi.org/10.1029/2009WR008800, 2010.
Zhang, L. M., Luo, Y. W., Liu, M., Chen, Z., Su, W., He, H., Zhu, Z., Sun, X., Wang, Y., Zhou, G., Zhao, X., Han, S., Ouyang, Zhu., Zhang, X., Zhang, Y., Liu, Q., Hao, Y., Yan, J., Zhang, D., Li, Y., Wang, A., Wu, J., Li, F., Zhao, F., Shi, P., Zhang, Y., He, Y., Lin, L., Song, Q., Wang, H.,, Liu, Y., and Yu, G.: Carbon and water fluxes observed by the Chinese Flux Observation and Research Network (2003–2005), Sci. Data., 4, https://doi.org/10.11922/csdata.2018.0028.zh, 2019 (in Chinese).
Zhang, Y., Kong, D., Gan, R., Chiew, F. H. S., McVicar, T. R., Zhang, Q., and Yang, Y.: Coupled estimation of 500 m and 8-day resolution global evapotranspiration and gross primary production in 2002–2017, Remote Sens. Environ., 222, 165–182, https://doi.org/10.1016/j.rse.2018.12.031, 2019.
Zhang, Y., Peña-Arancibia, J. L., McVicar, T. R., Chiew, F. H. S., Vaze, J., Liu, C., Lu, X., Zheng, H., Wang, Y., Liu, Y., Miralles, D., and Pan, M.: Multi-decadal trends in global terrestrial evapotranspiration and its components, Sci. Rep., 6, 19124, https://doi.org/10.1038/srep19124, 2016.
Zhao, H., Zeng, Y., Lv, S., and Su, Z.: Analysis of soil hydraulic and thermal properties for land surface modeling over the Tibetan Plateau, Earth Syst. Sci. Data, 10, 1031–1061, https://doi.org/10.5194/essd-10-1031-2018, 2018.
Zheng, C., Jia, L., and Hu, G.: Global Land Surface Evapotranspiration Monitoring by ETMonitor Model Driven by Multi-source Satellite Earth Observations, J. Hydrol., 613, 128444, https://doi.org/10.1016/j.jhydrol.2022.128444, 2022.
Zhong, L., Ma, Y., Hu, Z., Fu, Y., Hu, Y., Wang, X., Cheng, M., and Ge, N.: Estimation of hourly land surface heat fluxes over the Tibetan Plateau by the combined use of geostationary and polar-orbiting satellites, Atmos. Chem. Phys., 19, 5529–5541, https://doi.org/10.5194/acp-19-5529-2019, 2019.
Zohaib, M., Kim, H., and Choi, M.: Evaluating the patterns of spatiotemporal trends of root zone soil moisture in major climate regions in East Asia, J. Geophys. Res.-Atmos., 122, 7705–7722, https://doi.org/10.1002/2016JD026379, 2017.
- Abstract
- Introduction
- Materials and methods
- Results
- Discussions
- Data availability
- Conclusions
- Appendix A: MOD16-STM model validation at flux site out of the Tibetan Plateau
- Author contributions
- Competing interests
- Disclaimer
- Special issue statement
- Acknowledgements
- Financial support
- Review statement
- References