the Creative Commons Attribution 4.0 License.
the Creative Commons Attribution 4.0 License.
 | 29 Jan 2024
Ground- and ship-based microwave radiometer measurements during EUREC4A
Andreas Foth
Heike Kalesse-Los
Mario Mech
Claudia Acquistapace
Friedhelm Jansen
Ulrich Löhnert
Bernhard Pospichal
Johannes Röttenbacher
Susanne Crewell
Bjorn Stevens
During the EUREC4A field study, microwave radiometric measurements were performed at Barbados Cloud Observatory (BCO) and aboard RV Meteor and RV Maria S Merian in the downstream winter trades of the North Atlantic. We present retrieved integrated water vapor (IWV), liquid water path (LWP), and temperature and humidity profiles as a unified, quality-controlled, multi-site data set on a 3 s temporal resolution for a core period between 19 January and 14 February 2020 in which all instruments were operational. Multi-channel radiometric measurements were performed at BCO and aboard RV Meteor between 22 and 31 GHz (K-band) and from 51 to 58 GHz (V-band). Combined radar–radiometer measurements of a W-band Doppler radar with a single-channel radiometer instrument were conducted at 89 GHz aboard RV Meteor and RV Maria S Merian. We present a novel retrieval method to retrieve LWP from single-channel 89 GHz measurements, evaluate retrieved quantities with independent measurements, and analyze retrieval uncertainties by site and instrument intercomparison. Mean IWV conditions of 31.8 kg m−2 match independent radiosoundings at BCO with a root-mean-square difference of 1.1 kg m−2. Mean LWP conditions in confidently liquid cloudy, non-precipitating conditions ranged between 63.1 g m−2 at BCO and 46.8 g m−2 aboard RV Maria S Merian. Aboard the ships, 90 % of LWP was below 120 g m−2 with a 30 % uncertainty for LWP of 50 g m−2. Up to 20 % of confidently liquid cloudy profiles ranged below the LWP detection limit due to optically thin clouds.
The data set comprises of processed raw data (Level 1), full quality-controlled post-processed instrument data (Level 2), a unified temporal resolution (Level 3), and a ready-to-use multi-site time series of IWV and LWP (Level 4), available to the public via AERIS (https://doi.org/10.25326/454##v2.0; Schnitt et al., 2023a). The data set complements the airborne LWP measurements conducted during EUREC4A and provides a unique benchmark tool for satellite evaluation and model–observation studies.
- Article
(2414 KB) - Full-text XML
- BibTeX
- EndNote


The subtropical oceans are ubiquitously covered by shallow trade-wind cumulus clouds. While small in individual size and height, cloud fields are large in their extent, which makes them important for the radiative budget through the short-wave reflected radiation which is directly related to the liquid water amount and distribution in the cloud. Large inter-model spreads of climate sensitivity are thought to be related to the representation of these clouds in current climate models (Bony et al., 2015; Dufresne and Bony, 2008; Vial et al., 2013; Zelinka et al., 2020; Jahangir et al., 2021) and their potential role in mediating the long-wave radiative response to warming (Stevens and Kluft, 2023). Open questions include the interaction of these clouds with their environment and their coupling to circulation and convection (Bony et al., 2017).
In order to elucidate the underlying processes of the interactions, high-quality and fine-resolution observations were gathered during the EUREC4A field study in January and February 2020 (Stevens et al., 2021) over the tropical Atlantic, east of Barbados. A range of complementary atmospheric and oceanic measurements were performed by four different research aircraft (Konow et al., 2021; Bony et al., 2022; Pincus et al., 2021), as well as by ground- and ship-based observations (e.g., Acquistapace et al., 2022; Kalesse-Los et al., 2023). Microwave radiometric measurements were conducted at Barbados Cloud Observatory (BCO; Stevens et al., 2016), as well as aboard RV Meteor (hereafter referred to as Meteor) and the RV Maria S Merian (hereafter referred to as Merian). These measurements manifest an important contribution to the overall data set as they quantify cloud liquid water and water vapor amount statistically at high temporal resolution. Here, we present the data set of integrated water vapor (IWV) and liquid water path (LWP) as well as profiles of temperature (T) and absolute humidity (ρv) retrieved from the measurements at BCO and aboard Meteor and Merian.
Passive microwave radiometry is widely in use on satellites, airborne platforms such as the High Altitude and LOng range (HALO) research aircraft (Mech et al., 2014; Stevens et al., 2019), research vessels like RV Polarstern (Walbröl et al., 2022), and ground-based supersites like the Atmospheric Radiation Measurement (ARM) program (Stokes and Schwartz, 1994) or CloudNet (Illingworth et al., 2007) to continuously measure IWV and LWP. LWP conditions in the North Atlantic winter trades have been previously measured during the RICO (Rain in shallow Cumulus over the Ocean; Rauber et al., 2007) campaign. During the Next Generation Aircraft Remote Sensing for Validation Studies (NARVAL) I and II campaigns (Stevens et al., 2019; Jacob et al., 2019; Schnitt et al., 2017), airborne microwave radiometric measurements were performed by the HALO microwave package HAMP (HAMP; Mech et al., 2014), providing benchmark observations to elucidate cloud and precipitation properties in storm-resolving models (Jacob et al., 2020). During EUREC4A, airborne measurements were again performed by the HALO-HAMP as described in Konow et al. (2021) and available in Jacob (2021). Spaceborne observations of LWP in warm oceanic clouds reveal large biases depending on the used sensor and retrieval approach (Seethala and Horvath, 2010; Elsaesser et al., 2017). The here-presented ground- and ship-based microwave radiometer (MWR) measurements therefore provide an important high-resolution data set of IWV and LWP to evaluate airborne or spaceborne retrievals and to benchmark existing and future modeling experiments.
As opposed to remote sensing in the visible or infrared parts of the spectrum, passive MWR measurements are sensitive to the full vertical column as clouds are semi-transparent in the microwave frequencies. Water vapor, oxygen, and liquid water emit at characteristic frequencies. Emissions can be measured as brightness temperatures (TB) following Planck's law. While water vapor and oxygen emit in distinct absorption bands in the K and G bands (around 22.2 and 183.3 GHz, respectively) and V and F bands (60.0 and 118.8 GHz, respectively), liquid water emissions increase with increasing frequency (Ulaby, 2014). Therefore, channels in the water-vapor-sensitive K-band need to be paired with measurements from a window channel around 31.4 or 90 GHz to allow for a simultaneous retrieval of IWV and LWP (Westwater, 1978; Löhnert and Crewell, 2003). Single-channel measurements around 90 GHz provide higher sensitivity to LWP but require knowledge of IWV to solve the underdetermined inversion problem (e.g., Westwater et al., 2001; Billault-Roux and Berne, 2021). Absolute humidity profiles with limited vertical resolution (Löhnert et al., 2009) can be derived if multiple channels are located along the wing of the 22.24 or 183 GHz line. Temperature profiles of better than 500 m vertical resolution can be obtained from the oxygen absorption complex around 50 GHz. A higher resolution can be achieved by scanning at different elevation angles (Crewell and Löhnert, 2007). A scattering contribution to the measured TB only occurs if ice is present in clouds for frequencies above 90 GHz (e.g., Weng et al., 2003).
The TB measured by the Humidity and Temperature PROfiler (HATPRO; Rose et al., 2005), a 14-channel state-of-the-art microwave radiometer, allows for the retrieval of IWV and LWP, as well as temperature and humidity profiles, based on statistical regression techniques (Löhnert and Crewell, 2003), physical retrievals (Turner et al., 2007a; Maahn et al., 2020), or neural networks (Cadeddu et al., 2009; Jacob et al., 2019). Measurements can only be obtained in non-precipitating conditions as a wet radome causes non-atmospheric liquid emissions. A HATPRO is permanently installed at BCO (Stevens et al., 2016), here referred to as BCOHAT. During EUREC4A, BCOHAT measurements were complemented by HATPRO measurements aboard Meteor performed by the Leipzig Institute for Meteorology (LIM), here referred to as LIMHAT. Aboard Meteor, a 94 GHz cloud radar (Küchler et al., 2017) was installed, equipped with a passive radiometer channel measuring TB at 89 GHz (Kalesse-Los et al., 2023), here referred to as LIMRAD. A similar instrument was operated aboard Merian (Acquistapace et al., 2022), here referred to as MSMRAD. As water vapor and liquid water both contribute to the single-channel TB, we retrieve IWV from LIMRAD and MSMRAD only in clear-sky conditions. We use a novel retrieval method to derive cloudy LWP from the brightness temperature difference between cloudy and clear-sky TB rather than from absolute TB measurements.
This paper describes the network of continuous ground- and ship-based microwave radiometer measurements in a core period of 19 January until 14 February 2020, during which all four instruments were operational. We document the setup and installation of the instruments (Sect. 2), introduce the retrieval methods (Sect. 3), and describe precipitation and cloud masking as well as data processing (Sect. 4). We use independent measurements to derive and evaluate the retrieved IWV (Sect. 5) and analyze LWP conditions and uncertainties (Sect. 6). Retrieved temperature and humidity profiles are discussed in Sect. 7. We conclude the paper in Sect. 9 by summarizing and highlighting further scientific applications for this data set.
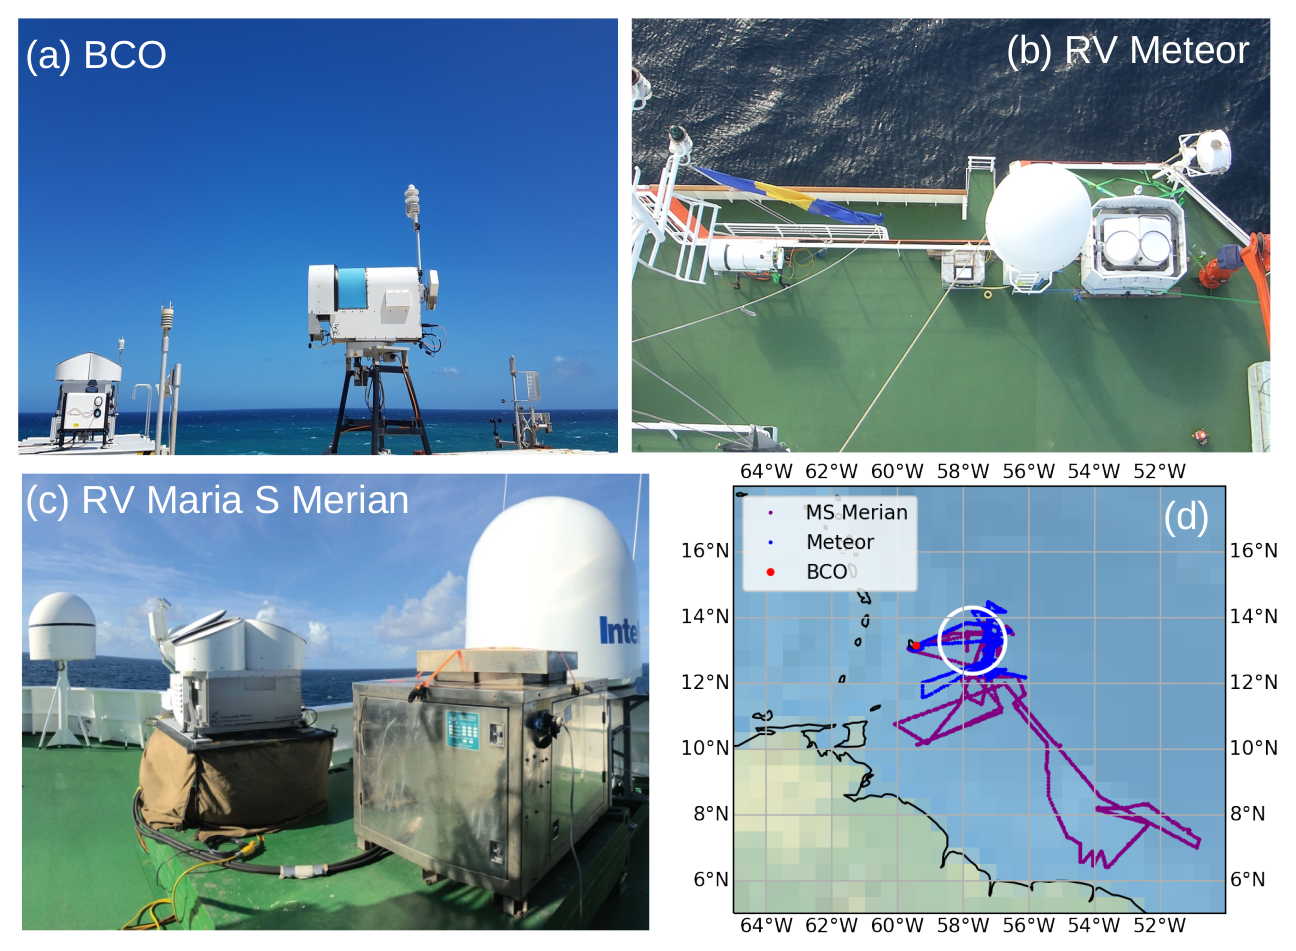
Figure 1Installation of (a) MWR BCOHAT at BCO, (b) MWR LIMHAT and cloud radar LIMRAD aboard Meteor, (c) cloud radar MSMRAD aboard Merian, and (d) map of operations with BCO (red) and Meteor (blue) and Merian (purple) ship tracks, including the circle flown by the HALO aircraft (white) for orientation.
Table 1Overview of passive microwave measurements performed during EUREC4A at BCO and aboard Meteor and Merian. Measured quantities, retrieved variables, each instrument's scan strategy, and the covered time periods are given.
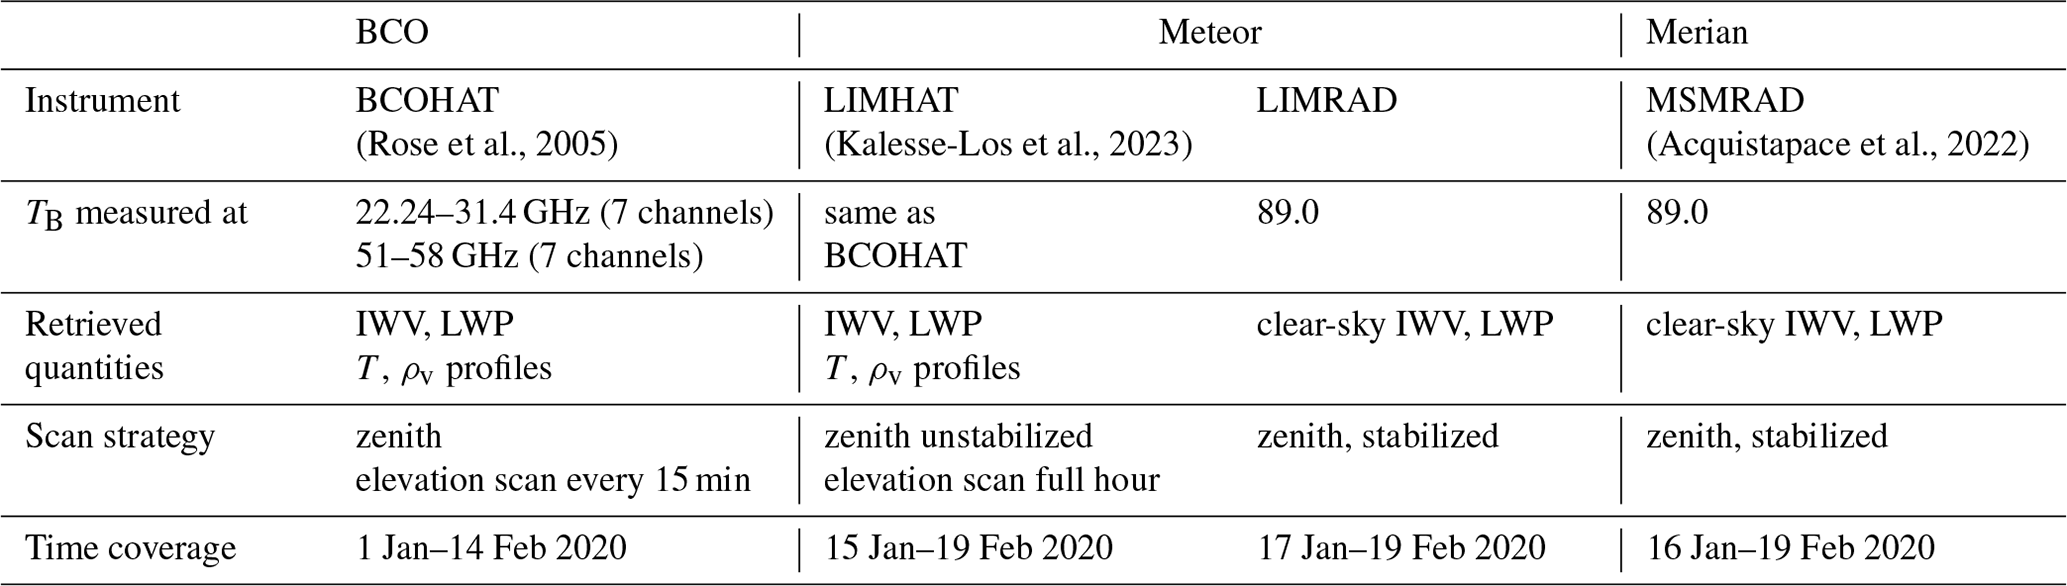
During EUREC4A, passive radiometer measurements were performed from BCO, Meteor, and Merian. The following subsections describe the installation details of the instruments at each site, respectively. Instrument details and retrieved quantities are summarized in Table 1. Installation and map of operations are shown in Fig. 1. Microwave radiometer measurements were not performed aboard RV Ronald H Brown. While an inter-platform comparison is generally performed statistically, two distinct periods of measurement allow for a direct comparison of the ship-based measurements. On 19 January 2020 between 00:00 and 12:00 UTC, both research vessels were steaming next to one another from −58 to −57.3∘ W between 13.8 and 13.75∘ N. On 7 February 2020, the ships were collocated at −57.2∘ W, 12.4∘ N between 11:00 and 18:00 UTC.
2.1 BCO
The RPG-HATPRO Generation 5 multi-channel microwave radiometer BCOHAT has been continuously operating on top of a container at 25 in proximity to the island shore (see Fig. 1a and Stevens et al., 2016). An absolute calibration with liquid nitrogen was performed before the start of the EUREC4A operations on 14 January 2020. BCOHAT measured according to the following regularly occurring scan strategy: azimuth scans at 30∘ elevation angle were performed for the duration of 5 min every 40 min, followed by an elevation scan covering 10 elevation angles (90, 30, 19.2, 14.4, 11.4, 8.4, 6.6, 5.4, 4.8, 4.2∘) at 0∘ azimuth position (later referred to as elevation scan; Crewell and Löhnert, 2007). Zenith measurements are performed for 15 min at a temporal resolution of 2 s. Due to technical difficulties with the scanning unit, the scanning strategy changed after 1 February 2020: azimuth scans were not performed, and operations were limited to zenith mode with elevation scans available every 15 min. These technical difficulties also affected the associated BCOHAT weather station. From 26 January 2020 onwards, data from the adjacent BCO weather station were used instead to flag measurements for precipitation (https://doi.org/10.25326/54, Jansen et al., 2020). No measurements were performed between 29 and 31 January 2020, due to maintenance on the instrument. A blowing unit was operational to mitigate the deposition of rain on the radomes during and after precipitation events.
2.2 Meteor
Aboard Meteor, the Leipzig Institute for Meteorology (LIM) of Leipzig University operated an MWR-type RPG-HATPRO Generation 5 (here referred to as LIMHAT) and a radar–radiometer system of type RPG-FMCW-94 dual polarization (DP), operating actively in the W-band (94 GHz) and containing a passive radiometer channel at 89 GHz (Küchler et al., 2017; Kalesse-Los et al., 2023; here referred to as LIMRAD). Both instruments were placed 4.5 m apart on the navigation deck of the ship at 15.8 to avoid sea spray. LIMHAT operated at a temporal resolution of 1 s in zenith mode. Elevation scans, as done by BCOHAT, were performed by LIMHAT every full hour. An absolute calibration with liquid nitrogen was performed on 15 January 2020.
LIMRAD was operated with two different radar settings as specified in Kalesse-Los et al. (2023). Between 17 and 29 January 2020 as well as between 31 January and 28 February 2020, the temporal resolution of LIMRAD was 2.9 and 1.6 s, at a vertical resolution between 22 and 42 m, respectively. Radar absolute calibration was performed on 16 January 2020. Data gaps exist between 27 and 31 January 2020, when different radar chirp table settings were tested, and on 3 February 2020, when all instruments had to be turned off while Meteor was near Trinidad. As explained in Kalesse-Los et al. (2023), LIMRAD was operated in a novel passive horizontal stabilization system (two-axle Cardan mount) to assure zenith-pointing of the instrument. Stabilization is required to eliminate the effect of horizontal wind on the radar Doppler velocities. Means and standard deviations of absolute values of radar attitude measurements amounted to 0.36∘ ± 0.31∘. It should be noted that since LIMRAD was operated in a horizontal stabilization platform while LIMHAT was not, the exact (near-zenith) viewing direction of both instruments was not always the same. This effect should be negligible for retrieved IWV and LWP, however, as the larger opening angle of the LIMHAT (half-power beamwidth HPBW = 3.5∘) covered the LIMRAD column (HPBW = 0.5∘) even in events of slight mis-pointing.
2.3 Merian
Aboard Merian, the Institute for Geophysics and Meteorology of the University of Cologne operated a radar–radiometer system of the type RPG-FMCW-94 dual polarization (DP), which measures in the W-band (94 GHz) and includes a passive radiometer channel at 89 GHz (Küchler et al., 2017; here referred to as MSMRAD). MSMRAD is of the same type as LIMRAD. The system was positioned on an active stabilization platform from the US Atmospheric Radiation Measurement (ARM) program Mobile Facility 2, which keeps the radar in zenith position by adapting the table surface position to compensate for ship motions (for more information, see Acquistapace et al., 2022). As for LIMRAD, stabilization helps eliminate the effect of horizontal wind and ship roll and pitch tilting from the radar Doppler velocities. MSMRAD was operated with three chirp programs, established after initial testing, and worked for the entire campaign. The chirp programs had 0.846, 0.786, and 1.124 s integration times, respectively, with vertical resolutions of 7 m in the boundary layer and 30 m in the free troposphere, resulting in brightness temperatures at 3 s temporal resolution (see Table 2 in Acquistapace et al., 2022). The data browser (https://bit.ly/3ZcAusN, last access: 16 January 2024) displays availability and observational quality for every day of the entire campaign.
This section presents the statistical retrieval methods applied to the HATPRO and single-channel 89 GHz measurements. IWV, LWP, and temperature and humidity profiles are retrieved from BCOHAT and LIMHAT, while LWP and clear-sky IWV data are retrieved from LIMRAD and MSMRAD. We make use of a state-of-the-art retrieval using TB from all 14 HATPRO channels (Sect. 3.1). In order to disentangle water vapor and liquid contributions in the 89 GHz TB retrieval, we retrieve IWV in clear-sky conditions only, and we present a novel retrieval method to derive single-channel LWP by retrieving from a TB difference of cloudy TB and closest clear-sky TB (Sect. 3.2).
3.1 Multi-channel retrieval: BCOHAT and LIMHAT
IWV, LWP, and coarse temperature and humidity profiles are retrieved from all 14 TB measurements by applying the statistical quadratic regression retrieval equation (see Eq. 1 with k indicating the number of channel and “var” indicating the retrieved variable). The seven K-band channels (22–31 GHz, channels 1–7) provide information for IWV, LWP, and the absolute humidity profiles, while the seven V-band channels (51–58 GHz, channels 8–14) are used for temperature profiling. The IDL software MWR PRO was used to process the data (Löhnert, 2023).
The coefficients c0, c1, and c2 are derived from a climatological training data set comprising 10 871 daily radiosoundings launched from 1990 until 2018 from Grantley Adams International Airport (GAIA, station ID 78954 TBPB) in close vicinity to BCO. Sounding measurements were obtained from http://weather.uwyo.edu/upperair/sounding.html (last access: 16 January 2024). During EUREC4A, radiosoundings of the type GRAW DFM-09 were used (Bock et al., 2021).
Following the approach by Löhnert and Crewell (2003) and, more recently, by Walbröl et al. (2022), we use a radiative transfer model to link atmospheric conditions with TB. In the model, gas absorption is calculated according to Rosenkranz (1998) with modifications in the water vapor continuum (Turner et al., 2009) and 22 GHz line (Liljegren et al., 2005). Liquid cloud absorption is calculated following Mätzler et al. (2006). A liquid water cloud was modeled using a modified adiabatic liquid water content approach following Karstens et al. (1994) in vertical levels where radiosounding relative humidity exceeded 95 %. To imitate the instrument noise, a random noise factor was added to the simulated TB, taken as a random sample from a Gaussian distribution with standard deviation of 0.4 K (Maschwitz et al., 2013). For the temperature retrieval, only a linear regression was used as in Walbröl et al. (2022). To derive temperature profiles from the elevation scans, coefficients c1 and c2 were calculated by adjusting the angle for which radiative transfer was performed. Theoretical LWP uncertainty scales with retrieved LWP and is further discussed in Sect. 6.2.
To further improve the standalone LWP retrieval, a clear-sky offset correction method is applied to the retrieved LWP (van Meijgaard and Crewell, 2005; Ebell et al., 2017). The correction scheme identifies a liquid-free condition if the standard deviation of LWP in a running 2 min window, as well as the previous and subsequent 2 min window, is below 2.5 g m−2. The median LWP during the identified 2 min clear-sky period is subsequently subtracted from all following LWP measurements until the next clear-sky period. Note that, due to the statistical retrieval approach, negative (unphysical) LWP values can occur. The remaining few negative LWP values are not set to zero to keep for statistical noise evaluation and to avoid biasing the overall statistical distribution of LWP. That way, the clear-sky LWP noise can be estimated by analyzing the LWP distribution in independently identified clear-sky periods as presented in Sect. 6.2.
3.2 Single-channel retrieval: LIMRAD and MSMRAD
As opposed to a multi-channel LWP retrieval, the retrieval of LWP from a single channel is underdetermined as both water vapor and liquid water contribute to the measured TB (e.g., Westwater et al., 2001; Billault-Roux and Berne, 2021). In order to extract the LWP signal in TB at 89 GHz, we present a novel retrieval approach based on the difference in brightness temperature, ΔTB, between cloudy-sky TB and the closest clear-sky TB,0. Parameter ΔTB is used in a third-order regression (Eq. 2) to estimate LWP.
Instrument biases are reduced by using the difference in brightness temperatures, so the unbiased portion of the signal from LWP remains. The clear-sky brightness temperature is obtained by selecting profiles not showing any radar reflectivity through the cloud mask, excluding measurements up to 5 min after rain events to avoid biases due to wet radome conditions. The unknown coefficients of the regression (a, b, and c) are derived from a training data set compiled from artificial LWPs and simulated brightness temperatures calculated with the forward model operator Passive and Active Microwave TRAnsfer model (PAMTRA; Mech et al., 2020). Atmospheric profiles were constructed from 401 radiosondes launched on the respective research vessels (Merian: 182; Meteor: 219) and artificial clouds between 0 and 5 km with LWPs up to 1 kg m−2. To retrieve LWP from the measured ΔTB in non-precipitating conditions, the coefficients derived for the closest radiosounding were applied following Eq. (2) to ΔTB which was in turn adjusted with noise by a random number of a Gaussian distribution with width of 0.5 K.
IWV is retrieved from the single-channel TB measurements only in clear-sky conditions as emissions are then dominated by water vapor. A quadratic regression is applied as in Eq. (1), weighed by the variability of TB around the radiosonde launch. By applying a weight to the regression, misidentified clear-sky radiosoundings are excluded from the training. Thus, 120 and 65 clear-sky radiosoundings were identified aboard Meteor and Merian, respectively, by applying a 98 % relative humidity threshold, and these were used to derive the coefficients linking TB and IWV. The coefficients were then applied to the measured TB in clear-sky conditions as detected by the cloud-masking algorithm presented in the following section.
This section describes the processing of the data set as available on AERIS: https://doi.org/10.25326/454##v2.0 (Schnitt et al., 2023a). Section 4.1 describes the precipitation and cloud masking, and Sect. 4.2 summarizes the processing of the measurements from Level 1 to Level 4.
4.1 Precipitation and cloud masking
Ground-based passive microwave radiometer measurements are not reliable during precipitation events due to additional liquid water emissions on the radome contributing to the column emissions. Flagging precipitation is, thus, crucial to guarantee high-quality retrievals. The HATPRO precipitation mask is set to “True” when precipitation was detected by the internal HATPRO or an adjacent weather station. Cloud radar measurements are added to the standalone precipitation flagging to improve the precipitation detection. At BCO, Ka-band (35 GHz) zenith-pointing radar measurements (Hirsch, 2022) are used. Aboard the ships, measurements of the LIMRAD and MSMRAD cloud radar operating in the W-band (94 GHz) are added. Precipitation is flagged if any reflectivity above −50 dBZ was recorded below 350 m. This reflectivity threshold was chosen according to Klingebiel et al. (2019) to exclude sea salt aerosols from being mis-flagged as precipitation. Aboard the ships, precipitation was also flagged if reflectivity exceeded 0 dBZ anywhere in the column (Kalesse-Los et al., 2023) or if a rain rate was derived by the radar.
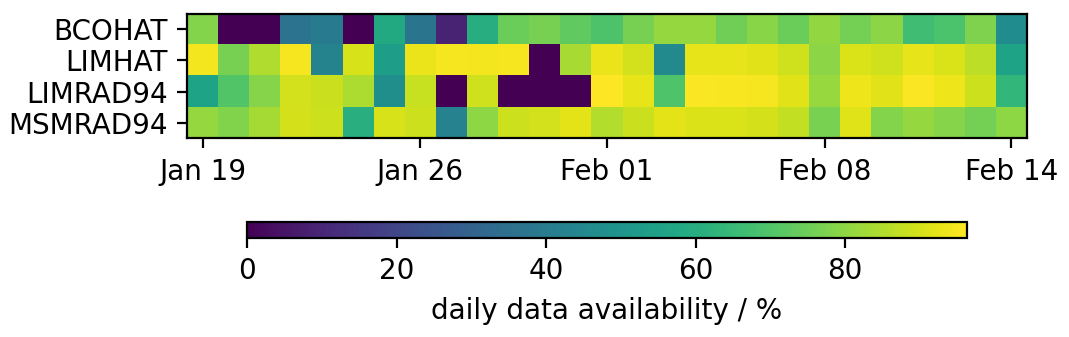
Figure 2Timeline of measurement availability (color-coded, in percent) in the identified core period between 19 January and 14 February 2020 for each instrument. Percentages are calculated with respect to the optimal expected number of measurements on the 3 s temporal resolution grid.
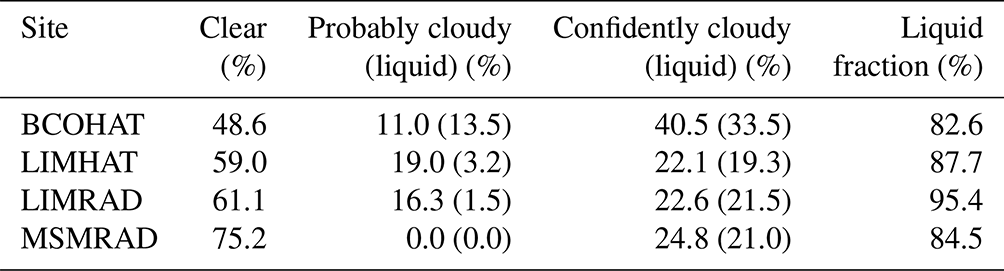
Table 2Cloud mask characteristics at BCO and aboard Meteor and Merian. Scenes are clear if both ceilometer and radar sensed clear-sky; probably cloudy if either detected a cloud; and confidently cloudy if both radar and ceilometer detected clouds. Fractions for respective liquid cloud occurrence are given in parenthesis. Percentages are relative to total number of non-precipitating measurement points with valid LWP and cloud mask. Liquid fraction refers to percentage of liquid clouds of all clouds.
Independent cloud masking was performed using the adjacent radar and, at BCO and aboard Meteor, ceilometer measurements from a Jenoptik/Lufft CHM15k Nimbus ceilometer, respectively. Ceilometer measurements are identified as cloudy if a cloud base height above 100 m is derived by the internal instrument software. If no valid cloud base height is derived, the scene is treated as clear. At BCO and aboard Merian, radar measurements indicate cloudy conditions if a reflectivity of more than −50 dBZ is recorded in more than two range gates above 300 m. The reflectivity threshold was carefully chosen to exclude occurring sea-spray from being flagged as cloudy (Klingebiel et al., 2019). Due to the different radar chirp settings (see Sect. 2.2) and resulting radar sensitivities, a threshold of −40 dBZ was applied to the LIMRAD measurements to optimally exclude sea spray and clutter. An additional liquid cloud mask is derived by enforcing that reflectivity above the respective threshold only occurred between 300 and 4000 m. Clear sky is identified if reflectivity is not a number (nan) in all range bins. Due to MSMRAD's maximal range of 10 km, high-occurring cirrus clouds might not be detected and could be mis-flagged as clear conditions aboard Merian.
In the presented analyses, the individual cloud masks are combined to a joint cloud mask as follows: clear conditions prevail if both ceilometer and radar flags are clear; probably cloudy conditions prevail if either ceilometer or radar sensed a cloud; and confidently cloudy scenes refer to measurements in which both radar and ceilometer sensed a cloud. Making use of the additional liquid cloud flag allows us to additionally derive probably liquid cloudy and confidently liquid cloudy conditions to exclude scattering from ice in the LWP statistics. Probably cloudy occurrences are mainly due to sensor beam mismatch, platform motions, or sensitivity differences between the ceilometer and radar as outlined in Konow et al. (2021). Aboard Merian, scenes were classified as clear or confidently cloudy based solely on MSMRAD radar observations.
Missing data of ceilometer or radar led to discarding of 3.7 %, 20 %, and 8.2 % of all measurements as a cloud mask could not be determined at BCO, Meteor, or Merian, respectively. The comparatively higher percentage aboard Meteor is dominated by data availability of LIMRAD. For presented analyses, we additionally demand a valid IWV and LWP, as well as a valid cloud mask for a measurement to be considered, thus excluding scenes affected by precipitation or instrument measurement or retrieval quality. This reduces the availability of valid measurements to 50.5 %, 66.8 %, 69.5 %, and 83.1 % of all 3 s measurements in the core period, dominated by instrument availability as shown in Fig. 2. Table 2 summarizes the respective cloud cover fractions of clear, probably (liquid) cloudy, and (liquid) cloudy scenes relative to this subsample for all instruments. The clear-sky fraction is highest aboard Merian and lowest at BCO. We relate the highest clear-sky fraction of 75.2 % aboard Merian to the missing ceilometer and reduced sensitivity of the radar to optically thin and geometrically small clouds (Mieslinger et al., 2022). Compared to the airborne cloud cover products presented in Konow et al. (2021), the here-presented ground-based derived confidently cloudy cloud cover estimates are closest to the airborne lidar-derived cloud cover of 34 %. Differences arise due to the fact that airborne operation was limited to selected days and daytime and that airborne horizontal resolution is lower than when measured from ground. Here-presented cloud cover matches the cloud cover observed at BCO from 2 years of measurements (Nuijens et al., 2014). More than 80 % of detected clouds are classified as liquid.
4.2 Overview of processing levels
4.2.1 Level 1
Level 1 files are provided for each instrument and include the unfiltered instrument output on original time resolution. HATPRO measurements were processed by the MWR PRO software (see Sect. 3.1), providing one daily file for IWV, LWP, T, and q retrieval as well as for the TB measurements. The LIMHAT data set is also available in Kalesse-Los et al. (2020). The HATPRO quality flags include flags for visual inspection, sun influence in measurement beam, and a TB threshold indicating poor measurement quality. For the W-band measurements, one file per day is produced by the manufacturer's software (see Acquistapace et al., 2022; Kalesse-Los et al., 2023).
4.2.2 Level 2
One Level 2 file is provided per instrument, concatenating the daily Level 1 HATPRO and hourly W-band files, respectively, into one single file. Measurements and retrieval products are given in the original instrument's time resolution. LWP is clear-sky-corrected as described in Sect. 3.1. The provided HATPRO quality mask indicates poor measurement and retrieval quality, respectively, combining single flags from Level 1 files in one flag. Poor measurement quality is flagged if any of the Level 1 quality flags is “True”, as identified manually due to maintenance on the instruments (see Sect. 2). An additional check is performed by simulating TB for each channel individually based on TB observations of all other channels. If the difference between simulated and observed TB is above a certain threshold, the spectrum is considered as unphysical and flagged. These unphysical spectra can be caused by rain, wet radome, or other external sources (such as radio-frequency interference, sun in beam, etc.). Threshold values were determined empirically, and are as follows: at K-band the sum of the absolute differences between channels 2 through 7 is larger than 3 K; at V-band the sum of the absolute differences between all channels is larger than 7 K. Poor retrieval quality is flagged for IWV, LWP, temperature, and humidity independently. In addition to the information given by the instrument's housekeeping data, IWV values larger than 60 kg m−2 and LWP values larger than 1000 g m−2 are flagged to additionally exclude poor retrieval quality or ice scattering impacts, leading to erroneously high retrieval results (see Jacob et al., 2019). LWP clipping amounts to 4.3 % (BCOHAT), 1.5 % (LIMHAT), 2.2 % (LIMRAD), and 1.5 % (MSMRAD) of all available retrieved LWP. Precipitation was flagged as outlined in the previous section. As described in Sect. 2, the HATPRO instruments performed different measurement strategies deviating from pure zenith measurements. A position mask included in Level 2 data indicates zenith measurement, azimuth, or elevation scan measurement. IWV was derived from single-channel 89 GHz measurements in clear-sky conditions as identified by LIMRAD and MSMRAD measurements (see previous section).
4.2.3 Level 3
One Level 3 file is provided for each site, combining all available radiometer and single-channel measurements on a mutual 3 s time grid to facilitate inter-platform comparison. A core measurement period was defined ranging from 19 January until 14 February 2020, during which all instruments were operational. As illustrated in Fig. 2, certain days did not contain measurements due to maintenance, and precipitation reduced the amount of available measurements. All following analyses, if not indicated differently, are based on the Level 3 data set.
Table 3Characteristics of clouds, water vapor, precipitation, and liquid cloud occurrence at each site. Precipitation and liquid cloud cover are calculated as temporal fraction of all valid measurements within the core period. Mean LWP is calculated for confidently liquid cloudy scenes.
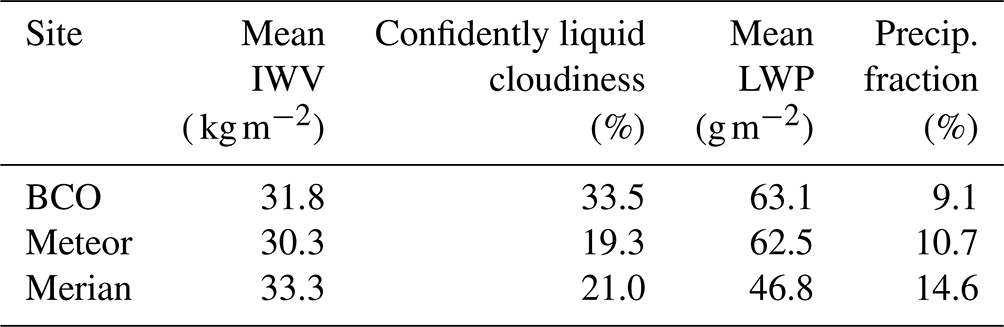
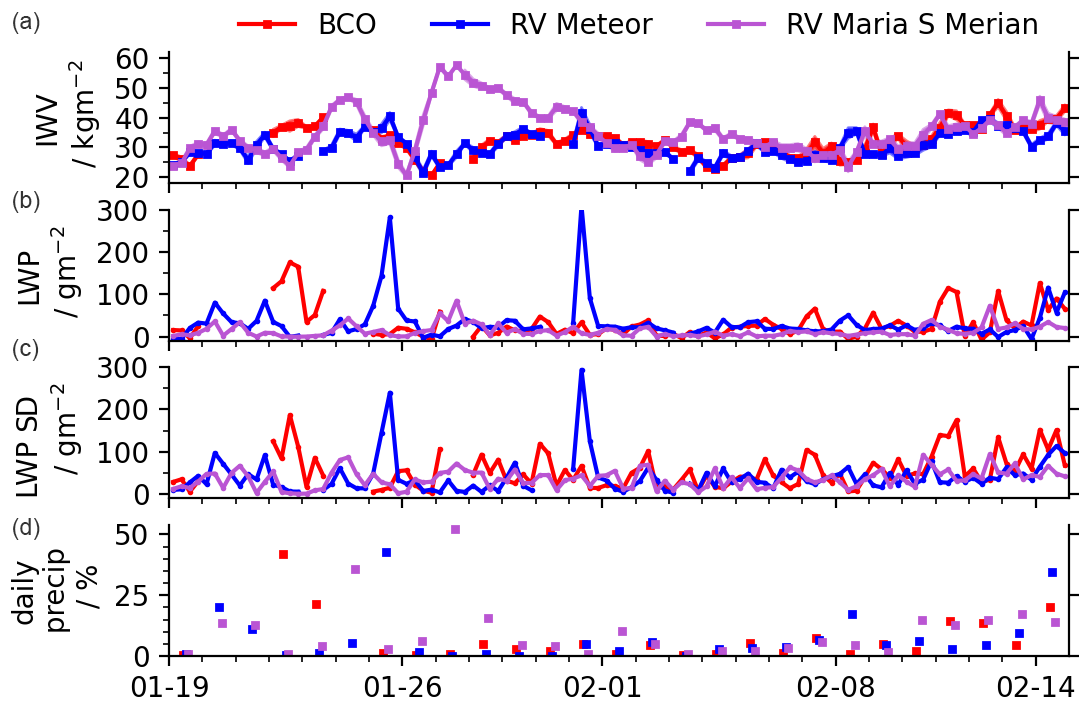
Figure 3Timeline of 6-hourly (a) IWV, (b) LWP, (c) LWP standard deviation in a 6 h window, and (d) daily precipitation fraction, recorded at BCO (red), aboard Meteor (blue) and Merian (purple) based on the Level-4 data set.
Mean characteristics of the core period are summarized in Table 3. At BCO, aboard Meteor, and aboard Merian, respectively, 9.1 %, 10.7 %, and 14.6 % of valid precipitation mask time steps were flagged as precipitating at ground. Scenes are flagged confidently liquid cloudy in 33.5 %, 19.3 %, and 21.0 % of all valid measurements at BCO, Meteor, and Merian, and they are characterized by a mean LWP of 63.1, 62.5, and 46.8 g m−2, respectively.
4.2.4 Level 4
Quality-controlled time series of IWV, LWP, precipitation, and cloud mask are given in one file for all three sites. Level 4 estimates are based on BCOHAT, LIMHAT, and MSMRAD retrieved IWV and LWP. Additionally, different files are provided for timelines of IWV and LWP sampled to different temporal resolution: 3 s (original), 1 min, 30 min, 1, 3, 6, 12 h, and daily. The 6-hourly timeline of IWV, LWP, 6-hourly variability of LWP, as well as daily precipitation fraction, are illustrated in Fig. 3. Spikes in LWP and LWP variability are related to unidentified precipitation events. While IWV varies little when sampled daily, longer sampling times smooth the LWP distribution.
This section presents the integrated water vapor (IWV) conditions as measured by the different instruments at the different sites and uses independent soundings, Global Navigation Satellite System (GNSS), and ERA5 estimates to evaluate the MWR retrievals.
Table 4Characteristics of IWV conditions measured by each instrument at each site, including number of valid non-precipitating measurements, mean IWV, median IWV, standard deviation (SD) and skewness of IWV probability distribution. Note that single-channel LIMRAD and MSMRAD IWV is retrieved for clear-sky conditions only.
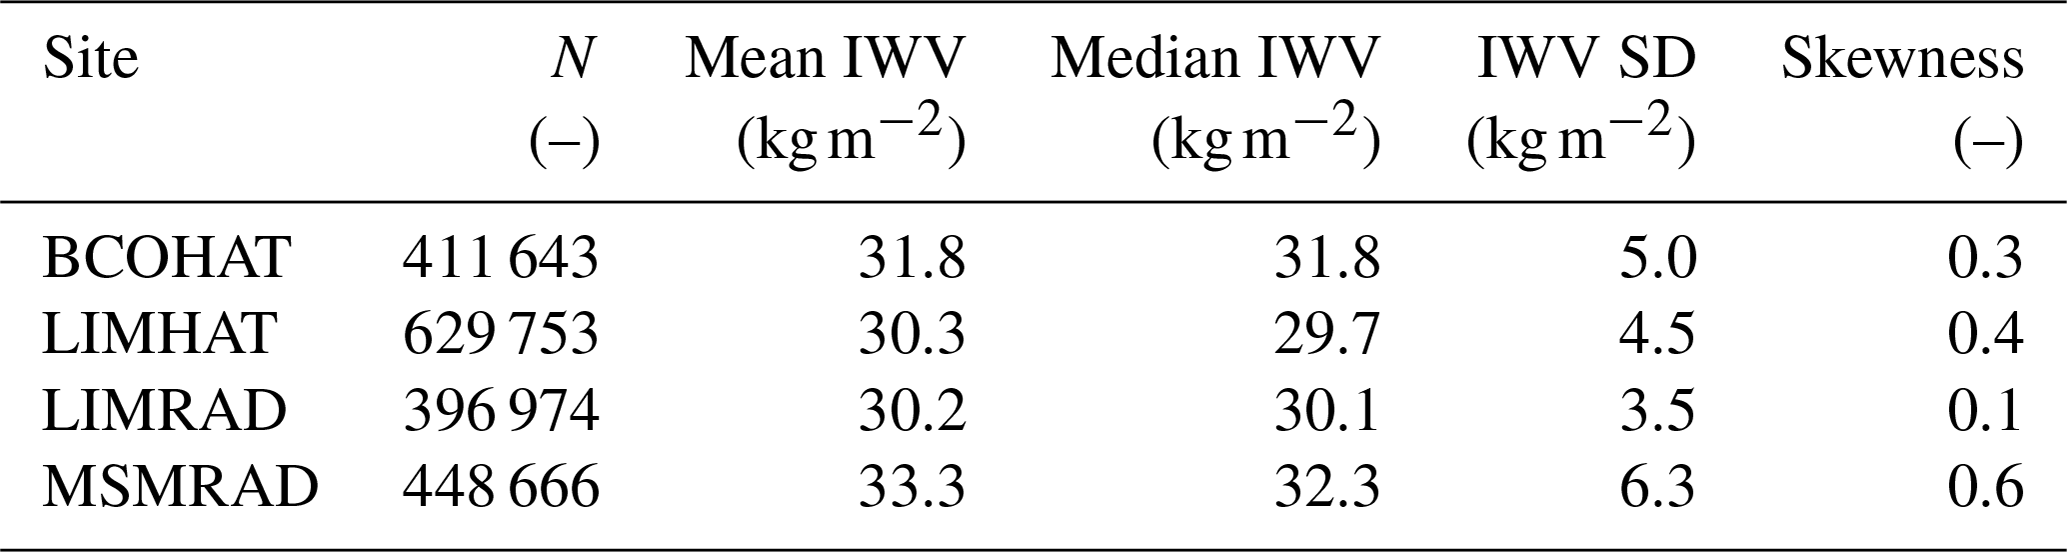
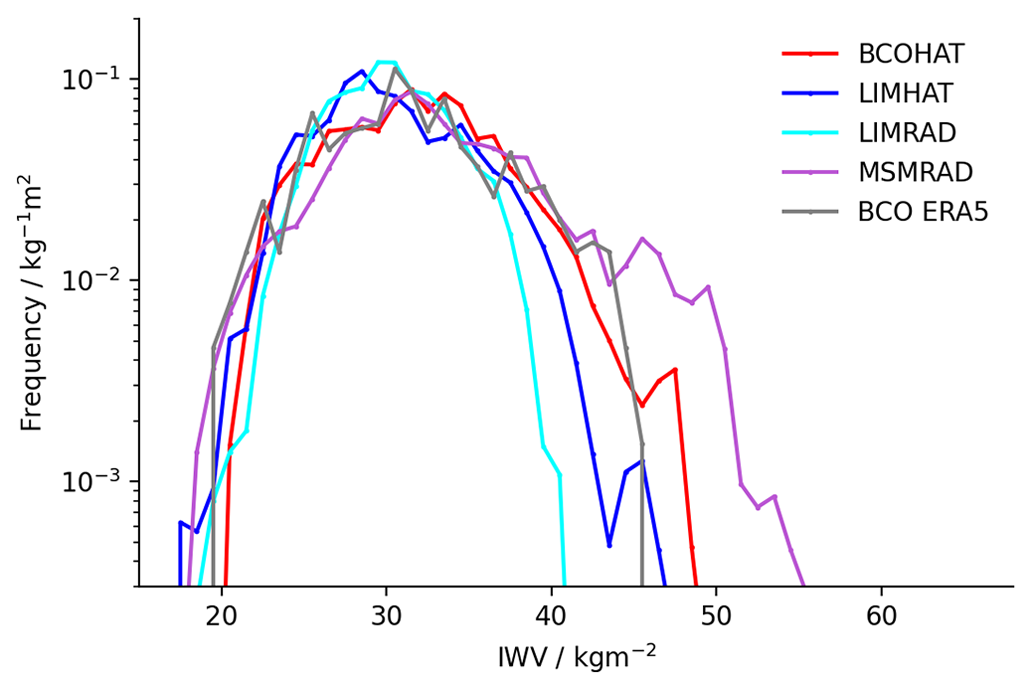
Figure 4Frequency of occurrence of IWV retrieved from HATPRO measurements at BCO (BCOHAT, red) and aboard Meteor (LIMHAT, blue), as well as from single-channel TB aboard Meteor (LIMRAD, cyan) and Merian (MSMRAD, purple). The distribution of ERA5 values at BCO (gray) is added for comparison. Displayed frequencies are cut if calculated from less than 30 measurement points. Note that LIMRAD and MSMRAD IWV is only retrieved in clear-sky conditions.
The IWV conditions measured at each site by each instrument are illustrated in Fig. 4, and corresponding distribution parameters are summarized in Table 4. At BCO, a mean IWV of 31.8 kg m−2 was measured in the core period with a standard deviation of 5.0 kg m−2. The conditions measured aboard Meteor agree within the associated uncertainty with a mean IWV of 30.3 kg m−2 but show slightly less variability (standard deviation of 4.5 kg m−2). The mean conditions aboard Meteor measured by the LIMHAT and LIMRAD agree, while the LIMRAD IWV distribution is slightly narrower and less skewed due to the fact that the retrieval is only applied in clear-sky conditions. As Merian was additionally sampling further south over warmer waters with deeper convection, IWV conditions were moister with a mean IWV of 33.3 kg m−2. High IWV conditions of more than 50 kg m−2, untypical for winter trade conditions, were observed close to Brazil from 27 to 29 January 2020 associated with a deep convective system. The skewness of all distributions indicates that the 2-month IWV conditions follow a lognormal distribution rather than a normal distribution, which is also confirmed visually in Fig. 4.
These results align with the results by Foster et al. (2006), who find lognormal distributions in IWV at many locations worldwide, in particular in the (sub-)tropics. EUREC4A was slightly moister compared to the dry season conditions observed during NARVAL-1 with a mean IWV of 28 kg m−2 (Jacob et al., 2019). An airborne mean IWV of 33.2 kg m−2 measured by the HAMP radiometers aboard HALO (Jacob et al., 2019) is higher than the ground-based estimates from Meteor, which sampled a similar area which we relate to the different retrievals used.
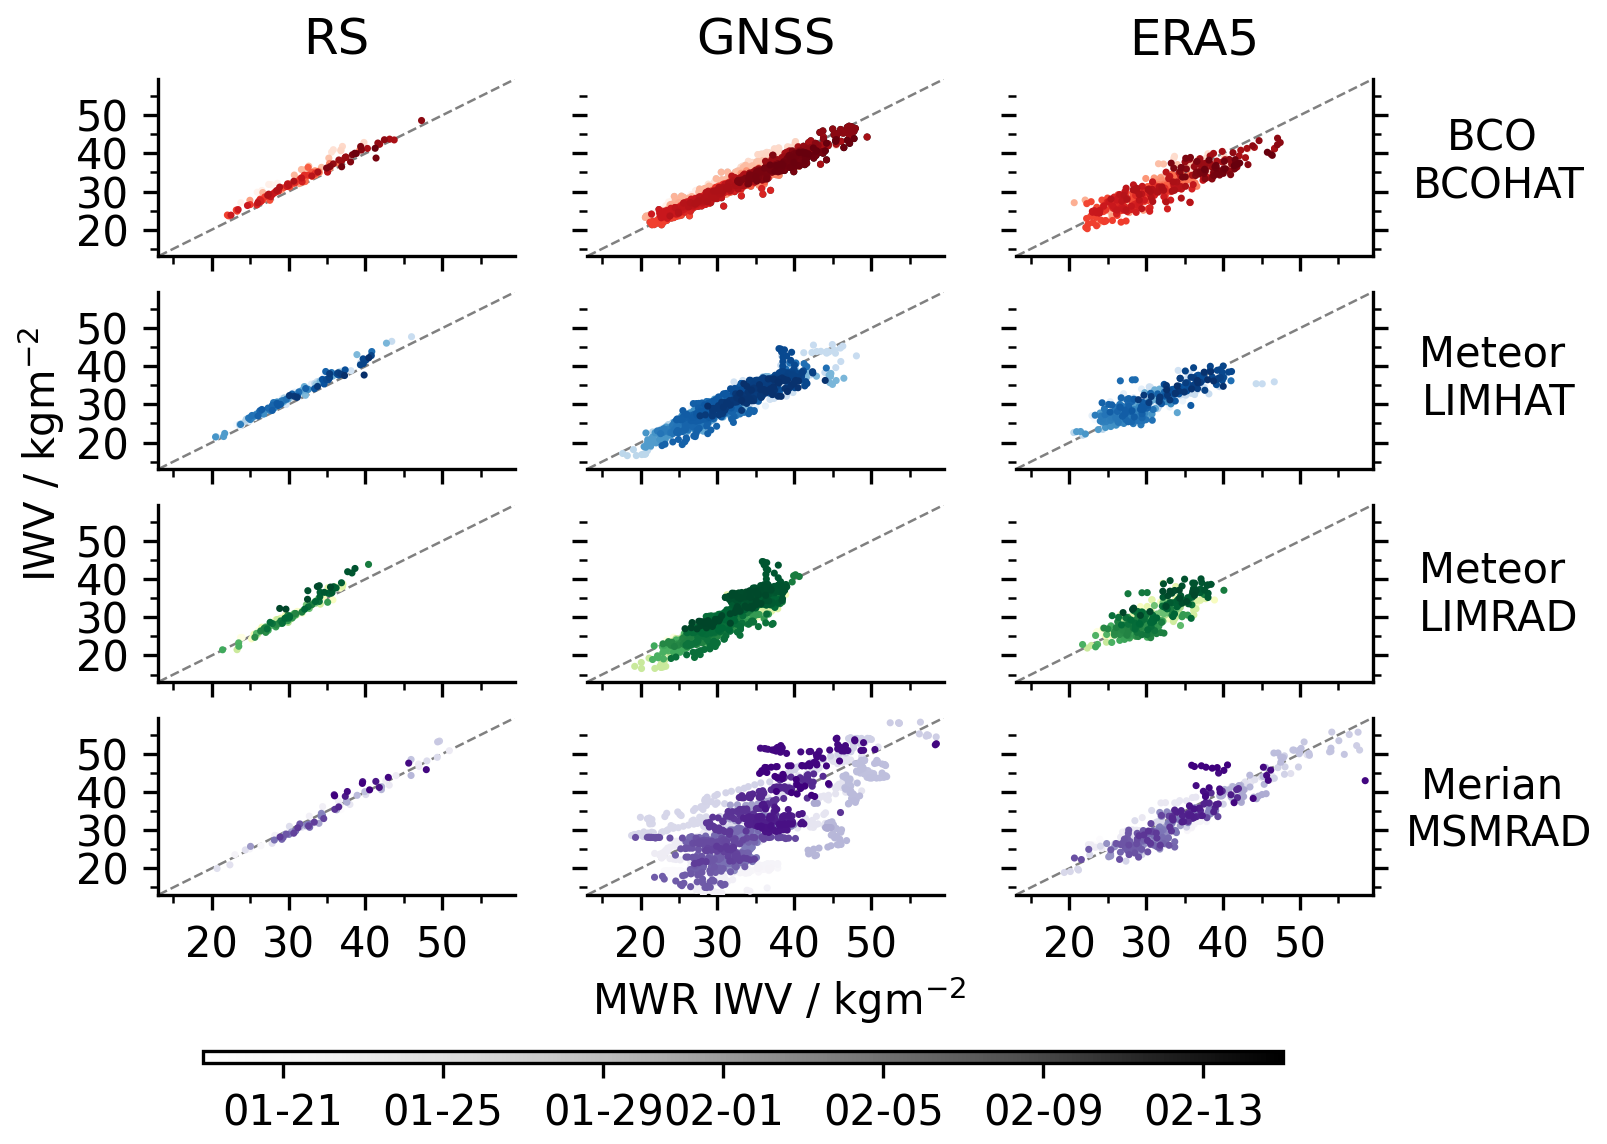
Figure 5Pairwise IWV evaluation of MWR-retrieved IWV (x axis) for four different instruments (rows) relative to independent measurements (y axis) of radiosoundings (first column), GNSS (second column), and ERA5 (third column), color-coded by time from 19 January 2020 (light) until 14 February 2020 (dark). Note that IWV from LIMRAD and MSMRAD is only available in clear-sky conditions.
We evaluate retrieved IWV by means of the root-mean-square difference (RMSD), Pearson correlation coefficient, and bias (independent measurement minus MWR) with independent IWV measurements derived from radiosoundings (Stephan et al., 2021) and GNSS (Bock et al., 2021; Bosser et al., 2021), and we compare them to ERA5 reanalysis data (Fig. 5 and Table 5). MWR measurements and radiosoundings are compared in a 10 min window around each 4-hourly sounding launch to minimize radiosounding drifting effects when comparing to the zenith column. GNSS and MWR measurements are averaged and compared in 15 min time windows matching GNSS realistic temporal resolution. For the ERA5 intercomparison, MWR measurements are resampled to the full hour and compared to the closest ERA5 field.
Table 5Evaluation of MWR-retrieved IWV from BCOHAT, LIMHAT, LIMRAD, and MSMRAD relative to independent IWV measurements of radiosoundings, GNSS, and closest ERA5 field through RMSD, bias, and correlation coefficient. A positive bias refers to drier MWR conditions than measured by the respective independent IWV measurement. Note that LIMRAD and MSMRAD evaluation is performed in clear-sky conditions only.
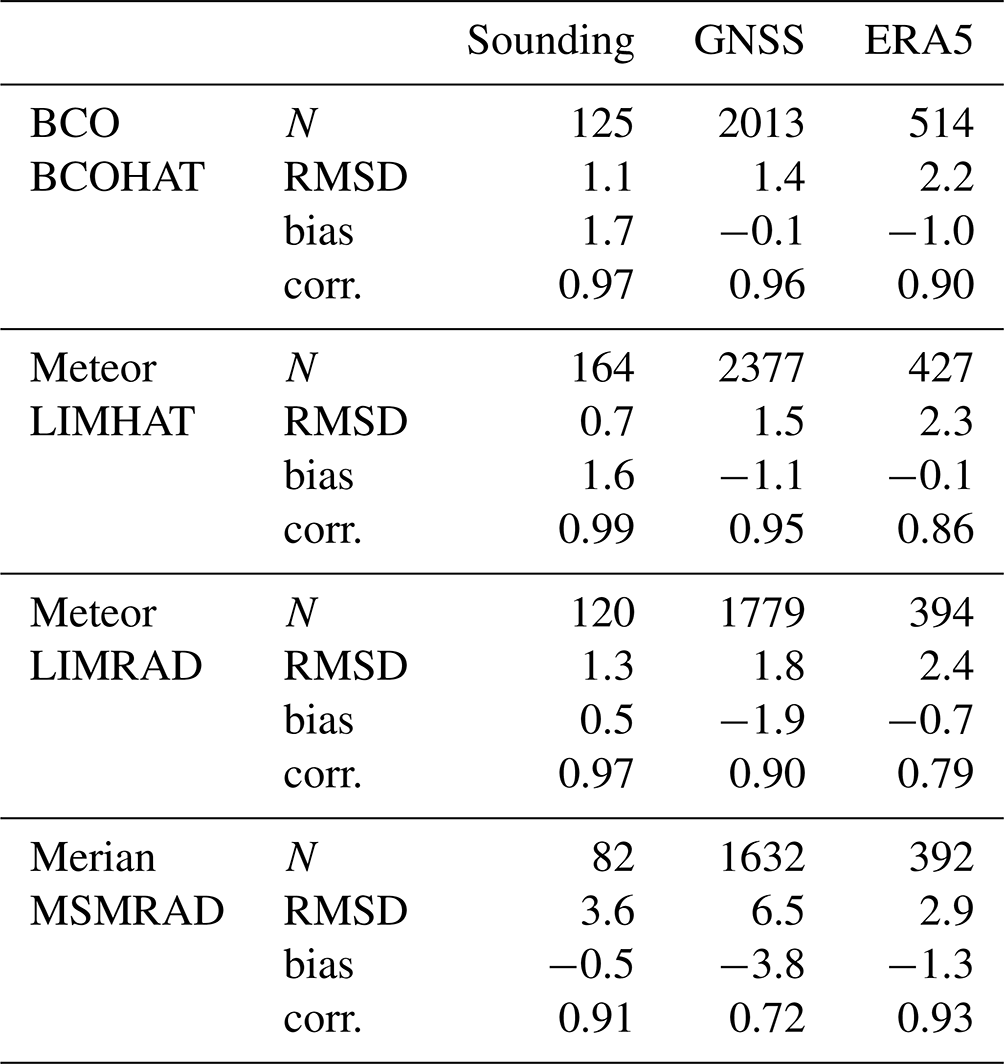
Retrieved IWV is closely correlated with sounding IWV at all sites with correlation coefficients higher than 0.9. The RMSD for the HATPRO measurements at BCO is 1.1 kg m−2, which is similar to the MWR-sounding RMSD that Steinke et al. (2015) find. The MWR measurements are on average drier than the radiosoundings' IWV as seen by the positive bias of 1.7 kg m−2. A similar bias of 1.6 kg m−2 is found in the LIMHAT–sounding comparison, although the RMSD is smaller than at BCO (0.7 kg m−2). The dry bias between MWR measurements and radiosoundings at both BCO and Meteor could be related to the fact that the statistical retrieval is trained on radiosoundings launched from Grantley International Airport. Bock et al. (2021) find that the airport radiosoundings exhibit a dry bias of 2.9 kg m−2 compared to the Vaisala MW41 radiosoundings used at BCO during EUREC4A (Stephan et al., 2021). Aboard Meteor, the LIMHAT IWV data set can additionally be used to evaluate the dropsondes launched from HALO's circles (George et al., 2021), which were corrected for a dry bias compared to the radiosounding data set.
The MWR–sounding bias of clear-sky IWV retrieved from LIMRAD is reduced by 70 % compared to the respective HATPRO-derived IWV. The RMSD of LIMRAD–radiosoundings (1.3 kg m−2) is slightly smaller than at BCO, while Merian measurements' RMSD is higher than expected (3.6 kg m−2). This increase in RMSD might be related to the lower number of radiosoundings used for training and evaluation, which could also explain the switch of bias sign to negative values. Single- and multi-channel clear-sky IWV retrievals can be directly intercompared using simultaneous LIMRAD and LIMHAT measurements aboard Meteor. All core period measurements agree with an RMSD of 1.2 kg m−2, affected by a bias of 1 kg m−2 with LIMRAD being moister than LIMHAT.
At BCO, IWV obtained from GNSS and BCOHAT exhibit a RMSD of 1.4 kg m−2. As opposed to Bock et al. (2021), we do not find a bias between the measurements which could be attributed to different quality filtering mechanisms used in this analysis. Aboard Meteor, the LIMHAT–GNSS RMSD is similar (1.4 kg m−2) but affected by a negative bias of −1.1 kg m−2 with GNSS measurements drier than the MWR measurements. Bosser et al. (2021) report that the GNSS measurements aboard Merian were of poor quality, which explains the large RMSD and bias when comparing to MSMRAD IWV.
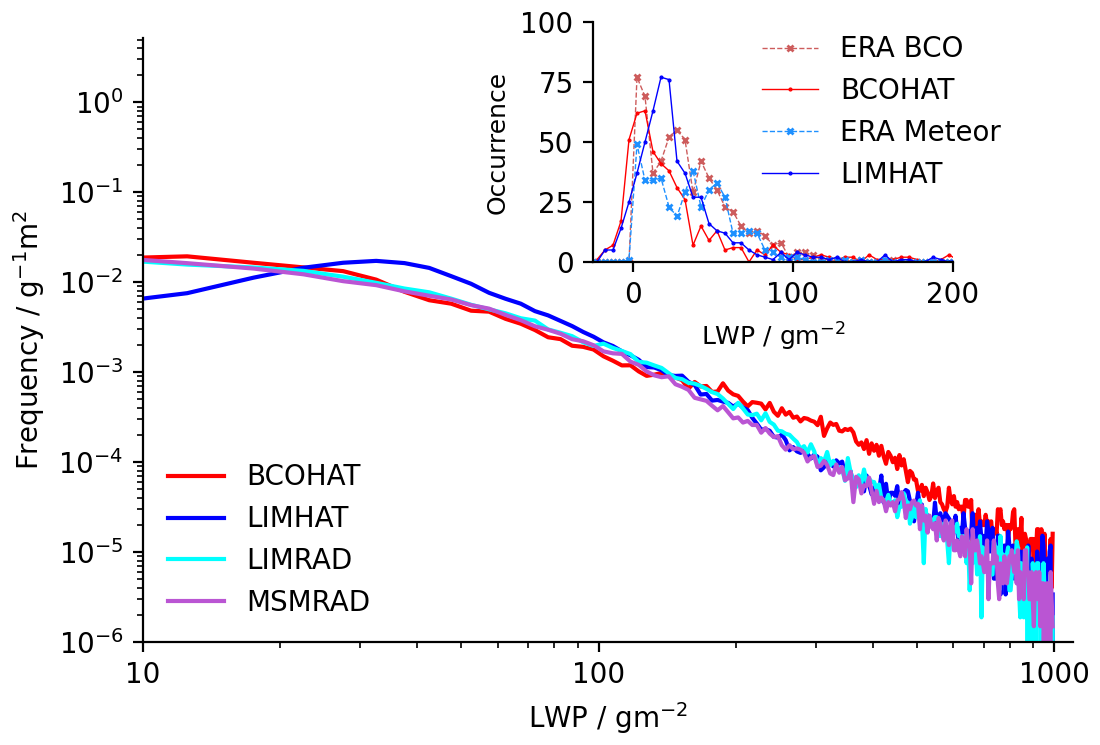
Figure 6Distribution of LWP occurrence in confidently liquid cloudy, non-precipitating scenes at BCO (red), aboard Meteor retrieved from LIMHAT (blue) and LIMRAD (cyan) measurements, and aboard Merian with MSMRAD (purple). The inlet displays the distribution of LWP resampled to the full hour from BCOHAT (red, solid) and LIMHAT (blue, solid), as well as the corresponding hourly-resolved ERA5 total column liquid water (dashed).
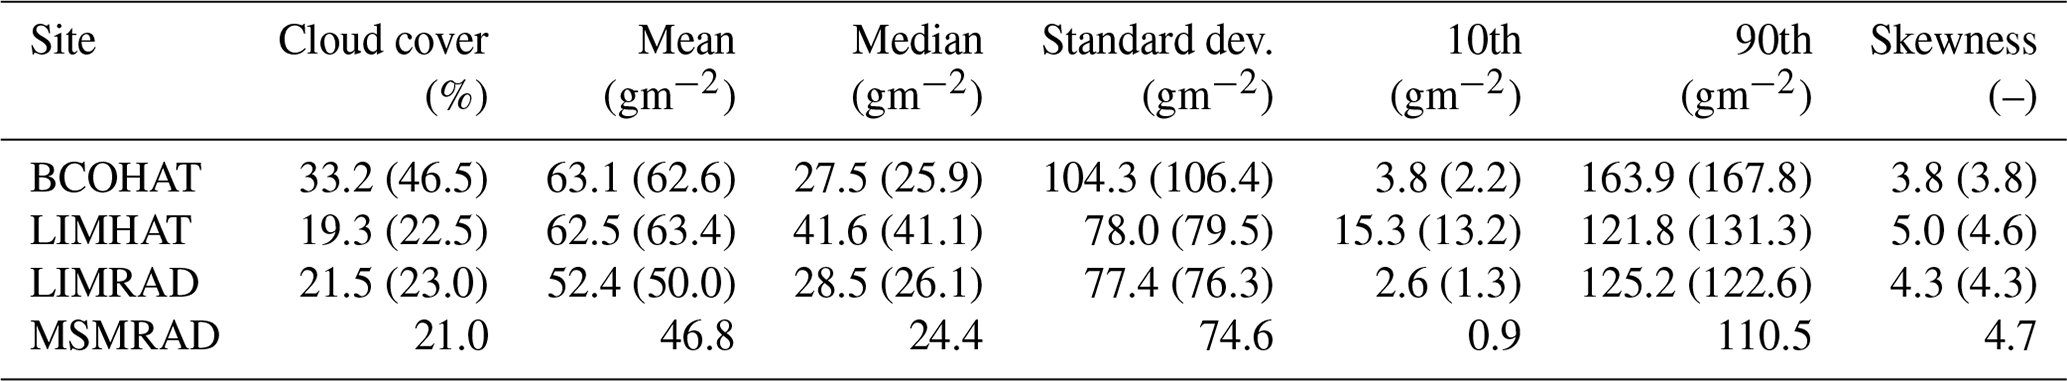
Table 6Characteristics of non-precipitating LWP distribution, including mean, median, standard deviation, 10th and 90th percentile, skewness, as retrieved from BCOHAT, LIMHAT, LIMRAD, and MSMRAD in confidently liquid cloudy (confident and probably liquid cloudy) identified scenes.
The two periods of ship collocation (see Sect. 2.2) allows for a direct comparison of clear-sky IWV derived from LIMRAD, LIMHAT, and MSMRAD. Comparing the radars from both ships, LIMRAD and MSMRAD are associated with an RMSD of 1.1 kg m−2, a correlation coefficient of 0.88, and a bias of −0.3 (LIMRAD moister than MSMRAD). Given this good agreement, MSMRAD IWV seems more accurate than the GNSS measurements and closes the measurement gap of highly temporally resolved IWV measurements aboard Merian.
As MWR measurements were not assimilated into the reanalysis, a comparison to reanalysis ERA5 fields closest in time and space can provide further retrieval evaluation. Retrieved IWV and ERA5 RMSD at BCO and Meteor agree to within 2.5 kg m−2 with slightly higher agreement aboard Merian (2.9 kg m−2). While ERA5's IWV is unbiased compared to LIMHAT's IWV aboard Meteor, it is dry biased by −1.0 kg m−2 and −1.3 kg m−2 at BCO and aboard Merian, respectively.
This section describes the liquid water path (LWP) conditions retrieved from the different instruments in non-precipitating conditions. Separating conditions into clear-sky and cloudy sky requires the cloud mask introduced in Sect. 4.1. The resulting liquid cloudy LWP conditions are analyzed in Sect. 6.1. Clear-sky-identified scenes serve as a base to characterize the clear-sky LWP noise, contributing to the overall LWP uncertainty and detection limit analysis presented in Sect. 6.2. Inter-platform retrieval comparison is performed for two limited time periods in which Meteor and Merian were measuring in close proximity (Sect. 6.3).
6.1 Cloudy LWP
Liquid cloud LWP is analyzed by applying the joint cloud mask (Sect. 4.1) to retrieved LWP. Figure 6 illustrates retrieved LWP distributions observed by BCOHAT, LIMHAT, LIMRAD, and MSMRAD in confidently liquid cloudy scenes. Corresponding distribution parameters are summarized in Table 6. Mean LWP conditions in confidently liquid cloudy conditions at BCO and aboard Meteor and Merian were 63.1, 62.5, 52.4, and 46.8 g m−2. The mean conditions at BCO and Meteor align well with the mean airborne LWP of 63 g m−2 observed during NARVAL-1 in similarly dry winter trade conditions across the same region (Jacob et al., 2019; Schnitt et al., 2017). BCOHAT and LIMHAT retrieved mean LWP of 63.1 and 62.5 g m−2 agree well within their associated LWP uncertainties (see Sect. 6.2).
Even though similar mean LWP conditions were observed, more detailed trajectory analyses are necessary to investigate the effect of ocean surface and island impact on the cloud evolution between Meteor and BCO. Median and mean LWP differ as the mean LWP is influenced by single events of high LWP, e.g., through un-flagged precipitation or sea-spray, while the median is driven by the large amount of small LWP below the instruments' detection limit.
So, 90 % of observed confidently liquid cloudy columns were associated with a LWP of around 160, 120, and 110 g m−2 at BCO, and aboard Meteor and Merian, respectively. The comparatively higher LWP 90th percentile and standard deviation at BCO are most probably related to wet radome conditions as the blower unit of BCOHAT was broken throughout some of the core period (as opposed to the other instruments). We also suspect that the sea-spray-altered and aged radome was less hygroscopic compared to the newer LIMHAT radome, leading to additional moisture on the radome and longer drying times. An additional island impact triggering deeper convection in prevailing non-trade-wind conditions is in ongoing analysis. The close-to-zero 10th percentile reflects the fact that the statistical regression covers negative values to avoid biasing the overall distribution (see Sect. 3.1), and this indicates that the cloud mask did not perform perfectly well in all conditions. Likely, the wider field of view of the MWR compared to the active remote sensing instruments used for the cloud mask led to misidentification of scenes.
Expanding the analysis to include probably liquid cloudy conditions slightly reduces mean and median LWP, as well as all other parameters of the distribution given in Table 6, likely due to the fact that more mis-flagged clear-sky conditions impact the LWP distribution. This shift in distribution parameters illustrates the sensitivity of the derived LWP properties to the cloud mask performance.
At BCO and Meteor, retrieved LWP is compared to the ERA5 estimates by resampling BCOHAT and LIMHAT's LWP, respectively, to every hour (see inlet in Fig. 6). Instrument-derived mean LWP of 33.2 and 39.5 g m−2 agree well with ERA5 mean LWP of 34.5 and 36.0 g m−2 at BCO and Meteor, respectively. The measured LWP variabilities, here quantified as standard deviation, of 58.0 and 84.7 g m−2 are higher than the ERA5 variabilities of 27.9 and 26.4 g m−2, respectively, which we attribute to the horizontal resolution of ERA and the small cloud sizes.
6.2 LWP uncertainty and detection limit
Characterizing the uncertainty of the retrieved LWP by independent measurements is not straight forward as LWP retrieved from measurements by visible or infrared remote sensing techniques is not sensitive to the same column as the microwave measurements (e.g., Turner et al., 2007b). Therefore, a clear-sky LWP noise can be derived by analyzing retrieved LWP in independently classified clear-sky cases as a generally accepted strategy (Jacob et al., 2019; van Meijgaard and Crewell, 2005). Retrieval offsets to zero are due to the statistical nature of the retrieval approach, due to calibration artifacts and radiometric noise. The lowest detectable LWP is then calculated from the clear-sky LWP noise for different water vapor conditions. Cloudy-sky LWP uncertainty can be estimated as a function of LWP by calculating a root-mean-square difference (RMSD) of true versus retrieved LWP. True LWP here refers to the LWP used to forward-model TB in the radiative transfer calculations (see Sect. 3), while retrieved LWP is the result of applying the respective retrieval equation to the same TB.
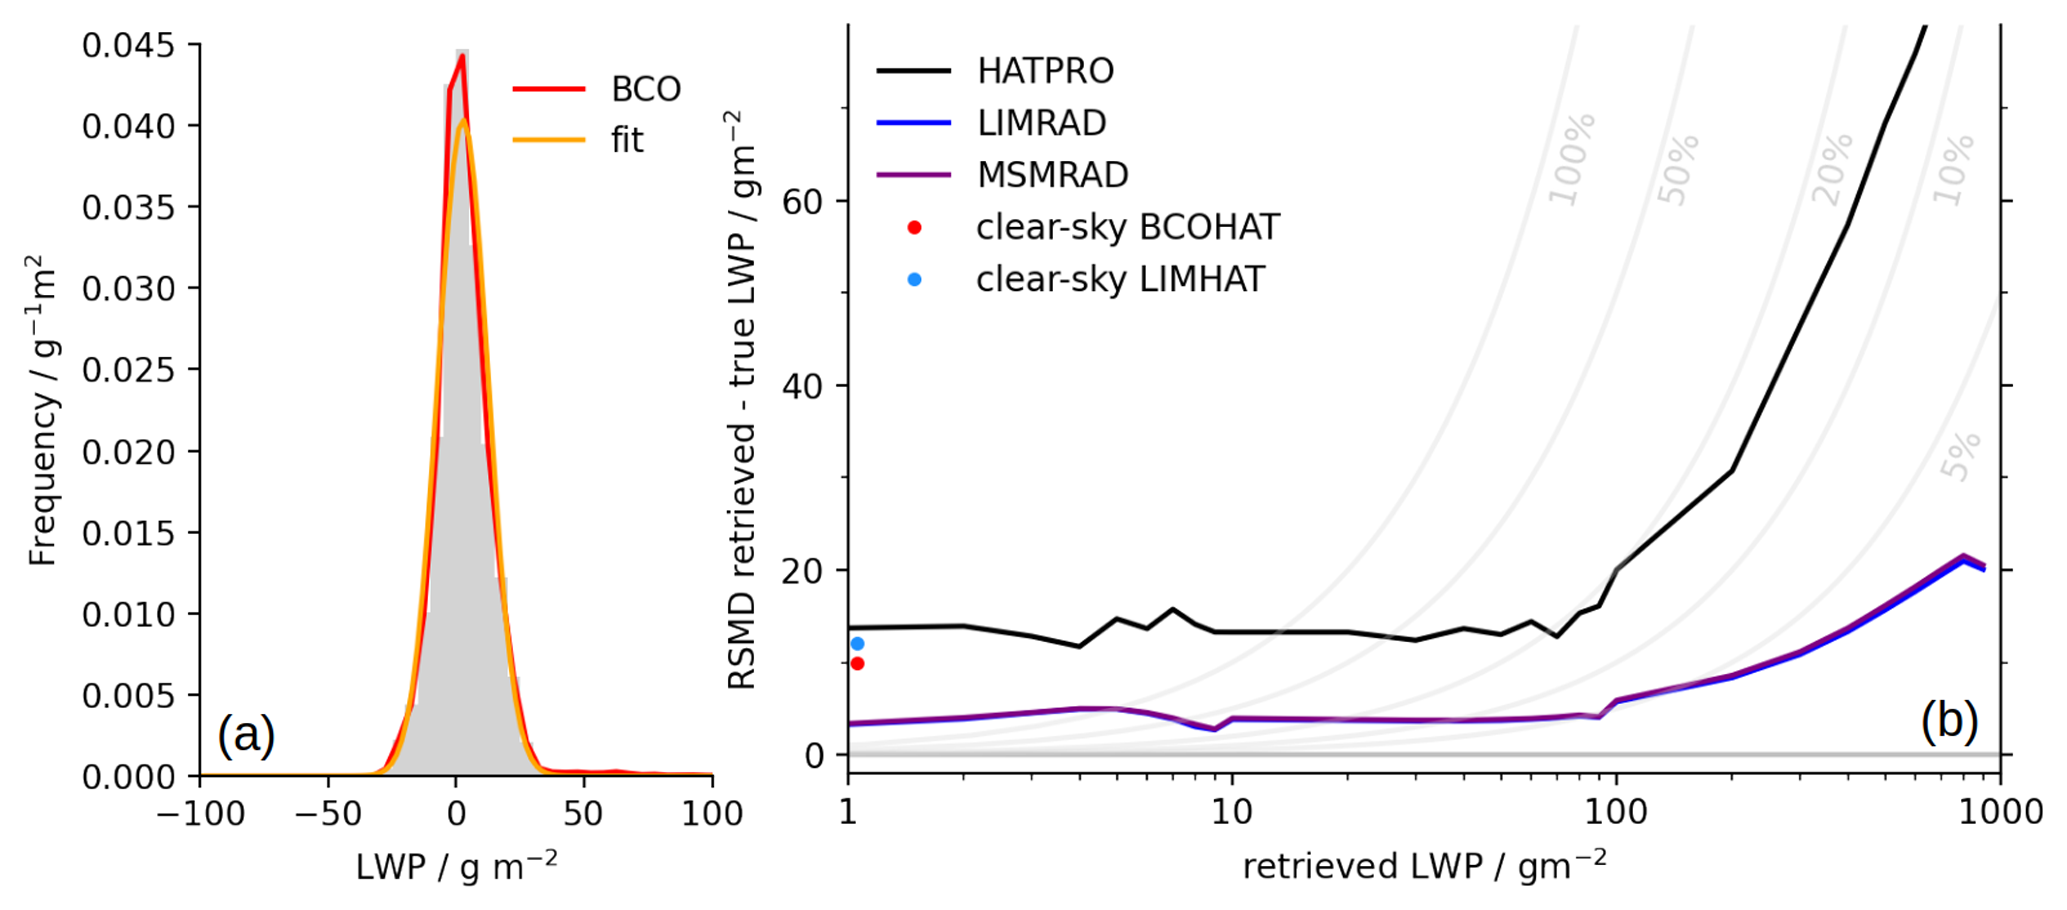
Figure 7(a) Distribution of occurrence of BCOHAT LWP in clear-sky-identified scenes (red) and respective Gaussian fit (orange), and (b) RMSD of retrieved versus true LWP for HATPRO (black) and single-channel retrieval (purple, blue), binned to retrieved LWP. Respective clear-sky Gaussian standard deviations are given for BCOHAT (red) and LIMHAT (blue).
Table 7Parameters of clear-sky LWP distribution at all sites, including clear-sky fraction of all valid LWP measurements, median, mean, standard deviation, and 10th and 90th percentiles. Additionally, mean and standard deviation of a Gaussian fit are given.
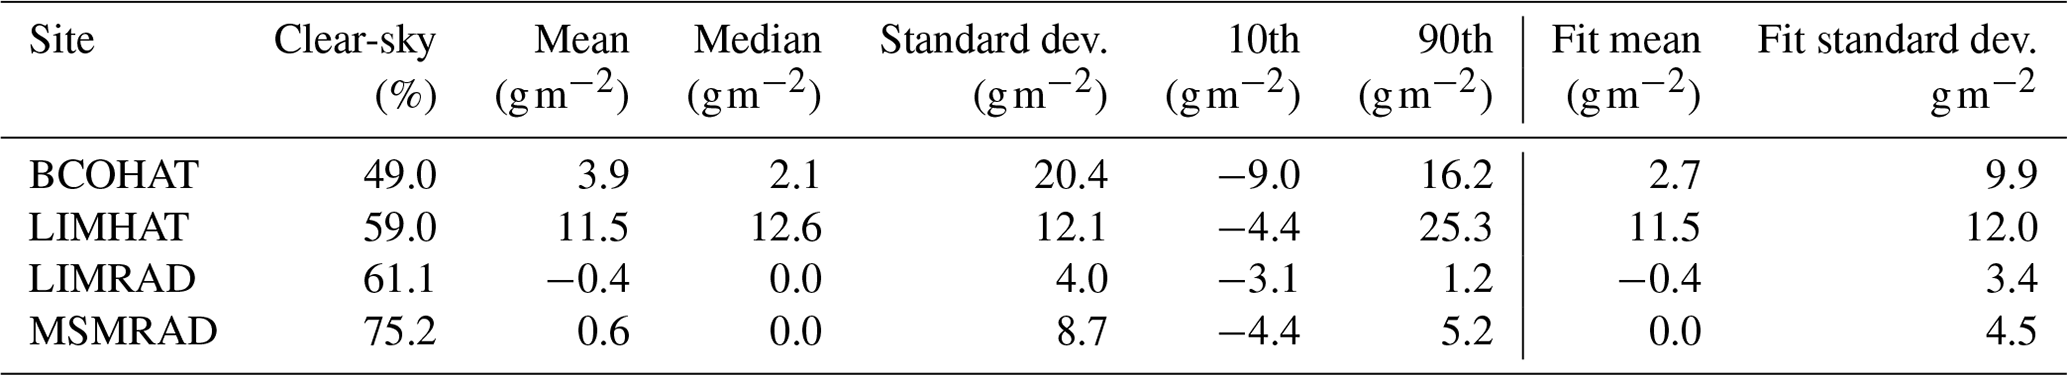
The retrieved clear-sky LWP distribution at BCO is illustrated in Fig. 7a, and Table 7 summarizes the distribution characteristics for all sites. Percentages of 49.0 %, 59.0 %, 61.1 %, and 75.2 % of all valid LWP BCOHAT, LIMHAT, LIMRAD, and MSMRAD measurements, respectively, are identified as clear-sky. Note that the fractions disagree for LIMRAD and LIMHAT aboard Meteor due to different observational gaps in the measurements. Applying a Gaussian fit to the distribution yields a mean and standard deviation, which is interpreted as clear-sky LWP bias and clear-sky LWP noise, respectively. The Gaussian fit widths of 9.9 and 12.0 g m−2 for BCOHAT and LIMHAT, respectively, quantify the clear-sky LWP noise and match clear-sky noises previously identified for retrievals based on the similar channels (Jacob et al., 2019; Schnitt et al., 2017). The single-channel clear-sky LWP noises are smaller (3.4 and 4.5 g m−2, respectively), as IWV is fixed due to retrieving from the TB difference of cloudy and clear-sky and as water vapor absorption is stronger at 89 GHz compared to the lower frequencies used in BCOHAT and LIMHAT. The lowest detectable LWP depends on the vertical water vapor distribution which, in cloudy conditions, is not available at any of the sites. Therefore, we estimate the smallest detectable LWP as the clear-sky LWP noise which, in turn, depends on the performance of the independent cloud-masking algorithm.
Table 8Characteristics of the confidently liquid cloudy Level 3 LWP distribution considering each instrument's detection limit. Fraction (relative to all valid confidently liquid cloudy measurements) and mean LWP are calculated for the following LWP bins: LWP below detection threshold, LWP between the detection threshold and 30 g m−2, LWP between 30 and 100 g m−2, and LWP above 100 g m−2.
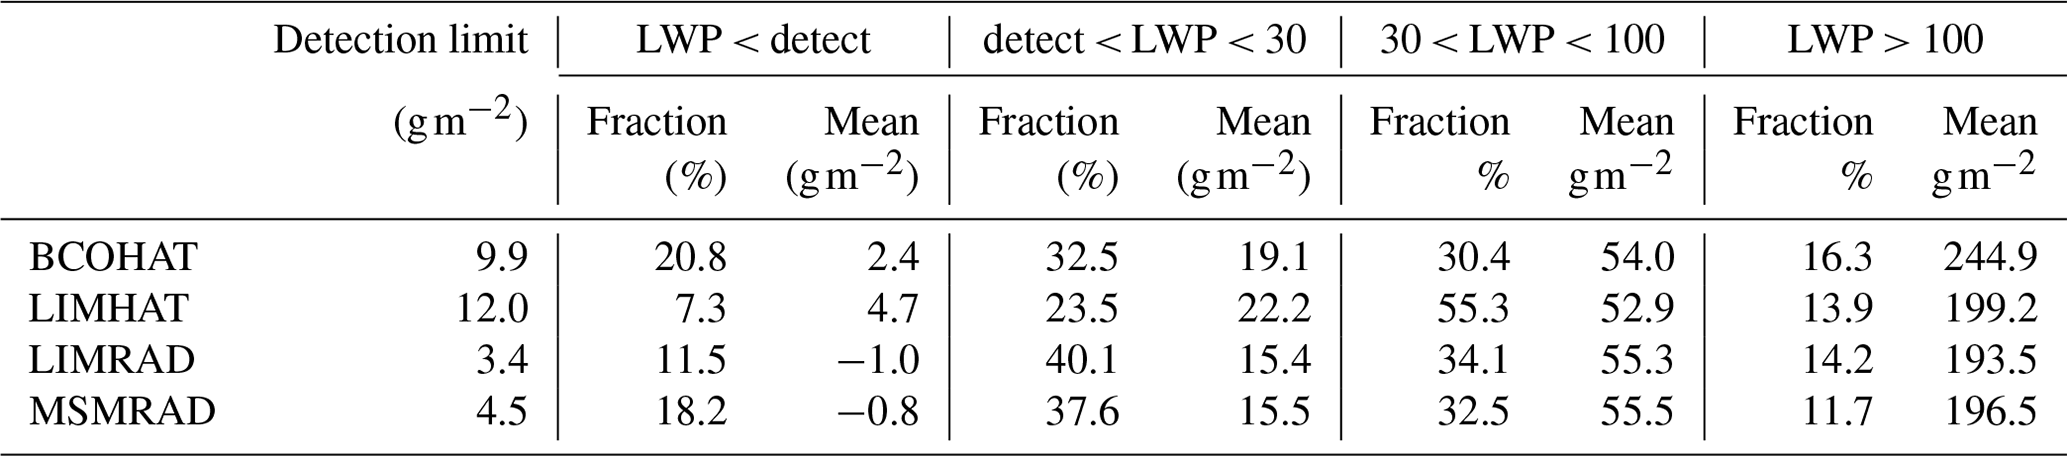
Quantifying the detection limit allows us to analyze which clouds are missed by the different radiometers. Percentages of 79.2 %, 92.8 %, 88.5 %, and 81.8 % of all confidently liquid cloudy flagged measurements contain LWP above the respective detection limits of BCOHAT, LIMHAT, LIMRAD, and MSMRAD (see Table 8). The remaining undetected LWP compared to the ceilometer-radar cloud mask is most likely associated to optically thin clouds with low water contents (e.g., Mieslinger et al., 2022) and to cloud mask performance. This reduction in cloud cover when derived from passive microwave sensors is also observed by the airborne cloud masks (Konow et al., 2021). One-third of detected LWP is seen between the detection limit and 30 g m−2, as well as between 30 and 100 g m−2, averaging to mean LWP conditions of 19 to 22 g m−2 and around 55 g m−2, respectively. Only 11 % to 16 % of detected LWP at BCO and aboard the ships, respectively, are associated with thicker clouds of higher than 100 g m−2.
Cloudy LWP uncertainty varies as a function of retrieved LWP as illustrated in Fig. 7b binned to logarithmic bins of LWP. The mean RMSD for HATPRO-derived LWPs below 20 g m−2 varies below 5 g m−2, corresponding to a relative RMSD between 75 % and 50 %. For LWP between 20 and 100 g m−2, the RMSD moderately reduces from 50 % to 15 % of retrieved LWP (15.8 at 50 g m−2). Above LWP of 100 g m−2, the relative uncertainty is better than 15 % (e.g., 29.9 g m−2 at LWP of 200 g m−2). Higher LWP values are in reality often affected by precipitation and, thus, not sensed by ground- or ship-based MWR measurements. Jacob et al. (2019) find, on average, higher RMSDs, which we relate to the additional uncertainty given by the background emission characterization for airborne LWP retrieval.
The single-channel retrieval, different in retrieval design and training data set compared to the multi-channel retrieval, is characterized by lower uncertainties and detection limit. Higher liquid water emissions in the 89 GHz channel compared to the 31.4 GHz channel used in the multi-frequency HATPRO retrieval leads to a higher sensitivity of the retrieval to smaller clouds with less liquid. This retrieval, however, strongly depends on the knowledge of IWV conditions and accurate clear-sky flagging. Relative LWP uncertainty for LWP between 10 and 100 g m−2 increases by few percentage points if closest clear-sky and cloudy IWV differ by 1 to 2 kg m−2.
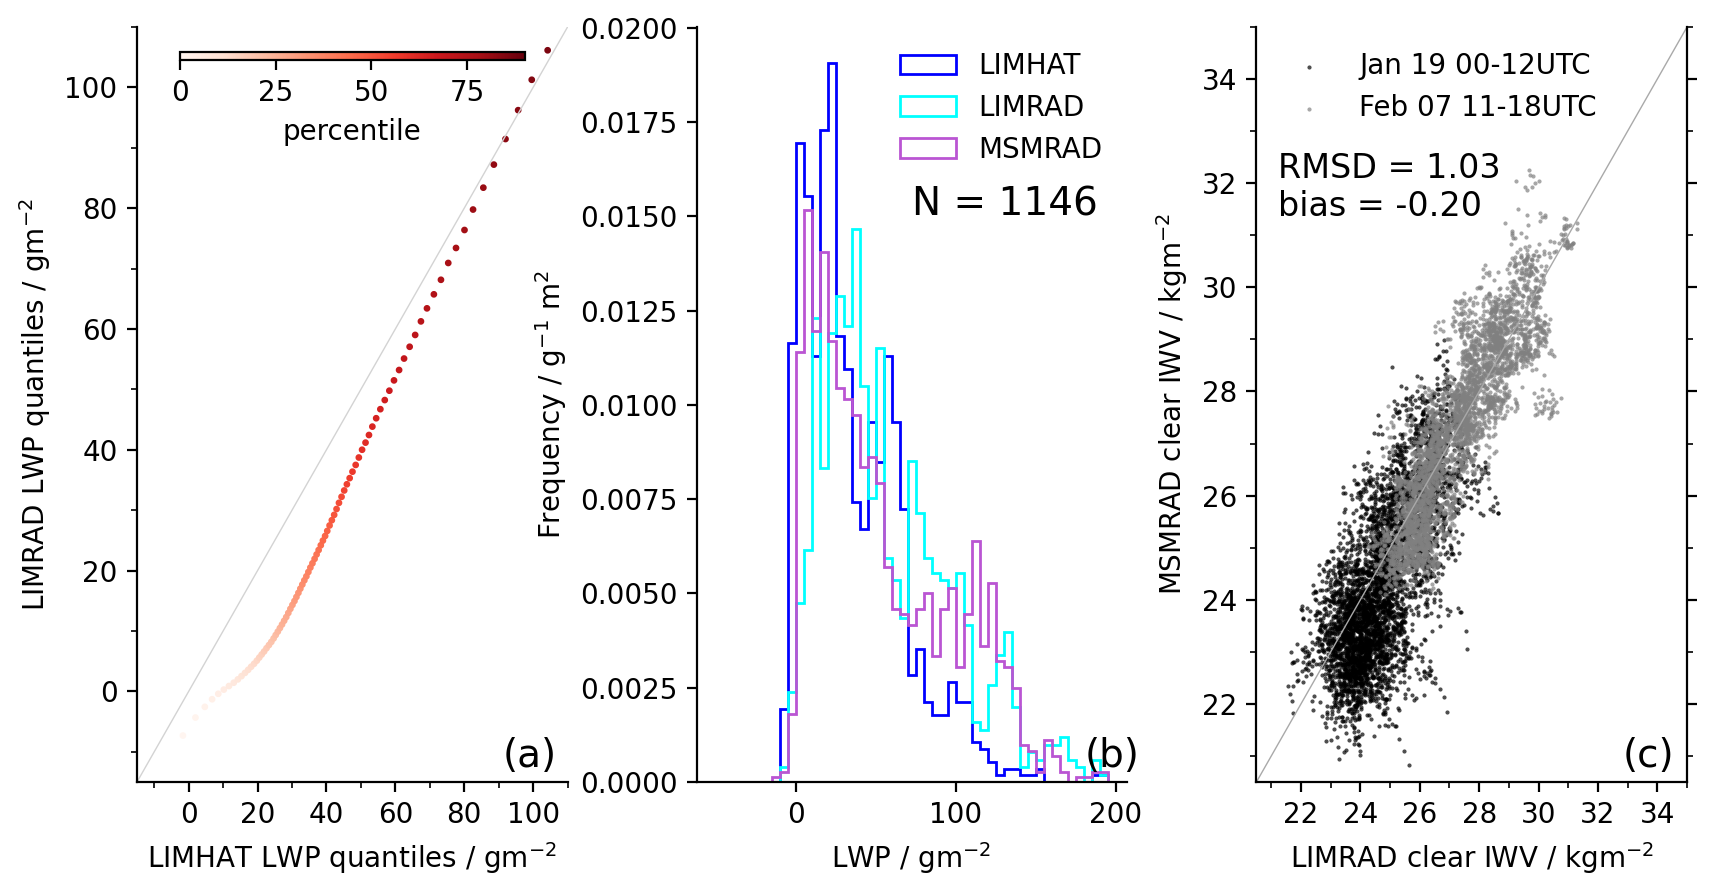
Figure 8(a) Percentiles of LIMHAT- and LIMRAD-retrieved liquid cloudy LWP distributions during the EUREC4A core period. Intercomparison of LIMRAD and MSMRAD retrieved (b) liquid cloudy LWP and (c) clear-sky IWV when Meteor and Merian steamed along the same trajectory (19 January 2020, 00–12UTC) and measured at the same location (7 February 2020, 11:00–18:00 UTC).
6.3 Single-channel retrieval intercomparison
The availability of both multi- and single-channel retrievals aboard Meteor allows for a direct comparison of the two different retrieval approaches. A direct intercomparison in confidently liquid cloudy conditions reveals a LWP RMSD of 31.3 g m−2, a bias of −5.9 g m−2 (LIMHAT LWP higher than LIMRAD), and a high correlation of 0.92 (not shown). As LWP varies strongly in time and space and sensors fields of view are different, comparing the liquid cloudy LWP distributions through percentiles is a preferable method. The percentiles of the liquid cloudy LWP distribution of LIMRAD and LIMHAT, illustrated in Fig. 8, show that LIMRAD-retrieved LWP is skewed to lower values compared to LIMHAT's LWP. The different clear-sky correction approaches in the two retrievals constitute themselves in the fact that LIMRAD LWP approaches zero when LIMHAT LWP ranges between 5 and 17 g m−2. Above this range, the negative bias towards LIMRAD, showing less LWP than LIMHAT, moderately decreases towards higher LWP values.
Inter-platform evaluation of single-channel-retrieved LWP and clear-sky IWV is performed for the two periods of ship collocation (see Sect. 2.2). The ships's visiting times at BCO could not be used as BCOHAT was not operational at those times. LWPs obtained from LIMHAT, LIMRAD, and MSMRAD are intercompared in a statistical way rather than directly as clouds might overpass with an unknown time shift. Both LIMRAD and MSMRAD exhibit larger LWPs (median of 50.4 and 42.6 g m−2, respectively) than LIMHAT (28.4 g m−2), confirming the percentile-based comparison of LIMRAD and LIMHAT. Cloudy profiles of above 100 g m−2 were mostly seen by MSMRAD, which, however, might be related to single events that did not overpass Meteor given the small sample size. Additionally, both radars were operated with different chirp table settings, leading to different sensitivity to boundary layer clouds which, in turn, might affect the performance of the cloud mask. Given the uncertainties of each LWP product identified in the previous section and the uncertainty related to the applied cloud mask, the distributions match well and are suitable for site intercomparison. Clear-sky IWV, less variable in space and time, is compared point to point and exhibits a RMSD of 1.0 and a bias of −0.2 kg m−2 (MSMRAD slightly drier). Both single-channel retrievals agree within the expected uncertainties.
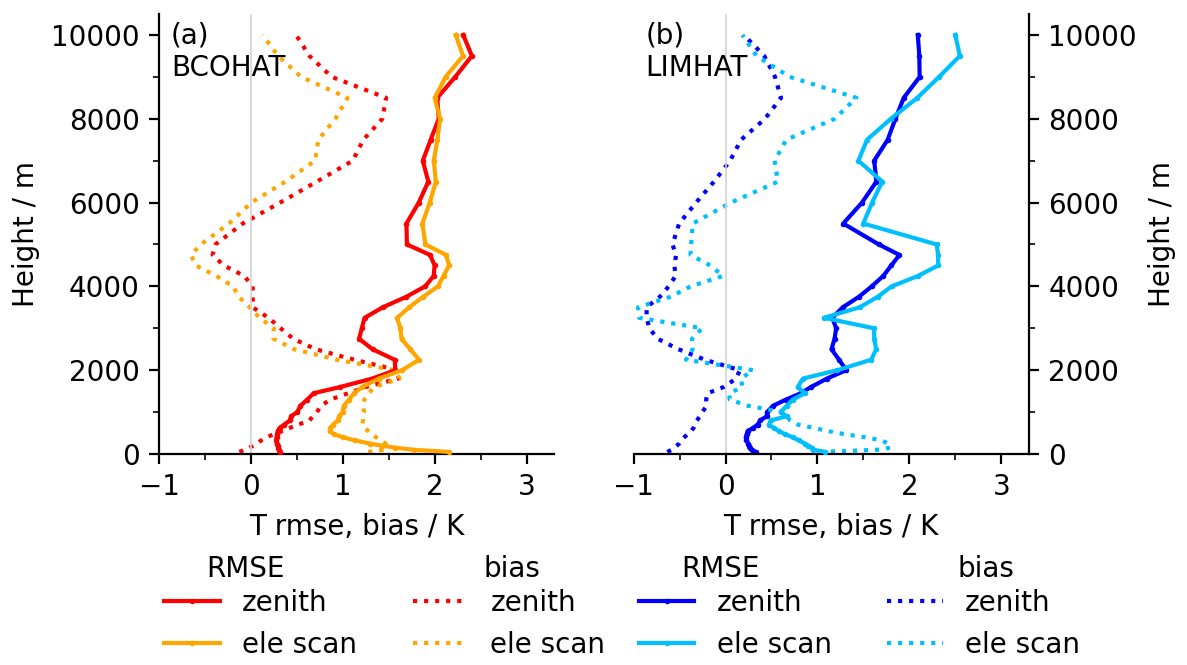
Figure 9RMSD (solid) and bias (dashed) of (a) BCOHAT and (b) LIMHAT temperature profiles from zenith (blue; red) and elevation scan (orange; cyan) operation compared to simultaneous sounding profiles.
Assuming that BCO and Meteor were exposed to similar conditions and given the fact that multi-channel derived LWP is generally more reliable, we conclude that the LIMHAT measurements should be used as truth for the Meteor site compared to the single-channel LIMRAD LWP. While LIMRAD single-channel LWP is biased by −5.9 g m−2 compared to the multi-channel LWP estimates, presumably due to a higher sensitivity towards smaller clouds, this bias cannot be directly translated to MSMRAD LWP due to absolute calibration differences of the two cloud radars. Clear-sky TB data are affected by a RMSD of 2.6 K and a bias of 5.6 K (Merian warmer), but a correlation of 0.66 is low due to temporal spatial mismatch. Given this TB bias and assuming all other instrument characteristics being the same between LIMRAD and MSMRAD, Merian single-channel LWPs might in reality be lower. An extended analysis can help to quantify this bias, e.g., by comparing similar-looking clouds as seen in the active cloud radar part.
The multi-channel measurements by the HATPRO instruments are used to retrieve temperature (see Sect. 7.1) and absolute humidity (see Sect. 7.2) profiles at BCO and aboard Meteor, respectively. Temperature profiles are obtained from zenith measurements and when elevation scans were performed (see Sect. 3.1), while absolute humidity profiles are only available in zenith mode. Profiles are obtained on 43 height levels with vertical resolution decreasing from 50–100 m in the moist layer to 200–500 m above the trade inversion. We use the EUREC4A sounding Level-2 data set (Stephan et al., 2021) to evaluate the MWR-retrieved profiles, assuming that the radiosoundings represent the best estimate of the true atmospheric conditions. To compare radiosoundings and MWR, we interpolate the radiosoundings to the MWR height grid and average MWR measurements 5 min around each sounding launch as conditions in the tropics change on longer timescales; 182 and 219 radiosoundings are used for BCO and Meteor, respectively. We then calculate RMSD and bias for each MWR height level. Positive biases here indicate an overestimation of MWR compared to the sounding value.
7.1 Temperature
The obtained temperature RMSD and bias are illustrated in Fig. 9. At both sites, zenith mode RMSD increases throughout the moist layer from less than 0.5 K below the lifting condensation level (LCL) to 1.5 K at the trade inversion around 2 km. As zenith, HATPRO measurements generally contain 2 degrees of freedom (independent pieces of information) for retrieving the temperature profile (Löhnert et al., 2009); the retrieval information content is too low to resolve the trade temperature inversion. Rather, the MWR profiles smooth the inversion, resulting in on average warmer MWR conditions at the base of the inversion and colder conditions at inversion top, similar to conditions found in the Arctic (Walbröl et al., 2022). Temperature information content is highest below 4 km (Löhnert and Maier, 2012), which makes the MWR insensitive to the conditions in the middle troposphere as seen by further increasing RMSD.
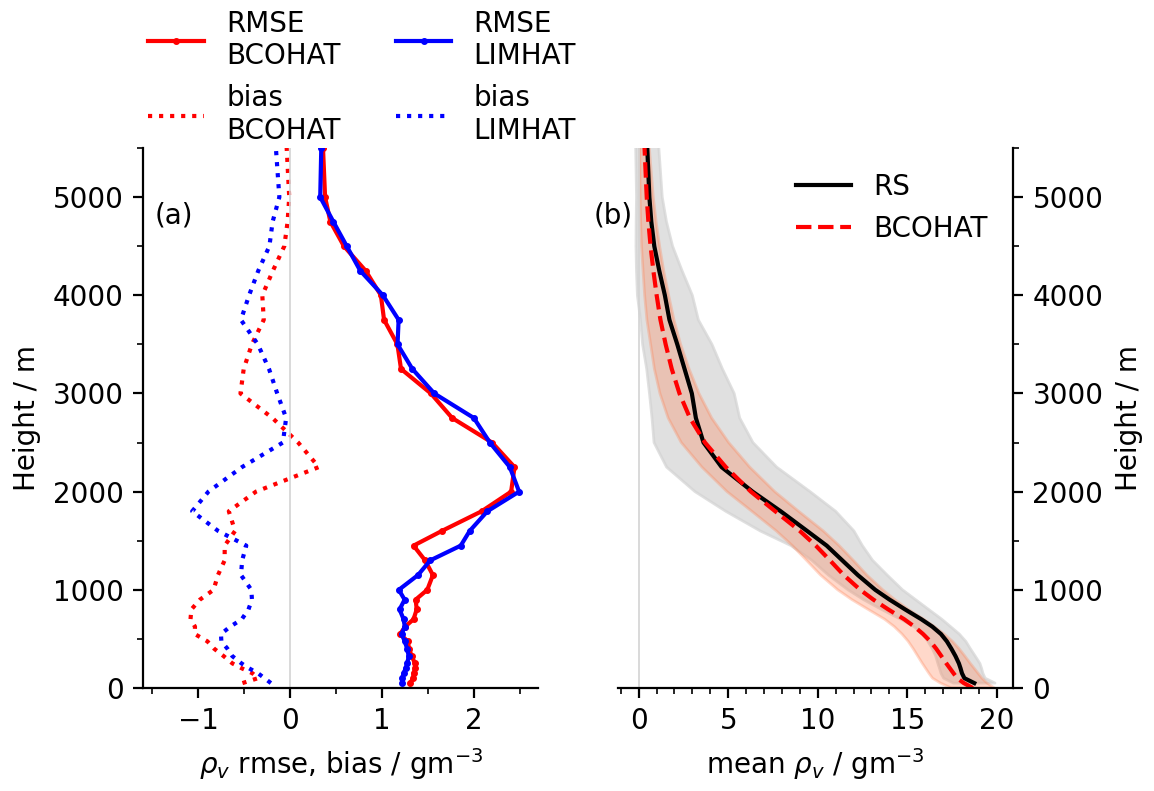
Figure 10(a) BCOHAT (red) and LIMHAT (blue) RMSD (solid) and bias (dashed) of retrieved absolute humidity ρv profiles compared to simultaneous sounding profiles, and (b) mean ρv profiles of radiosoundings (black) and BCOHAT (red), shaded by their respective standard deviation.
Elevation scans have been shown to improve the derived temperature profile in the lowest kilometer of the boundary layer (Crewell and Löhnert, 2007; Walbröl et al., 2022). As illustrated in Fig. 9, however, the BCOHAT and LIMHAT scans increase RMSD and bias in the layers below 1 km. We suspect that the GAIA sounding data set used for training is impacted by the island surface, leading to warmer temperatures in the moist layer compared to the zenith column at BCO or over the ocean. Typically, when trade winds prevail, radiosoundings launched at GAIA or BCO drift westwards over the island when ascending through the sub-cloud layer. Paired with small seasonal temperature variations in the tropics and, thus, little variability in the temperature training data set, this systematic training error translates into warm temperature biases of the retrieved temperature profiles compared to the launched radiosoundings. A physical, iterative retrieval approach such as Optimal Estimation (Rodgers, 2000; Maahn et al., 2020) would help to constrain the covariances of the prior temperature profile data set. Elevation scans aboard Meteor, in particular the low-elevation-angle measurements, are additionally affected by ship motion as LIMHAT was not stabilized. The functionality of the HATPRO-attached weather station might additionally impact the quality of the temperature retrieval.
7.2 Absolute humidity
Comparing radiosoundings and MWR yields to the RMSD and bias illustrated in Fig. 10a. At both sites, the RMSD from ground to LCL is 1.3 g m−3, and it increases to 2.5 g m−3 in the area of the hydrolapse associated with the trade inversion. The tendencies of the bias can be further understood when analyzing the mean profiles as illustrated in Fig. 10b. From ground towards hydrolapse, MWR underestimates the humidity, resulting in a negative bias of −1 g m−3. Throughout the hydrolapse, MWR and sounding profiles converge, which is due to the smoothing of the MWR profile. Depending on the strength of the hydrolapse, MWR overestimates the humidity in the dry layer, balancing the overall profile to match overall IWV conditions. Above the hydrolapse in the free troposphere, dry conditions prevail, and MWR is not sensitive to elevated moist layers. While the MWR covers the variability of moist layer water vapor well as seen by similar standard deviations of sounding and MWR profile, it does not resolve the variability in the hydrolapse or free troposphere. The overall negative bias in the absolute humidity profile translates into a dry bias in the IWV estimate (compared to the radiosoundings), which confirms the findings in Sect. 5.
The presented data set is available through AERIS (https://doi.org/10.25326/454#v2.0, Schnitt et al., 2023a). Processing and analysis code are available in Schnitt et al. (2023b) (https://doi.org/10.5281/zenodo.8208499).
This study presents ground- and ship-based passive MWR measurements performed during the EUREC4A field study. Between 19 January and 14 February 2020, continuous measurements of IWV, LWP, and coarse profiles of temperature and absolute humidity were obtained in the vicinity of Barbados at 3 s resolution. The 14-channel MWR measurements were performed at Barbados Cloud Observatory and aboard Meteor with a HATPRO microwave radiometer, while single-channel measurements were performed at 89 GHz aboard Meteor and Merian, complementing W-band cloud radar measurements.
The here-presented data set contributes key measurements to study the coupling of clouds to circulation and their environment, which was the overall goal of the EUREC4A field study (Bony et al., 2017; Stevens et al., 2021). The data set enables a continuous quantification of clouds' LWP in their immediate moisture environment, enables the characterization along spatial scales across the trade-driven tropical Atlantic, and complements the airborne LWP measurements performed aboard HALO and the SAFIRE ATR42. Similar mean IWV conditions of 31.8 and 30.3 kg m−2 at BCO and aboard Meteor, respectively, support the hypothesis that similar air masses were observed, evolving from Meteor towards BCO along the trade-wind-driven region. The Merian sampled moister conditions on its track southward, leading to mean IWV conditions of 33.3 kg m−2. The multi-channel retrieved IWV at BCO is affected by a RMSD of 1.1, 1.4 and 2.2 kg m−2 compared to radiosoundings, GNSS, and ERA5 estimates, matching uncertainties identified in midlatitudes (Steinke et al., 2015).
A precipitation and cloud mask are included in the data set, as derived from adjacent weather station and simultaneous cloud radar and ceilometer measurements. Cloudy scenes are additionally flagged for liquid cloud occurrence based on the radar observations. We find that 9.1 %, 10.7 %, and 14.6 % of all valid measurements contain ground-reaching precipitation at BCO, Meteor, and Merian, respectively. Confidently liquid cloudy scenes prevail in 33.5 %, 19.3 %, and 21.0 % of available profiles, respectively, matching cloud cover estimates in Nuijens et al. (2014). Confidently liquid cloudy LWP distributions reveal a mean LWP of 63.1, 62.5, and 46.8 g m−2 at BCO, Meteor, and Merian, respectively, which align with findings in Jacob et al. (2019). So 90 % of all confidently liquid cloudy profiles contained around 160 and 120 g m−2 LWP at BCO and aboard Meteor and Merian, respectively. Derived LWP statistics depend on the performance of the cloud-masking algorithm. When including probably cloudy identified scenes in the statistics, mean LWP and percentiles reduce slightly due to beam mismatches and resulting misidentification of clear scenes. Multi-channel retrieved LWP at BCO and aboard Meteor is provided with an uncertainty of 30 % at 50 g m−2 and better than 15 % above 100 g m−2. Single-channel retrieved LWP uncertainty is reduced by 70 % at 50 g m−2 but might in reality be higher as the retrieval requires accurate quantification of IWV and clear-sky identification. Clear-sky LWP noise reveals a detection limit of 9.9, 12.0, 3.4 and 4.5 g m−2 for BCOHAT, LIMHAT, LIMRAD and MSMRAD. Up to 20 % of confidently liquid cloudy tagged profiles are below the LWP detection limit, presumably due to undetected optically thin clouds (Mieslinger et al., 2022).
We recommend using the Level 4 data set for non-expert users as quality and precipitation flags were applied to the provided IWV and LWP time series. Data are resampled to different temporal resolutions, facilitating model–observation intercomparison experiments. More experienced users will find more details in the Level 3 data set, including a liquid cloud flag and the temperature and humidity retrieval output. Future retrieval approaches could combine HATPRO and the 89 GHz channel (Crewell and Löhnert, 2003) to advance the retrieval performance. More specifically, improvements are expected by applying neural-network-based (e.g., Jacob et al., 2019; Cadeddu et al., 2009) or physical (e.g., Löhnert et al., 2004; Turner et al., 2007a; Maahn et al., 2020) retrieval approaches. The single-channel LWP retrieval can be used to evaluate the approach presented by Billault-Roux and Berne (2021). The spatial dimension of this data set is currently further exploited by characterizing LWP and IWV conditions in different mesoscale organization conditions (e.g., Schulz et al., 2021) and by evaluating microwave and VIS/IR satellite LWP products as well as climatologies (Elsaesser et al., 2017). Combining BCO and Meteor measurements can frame Lagrangian trajectory analyses, targeting the evolution of air masses along the trade winds. Using this data set to benchmark cloud-resolving simulations will help with answering some of the central questions targeted by the EUREC4A field study on the interplay of clouds, circulation, convection, and climate.
SaS led the study; developed the Barbados-specific HATPRO retrieval; and prepared data set, manuscript, and figures. AF and HKL supported the conceptualization of the study and led the Meteor measurements and post-processing, supported by JR. MM and SC developed and ran the single-channel retrieval. CA led the measurements aboard Merian. UL provided expertise on HATPRO retrieval, and BP contributed the spectral flagging retrieval. FJ maintains the BCO measurements. BS led the EUREC4A campaign. All authors contributed to the manuscript.
The contact author has declared that none of the authors has any competing interests.
Publisher's note: Copernicus Publications remains neutral with regard to jurisdictional claims made in the text, published maps, institutional affiliations, or any other geographical representation in this paper. While Copernicus Publications makes every effort to include appropriate place names, the final responsibility lies with the authors.
This article is part of the special issue “Elucidating the role of clouds–circulation coupling in climate: data sets from the 2020 (EUREC4A) field campaign”. It is not associated with a conference.
The data used in this publication was gathered in the EUREC4A field campaign and is made available through Max Planck Institute for Meteorology, University Leipzig, University of Cologne. EUREC4A is funded with support of the European Research Council (ERC), the Max Planck Society (MPG), the German Research Foundation (DFG), the German Meteorological Weather Service (DWD), and the German Aerospace Center (DLR). Sabrina Schnitt's EUREC4A participation was funded by a travel grant from the Graduate School of Geosciences (GSGS), University of Cologne. We thank the BCO team for maintaining the observatory; the ship crews of RV Meteor and RV Maria S Merian for their support; and the AERIS team, especially Vincent Douet, for their support in publishing the data set. We thank two anonymous reviewers for their helpful comments.
Research by Heike Kalesse-Los, Andreas Foth, and Johannes Röttenbacher has been supported by the Federal State of Saxony and the European Social Fund (ESF) in the framework of the program “Projects in the fields of higher education and research” (grant no. 100339509) and ESF-REACT (grant no. 100602743). Further financial support was provided by the German Science Foundation (DFG; grant no. FO 1285/2-1). Claudia Acquistapace's research was funded by Deutsche Forschungsgemeinschaft (DFG) under the Research Grants Programme – Individual Proposal with title “Precipitation life cycle in trade wind cumuli”, project number 437320342. Claudia Acquistapace also acknowledges funding from the Federal Ministry for Digital and Transport (BMDV).
This open-access publication was funded by Universität zu Köln.
This paper was edited by Silke Gross and reviewed by two anonymous referees.
Acquistapace, C., Coulter, R., Crewell, S., Garcia-Benadi, A., Gierens, R., Labbri, G., Myagkov, A., Risse, N., and Schween, J. H.: EUREC4A's Maria S. Merian ship-based cloud and micro rain radar observations of clouds and precipitation, Earth Syst. Sci. Data, 14, 33–55, https://doi.org/10.5194/essd-14-33-2022, 2022. a, b, c, d, e, f
Billault-Roux, A.-C. and Berne, A.: Integrated water vapor and liquid water path retrieval using a single-channel radiometer, Atmos. Meas. Tech., 14, 2749–2769, https://doi.org/10.5194/amt-14-2749-2021, 2021. a, b, c
Bock, O., Bosser, P., Flamant, C., Doerflinger, E., Jansen, F., Fages, R., Bony, S., and Schnitt, S.: Integrated water vapour observations in the Caribbean arc from a network of ground-based GNSS receivers during EUREC4A, Earth Syst. Sci. Data, 13, 2407–2436, https://doi.org/10.5194/essd-13-2407-2021, 2021. a, b, c, d
Bony, S., Stevens, B., Frierson, D. M. W., Jakob, C., Kageyama, M., Pincus, R., Shepherd, T. G., Sherwood, S. C., Siebesma, A. P., Sobel, A. H., Watanabe, M., and Webb, M. J.: Clouds, circulation and climate sensitivity, Nat. Geosci., 8, 261–268, https://doi.org/10.1038/ngeo2398, 2015. a
Bony, S., Stevens, B., Ament, F., Bigorre, S., Chazette, P., Crewell, S., Delanoë, J., Emanuel, K., Farrell, D., Flamant, C., Gross, S., Hirsch, L., Karstensen, J., Mayer, B., Nuijens, L., Ruppert, J. H., Sandu, I., Siebesma, P., Speich, S., Szczap, F., Totems, J., Vogel, R., Wendisch, M., and Wirth, M.: EUREC4A: A Field Campaign to Elucidate the Couplings Between Clouds, Convection and Circulation, Surv. Geophys., 38, 1529–1568, https://doi.org/10.1007/s10712-017-9428-0, 2017. a, b
Bony, S., Lothon, M., Delanoë, J., Coutris, P., Etienne, J.-C., Aemisegger, F., Albright, A. L., André, T., Bellec, H., Baron, A., Bourdinot, J.-F., Brilouet, P.-E., Bourdon, A., Canonici, J.-C., Caudoux, C., Chazette, P., Cluzeau, M., Cornet, C., Desbios, J.-P., Duchanoy, D., Flamant, C., Fildier, B., Gourbeyre, C., Guiraud, L., Jiang, T., Lainard, C., Le Gac, C., Lendroit, C., Lernould, J., Perrin, T., Pouvesle, F., Richard, P., Rochetin, N., Salaün, K., Schwarzenboeck, A., Seurat, G., Stevens, B., Totems, J., Touzé-Peiffer, L., Vergez, G., Vial, J., Villiger, L., and Vogel, R.: EUREC4A observations from the SAFIRE ATR42 aircraft, Earth Syst. Sci. Data, 14, 2021–2064, https://doi.org/10.5194/essd-14-2021-2022, 2022. a
Bosser, P., Bock, O., Flamant, C., Bony, S., and Speich, S.: Integrated water vapour content retrievals from ship-borne GNSS receivers during EUREC4A, Earth Syst. Sci. Data, 13, 1499–1517, https://doi.org/10.5194/essd-13-1499-2021, 2021. a, b
Cadeddu, M., Turner, D., and Liljegren, J.: A Neural Network for Real-Time Retrievals of PWV and LWP From Arctic Millimeter-Wave Ground-Based Observations, IEEE T. Geosci. Remote, 47, 1887–1900, https://doi.org/10.1109/TGRS.2009.2013205, 2009. a, b
Crewell, S. and Löhnert, U.: Accuracy of cloud liquid water path from ground-based microwave radiometry 2. Sensor accuracy and synergy, Radio Sci., 38, 3, https://doi.org/10.1029/2002RS002634, 2003. a
Crewell, S. and Löhnert, U.: Accuracy of Boundary Layer Temperature Profiles Retrieved With Multifrequency Multiangle Microwave Radiometry, IEEE T. Geosci. Remote, 45, 2195–2201, https://doi.org/10.1109/TGRS.2006.888434, 2007. a, b, c
Dufresne, J.-L. and Bony, S.: An Assessment of the Primary Sources of Spread of Global Warming Estimates from Coupled Atmosphere–Ocean Models, J. Climate, 21, 5135–5144, https://doi.org/10.1175/2008JCLI2239.1, 2008. a
Ebell, K., Löhnert, U., Päschke, E., Orlandi, E., Schween, J. H., and Crewell, S.: A 1-D variational retrieval of temperature, humidity, and liquid cloud properties: Performance under idealized and real conditions, J. Geophys. Res.-Atmos., 122, 1746–1766, https://doi.org/10.1002/2016JD025945, 2017. a
Elsaesser, G. S., O'Dell, C. W., Lebsock, M. D., Bennartz, R., Greenwald, T. J., and Wentz, F. J.: The Multisensor Advanced Climatology of Liquid Water Path (MAC-LWP), J. Climate, 30, 10193–10210, https://doi.org/10.1175/JCLI-D-16-0902.1, 2017. a, b
Foster, J., Bevis, M., and Raymond, W.: Precipitable water and the lognormal distribution, J. Geophys. Res.-Atmos., 111, D15102, https://doi.org/10.1029/2005JD006731, 2006. a
George, G., Stevens, B., Bony, S., Pincus, R., Fairall, C., Schulz, H., Kölling, T., Kalen, Q. T., Klingebiel, M., Konow, H., Lundry, A., Prange, M., and Radtke, J.: JOANNE: Joint dropsonde Observations of the Atmosphere in tropical North atlaNtic meso-scale Environments, Earth Syst. Sci. Data, 13, 5253–5272, https://doi.org/10.5194/essd-13-5253-2021, 2021. a
Hirsch, L.: Ka Band Cloud Radar Barbados Cloud Observatory, EUREC4A, AERIS [data set], https://doi.org/10.25326/55, 2022. a
Illingworth, A. J., Hogan, R. J., O'Connor, E. J., Bouniol, D., Brooks, M. E., Delanoé, J., Donovan, D. P., Eastment, J. D., Gaussiat, N., Goddard, J. W. F., Haeffelin, M., Baltink, H. K., Krasnov, O. A., Pelon, J., Piriou, J.-M., Protat, A., Russchenberg, H. W. J., Seifert, A., Tompkins, A. M., van Zadelhoff, G.-J., Vinit, F., Willén, U., Wilson, D. R., and Wrench, C. L.: Cloudnet: Continuous Evaluation of Cloud Profiles in Seven Operational Models Using Ground-Based Observations, B. Am. Meteorol. Soc., 88, 883–898, https://doi.org/10.1175/BAMS-88-6-883, 2007. a
Jacob, M.: Liquid water path and integrated water vapor over the tropical Atlantic during EUREC4A, AERIS [data set], https://doi.org/10.25326/247, 2021. a
Jacob, M., Ament, F., Gutleben, M., Konow, H., Mech, M., Wirth, M., and Crewell, S.: Investigating the liquid water path over the tropical Atlantic with synergistic airborne measurements, Atmos. Meas. Tech., 12, 3237–3254, https://doi.org/10.5194/amt-12-3237-2019, 2019. a, b, c, d, e, f, g, h, i, j, k
Jacob, M., Kollias, P., Ament, F., Schemann, V., and Crewell, S.: Multilayer cloud conditions in trade wind shallow cumulus – confronting two ICON model derivatives with airborne observations, Geosci. Model Dev., 13, 5757–5777, https://doi.org/10.5194/gmd-13-5757-2020, 2020. a
Jahangir, E., Libois, Q., Couvreux, F., Vié, B., and Saint-Martin, D.: Uncertainty of SW Cloud Radiative Effect in Atmospheric Models Due to the Parameterization of Liquid Cloud Optical Properties, J. Adv. Model. Earth Sy., 13, e2021MS002742, https://doi.org/10.1029/2021MS002742, 2021. a
Jansen, F., Bruegmann, B., and Schulz, H.: Surface meteorology Barbados Cloud Observatory, Aeris [data set], https://doi.org/10.25326/54, 2020. a
Kalesse-Los, H., Röttenbacher, J., Schäfer, M., and Emmanouilidis, A.: Microwave Radiometer Measurements RV Meteor, EUREC4A, AERIS [data set], https://doi.org/10.25326/77, 2020. a
Kalesse-Los, H., Kötsche, A., Foth, A., Röttenbacher, J., Vogl, T., and Witthuhn, J.: The Virga-Sniffer – a new tool to identify precipitation evaporation using ground-based remote-sensing observations, Atmos. Meas. Tech., 16, 1683–1704, https://doi.org/10.5194/amt-16-1683-2023, 2023. a, b, c, d, e, f, g, h
Karstens, U., Simmer, C., and Ruprecht, E.: Remote sensing of cloud liquid water, Meteorol. Atmos. Phys., 54, 157–171, https://doi.org/10.1007/BF01030057, 1994. a
Klingebiel, M., Ghate, V. P., Naumann, A. K., Ditas, F., Pöhlker, M. L., Pöhlker, C., Kandler, K., Konow, H., and Stevens, B.: Remote Sensing of Sea Salt Aerosol below Trade Wind Clouds, J. Atmos. Sci., 76, 1189–1202, https://doi.org/10.1175/JAS-D-18-0139.1, 2019. a, b
Konow, H., Ewald, F., George, G., Jacob, M., Klingebiel, M., Kölling, T., Luebke, A. E., Mieslinger, T., Pörtge, V., Radtke, J., Schäfer, M., Schulz, H., Vogel, R., Wirth, M., Bony, S., Crewell, S., Ehrlich, A., Forster, L., Giez, A., Gödde, F., Groß, S., Gutleben, M., Hagen, M., Hirsch, L., Jansen, F., Lang, T., Mayer, B., Mech, M., Prange, M., Schnitt, S., Vial, J., Walbröl, A., Wendisch, M., Wolf, K., Zinner, T., Zöger, M., Ament, F., and Stevens, B.: EUREC4A's HALO, Earth Syst. Sci. Data, 13, 5545–5563, https://doi.org/10.5194/essd-13-5545-2021, 2021. a, b, c, d, e
Küchler, N., Kneifel, S., Löhnert, U., Kollias, P., Czekala, H., and Rose, T.: A W-Band Radar–Radiometer System for Accurate and Continuous Monitoring of Clouds and Precipitation, J. Atmos. Ocean. Tech., 34, 2375–2392, https://doi.org/10.1175/JTECH-D-17-0019.1, 2017. a, b, c
Liljegren, J., Boukabara, S.-A., Cady-Pereira, K., and Clough, S.: The effect of the half-width of the 22-GHz water vapor line on retrievals of temperature and water vapor profiles with a 12-channel microwave radiometer, IEEE T. Geosci. Remote, 43, 1102–1108, https://doi.org/10.1109/TGRS.2004.839593, 2005. a
Löhnert, U.: Ground-based microwave radiometer reprocessing mwr_pro, Zenodo [code], https://doi.org/10.5281/zenodo.7973553, 2023. a
Löhnert, U. and Crewell, S.: Accuracy of cloud liquid water path from ground-based microwave radiometry 1. Dependency on cloud model statistics, Radio Sci., 38, 8041, https://doi.org/10.1029/2002RS002654, 2003. a, b, c
Löhnert, U. and Maier, O.: Operational profiling of temperature using ground-based microwave radiometry at Payerne: prospects and challenges, Atmos. Meas. Tech., 5, 1121–1134, https://doi.org/10.5194/amt-5-1121-2012, 2012. a
Löhnert, U., Crewell, S., and Simmer, C.: An Integrated Approach toward Retrieving Physically Consistent Profiles of Temperature, Humidity, and Cloud Liquid Water, J. Appl. Meteorol., 43, 1295–1307, https://doi.org/10.1175/1520-0450(2004)043<1295:AIATRP>2.0.CO;2, 2004. a
Löhnert, U., Turner, D. D., and Crewell, S.: Ground-Based Temperature and Humidity Profiling Using Spectral Infrared and Microwave Observations. Part I: Simulated Retrieval Performance in Clear-Sky Conditions, J. Appl. Meteorol. Clim., 48, 1017–1032, https://doi.org/10.1175/2008JAMC2060.1, 2009. a, b
Maahn, M., Turner, D. D., Löhnert, U., Posselt, D. J., Ebell, K., Mace, G. G., and Comstock, J. M.: Optimal Estimation Retrievals and Their Uncertainties: What Every Atmospheric Scientist Should Know, B. Am. Meteorol. Soc., 101, E1512–E1523, https://doi.org/10.1175/BAMS-D-19-0027.1, 2020. a, b, c
Maschwitz, G., Löhnert, U., Crewell, S., Rose, T., and Turner, D. D.: Investigation of ground-based microwave radiometer calibration techniques at 530 hPa, Atmos. Meas. Tech., 6, 2641–2658, https://doi.org/10.5194/amt-6-2641-2013, 2013. a
Mätzler, C., Ellison, W., Thomas, B., Sihvola, A., and Schwank, M.: Dielectric properties of natural media, in: Thermal Microwave Radiation: Applications for Remote Sensing, IET Digital Library, https://doi.org/10.1049/PBEW052E_ch5, pp. 427–506, 2006. a
Mech, M., Orlandi, E., Crewell, S., Ament, F., Hirsch, L., Hagen, M., Peters, G., and Stevens, B.: HAMP – the microwave package on the High Altitude and LOng range research aircraft (HALO), Atmos. Meas. Tech., 7, 4539–4553, https://doi.org/10.5194/amt-7-4539-2014, 2014. a, b
Mech, M., Maahn, M., Kneifel, S., Ori, D., Orlandi, E., Kollias, P., Schemann, V., and Crewell, S.: PAMTRA 1.0: the Passive and Active Microwave radiative TRAnsfer tool for simulating radiometer and radar measurements of the cloudy atmosphere, Geosci. Model Dev., 13, 4229–4251, https://doi.org/10.5194/gmd-13-4229-2020, 2020. a
Mieslinger, T., Stevens, B., Kölling, T., Brath, M., Wirth, M., and Buehler, S. A.: Optically thin clouds in the trades, Atmos. Chem. Phys., 22, 6879–6898, https://doi.org/10.5194/acp-22-6879-2022, 2022. a, b, c
Nuijens, L., Serikov, I., Hirsch, L., Lonitz, K., and Stevens, B.: The distribution and variability of low-level cloud in the North Atlantic trades, Q. J. Roy. Meteor. Soc., 140, 2364–2374, https://doi.org/10.1002/qj.2307, 2014. a, b
Pincus, R., Fairall, C. W., Bailey, A., Chen, H., Chuang, P. Y., de Boer, G., Feingold, G., Henze, D., Kalen, Q. T., Kazil, J., Leandro, M., Lundry, A., Moran, K., Naeher, D. A., Noone, D., Patel, A. J., Pezoa, S., PopStefanija, I., Thompson, E. J., Warnecke, J., and Zuidema, P.: Observations from the NOAA P-3 aircraft during ATOMIC, Earth Syst. Sci. Data, 13, 3281–3296, https://doi.org/10.5194/essd-13-3281-2021, 2021. a
Rauber, R. M., Stevens, B., Ochs, H. T., Knight, C., Albrecht, B. A., Blyth, A. M., Fairall, C. W., Jensen, J. B., Lasher-Trapp, S. G., Mayol-Bracero, O. L., Vali, G., Anderson, J. R., Baker, B. A., Bandy, A. R., Burnet, E., Brenguier, J.-L., Brewer, W. A., Brown, P. R. A., Chuang, R., Cotton, W. R., Girolamo, L. D., Geerts, B., Gerber, H., Göke, S., Gomes, L., Heikes, B. G., Hudson, J. G., Kollias, P., Lawson, R. R., Krueger, S. K., Lenschow, D. H., Nuijens, L., O'Sullivan, D. W., Rilling, R. A., Rogers, D. C., Siebesma, A. P., Snodgrass, E., Stith, J. L., Thornton, D. C., Tucker, S., Twohy, C. H., and Zuidema, P.: Rain in Shallow Cumulus Over the Ocean: The RICO Campaign, B. Am. Meteorol. Soc., 88, 1912–1928, https://doi.org/10.1175/BAMS-88-12-1912, 2007. a
Rodgers, C. D.: Inverse Methods for Atmospheric Sounding: Theory and Practice, World Scientific, https://doi.org/10.1142/3171, 2000. a
Rose, T., Crewell, S., Löhnert, U., and Simmer, C.: A network suitable microwave radiometer for operational monitoring of the cloudy atmosphere, Atmos. Res., 75, 183–200, https://doi.org/10.1016/j.atmosres.2004.12.005, 2005. a, b
Rosenkranz, P. W.: Water vapor microwave continuum absorption: A comparison of measurements and models, Radio Sci., 33, 919–928, https://doi.org/10.1029/98RS01182, 1998. a
Schnitt, S., Orlandi, E., Mech, M., Ehrlich, A., and Crewell, S.: Characterization of Water Vapor and Clouds During the Next-Generation Aircraft Remote Sensing for Validation (NARVAL) South Studies, IEEE J. Sel. Top. Appl., 10, 3114–3124, https://doi.org/10.1109/JSTARS.2017.2687943, 2017. a, b, c
Schnitt, S., Foth, A., Kalesse-Los, H., Mech, M., and Acquistapace, C.: Ground- and ship-based microwave radiometer measurements during EUREC4A, AERIS [data set], https://doi.org/10.25326/454#v2.0, 2023a. a, b, c
Schnitt, S., Mech, M., Acquistapace, C., and Kalesse-Los, H.: Code for processing ground- and ship-based microwave radiometer measurements during EUREC4A, Zenodo [code], https://doi.org/10.5281/zenodo.8208499, 2023b. a
Schulz, H., Eastman, R., and Stevens, B.: Characterization and Evolution of Organized Shallow Convection in the Downstream North Atlantic Trades, J. Geophys. Res.-Atmos., 126, e2021JD034575, https://doi.org/10.1029/2021JD034575, 2021. a
Seethala, C. and Horvath, A.: Global assessment of AMSR-E and MODIS cloud liquid water path retrievals in warm oceanic clouds, J. Geophys. Res.-Atmos., 115, D13202, https://doi.org/10.1029/2009JD012662, 2010. a
Steinke, S., Eikenberg, S., Löhnert, U., Dick, G., Klocke, D., Di Girolamo, P., and Crewell, S.: Assessment of small-scale integrated water vapour variability during HOPE, Atmos. Chem. Phys., 15, 2675–2692, https://doi.org/10.5194/acp-15-2675-2015, 2015. a, b
Stephan, C. C., Schnitt, S., Schulz, H., Bellenger, H., de Szoeke, S. P., Acquistapace, C., Baier, K., Dauhut, T., Laxenaire, R., Morfa-Avalos, Y., Person, R., Quiñones Meléndez, E., Bagheri, G., Böck, T., Daley, A., Güttler, J., Helfer, K. C., Los, S. A., Neuberger, A., Röttenbacher, J., Raeke, A., Ringel, M., Ritschel, M., Sadoulet, P., Schirmacher, I., Stolla, M. K., Wright, E., Charpentier, B., Doerenbecher, A., Wilson, R., Jansen, F., Kinne, S., Reverdin, G., Speich, S., Bony, S., and Stevens, B.: Ship- and island-based atmospheric soundings from the 2020 EUREC4A field campaign, Earth Syst. Sci. Data, 13, 491–514, https://doi.org/10.5194/essd-13-491-2021, 2021. a, b, c
Stevens, B. and Kluft, L.: A Colorful look at Climate Sensitivity, EGUsphere [preprint], https://doi.org/10.5194/egusphere-2022-1460, 2023. a
Stevens, B., Farrell, D., Hirsch, L., Jansen, F., Nuijens, L., Serikov, I., Brügmann, B., Forde, M., Linne, H., Lonitz, K., and Prospero, J. M.: The Barbados Cloud Observatory: Anchoring Investigations of Clouds and Circulation on the Edge of the ITCZ, B. Am. Meteorol. Soc., 97, 787–801, https://doi.org/10.1175/BAMS-D-14-00247.1, 2016. a, b, c
Stevens, B., Ament, F., Bony, S., Crewell, S., Ewald, F., Gross, S., Hansen, A., Hirsch, L., Jacob, M., Kölling, T., Konow, H., Mayer, B., Wendisch, M., Wirth, M., Wolf, K., Bakan, S., Bauer-Pfundstein, M., Brueck, M., Delanoë, J., Ehrlich, A., Farrell, D., Forde, M., Gödde, F., Grob, H., Hagen, M., Jäkel, E., Jansen, F., Klepp, C., Klingebiel, M., Mech, M., Peters, G., Rapp, M., Wing, A. A., and Zinner, T.: A High-Altitude Long-Range Aircraft Configured as a Cloud Observatory: The NARVAL Expeditions, B. Am. Meteorol. Soc., 100, 1061–1077, https://doi.org/10.1175/BAMS-D-18-0198.1, 2019. a, b
Stevens, B., Bony, S., Farrell, D., Ament, F., Blyth, A., Fairall, C., Karstensen, J., Quinn, P. K., Speich, S., Acquistapace, C., Aemisegger, F., Albright, A. L., Bellenger, H., Bodenschatz, E., Caesar, K.-A., Chewitt-Lucas, R., de Boer, G., Delanoë, J., Denby, L., Ewald, F., Fildier, B., Forde, M., George, G., Gross, S., Hagen, M., Hausold, A., Heywood, K. J., Hirsch, L., Jacob, M., Jansen, F., Kinne, S., Klocke, D., Kölling, T., Konow, H., Lothon, M., Mohr, W., Naumann, A. K., Nuijens, L., Olivier, L., Pincus, R., Pöhlker, M., Reverdin, G., Roberts, G., Schnitt, S., Schulz, H., Siebesma, A. P., Stephan, C. C., Sullivan, P., Touzé-Peiffer, L., Vial, J., Vogel, R., Zuidema, P., Alexander, N., Alves, L., Arixi, S., Asmath, H., Bagheri, G., Baier, K., Bailey, A., Baranowski, D., Baron, A., Barrau, S., Barrett, P. A., Batier, F., Behrendt, A., Bendinger, A., Beucher, F., Bigorre, S., Blades, E., Blossey, P., Bock, O., Böing, S., Bosser, P., Bourras, D., Bouruet-Aubertot, P., Bower, K., Branellec, P., Branger, H., Brennek, M., Brewer, A., Brilouet , P.-E., Brügmann, B., Buehler, S. A., Burke, E., Burton, R., Calmer, R., Canonici, J.-C., Carton, X., Cato Jr., G., Charles, J. A., Chazette, P., Chen, Y., Chilinski, M. T., Choularton, T., Chuang, P., Clarke, S., Coe, H., Cornet, C., Coutris, P., Couvreux, F., Crewell, S., Cronin, T., Cui, Z., Cuypers, Y., Daley, A., Damerell, G. M., Dauhut, T., Deneke, H., Desbios, J.-P., Dörner, S., Donner, S., Douet, V., Drushka, K., Dütsch, M., Ehrlich, A., Emanuel, K., Emmanouilidis, A., Etienne, J.-C., Etienne-Leblanc, S., Faure, G., Feingold, G., Ferrero, L., Fix, A., Flamant, C., Flatau, P. J., Foltz, G. R., Forster, L., Furtuna, I., Gadian, A., Galewsky, J., Gallagher, M., Gallimore, P., Gaston, C., Gentemann, C., Geyskens, N., Giez, A., Gollop, J., Gouirand, I., Gourbeyre, C., de Graaf, D., de Groot, G. E., Grosz, R., Güttler, J., Gutleben, M., Hall, K., Harris, G., Helfer, K. C., Henze, D., Herbert, C., Holanda, B., Ibanez-Landeta, A., Intrieri, J., Iyer, S., Julien, F., Kalesse, H., Kazil, J., Kellman, A., Kidane, A. T., Kirchner, U., Klingebiel, M., Körner, M., Kremper, L. A., Kretzschmar, J., Krüger, O., Kumala, W., Kurz, A., L'Hégaret, P., Labaste, M., Lachlan-Cope, T., Laing, A., Landschützer, P., Lang, T., Lange, D., Lange, I., Laplace, C., Lavik, G., Laxenaire, R., Le Bihan, C., Leandro, M., Lefevre, N., Lena, M., Lenschow, D., Li, Q., Lloyd, G., Los, S., Losi, N., Lovell, O., Luneau, C., Makuch, P., Malinowski, S., Manta, G., Marinou, E., Marsden, N., Masson, S., Maury, N., Mayer, B., Mayers-Als, M., Mazel, C., McGeary, W., McWilliams, J. C., Mech, M., Mehlmann, M., Meroni, A. N., Mieslinger, T., Minikin, A., Minnett, P., Möller, G., Morfa Avalos, Y., Muller, C., Musat, I., Napoli, A., Neuberger, A., Noisel, C., Noone, D., Nordsiek, F., Nowak, J. L., Oswald, L., Parker, D. J., Peck, C., Person, R., Philippi, M., Plueddemann, A., Pöhlker, C., Pörtge, V., Pöschl, U., Pologne, L., Posyniak, M., Prange, M., Quiñones Meléndez, E., Radtke, J., Ramage, K., Reimann, J., Renault, L., Reus, K., Reyes, A., Ribbe, J., Ringel, M., Ritschel, M., Rocha, C. B., Rochetin, N., Röttenbacher, J., Rollo, C., Royer, H., Sadoulet, P., Saffin, L., Sandiford, S., Sandu, I., Schäfer, M., Schemann, V., Schirmacher, I., Schlenczek, O., Schmidt, J., Schröder, M., Schwarzenboeck, A., Sealy, A., Senff, C. J., Serikov, I., Shohan, S., Siddle, E., Smirnov, A., Späth, F., Spooner, B., Stolla, M. K., Szkółka, W., de Szoeke, S. P., Tarot, S., Tetoni, E., Thompson, E., Thomson, J., Tomassini, L., Totems, J., Ubele, A. A., Villiger, L., von Arx, J., Wagner, T., Walther, A., Webber, B., Wendisch, M., Whitehall, S., Wiltshire, A., Wing, A. A., Wirth, M., Wiskandt, J., Wolf, K., Worbes, L., Wright, E., Wulfmeyer, V., Young, S., Zhang, C., Zhang, D., Ziemen, F., Zinner, T., and Zöger, M.: EUREC4A, Earth Syst. Sci. Data, 13, 4067–4119, https://doi.org/10.5194/essd-13-4067-2021, 2021. a, b
Stokes, G. M. and Schwartz, S. E.: The Atmospheric Radiation Measurement (ARM) Program: Programmatic Background and Design of the Cloud and Radiation Test Bed, B. Am. Meteorol. Soc., 75, 1201–1222, https://doi.org/10.1175/1520-0477(1994)075<1201:TARMPP>2.0.CO;2, 1994. a
Turner, D. D., Clough, S. A., Liljegren, J. C., Clothiaux, E. E., Cady-Pereira, K. E., and Gaustad, K. L.: Retrieving Liquid Wat0er Path and Precipitable Water Vapor From the Atmospheric Radiation Measurement (ARM) Microwave Radiometers, IEEE T. Geosci. Remote, 45, 3680–3690, https://doi.org/10.1109/TGRS.2007.903703, 2007a. a, b
Turner, D. D., Vogelmann, A. M., Austin, R. T., Barnard, J. C., Cady-Pereira, K., Chiu, J. C., Clough, S. A., Flynn, C., Khaiyer, M. M., Liljegren, J., Johnson, K., Lin, B., Long, C., Marshak, A., Matrosov, S. Y., McFarlane, S. A., Miller, M., Min, Q., Minimis, P., O'Hirok, W., Wang, Z., and Wiscombe, W.: Thin Liquid Water Clouds: Their Importance and Our Challenge, B. Am. Meteorol. Soc., 88, 177–190, https://doi.org/10.1175/BAMS-88-2-177, 2007b. a
Turner, D. D., Cadeddu, M. P., Löhnert, U., Crewell, S., and Vogelmann, A. M.: Modifications to the Water Vapor Continuum in the Microwave Suggested by Ground-Based 150-GHz Observations, IEEE T. Geosci. Remote, 47, 3326–3337, https://doi.org/10.1109/TGRS.2009.2022262, 2009. a
Ulaby, F. T.: Microwave radar and radiometric remote sensing, The University of Michigan Press, Ann Arbor, ISBN 978-0-472-11935-6, 2014. a
van Meijgaard, E. and Crewell, S.: Comparison of model predicted liquid water path with ground-based measurements during CLIWA-NET, Atmos. Res., 75, 201–226, https://doi.org/10.1016/j.atmosres.2004.12.006, 2005. a, b
Vial, J., Dufresne, J.-L., and Bony, S.: On the interpretation of inter-model spread in CMIP5 climate sensitivity estimates, Clim. Dynam., 41, 3339–3362, https://doi.org/10.1007/s00382-013-1725-9, 2013. a
Walbröl, A., Crewell, S., Engelmann, R., Orlandi, E., Griesche, H., Radenz, M., Hofer, J., Althausen, D., Maturilli, M., and Ebell, K.: Atmospheric temperature, water vapour and liquid water path from two microwave radiometers during MOSAiC, Scientific Data, 9, 534, https://doi.org/10.1038/s41597-022-01504-1, 2022. a, b, c, d, e
Weng, F., Zhao, L., Ferraro, R. R., Poe, G., Li, X., and Grody, N. C.: Advanced microwave sounding unit cloud and precipitation algorithms, Radio Sci., 38, 4, https://doi.org/10.1029/2002RS002679, 2003. a
Westwater, E. R.: The accuracy of water vapor and cloud liquid determination by dual-frequency ground-based microwave radiometry, Radio Sci., 13, 677–685, https://doi.org/10.1029/RS013i004p00677, 1978. a
Westwater, E. R., Han, Y., Shupe, M. D., and Matrosov, S. Y.: Analysis of integrated cloud liquid and precipitable water vapor retrievals from microwave radiometers during the Surface Heat Budget of the Arctic Ocean project, J. Geophys. Res.-Atmos., 106, 32019–32030, https://doi.org/10.1029/2000JD000055, 2001. a, b
Zelinka, M. D., Myers, T. A., McCoy, D. T., Po-Chedley, S., Caldwell, P. M., Ceppi, P., Klein, S. A., and Taylor, K. E.: Causes of Higher Climate Sensitivity in CMIP6 Models, Geophys. Res. Lett., 47, e2019GL085782, https://doi.org/10.1029/2019GL085782, 2020. a
- Abstract
- Introduction
- MWR network
- Retrievals
- Masking and data processing
- Integrated water vapor
- Liquid water path
- Thermodynamical profiles
- Code and data availability
- Conclusions
- Author contributions
- Competing interests
- Disclaimer
- Special issue statement
- Acknowledgements
- Financial support
- Review statement
- References