the Creative Commons Attribution 4.0 License.
the Creative Commons Attribution 4.0 License.
Very high resolution aerial image orthomosaics, point clouds, and elevation datasets of select permafrost landscapes in Alaska and northwestern Canada
Tabea Rettelbach
Ingmar Nitze
Inge Grünberg
Jennika Hammar
Simon Schäffler
Daniel Hein
Matthias Gessner
Tilman Bucher
Jörg Brauchle
Jörg Hartmann
Torsten Sachs
Julia Boike
Permafrost landscapes in the Arctic are highly vulnerable to warming, with rapid changes underway. High-resolution remote sensing, especially aerial datasets, offers valuable insights into current permafrost characteristics and thaw dynamics. Here, we present a new dataset of very high resolution orthomosaics, point clouds, and digital surface models that we acquired over permafrost landscapes in northwestern Canada and northern and northwestern Alaska for the purpose of better understanding the impacts of climate change on permafrost landscapes. The imagery was collected with the Modular Aerial Camera System (MACS) during aerial campaigns conducted by the Alfred Wegener Institute in the summers of 2018, 2019, and 2021. The MACS was specifically developed by the German Aerospace Center (DLR) for operation under challenging light conditions in polar environments. It features cameras in the optical and the near-infrared wavelengths with up to a 16 MP resolution. We processed the images to four-band (blue–green–red–near-infrared) orthomosaics and digital surface models with spatial resolutions of 7 to 20 cm as well as 3D point clouds with point densities of up to 41 points m−2. The dataset collection features 102 subprojects from 35 target regions (1.4–161.1 km2 in size). Project sizes range from 4.8 to 336 GB. In total, 3.17 TB were published. The horizontal precision of the datasets is in the range of 1–2 px and vertical precision is better than 0.10 m. The datasets are not radiometrically calibrated. Overall, these very high resolution images and point clouds provide significant opportunities for mapping permafrost landforms and generating detailed training datasets for machine learning, can serve as a baseline for change detection for thermokarst and thermo-erosion processes, and help with upscaling of field measurements to lower-resolution satellite observations. The dataset is available on the PANGAEA repository at https://doi.org/10.1594/PANGAEA.961577 (Rettelbach et al., 2024).
- Article
(14571 KB) - Full-text XML
- BibTeX
- EndNote
In a globally warming world, detailed monitoring of the regions affected by rapid climate change is one key to understanding the underlying ecosystem and landscape processes and quantifying their consequences for the environment (Bartsch et al., 2021). The cryosphere experiences some of the most profound impacts of climate warming, as it is especially vulnerable to increasing temperatures; moreover, its disappearance acts to further accelerate environmental change. It is currently estimated that the Arctic is warming 2–4 times as fast as the rest of the globe, a phenomenon largely driven by so-called Arctic amplification through the sea-ice–albedo feedback (Walsh, 2014; Jansen, 2020; Richter-Menge and Druckenmiller, 2020; AMAP, 2021; Yu et al., 2021; Rantanen et al., 2022). Permafrost is one of the most important components of the cryosphere. Any ground with temperatures <0 °C for a minimum of 2 consecutive years is considered permafrost; therefore, permafrost can cover the range of very ice-rich soils to non-porous bedrock. According to a recent study, permafrost is found in approximately 14×106 to 16×106 km2, or 15 %, of the exposed land surface area in the Northern Hemisphere (Obu, 2021). Atmospheric warming causes significant land surface warming and precipitation changes to these extensive landscapes, thereby resulting in enhanced permafrost thaw (Guo et al., 2020; Vincent et al., 2017; Jorgenson and Grosse, 2016; Grosse et al., 2016). Melt of ground ice in ice-rich permafrost significantly impacts landscape topography, geomorphology, pedology, hydrology, and vegetation structure and distribution. With these factors, the entire ecology of permafrost ecosystems is affected. In addition, thawing ground strongly affects the lives and livelihoods of the communities in permafrost regions: human infrastructure built on and into permafrost (like roads, houses, and pipelines) is increasingly at risk, maintenance costs are rising strongly, physical damage has led to loss of economic value, and the risk of exposure to environmental hazards has also increased (e.g., Langer et al., 2023; Hjort et al., 2022; Bartsch et al., 2021; Larsen et al., 2021; Miner et al., 2021). The complex interplay between these changing environmental factors and both gradual or abrupt permafrost thaw results in a broad range of ecological and economical impacts and consequences that manifest very differently across spatial scales. Accordingly, the response of permafrost landscapes in the face of climate change requires careful observation and monitoring, and remote sensing offers excellent tools and methods for this across large and remote regions. Remote sensing can deliver spatially continuous and comprehensive insights into land surface conditions across large areas affected by permafrost thaw throughout the Arctic (Jorgenson and Grosse, 2016). By definition, permafrost is a subsurface phenomenon, but the consequences of soil thaw, ground-ice melt, and surface subsidence and erosion result in characteristic surface processes and landforms that can be monitored from above. Thus, Earth observation imagery provides both a basis for spatially comprehensive permafrost landscape monitoring through remote-sensing image analysis and a database of observations that can be consulted for the purpose of validating in situ field measurements or predictions from modeling approaches. Permafrost phenomena that can be directly observed with remote sensing include thaw slumping (e.g., Runge et al., 2022; Bernhard et al., 2022; Lewkowicz and Way, 2019), coastal erosion (e.g., Wang et al., 2022; Jones et al., 2018; Irrgang et al., 2018), ice-wedge degradation (e.g., Frost et al., 2018; Rettelbach et al., 2022; Jorgenson et al., 2022), growing and draining thermokarst lakes (e.g., Nitze et al., 2020; Lara et al., 2021; Jones et al., 2020), ground subsidence (e.g., Zwieback and Meyer, 2021; De la Barreda-Bautista et al., 2022; Liu et al., 2014), and post-fire thermokarst dynamics (e.g., Jones et al., 2015; Rettelbach et al., 2021; Iwahana et al., 2016). Remote sensing also allows the monitoring of further ecological processes, like beaver-damming activities (e.g., Jones et al., 2021; Tape et al., 2022, 2018), and anthropogenic activities, such as road construction and maintenance (e.g., Raynolds et al., 2014; Walker et al., 2015; Kaiser et al., 2022), which affect permafrost directly or indirectly. Airborne remote sensing plays an essential role in bridging the gap between (a) hyperlocal, in situ field studies and close-range remote sensing with uncrewed aerial systems (UASs) or ground-based remote sensors and (b) satellite-based remote sensing covering very large spatial areas at lower spatial resolutions. Airborne sensors offer high operating flexibility and can cover significantly larger areas than UASs (Oldenborger et al., 2022; Boike and Yoshikawa, 2003), while also capturing great spatial detail. Recent aerial campaigns within the NASA ABoVE project focused on acquiring hyperspectral, synthetic-aperture radar (SAR), and laser altimetry data over permafrost regions in Alaska and northwestern Canada to observe wetlands, greenhouse gas (GHG) emissions, and active-layer dynamics (Miller et al., 2019). In combination with historical aerial imagery or laser-scanning datasets, modern optical airborne datasets have been used to quantify thaw subsidence following disturbances (Jones et al., 2013; Zhang et al., 2023), lake change (Jones et al., 2011), broad landscapes changes (Jorgenson et al., 2018), coastal erosion (Jones et al., 2020; Obu et al., 2017; Gibbs et al., 2019), ice-wedge degradation (Liljedahl et al., 2016; Rettelbach et al., 2021), retrogressive thaw slump development (Swanson and Nolan, 2018), and vegetation dynamics (Tape et al., 2006).
In this work, we report on a new airborne image dataset that we collected across extensive permafrost-affected areas and broad environmental gradients in Alaska and northwestern Canada in 2018, 2019, and 2021. The data include very high resolution (VHR) multispectral images in the visible (red–green–blue, RGB) and near-infrared (NIR) wavelengths captured with the advanced Modular Aerial Camera System (MACS), developed by the German Aerospace Center (DLR) and flown aboard the polar aircraft of the Alfred Wegener Institute (AWI), Helmholtz Centre for Polar and Marine Research. From the densely overlapping imagery, we used photogrammetry to derive VHR (up to 7 cm px−1) RGB and NIR orthoimage mosaics and dense point clouds as well as digital surface models (DSMs). Here, we describe these datasets of derived image products, which are archived and accessible on the PANGAEA scientific data repository (Rettelbach et al., 2024).
The VHR aerial image datasets published here were acquired during three AWI airborne campaigns conducted over permafrost regions in northwestern North America in the summers of 2018, 2019, and 2021. All surveys were flown with the AWI polar research aircraft Polar 5 or Polar 6 using the MACS. Aside from this aerial camera system, further environmental sensors acquired data during survey flights. We do not report on them in this publication, but some further information on their availability can be found in Sect. 6.
2.1 Study areas
The study regions in northwestern North America are characterized by extensive permafrost landscapes with sporadic–discontinuous–continuous permafrost extent gradients. In the north, tundra ecosystems are predominant, while the ecosystems farther south transition to shrub tundra and boreal forests. All study areas cover both coastal and more inland areas, and they feature Köppen–Geiger climates ranging from Dfc (cold, no dry season, and cold summer), to Dsc (cold, dry summer, and cold summer), to ET (polar and tundra) (Beck et al., 2018).
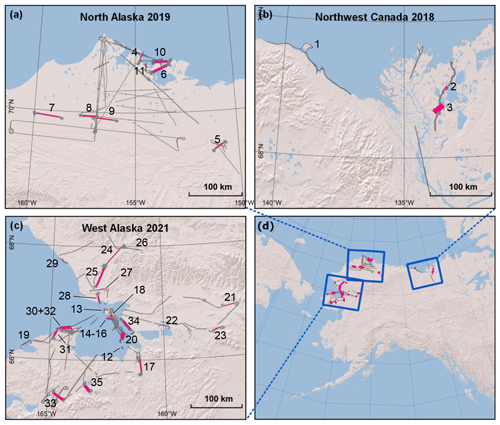
Figure 1Footprints of the acquired aerial imagery for the study regions of (a) northern Alaska, (b) northwestern Canada, and (c) northwestern Alaska. (d) Location of the three study regions in northwestern North America. Black areas show the footprints of all available imagery, pink blocks represent the footprints of the here published and presented datasets, and the labels correspond to the IDs in Table 2. Basemap: ESRI (2009).
2.1.1 Yukon and Northwest Territories, Canada, 2018
From 15 to 29 August 2018, we surveyed several transects in both the Yukon and the Northwest Territories, Canada, covering a total area of 746 km2 and ranging from the Mackenzie (Deh-Cho/Kuukpak) Delta in the east to Herschel Island (Qikiqtaruk) in the Canadian Beaufort Sea close to the Alaskan border in the west and the village of Fort McPherson (Teetł'it Zheh) in the south. The survey mainly included the corridor of the Inuvik–Tuktoyaktuk Highway (ITH) and the Trail Valley Creek (TVC) research watershed (Fig. 1b, d). ITH is a 137 km long gravel highway which was officially opened in 2017. TVC is located about 55 km northeast of Inuvik and has been in the focus for research on snow, permafrost, vegetation, and hydrology since 1991 (Marsh et al., 2010; Antonova et al., 2019; Wilcox et al., 2019; Grünberg et al., 2020). The sites are characterized by moderately ice-rich permafrost and are located within the continuous permafrost zone (Obu et al., 2019). Thermokarst lakes and degrading ice-wedge landscapes are abundant throughout the Mackenzie Delta, further inland, and also especially pronounced along the ITH. Along the coast of Herschel Island and the Canadian Beaufort Sea, permafrost coastal erosion is an important process (Lantuit and Pollard, 2008), and some coastal segments are affected by strong retrogressive thaw slump activity (Lantuit and Pollard, 2005). The coastal landscapes and hinterlands feature terrain rich in lakes and drained lake basins as well as hummocky and rolling terrain with predominantly ground moraines (fine-grained and stony tills) with some interspersed alluvial, glaciofluvial, and lacustrine deposits (Duk-Rodkin and Lemmen, 2000). The highway crosses the tundra–taiga ecotone, and the vegetation changes from dwarf-shrub tundra in the north to open-canopy spruce forests in the south (Timoney et al., 1992). TVC is located at the northern edge of the treeline zone and is characterized by a mix of dwarf shrubs and herbaceous tundra, upright shrub tundra, and open spruce woodlands. The ITH corridor is characterized by a significant climatic gradient, with coastal conditions drier and colder than the inland region (Burn and Kokelj, 2009). The mean annual air temperatures for 1990–2020 were −7.1 and −8.9 °C at Inuvik and Tuktoyaktuk, respectively (Government of Canada, 2022). In the weeks prior to the image acquisitions, no precipitation was recorded at the Inuvik (Mike Zubko) or Aklavik Airport stations. For the later flights at the end of August (i.e., ITH on 29 August 2018), foliage had already transitioned towards fall colors, which is visible in the imagery.
2.1.2 Alaska North Slope, USA, 2019
The 2019 airborne campaign with Polar 6 focused on the Alaska North Slope (Siḷaliñiq), USA. Main targets in this study region were coastal segments between Utqiaġvik (Barrow) and McLeod Point; the outer Arctic Coastal Plain north of Teshekpuk Lake; the Ikpikpuk Delta; historic fire scars between the inner Arctic Coastal Plain, the Ikpikpuk Sand Sea, and the foothills north of the Brooks Range; and the Anaktuvuk (Anaqtuuvak) River fire scar east of Umiat (Fig. 1a, d). This campaign was conducted from 13 to 31 July in 2019 and covered 1766 km2 in total. This region is located entirely within the zone of continuous permafrost extent (> 90 % permafrost coverage), and mean annual ground temperatures range from −12 to −5 °C (Obu et al., 2019; Jorgenson, 2008). Thermokarst lakes and drained thermokarst lake basins are the most prevalent permafrost features in the northern lowland landscapes of the studied region, but many other types of thaw landforms are found as well and indicate the widespread presence of ice-rich ground (Farquharson et al., 2016). Along the Alaskan Beaufort Sea coastline, strong permafrost coastal erosion is occurring in many segments with the highest rates reported from Drew Point (Jones et al., 2020). Further south, terrain becomes more sloping towards the Brooks Range foothills and barely any lakes are present. The vegetation is characterized by a mossy tundra with sedges and dwarf shrubs in the north, with shrub sizes increasing along the southward gradient (Raynolds et al., 2019). Mean annual air temperatures in Utqiaġvik were −10.1 °C with a mean annual precipitation of 137 mm (1991–2020) (NOAA, 2023), which is highly influenced by its coastal location. Precipitation occurs predominantly during the summer and fall months. Cloud cover and fog are persistent in coastal areas, creating challenging conditions for (imaging) flights. In the 4 weeks prior to the flight campaign, average precipitation (40 mm) was recorded (NOAA, 2023). During the campaign, precipitation increased slightly and records from Utqiaġvik measured a further 34 mm of rain during these acquisition dates. By the time the data were collected, snowmelt for the 2019 season had already concluded. During the observation period, weather was variable from cloud-free to overcast and rainy. On several sunny days across large parts of the target area (North Slope), acquisition flights could not be flown, as fog at the aircraft’s base in Utqiaġvik hindered takeoff, missing optimal acquisition conditions.
2.1.3 Northwestern Alaska, USA, 2021
In 2021, the aerial campaign, based out of Kotzebue in northwestern Alaska, was conducted between 25 June and 10 July. This campaign's study area spanned coastal segments along the northern and central Baldwin Peninsula; the outer areas of the Noatak and the Kobuk (Kuuvak) deltas; the lake- and basin-rich Cape Espenberg lowlands; the Nome–Taylor Highway (Kougarok Road) and the Imuruk volcanic field on the central Seward Peninsula; historic fire scars near Buckland and in the lower Noatak Valley; the Selawik Thaw Slump; various known beaver-affected sites in the region; and the eight villages of Buckland (Kaniq), Deering (Ipnatchiaq), Kivalina (Kivalliñiq), Kobuk (Laugviik), Kotzebue (Qikiqtaġruk), Selawik (Akuliġaq), Shishmaref (Qikiqtaq), and Shungnak (Nuurviuraq) (Fig. 1c, d). The majority of these areas are located in a region where continuous permafrost transitions into the discontinuous permafrost zone (50 %–90 % permafrost coverage), with mean annual ground temperatures ranging from 0 to −4 °C (Jorgenson, 2008; Obu et al., 2019). Some areas on the northern Seward Peninsula and in the Noatak Valley are already part of the continuous permafrost zone. The region is characterized by a wide range of permafrost landscape dynamics. Most of the target sites have been affected by thermokarst lake expansion and drainage events in the recent past (Jones et al., 2011; Nitze et al., 2020) or lake (re)formation by beaver activity (Tape et al., 2018, 2022; Jones et al., 2021), the coasts have been partially affected by retrogressive thaw slumps and coastal erosion (Farquharson et al., 2018), and widespread subsidence and thermokarst activity can be found throughout the surveyed areas. On the northern Seward Peninsula, the landscape is dominated by wetland tundra and thermokarst lakes, with sparse vegetation. The central Seward Peninsula is, however, characterized by low to tall shrubs in between otherwise mainly moist tundra landscapes (Raynolds et al., 2002). The surveyed areas at the western foothills of the Brooks Range show tundra, mainly dominated by graminoids and dwarf and tall shrubs (Ueyama et al., 2013). In the surveyed areas in the east, we find a mosaic of varying local conditions, from wetland to boreal forests. Mean annual air temperatures range from −7.6 to −1.2 °C, and average annual precipitation at the Kotzebue weather station is around 289 mm. While the average month of June is rather dry in Kotzebue, with mean monthly precipitation of 15 mm, July ushers in the wet season, with mean monthly values of 41 mm (1991–2020) (NOAA, 2023). However, in 2021, the year that we surveyed, the area experienced a record-breaking 137.9 mm of rainfall in July alone (NOAA, 2023). This potentially affected the water levels in comparison to normal years and, thus, the overall hydrological state depicted in the acquired datasets of that year. Nevertheless, imaging flights were exclusively conducted under precipitation-free conditions.
2.2 Multispectral sensor
For all three campaigns, we used a custom-built aerial camera system (configuration: MACS-Polar18) developed by the DLR Institute of Optical Sensor Systems. It was specifically adapted to work in very low ambient temperatures. Multiple integration times per scene can be acquired to avoid under- or overexposed pixels in the challenging Arctic light conditions, where very dark (water and dark bare soil) and bright (snow and ice) surfaces often coexist in target areas (Brauchle et al., 2015).
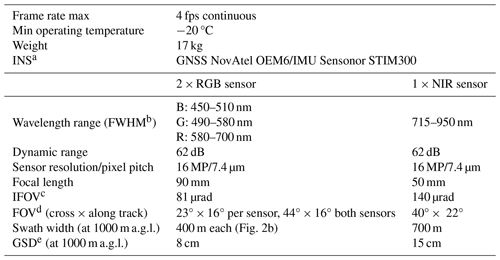
The camera consists of a computing unit and a sensor unit (sensor: SVS-Vistek HR16070CFLGEC; Fig. 2a). The computing unit comprises subassemblies including an L1-, L2-, and L-band global navigation satellite system (GNSS) receiver and the main computer. The sensor unit contains an inertial measurement unit (IMU) and three 16 MP industrial cameras: one nadir-looking NIR camera and two visible RGB cameras with overlapping right- and left-looking (± 8.5°) view directions (Fig. 2b). The maximum frame rate is 4 fps (where fps denotes frames per second). Thus, when acquiring images at two different exposure times, each is repeated with a rate of 2 fps. All sensors are electrically triggered to start the image exposure at the exact same time. At the end of integration, the sensor delivers an electric pulse to the GNSS receiver, generating a message including information on the time, position and attitude of the acquisition.1 This georeference is written into the corresponding raw image file before storage and can later easily be substituted by a post-processed solution. Relevant distances between lever arms like the IMU-to-GNSS antenna distance and the IMU-to-sensor distance are measured with an uncertainty of less than 10 mm. These offsets are stored on the GNSS receiver and used to calculate the correct sensor position. Technical specifications are summarized in Table 1. More information on the camera system and its general concept can be found in Lehmann et al. (2011).
The sensors of the MACS camera system underwent in-flight calibration. During the campaign in 2021, topology points of an urban scene in Kotzebue were measured with a double-frequency GNSS receiver (Leica VIVA GS14). In a GNSS post-processing with open International GNSS Service (IGS) data (https://igs.org/, last access: 12 December 2024), the points were calculated with sub-centimeter accuracy. Together with MACS aerial images from the same scene, we applied a bundle adjustment and derived the interior-orientation camera parameters. These camera parameters were then used for further image processing.
The MACS-Polar18 was operated aboard the Polar 5 (2018) and the Polar 6 (2019 and 2021) polar research aircraft, which represent AWI's own research fleet (Alfred Wegener Institute, 2024). The aircraft are Douglas DC-3 planes refitted to Basler BT-67 planes for harsh polar environments. The sensor unit is installed in a belly port of the planes (Fig. 2c, d).
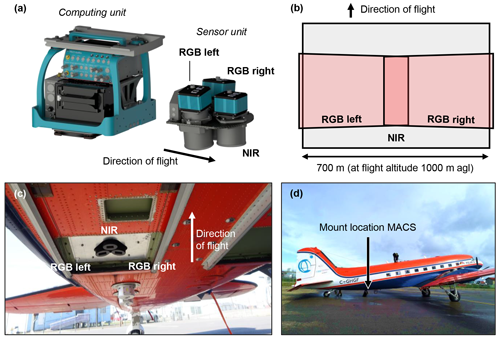
Figure 2(a) MACS control unit and sensor heads as installed in the belly ports of the aircraft. (b) Ground footprints of the three cameras at a flight altitude of 1000 m a.g.l. (meters above ground level), showing the overlapping ground areas. Panels (c) and (d) show the mount location of the camera within the Basler BT-67 aircraft.
2.3 Survey design
Our surveys were guided by multiple research questions associated with permafrost landscape and ecosystem change. Accordingly, our observation targets included permafrost landscapes affected by thaw subsidence, eroding coasts, various disturbances to hydrological and vegetation characteristics, and settlements and infrastructure threatened by damage from permafrost thaw. We prioritized sites according to (a) areas where ground sampling had been performed during previous field campaigns to allow us to link local-scale observations to regional-scale airborne data; (b) footprints of previous aerial campaigns with available published datasets (i.e., Marsh et al., 2010; Miller et al., 2019; Manley et al., 2007) to provide data for change detection analyses and time-series observations; and (c) areas with infrastructure to assess permafrost-thaw-associated vulnerabilities (e.g., Van der Sluijs et al., 2018) and contribute to monitoring and mitigation efforts of other institutions or local authorities. For the surveys, we flew either elaborate grids or single-track transects (sometimes referred to as “strips”) for different areas of interest depending on the specific observation goals for the respective sites. The size and shape of a target area also had an influence on the survey design. The flight altitude (and, correlated with this, the highest possible ground sampling distance – GSD) was similarly chosen with the prospective research question in mind. Given the sensor resolution of 16 MP and the fact that the majority of flights were conducted at altitudes of between 500 m and 1500 m a.g.l. (meters above ground level), the GSDs of the acquired imagery ranged between 4.4 and 12.5 cm px−1 for the RGB sensors and between 7.7 and 21.5 cm px−1 for the NIR sensor. For every flight, the flying altitude was set above sea level – determined by adding an offset of 500/1000/1500 m to the ground elevation (depending on the desired resulting GSD of output images) – and remained constant throughout a grid. As most targets show only minimal elevation changes throughout their area, the constant altitude above sea level corresponded to a constant altitude above ground level. For targets that did show differences in elevation, we added a respective offset of 500 m/1000 m/1500 m to the higher elevations. With this approach, we made sure to avoid holes in the flown grid (at the cost of a lower spatial resolution for the lower-lying areas of the target).
For our aerial camera, all parameters are fixed except for the exposure time, which typically ranges from 0.2 to 1.5 ms (1 ms corresponds to 1/1000 s). Given a motion rate of 6.7 cm ms−1 (aircraft speed was roughly 130 kn), the resulting motion-induced blur at, e.g., 1.5 ms exposure time is approximately 1.2 px for an 8 cm GSD scenario.
The along-track overlap between single image captures is 80 % for all datasets. For targets flown in grid mode, the across-track overlap is 45 % for datasets from 2018 and 2019. For the campaign in 2021, we increased the across-track overlap to 60 %. Only one grid (TrailValleyCreek) from 2018 was flown with a side-overlap of only 28 %. The main aim of this flight grid was the acquisition of lidar data; thus, flight-line planning was optimized towards airborne laser-scanning (ALS) requirements. This led to a significantly lower overlap for the aerial images, which were only a byproduct during this flight. For the photogrammetric processing, the along-track overlaps of 80 % and 45 %–60 % lead to every ground location being captured by 10 to 15 images, and thus from 10 to 15 slightly different viewing angles. These numbers decline towards the edges of grids and can further vary with deviant angles of roll, pitch, and yaw of the aircraft induced by internal (i.e., pilot) or external (i.e., wind and drift) influences.
While we only publish datasets generated from targets that we flew in grid patterns which were suitable for photogrammetric processing here (labeled in yellow in Fig. 1a, b, c), we also captured additional imagery on single-track transect flights (labeled in black in Fig. 1; master tracks available via Hartmann, 2018, and Grosse et al., 2019, 2021). We acquired images for all transit flights to, from, and between planned target grids. The camera was only turned off during takeoff and landing, when low-level clouds occurred locally, over larger water bodies or sensitive infrastructure, during sharp turns, or when space on the hard drives for data storage was running low. Tests of processing strip-flown data resulted in mosaics with stronger bowling effects and distortions, especially at the borders of the images, that could not automatically be corrected due to a lack of images from neighboring tracks. Nevertheless, it is possible to manually correct for such effects in the post-processing stage. However, for the large number of our collected data, this manual correction for all datasets was not feasible at this stage. Nonetheless, the raw, individual images from these additional strip flight tracks (see black areas in Fig. 1), not covered by the processed data described in this publication, are available upon request until further processing and public data archiving has been conducted.
For detailed flight planning on a daily basis, we needed to consider the prevailing environmental conditions: prior to any acquisition flight, we set the camera's shutter timing according to the prevailing illumination. Heavy cloud cover with homogeneous diffuse light, for example, required longer sensor exposure times than clear skies and direct sunlight. During some of the flights, we chose different shutter timings for the NIR and the RGB sensors (e.g., 0.2 and 0.4 ms, respectively). The timing for the slightly more sensitive NIR sensor was set a little lower to avoid overexposure in its data. With respect to targets for which we expected to see both very bright and very dark ground features (e.g., snow and water bodies), we also acquired images at two different exposure times (e.g., 0.4 and 1.0 ms), to ensure that we always had at least one image that was not over- or underexposed. This was also done when we expected shifts in illumination throughout the survey time. Precipitation of any kind or low-lying clouds entirely prohibited us from acquiring useful data.
We processed all data based on the workflow shown in Fig. 3. Multiple software packages were used in the workflow, but most data handling for pre- and post-processing was implemented automatically via Python scripts of the macs_processing Python code (Nitze and Rettelbach, 2024) (01_SetupData.py and 02_Postprocessing.py; see Sect. 7). Software, such as the DLR MACS Image Pre-Processing tool (MIPPS) and WhiteboxTools, is also operated via Python. The main structure-from-motion (SfM) processing is handled with the graphical user interface (GUI)-based Pix4Dmapper (version 4.6.4).2 The following sections describe the processing substeps in more detail.
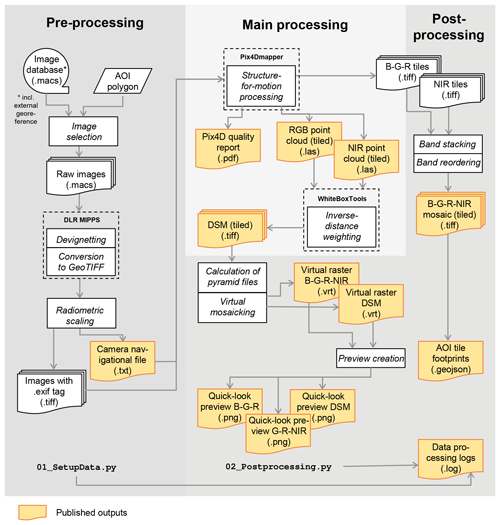
Figure 3Workflow diagram of the processing steps to generate the photogrammetric orthomosaics, point clouds, and digital surface models from the raw images. The diagram also provides an overview of additional byproducts published with this paper.
3.1 Pre-processing of raw images
Upon acquisition, the raw Bayer-pattern images (Bayer, 1976) are stored in the DLR proprietary macs format. These files contain information on the following: the acquisition time (in coordinated universal time – UTC); the image’s geospatial properties, including the coordinates of the image center and the altitude of flight above WGS84 ellipsoid (measured by the onboard GNSS receiver); the attitude of the camera at capture time with values for roll, pitch, and yaw (measured by the IMU); and information on which sensor captured the respective image. In this format, the files can be viewed in MacsViewer software and initially processed within the Mosaica application, both available within the MACS-Box, a Windows-based software package for MACS flight planning, raw data view, data pre-processing, and data export developed by DLR (DLR, 2019a). To create the desired mosaics with Pix4Dmapper and to share the data in a more commonly used format, we applied pre-processing and cleaning operations and exported these files to georeferenced tagged image file format (GeoTIFF, tiff format). The pre-processing is done using MIPPS (another tool within the MACS-Box). Cleaning and pre-processing steps are described in the following.
3.1.1 Devignetting and file format conversion
The acquired raw images are affected by a vignetting effect, which is characterized by a decrease in illumination from the center towards the edges and corners of each image. To overcome this systematic effect, we applied a devignetting algorithm (DLR, 2019b). It requires the camera’s dark signal nonuniformity (DSNU) parameters as input and corrects the brightness to create more homogeneous lighting. The given offset, also known as bias, varies with the exposure time. The sensors' DSNU parameters were calibrated beforehand in a laboratory setting by acquiring images with mounted lens caps to avoid any external illumination. Figure 4 shows an example of the difference in an image before (Fig. 4a) and after devignetting (Fig. 4b). Furthermore, we transformed each image file from the proprietary macs image format to a 16 b tiff format without projection. For this, we decompressed the original images and applied a demosaicking algorithm from a one-channel Bayer pattern to a three-channel RGB pattern, resulting in an image size of 30 MB (NIR) and 90 MB (RGB). Metadata on the camera's position and attitude were stored in an external text file (nav file) and formatted to match the requirements for processing with Pix4Dmapper. Both the devignetting and the format conversion were carried out with MIPPS; the nav file was generated with a custom Python script. The camera definition file for devignetting and the MIPPS configuration file are available via GitHub (at https://github.com/awi-response/macs_processing/blob/main/pix4D_processing_templates/pix4d_CameraDef_MACS_Polar18.xml (last access: 23 October 2024) and https://github.com/awi-response/macs_processing/tree/main/mipps_scripts (last access: 23 October 2024), respectively; see Sect. 6). The nav files are specific to each project and are thus distributed via the respective PANGAEA dataset.
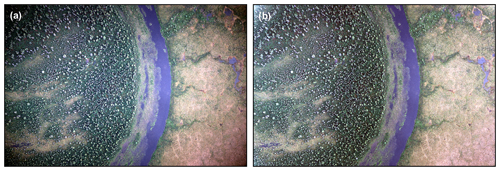
Figure 4(a) Original image shows the intensity of the vignette towards the borders of the image. (b) Same image after devignetting with the MIPPS pre-processing script. The contrast of light intensities between the image center and the image borders is decreased, thus providing a more homogenous image as input for mosaicking. The image location is an oxbow lake from Selawik River at 66.4662° N, 157.8018° W. Data were collected on 1 July 2021.
3.1.2 Radiometric scaling for matching RGB and NIR bands
In order to combine all four bands of the blue, green, red, and near-infrared wavelengths in the output mosaics, the images from both the RGB and NIR cameras need to be combined. For radiometric matching between the RGB and the NIR acquisitions, we applied a linear scaling factor to the RGB data. We determined the scaling factor from the difference in shutter timing between the two sensors. For example, if the shutter timing for the NIR sensor and the RGB sensor was set to 0.2 ms and 0.4 ms during the flight, respectively, the post-processing scaling factor was 0.5. Subsequently, we scaled the data values between 0 and 65 535 to exploit the entire 16 b information range. This step results in more homogenous output among the three campaigns and the many target sites that were flown under varying illumination conditions and with slightly different initial camera parameter settings. It also simplified the debugging and process control.
3.1.3 File preparation
To simplify the process of mosaicking the images with Pix4Dmapper in a later step (see Sect. 3.2), we added information on the acquiring sensor type to each image, which allowed Pix4DMapper to automatically assign the correct camera definition. This was done via exif tags that contained the parameter “right”, “left”, or “center” for the right RGB sensor, left RGB sensor, and NIR sensor, respectively.
3.2 Structure-from-motion orthomosaic and point cloud generation
We processed the individual georeferenced images with the Pix4Dmapper photogrammetry software of the Pix4D imaging tool suite. All processing was done on a computer with an AMD EPYC 7702P 64-core processor (operating at 2 Hz and with 512 GB of available RAM) running Microsoft Windows 10. Computation was partly run on two NVIDIA A40 GPUs. For all target datasets, we created B–G–R–NIR orthomosaics exported in GeoTIFF format and dense points clouds in laser (las) format for both the RGB sensors and the NIR sensor. Orthorectification of the image mosaic is automatically carried out in Pix4Dmapper with the internally calculated elevation information (Pix4D, 2021). We later processed the point clouds to DSMs (see Sect. 3.3). For large target areas exceeding 10 000 images, we created subprojects, so that Pix4Dmapper and the processing hardware could manage computation. Geolocation information for each individual image, available as latitude and longitude coordinates for the image center point, the flight altitude (WGS84), and camera angles (Omega, Phi, Kappa), were provided in a separate nav file in a Pix4D-readable format. For the photogrammetric orthomosaic generation, the software used this accurate geolocation information to identify neighboring images for tie-point matching and georeferencing. Within Pix4Dmapper, we specified the expected positional accuracy of the images to be 1 m. The software largely accounts for exposure mismatches through a global offset and individual gain values per image per sensor type. With this global balancing, it can correct or normalize brightness levels in images. Regarding flights for which we acquired images at multiple different exposure timings (e.g., 0.4 and 1.0 ms; see Sect. 2.3), we input both image sets into Pix4Dmapper and let the software select the adequate image information for processing.
During the photogrammetric calculation of the 3D point cloud, erroneous points can arise from factors such as noise in the original imagery. To ensure that these errors were not propagated into any subsequently created raster DSM, we filtered such outlying points (outliers in the z dimension) by correcting their altitude with the median of their neighboring points (Pix4D, 2021). Depending on the flight altitude of the aircraft and, thus, the maximum spatial resolution of the imagery, we processed the orthomosaics at 7 cm (ca. 500 m a.g.l.), 10 cm (ca. 1000 m a.g.l.), or 20 cm (ca. 1500 m a.g.l.) GSD. For some datasets, slightly higher GSDs could be achieved; however, we decided to rather provide orthomosaics with homogeneous properties. The average point cloud densities range from 0.78 to 41.97 px m−2 in the RGB and 1.15 and 12.91 px m−2 in the NIR point clouds, depending on flight parameters. All steps were performed within Pix4Dmapper. For reproducing the analysis, we provide the Pix4Dmapper processing templates for each target GSD; they can be accessed via GitHub (https://github.com/awi-response/macs_processing/tree/main/pix4D_processing_templates, last access: 23 October 2024; see Sect. 6).
3.3 Digital surface model calculation
To create a DSM from the processed RGB and NIR point clouds, we used WhiteboxTools (v.2.2.0; Lindsay et al., 2019) via the WhiteboxTools Python Frontend. DSMs can be generated from the RGB-only point cloud, from the NIR-only point cloud, or by combining both. We conducted a test of the three approaches and found that, in most cases, using both the RGB and the NIR point cloud yielded the best results. The majority of issues arose from pixels that were over- or undersaturated, which made the matching more difficult and, thus, resulted in errors in the DSMs in those areas. A more detailed analysis can be found in Appendix A. Based on this finding, for each target area, we first merged all of the RGB and NIR point cloud tiles output by Pix4Dmapper to one point cloud. We then used inverse distance weighting (IDW) to calculate a continuous surface from the merged point cloud. From this initial surface model, we filled no-data gaps smaller than , with r corresponding to the GSD of the resulting dataset. This number is large enough to fill small water surfaces, such as thermokarst trough ponds (and thus avoid DSMs of polygonal terrain speckled by no-data gaps) but small enough that we do not need to make guesses for larger lakes. Subsequently, we applied surface smoothing in case some erroneous points potentially causing artifacts were missed (Lindsay et al., 2019). We then conducted a visual quality check of the final product: if any issues were visible (e.g., striping, bowling, or imprecise edges), we manually inspected the merged point cloud, determined from which individual point cloud (RGB or NIR) the error originated, and finally reprocessed the DSM from the higher-quality point cloud only.
3.4 Post-processing
3.4.1 Tiling
To be able to photogrammetrically process the large number of images (in total 102 projects) on our end and also provide datasets in sizes that can be handled by standard computing infrastructure and a wider range of post-processing software on the user side, we tiled the orthomosaics, point clouds, and DSMs. We first split the mosaicked data based on a grid with 5000 px × 5000 px tiles using the automatically created tile grid by Pix4Dmapper. The grid position is determined based on the northwestern corner of an orthomosaic, with tile 1_1 covering the northwesternmost square of the target area. The first digit represents the column number and the second digit represents the row number. As no target dataset is exactly rectangular in shape, some tiles at the borders may also have non-rectangular shapes (see, e.g., tile 1_1 in Fig. 5). Due to the irregular shapes of some datasets, tile numbers are omitted if their column–row combination is not covered by data (i.e., tile 1_3 in the example dataset in Fig. 5). We provide GeoJSON (geojson) files of the tiling pattern alongside our mosaics. The point clouds, which were initially tiled to another pattern by the software, were later retiled to match the tiling of the raster datasets. This operation was conducted with the las2las function of LAStools.
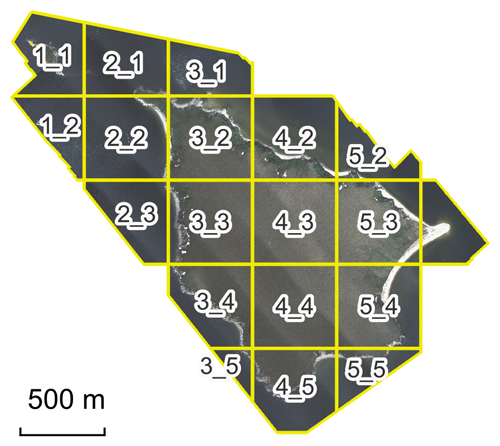
Figure 5Tiling and tile naming scheme for processed orthomosaics, point clouds, and digital surface models displayed on the “WA_ChamissoIsland_20210625_10cm_01” dataset. Regular tiles measure 5000 px × 5000 px, with tiles at the border of the dataset forming an exception. Numbering follows a column–row pattern i_j, with 1_1 being in the northern and westernmost corner. i increases eastward, while j increases southward.
3.4.2 Image stacking
For each orthoimage tile, Pix4Dmapper generated two separate orthomosaics: a single-band NIR raster and an RGB raster with three bands. Both outputs have the same extent and GSD, allowing us to stack them to a single four-band raster with exactly superimposing pixels. Following band stacking, we reordered the bands so that the final output is ordered radiometrically: blue–green–red–near-infrared (B–G–R–NIR) following the typical band order of optical remote-sensing datasets.
Here, we publish three main datasets (1–3) and multiple further, supporting files (4a–g) for 102 areas of interest (AOIs) of varying sizes. For each AOI, the following files are available:
-
multispectral orthophoto mosaic with the blue, green, red, and near-infrared bands (as tiles);
-
dense point clouds from both the NIR and the RGB sensors;
-
digital surface model of the processed point cloud (as tiles);
-
additional data.
The additional data (point 4 above) include the following:
- a.
cloud-optimized GeoTIFFs (COGs, of the entire AOI)
- i.
for the orthophoto mosaics,
- ii.
for the DSMs, and
- iii.
for multidirectional hillshades;
- i.
- b.
virtual mosaic files
- i.
for the orthophoto tiles and
- ii.
for the digital surface model tiles;
- i.
- c.
quick-look preview files (of the entire AOI)
- i.
for an optical orthophoto mosaic,
- ii.
for a color-infrared orthophoto mosaic, and
- iii.
for a digital surface model;
- i.
- d.
a GeoJSON file of the tile footprints valid for the orthophoto mosaic, dense point cloud, and digital surface model;
- e.
an automatically generated Pix4Dmapper orthomosaicking quality report;
- f.
a navigational text file (nav file) with position and attitude camera information for each individual image used for the mosaics;
- g.
a log file of the steps performed during the automated data processing.
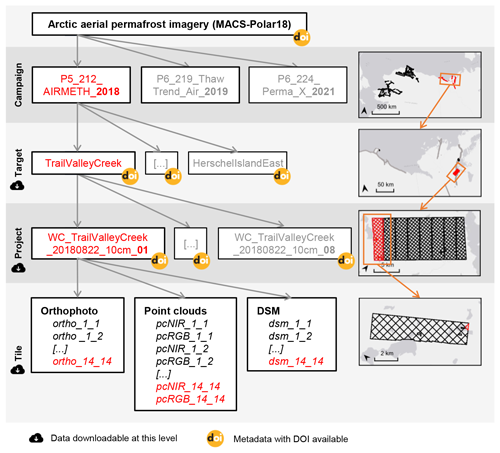
Figure 6Hierarchical structure of the published datasets. This publication includes data from three aerial campaigns. Each campaign covered multiple targets of interest. Due to processing/computational limitations, we split large target areas into multiple processing projects. For easier data handling, orthomosaics, point clouds, and DSMs from each project are tiled into 5000 px × 5000 px tiles.
Additionally, we provide two superordinate GeoPackage (gpkg) files of data footprints. First, aois.gpkg combines the footprints of all published datasets (yellow area in Fig. 1); second, image_footprints.gpkg shows the footprints of all images taken during the three described campaigns (black area in Fig. 1; data are available via PANGAEA; see Sect. 6). The latter also includes the areas that were covered by single-swath transects and not flown in grid mode (e.g., during transits between targets) and, therefore, were not processed photogrammetrically and not published alongside this paper. However, images of these additional areas will become available in future versions. The campaign-level metadata are available per the project dataset from PANGAEA. They are compatible with the Open Archives Initiative Protocol for Metadata Harvesting (OAI-PMH) and can, thus, be harvested in a variety of standardized formats (DC, ISO 19139, dif, DataCite, internal PANGAEA xml schema) using automated tools (PANGAEA, 2023). Table 2 shows the list of all target areas with additional information on the day of acquisition, the area covered, the GSD of orthomosaics, and the average point cloud densities.
Table 2Overview of all published target areas with information on acquisition parameters, dataset coverage, and resolution. An extended version can be found in Table A1 in the Appendix.
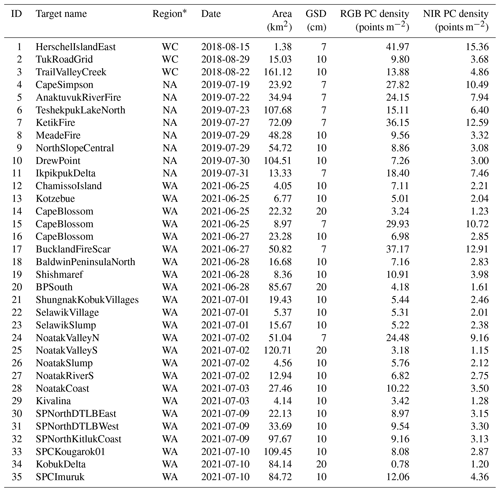
* Region abbreviations are as follows: WC – northwestern Canada; NA – northern Alaska; WA – northwestern Alaska
4.1 Multispectral orthophoto mosaics and digital surface models
The resulting orthophoto mosaic for each target area is available in Cloud Optimized GeoTIFF (cog) format as a four-band image (blue–green–red–near-infrared) (Rettelbach et al., 2024) and tiled into individual 5000 px × 5000 px files. DSMs are tiled to exactly equivalent footprints. Depending on the flight altitude of the aircraft during the image acquisition, we achieved GSDs of up to 4.4 cm for the RGB sensors and 7.7 cm for the NIR sensor. As each dataset includes images from both sensor types, we have decided to select the approximate GSD of the NIR sensor, the lower-resolution of the two, as the common final product pixel size. The vast majority of image surveys were usually conducted at one of three different main flight altitudes (see also Sect. 2.3). Some selected targets (e.g., CapeBlossom in northwestern Alaska in 2021) were covered twice or three times at different altitudes for comparative resolution tests. Thus, we have selected three different GSDs for the final mosaicked products: for flights conducted at ca. 500 m a.g.l., mosaics were processed at 7 cm px−1; flights at ca. 1000 m a.g.l. were processed at 10 cm px−1; and flights at altitudes ca. 1500 m a.g.l. resulted in mosaics of 20 cm px−1 GSD. All spatial datasets are projected to the UTM WGS84 coordinate reference system (CRS). The UTM zones range from UTM 3N (Seward Peninsula, northwestern Alaska) to 8N (Tuktoyaktuk, Northwest Canada). The mosaics were processed based on the geopositioning information recorded by the GNSS receiver and the IMU of the camera system itself. Their real-time positional errors are in the range of 1 m vertically and 0.6 m horizontally, with 0.02° uncertainty for roll and pitch and 0.1° for heading. For the resulting datasets, this translates to ca. 0.8 m positional error in the horizontal plane and up to 2 m along the z axis. Figures 7, 8, and 9 show example orthomosaics and DSMs of the published datasets at the three different target GSDs.
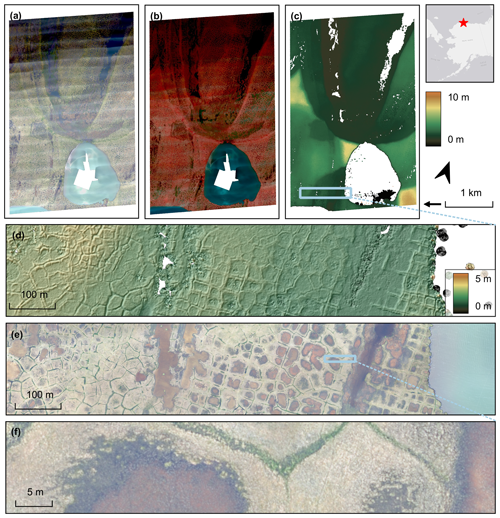
Figure 7AOI TeshekpukLakeNorth subproject 09 captured on 23 July 2019 and processed to datasets with a 7 cm GSD displayed as (a) an optical orthoimage in the blue, green, and red bands; (b) a color-infrared image in the green, red, and near-infrared bands; and (c) a DSM. Panel (d) shows a zoomed-in section of the DSM of high- and low-centered polygons draped with a hillshade layer. Panel (e) shows the same footprint as panel (d) but for the optical orthoimage. Panel (f) also shows the orthomosaic zoomed in further to showcase the level of detail visible in these high-resolution datasets. Basemap in overview panel: Esri, TomTom, Garmin, FAO, NOAA, USGS, © OpenStreetMap contributors, and the GIS User Community (2011).
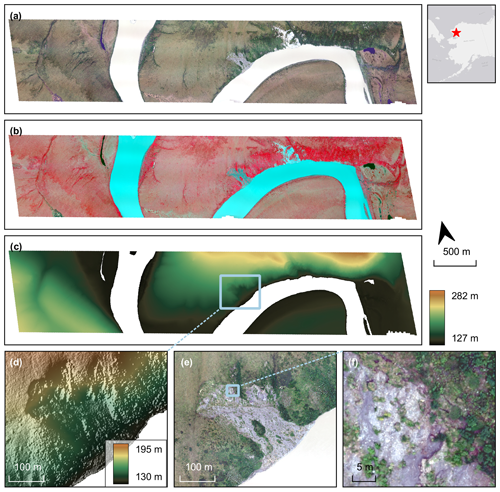
Figure 8AOI NoatakSlump captured on 2 July 2021 and processed to datasets with a 10 cm GSD displayed as (a) an optical orthoimage in the blue, green, and red bands; (b) a color-infrared image in the green, red, and near-infrared bands; and (c) a DSM. Panel (d) shows a zoomed-in section of the DSM around the Noatak Slump draped with a hillshade layer. Panel (e) shows the same footprint as panel (d) but for the optical orthoimage. Panel (f) also shows the orthomosaic zoomed in further to showcase the level of detail visible in these high-resolution datasets. Basemap in overview panel: Esri, TomTom, Garmin, FAO, NOAA, USGS, © OpenStreetMap contributors, and the GIS User Community (2011).
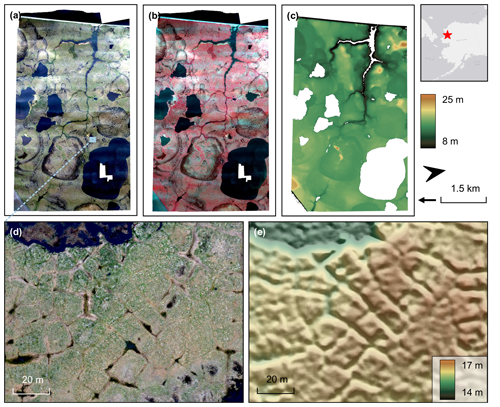
Figure 9AOI BPSouth subproject 03 captured on 28 June 2021 and processed to datasets with a 20 cm GSD displayed as (a) an optical orthoimage in the blue, green, and red bands; (b) a color-infrared image in the green, red, and near-infrared bands; and (c) a DSM. Panels (d) and (e) show zoomed-in sections of the optical orthoimage and the DSM with draped hillshade, respectively. With these VHR DSMs, polygon borders can be made visible that may not be easily distinguished in the optical data alone. Basemap in overview panel: Esri, TomTom, Garmin, FAO, NOAA, USGS, © OpenStreetMap contributors, and the GIS User Community (2011).
4.2 Photogrammetric point clouds
The processed point clouds are provided as las files, both in the RGB and NIR bands (Rettelbach et al., 2024). They are provided as tiles with the same tiling scheme as the orthophotos and also published in UTM CRS, allowing for efficient organization and management of the datasets. Each point in the point cloud contains multiple attributes, including RGB or NIR reflectance information, as well as the x, y, and z location in meters. The density of points within the point cloud varies depending on the spatial resolution of the source images used for point cloud generation and ranges between 0.78 to 41.97 px m−2 for the RGB and 1.15 and 12.91 px m−2 for the NIR clouds.
4.3 Additional data
For each data product (orthophoto and DSM), we provide mosaic files in virtual raster tile (vrt) format which load all tiles at once. We further make available three very low resolution, portable network graphics (png)-formatted preview images of the target area: (1) an orthophoto rendered in the optical RGB wavelengths, (2) a color-infrared preview with the NIR–R–G bands, and (3) an image based on the DSM. These files are suitable for quick-look purposes only and should not be used for scientific analysis. Some quick-look preview PNGs have vertical striping as an artifact. However, this is only an artifact in the png file; it is not found in the original orthophotos or DSMs. All additional files are also available from Rettelbach et al. (2024).
5.1 Quantitative assessment on geolocational accuracy
In order to assess the geolocational accuracy of our processed datasets, we have conducted comparison studies for both the horizontal and the vertical precision. We have selected three exemplary datasets within the targets of Cape Blossom, the Anaktuvuk River Fire, and the city of Kotzebue (see Table 2, IDs 14–16, 5, and 13, respectively).
5.1.1 Horizontal precision and accuracy
To determine the precision of our Cape Blossom datasets, we compared our mosaics at all three GSDs (7, 10, and 20 cm) with each other as well as with reference imagery published by the NOAA's Office for Coastal Management from 2017. These data are available at a 0.35 m GSD with a horizontal positional accuracy of ca. 1.5 m and a 95 % circular error confidence level (NOAA, 2024). For the 2019 data from Anaktuvuk, we compared the accuracy to the Alaska High Resolution Imagery (AHRI) published by the USGS (Maxar Technologies Inc., Alaska Geospatial Office, USGS, 2020). These data are based on Maxar high-resolution satellite imagery from 2020 and are provided at a 0.50 m GSD with a reported horizontal accuracy of 0.50 m and a 95 % circular error confidence level.
We manually identified tie points within our MACS mosaics and the reference imagery datasets and calculated their offsets to each other in the x–y plane.
For Cape Blossom, we determined an offset of up to 1.70 m ± 0.29 m (mean of residuals ± SD, where SD denotes standard deviation, of residuals) with respect to the NOAA imagery, based on nine evenly spread tie-point locations. With respect to each other, our Cape Blossom datasets show a maximum shift of 0.28 m ± 0.12 m (Table 3).
For the Anaktuvuk imagery, we found that the horizontal positioning accuracy of our datasets is within 1.65 m ± 0.10 m compared to the AHRI images, based on 13 evenly spread tie-point locations. Considering the reported uncertainties for the NOAA and AHRI imagery, more precise values are not possible.
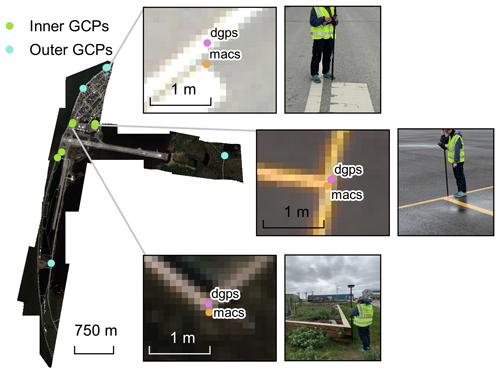
For the Kotzebue mosaics collected on 25 June 2021, we further used the differential GPS (DGPS) measurements of 11 ground control points (GCPs) that were also used within the GNSS post-processing solution (see Sect. 2.2). While, unfortunately, no independent DGPS reference dataset was available, the results may nevertheless give an overall idea of the datasets' accuracies and precision.
We divided the GCPs into six inner and five outer points. The inner points are covered by data flown in a north–south and east–west directions, whereas the outer points are only covered by one direction, represented by two flight lines. Figure 10 marks their locations within the Kotzebue dataset. For the inner GCPs, we measured an x–y offset of 0.13 m ± 0.02 m; for the outer GCPs, we measured an offset of 0.62 m ± 0.85 m. The higher inaccuracies of the outer GCPs can be explained by the low across-track overlap (only two flight lines) and by the large percentage of water in the surrounding areas (e.g., southernmost GCP; Fig. 10). Water-covered areas do not provide good tie points for photogrammetric matching (see Sect. 5.2.4), thereby affecting the positional accuracy in the mosaics. Thus, we can assume that the accuracies of the inner GCPs are most representative of the quality of the other published datasets, given that they have more than 50 % across-track overlap as well as a sufficiently high percentage of non-water-covered areas for accurate tie-point matching.
For an additional comparison to an independent dataset, we further derived the horizontal offset to aerial imagery of Kotzebue from 2016, distributed by the Division of Geological and Geophysical Surveys (DGGS) of Alaska. These data were processed from aerial overflights similar to our campaigns described here, and the published orthomosaics were processed at a 20 cm GSD (QSI Corvallis, 2019). We reprojected the DGGS data to EPSG:32603 and subsequently selected 14 tie points on flat surfaces (i.e., road and airfield apron markings) for comparison. On average, the DGGS data are shifted by 1.40 m ± 0.34 m to the northeast compared with our MACS imagery.
Overall, this leads us to assume a horizontal precision of our published datasets in the range of 1–2 px.
5.1.2 Vertical precision and accuracy
For quantifying the vertical precision and accuracy, we again compared the Cape Blossom DSM datasets at the different GSDs with each other. Here, we found average offsets less than 0.60 m from each other, with maximum standard deviations of 0.10 m (Table 3).
For the Anaktuvuk River Fire DSM (7 cm GSD), we had access to a lidar-derived elevation model that was collected during the same flight. The average density of the lidar point clouds was 5 points m−2. The resulting elevation model had a GSD of 1 m; the vertical accuracy reached 0.10 m. The process to derive the DEM from the raw data involved classifying target waveforms into vegetation and ground returns, post-processing ground returns into georeferenced point cloud data, and finally constructing the DEM using inverse distance weighting interpolation (see also Rettelbach et al., 2021). Within the overlapping areas of the processed lidar DEM and our photogrammetrically derived DSM (covering 0.63 km2), we detected a vertical offset of 0.18 m ± 0.06 m between the two elevation models, based on 200 randomly sampled point locations. This offset is likely related to the difference between the MACS DSM including tundra vegetation versus the lidar data providing a bare-earth DEM.
Overall, this also positions the vertical precision of our datasets in the range of 0.06–0.10 m.
Table 3Horizontal (x–y) and vertical (z) offsets between the Cape Blossom datasets at different GSDs with respect to each other and horizontal offsets with respect to the NOAA reference imagery. All values are given as the mean of residuals (m) ± SD of residuals (m).

* Positional accuracy of ca. 1.5 m and a 95% circular error confidence level.
5.2 Qualitative dataset assessments
The quality parameters of the output datasets are described in the Pix4Dmapper quality reports generated for each dataset. Additionally, we conducted a visual inspection of the resulting data. The automatically generated Pix4Dmapper quality reports contain information on the technical processing details and the quality of the orthomosaicking process, such as the number of calibrated and matched images, the number of tie points found and considered, the internal camera parameter uncertainties, and the geolocation variance of the individual input images. The quality report is provided with each target dataset and also contains information on the computing infrastructure that we used for the processing; the coordinate reference system; and the GSDs of the resulting orthomosaics, elevation models, and point clouds. General guidelines for interpreting the report are provided as an online resource by Pix4D: https://support.pix4d.com/hc/en-us/articles/202558689 (last access: 5 December 2024). The subsequent visual assessment of the output datasets was conducted to assess the optical quality of the datasets. While processing parameters can be tightly controlled, the image quality is also determined by the lighting conditions during image acquisition, which varied across the targets and, in the case of large targets that were acquired over several flight hours, also within the grids. Below, the most prevalent issues are described in detail.
5.2.1 Multispectral image matching
The camera system records spectral information in the RGB and NIR wavelengths with separate sensors of different resolutions and fields of view and, thus, different footprints on the ground (see Sect. 2.2 and Fig. 2b). When photogrammetrically processing the images to orthomosaics, Pix4Dmapper matches brightness levels between images of a sensor (RGB or NIR) but is not able to match colors between the two cameras. This can lead to problems when calculating spectral indices that require input from the NIR and an optical band, such as the normalized difference vegetation index (NDVI), requiring information from the NIR and red wavelengths. The effect was particularly problematic in inhomogeneously illuminated areas, such as at the overlap of two flight lines when the illumination changed between the two tracks (from, e.g., shifting clouds in the meantime). In such cases, the mosaicking algorithm might favor images from different flight lines for the same pixel in the NIR and in the RGB. Figure 11 illustrates how, for example, clouds appear differently in RGB and NIR orthomosaics because they moved between the timing of the flight lines.
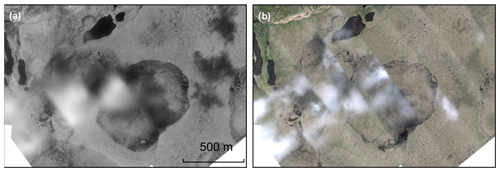
Figure 11Cloudy scenes in orthomosaics (here AOI SPNorthDTLBEast) may appear different in the (a) NIR and the (b) RGB orthomosaics. While NIR and RGB cameras always captured data simultaneously and, thus, produced images of the same ground conditions, the RGB and NIR orthomosaics were computed independently of each other, which could lead to different image instances from different flight lines being incorporated into the RGB and NIR mosaics. In addition, if objects such as clouds, cloud shadows, or waves on water within the imaging footprint moved between the acquisition flight lines, photogrammetric matching usually failed and flight lines became very apparent due to cut-off objects, such as the clouds in panel (b). The image location is 66.5370° N, 164.0700° W. Data were collected on 9 July 2021.
5.2.2 Changing illumination
Despite our best efforts to optimize the sensor settings according to the prevailing light conditions (see Sect. 2.3), no camera exposure settings could compensate for the slight changes in illumination between flight lines of a large target area. As automated post-processing cannot entirely mitigate this effect either, such brightness differences also manifested in the orthomosaics along the edges of flight lines. Figure 12a shows the optical orthomosaic of a tundra landscape near the village of Buckland with images collected on 27 June 2021 and gives an example of this data artifact. In most orthoimages, these flight lines are visible to some degree; however, especially at a local scale, they become almost negligible. The derived DSMs are only affected in very rare cases in which illumination changes between flight lines were extreme. This can be seen in the dataset of the Ketik River fire scar, as displayed in Fig. 12c and d.
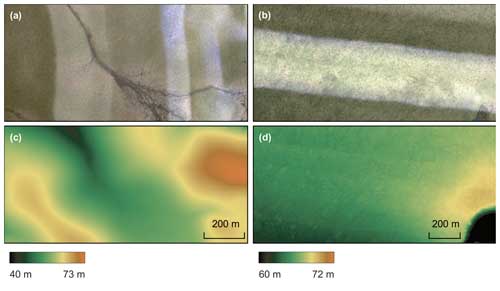
Figure 12Panels (a) and (b) show RGB orthomosaics generated from images with strong illumination differences between neighboring flight lines. Panels (c) and (d) show the corresponding digital surface models (DSMs) of the scenes in panels (a) and (b), respectively. Even though orthomosaics often show these striping artifacts caused by illumination differences, they only manifest in DSMs in cases of very extreme differences in image brightness. The image location for panels (a) and (c) is AOI BucklandFireScar subproject 01 at 65.9697° N, 161.0475° W. Data were collected on 27 June 2021. The image location for panels (b) and (d) is AOI KetikFire subproject 05 at 69.9149° N, 159.3557° W. Data were collected on 27 July 2019.
In extreme cases, such as during some acquisition flights in northern Alaska in 2019, some images had very strong overexposure. Especially in the NIR images, we then find a “smear” effect around the centers of the affected acquisitions (see Fig. 13a). This is an artifact resulting from the sensor design: when too many photons reach the interline charge-coupled device (CCD) sensors, the buffer overflows into the next line, creating what looks like vertical streaks in the resulting image. Accordingly, the saturation for these pixels is at 100 %. Thus, it is also not possible to post-process the affected images in any way to regain the spectral information of the underlying landscape. Therefore, targets affected by such strong overexposure have not been included in the dataset published here.
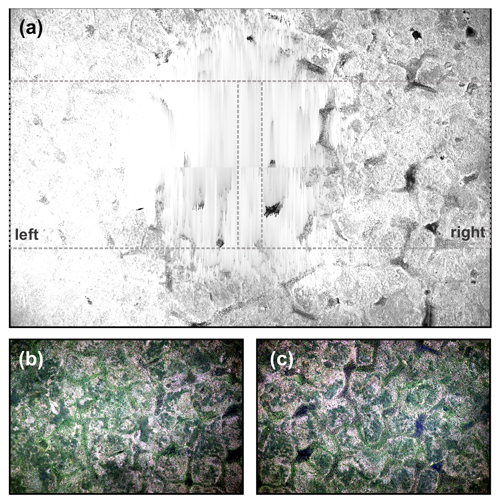
Figure 13(a) The original NIR image shows a smear effect at the center of the image. Due to overexposure, the affected pixels are entirely saturated and the CCD sensor buffers overflow into the next line, oversaturating the next pixel too. The RGB images of the (b) left-looking and (c) right-looking cameras were set to more adequate exposure times and do not show any smearing. The dotted rectangles in panel (a) show the left and right RGB footprints. The image location is polygonal tundra in the Ketik River fire scar at 69.9107 ° N, 159.2578 ° W. Data were collected on 27 July 2019.
While almost all targets were flown in a regular grid pattern, where neighboring flight lines were acquired directly one after the other (resulting in time shifts of ca. 10 to 15 min between neighboring images), the TrailValleyCreek (TVC) target was flown in larger loops. Figure 14e shows the order and flight direction of the lines for the aerial grid. Between the acquisitions of flight lines 2 and 17, approximately 3 h passed and illumination brightness and angle changed strongly. For this extreme case, we conducted a comparison of one of our TVC DSM subprojects (Fig. 14b) with the ALS digital terrain model (DTM; Fig. 14c) that was acquired during the same flight (Lange et al., 2021a). The ALS DTM is of high quality, with an accuracy of 0.03 m and a precision of 0.08 m. We applied the demcoreg algorithm (Shean et al., 2016), which is based on the method outlined in Nuth and Kääb (2011), to first align the MACS DSM to the ALS DTM and then conduct differencing. We found a vertical offset of −1.40 m and a horizontal offset of −0.03 m in the x direction and −3.44 m in the y direction (see Fig. 14). As the flights over TVC were also flown at only 20 % across-track overlap, this mismatch could not be corrected from further outward-lying, neighboring flight lines (i.e., 4 and 15).
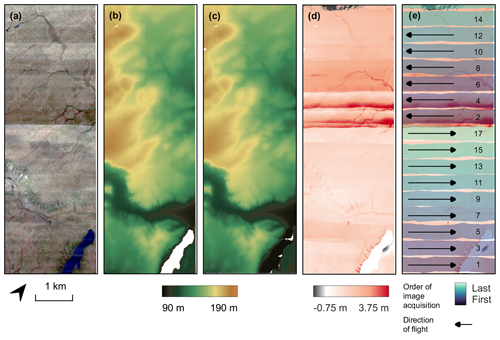
Figure 14AOI TrailValleyCreek subproject 03 displayed as (a) an optical orthophoto, (b) a photogrammetric DSM, and (c) a DTM generated from ALS data. Panel (d) shows the elevation difference between the MACS- and ALS-derived elevation models with a strong height mismatch in the center. In panel (e), the flight pattern (order and directions of the flight lines) is overlaid to emphasize the impact that the timing of adjacent flight lines can have on the photogrammetric processing. The image location is 68.6994 ° N, 133.6874 ° W. Data were collected on 22 August 2018.

Figure 15(a) Orthophoto of a region near Kotzebue characterized by extensive water-covered areas. (b) Point cloud of the same area showing the large data gaps of the water-covered areas from the ocean, ponds, and lakes. (c) In the resulting DSM, the water-covered areas therefore also represent areas of missing data. The image location is the Kotzebue Spit south of the Ralph Wien Memorial Airport on Baldwin Peninsula, northwestern Alaska, at 66.8756 ° N, 162.6167 ° W. Data were collected on 25 June 2021.
5.2.3 Illumination angle and bidirectional reflectance distribution function
A second source of visible linear artifacts stems from the bidirectional reflectance distribution function (BRDF). The BRDF describes how surfaces reflect light at different angles of incidence and reflection. Therefore, when a flight line is directed towards the Sun and the neighboring line is flown in the opposite direction (away from the Sun), this variation leads to changes in the perceived reflectance of the surface. Surfaces with different BRDF characteristics will reflect light differently based on the flight-line angle. This variation affects the radiometric properties of the captured imagery, causing variations in brightness, contrast, and spectral response across the images (examples can be seen in Figs. 7 and 14a).
Processing software will often select high-contrast features to prepare for image matching, which may include shadows cast on the ground. Therefore, the more time that has passed between two neighboring flight lines that should be matched photogrammetrically, the larger the induced error, as shadows wander across the ground with a changing Sun illumination angle.
The safest way to avoid such artifacts is by already factoring the Sun position into the flight planning phase and by designing smaller target blocks with shorter flight lines so that illumination differences between neighboring lines remain small. In our case, factoring in the Sun position was often not possible: preparing flight plans for airborne surveys is a lengthy process and, thus, needed to be done ahead of the campaign. However, the decision on which targets would be flown on a given day and at a given time was only made each morning, based on the local weather conditions at the desired target sites. Thus, a spontaneous realignment of the flight direction according to the Sun position was not feasible on such short notice. Some separate post-processing techniques to mitigate such artifacts have been proposed by studies such as Queally et al. (2022), Greenberg et al. (2022), and Wang and Liu (2016), but they have not been tested on our datasets. Depending on a user's requirement and their desired application, some algorithms might be more suitable than others.
5.2.4 Water-covered areas
Typically, water-covered areas cannot be matched through tie points in SfM, as the contrast in the imagery is too low. Resulting point clouds therefore usually have no or extremely sparse data for these areas. During the calculation of DSMs from point clouds (see Sect. 3.3), we did fill small holes by interpolating them; however, most water-covered areas exceed this size, and we therefore obtained large no-data areas within the calculated DSMs. Figure 15 shows an example using a DSM and point cloud data gaps from the Kotzebue Spit, south of the airport. This area is characterized by ponds and lakes on the narrow spit between the Chukchi Sea in the west and the Kotzebue Lagoon in the east.
In contrast, when we encounter waves or whitecaps in the ocean or in wind-blown lakes and rivers, the color contrast does allow matching during the automated SfM processing. Therefore, these areas do generate sufficient points within the dense point cloud to interpolate when creating the DSMs with WhiteboxTools. However, this is not necessarily a desired effect, as such whitecaps are moving objects between the pictures taken. Thus, any topographic information derived from these areas is likely false and should not be considered in any analysis. We see this effect, for example, in the dataset of Shishmaref, a village on a barrier island in the Chukchi Sea (Fig. 16).
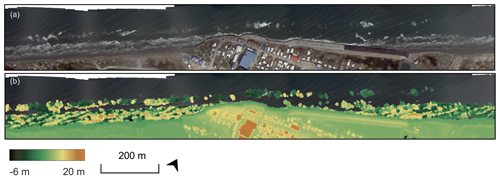
Figure 16(a) Optical orthophoto of the Chukchi Sea coast for the village of Shishmaref (Qigiqtaq) with waves and whitewater along the entire coast. In panel (b), the digital surface model (DSM) of this area is overlaid, showing the response of these disturbed waters in the point cloud and, thus, in the resulting DSM. As stated, the image location is the village of Shishmaref (Qigiqtaq) on the Seward Peninsula, northwestern Alaska, at 66.2557 ° N, 166.0731 ° W. Data were collected on 28 June 2021.
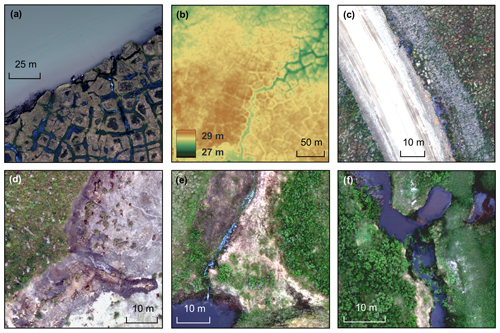
Figure 17(a) Impending block failures on the Drew Point coast in North Slope, Alaska, at 70.8766 ° N, 153.9315 ° W. Data were collected on 30 July 2019. Dataset ID: 10. (b) Degrading ice-wedge polygons on the northern Seward Peninsula, Alaska, at 66.4677 ° N, 164.7746 ° W. Data were collected on 9 July 2021. Dataset ID: 31. (c) Emerging thaw ponds next to the Inuvik–Tuktoyaktuk Highway in Northwest Territories, Canada, at 68.7519 ° N, 133.5464 ° W. Data were collected on 22 August 2018. Dataset ID: 3. (d) Northwest head wall of the Selawik Thaw Slump with active mud flow and individually distinguishable trees behind the head wall, northwestern Alaska, at 66.5001 ° N, 157.6148 ° W. Data were collected on 1 July 2021. Dataset ID: 21. (e) Drainage channel for small thermokarst lake on the Baldwin Peninsula, Alaska, at 66.8032 ° N, 162.3014 ° W. Data were collected on 28 June 2021. Dataset ID: 18. (f) Beaver dam on the Baldwin Peninsula, Alaska, at 66.7861 ° N, 162.3215 ° W. Data were collected on 28 June 2021. Dataset ID: 18. Panel (b) shows the DSM; all other panels show the orthophoto in the RGB bands. All datasets have a GSD of 10 cm.
All data described in this paper are available to the public via PANGAEA, an open-access data publisher archiving and distributing georeferenced data from Earth and environmental research. The following DOI represents access to the collection of all datasets covered by this publication: https://doi.org/10.1594/PANGAEA.961577 (Rettelbach et al., 2024).
Individual raw images from additional flight tracks (see the black areas in Fig. 1) not covered by the processed data described in this publication are available upon reasonable request until further processing and public data archiving are conducted in the future. During all three campaigns described in this publication, additional sensors, i.e., a full-waveform lidar (RIEGL LMS-Q680i); a slewable camera; an infrared thermometer; and sensors for measuring air temperature, moisture, and barometric pressure, were installed on the planes and recorded measurements at the same time as the MACS-recorded images. For the flights in northern Alaska in 2019, a further sensor recorded the methane concentration. Data from these additional sensors have not been published yet and are available from the authors upon reasonable request.
Some point clouds derived from the lidar system of the flights in northwestern Canada in 2018 have already been processed and published on PANGAEA: TrailValleyCreek_20190822 (Lange et al., 2021a) and TukRoadGrid_20190822 (Lange et al., 2021b).
All code used to process the datasets published here is available to the public via GitHub: https://github.com/awi-response/macs_processing (last access: 23 October 2024) and Zenodo: https://doi.org/10.5281/zenodo.12724200 (Nitze and Rettelbach, 2024). This repository contains all necessary files and code to reproduce our data processing workflow exactly as described in this publication, assuming that one has access to Pix4Dmapper (our workflow was only tested on v.4.6.4). The raw images can be provided upon reasonable request.
Here, we publish and describe very high resolution aerial datasets of permafrost landscapes covering more than 1500 km2 in northwestern North America (Rettelbach et al., 2024). These datasets were derived from the optical and near-infrared MACS sensors during three airborne campaigns with the AWI Polar 5 and Polar 6 aircraft. They include photogrammetric orthomosaics, point clouds, and digital surface models at spatial resolutions from 7 to 20 cm GSD or 0.78 to 41.97 px m−2 point cloud density, with horizontal and vertical precisions of 1–2 px and 0.06–0.10 m, respectively. These datasets provide an extraordinary level of spatial detail for a wide range of observation targets in permafrost regions of northern and northwestern Alaska and northwestern Canada.
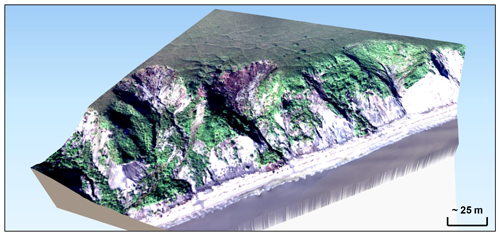
The high spatial detail and precision open up new possibilities for data analysis as well as for the discovery and validation of small-scale permafrost landforms. Potential research with these datasets may include, although it is not limited to, the following: tracking coastal erosion (e.g., impending block failures); the detailed analysis of ice-wedge polygons, their microtopography, and their degradation dynamics; monitoring thaw subsidence to evaluate potential impacts on infrastructure; the detection and characterization of retrogressive thaw slump and thermo-erosion gully dynamics; the detailed analysis of ground characteristics in recent and historic fire scars; the detection of lake drainages and drainage pathways in thermokarst lakes (Jones et al., 2023); the examination of individual shrubs and trees in the shrub–tundra regions; or the quantification of beaver dams and lodges (Figs. 17–18).
Given the absence of radiometric calibration targets during the campaigns, calculating radiometric indices may not be wholly reliable with the current version. However, it is important to note that these constraints do not diminish the datasets' utility for object-based analyses; automated segmentation tasks; or the mapping of specific features, their distribution, and their microtopography. The datasets will also be very useful to create VHR training datasets for machine learning algorithms in support of analyzing lower-resolution satellite imagery with broader coverage. With this, the datasets build a highly valuable foundation for scaling analyses and for change detection with historic and future airborne or satellite datasets. For several communities in northwestern Alaska, the datasets already provide recent VHR baseline imagery for assessing infrastructure risks from thawing permafrost nearby or for community infrastructure planning efforts enhancing adaptation and allowing some mitigation of consequences of climate change impacts. For the years 2023–2026, we plan to expand this dataset spatially and temporally through revisits in these three regions during upcoming aerial campaigns, allowing us to not only cover existing sites again for change detection analysis but also add new sites of high interest. Overall, these VHR datasets can become an essential tool for understanding the impacts of climate change on permafrost regions and can provide insights into the processes and dynamics of rapidly changing permafrost landscapes in the Arctic.
To generate photogrammetric DSMs (as described in Sect. 3.3), we had three possible sources to select from: (a) the point clouds derived from the RGB images, (b) the point clouds derived from the NIR images, or (c) the combination point clouds from RGB and NIR images. To determine which of these sources generated the best DSM results, we conducted a small test. For this, we selected three exemplary datasets that cover different landscape types and permafrost features represented over the entire available image space. The first AOI is found around the Selawik Thaw Slump in northwestern Alaska. This thaw slump shows steep edges and individually standing trees. The second AOI is Kivalina on the Seward Peninsula, northwestern Alaska, representing a village with buildings of different sizes. Finally, the third AOI is near Teshekpuk Lake. Here, we find small elevation differences between the ice-wedge polygons and their troughs in between.
It is important that the selected source allows the DSM-generating algorithm to both preserve the fine elevation details and correctly represent steep or sharp edges, such as those from buildings in the villages, a thaw slump’s head wall, or the individual trees.
Our analyses show that there is no general tendency towards either the NIR or the RGB sensor being the better option. Rather, the matching algorithm performs poorly for oversaturated or undersaturated and very dark pixels in the original image. Within our three comparison AOIs, this effect can be seen in the DSMs from the RGB-only point clouds for Kivalina and the polygonal tundra near Teshekpuk Lake. In Kivalina, many metal roofs of buildings show oversaturation in the images and, thus, complicate the correct matching of pixels. This results in frayed and imprecise building edges. Similarly, the undersaturated water-covered areas from the thermokarst ponds in the polygonal tundra AOI also show imprecise matching in the RGB-only DSM (Fig. A1i). As oversaturation can also be a problem in some NIR images (see Fig. 13), we found targets for which the NIR-only point cloud is also affected by this issue. Furthermore, using the NIR-only point cloud, we also observed that the resulting DSMs showed less sharp edges compared with the DSMs from the RGB-only point clouds. This is a result of the lower point density of the NIR point clouds. This effect can be seen both at the thaw slumps head wall edge in Fig. A1d and g and the edges of buildings in Fig. A1e and h. Using the combination point cloud (Fig. A1k, l, m) can overcome the worst of both of the described effects and results in the most coherent DSMs for the majority of our targets.
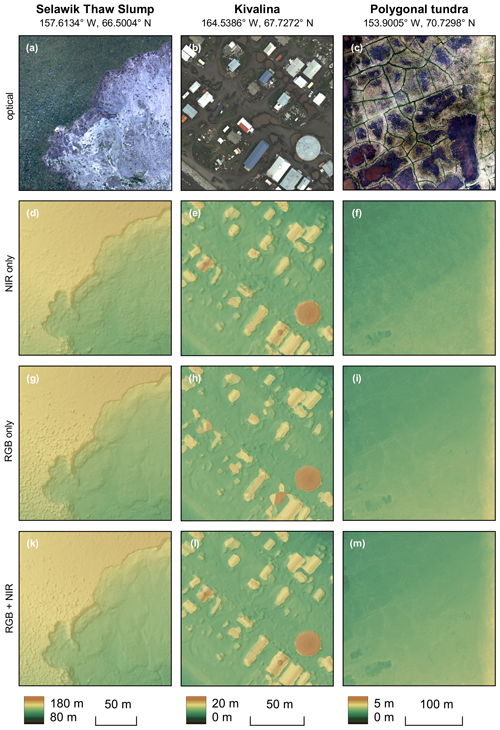
Figure A1Three AOIs representing different landscapes of the dataset domain were chosen to conduct a comparison of DSMs originating from three different data sources. Orthophotos of (a) the Selawik Thaw Slump, (b) Kivalina in northwestern Alaska, and (c) a polygonal thermokarst landscape near Teshekpuk Lake in northern Alaska show the three test sites. Below are the resulting DSMs (d–f) from the NIR-only point cloud, (g–i) from the RGB-only point cloud, and (k–m) from the point cloud with both RGB and NIR points.
Within our published datasets, we provide both the RGB and the NIR point clouds, should users desire to reprocess a certain DSM with only one of the point clouds.
Table A1Overview of all published target areas with information on dataset coverage and resolution, size of the datasets, and flight survey parameters. Further information on features that can be found in the respective datasets as well as in a collection of both literature that informed target selection (published before the acquisition date) and later literature that was conducted in the surveyed area (published after the acquisition date). Extension of Table 2.
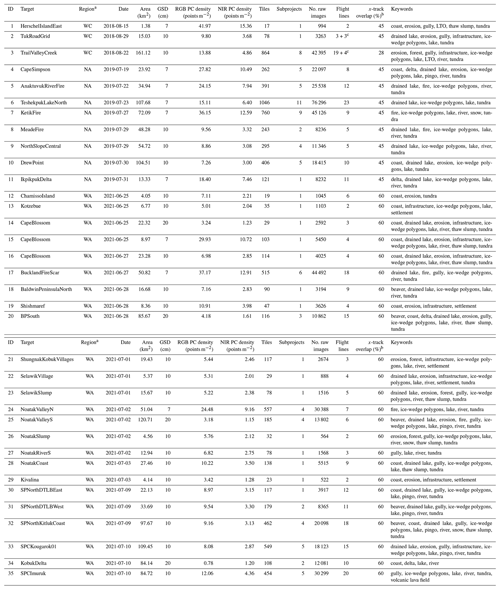
a Region abbreviations are as follows: WC – northwestern Canada; NA – northern Alaska; WA – northwestern Alaska; b This number corresponds to the planned and targeted across-track overlap for grid flights. As detailed in Sect. 2.3, the actual overlap can deviate in the resulting data;c A total of 3 (19) flight lines were acquired in the main grid direction, and 3 (4) further lines were acquired roughly perpendicular to the first 3 (19).
Conceptualization: GG, TS, IN, and TR; data curation: IN, TR, and SiS; formal analysis: IN, TR, and SiS; funding acquisition: GG and TS; investigation: GG, IN, TR, JB, IG, TS, JH, and MG; methodology: IN, TR, IG, JH, and SiS; project administration: GG and TS; resources: GG; software: IN, TR, IG, JH, and SiS; supervision: GG, TS, and JB; validation: IN, TR, IG, and JH; visualization: TR, IG, and JH; writing – original draft preparation: TR; writing – review and editing: TR, IN, GG, TS, IG, JH, DH, MG, TB, JB, and JB.
The contact author has declared that none of the authors has any competing interests.
Publisher’s note: Copernicus Publications remains neutral with regard to jurisdictional claims made in the text, published maps, institutional affiliations, or any other geographical representation in this paper. While Copernicus Publications makes every effort to include appropriate place names, the final responsibility lies with the authors.
The authors acknowledge support from AWI Logistics and Scientific Platforms personnel, specifically Daniel Steinhage, Benjamin Harting, Christoph Petersen, Martin Gehrmann, Maximilian Stöhr, Cristina Sans Coll, Eduard Gebhard, Silke Henkel, and Uwe Nixdorf, who facilitated the Polar 5 and Polar 6 airplane logistics and technical preparation. We thank Birgit Heim for helping with the preparation of initial MACS logistics and Katrin Kohnert for campaign and flight planning in 2018. The authors are also grateful to the Polar 5 and Polar 6 captains, first officers, and engineers from Kenn Borek Air for their great service, specifically Dean Emberley, Jamie Chisholm, William Houghton, Kodi Bacon, Matthew Patz, Linden Hoover, Erik Prager, Jamie Harrison, and Ryan Schrader. We are thankful to the many US and Canadian partners for their support regarding permits and survey target selection We would further like to thank Lion Golde for post-processing support and Amelie Driemel and Maximilian Betz from the PANGAEA team for their invaluable support with data and metadata management.
The airborne campaigns were made possible via AWI base funds through LK-II infrastructure (Alfred-Wegener-Institut Helmholtz-Zentrum für Polar- und Meeresforschung, 2016). Additional support for the personnel involved in the campaigns and data processing was received through ESA CCI+ Permafrost, ESA EO4PAC, EU Nunataryuk, EU Arctic Passion, NSF and google.org Permafrost Discovery Gateway, HGF AI-CORE, HGF HIP, HEIBRiDS, and Geo.X.
The article processing charges for this open-access publication were covered by the Alfred-Wegener-Institut Helmholtz-Zentrum für Polar- und Meeresforschung.
This paper was edited by Achim A. Beylich and reviewed by Matt Nolan and two anonymous referees.
Alfred-Wegener-Institut Helmholtz-Zentrum für Polar- und Meeresforschung: Polar aircraft Polar5 and Polar6 operated by the Alfred Wegener Institute, Journal of large-scale research facilities, 2, A87, https://doi.org/10.17815/jlsrf-2-153, 2016. a
Alfred Wegener Institute: Research aircraft Polar 5 and Polar 6, https://www.awi.de/en/expedition/aircraft/polar-5-6.html (last access: 24 January 2024), 2024. a
AMAP: Arctic climate change update 2021: key trends and impacts, Summary for policy-makers, Arctic Monitoring and Assessment Programme (AMAP), Oslo, Norway, https://www.arcticstation.nl/pics2021/Arctic-Climate-Change-Update-2021-SPM.pdf (last access: 13 December 2024), 2021. a
Antonova, S., Thiel, C., Höfle, B., Anders, K., Helm, V., Zwieback, S., Marx, S., and Boike, J.: Estimating tree height from TanDEM-X data at the northwestern Canadian treeline, Remote Sens. Environ., 231, 111251, https://doi.org/10.1016/j.rse.2019.111251, 2019. a
Bartsch, A., Pointner, G., Nitze, I., Efimova, A., Jakober, D., Ley, S., Högström, E., Grosse, G., and Schweitzer, P.: Expanding infrastructure and growing anthropogenic impacts along Arctic coasts, Environ. Res. Lett., 16, 115013, https://doi.org/10.1088/1748-9326/ac3176, 2021. a, b
Bayer, B. E.: Color imaging array, US Patent 3,971,065, https://patents.google.com/patent/US3971065A/en (last access: 13 December 2024), 1976. a
Beck, H. E., Zimmermann, N. E., McVicar, T. R., Vergopolan, N., Berg, A., and Wood, E. F.: Present and future Köppen-Geiger climate classification maps at 1-km resolution, Sci. Data, 5, 1–12, 2018. a
Bernhard, P., Zwieback, S., Bergner, N., and Hajnsek, I.: Assessing volumetric change distributions and scaling relations of retrogressive thaw slumps across the Arctic, The Cryosphere, 16, 1–15, https://doi.org/10.5194/tc-16-1-2022, 2022. a
Boike, J. and Yoshikawa, K.: Mapping of periglacial geomorphology using kite/balloon aerial photography, Permafrost Periglac., 14, 81–85, 2003. a
Brauchle, J., Hein, D., and Berger, R.: DETAILED AND HIGHLY ACCURATE 3D MODELS OF HIGH MOUNTAIN AREAS BY THE MACS-HIMALAYA AERIAL CAMERA PLATFORM, Int. Arch. Photogramm. Remote Sens. Spatial Inf. Sci., XL-7/W3, 1129–1136, https://doi.org/10.5194/isprsarchives-XL-7-W3-1129-2015, 2015. a
Burn, C. R. and Kokelj, S. V.: The environment and permafrost of the Mackenzie Delta area, Permafrost Periglac., 20, 83–105, 2009. a
De la Barreda-Bautista, B., Boyd, D. S., Ledger, M., Siewert, M. B., Chandler, C., Bradley, A. V., Gee, D., Large, D. J., Olofsson, J., Sowter, A., and Sjögersten, S.: Towards a Monitoring Approach for Understanding Permafrost Degradation and Linked Subsidence in Arctic Peatlands, Remote Sens., 14, 444, https://doi.org/10.3390/rs14030444, 2022. a
DLR: MACS-Box, https://macs.dlr.de/box/index.html (last access: 2 September 2022), 2019a. a
DLR: https://macs.dlr.de/doc/macs_io/#devignetting (last access: 25 April 2023), 2019b. a
Duk-Rodkin, A. and Lemmen, D.: Glacial history of the Mackenzie region, The Physical Environment of the Mackenzie Valley, Northwest Territories: a Base Line for the Assessment of Environmental Change, edited by: Dyke, L. D. and Brooks, G. R., 11–20, 2000. a
ESRI: World Shaded Relief [basemap], https://services.arcgisonline.com/ArcGIS/rest/services/World_Shaded_Relief/MapServer (last access: 27 October 2024), 2009. a
Esri, TomTom, Garmin, FAO, NOAA, USGS, © OpenStreetMap contributors, and the GIS User Community: Light Gray Canvas [basemap], https://www.arcgis.com/home/item.html?id=979c6cc89af9449cbeb5342a439c6a76 (last access: 27 October 2024), 2011. a, b, c
Farquharson, L. M., Mann, D. H., Grosse, G., Jones, B. M., and Romanovsky, V. E.: Spatial distribution of thermokarst terrain in Arctic Alaska, Geomorphology, 273, 116–133, 2016. a
Farquharson, L. M., Mann, D., Swanson, D., Jones, B., Buzard, R., and Jordan, J.: Temporal and spatial variability in coastline response to declining sea-ice in northwest Alaska, Mar. Geol., 404, 71–83, 2018. a
Frost, G. V., Christopherson, T., Jorgenson, M. T., Liljedahl, A. K., Macander, M. J., Walker, D. A., and Wells, A. F.: Regional patterns and asynchronous onset of ice-wedge degradation since the mid-20th century in Arctic Alaska, Remote Sens., 10, 1312, https://doi.org/10.3390/rs10081312, 2018. a
Gibbs, A. E., Nolan, M., Richmond, B. M., Snyder, A. G., and Erikson, L. H.: Assessing patterns of annual change to permafrost bluffs along the North Slope coast of Alaska using high-resolution imagery and elevation models, Geomorphology, 336, 152–164, 2019. a
Government of Canada: Historical Climate Data, https://climate.weather.gc.ca/ (last access: 15 July 2022), 2022. a
Greenberg, E., Thompson, D. R., Jensen, D., Townsend, P. A., Queally, N., Chlus, A., Fichot, C. G., Harringmeyer, J. P., and Simard, M.: An improved scheme for correcting remote spectral surface reflectance simultaneously for terrestrial BRDF and water-surface sunglint in coastal environments, J. Geophys. Res.-Biogeo., 127, e2021JG006712, https://doi.org/10.1029/2021JG006712, 2022. a
Grosse, G., Goetz, S., McGuire, A. D., Romanovsky, V. E., and Schuur, E. A.: Changing permafrost in a warming world and feedbacks to the Earth system, Environ. Res. Lett., 11, 040201, https://doi.org/10.1088/1748-9326/11/4/040201, 2016. a
Grosse, G., Nitze, I., Sachs, T., and Gessner, M.: Master tracks in different resolutions during POLAR 6 campaign P6_219_ThawTrend_Air_2019, Alfred Wegener Institute – Research Unit Potsdam, PANGAEA [data set], https://doi.org/10.1594/PANGAEA.905792, 2019. a
Grosse, G., Nitze, I., and Rettelbach, T.: Master tracks in different resolutions during POLAR 6 campaign P6_224_Perma_X_2021, Alfred Wegener Institute, Helmholtz Centre for Polar and Marine Research, Bremerhaven, PANGAEA [data set], https://doi.org/10.1594/PANGAEA.936829, 2021. a
Grünberg, I., Wilcox, E. J., Zwieback, S., Marsh, P., and Boike, J.: Linking tundra vegetation, snow, soil temperature, and permafrost, Biogeosciences, 17, 4261–4279, https://doi.org/10.5194/bg-17-4261-2020, 2020. a
Guo, D., Sun, J., Li, H., Zhang, T., and Romanovsky, V. E.: Attribution of historical near-surface permafrost degradation to anthropogenic greenhouse gas warming, Environ. Res. Lett., 15, 084040, https://doi.org/10.1088/1748-9326/ab926f, 2020. a
Hartmann, J.: Master tracks in different resolutions during POLAR 5 campaign AIRMETH_2018, PANGAEA [data set], https://doi.org/10.1594/PANGAEA.895733, 2018. a
Hjort, J., Streletskiy, D., Doré, G., Wu, Q., Bjella, K., and Luoto, M.: Impacts of permafrost degradation on infrastructure, Nat. Rev. Earth Environ., 3, 24–38, 2022. a
Irrgang, A. M., Lantuit, H., Manson, G. K., Günther, F., Grosse, G., and Overduin, P. P.: Variability in rates of coastal change along the Yukon coast, 1951 to 2015, J. Geophys. Res.-Earth, 123, 779–800, 2018. a
Iwahana, G., Uchida, M., Liu, L., Gong, W., Meyer, F. J., Guritz, R., Yamanokuchi, T., and Hinzman, L.: InSAR detection and field evidence for thermokarst after a tundra wildfire, using ALOS-PALSAR, Remote Sens., 8, 218, https://doi.org/10.3390/rs8030218, 2016. a
Jansen, E.: Past perspectives on the present era of abrupt Arctic climate change, Nat. Clim. Change, 10, 714–721, 2020. a
Jones, B., Grosse, G., Arp, C., Jones, M., Anthony, K., and Romanovsky, V.: Modern thermokarst lake dynamics in the continuous permafrost zone, northern Seward Peninsula, Alaska: Thermokarst Lakes and Permafrost Degradation in the Artic and Feedbacks to the Carbon Cycle, J. Geophys. Res., 117, G00M03, https://doi.org/10.1029/2011JG001666, 2011. a, b
Jones, B. M., Stoker, J. M., Gibbs, A. E., Grosse, G., Romanovsky, V. E., Douglas, T. A., Kinsman, N. E., and Richmond, B. M.: Quantifying landscape change in an arctic coastal lowland using repeat airborne LiDAR, Environ. Res. Lett., 8, 045025, https://doi.org/10.1088/1748-9326/8/4/045025, 2013. a
Jones, B. M., Grosse, G., Arp, C. D., Miller, E., Liu, L., Hayes, D. J., and Larsen, C. F.: Recent Arctic tundra fire initiates widespread thermokarst development, Sci. Rep., 5, 15865, https://doi.org/10.1038/srep15865, 2015. a
Jones, B. M., Farquharson, L. M., Baughman, C. A., Buzard, R. M., Arp, C. D., Grosse, G., Bull, D. L., Günther, F., Nitze, I., Urban, F., Kasper, J. L., Frederick, J. M., Thomas, M., Jones, C., Mota, A., Dallimore, S., Tweedie, C., Maio, C., Mann, D. H., Richmond, B., Gibbs, A., Xiao, M., Sachs, T., Iwahana, G., Kanevskiy, M., and Romanovsky, V. E.: A decade of remotely sensed observations highlight complex processes linked to coastal permafrost bluff erosion in the Arctic, Environ. Res. Lett., 13, 115001, https://doi.org/10.1088/1748-9326/aae471, 2018. a
Jones, B. M., Arp, C. D., Grosse, G., Nitze, I., Lara, M. J., Whitman, M. S., Farquharson, L. M., Kanevskiy, M., Parsekian, A. D., Breen, A. L., Ohara, N., Rangel, R. C., and Hinkel, K. M.: Identifying historical and future potential lake drainage events on the western Arctic coastal plain of Alaska, Permafrost Periglac., 31, 110–127, 2020. a, b, c
Jones, B. M., Tape, K. D., Clark, J. A., Bondurant, A. C., Ward Jones, M. K., Gaglioti, B. V., Elder, C. D., Witharana, C., and Miller, C. E.: Multi-dimensional remote sensing analysis documents beaver-induced permafrost degradation, Seward Peninsula, Alaska, Remote Sens., 13, 4863, https://doi.org/10.3390/rs13234863, 2021. a, b
Jones, B. M., Tessier, S. S., Tessier, T., Brubaker, M., Brook, M., Schaeffer, J., Ward Jones, M. K., Grosse, G., Nitze, I., Rettelbach, T., Zavoico, S., Clark, J. A., and Tape, K. D.: Integrating local environmental observations and remote sensing to better understand the life cycle of a thermokarst lake in Arctic Alaska, Arct. Antarct. Alp. Res., 55, 2195518, https://doi.org/10.1080/15230430.2023.2195518, 2023. a
Jorgenson, J. C., Jorgenson, M. T., Boldenow, M. L., and Orndahl, K. M.: Landscape change detected over a half century in the Arctic National Wildlife Refuge using high-resolution aerial imagery, Remote Sens., 10, 1305, https://doi.org/10.3390/rs10081305, 2018. a
Jorgenson, M.: Permafrost characteristics of Alaska, in: Proceedings of the Ninth International Conference on Permafrost, vol. 3, University of Alaska, Fairbanks, 2008. a, b
Jorgenson, M. T. and Grosse, G.: Remote sensing of landscape change in permafrost regions, Permafrost Periglac., 27, 324–338, 2016. a, b
Jorgenson, M. T., Kanevskiy, M. Z., Jorgenson, J. C., Liljedahl, A., Shur, Y., Epstein, H., Kent, K., Griffin, C. G., Daanen, R., Boldenow, M., Orndahl, K., Witharan, C., and Jones, B. M.: Rapid transformation of tundra ecosystems from ice-wedge degradation, Global Planet. Change, 216, 103921, https://doi.org/10.1016/j.gloplacha.2022.103921, 2022. a
Kaiser, S., Boike, J., Grosse, G., and Langer, M.: The Potential of UAV Imagery for the Detection of Rapid Permafrost Degradation: Assessing the Impacts on Critical Arctic Infrastructure, Remote Sens., 14, 6107, https://doi.org/10.3390/rs14236107, 2022. a
Lange, S., Grünberg, I., Anders, K., Hartmann, J., Helm, V., and Boike, J.: Airborne Laser Scanning (ALS) Point Clouds of Trail Valley Creek, NWT, Canada (2018), PANGAEA [data set], https://doi.org/10.1594/PANGAEA.934387, 2021a. a, b
Lange, S., Grünberg, I., Anders, K., Hartmann, J., Helm, V., and Boike, J.: Airborne Laser Scanning (ALS) Point Clouds of the Inuvik-Tuktuyaktuk-Highway, NWT, Canada (2018), PANGAEA [data set], https://doi.org/10.1594/PANGAEA.939655, 2021b. a
Langer, M., Von Deimling, T. S., Westermann, S., Rolph, R., Rutte, R., Antonova, S., Rachold, V., Schultz, M., Oehme, A., and Grosse, G.: Thawing permafrost poses environmental threat to thousands of sites with legacy industrial contamination, Nat. Commun., 14, 1721, https://doi.org/10.1038/s41467-023-37276-4, 2023. a
Lantuit, H. and Pollard, W. H.: Temporal stereophotogrammetric analysis of retrogressive thaw slumps on Herschel Island, Yukon Territory, Nat. Hazards Earth Syst. Sci., 5, 413–423, https://doi.org/10.5194/nhess-5-413-2005, 2005. a
Lantuit, H. and Pollard, W. H.: Fifty years of coastal erosion and retrogressive thaw slump activity on Herschel Island, southern Beaufort Sea, Yukon Territory, Canada, Geomorphology, 95, 84–102, 2008. a
Lara, M. J., Chen, Y., and Jones, B. M.: Recent warming reverses forty-year decline in catastrophic lake drainage and hastens gradual lake drainage across northern Alaska, Environ. Res. Lett., 16, 124019, https://doi.org/10.1088/1748-9326/ac3602, 2021. a
Larsen, J. N., Schweitzer, P., Abass, K., Doloisio, N., Gartler, S., Ingeman-Nielsen, T., Ingimundarson, J. H., Jungsberg, L., Meyer, A., Rautio, A., Scheer, J., Timlin, U., Vanderlinden, J.-P., and Vullierme, M.: Thawing permafrost in Arctic coastal communities: a framework for studying risks from climate change, Sustainability, 13, 2651, https://doi.org/10.3390/su13052651, 2021. a
Lehmann, F., Berger, R., Brauchle, J., Hein, D., Meissner, H., Pless, S., Strackenbrock, B., and Wieden, A.: MACS – Modular Airborne Camera System for Generating Photogrammetric High-Resolution Products, PFG, 6, 435–446, https://doi.org/10.1127/1432-8364/2011/0096, 2011. a
Lewkowicz, A. G. and Way, R. G.: Extremes of summer climate trigger thousands of thermokarst landslides in a High Arctic environment, Nat. Commun., 10, 1329, https://doi.org/10.1038/s41467-019-09314-7, 2019. a
Liljedahl, A. K., Boike, J., Daanen, R. P., Fedorov, A. N., Frost, G. V., Grosse, G., Hinzman, L. D., Iijima, Y., Jorgenson, J. C., Matveyeva, N., Necsoiu, M. K., Raynolds, M. K., Romanovsky, V. E., Schulla, J., Tape, K. D., Walker, D. A., Wilson, C. J., Yabuki, H., and Zona, D.: Pan-Arctic ice-wedge degradation in warming permafrost and its influence on tundra hydrology, Nat. Geosci., 9, 312–318, https://doi.org/10.1038/ngeo2674, 2016. a
Lindsay, J. B., Francioni, A., and Cockburn, J. M.: LiDAR DEM smoothing and the preservation of drainage features, Remote Sens., 11, 1926, https://doi.org/10.3390/rs11161926, 2019. a, b
Liu, L., Jafarov, E. E., Schaefer, K. M., Jones, B. M., Zebker, H. A., Williams, C. A., Rogan, J., and Zhang, T.: InSAR detects increase in surface subsidence caused by an Arctic tundra fire, Geophys. Res. Lett., 41, 3906–3913, 2014. a
Manley, W. F., Parrish, E. G., Sanzone, D. M., and Lestak, L. R.: High-resolution orthorectified imagery from approximately 1950 for the coastal areas of Bering Land Bridge NP (BELA) and Cape Krusenstern NM (CAKR), northwest Alaska, 2007. a
Marsh, P., Bartlett, P., MacKay, M., Pohl, S., and Lantz, T.: Snowmelt energetics at a shrub tundra site in the western Canadian Arctic, Hydrol. Process., 24, 3603–3620, 2010. a, b
Maxar Technologies Inc., Alaska Geospatial Office, USGS: Maxar Products. Dynamic Mosaic – Alaska High Resolution Imagery (RGB), https://geoportal.alaska.gov/arcgis/rest/services/ahri_2020_rgb_cache/MapServer (last access: 11 March 2024), 2020. a
Miller, C. E., Griffith, P. C., Goetz, S. J., Hoy, E. E., Pinto, N., McCubbin, I. B., Thorpe, A. K., Hofton, M., Hodkinson, D., Hansen, C., Woods, J., Larson, E., Kasischke, E. S., and Margolis, H. A.: An overview of ABoVE airborne campaign data acquisitions and science opportunities, Environ. Res. Lett., 14, 080201, https://doi.org/10.1088/1748-9326/ab0d44, 2019. a, b
Miner, K. R., D’Andrilli, J., Mackelprang, R., Edwards, A., Malaska, M. J., Waldrop, M. P., and Miller, C. E.: Emergent biogeochemical risks from Arctic permafrost degradation, Nat. Clim. Change, 11, 809–819, 2021. a
Nitze, I. and Rettelbach, T.: MACS processing code (v0.9.0), Zenodo [code], https://doi.org/10.5281/zenodo.13983272, 2024. a, b
Nitze, I., Cooley, S. W., Duguay, C. R., Jones, B. M., and Grosse, G.: The catastrophic thermokarst lake drainage events of 2018 in northwestern Alaska: fast-forward into the future, The Cryosphere, 14, 4279–4297, https://doi.org/10.5194/tc-14-4279-2020, 2020. a, b
NOAA: Climate Data Online: 1991–2012 Normals, https://www.weather.gov/wrh/Climate (last access: 26 January 2023), 2023. a, b, c, d
NOAA: 2017 NOAA NGS Ortho-rectified Color Mosaic of Kotzebue, Alaska, https://coast.noaa.gov/dataviewer/#/imagery/search/where:ID=8438 (last access: 11 March 2024), 2024. a
Nuth, C. and Kääb, A.: Co-registration and bias corrections of satellite elevation data sets for quantifying glacier thickness change, The Cryosphere, 5, 271–290, https://doi.org/10.5194/tc-5-271-2011, 2011. a
Obu, J.: How much of the earth's surface is underlain by permafrost?, J. Geophys. Res.-Earth, 126, e2021JF006123, https://doi.org/10.1029/2021JF006123, 2021. a
Obu, J., Lantuit, H., Grosse, G., Günther, F., Sachs, T., Helm, V., and Fritz, M.: Coastal erosion and mass wasting along the Canadian Beaufort Sea based on annual airborne LiDAR elevation data, Geomorphology, 293, 331–346, 2017. a
Obu, J., Westermann, S., Bartsch, A., Berdnikov, N., Christiansen, H. H., Dashtseren, A., Delaloye, R., Elberling, B., Etzelmüller, B., Kholodov, A., Khomutov, A., Kääb, A., Leibman, M. O., Lewkowicz, A. G., Panda, S. K., Romanovsky, V. E., Way, R. G., Westergaard-Nielsen, A., Wu, T., Yamkhin, J., and Zou, D.: Northern Hemisphere permafrost map based on TTOP modelling for 2000–2016 at 1 km2 scale, Earth-Sci. Rev., 193, 299–316, https://doi.org/10.1016/j.earscirev.2019.04.023, 2019. a, b, c
Oldenborger, G. A., Bellehumeur-Génier, O., LeBlanc, A.-M., and McMartin, I.: Landform mapping, elevation modelling, and thaw subsidence estimation for permafrost terrain using a consumer-grade remotely-piloted aircraft, Drone Systems and Applications, 10, 309–329, 2022. a
PANGAEA: OAI-PMH, https://wiki.pangaea.de/wiki/OAI-PMH (last access: 10 May 2023), 2023. a
Pix4D: Pix4Dmapper Manual, https://support.pix4d.com/hc/en-us/articles/202557769-Menu-Process-Processing-Options-3-DSM-Orthomosaic-and-Index-DSM-and-Orthomosaic (last access: 26 January 2023), 2021. a, b
QSI Corvallis: Fairbanks Fodar Assessment, Tech. rep., QSI Corvallis, 2019. a
Queally, N., Ye, Z., Zheng, T., Chlus, A., Schneider, F., Pavlick, R. P., and Townsend, P. A.: FlexBRDF: A flexible BRDF correction for grouped processing of airborne imaging spectroscopy flightlines, J. Geophys. Res.-Biogeo., 127, e2021JG006622, https://doi.org/10.1029/2021JG006622, 2022. a
Rantanen, M., Karpechko, A. Y., Lipponen, A., Nordling, K., Hyvärinen, O., Ruosteenoja, K., Vihma, T., and Laaksonen, A.: The Arctic has warmed nearly four times faster than the globe since 1979, Commun. Earth Environ., 3, 168, https://doi.org/10.1038/s43247-022-00498-3, 2022. a
Raynolds, M., Martin, C., Walker, D., Moody, A., Wirth, D., Thayer-Snyder, C., and Center, A. G.: ATLAS Vegetation Studies: Seward Peninsula, Alaska, 2000, https://doi.org/10.5065/D6KS6PRJ, 2002. a
Raynolds, M. K., Walker, D. A., Ambrosius, K. J., Brown, J., Everett, K. R., Kanevskiy, M., Kofinas, G. P., Romanovsky, V. E., Shur, Y., and Webber, P. J.: Cumulative geoecological effects of 62 years of infrastructure and climate change in ice-rich permafrost landscapes, Prudhoe Bay Oilfield, Alaska, Glob. Change Biol., 20, 1211–1224, 2014. a
Raynolds, M. K., Walker, D. A., Balser, A., Bay, C., Campbell, M., Cherosov, M. M., Daniëls, F. J. A., Eidesen, P. B., Ermokhina, K. A., Frost, G. V., Jedrzejek, B., Jorgenson, M. T., Kennedy, B. E., Kholod, S. S., Lavrinenko, I. A., Lavrinenko, O. V., Magnússon, B., Matveyeva, N. V., Metúsalemsson, S., Nilsen, L., Olthof, I., Pospelov, I. N., Pospelova, E. B., Pouliot, D., Razzhivin, V., Schaepman-Strub, G., Šibík, J., Telyatnikov, M. Yu., and Troeva, E.: A raster version of the Circumpolar Arctic Vegetation Map (CAVM), Remote Sens. Environ., 232, 111297, https://doi.org/10.1016/j.rse.2019.111297, 2019. a
Rettelbach, T., Langer, M., Nitze, I., Jones, B., Helm, V., Freytag, J.-C., and Grosse, G.: A Quantitative Graph-Based Approach to Monitoring Ice-Wedge Trough Dynamics in Polygonal Permafrost Landscapes, Remote Sens., 13, 3098, https://doi.org/10.3390/rs13163098, 2021. a, b, c
Rettelbach, T., Langer, M., Nitze, I., Jones, B. M., Helm, V., Freytag, J.-C., and Grosse, G.: From images to hydrologic networks-Understanding the Arctic landscape with graphs, in: Proceedings of the 34th International Conference on Scientific and Statistical Database Management, 1–10, https://doi.org/10.1145/3538712.3538740, 2022. a
Rettelbach, T., Nitze, I., Grünberg, I., Hammar, J., Schäffler, S., Hein, D., Gessner, M., Bucher, T., Brauchle, J., Hartmann, J., Sachs, T., Boike, J., and Grosse, G.: Aerial imagery datasets of permafrost landscapes in Alaska and northwestern Canada acquired by the Modular Aerial Camera System, PANGAEA [data set], https://doi.org/10.1594/PANGAEA.961577, 2024. a, b, c, d, e, f, g
Richter-Menge, J. and Druckenmiller, M.: State of the climate in 2019, Arctic, 101, S239–S286, 2020. a
Runge, A., Nitze, I., and Grosse, G.: Remote sensing annual dynamics of rapid permafrost thaw disturbances with LandTrendr, Remote Sens. Environ., 268, 112752, https://doi.org/10.1016/j.rse.2021.112752, 2022. a
Shean, D. E., Alexandrov, O., Moratto, Z. M., Smith, B. E., Joughin, I. R., Porter, C., and Morin, P.: An automated, open-source pipeline for mass production of digital elevation models (DEMs) from very-high-resolution commercial stereo satellite imagery, ISPRS J. Photogramm., 116, 101–117, 2016. a
Swanson, D. K. and Nolan, M.: Growth of retrogressive thaw slumps in the Noatak Valley, Alaska, 2010–2016, measured by airborne photogrammetry, Remote Sens., 10, 983, https://doi.org/10.3390/rs10070983, 2018. a
Tape, K., Sturm, M., and Racine, C.: The evidence for shrub expansion in Northern Alaska and the Pan-Arctic, Glob. Change Biol., 12, 686–702, 2006. a
Tape, K. D., Jones, B. M., Arp, C. D., Nitze, I., and Grosse, G.: Tundra be dammed: Beaver colonization of the Arctic, Glob. Change Biol., 24, 4478–4488, 2018. a, b
Tape, K. D., Clark, J. A., Jones, B. M., Kantner, S., Gaglioti, B. V., Grosse, G., and Nitze, I.: Expanding beaver pond distribution in Arctic Alaska, 1949 to 2019, Sci. Rep., 12, 7123, https://doi.org/10.1038/s41598-022-09330-6, 2022. a, b
Timoney, K., La Roi, G., Zoltai, S., and Robinson, A.: The high subarctic forest-tundra of northwestern Canada: position, width, and vegetation gradients in relation to climate, Arctic, 1–9, https://doi.org/10.14430/arctic1367, 1992. a
Ueyama, M., Iwata, H., Harazono, Y., Euskirchen, E. S., Oechel, W. C., and Zona, D.: Growing season and spatial variations of carbon fluxes of Arctic and boreal ecosystems in Alaska (USA), Ecol. Appl., 23, 1798–1816, 2013. a
Van der Sluijs, J., Kokelj, S. V., Fraser, R. H., Tunnicliffe, J., and Lacelle, D.: Permafrost terrain dynamics and infrastructure impacts revealed by UAV photogrammetry and thermal imaging, Remote Sens., 10, 1734, https://doi.org/10.3390/rs10111734, 2018. a
Vincent, W. F., Lemay, M., and Allard, M.: Arctic permafrost landscapes in transition: towards an integrated Earth system approach, Arctic Sci., 3, 39–64, 2017. a
Walker, D., Buchhorn, M., Kanevskiy, M., Matyshak, G., Raynolds, M., Shur, Y., and Wirth, L.: Infrastructure-Thermokarst-Soil-Vegetation interactions at Lake Colleen Site A, Prudhoe Bay, Alaska, Alaska Geobotany Center Data Report AGC, https://doi.org/10.18739/A2M61BQ8M, 2015. a
Walsh, J. E.: Intensified warming of the Arctic: Causes and impacts on middle latitudes, Global Planet. Change, 117, 52–63, 2014. a
Wang, J., Li, D., Cao, W., Lou, X., Shi, A., and Zhang, H.: Remote Sensing Analysis of Erosion in Arctic Coastal Areas of Alaska and Eastern Siberia, Remote Sens., 14, 589, https://doi.org/10.3390/rs14030589, 2022. a
Wang, Z. and Liu, L.: Correcting Bidirectional Effect for Multiple-Flightline Aerial Images Using a Semiempirical Kernel-Based Model, IEEE J. Select. Top. Appl. Earth Obs., 9, 4450–4463, 2016. a
Wilcox, E. J., Keim, D., de Jong, T., Walker, B., Sonnentag, O., Sniderhan, A. E., Mann, P., and Marsh, P.: Tundra shrub expansion may amplify permafrost thaw by advancing snowmelt timing, Arctic Sci., 5, 202–217, 2019. a
Yu, L., Zhong, S., Vihma, T., and Sun, B.: Attribution of late summer early autumn Arctic sea ice decline in recent decades, npj Clim. Atmos. Sci., 4, 3, https://doi.org/10.1038/s41612-020-00157-4, 2021. a
Zhang, C., Douglas, T. A., Brodylo, D., and Jorgenson, M. T.: Linking repeat lidar with Landsat products for large scale quantification of fire-induced permafrost thaw settlement in interior Alaska, Environ. Res. Lett., 18, 015003, https://doi.org/10.1088/1748-9326/acabd6, 2023. a
Zwieback, S. and Meyer, F. J.: Top-of-permafrost ground ice indicated by remotely sensed late-season subsidence, The Cryosphere, 15, 2041–2055, https://doi.org/10.5194/tc-15-2041-2021, 2021. a
- Abstract
- Introduction
- Data acquisition
- Data processing
- Data and metadata structure
- Data quality assessment
- Code and data availability
- Conclusions
- Appendix A: Point cloud source sensor for digital surface models
- Author contributions
- Competing interests
- Disclaimer
- Acknowledgements
- Financial support
- Review statement
- References


