the Creative Commons Attribution 4.0 License.
the Creative Commons Attribution 4.0 License.
SARAH-3 – satellite-based climate data records of surface solar radiation
Jaqueline Drücke
Steffen Kothe
Jörg Trentmann
Marc Schröder
Rainer Hollmann
The amount of energy reaching Earth's surface from the Sun is a quantity of high importance for the climate system and for renewable energy applications. SARAH-3 (SurfAce Radiation DAtaset Heliosat, https://doi.org/10.5676/EUM_SAF_CM/SARAH/V003, Pfeifroth et al., 2023) is a new version of a satellite-based climate data record of surface solar radiation parameters, generated and distributed by the European Organisation of Meteorological Satellites (EUMETSAT) Climate Monitoring Satellite Application Facility (CM SAF). SARAH-3 provides data from 1983 onwards, i.e. more than 4 decades of data, and has a spatial resolution of 0.05° × 0.05°, a temporal resolution of 30 min and daily and monthly means for the region covered by the Meteosat field of view (65° W to 65° E and 65° S to 65° N). SARAH-3 consists of seven parameters: surface irradiance, direct irradiance, direct normal irradiance, sunshine duration, daylight, photosynthetically active radiation and effective cloud albedo. SARAH-3 data between 1983 and 2020 have been generated with stable input data (i.e. satellite and auxiliary data) to ensure a high temporal stability; these data are temporally extended by operational near-real-time processing – the so-called Interim Climate Data Record. The data record is suitable for various applications, from climate monitoring to renewable energy. The validation of SARAH-3 shows good accuracy (deviations of ∼ 5 W m−2 from surface reference measurements for monthly surface irradiance), stability of the data record and further improvements over its predecessor SARAH-2.1. One reason for this improved quality is the new treatment of snow-covered surfaces in the algorithm, reducing the misclassification of snow as clouds. The SARAH-3 data record reveals an increase in the surface irradiance (∼ +3 W m−2 per decade) during recent decades in Europe, in line with surface observations.
- Article
(6859 KB) - Full-text XML
- BibTeX
- EndNote
Surface solar radiation is of high importance for Earth's climate (Ramanathan et al., 2001; Wild, 2012, 2016) and for life on Earth in general. Besides the astronomical Earth–Sun constellation and the individual daytime and location, surface solar radiation (SSR) is controlled by the atmospheric and surface properties. Overall, important factors influencing SSR are clouds, which strongly reflect solar radiation, reduce SSR and are highly variable in space and time (Pfeifroth et al., 2018a, b; Wild, 2012; Hartmann et al., 1986). Hence, a dense observational network is required to capture the temporal and spatial variability of SSR. However, station-based high-quality SSR measurements are often available at relatively few stations, e.g. from the Baseline Surface Radiation Network (BSRN), and do not capture the global or regional SSR spatial and temporal distributions appropriately. Large gaps in space and time exist in the surface network, especially over the ocean and on the African continent.
Satellite data have become a valuable data source for filling gaps (e.g. Gautier et al., 1980; Pinker et al., 1992; Huang et al., 2019) – not only in space, but also in time. SSR has been estimated from satellite measurements since the 1980s using a range of different retrieval methods (Rigollier et al., 2004; Vernay et al., 2014; Möser and Raschke, 1984; Cano et al., 1986; Mueller et al., 2015b; Müller and Pfeifroth, 2022; Karlsson et al., 2023). The generation of longer-term data records, however, only started in the 2000s, when higher-quality satellite data became available for 1 decade or longer. The data used for the monitoring of the climate are typically required to cover multiple decades (i.e. 20 years or more) and to be temporally homogeneous, in addition to having high accuracy. For a comprehensive review of the available retrieval techniques, the selected data records and the future perspectives, the reader is referred to Huang et al. (2019).
Here we present the climate data record (CDR) of SARAH-3 (SurfAce Radiation DAtaset Heliosat) (Pfeifroth et al., 2023, https://doi.org/10.5676/EUM_SAF_CM/SARAH/V003) generated by the European Organisation of Meteorological Satellites (EUMETSAT) Climate Monitoring Satellite Application Facility (CM SAF, Schulz et al., 2009), i.e. the latest version of the series of SARAH CDRs. SARAH-3 was released in May 2023 and covers more than 40 years (1983 to date), including, for the first time, the current World Meteorological Organization (WMO) climate normal period 1991–2020. SARAH-3 provides seven surface solar radiation parameters: solar irradiance (also called global radiation), two direct irradiance parameters (horizontal and normal), sunshine duration, two spectral surface radiation parameters (i.e. photosynthetically active radiation – PAR – and daylight – DAL) and the effective cloud albedo.
The SARAH data are based on the series of the geostationary Meteosat instruments of the first and second generations. The first Meteosat-based SSR data record was released by CM SAF more than a decade ago (Posselt et al., 2011) and, with its successors SARAH-1, SARAH-2 and SARAH-2.1, the generated data have been steadily improved and extended in time. While for SARAH-1 the main step was the inclusion of the MVIRI sensor (on board the first Meteosat generation) and the SEVIRI sensor (on board the second Meteosat generation) (Mueller et al., 2015b), the stability over time was further improved with SARAH-2 (covering 1983–2015). SARAH-2.1 is the extension of the SARAH-2 CDR and came with near-real-time processing for the first time. The so-called Interim Climate Data Record (ICDR) operationally and consistently extended the SARAH-2 CDR with a delay of 2–3 d. The current SARAH version, SARAH-3, is also accompanied and temporally extended by ICDR data, which enables climate monitoring applications (e.g. C3S, 2023). The main conceptional improvement in the generation of SARAH-3 has been the improved estimation of the surface solar radiation parameters in the case of snow-covered surfaces, which reduced the underestimation of surface solar radiation and sunshine duration found in previous versions of SARAH (e.g. Niermann et al., 2019). The estimation of surface irradiance under snow-covered conditions has also been identified as a key difficulty for other retrieval techniques (see Huang et al., 2019). Two novel parameters (compared to previous versions of SARAH), representing different spectral information, are included in SARAH-3, i.e. DAL and PAR. Some more information on the new parameters is given in Sect. 2.
All CM SAF data records are freely available via the CM SAF Web User Interface (see https://www.cmsaf.eu/ and https://wui.cmsaf.eu/, last access: 8 November 2024) in NetCDF format. The quality of the previous versions of the SARAH climate data records has been externally assessed under different aspects and for different regions by numerous studies (e.g. Urraca et al., 2017; Montero-Martin et al., 2020; Yang and Bright, 2020; Mabasa et al., 2021; Kenny and Fiedler, 2022; Gava et al., 2023; Ouhechou et al., 2023; Sawadogo et al., 2023; Forstinger et al., 2023).
Applications of the available SARAH climate data records cover many fields and applications, including climate analysis and monitoring (e.g. Pfeifroth et al., 2018a, b; Cebulska and Kholiavchuk, 2022; Obregón et al., 2014; C3S, 2023), evaluation of numerical models (e.g. Alexandri et al., 2015; Chen et al., 2024), agro-meteorology (e.g. Pelosi et al., 2022) and analysis of surface station locations and quality control of surface data (e.g. Schwarz et al., 2018; Urraca et al., 2020, 2024). In addition, the SARAH data records have been used extensively for analysis of the solar energy resources, their temporal and spatial variability and the modelling of the energy system (e.g. Huld, 2017; Hörsch et al., 2018; Kaspar et al., 2019; Drücke et al., 2021; Jensen et al., 2023; Sander et al., 2023; Kakoulaki et al., 2024; Husein et al., 2024).
This article provides an overview of the most important aspects of the CM SAF SARAH-3 climate data record. The retrieval algorithm is described in Sect. 2. Section 3 presents the validations of the data record, and in Sect. 4 some example applications of the SARAH-3 data record are given. The data availability is described in Sect. 5. Finally, a summary and conclusions are presented in Sect. 6.
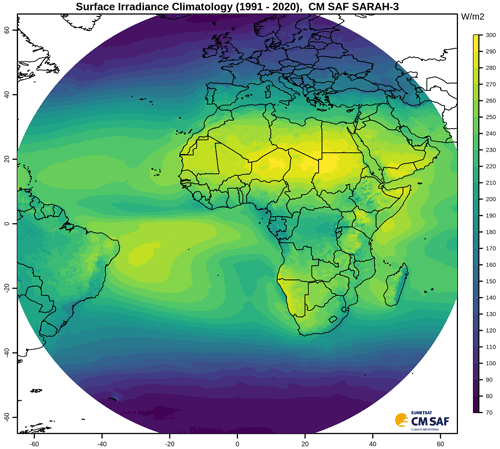
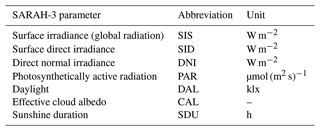
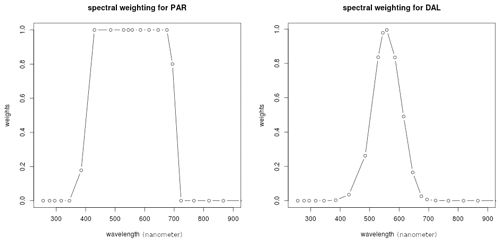
SARAH-3 is a climate data record generated and distributed by the EUMETSAT CM SAF. This is the latest version of SARAH data records and is based on instruments on board the series of Meteosat geostationary satellites, including the first (MFG) and second (MSG) generations. SARAH-3 thereby combines the MVIRI (on MFG) and SEVIRI (on MSG) sensors and covers the time period from 1983 to the present. The data record covers the region from 65° S to 65° N and from 65° W to 65° E (see Fig. 1) and is provided on a regular 0.05° × 0.05° grid. The available temporal resolutions are 30 min (instantaneous), daily and monthly means. Figure 2 shows the sunshine duration climatology for Europe. The annual sunshine duration in Europe varies between less than 1000 h in the north and more than 3000 h in the Mediterranean area. The parameters included in SARAH-3 are presented in Table 1. PAR and DAL represent specific spectrally weighted radiation quantities and have not been provided in previous versions of SARAH. PAR corresponds to the part of the solar radiation that can be used by plants to drive photosynthesis; DAL is defined as the brightness (lx) the human eye is observing. PAR is relevant for biological applications (e.g. oceanic carbon uptake), while DAL can serve infrastructure planning. The spectral weighting used to derive PAR and DAL is presented in Sect. 2.2.
The concept of SARAH-3 includes the generation and provision of a temporally stable and very consistent climate data record (from 1983 to 2020) based on high-quality and homogeneous input data (i.e. quality-checked satellite data and reanalysis data) and of the near-real-time so-called ICDR. The ICDR data, starting in 2021, are generated with the same algorithm (whenever possible) and input data comparable to the climate data to ensure high consistency between the ICDR and the CDR but provide the data with a timeliness of a few days.
Even though the SARAH-3 CDR can be extended with the ICDR in a consistent manner, care should be taken when the CDR–ICDR transition is included in the time series. The main differences in the CDR and ICDR processing are pointed out in the next sub-sections. More details on the algorithm and validation of the SARAH-3 CDR and ICDR data can be found in the data record documentation available at https://doi.org/10.5676/EUM_SAF_CM/SARAH/V003 (Pfeifroth et al., 2023).
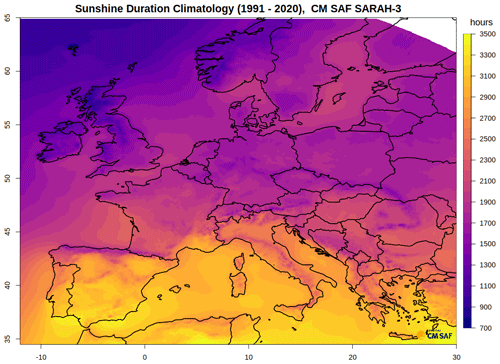
Figure 2SARAH-3 sunshine duration mean annual sum for Europe for the climate normal period (1991–2020).
The retrieval method for estimating the surface solar radiation used for the generation of all versions of the SARAH data record is based on the Heliosat approach (Cano et al., 1986; Hammer et al., 2003), is described in detail in Mueller et al. (2015b) and is put into further perspective in Müller and Pfeifroth (2022). In brief, the method is a two-step approach: first, the effective cloud albedo (CAL) is derived from the visible satellite channels only, and in the second step CAL is used together with a clear-sky surface solar radiation transfer model to derive the all-sky surface solar radiation parameters. The estimation of the clear-sky surface solar radiation requires some auxiliary data (see Sect. 2.5). For consistency reasons, the visible-channel-only approach is used throughout the satellite generations to account for the limited available spectral channels from the MVIRI instrument on board the first-generation Meteosat satellites.
One main new implementation in the SARAH-3 retrieval scheme compared to previous versions of SARAH is the improved consideration of snow-covered surfaces by detecting them internally (see Sect. 2.1). This information is used as part of the Heliosat algorithm to generate a more accurate effective cloud albedo in the case of snow-covered surfaces. By combining the SPECMAGIC (Spectral Mesoscale Global Irradiance Code) clear-sky model (see Sect. 2.2) with CAL, the all-sky surface solar radiation parameters are derived (see Sect. 2.3). Section 2.4 introduces the sunshine duration parameter and its retrieval algorithm based on the direct normal irradiance (DNI). For the estimation of the clear-sky surface solar radiation using a radiative transfer model, some auxiliary data are required, and they are described in Sect. 2.5. The estimation of daily and monthly averages from the instantaneous satellite retrievals is presented in Sect. 2.6.
2.1 Heliosat–HelSnow
Data from the previous versions of the SARAH data records suffered from occasional misclassifications of snow-covered surfaces as clouds, which resulted in an overly high effective CAL, in particular under predominantly clear-sky and snow-covered conditions, and subsequently in significant underestimations of surface solar radiation (Niermann et al., 2019; Carpentieri et al., 2023). With the help of HelSnow, the data quality has improved considerably under such conditions in SARAH-3 (see Sect. 3.2). With SARAH-3, the classical Heliosat approach for generating CAL is extended using the so-called HelSnow algorithm. The HelSnow algorithm is applied to estimate the surface reflectance (rho_min) in the presence of snow before the application of the “classical” Heliosat algorithm. The snow detection in HelSnow is a novel method for efficiently distinguishing between clouds and snow-covered surfaces based on the detection of moving bright objects. This method takes advantage of the high temporal frequency of observations from geostationary satellites and the fact that clouds typically move in time while snow-covered surfaces are immobile. The HelSnow method is able to separate snow and cloud coverage based on data from the satellite's visible channel only, allowing consistent processing across multiple generations of satellite instruments.
The basic assumption for snow detection in HelSnow is rather simple: bright areas that are in motion are considered cloudy, and bright areas without motion may be snow-covered surfaces. As the final result, daily information on snow-covered surfaces and their daily averaged brightness is generated and subsequently used in the estimation of the effective cloud albedo. There are four main steps in the implementation of the HelSnow algorithm to generate daily snow brightness data. The daily snow brightness data are subsequently used in the Heliosat approach.
2.1.1 Step 1: detection of motion
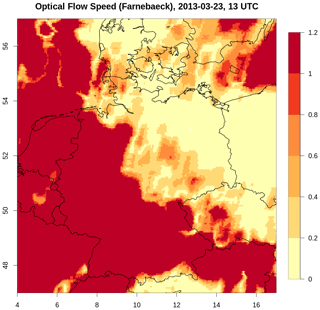
Optical flow is a method from image processing that can detect and quantify motion of objects from a sequence of images. Using the Farnebaeck algorithm (Farnebäck, 2003) in standard settings, “motion” (i.e. the optical flow) is detected in a sequence of two images (technically, the OpenCV software library is used; see https://opencv.org/, last access: 8 November 2024) in unit pixels per image sequence. For HelSnow we assume that, if the speed of the motion is lower than a certain threshold, the pixel (or objects of several pixels) is potentially cloud-free. This threshold is different for the MVIRI and SEVIRI sensors (i.e. 0.63 pixels per 30 min and 0.44 pixels per 30 min, respectively) due to the different native spatial resolutions of the sensors. An example of the calculated optical flow speed is shown in Fig. 3. All pixels with motion levels above or below the specified threshold are considered in motion and not in motion, respectively. Only those pixels below the threshold, i.e. those determined to be not in motion and hence cloud-free, are considered further.
2.1.2 Step 2: detection of sub-daily snow
In the second step of the HelSnow algorithm, potentially snow-covered surfaces are identified for every 30 min satellite slot between 09:00 and 15:30 UTC. For all pixels identified as not in motion, i.e. cloud-free, in step 1 the difference between the actual measured reflectivity and a reference clear sky is calculated. In case this difference is larger (i.e. the pixel is brighter) than a pre-defined threshold, the corresponding satellite pixel is considered snow-covered for this time step or satellite slot. Otherwise, this pixel is considered snow-free. The reference clear-sky value is calculated for each year based on the individual satellite slots and based on the months of June, July and August. This calculation is done for each year to account for different instrument calibrations and degradations. For the ICDR (2021 onwards), the clear-sky values for 2020 are used, as the SEVIRI instruments are quite stable over time.
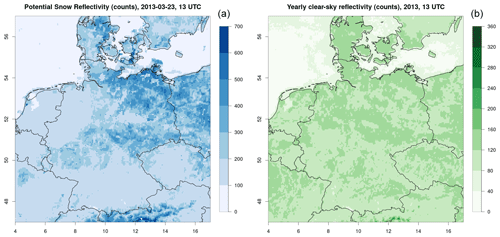
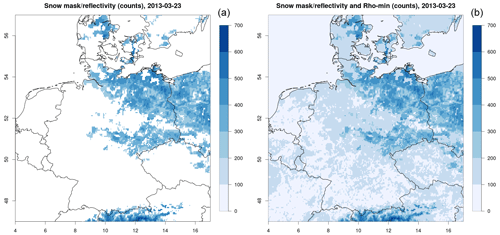
In the case of clouds (i.e. motion detected in step 1), a view of Earth's surface is not possible. In this case, the last valid observation of the surface for the corresponding satellite slot (e.g. the 13:00 UTC slot, either snow-covered surface or non-snow-covered surface) is kept unchanged from the same satellite slot from the previous day. This step is performed for each available satellite measurement between 09:00 and 15:30 UTC. An example of the instantaneous (snow) reflectivity for 23 March 2013, 13:00 UTC is shown in Fig. 4 (left). The corresponding clear-sky reference value to which the values from the determined clear-sky pixels are compared is shown in Fig. 4 (right). Note that the reflectivities of the snow-covered surfaces are typically substantially higher than those of the reference surface reflectivities. The corresponding threshold used to separate snow-covered surfaces from non-snow-covered surfaces is set to 60 counts.
2.1.3 Step 3: derivation of the daily snow brightness data
Using the sub-daily (30 min instantaneous) information on potentially snow-covered pixels, pixels are classified as snow-covered for that particular day if they have been classified as snow-covered (in step 2) for more than two-thirds of the used daytime observations. In this case, the associated clear-sky reflections (ρmin) for these pixels are derived as the temporal average of the instantaneous clear-sky reflections for the particular day and kept constant throughout the day. As a final step, to minimise incorrectly classified snow-covered surfaces (e.g. during fog events), the daily snow coverage information is corrected using snow and sea ice coverage data from ECMWF global analysis data records (see Sect. 2.5.1). This means that snow-covered surfaces as detected from satellite observations are not treated as snow-covered if there is no snow in the reanalysis data; in this case the ρmin data as determined by the classical Heliosat approach are used. Figure 5 (left) shows the final daily snow mask and snow reflectivity on 13 March 2013.
2.1.4 Step 4: Heliosat with snow data
The final step of the HelSnow–Heliosat approach generates CAL based on a monthly statistic of satellite images (see also Mueller et al., 2015b). The basic formula is CAL . ρ is the actual radiance measured by the sensor, and ρmin is the clear-sky reflectance estimated as the minimum reflectance over a certain period of time and derived for each satellite slot to consider the directional surface reflectance. In case a snow-covered surface was detected by the HelSnow approach (i.e. allowing the update of the snow reflectivity in step 3), the daily clear-sky reflectivity is used for all satellite slots. This implies that snow ρmin is only used under (mostly) clear-sky conditions and prevents the degradation of the sensitivity of the Heliosat approach under cloudy and snow-covered conditions. ρmax is the maximum reflectance determined per month as derived from the 95th percentile of the values in a region of the South Atlantic Ocean with a frequent occurrence of clouds (see also Mueller et al., 2015b). ρmax normalises the cloud albedo and considers the different sensitivities of the satellite instruments and the degradation of the sensor sensitivity with time. Finally, this leads to enhanced temporal stability of the data record.
The result of the HelSnow–Heliosat algorithm is CAL, which is the normalised cloud reflectivity relative to the clear-sky reflectance, now considering snow-covered surfaces. CAL is used subsequently as the main input for the calculation of the surface solar radiation parameters.
2.2 SPECMAGIC
The SPECMAGIC clear-sky surface solar radiation model is used to estimate the total and direct clear-sky surface irradiance (Mueller et al., 2012, 2015b). SPECMAGIC applies an efficient hybrid-eigenvector lookup-table (LUT) approach based on the modified Lambert–Beer function (MLB) (Mueller et al., 2004, 2009, 2012) to allow efficient processing of long-term satellite data. The LUT has been generated using the libRadtran radiative transfer model (RTM) (Mayer and Kylling, 2005). It has been derived for fixed values of integrated ozone, integrated water vapour and surface albedo, two solar zenith angles and a large range of aerosol properties. SPECMAGIC provides clear-sky surface solar radiation for 32 spectral bands (so-called Kato bands; see Kato et al., 1999). For more information, the reader is referred to Mueller et al. (2012, 2015b).
For the calculation of the clear-sky surface solar radiation, auxiliary data are required. A description of the auxiliary data used for the generation of SARAH-3 is presented in Sect. 2.5.
The total and direct clear-sky surface irradiances are derived as the sum of the irradiances of the 32 spectral Kato bands. The broadband parameters SIS, SID and DNI are calculated by summing up the respective spectral irradiances from all the Kato bands. The clear-sky surface solar radiation for the spectral parameters, PAR and DAL, is derived according to their definitions (see Alados et al., 1995, and https://cie.co.at/, last access: 8 November 2024) by adding the weighted irradiances from the corresponding spectral Kato bands. Figure 6 shows the weighting of the Kato bands for the estimation of PAR and DAL.
2.3 All-sky radiation
The all-sky surface solar radiation is derived by combining the effective cloud albedo derived from the satellite data and the clear-sky surface solar radiation estimated using SPECMAGIC. The clear-sky index, k, is defined as the ratio between the all-sky irradiance I and the clear-sky irradiance I_clr: k = _clr; hence, the all-sky surface irradiance is estimated as I = k⋅ I_clr. For the estimation of the surface direct irradiance, the following relation is used: . For more information on the calculation of the direct irradiance, we refer the reader to Mueller et al. (2015b) and Skartveit et al. (1998). k can be estimated from the effective cloud albedo using the Heliosat relation (Hammer et al., 2003). Over wide ranges of CAL (−0.05 < CAL < 0.8), the relation between k and CAL is k=1 − CAL, which provides, when multiplied by I_clr, the estimate of the all-sky surface irradiance: I= (1− CAL) ⋅ I_clr. To estimate the clear-sky index outside this range of CAL, other relations between CAL and k are used (Mueller et al., 2015b).
Spectral effects of clouds are also considered, resulting in a spectral adjustment of the clear-sky index and requiring separate estimation of the all-sky surface for each individual Kato band using the spectrally dependent clear-sky index and clear-sky irradiance. For further information on the estimation of the spectrally resolved all-sky surface solar radiation parameters, see Mueller et al. (2012, 2015b).
The final all-sky irradiance is estimated as the sum of the spectral all-sky irradiances for the corresponding spectral Kato bands, as described in the previous section. The DNI is calculated with , where SZA is the Sun zenith angle. The PAR data are provided as the photosynthetic photon flux density (PPFD) (µmol m−2 s−1), and the DAL data are provided in lux.
2.4 Sunshine duration
The basis for the retrieval of the SARAH-3 sunshine duration (SDU) data record is the instantaneous (30 min) DNI data and the WMO threshold for sunshine, which is defined by DNI≥120 W m2. In SARAH-3 the maximum possible daily sunshine duration is determined using the 2.5° threshold for the solar elevation angle and 120 W m−2 for the DNI. Here, the solar elevation angle under clear-sky conditions is used, and if it falls below the threshold of 2.5°, it is set to exactly the angle where 120 W m−2 is reached. The SDU is derived from the ratio of the number of “sunny” satellite slots to all available slots during daylight multiplied by the theoretically possible daylength:
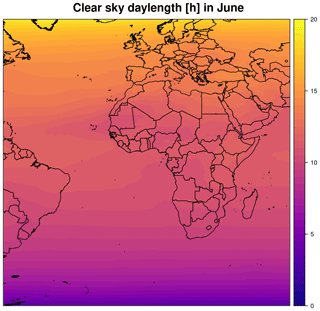
The theoretical daylength is pre-calculated depending on the date and location using the simplified SOLIS clear-sky radiation model to estimate the clear-sky DNI (Ineichen, 2008; Antonanzas-Torres et al., 2019) and monthly climatological aerosol and water vapour information. For each day and grid box, the length of the period with DNIclr≥120 W m−2 and SZA > 2.5° is determined and considered to be the theoretically possible daylength (Fig. 7).
Wi indicates the weighting of sunny slots depending on the number of surrounding cloudy and sunny grid points, which is discussed in more detail in Kothe et al. (2017) and remained unchanged in SARAH-2.1. The number of daylight slots (#daylight_slots) describes the maximum number of Meteosat observations (slots) per grid point and day during daylight as derived from clear-sky estimations of the DNI. The daily SDU is only calculated if at least 25 % of the possible daylight slots are available.
2.5 Auxiliary data
For the generation of the SARAH-3 climate data record, a few auxiliary data have been used within HelSnow and for the clear-sky surface solar radiation calculations. The details are covered in the following sections.
2.5.1 Snow cover and sea ice thickness
To reduce the number of misclassified snow-covered surfaces in the HelSnow approach, in particular in the presence of fog, snow-covered surfaces are only considered in the satellite retrieval if snow is also present in global model simulations from ECMWF that use a wide range of satellite data as well as temperature information from the model simulations to determine the snow coverage of the surface.
Here, snow cover and sea ice data are combined and used to correct for erroneous daily snow information derived from HelSnow. The global data are remapped to the spatial grid of the SARAH-3 data record. For the CDR time period of the SARAH-3 data record (i.e. 1983–2020), daily 12:00 UTC data from ERA5-Land (snow coverage) and ERA5 (sea ice cover) (C3S, 2017) are used. Snow and sea ice are considered in case their coverage is higher than 50 % for a certain pixel. For the period after 2021 (ICDR processing), the corresponding parameters are taken from the ECMWF Integrated Forecasting System operational high-resolution forecast model (IFS model); they deviate from the used ERA5 parameters. For the ICDR, snow depth and sea ice thickness are used if their respective values are at least 5 cm for the grid box mean. This has been shown to deliver mostly equivalent snow and sea ice masks to ERA5. Snow coverage is only considered in the satellite retrieval if detected by the HelSnow approach; snow information is not added from auxiliary data alone.
2.5.2 Water vapour
The daily total column water vapour (TCWV) data from ERA5 are used for the CDR. For the ICDR (2021 onwards), the TCWV data are used from the ECMWF IFS operational high-resolution forecast model. There a daily mean is generated from four sub-daily fields (i.e. 00:00, 06:00, 12:00 and 18:00 UTC). As the ERA5 data have a spatial resolution of 0.25° × 0.25°, the TCWV data are topographically downscaled to 0.05° × 0.05° assuming a scale height of ∼ 1600 m (see Bento et al., 2017). For the ICDR processing, the TCWV from the IFS model is used on the native grid with a spatial resolution of 0.1° × 0.1°. Like in the CDR, a daily mean is calculated and used in the ICDR.
2.5.3 Ozone
In SARAH-3, daily mean values of the total vertically integrated ozone column from ERA5 are used at a spatial resolution of 0.25° × 0.25°. For the ICDR processing, daily mean total ozone from the IFS model with a spatial resolution of 0.1° × 0.1° is used, similar to the water vapour data but excluding the downscaling step. The data are in Dobson units.
2.5.4 Aerosols
An aerosol climatology of the European Centre for Medium-Range Weather Forecasts – MACC (Monitoring Atmospheric Composition and Climate; see Inness et al., 2013) – is used in SARAH-3 (it had also been used for the generation of SARAH-1 and SARAH-2; see Mueller et al., 2015). The original MACC climatology has been adjusted to account for the detection of high aerosol loadings in the HelSnow retrieval based on the studies of Mueller et al. (2015a, b).
2.5.5 Surface albedo
New data on the surface albedo have been used in SARAH-3 compared to previous versions for the estimation of the clear-sky surface radiation. Here, monthly climatological surface albedo information based on MODIS and prepared by Blanc et al. (2018) is used. These data are based on bi-directional reflectance distribution function (BRDF) retrievals given by MODIS satellite observations. The surface reflectance is provided at a spatial resolution of 0.05° × 0.05° for five spectral bands. The albedo values from the five spectral bands have been transferred to match the Kato bands in the SPECMAGIC clear-sky radiative transfer model. This new monthly surface albedo background climatology used in SARAH-3 represents a substantial improvement compared to previous versions of SARAH, which used surface albedo data based on land use classes without monthly variability at a much coarser spatial resolution (0.5°).
2.6 Daily and monthly mean generation
The retrieval of the surface solar radiation parameters and the effective cloud albedo is conducted for the whole time period from 1 January 1983 with a temporal resolution of 30 min; the satellite slots of HH:00 and HH:30 are used for the MVIRI and SEVIRI instruments, respectively. To ensure the temporal consistency of the data record, no additional satellite slots have been used from the SEVIRI instrument, which does provide satellite data with a temporal resolution of 15 min.
The daily means of the surface solar radiation data are based on the 30 min instantaneous data, using the method of Diekmann et al. (1988). The formula considers the diurnal cycle of surface solar radiation by using the daily averaged and instantaneous clear-sky radiation:
SSRDA is the daily average of SSR. SSRCLSDA is the daily mean clear-sky SSR (derived using SPECMAGIC every 15 min). SSRi and are the satellite-derived SSR and model-simulated clear-sky SSR for the satellite slot i. The criterion for generating a daily mean is that at least 25 % of the possible daytime pixels must be available (similar to the SDU generation). Otherwise, the daily mean data are set to missing for that pixel. The daily averaging is the same for all of the surface solar radiation parameters, including the spectral parameters. The advantage of this method for generating the daily means is that the impact of missing instantaneous data on the daily averaging is much reduced. The effective cloud albedo is arithmetically averaged to estimate the daily mean.
For the estimation of monthly averages from daily averages, the criteria as defined by WMO for the calculation of monthly means are applied (WMO no. 1203). These criteria imply that no monthly mean is estimated in case more than 10 daily values or 5 or more consecutive daily values are missing. If the WMO criteria are not met, the data will be set to missing for these grid boxes, which occurred for 3 months for a larger part of the domain (January 1983, February 1985, November 1988). The monthly means are calculated by arithmetic averaging of the daily averages.
The validation of each data record is an essential mandatory step that each CM SAF data record undergoes before its release. The validation of SARAH-3 is documented in the CM SAF Validation Report available at https://doi.org/10.5676/EUM_SAF_CM/SARAH/V003 (Pfeifroth et al., 2023). Here we summarise the validation of the SARAH-3 CDR and ICDR with surface reference measurements. We further compare the SARAH-3 data record with its predecessor SARAH-2.1, which provides data from January 1983 until May 2023.
3.1 Reference data
In this section the reference data used for the validation are described. Surface measurements are used to assess the quality and to validate the SARAH-3 data, as these usually offer the best data quality and can serve as references.
3.1.1 BSRN
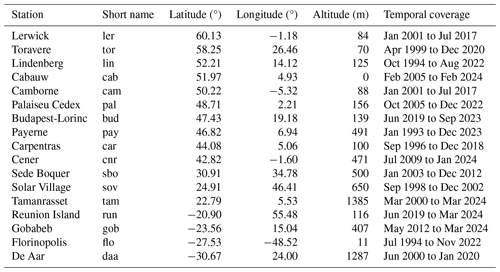
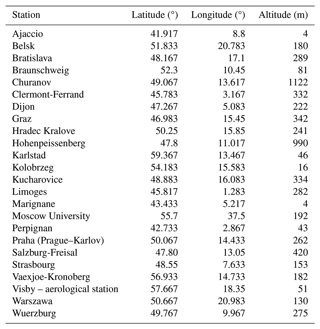
The BSRN is a widely used, high-quality network for surface radiation measurements (Driemel et al., 2018, https://bsrn.awi.de/, last access: 8 November 2024) maintained by the Alfred Wegener Institute (Helmholtz-Zentrum für Polar- und Meeresforschung) in Bremerhaven, Germany. The stations are globally distributed, but their overall number is quite small (51 active stations at the end of 2023). The BSRN data include global, direct and direct normal solar radiation data with a temporal resolution of 1 min at most of the stations, and they are collected with standardised high-quality measurement devices. For the validation of the SARAH data records, these 1 min data are averaged to daily and monthly means using the “M7-method” as recommended by Roesch et al. (2011) that makes use of the diurnal cycle of surface radiation to better account for missing values. The BSRN archive has provided data since 1994 from a total of 76 stations, with however a changing availability of stations over time. BSRN data are used to assess the accuracy of the SARAH-3 data record; to analyse the temporal stability of a data record, their usability is limited due to the comparatively short duration of the time series. Table 2 contains the BSRN stations used here for the validation of SARAH-3 (see Sect. 3.3).
3.1.2 Global Energy Balance Archive (GEBA)
GEBA is a collection of global monthly surface irradiance data (Wild et al., 2017; https://geba.ethz.ch/, last access: 8 November 2024). It includes data from several hundred stations; many of these provide time series for more than 30 years. The quality of the data in GEBA depends on the data provider; no general quality standards for the measurements are required, and no general quality control of the data is applied (as is done as part of the BSRN). To ensure the high data quality of the reference data used here, a careful selection of the data from stations from GEBA has been made. The criteria of this selection include a high data availability for the study period, a high spatial representativity of the station location and a temporally homogeneous data record. The latter was determined by applying homogeneity tests using independent gridded data records as references; these data have also been used to identify outliers in the monthly surface data, which have been removed from the analysis. The final set of 24 stations, which are used for the stability assessment of SARAH-3, is presented in Table 3. All these stations cover the time period 1983–2020.
3.1.3 Sunshine duration data from monthly CLIMAT messages
CLIMAT is a set of monthly meteorological measurements shared and distributed by meteorological services worldwide. CLIMAT data are collected and distributed by the German Meteorological Service (Deutscher Wetterdienst, DWD) via its Climate Data Center (CDC, https://opendata.dwd.de/climate_environment/CDC/, last access: 8 November 2024). CLIMAT includes the sunshine duration as a standard meteorological parameter, which is used here for the validation of the SARAH-3 SDU data record.
3.1.4 European Climate Assessment and Data (ECA&D) – daily sunshine duration data
ECA&D (https://www.ecad.eu/, last access: 8 November 2024) provides station-based data of several meteorological parameters at a daily resolution, including sunshine duration, for Europe (Klein Tank et al., 2002; van den Besselaar et al., 2015). Here we use daily sunshine duration data from the “pre-defined subset” as provided by ECA&D; non-blended time series are used. That is, the data from all individual stations are used, and the time series have not been merged in case of station relocation or closure. Because for GEBA the quality of the ECA&D data depends on the data provider, no specific quality standards are applied. Also, the instruments for measuring the sunshine duration are different between the available time series, in particular those from different data providers.
3.1.5 German meteorological stations
The DWD provides high-quality observational data through its Climate Data Center (CDC, http://www.dwd.de/cdc, last access: 8 November 2024), mainly for Germany. Here we use daily sunshine duration and snow height data from a large number of stations throughout Germany for specific validation purposes – in particular for evaluating the data quality of the satellite data in case of snow cover (Sect. 3.2).
3.2 Validation of HelSnow
The newly developed HelSnow algorithm aims to detect snow-covered surfaces and improves the ability of the algorithm to distinguish between cloud and snow coverage in the visible-channel satellite data. This is especially relevant for clear-sky situations, when previous versions of the SARAH data record underestimated the surface solar radiation in the case of snow-covered surfaces.
Figure 8 shows the case for 23 March 2013, when snow cover and clear-sky conditions occurred in Germany and its neighbouring regions. The figure shows the improvement in the quality of the sunshine duration data from SARAH-3 compared to SARAH-2.1 (Fig. 8, top row). Particularly in the north-eastern part of Germany, marked by the black circle (where clear skies prevail), the SARAH-3 sunshine duration compares much better to the surface reference data than the SARAH-2.1 data. In this area, the snow-covered surfaces were detected well by the HelSnow algorithm (Fig. 8, bottom right). The grey area (snow detected by HelSnow) agrees with the snow observations from the stations (black dots). The data quality improvement is also shown by the scatterplot (Fig. 8, bottom left): the SARAH-3 SDU (red dots) aligns much better with the 1 : 1 line than the SARAH-2.1 SDU (blue dots), and the mean absolute differences between the SARAH data and the surface measurements drop from about 2.5 h (SARAH-2.1) to about 1.8 h (SARAH-3).
A similar improvement in the data quality of the SARAH-3 surface irradiance data records is documented in Fig. 9 for the springtime climatological distribution of surface irradiance in the European Alpine region. Figure 9 shows a comparison of surface irradiance climatologies of March derived from the SARAH-3 and SARAH-2.1 climate data records compared to surface reference observations in the European Alpine region extracted from GEBA. Overall, in the considered regions, SARAH-3 shows higher climatological surface irradiance levels compared to SARAH-2.1, which agrees much better with the levels derived from the surface reference measurements.
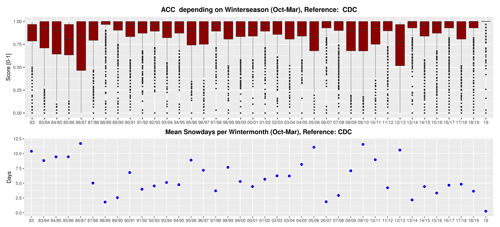
The ability of the HelSnow algorithm to detect snow-covered surfaces can be determined by comparison with surface observations of snow height or coverage. Here we use snow height data for Germany from the DWD network, which are available for the temporal coverage of the satellite data record. Figure 10 shows the results of the comparison between the satellite-derived snow mask and the surface measurements for all the winter seasons from 1983 to 2019 using the categorical accuracy (ACC) score, defined as the number of correct detections (snow and no snow) over all the cases and the mean number of days with snow for each season. Overall, the high levels of the ACC score (median value for almost all years > 0.8) indicate a good quality of the snow mask. A reduced ACC score is correlated with a larger number of days with snow, indicating an underestimation of snow detection by HelSnow. It is worth noting that this evaluation includes situations with snow coverage under cloudy skies; in such situations snow detection is not possible from the satellite data in the visible channel, and the information on snow coverage is estimated from the previous day. The surface solar radiation retrieval, however, does not use the snow information on cloudy days (see Sect. 2.1.4).
The quality of the internal snow mask slightly improves over time but has been rather stable since the early 1990s (Fig. 10). The reason for the reduced quality of the snow detection in the early years of the SARAH-3 data record is the reduced quality of the satellite input data from the early Meteosat instruments (less stable, many missing data), which negatively affects the snow detection capability and the high number of days with snow coverage and in turn influences the accuracy of the HelSnow algorithm. This reduced snow detection quality results in an underestimation of snow and a more frequent misclassification of snow as cloud coverage, which subsequently might lead to a more frequent underestimation of surface solar radiation in the early years of the SARAH-3 data record.
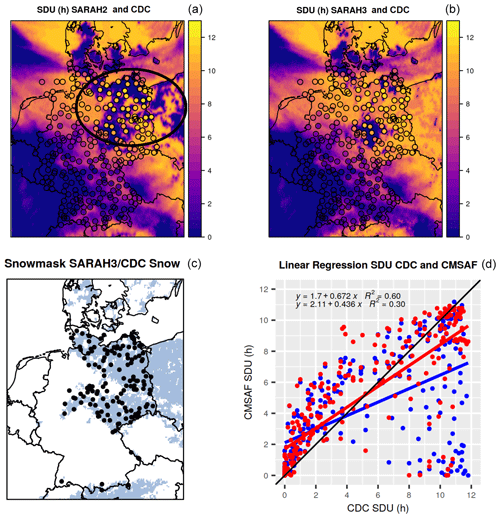
Figure 8Comparison of sunshine duration from SARAH-3 (top right) and its predecessor SARAH-2.1 (top left) for a snow case in Germany on 23 March 2013 and comparison to station observations of sunshine duration (dots with the same colour bar). The map in the bottom right shows the snow cover as detected by HelSnow (grey pixels) and the station data with snow observations (black dots) as an overlay. The scatterplot (bottom left) shows the SARAH-3 SDU (red dots), SARAH-2.1 SDU (blue dots) and station observation SDU (bottom right). Included are the linear regressions and the 1:1 line in black. Note that the area of interest in the top left is marked by the black circle, which is the area where the snow cover has been misclassified as clouds in SARAH-2.1.

Figure 9Validation of the surface irradiance (SIS) climatology of SARAH-2.1 (a) and SARAH-3 (b) for March together with station observations from GEBA for the Alpine region.
3.3 Accuracy validation
3.3.1 Validation with BSRN data
The data from the BSRN are the most important reference sources for the validation of surface radiation data in the CM SAF. The main validation results of the SARAH-3 SIS and direct irradiance data records (SID and DNI) using BSRN data for the time period 1994–2024 are shown in Fig. 11 for the monthly and daily averages. For the comparison, the data from the SARAH-3 grid box that are closest to the corresponding BSRN station are used.
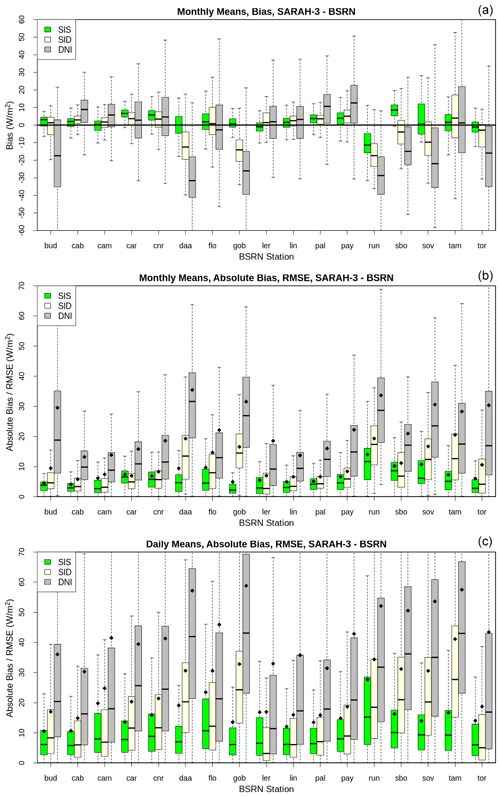
Figure 11Validation results of the SARAH-3 parameters SIS (green), surface direct irradiance (SID, yellow) and direct normal irradiance (DNI, grey) with individual BSRN stations. Shown are boxplots for the monthly mean bias (a), the monthly absolute bias (b) and the daily absolute bias (c). The black diamonds plotted in the boxplots in the middle and bottom show the root mean squared error (RMSE). All the data are in Watt per square metre. The short names of the BSRN stations are listed in Table 2.
Figure 11 shows that the bias and mean absolute differences (MADs) are lower for the SIS and higher for the direct irradiance parameters SID and DNI. For the surface irradiance, the bias is rather small for most of the locations. Only for the BSRN stations of Réunion (negative bias) and Sede Boquer (positive bias) is the bias somehow conspicuously larger than for the other locations; the biases are larger, in general, for the direct irradiance parameters (SID and DNI). In terms of the MADs, the situation is comparable (see Fig. 11, middle and bottom): the MADs for the direct irradiance parameters are larger than for the surface irradiance. The overall validation results of the SARAH-3 and BSRN stations for the monthly and daily data are summarised in Table 4.
Table 4Summary of the validation results of SIS, surface direct irradiance (SID) and direct normal irradiance (DNI) for the BSRN stations for monthly (mm), daily (dm) and SARAH-3 data. Shown are the bias, mean absolute difference (MAD), root mean squared error (RMSE) and anomaly correlation (“Anomaly corr.”).
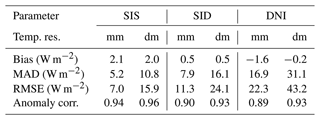
Table 4 shows that the mean bias for all of the parameters is small, at ±2 W m−2. The MADs and root mean squared errors (RMSEs) are lowest for the SIS and higher for the direct solar radiation parameters SID and DNI. In general, the monthly means have lower MAD and RMSE values than the daily means, as daily deviations partly average out over the course of a month. For the monthly means, the MAD for SIS is only about 5 W m−2 and the RMSE is 7 W m−2. The correlations of the anomalies between the SARAH-3 data records and the BSRN reference data reach and exceed 0.9 for all of the parameters, documenting the great ability of SARAH-3 to identify and quantify anomalies in the surface solar radiation, which is an important application for climate data records as well.
3.3.2 Validation of sunshine duration
Sunshine duration is a highly relevant climate variable with a long history of surface measurements. It has been measured for more than 150 years and is of high relevance for life. There are many sunshine duration measurements available for validation purposes. For the SARAH-3 SDU validation, we make use of the monthly CLIMAT data and the daily SDU data from ECA&D. The validation results are summarised in Table 5. For the monthly sums, the SDU bias is about 10 h on average and about 0.2 h (or about 12 min) for the daily sums. Due to its higher variability in terms of day-to-day variations, the anomaly correlation of SARAH-3 and the stations is higher for daily sums than for monthly sums. The mean absolute difference is only about 1 h for the daily sums of sunshine duration.
Table 5Summary of the validation of the monthly and daily SARAH-3 SDUs with reference to monthly CLIMAT and daily ECA&D sunshine duration data.

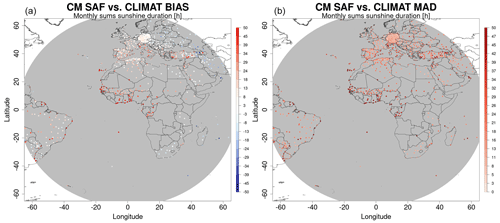
Figure 12 shows maps of the mean bias and MADs per station of the monthly SARAH-3 SDU data minus the CLIMAT station data. The figure shows that the bias and MADs are small for most of the stations but larger for the tropical and subtropical stations of Africa. For parts of south-eastern Europe, the differences are larger as well. For the majority of the African stations, SARAH-3 has a positive bias in terms of monthly sums of SDU, reaching values of more than 30 h.
3.4 Stability validation
3.4.1 Sunshine duration validation with CLIMAT
The availability of the long time series of sunshine duration in the CLIMAT data archive allows the analysis of the temporal stability of the SARAH-3 sunshine duration data. The temporal evolution of the bias between the SARAH-3 and reference data reveals fluctuations and deviations, in particular during the early years of the data record (Fig. 13). In the early 1990s there is a period with more positive deviations by SARAH-3, which might be related to the volcanic eruption of Mount Pinatubo in the Philippines in 1991 (Vernier et al., 2011).
The increase in the atmospheric optical depth due to additional aerosols, e.g. by volcanic eruptions, is not directly accounted for in the SARAH retrieval and hence might result in an overestimation of SDU in that particular period. The slight and gradual increase in the bias in the mid-2000s is not associated with volcanic activity and requires further analysis. The data quality of SARAH-3 is improved, compared to SARAH-2.1, in terms of the mean bias (∼ 9.5 h vs. ∼ 12.3 h) by more than 20 % and the stability of SARAH-3 as documented by the linear regression lines in Fig. 13. Overall, there is a slight negative trend in the bias compared to the CLIMAT SDU measurements.
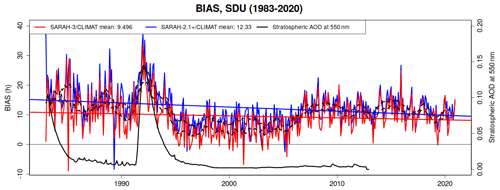
Figure 13Bias time series of the monthly sunshine duration (SDU) in hours of SARAH-3 vs. CLIMAT (red) and SARAH-2.1 vs. CLIMAT (blue) for the time period 1983–2020. Additionally, the linear regression lines for both bias time series and the 12-month running means of both bias time series are shown. The black line shows the stratospheric aerosol optical depth (AOD) at 550 nm provided by the National Aeronautics and Space Administration (NASA) Goddard Institute for Space Studies (see https://data.giss.nasa.gov/modelforce/strataer/#References (last access: 8 November 2024) for details of the aerosol data used). The mean bias of the SARAH-3 SDU and SARAH-2.1 SDU vs. CLIMAT station observations is also provided at the top of the figure.
3.4.2 Surface irradiance validation with GEBA
The monthly surface irradiance data from GEBA are used to assess the long-term stability of the SARAH-3 surface solar radiation climate data record in Europe. Figure 14 (left) shows the time series of the normalised bias between the data from the 24 GEBA stations and the SARAH-3 surface irradiance data record. The numbers in the bottom right of Fig. 14 (left) represent the slope of the linear regression line (number in the middle) and its 95 % confidence interval (CI), indicating the linear trend of the time series. The 95 % CI defines the range of values in which the true slope of the linear regression is located with a probability of 95 %. The linear trend of the bias based on the 12-monthly running mean time series is −0.64 W m−2 per decade, which in turn means that a potential trend in the data from the GEBA stations is underestimated by SARAH-3 by about 0.6 W m−2 per decade. The number of stations used for this analysis is rather stable over time due to the used set of selected stations from GEBA (see Sect. 3.1.2). The number of stations drops to almost zero in February 1985 due to missing data in the SARAH-3 data record for that month as a result of the application of the rather strict criteria for the monthly mean generation based on WMO (see Sect. 2.6).
Figure 14 shows that there is a positive anomaly in the SARAH-3 surface irradiance data record in the early 1990s, which might be related to the Pinatubo volcanic eruption in June 1991. This eruption emitted huge amounts of sulfate into the stratosphere, resulting in the formation of sulfate aerosol, which caused a dimming of the solar radiation in the years afterwards. This dimming by volcanic aerosols is not accounted for in the SARAH-3 data record, which might cause an overestimation of the surface solar radiation by SARAH-3. Similar behaviour in the temporal evolution of the bias has been observed for the sunshine duration in the early 1990s (see Sect. 3.4.1). On the other hand, the increase in the surface irradiance bias already started in 1989, i.e. prior to the Pinatubo eruption, and other factors are likely to have contributed to this increase. The decrease in the tropospheric aerosol optical depth due to the reduction in air pollution after 1989 in Europe might also have contributed to the overestimation of surface irradiance by SARAH-3 in this time period.
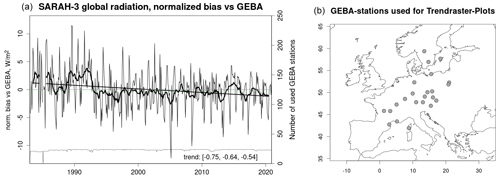
Figure 14(a) Time series of the monthly and 12-monthly rolling means of normalised bias (meaning the overall bias of 3 W m−2 is subtracted) between the SARAH-3 surface irradiance data record and the GEBA station data for the time period 1983–2020 (black line), including the linear trend line (black) based on the 12-month rolling means. The green line is the zero-trend line. The grey line (in the lower part) shows the time series of the number of stations used. Additionally, the trend based on the linear regression and its confidence interval are shown (W m−2, lower right). There the first number is the lower end of the confidence interval, the second number is the trend, and the third number is the upper end of the confidence interval. (b) Map of the GEBA stations used.
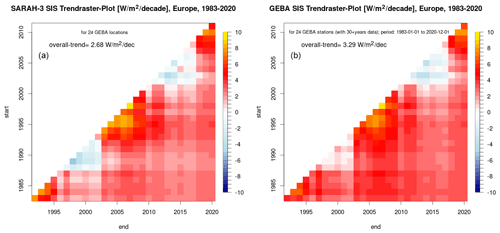
Figure 15“Trendraster” plot of the SARAH-3 (a) and GEBA (b) surface irradiances for the 24 GEBA stations. The y axis denotes the start of the trends, and the x axis denotes the end of the trends. The trends shown range from 10 to 38 years (the maximum length of the trend shown in the lower-right part of the Trendraster).
The “running trend” analysis (visualised by the so-called “Trendraster” plots) enables us to analyse and compare variability and trends between two data sets. Figure 15 shows the linear trends over different time periods of 10 years and longer; the y axis denotes the start of a trend estimate, and the x axis denotes the end of a trend estimate. The diagonal shows the shortest (10-year) trends. Figure 15 shows that the temporal patterns of trends as given by SARAH-3 (Fig. 15, left) and GEBA (Fig. 15, right) are very similar for the average of the used stations. The overall long-term trends of surface irradiance for the period 1983–2020 are also provided in the figure. The trend in SARAH-3 is about +2.7 W m−2 per decade, and the corresponding trend in GEBA is about +3.3 W m−2 per decade. The difference between the trends is about 0.6 W m−2 per decade, in line with the trend in the bias between both data sets (Fig. 14). There is substantial variability in the decadal trend estimate, which is represented well by the SARAH-3 SIS data record (Fig. 15). This variability highlights the great relevance of the start and end years for trend analysis, as can also be seen in the patterns (vertical and horizontal lines) caused by the end years 2003 and 2013, which experience strong positive and negative anomalies of surface irradiance. In other words, trends ending (starting) in 2003 tend to be exceptionally positive (negative).
In this section we will demonstrate some applications of the SARAH-3 climate data record.
4.1 Climatology
One basic application of a climate data record is the calculation of a climatology by averaging the monthly means for a certain time period. SARAH-3 covers the current WMO climate normal period from 1991 to 2020; the climatology of surface irradiance for the full SARAH-3 domain is shown in Fig. 1. It shows the typical pattern of maximum surface solar radiation in the subtropics, in particular in the Northern Hemisphere, and minimum surface solar radiation at high latitudes. In the tropics there is a local minimum due to the frequent occurrence of clouds in the Inter-Tropical Convergence Zone (ITCZ). Figure 16 shows the zonal means of all SARAH-3 parameters for the full domain. The meridional variability of CAL is opposite to the surface solar radiation parameters, which follow the relation of CAL to surface solar radiation as described in Sect. 2.3.
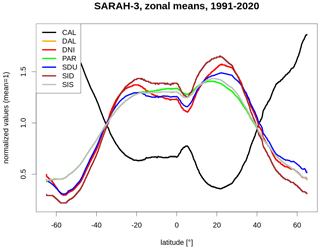
Figure 16Zonal means of all SARAH-3 parameters for the full SARAH-3 domain. The parameters are normalised with their respective mean values.
Figure 16 is meant to give a qualitative overview of the relation of the SARAH-3 parameters by showing zonal means normalised by their respective climatological means. All the surface solar radiation parameters behave similarly in terms of the zonal means, showing maxima in the subtropics and minima at high latitudes. However, there are also some differences. The relative SIS is higher than the SID at higher latitudes, where clear-sky situations are less frequent and hence the contribution of the diffuse radiation is enhanced. On the other hand, the situation is the opposite for the subtropics, where cloudy days are rare. There, the normalised values for the direct radiation are higher than for the global radiation (i.e. surface irradiance). A local minimum in all surface solar radiation parameters is visible in the inner tropics (∼ 5° N), where clouds are relatively frequent due to the convection in the ITCZ. The high cloud coverage south of 40° S results in low values of the direct radiation parameters (SID and DNI) and the sunshine duration, in particular when compared to the SIS, which also includes the diffuse radiation and, subsequently, is impacted less by clouds. The minimum (maximum) of the effective cloud albedo (surface solar radiation) parameters at about 20° N corresponds to the Sahara in northern Africa. In general, the anti-correlation of CAL and the surface radiation is obvious. The SID shows the largest meridional gradient.
4.2 Climate monitoring
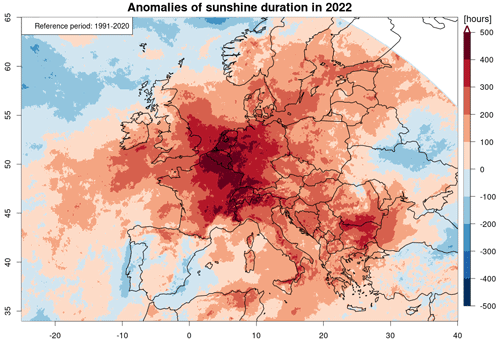
SARAH-3 is accompanied by the ICDR that consistently extends the CDR in time. The CDR–ICDR combination is a powerful tool for climate monitoring applications. The committed timeliness of the SARAH-3 ICDR is 5 d, but usually the SARAH-3 ICDR comes with a timeliness of only 2 d. Figure 17 shows the spatial distribution of the annual anomaly of sunshine duration for 2022 relative to the climate normal period (1991–2020). The map shows that 2022 was much sunnier than normal (up to +500 h of sunshine) in parts of central Europe (Germany, BeNeLux and France); parts of the Iberian Peninsula were less sunny than usual in 2022. The SARAH-3 CDR–ICDR combination is used, for example, by the Copernicus European State of the Climate reports (ESOTC; C3S, 2023) and by the WMO Regional Climate Center (RCC) for the European area (https://rcccm.dwd.de/DWD-RCCCM/EN/home/home_node.html, last access: 8 November 2024).
4.3 Climate variability and trends
Using a data record to assess climate variability and trends requires a high level of data quality. The temporal stability of a data record is especially crucial for such analyses. Based on the experiences with the previous versions of SARAH (e.g. Pfeifroth et al., 2018a) and based on the SARAH-3 validation results, we conclude that it is feasible to calculate trends with reasonable confidence, in particular for Europe after about 1990 (see Sect. 3.4.2). However, it should be mentioned here that further analyses and validation are required to assess the stability of the SARAH-3 data record for other regions and periods.
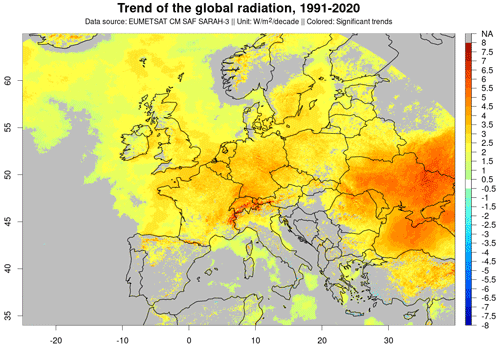
Figure 18 shows the trends of the SARAH-3 surface irradiance (also called global radiation) for the climate normal period (1991–2020), focusing on Europe. The climate normal period was chosen in order to foster comparability; further, the 1980s with reduced data quality in satellite and station data are avoided when using the WMO climate normal period. Pixels are only coloured in the case where the trend is statistically significant. The trend and the significance values are derived using the “trend” function from the CM SAF R Toolbox (Kothe et al., 2019). A trend for pixels is considered to be significantly positive (negative) if the 95 % confidence interval of the slope of the linear trend (see Sect. 3.4.2 for details) is completely positive (negative). For Europe, there are significant positive trends of surface irradiance given by SARAH-3 over the period 1991–2020. The strongest positive trends are located in central and eastern Europe, with trends in the range of 2–5 W m−2 per decade. Also, parts of the European Alps stand out, with large significantly positive trends of up to 7 W m−2 per decade. There, the snow detection by the HelSnow algorithm might impact the estimated trend, resulting in an overestimation of the trend (see also Sect. 3.2). There are almost no significant negative trends of surface irradiance in Europe for the period 1991–2020.
The data record DOI for SARAH-3 is https://doi.org/10.5676/EUM_SAF_CM/SARAH/V003 (Pfeifroth et al., 2023). The data and the associated documentation (scientific references, algorithm theoretical basis documents, validation reports and user manuals) are available through the following link: https://doi.org/10.5676/EUM_SAF_CM/SARAH/V003 (Pfeifroth et al., 2023).
All intellectual property rights of the CM SAF SARAH-3 products belong to EUMETSAT. The use of these products is granted to every interested user free of charge. If you wish to use these products, EUMETSAT's copyright credit must be shown by displaying the words “copyright (year) EUMETSAT” on each of the products used.
SARAH-3 is the new version of the satellite-based surface solar radiation climate data record (released in May 2023) of the EUMETSAT Satellite Application Facility on Climate Monitoring. SARAH-3 has provided data since 1983 (i.e. for more than 40 years) with a spatial resolution of 0.05° and a temporal resolution of up to 30 min for Europe, Africa and parts of South America as well as for parts of the Atlantic and Indian oceans. SARAH-3 includes seven parameters (see Table 1), including surface irradiance, surface direct radiation parameters, sunshine duration, PAR and DAL, which are new parameters in SARAH-3. The main improvement in SARAH-3 is the surface solar radiation estimation in the presence of snow cover, which is derived internally by the HelSnow algorithm. Further, several auxiliary data are updated, including the surface albedo, which now has a spatial resolution comparable to the SARAH-3 data themselves. The SARAH-3 data record and all other data records released by the CM SAF are available free of charge via the CM SAF Web User Interface (https://www.wui.cmsaf.eu, last access: 8 November 2024) in NetCDF format.
The algorithm used to generate SARAH-3 has been subject to continuous developments since the first release of a Meteosat-based surface radiation data record by the CM SAF, while the basic algorithmic approach (i.e. a Heliosat-based retrieval) has been unchanged. The improved auxiliary data have also contributed to improved final data products, e.g. through the usage of daily ERA5 atmospheric background fields, instead of monthly ERA-Interim data. The new snow detection by HelSnow leads to improved accuracy and reduced biases, especially in the case of snow cover and clear-sky conditions (see Sect. 3.2).
The validation (see Sect. 3) shows that SARAH-3 offers high-quality climate data; the uncertainty of the data increases with increasing temporal resolutions. The validation of the SARAH-3 direct solar radiation parameters shows higher differences for the surface reference measurements than for the surface irradiance (called global radiation). For the latter, the mean absolute differences between the SARAH-3 data and surface reference measurements are about 5 and 11 W m−2 for monthly and daily averages, respectively. Note that these measures include the uncertainties of the surface measurements and are impacted by the difficulty of comparing point measurements to grid box averages. An important validation measure for climate data records is also the ability to detect and quantify anomalies, which is measured by the anomaly correlation. For SARAH-3 the corresponding correlation coefficients are between 0.84 and 0.98, documenting the ability to use the SARAH-3 data for climate monitoring applications (see Sect. 4.2).
The stability of SARAH-3 has been found to be high and further improved relative to its predecessor. The comparison with long-term surface reference measurements in Europe from GEBA revealed that there is a small negative trend in the time series of the bias between SARAH-3 and surface reference data of about −0.6 W m−2 per decade for surface irradiance for the period 1983–2020. Further, trends in the European Alps are likely overestimated by SARAH-3 when considering the full time series of the data record (1983 onwards). The reason for this trend overestimation is the reduced quality of the snow detection by HelSnow for the early years of the data record. For the climate normal period 1991–2020 and onwards, this issue is strongly reduced, and hence the stability in the Alpine region is improved from the 1990s onwards. The 1991 Pinatubo volcanic eruption likely led to an overestimation of the surface solar radiation and sunshine duration during that period of enhanced aerosol loading in the stratosphere.
In Sect. 4, some example applications of the SARAH-3 data record are shown. The climatology of a certain parameter gives insights into the spatial distributions of the respective parameters, which is useful for many applications. For the first time, the current SARAH climate data record covers the current climate normal period 1991–2020. In addition, the availability of instantaneous (30 min), daily, monthly and ICDR data, which operationally extends the data record, allows a wide range of applications of the SARAH-3 climate data record, including climate monitoring (see Fig. 17) and climate analyses. The interpretation, however, of long-term trends should be done with care, since such trends are strongly influenced by anomalies at the beginning and end of the time series considered. The validation results of SARAH-3 show that the data can be used for trend analysis with reasonable confidence. The linear trend of the SARAH-3 global radiation for 1991–2020 in Europe is overall positive, which is in line with surface observations (see Fig. 15).
Future developments of the CM SAF SARAH data record will include the transition from the Meteosat-only setup to the inclusion of other geostationary satellite orbits to provide the data at an improved spatial coverage. The combination of such a data record, e.g. SARAH-GEO, with a data record based on polar-orbiting satellites, e.g. the CM SAF CLARA data record, allows the generation of a multi-satellite, multi-platform global data record.
With its numerous surface solar radiation parameters, high-quality long time series, high spatial and temporal resolution and high timeliness (∼ 2 d), the freely available SARAH-3 data record continues to serve users in many fields of research and operation. In case of questions or inquiries regarding the SARAH-3 data (or any other CM SAF data), the CM SAF User Help Desk is available via contact.cmsaf@dwd.de.
UP prepared the original manuscript with substantial contributions from JT. JD contributed to the data validation of sunshine duration. UP and JT developed and validated the surface radiation products. UP generated the data record, supported by SK and supervised by JT. MS and RH provided valuable comments and recommendations for the structure of the paper. All the authors contributed to the manuscript. All the authors contributed to the writing, reviewing and editing.
The contact author has declared that none of the authors has any competing interests.
Publisher’s note: Copernicus Publications remains neutral with regard to jurisdictional claims made in the text, published maps, institutional affiliations, or any other geographical representation in this paper. While Copernicus Publications makes every effort to include appropriate place names, the final responsibility lies with the authors.
The authors would like to thank Ruben Urraca for the cooperation on the quality control and usage of the Global Energy Balance Archive (GEBA) surface reference measurements. Further, we thank the World Radiation Monitoring Center's Baseline Surface Radiation Network (BSRN) and GEBA for providing surface reference data. GEBA is co-funded by the Federal Office of Meteorology and Climatology (MeteoSwiss) within the framework of GCOS Switzerland. We also thank Elmar Schömer and Kai Wirtz from Johannes Gutenberg University of Mainz for the HelSnow development.
This research has been supported by the European Organization for the Exploitation of Meteorological Satellites, funded by the EUMETSAT ground segment budget (Satellite Application Facilities).
This paper was edited by Di Tian and reviewed by two anonymous referees.
Alados, I., Foyo-Moreno, I. and Alados-Arboledas, L.: Photosynthetically active radiation: measurements and modelling, Agr. Forest Meteorol., 78, 121–131, 1995.
Alexandri, G., Georgoulias, A. K., Zanis, P., Katragkou, E., Tsikerdekis, A., Kourtidis, K., and Meleti, C.: On the ability of RegCM4 regional climate model to simulate surface solar radiation patterns over Europe: an assessment using satellite-based observations, Atmos. Chem. Phys., 15, 13195–13216, https://doi.org/10.5194/acp-15-13195-2015, 2015.
Antonanzas-Torres, F., Urraca, R., Polo, J., Perpiñán-Lamigueiro, O., and Escobar, R.: Clear sky solar irradiance models: A review of seventy models, Renew. Sust. Energ. Rev., 107, 374–387, https://doi.org/10.1016/j.rser.2019.02.032, 2019.
Bento, V., DaCamara, C. C., Trigo, I. F., Martins, J. P. A., and Duguay-Tetzlaff, A.: Improving Land Surface Temperature Retrievals over Mountainous Regions, Remote Sens., 9, 38, https://doi.org/10.3390/rs9010038, 2017.
Blanc, P., Gschwind, B., Ménard, L., and Wald, L.: Monthly-averaged maps of surface BRDF parameters in ten spectral bands for land and water masses, Earth Syst. Sci. Data Discuss. [preprint], https://doi.org/10.5194/essd-2017-141, 2018.
Cano, D., Monget, J., Albuisson, M., Guillard, H., Regas, N., and Wald, L.: A method for the determination of the global solar radiation from meteorological satellite data, Solar Energ., 37, 31–39, 1986.
Carpentieri, A., Folini, D., Wild, M., Vuilleumier, L., and Meyer, A.: Satellite-derived solar radiation for intra-hour and intra-day applications: Biases and uncertainties by season and altitude, Solar Energ., 255, 274–284, https://doi.org/10.1016/j.solener.2023.03.027, 2023.
Chen, S., Poll, S., Hendricks Franssen, H.-J., Heinrichs, H., Vereecken, H., and Goergen, K.: Convection-Permitting ICON-LAM Simulations for Renewable Energy Potential Estimates Over Southern Africa, J. Geophys. Res.-Atmos., 129, e2023JD039569, https://doi.org/10.1029/2023JD039569, 2024.
Cebulska, M., and Kholiavchuk, D.: Variability of meteorological droughts in the polish and the Ukrainian Carpathians, 1984–2015, Meteorol. Atmos. Phys., 134, 17, https://doi.org/10.1007/s00703-021-00853-7, 2022.
Copernicus Climate Change Service (C3S): European State of the Climate 2022, Full report, https://climate.copernicus.eu/ESOTC/2022 (lst access: 8 November 2024), 2023.
Diekmann, F. J., Happ, S., Rieland, M., Benesch, W., Czeplak, G., and Kasten, F.: An operational estimate of global solar irradiance at ground level from METEOSAT data: Results from 1985 to 1987, Meteorol. Runddsch., 41, 65–79, 1988.
Driemel, A., Augustine, J., Behrens, K., Colle, S., Cox, C., Cuevas-Agulló, E., Denn, F. M., Duprat, T., Fukuda, M., Grobe, H., Haeffelin, M., Hodges, G., Hyett, N., Ijima, O., Kallis, A., Knap, W., Kustov, V., Long, C. N., Longenecker, D., Lupi, A., Maturilli, M., Mimouni, M., Ntsangwane, L., Ogihara, H., Olano, X., Olefs, M., Omori, M., Passamani, L., Pereira, E. B., Schmithüsen, H., Schumacher, S., Sieger, R., Tamlyn, J., Vogt, R., Vuilleumier, L., Xia, X., Ohmura, A., and König-Langlo, G.: Baseline Surface Radiation Network (BSRN): structure and data description (1992–2017), Earth Syst. Sci. Data, 10, 1491–1501, https://doi.org/10.5194/essd-10-1491-2018, 2018.
Drücke, J., Borsche, M., James, P., Kaspar, F., Pfeifroth, U., Ahrens, B., and Trentmann, J.: Climatological analysis of solar and wind energy in Germany using the Grosswetterlagen classification, Renew. Energ., 164, 1254–1266, https://doi.org/10.1016/j.renene.2020.10.102, 2021.
Farnebäck, G.: Two-Frame Motion Estimation Based on Polynomial Expansion, in: Image Analysis, edited by: Bigun, J. and Gustavsson, T., SCIA 2003, Lecture Notes in Computer Science, vol. 2749, Springer, Berlin, Heidelberg, https://doi.org/10.1007/3-540-45103-X_50, 2003.
Forstinger, A., Wilbert, S., Jensen, A. R., Kraas, B., Fernandez Peruchena, C., Gueymard, C. A., Ronzio, D., Yang, D., Collino, E., Polo Martinez, J., Ruiz-Arias, J. A., Hanrieder, N., Blanc, P., and Saint-Drenant, Y.-M.: Worldwide Benchmark of Modelled Solar Irradiance Data, IEA PVPS, Task 16, Solar Resource for High Penetration and Large-Scale Applications, 2023.
Gautier, C., Diak, G., and Masse, S.: A Simple Physical Model to Estimate Incident Solar Radiation at the Surface from GOES Satellite Data, J. Appl. Meteorol. Clim., 19, 1005–1012, https://doi.org/10.1175/1520-0450(1980)019<1005:ASPMTE>2.0.CO;2, 1980.
Gava, M. L. L. M., Costa, S. M. S., and Porfírio, A. C. S.: Daily satellite-based sunshine duration estimates over Brazil: validation and intercomparison, Atmos. Meas. Tech., 16, 5429–5441, https://doi.org/10.5194/amt-16-5429-2023, 2023.
Hammer, A., Heinemann, D., Hoyer, C., Kuhlemann, R., Lorenz, E., Mueller, R., and Beyer, H.: Solar energy assessment using remote sensing technologies, Remote Sens. Environ., 86, 423–432, 2003.
Hartmann, D. L., Ramanathan, V., Berroir, A., and Hunt, G. E.: Earth Radiation Budget data and climate research, Rev. Geophys., 24, 1944–9208, https://doi.org/10.1029/RG024i002p00439, 1986.
Hörsch, J., Hofmann, F., Schlachtberger, D., and Brown, T.: PyPSA-Eur: An open optimisation model of the European transmission system, Energy Strateg. Rev., 22, 207–215, https://doi.org/10.1016/j.esr.2018.08.012, 2018.
Huang, G., Li, Z., Li, X., Liang, S., Yang, K., Wang, D., and Zhang, Y.: Estimating surface solar irradiance from satellites: Past, present, and future perspectives, Remote Sens. Environ., 233, 111371, https://doi.org/10.1016/j.rse.2019.111371, 2019.
Huld, T.: PVMAPS: Software tools and data for the estimation of solar radiation and photovoltaic module performance over large geographical areas, Solar Energ., 142, 171–181, https://doi.org/10.1016/j.solener.2016.12.014, 2017.
Husein, M., Moner-Girona, M., Falchetta, G., Stevanato, N., Fahl, F., and Szabó, S.: The impacts of incentive policies on improving private investment for rural electrification in Nigeria – A geospatial study, Heliyon, 10, e27440, https://doi.org/10.1016/j.heliyon.2024.e27440, 2024.
Ineichen, P.: A broadband simplified version of the Solis clear sky model, Solar Energ., 82, 758–762, https://doi.org/10.1016/j.solener.2008.02.009, 2008.
Inness, A., Baier, F., Benedetti, A., Bouarar, I., Chabrillat, S., Clark, H., Clerbaux, C., Coheur, P., Engelen, R. J., Errera, Q., Flemming, J., George, M., Granier, C., Hadji-Lazaro, J., Huijnen, V., Hurtmans, D., Jones, L., Kaiser, J. W., Kapsomenakis, J., Lefever, K., Leitão, J., Razinger, M., Richter, A., Schultz, M. G., Simmons, A. J., Suttie, M., Stein, O., Thépaut, J.-N., Thouret, V., Vrekoussis, M., Zerefos, C., and the MACC team: The MACC reanalysis: an 8 yr data set of atmospheric composition, Atmos. Chem. Phys., 13, 4073–4109, https://doi.org/10.5194/acp-13-4073-2013, 2013.
Jensen, A. R., Anderson, K. S., Holmgren, W. F., Mikofski, M. A., Hansen, C. W., Boeman, L. J., and Loonen, R.: pvlib iotools – Open-source Python functions for seamless access to solar irradiance data, Solar Energ., 266, 112092, https://doi.org/10.1016/j.solener.2023.112092, 2023.
Kakoulaki, G., Taylor, N., Szabo, S., Kenny, R., Chatzipanagi, A., and Jäger-Waldau, A.: Communication on the potential of applied PV in the European Union: Rooftops, reservoirs, roads (R3), EPJ Photovolt., 15, 8 pp., https://doi.org/10.1051/epjpv/2023035, 2024.
Karlsson, K.-G., Stengel, M., Meirink, J. F., Riihelä, A., Trentmann, J., Akkermans, T., Stein, D., Devasthale, A., Eliasson, S., Johansson, E., Håkansson, N., Solodovnik, I., Benas, N., Clerbaux, N., Selbach, N., Schröder, M., and Hollmann, R.: CLARA-A3: The third edition of the AVHRR-based CM SAF climate data record on clouds, radiation and surface albedo covering the period 1979 to 2023, Earth Syst. Sci. Data, 15, 4901–4926, https://doi.org/10.5194/essd-15-4901-2023, 2023.
Kaspar, F., Borsche, M., Pfeifroth, U., Trentmann, J., Drücke, J., and Becker, P.: A climatological assessment of balancing effects and shortfall risks of photovoltaics and wind energy in Germany and Europe, Adv. Sci. Res., 16, 119–128, https://doi.org/10.5194/asr-16-119-2019, 2019.
Kato, S., Ackerman, T., Mather, J., and Clothiaux, E.: The k-distribution method and correlated-k-approximation for short-wave radiative transfer model, J. Quant. Spectrosc. Ra., 62, 109–121, 1999.
Kenny, D. and Fiedler, S.: Which gridded irradiance data is best for modelling photovoltaic power production in Germany?, Sol. Energy, 232, 444–458, https://doi.org/10.1016/j.solener.2021.12.044, 2022.
Klein Tank, A. M. G., Wijngaard, J. B., Können, G. P., Böhm, R., Demaree, G., Gocheva, A., Mileta, M., Pashiardis, S., Hejkrlik, L., Kern-Hansen, C., Heino, R., Bessemoulin, P., Müller-Westermeier, G., Tzanakou, M., Szalai, S., Palsdottir, T., Fitzgerald, D., Rubin, S., Capaldo, M., Maugeri, M., Leitass, A., Bukantis, A., Aberfeld, R., Van Engelen, A. F. V., Forland, E., Mietus, M., Coelho, F., Mares, C., Razuvaev, V., Nieplova, E., Gegnar, T., Antonio Lopez, J., Dahlström, B., Moberg, A., Kirchhofer, W., Ceylan, A., Pachaliuk, O., Alexander, L. V., and Petrovic, P.: Daily dataset of 20th-century surface air temperature and precipitation series for the European Climate Assessment, Int. J. Climatol., 22, 1441–1453, 2002.
Kothe, S., Pfeifroth, U., Cremer, R., Trentmann, J., and Hollmann, R.: A Satellite-Based Sunshine Duration Climate Data Record for Europe and Africa, Remote Sens., 9, 429, https://doi.org/10.3390/rs9050429, 2017.
Kothe, S., Hollmann, R., Pfeifroth, U., Träger-Chatterjee, C., and Trentmann J.: The CM SAF R Toolbox – A Tool for the Easy Usage of Satellite-Based Climate Data in NetCDF Format, ISPRS Int. J. Geo-Inf., 8, 109, https://doi.org/10.3390/ijgi8030109, 2019.
Mabasa, B., Lysko, M. D., and Moloi, S. J.: Validating Hourly Satellite Based and Reanalysis Based Global Horizontal Irradiance Datasets over South Africa, Geomatics, 1, 429–449, https://doi.org/10.3390/geomatics1040025, 2021.
Mayer, B. and Kylling, A.: Technical note: The libRadtran software package for radiative transfer calculations – description and examples of use, Atmos. Chem. Phys., 5, 1855–1877, https://doi.org/10.5194/acp-5-1855-2005, 2005.
Montero-Martín, J., Antón, M., Vaquero-Martínez, J., and Sanchez-Lorenzo, A.: Comparison of long-term solar radiation trends from CM SAF satellite products with ground-based data at the Iberian Peninsula for the period 1985–2015, Atmos. Res., 236, 104839, https://doi.org/10.1016/j.atmosres.2019.104839, 2020.
Möser, W. and Raschke, E.: Incident solar radiation over Europe estimated from METEOSAT data, J. Clim. Appl. Meteorol., 23, 166–170, 1984.
Müller, R. and Pfeifroth, U.: Remote sensing of solar surface radiation – a reflection of concepts, applications and input data based on experience with the effective cloud albedo, Atmos. Meas. Tech., 15, 1537–1561, https://doi.org/10.5194/amt-15-1537-2022, 2022.
Mueller, R. W., Dagestad, K. F., Ineichen, P., Schroedter-Homscheidt, M., Cros, S., Dumortier, D., Kuhlemann, R., Olseth, J. A., Piernavieja, G., Reise, C., Wald, L., and Heinemann, D.: Rethinking satellite-based solar irradiance modelling: The SOLIS clear-sky module, Remote Sens. Environ., 91, 160–174, https://doi.org/10.1016/j.rse.2004.02.009, 2004.
Mueller, R., Matsoukas, C., Gratzki, A., Hollmann, R., and Behr, H.: The CM-SAF operational scheme for the satellite based retrieval of solar surface irradiance – A LUT based eigenvector hybrid approach, Remote Sens. Environ., 113, 1012–1022, 2009.
Mueller, R., Behrendt, T., Hammer, A., and Kemper, A.: A new algorithm for the satellite-based retrieval of solar surface irradiance in spectral bands, Remote Sens., 4, 622–647, https://doi.org/10.3390/rs4030622, 2012.
Mueller, R., Pfeifroth, U., and Traeger-Chatterjee, C.: Towards Optimal Aerosol Information for the Retrieval of Solar Surface Radiation Using Heliosat, Atmosphere, 6, 863–878, https://doi.org/10.3390/atmos6070863, 2015a.
Mueller, R., Pfeifroth, U., Traeger-Chatterjee, C., Trentmann, J., and Cremer, R.: Digging the METEOSAT Treasure – 3 Decades of Solar Surface Radiation, Remote Sens., 7, 8067–8101, https://doi.org/10.3390/rs70608067, 2015b.
Niermann, D., Borsche, M., Kaiser-Weiss, A., and Kaspar, F.: Evaluating renewable-energy-relevant parameters of COSMO-REA6 by comparison with satellite data, station observations and other reanalyses, Meteorol. Z., 28, 347–360, https://doi.org/10.1127/metz/2019/0945, 2019.
Obregón, A., Nitsche, H., Körber, M., Kreis, A., Bissolli, P., Friedrich, K., and Rösner, S.: Satellite-based climate information within the WMO RA VI Regional Climate Centre on Climate Monitoring, Adv. Sci. Res., 11, 25–33, https://doi.org/10.5194/asr-11-25-2014, 2014.
Ouhechou, A., Philippon, N., Morel, B., Trentmann, J., Graillet, A., Mariscal, A., and Nouvellon, Y.: Inter-comparison and validation against in-situ measurements of satellite estimates of incoming solar radiation for Central Africa: From the annual means to the diurnal cycles, Atmos. Res., 287, 106711, https://doi.org/10.1016/j.atmosres.2023.106711, 2023.
Pelosi, A., Belfiore, O. R., D'Urso, G., and Chirico, G. B.: Assessing Crop Water Requirement and Yield by Combining ERA5-Land Reanalysis Data with CM-SAF Satellite-Based Radiation Data and Sentinel-2 Satellite Imagery, Remote Sens., 14, 6233, https://doi.org/10.3390/rs14246233, 2022.
Pfeifroth, U., Sanchez-Lorenzo, A., Manara, V., Trentmann, J., and Hollmann, R.: Trends and variability of surface solar radiation in Europe based on surface- and satellite-based data records, J. Geophys. Res.-Atmos., 123, 1735–1754, https://doi.org/10.1002/2017JD027418, 2018a.
Pfeifroth, U., Bojanowski, J. S., Clerbaux, N., Manara, V., Sanchez-Lorenzo, A., Trentmann, J., Walawender, J. P., and Hollmann, R.: Satellite-based trends of solar radiation and cloud parameters in Europe, Adv. Sci. Res., 15, 31–37, https://doi.org/10.5194/asr-15-31-2018, 2018b.
Pfeifroth, U., Kothe, S., Drücke, J., Trentmann, J., Schröder, M., Selbach, N., and Hollmann, R.: Surface Radiation Data Set – Heliosat (SARAH) – Edition 3, Satellite Application Facility on Climate Monitoring [data set], https://doi.org/10.5676/EUM_SAF_CM/SARAH/V003, 2023.
Pinker, R. T. and Laszlo, I.: Modeling Surface Solar Irradiance for Satellite Applications on a Global Scale, J. Appl. Meteorol. Clim., 31, 194–211, https://doi.org/10.1175/1520-0450(1992)031<0194:MSSIFS>2.0.CO;2, 1992.
Posselt, R., Mueller, R., Stöckli, R., and Trentmann, J.: CM SAF Surface Radiation MVIRI Data Set 1.0 – Monthly Means/Daily Means/Hourly Means, Satellite Application Facility on Climate Monitoring [data set], https://doi.org/10.5676/EUM_SAF_CM/RAD_MVIRI/V001, 2011.
Ramanathan, V., Crutzen, P. J., Kiehl, J. T., and Rosenfeld, D.: Aerosols, climate, and the hydrological cycle, Science, 294, 2119–2124, https://doi.org/10.1126/science.1064034, 2001.
Rigollier, M., Levefre, M., and Wald, L.: The method Heliosat-2 for deriving shortwave solar radiation from satellite images, Solar Energ., 77, 159–169, 2004.
Roesch, A., Wild, M., Ohmura, A., Dutton, E. G., Long, C. N., and Zhang, T.: Assessment of BSRN radiation records for the computation of monthly means, Atmos. Meas. Tech., 4, 339–354, https://doi.org/10.5194/amt-4-339-2011, 2011.
Sander, L., Jung, C., and Schindler, D.: New concept of renewable energy priority zones for efficient onshore wind and solar expansion, Energ. Convers. Manage., 294, 117575, https://doi.org/10.1016/j.enconman.2023.117575, 2023.
Sawadogo, W., Bliefernicht, J., Fersch, B., Salack, S., Guug, S., Diallo, B., Ogunjobi, K. O., Nakoulma, G., Tanu, M., Meilinger, S., and Kunstmann, H.: Hourly global horizontal irradiance over West Africa: A case study of one-year satellite- and reanalysis-derived estimates vs. in situ measurements, Renew. Energ., 216, 119066, https://doi.org/10.1016/j.renene.2023.119066, 2023.
Schulz, J., Albert, P., Behr, H.-D., Caprion, D., Deneke, H., Dewitte, S., Dürr, B., Fuchs, P., Gratzki, A., Hechler, P., Hollmann, R., Johnston, S., Karlsson, K.-G., Manninen, T., Müller, R., Reuter, M., Riihelä, A., Roebeling, R., Selbach, N., Tetzlaff, A., Thomas, W., Werscheck, M., Wolters, E., and Zelenka, A.: Operational climate monitoring from space: the EUMETSAT Satellite Application Facility on Climate Monitoring (CM-SAF), Atmos. Chem. Phys., 9, 1687–1709, https://doi.org/10.5194/acp-9-1687-2009, 2009.
Schwarz, M., Folini, D., Hakuba, M. Z., and Wild, M.: From Point to Area: Worldwide Assessment of the Representativeness of Monthly Surface Solar Radiation Records, J. Geophys. Res.-Atmos., 123, 13857–13874, https://doi.org/10.1029/2018JD029169, 2018.
Skartveit, A., Olseth, J. A., and Tuft, M. A.: An Hourly Diffuse Fraction Model with Correction for Variability and Surface Albedo, Solar Energ., 63, 173–183, 1998.
Urraca, R., Gracia-Amillo, A. M., Huld, T., Martinez-de-Pison, F. J., Trentmann, J., Lindfors, A. V., Riihelä, A., and Sanz-Garcia, A.: Quality control of global solar radiation data with satellite-based products, Solar Energ., 158, 49–62, https://doi.org/10.1016/j.solener.2017.09.032, 2017.
Urraca, R., Sanz-Garcia, A., and Sanz-Garcia, I.: BQC: A free web service to quality control solar irradiance measurements across Europe, Solar Energ., 211, 1–10, https://doi.org/10.1016/j.solener.2020.09.055, 2020.
Urraca, R., Trentmann, J., Pfeifroth, U., and Gobron, N.: Can satellite products monitor solar brightening in Europe?, Remote Sens. Environ., 315, 114472, https://doi.org/10.1016/j.rse.2024.114472, 2024.
van den Besselaar, E. J. M., Sanchez-Lorenzo, A., Wild, M., Klein Tank, A. M. G., and de Laat, A. T. J.: Relationship between sunshine duration and temperature trends across Europe since the second half of the twentieth century, J. Geophys. Res.-Atmos., 120, 10823–10836, https://doi.org/10.1002/2015JD023640, 2015.
Vernay, C., Pitaval, S. and Blanc, P.: Review of satellite based surface solar irradiation databases for the engineering, the financing and the operating of photovoltaic systems, Enrgy Proced., 57, 1383–1391, 2014.
Vernier, J.-P., Thomason, L. W., Pommereau, J.-P., Bourassa, A., Pelon, J., Garnier, A., Hauchecorne, A., Blanot, L., Trepte, C., Degenstein, D., and Vargas, F.: Major influence of tropical volcanic eruptions on the stratospheric aerosol layer during the last decade, Geophys. Res. Lett., 38, L12807, https://doi.org/10.1029/2011GL047563, 2011.
Wild, M.: Enlightening Global Dimming and Brightening, B. Am. Meteorol. Soc., 93, 27–37, https://doi.org/10.1175/BAMS-D-11-00074.1, 2012.
Wild, M.: Decadal changes in radiative fluxes at land and ocean surfaces and their relevance for global warming, WIREs Clim. Change, 7, 91–107, https://doi.org/10.1002/wcc.372, 2016.
Wild, M., Folini, D., Schär, C., Loeb, N., Dutton, E. G., and König-Langlo, G.: The global energy balance from a surface perspective, Clim. Dynam., 40, 3107–3134, https://doi.org/10.1007/s00382-012-1569-8, 2013.
Wild, M., Ohmura, A., Schär, C., Müller, G., Folini, D., Schwarz, M., Hakuba, M. Z., and Sanchez-Lorenzo, A.: The Global Energy Balance Archive (GEBA) version 2017: a database for worldwide measured surface energy fluxes, Earth Syst. Sci. Data, 9, 601–613, https://doi.org/10.5194/essd-9-601-2017, 2017.
Yang, D. and Bright, J. M.: Worldwide validation of 8 satellite-derived and reanalysis solar radiation products: A preliminary evaluation and overall metrics for hourly data over 27 years, Solar Energ., 210, 3–19, https://doi.org/10.1016/j.solener.2020.04.016, 2020.


