the Creative Commons Attribution 4.0 License.
the Creative Commons Attribution 4.0 License.
Constructing a 22-year internal wave dataset for the northern South China Sea: spatiotemporal analysis using MODIS imagery and deep learning
Xudong Zhang
Xiaofeng Li
Internal waves (IWs) are an important ocean phenomenon facilitating energy transfer between multiscale ocean processes. Understanding such processes necessitates the collection and analysis of extensive observational data. IWs predominantly occur in marginal seas, with the South China Sea (SCS) being one of the most active regions, characterized by frequent and large-amplitude IW activities. In this study, we present a comprehensive IW dataset for the northern SCS (https://doi.org/10.12157/IOCAS.20240409.001, Zhang and Li, 2024), covering the area from 112.40 to 121.32° E and from 18.32 to 23.19° N, spanning the period from 2000 to 2022 with a 250 m spatial resolution. During the 22 years, a total of 15 830 MODIS images were downloaded for further processing. Out of these, 3085 high-resolution MODIS true-color images were identified to contain IW information and were included in the dataset with precise IW positions extracted using advanced deep learning techniques. IWs in the northern SCS are categorized into four regions based on extracted IW spatial distributions. This classification enables detailed analyses of IW characteristics, including their spatial and temporal distributions across the entire northern SCS and its specific sub-regions. Interestingly, our temporal analysis reveals characteristic “double-peak” patterns aligned with the lunar day, highlighting the strong connection between IWs and tidal cycles. Furthermore, our spatial analysis identifies two IW quiescent zones within the IW clusters influenced by underwater topography, highlighting regional variations in IW characteristics and suggesting underlying mechanisms which merit further investigation. There are also three gap regions between distinct IW clusters, which may indicate different IW sources. The constructed dataset holds significant potential for studying IW–environment interactions, developing monitoring and prediction models, validating numerical simulations, and serving as an educational resource to promote awareness and interest in IW research.
- Article
(8384 KB) - Full-text XML
- BibTeX
- EndNote
Oceanic internal waves (IWs) are prominent phenomena in marginal seas and continental shelf areas, characterized by their long-distance horizontal propagation and large amplitude within stratified waters (Haury et al., 1979; Magalhaes et al., 2020, 2022; Pan et al., 2007; Zhang et al., 2022; Zhao et al., 2014). Their significance lies in their role in transmitting energy between multiscale ocean processes and their critical impact on the ocean environment, acoustics, and underwater navigation (Jia et al., 2019; Ramp et al., 2022b). IWs manifest as either a periodic wave series with distinct amplitude and crest length or solitary solitons. While the IW crest length extends several hundreds of kilometers, their wavelength in the propagation direction spans only a few hundred meters to a few kilometers. Their isolated nature and infrequent occurrence make these waves difficult to capture. Understanding IWs requires extensive collection and analysis of observational data. Traditional methods using oceanographic instruments are costly, labor-intensive, and unsuitable for large-scale observations due to the submerged nature of IWs.
A viable solution to this challenge is offered by remote sensing techniques benefitting from repeated orbits, large spatial coverage, and cost efficiency (Li et al., 2008; Zhang et al., 2019). Over the past 20 years, the amount of satellite data has grown exponentially, enabling the construction of an IW dataset at a larger and longer scale. Active satellite sensors can detect the sea surface manifestations of IWs because the convergent and divergent motions they induce modulate the sea surface roughness (Alpers, 1985; Zheng et al., 2001), a predominant factor affecting the backscattering intensity of active microwave sensors, such as the synthetic aperture radar (SAR) (Furtney et al., 2024; Jia et al., 2018; Zhao et al., 2004). Passive satellite sensors, such as radiometers, can also detect the IW-induced sea surface roughness signatures by receiving sunlight reflected by the ocean surface (de Macedo et al., 2023; Hu et al., 2021; Sun et al., 2021). Because passive satellite sensors can provide images with higher temporal resolution, wider image swath, and free access, we mainly use passive satellite sensors for the investigation. For instance, since 2000, data with nearly daily global monitoring at a spatial resolution of 250 m have been provided by the Moderate-resolution Imaging Spectroradiometer (MODIS) on board the Aqua and Terra satellites, which is suitable for more in-depth IW investigation since it achieves the best possible balance between orbital duration and spatial coverage (de Macedo et al., 2023).
The advent of cloud computing platforms, such as the Earth Observation (EO) Browser from ESA, Worldview from NASA, and Google Earth Engine (GEE) from Google, have streamlined the repetitive and arduous image pre-processing steps (e.g., radiometric, atmospheric, and geometric corrections). Therefore, the primary challenge in constructing IW datasets is accurately detecting and obtaining the limited quasi-linear IW features dispersed across extensive satellite observations. Manually extracting the IW crest can reduce errors but significantly increase processing time. Consequently, researchers have developed automated tools to extract IW features from satellite observations. These tools typically employ conventional or semi-automated extraction methods, utilizing basic image processing techniques such as image segmentation and edge detection (Kurekin et al., 2020). However, edge detection algorithms often produce discontinuous edge pixels, which may not represent a complete IW crest. Meanwhile, image segmentation techniques struggle to establish consistent threshold values and require additional processing steps to detect boundary pixels.
In recent years, deep convolutional neural networks (DCNNs) have showcased their capacity in image pattern classification and have become a dependable tool for extracting accurate pixel-level targets from oceanic remote sensing imagery (Li et al., 2022, 2020; Liu et al., 2019; Wang and Li, 2023). Numerous machine learning techniques have been put forth for the automatic extraction of the IW crest from geostationary optical and spaceborne SAR imagery (Bao et al., 2019; Ma et al., 2023; Tao et al., 2022; Zheng et al., 2021). However, these studies have only been tested and validated on individual sensors and limited geographical areas with few images, making them insufficient for creating a comprehensive IW database over a long period. Recently, Zhang et al. (2023) developed the robust DCNN-based IWE-Net (IW extraction network) model for automatically extracting IW signatures from several satellite sensors with different spatial resolutions even in difficult imaging circumstances. Implementing IWE-Net allows for fast and accurate processing of a large volume of satellite images.
The northern South China Sea (SCS) serves as an exceptional natural laboratory for studying IWs of large amplitudes (Alford et al., 2015; Bai et al., 2017, 2014; Cai et al., 2012; Guo and Chen, 2014; Liang et al., 2019; Liu and Hsu, 2004; Ramp et al., 2022a). IW propagation characteristics, such as the reflection, refraction, and shoaling process, have been extensively studied in the literature. In addition to active IW activity, the northern SCS is influenced by circulation patterns, eddies, Kuroshio intrusion, and other dynamic processes, which can affect IW characteristics (Dong et al., 2016; Liu et al., 2014; Liu and Abernathey, 2023; Liu et al., 2022, 2016; Xu et al., 2020). Given the multiscale dynamics and active IW activity, a long-term IW dataset would enhance the study of these interactions. The purpose of this study is to utilize IWE-Net to extract IWs from the complete set of MODIS images spanning 22 years in the northern SCS. Following essential post-processing steps, we create a comprehensive and accessible IW dataset, providing valuable resources for research on various IW life stages and their interactions with surrounding dynamic processes.
The paper is organized as follows: Sect. 2 describes the satellite images and the deep learning model; Sect. 3 presents the results; Sect. 4 highlights the new findings from the constructed dataset; and Sect. 6 provides the conclusion and future outlooks.
2.1 MODIS imagery collection
The MODIS sensors, positioned at approximately 700 km in Sun-synchronous orbits, are on board NASA's Terra and Aqua satellites, launched in December 1999 and May 2002, respectively. These sensors provide near-daily global coverage, capturing imagery over a 2300 km wide swath with spatial resolutions ranging from 250 m to 1 km (bands 1 and 2 at 250 m, bands 3–7 at 500 m, and bands 8–36 at 1 km). MODIS data processing involves several steps, including data download, geometric correction, radiometric calibration, atmospheric correction, and re-projection.
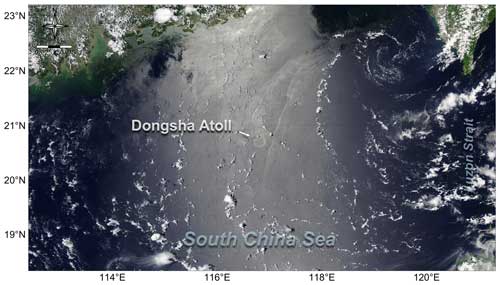
Figure 1True-color MODIS image captured by Aqua on 14 July 2021 showing IW signatures around Dongsha Atoll in the northern South China Sea.
Through an interactive browsing experience, users can explore global and full-resolution satellite images stored by the Global Imagery Browse Services (GIBS) system using NASA's Worldview (https://worldview.earthdata.nasa.gov/, last access: 5 November 2024). The MODIS corrected reflectance products (Fig. 1) use level 1B data (calibrated, geolocated radiances) to produce true-color images with three channels: red from band 1, green from band 4, and blue from band 3. This process also involves the removal of significant atmospheric effects, including Rayleigh scattering, to enhance the image quality. Worldview offers Terra MODIS products from 25 February 2000 and Aqua products from 4 July 2002. The target area covers 112.40–121.32° E and 18.32–23.19° N. We collected 15 830 MODIS true-color images from 2000 to 2022 as model input, with 8345 from Terra and 7485 from Aqua. All these images have a 250 m spatial resolution and are stored in a GeoTIFF format, which embeds geospatial information into image files.
2.2 Deep learning model
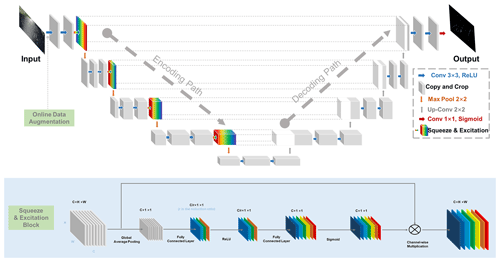
The deep learning model IWE-Net (Zhang et al., 2023) is designed to identify IW locations across a wide range of satellite imagery, including data from both optical and SAR sensors operating in Sun-synchronous and geostationary orbits with varying spatial resolutions. This model underwent training and testing using a dataset comprising 1115 satellite images, encompassing 116 full-swath Environmental Satellite (Envisat) advanced synthetic aperture radar (ASAR) images, 839 Terra/Aqua MODIS images, and 160 geostationary Himawari-8 Advanced Himawari Imager (AHI) images. All these satellite images have clear IW signatures in the SCS, Sulu Sea, and Celebes Sea. Three major improvements are incorporated into IWE-Net to increase its resilience and accuracy: squeeze and excitation blocks, online data augmentation, and Matthews correlation coefficient loss function, which takes into consideration the distinct properties of IW under various imaging techniques. The structure of the IWE-Net is presented in Fig. 2.
We employ pixel accuracy, precision, recall, and F1 score as metrics to evaluate the positional differences between the IW dataset and the ground truths. Pixel accuracy represents the proportion of the image's pixels that were properly classified. When there is a significant percentage of negative samples (non-IWs), such as in this task, pixel accuracy often approaches 1 and exhibits a limited responsiveness. Precision, recall, and F1 score are suitable metrics to evaluate the classifier's output quality when managing uneven classes. Precision reflects the proportion of the false IW pixels in the dataset, while recall indicates the proportion of the missed ones. The F1 score is the harmonic mean of these two metrics, balancing precision and recall. The testing set boasts an overall mean precision of 85.75 %, a recall of 85.67 %, and an F1 score of 85.71 %, demonstrating the model's accuracy in extracting IW signatures.
2.3 Post-processing
IWE-Net's performance in the SCS using MODIS images demonstrates an average precision of 87.90 %, indicating that around 12 % of the model's classifications are false positives. These inaccuracies are primarily due to a small subset of features resembling IWs, such as aircraft trails, linear and sparse clouds, and surface signals related to shallow water topography and plumes. These small-scale misclassifications, characterized by their varying shapes and orientations but consistent positions, can be readily eliminated manually, thus contributing to an overall improvement in the accuracy of this IW dataset. Since the model-produced IW locations are stored in longitude and latitude, users can do more post-processing procedures as needed.
2.4 Data records
This study generated two sets of data: true color MODIS imagery with observed IWs and corresponding IW positional information. All data have been archived and stored on the Zhang and Li (2024) repository at https://doi.org/10.12157/IOCAS.20240409.001.
2.4.1 MODIS IW imagery
The characteristics of the MODIS IW imagery are listed below.
- –
The repository is located at
https://doi.org/10.12157/IOCAS.20240409.001 (Zhang and Li, 2024). - –
The data format used is GeoTIFF. The GeoTIFF format is ideal for storing MODIS imagery of IWs as it embeds georeferencing information (WGS 84) directly into the file, ensuring accurate pixel-to-geography mapping. Its widespread compatibility with GIS platforms and robust support for large datasets make it a reliable choice for precise and versatile data handling.
- –
The file structure is as follows:
- ∘
-
All files follow the naming convention of MODIS_TrueColor_YYYY-MM-DD_SSS.tiff (where YYYY-MM-DD represents the acquisition date of the image and SSS represents the satellite, Terra or Aqua).
- ∘
-
The size of the image is 4061 (width) × 2218 (length) pixels.
- ∘
-
The ground pixel resolution is 250 m × 250 m.
- ∘
-
The data layers included are the red channel (band 1), with a data range of [0, 255]; green channel (band 4), with a data range of [0, 255]; and blue channel (band 3), with a data range of [0, 255].
- ∘
-
Georeferencing information (in the metadata) includes the projection system, image size, resolution, etc.
2.4.2 IW overlay information
The information on the IW overlay is listed below.
- –
The repository is located at
https://doi.org/10.12157/IOCAS.20240409.001 (Zhang and Li, 2024). - –
The data is in the form of a shapefile. This format excels in archiving IW position data due to its board compatibility with GIS software, enabling seamless interoperability and effective data dissemination. It supports advanced spatial analysis, preserves data integrity, and efficiently manages large datasets for quick and reliable access.
- –
The file structure is as follows:
- ∘
-
All files follow the naming convention of IW_YYYY-MM-DD.shp (where YYYY-MM-DD represents the date the IWs occurred).
- ∘
-
The column names (and data types) are longitude (float, with precision to four decimal places) and latitude (float, with precision to four decimal places).
IWE-Net is an end-to-end model where both input and output are images. It frames IW location extraction as a binary classification, with the output image containing only two values: 1 for IW presence and 0 for non-IW features. Figure 3 illustrates an example of the output and the corresponding input image acquired on 28 August 2002. The extraction results show that most of the IWs are concentrated around Dongsha Atoll, consistent with the distribution observed in previous studies. In addition, IWE-Net can also effectively identify IWs even in darker regions, as shown in the lower-left part of Fig. 3, far from the sun glint area and barely visible to the naked eye without image enhancement. It suggests that deep-learning-based extraction models can potentially exceed the accuracy of visual interpretation, especially when processing large datasets. Out of 15 830 input images, 3085 MODIS images containing IW signatures were identified.
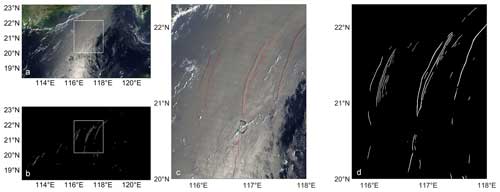
Figure 3An example of IWE-Net's output (b) alongside the original MODIS image (a) was acquired on 28 August 2002. Panels (c) and (d) show enlarged views of the regions highlighted by the white box in (a) and (b). The red lines in (c) correspond to the white lines in (d).
In Fig. 3, white points indicate values predicted to be 1 by the model, while black points represent predictions of 0, reflecting the precision of IW position detection. However, due to the complex imaging conditions of MODIS in the SCS, no standard IW products are available, and manual extraction remains the most accurate method. We created ground-truth maps based on visual interpretation labels to evaluate the model's performance. A new layer was added to the MODIS image for practical implementation to match the IW reference image size. IW locations were then marked with white lines on a black background.
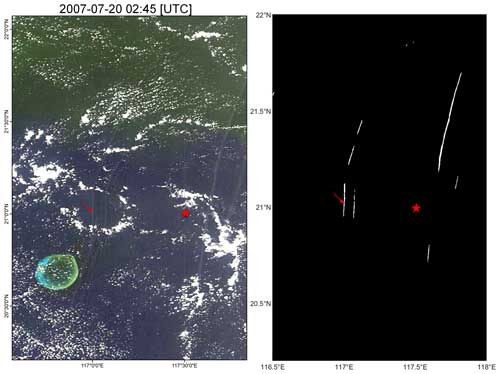
Figure 4The Terra MODIS image from July 2007 (left) and corresponding IW locations in the dataset (right). The red star marks the field observation site from Zhao et al. (2012), and the red arrow points to the IW observed in the field study.
Figure 4 illustrates an example of IW detection using a MODIS image captured on 20 July 2007 at 02:45 UTC alongside field observations detailed by Zhao et al. (2012). The red star marks the locations of the field observations, while the red arrow indicates the IW observed in these field studies. According to Zhao et al. (2012), the IW had several tens of meters in amplitude and vertical wave-induced currents exceeding 0.5 m s−1 (see Fig. 3 in their work). This IW was effectively detected through field observations and subsequently captured by the Terra MODIS imager approximately 7 h later. The near-synchronous detection of IWs from satellite imagery and field observations provides strong validation for the accuracy of the applied model and produced dataset.
4.1 IW spatial distributions in the northern SCS
We superimpose the IWE-Net-produced IW crest lines using MODIS images from 2000 to 2022 in Fig. 5. The spatial resolution of the superimposed map is 250 m, which is the same as the input MODIS image. Most IWs are concentrated around Dongsha Atoll, with four distinct clusters in deep and shallow ocean areas. More IWs are generally found in continental shelf regions than in the deep ocean, and their distribution closely aligns with the topographic features.
As shown in Fig. 5, we divided the detected IW locations into four regions, 1–4, which cover the area from 112.5 to 114.2° E and from 18.5 to 20.9° N, from 114.2 to 118.1° E and from 19.5 to 22.2° N, from 118.1 to 120.0° E and from 22.0 to 23.0° N, and from 118.1 to 120.5° E and from 19.5 to 22.0° N. The division was based on the geometry of IW crests, indicating different sources for regions 1 and 3 and various life stages of IWs before and after IWs propagate from the deep ocean to the continental shelf areas in regions 2 and 4. IWs in regions 1, 2, and 4 mainly propagate westward, while those in region 3 propagate southward, suggesting different IW generation sources. More IWs are observed in region 2 than in region 4 because the IWs in region 4 are primarily solitons. As these solitons move into the shallower waters of region 2, where the depth is above 1000 m, they break into multiple IW packets (Li et al., 2013; Ramp et al., 2022b). In addition, the existence of Dongsha Atoll causes IW reflection or refraction, complicating the IW characteristic (Jia et al., 2018; Li et al., 2013). The IW wave crests in region 1 do not always align with IWs in regions 2 and 4, indicating different IW generation sources or mechanisms.
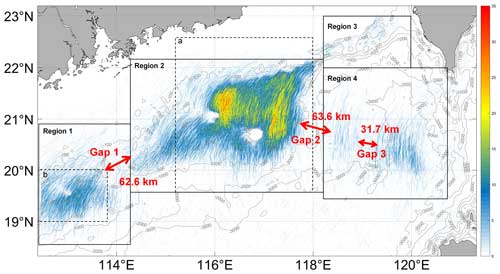
Figure 5Overlay of IW detection results from MODIS images (2000–2022). Colors represent the frequency of IW observations at each location. The map resolution is 250 m, matching the input MODIS image resolution. Two dashed boxes indicate the locations of the enlarged view (boxes a and b) shown in Fig. 9. Three gaps between different IW clusters and the corresponding spatial distances are labeled with red annotations.
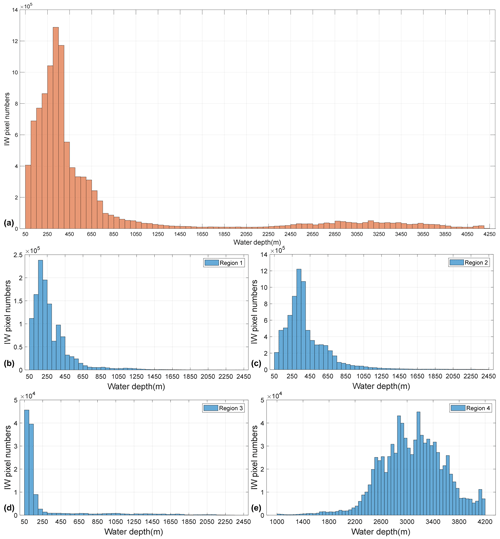
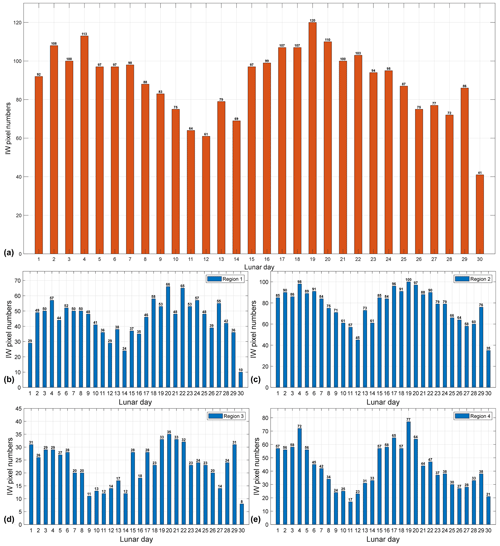
Figure 6Histograms showing the number of IW pixels versus water depth for (a) the entire northern SCS (orange) and (b–e) the four regions highlighted in Fig. 4 (blue).
Underwater topography significantly influences IW evolution. Figure 6 illustrates IW distribution relative to water depth, indicating a prevalence of IWs in open-ocean areas with depths under 1000 m. Interestingly, there are more IWs at depths of 3000 than 2000 m, hinting at an IW evolution mechanism that warrants further study. In regions 2 and 4 (Fig. 4), the distribution of IW clusters corresponds to specific depth characteristics. Region 1 has IWs concentrated at depths above 600 m despite a total depth range of 100 to 2000 m. In region 2, most IWs occur at depths under 1000 m, closely following contours between 100 and 1000 m. In region 2, most IWs occur at depths under 1000 m, closely following contours between 100 and 1000 m. Region 3 sees IWs primarily at 100 m depths, with their presence decreasing as they move away from the continental shelf and disappearing beyond 2000 m. In region 4, IWs are mostly found between 2600 and 3600 m, rarely occurring below 2000 m, reflecting a strong correlation between IW distribution and water depth.
4.2 IW temporal distributions and monthly variations
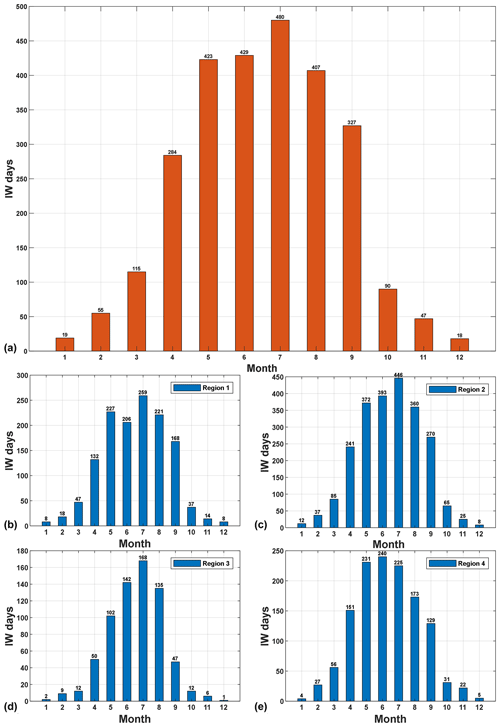
Stratification plays a crucial role in IW generation and propagation, with its seasonal variations in the northern SCS causing changes in IW distribution variation. Figure 7 shows that IW occurrences peak from May to August, with significantly fewer detections in other months. This temporal disparity underscores the influence of seasonal changes on the stratification and IW activity. Shallow mixed layer depths and intensified stratification during summer months promote IW activity, enhancing their generation and propagation across the northern SCS. Notably, in region 3, the distribution is more concentrated in July, suggesting that IWs in this area may require more stringent conditions for generation. In winter, intensified monsoon activity leads to deeper and weaker stratification, reducing the modulation of surface features and making conditions less favorable for IW generation and propagation, which results in fewer observed IWs. The four classified regions exhibit a similar trend to the entire northern SCS. These findings emphasize the seasonal modulation of stratification and its impact on IW dynamics. They reveal the complex interplay between atmospheric factors like monsoonal circulations and solar radiation in driving seasonal variations in IW activity within the northern SCS.
4.3 Lunar day influence on IW variations
The IW generation is closely linked to the astronomical tide, with tidal magnitude directly influencing the IW scale. Astronomical tides follow a fortnightly cycle, peaking on the 1st and 15th lunar days during spring tides. As a result, IW characteristics display fortnightly variations. Figure 8 shows these variations relative to the lunar day, revealing a typical double-peak distribution for IWs in the northern SCS. Peak IW occurrences occur approximately 4 d after the spring tide as it takes about 4 d for IWs to travel from the generation site, Luzon Strait, to the observational continental shelf regions before dissipating.
All four regions display a double-peak pattern linked to tidal dynamics. Regions 2 and 4 are the main channels for IW in the northern SCS, recording the highest number of IW observation days – 446 and 240 d, respectively. In contrast, region 3 exhibits the fewest IW observation days, with a maximum of just 35 d, suggesting that the generation and propagation of IWs are less favorable in this region. Region 4 exhibits sharper and more defined peaks due to the dominance of IW solitons, whereas region 2 shows broader peaks typical of IW packet behavior. The shallower water in region 2 slows IW propagation speed compared to region 4, resulting in the wider peaks observed.
4.4 IW quiescent zones
Figure 5 shows two distinct blank areas in regions 1 and 2 within IW clusters. One area in region 2 covers the well-studied Dongsha Atoll, while the less-known area behind it has received minimal attention in previous research. These blank spaces signify limited or absent IW activity, delineating IW quiescent zones. Figure 9 reveals the presence of a chain of small underwater ridges situated in the northwest direction of Dongsha Atoll. As two black arrows indicate, these ridges correspond to a series of IW quiescent zones. The unique underwater topography contributes to forming IW quiescent zones within the northern SCS.
The IW quiescent zones adjacent to Dongsha Atoll extend approximately 110 km towards the continental shelf area, with water depths above 100 m. Conversely, the IW quiescent zones in region 1 are comparatively smaller, characterized by conspicuous underwater ridges aligned along the direction of IW propagation. These underwater ridges segregate IW crests, with subsequent reconnection occurring at 112.7° E.
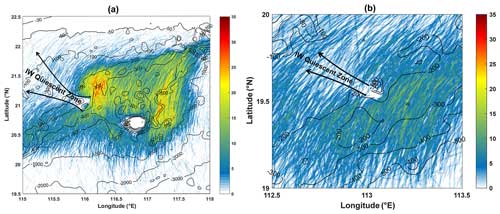
Figure 9IW quiescent zones (black arrows) within IW clusters in region 2 (a) and region 1 (b). The locations correspond to two dashed boxes in Fig. 5.
IWs exhibit a widespread distribution across the northern SCS, yet noticeable gaps (gaps 1–3) between distinct IW clusters are evident. Figure 5 shows two IW gap zones, gaps 2 and 3, in regions 2 and 4, separated by 31.7 and 63.6 km. The occurrence of gap 2 and gap 3 is due to the solitonic nature of IWs, which have fast phase speeds of over 3.0 m s−1. The fast propagation of IWs and the observation gaps between two daily MODIS snapshots likely cause gaps 2 and 3. Additionally, gap 1, a 62.6 km gap, is clearly observed between regions 1 and 2, where the differing orientations of IW wave crests suggest distinct IW generation sources. Notably, IW crests show discontinuous features between regions 2 and 3, coinciding with abrupt underwater topography and small underwater ridges. As a result, IWs originating from different sources undergo separate evolution processes and fail to connect.
The internal wave dataset can be freely downloaded from https://doi.org/10.12157/IOCAS.20240409.001 (Zhang and Li, 2024).
In this study, we have constructed a comprehensive oceanic IW dataset spanning 2000 to 2022 by applying the deep-learning-based IWE-Net model to MODIS satellite imagery. The model accurately extracts IW locations, providing precise longitude and latitude coordinates of IS crests, which were then compiled into the shapefile format for easy access and analysis.
The generated IW dataset potentially advances our understanding of IW characteristics in the northern SCS. Primarily, we gain insights into the region's prevalent locations and seasonal variations in IW activity by analyzing the spatial and temporal distributions of IWs based on the collected MODIS images. This dataset also provides valuable information for studying the interactions between IWs and mesoscale ocean phenomena, such as eddies, facilitating further investigations into ocean dynamics (Li et al., 2016; Xie et al., 2016). Cyclonic and anticyclonic mesoscale eddies can cause vertical fluctuations in ocean temperature isopleths and generate accompanying currents, influencing IW characteristics such as amplitude and propagation direction. We can examine IW characteristic changes after passing through different eddy types by analyzing the IW spatial and temporal information provided in this dataset. Additionally, other dynamic ocean phenomena, such as the intrusion of the Kuroshio Current, also affect the generation and propagation of IWs in the SCS. Analyzing the statistical characteristics of IWs across different seasons and years can enhance understanding of how dynamic phenomena like the Kuroshio Current affect the IW behavior, thereby advancing the study of multiscale dynamic interactions in the SCS.
Moreover, the availability of this extensive IW dataset is crucial for advancing artificial intelligence oceanography studies (Li et al., 2022; Wang and Li, 2023). It serves as valuable ground-truth data for validating IW generation or forecast models, allowing researchers to assess the performance of AI models by comparing their predictions with the IW locations in the dataset. The dataset can also be used to validate numerical simulations (Gong et al., 2023), enabling researchers to refine and improve these numerical models based on observed IW distributions. It can also serve as a benchmark for collaborative observations of IWs in the SCS with other satellite sensors or field campaigns, thereby facilitating the construction of matched datasets to support IW research with artificial intelligence technologies.
It is important to recognize that the constructed IW dataset has two main sources of error. First, while optical imagery can capture most IW features, weather conditions such as clouds and rain can obstruct MODIS imagery, preventing the detection of IWs even when they are present. Second, the uneven coverage and gaps between polar-orbiting satellites' orbits can lead to missed IW detections in the model's results. Future efforts should consider adding additional satellite sensors, especially SAR imagery, to improve the comprehensiveness of the IW dataset.
Overall, the IW dataset presented in this paper is a valuable resource for oceanography, aiding in studying IW dynamics, validating AI models, and refining numerical simulations. This dataset is expected to stimulate further research and advancements in understanding the complex dynamics of oceanic IWs. Mooring observations offer vertical structural information on IWs. By integrating this dataset with mooring observation data and applying artificial intelligence technology, researchers can extend from two-dimensional sea surface information to a three-dimensional understanding of IW structure.
XZ and XL designed the research. XZ developed the datasets. XZ and XL contributed to the analysis of the results and the writing of the paper.
The contact author has declared that neither of the authors has any competing interests.
Publisher's note: Copernicus Publications remains neutral with regard to jurisdictional claims made in the text, published maps, institutional affiliations, or any other geographical representation in this paper. While Copernicus Publications makes every effort to include appropriate place names, the final responsibility lies with the authors.
All MODIS images were downloaded from the NASA Worldview application (https://worldview.earthdata.nasa.gov, last access: 5 November 2024), part of the NASA Earth Observing System Data and Information System (EOSDIS).
Xudong Zhang was funded by the National Natural Science Foundation of China Shandong Joint Fund (grant no. U2006211), the Innovative Research Group Project of the National Natural Science Foundation of China (grant no. 42221005), and the National Natural Science Foundation of China (grant no. 41906157).
This paper was edited by Alberto Ribotti and reviewed by Tongya Liu and one anonymous referee.
Alford, M. H., Peacock, T., MacKinnon, J. A., Nash, J. D., Buijsman, M. C., Centurioni, L. R., Chao, S. Y., Chang, M. H., Farmer, D. M., Fringer, O. B., Fu, K. H., Gallacher, P. C., Graber, H. C., Helfrich, K. R., Jachec, S. M., Jackson, C. R., Klymak, J. M., Ko, D. S., Jan, S., Johnston, T. M., Legg, S., Lee, I. H., Lien, R. C., Mercier, M. J., Moum, J. N., Musgrave, R., Park, J. H., Pickering, A. I., Pinkel, R., Rainville, L., Ramp, S. R., Rudnick, D. L., Sarkar, S., Scotti, A., Simmons, H. L., St Laurent, L. C., Venayagamoorthy, S. K., Wang, Y. H., Wang, J., Yang, Y. J., Paluszkiewicz, T., and Tang, T. Y.: The formation and fate of internal waves in the South China Sea, Nature, 521, 65–69, https://doi.org/10.1038/nature14399, 2015.
Alpers, W.: Theory of radar imaging of internal waves, Nature, 314, 245–247, 1985.
Bai, X., Liu, Z., Li, X., and Hu, J.: Generation sites of internal solitary waves in the southern Taiwan Strait revealed by MODIS true-colour image observations, Int. J. Remote Sens., 35, 4086–4098, https://doi.org/10.1080/01431161.2014.916453, 2014.
Bai, X., Li, X., Lamb, K. G., and Hu, J.: Internal Solitary Wave Reflection Near Dongsha Atoll, the South China Sea, J. Geophys. Res.-Oceans, 122, 7978–7991, https://doi.org/10.1002/2017jc012880, 2017.
Bao, S., Meng, J., Sun, L., and Liu, Y.: Detection of ocean internal waves based on Faster R-CNN in SAR images, J. Oceanol. Limnol., 38, 55–63, https://doi.org/10.1007/s00343-019-9028-6, 2019.
Cai, S., Xie, J., and He, J.: An Overview of Internal Solitary Waves in the South China Sea, Surv. Geophys., 33, 927–943, https://doi.org/10.1007/s10712-012-9176-0, 2012.
de Macedo, C. R., Koch-Larrouy, A., da Silva, J. C. B., Magalhães, J. M., Lentini, C. A. D., Tran, T. K., Rosa, M. C. B., and Vantrepotte, V.: Spatial and temporal variability in mode-1 and mode-2 internal solitary waves from MODIS-Terra sun glint off the Amazon shelf, Ocean Sci., 19, 1357–1374, https://doi.org/10.5194/os-19-1357-2023, 2023.
Dong, D., Yang, X. F., Li, X. F., and Li, Z. W.: SAR Observation of Eddy-Induced Mode-2 Internal Solitary Waves in the South China Sea, IEEE T. Geosci. Remote, 54, 6674–6686, https://doi.org/10.1109/Tgrs.2016.2587752, 2016.
Furtney, S., Romeiser, R., and Graber, H. C.: Automated retrieval of internal wave phase speed and direction from pairs of SAR images with different look directions, Remote Sens. Environ., 305, 114084, https://doi.org/10.1016/j.rse.2024.114084, 2024.
Gong, Y., Chen, X., Xu, J., Xie, J., Chen, Z., He, Y., and Cai, S.: An internal solitary wave forecasting model in the northern South China Sea (ISWFM-NSCS), Geosci. Model Dev., 16, 2851–2871, https://doi.org/10.5194/gmd-16-2851-2023, 2023.
Guo, C. and Chen, X.: A review of internal solitary wave dynamics in the northern South China Sea, Prog. Oceanogr., 121, 7–23, https://doi.org/10.1016/j.pocean.2013.04.002, 2014.
Haury, L. R., Briscoe, M. G., and Orr, M. H.: Tidally generated internal wave packets in Massachusetts Bay, Nature, 278, 312–317, https://doi.org/10.1038/278312a0, 1979.
Hu, B. L., Meng, J. M., Sun, L. N., and Zhang, H.: A Study on Brightness Reversal of Internal Waves in the Celebes Sea Using Himawari-8 Images, Remote Sens., 13, 3831, https://doi.org/10.3390/Rs13193831, 2021.
Jia, T., Liang, J. J., Li, X. M., and Sha, J.: SAR Observation and Numerical Simulation of Internal Solitary Wave Refraction and Reconnection Behind the Dongsha Atoll, J. Geophys. Res.-Oceans, 123, 74–89, https://doi.org/10.1002/2017jc013389, 2018.
Jia, Y., Tian, Z., Shi, X., Liu, J. P., Chen, J., Liu, X., Ye, R., Ren, Z., and Tian, J.: Deep-sea sediment resuspension by internal solitary waves in the northern South China Sea, Sci. Rep., 9, 12137, https://doi.org/10.1038/s41598-019-47886-y, 2019.
Kurekin, A. A., Land, P. E., and Miller, P. I.: Internal Waves at the UK Continental Shelf: Automatic Mapping Using the ENVISAT ASAR Sensor, Remote Sens., 12, 2476, https://doi.org/10.3390/rs12152476, 2020.
Li, Q., Wang, B., Chen, X., Chen, X., and Park, J. H.: Variability of nonlinear internal waves in the South China Sea affected by the Kuroshio and mesoscale eddies, J. Geophys. Res.-Oceans, 121, 2098–2118, https://doi.org/10.1002/2015jc011134, 2016.
Li, X., Zhao, Z., and Pichel, W. G.: Internal solitary waves in the northwestern South China Sea inferred from satellite images, Geophys. Res. Lett., 35, L13605, https://doi.org/10.1029/2008gl034272, 2008.
Li, X., Jackson, C. R., and Pichel, W. G.: Internal solitary wave refraction at Dongsha Atoll, South China Sea, Geophys. Res. Lett., 40, 3128–3132, https://doi.org/10.1002/grl.50614, 2013.
Li, X., Zhou, Y., and Wang, F.: Advanced Information Mining from Ocean Remote Sensing Imagery with Deep Learning, J. Remote Sens., 2022, 1–4, https://doi.org/10.34133/2022/9849645, 2022.
Li, X. F., Liu, B., Zheng, G., Ren, Y. B., Zhang, S. S., Liu, Y. J., Gao, L., Liu, Y. H., Zhang, B., and Wang, F.: Deep-learning-based information mining from ocean remote-sensing imagery, Natl. Sci. Rev., 7, 1584–1605, https://doi.org/10.1093/nsr/nwaa047, 2020.
Liang, J., Li, X.-M., Sha, J., Jia, T., and Ren, Y.: The Lifecycle of Nonlinear Internal Waves in the Northwestern South China Sea, J. Phys. Oceanogr., 49, 2133–2145, https://doi.org/10.1175/jpo-d-18-0231.1, 2019.
Liu, A. K. and Hsu, M. K.: Internal wave study in the South China Sea using Synthetic Aperture Radar (SAR), Int. J. Remote Sens., 25, 1261–1264, https://doi.org/10.1080/01431160310001592148, 2004.
Liu, B., Yang, H., Zhao, Z., and Li, X.: Internal solitary wave propagation observed by tandem satellites, Geophys. Res. Lett., 41, 2077–2085, https://doi.org/10.1002/2014GL059281, 2014.
Liu, B., Li, X., and Zheng, G.: Coastal inundation mapping from bitemporal and dual-polarization SAR imagery based on deep convolutional neural networks, J. Geophys. Res.-Oceans, 124, 9101–9113, https://doi.org/10.1029/2019jc015577, 2019.
Liu, T. and Abernathey, R.: A global Lagrangian eddy dataset based on satellite altimetry, Earth Syst. Sci. Data, 15, 1765–1778, https://doi.org/10.5194/essd-15-1765-2023, 2023.
Liu, T. Y., Xu, J. X., He, Y. H., Lü, H. B., Yao, Y., and Cai, S. Q.: Numerical simulation of the Kuroshio intrusion into the South China Sea by a passive tracer, Acta Oceanol. Sin., 35, 1–12, https://doi.org/10.1007/s13131-016-0930-x, 2016.
Liu, T. Y., He, Y. H., Zhai, X. M., and Liu, X. H.: Diagnostics of Coherent Eddy Transport in the South China Sea Based on Satellite Observations, Remote Sens., 14, 14071690, https://doi.org/10.3390/rs14071690, 2022.
Ma, Y. T., Meng, J. M., Sun, L. N., and Ren, P.: Oceanic Internal Wave Signature Extraction in the Sulu Sea by a Pixel Attention U-Net: PAU-Net, IEEE Geosci. Remote Sens. Lett., 20, 4000905, https://doi.org/10.1109/Lgrs.2022.3230086, 2023.
Magalhaes, J. M., da Silva, J. C. B., and Buijsman, M. C.: Long lived second mode internal solitary waves in the Andaman Sea, Sci. Rep., 10, 10234, https://doi.org/10.1038/s41598-020-66335-9, 2020.
Magalhaes, J. M., da Silva, J. C. B., Nolasco, R., Dubert, J., and Oliveira, P. B.: Short timescale variability in large-amplitude internal waves on the western Portuguese shelf, Cont. Shelf Res., 246, 104812, https://doi.org/10.1016/j.csr.2022.104812, 2022.
Pan, J., Jay, D. A., and Orton, P. M.: Analyses of internal solitary waves generated at the Columbia River plume front using SAR imagery, J. Geophys. Res.-Oceans, 112, C07014, https://doi.org/10.1029/2006jc003688, 2007.
Ramp, S. R., Yang, Y. J., Chiu, C.-S., Reeder, D. B., and Bahr, F. L.: Observations of shoaling internal wave transformation over a gentle slope in the South China Sea, Nonlin. Processes Geophys., 29, 279–299, https://doi.org/10.5194/npg-29-279-2022, 2022a.
Ramp, S. R., Yang, Y. J., Jan, S., Chang, M. H., Davis, K. A., Sinnett, G., Bahr, F. L., Reeder, D. B., Ko, D. S., and Pawlak, G.: Solitary waves impinging on an Isolated tropical reef: arrival patterns and wave transformation under shoaling, J. Geophys. Res.-Oceans, 127, e2021JC017781, https://doi.org/10.1029/2021jc017781, 2022b.
Sun, L., Zhang, J., and Meng, J.: Study on the propagation velocity of internal solitary waves in the Andaman Sea using Terra/Aqua-MODIS remote sensing images, J. Oceanol. Limnol., 39, 2195–2208, https://doi.org/10.1007/s00343-020-0280-6, 2021.
Tao, M., Xu, C., Guo, L., Wang, X., and Xu, Y.: An Internal Waves Data Set From Sentinel-1 Synthetic Aperture Radar Imagery and Preliminary Detection, Earth Space Sci., 9, e2022EA002528, https://doi.org/10.1029/2022EA002528, 2022.
Wang, H. and Li, X.: DeepBlue: Advanced convolutional neural network applications for ocean remote sensing, IEEE Geosci. Remote Sen. Mag., 12, 138–161, https://doi.org/10.1109/MGRS.2023.3343623, 2023.
Xie, J., He, Y., Lü, H., Chen, Z., Xu, J., and Cai, S.: Distortion and broadening of internal solitary wavefront in the northeastern South China Sea deep basin, Geophys. Res. Lett., 43, 7617–7624, https://doi.org/10.1002/2016gl070093, 2016.
Xu, J., He, Y., Chen, Z., Zhan, H., Wu, Y., Xie, J., Shang, X., Ning, D., Fang, W., and Cai, S.: Observations of different effects of an anti-cyclonic eddy on internal solitary waves in the South China Sea, Prog. Oceanogr., 188, 102422, https://doi.org/10.1016/j.pocean.2020.102422, 2020.
Zhang, M., Wang, J., Chen, X., Mei, Y., and Zhang, X.: An experimental study on the characteristic pattern of internal solitary waves in optical remote-sensing images, Int. J. Remote Sens., 40, 7017–7032, https://doi.org/10.1080/01431161.2019.1597308, 2019.
Zhang, S., Li, X., and Zhang, X.: Internal Wave Signature Extraction from SAR and Optical Satellite Imagery Based on Deep Learning, IEEE T. Geosci. Remote, 61, 1-16, https://doi.org/10.1109/TGRS.2023.3258189, 2023.
Zhang, X. and Li, X.: Deep Learning-Derived Long-Term Dataset of Internal Waves in the Northern South China Sea from Satellite Imagery, Marine Science Data Center of the Chinese Academy of Sciences [data set], https://doi.org/10.12157/IOCAS.20240409.001, 2024.
Zhang, X., Wang, H., Wang, S., Liu, Y., Yu, W., Wang, J., Xu, Q., and Li, X.: Oceanic internal wave amplitude retrieval from satellite images based on a data-driven transfer learning model, Remote Sens. Environ., 272, 112940, https://doi.org/10.1016/j.rse.2022.112940, 2022.
Zhao, W., Huang, X., and Tian, J.: A new method to estimate phase speed and vertical velocity of internal solitary waves in the South China Sea, J. Oceanogr., 68, 761–769, https://doi.org/10.1007/s10872-012-0132-x, 2012.
Zhao, Z., Klemas, V., Zheng, Q., Li, X., and Yan, X.: Estimating parameters of a two-layer stratified ocean from polarity conversion of internal solitary waves observed in satellite SAR images, Remote Sens. Environ., 92, 276–287, https://doi.org/10.1016/j.rse.2004.05.014, 2004.
Zhao, Z., Liu, B., and Li, X.: Internal solitary waves in the China seas observed using satellite remote-sensing techniques: a review and perspectives, Int. J. Remote Sens., 35, 3926–3946, https://doi.org/10.1080/01431161.2014.916442, 2014.
Zheng, Q., Yuan, Y., Klemas, V., and Yan, X.-H.: Theoretical expression for an ocean internal soliton synthetic aperture radar image and determination of the soliton characteristic half width, J. Geophys. Res.-Oceans, 106, 31415–31423, https://doi.org/10.1029/2000jc000726, 2001.
Zheng, Y. G., Zhang, H. S., and Wang, Y. Q.: Stripe detection and recognition of oceanic internal waves from synthetic aperture radar based on support vector machine and feature fusion, Int. J. Remote Sens., 42, 6710–6728, https://doi.org/10.1080/01431161.2021.1943040, 2021.


