the Creative Commons Attribution 4.0 License.
the Creative Commons Attribution 4.0 License.
VODCA v2: multi-sensor, multi-frequency vegetation optical depth data for long-term canopy dynamics and biomass monitoring
Ruxandra-Maria Zotta
Leander Moesinger
Robin van der Schalie
Mariette Vreugdenhil
Wolfgang Preimesberger
Thomas Frederikse
Richard de Jeu
Wouter Dorigo
Vegetation optical depth (VOD) is a model-based indicator of the total water content stored in the vegetation canopy derived from microwave Earth observations. As such, it is related to vegetation density, abundance, and above-ground biomass (AGB). Moesinger et al. (2020) introduced the global microwave VOD Climate Archive (VODCA v1), which harmonises VOD retrievals from several individual sensors into three long-term, multi-sensor VOD products in the C, X, and Ku frequency bands, respectively. VODCA v1 was the first VOD dataset spanning over 30 years of observations, thus allowing the monitoring of long-term changes in vegetation. Several studies have used VODCA in applications such as phenology analysis; drought monitoring; gross primary productivity monitoring; and the modelling of land evapotranspiration, live fuel moisture, and ecosystem resilience.
This paper presents VODCA v2, which incorporates several methodological improvements compared to the first version and adds two new VOD datasets to the VODCA product suite. The VODCA v2 products are computed with a novel weighted merging scheme based on first-order autocorrelation of the input datasets. The first new dataset merges observations from multiple sensors in the C-, X-, and Ku-band frequencies into a multi-frequency VODCA CXKu product indicative of upper canopy dynamics. VODCA CXKu provides daily observations in a 0.25° resolution for the period 1987–2021. The second addition is an L-band product (VODCA L), based on the Soil Moisture and Ocean Salinity (SMOS) and Soil Moisture Active Passive (SMAP) missions, which in theory is more sensitive to the entire canopy, including branches and trunks. VODCA L covers the period 2010–2021 and has a temporal resolution of 10 d and a spatial resolution of 0.25°. The sensitivity of VODCA CXKu to the upper vegetation layer and that of VODCA L to above-ground biomass (AGB) are analysed using independent vegetation datasets.
VODCA CXKu exhibits lower random error levels and improved temporal sampling compared to VODCA v1 single-frequency products. It provides complementary spatio-temporal information to optical vegetation indicators containing additional information on the state of the canopy. As such, VODCA CXKu shows moderate positive agreement in short vegetation (Spearman's R: 0.57) and broadleaf forests (Spearman's R: 0.49) with the fraction of absorbed photosynthetically active radiation from MODIS. VODCA CXKu also shows moderate agreement with the slope of the backscatter incidence angle relation of MetOp ASCAT in grassland (Spearman's R: 0.48) and cropland (Spearman's R: 0.46). Additionally, VODCA CXKu shows temporal patterns similar to the Normalized Microwave Reflection Index (NMRI) from in situ L-band GNSS measurements of the Plate Boundary Observatory (PBO) and sap flow measurements from SAPFLUXNET. VODCA L shows strong spatial agreement (Spearman's R: 0.86) and plausible temporal patterns with respect to yearly AGB maps from the Xu et al. (2021) dataset. VODCA v2 enables monitoring of plant water dynamics, stress, and biomass change and can provide insights, even into areas that are scarcely covered by optical data (i.e. due to cloud cover).
VODCA v2 is open-access and available at https://doi.org/10.48436/t74ty-tcx62 (Zotta et al., 2024).
- Article
(8742 KB) - Full-text XML
- BibTeX
- EndNote
Vegetation attenuates microwave radiation emitted or reflected by the Earth's surface. This attenuation can be quantified through a metric known as vegetation optical depth (VOD), which can be calculated from both passive and active microwave satellite observations (Vreugdenhil et al., 2016). Field studies have found that VOD is directly connected to vegetation water content (VWC) (Jackson and Schmugge, 1991; Sawada et al., 2015). VOD is influenced by various factors, including the density and relative moisture content of the vegetation, as well as the wavelength domain of the observations (Mo et al., 1982; Jackson and Schmugge, 1991; Kerr and Njoku, 1990; Owe et al., 2008). The sensitivity of VOD to the uppermost layer of vegetation increases with shorter measurement wavelengths (Tian et al., 2018; Konings et al., 2019). Consequently, spatial and temporal patterns observed at higher frequencies, such as those in the C-, X-, and Ku-bands, tend to agree more closely with dynamics in the upper canopy (Teubner et al., 2018; Schmidt et al., 2023). Similarly, dynamics observed at lower frequencies, like the P- and L-band, correspond more closely to those of overall above-ground biomass (AGB), including branches and trunks (Chaparro et al., 2019; Olivares-Cabello et al., 2021; Schmidt et al., 2023).
Compared to vegetation indicators in the optical domain, VOD offers distinct advantages, as it is unaffected by atmospheric conditions and the influence of solar illumination (Li et al., 2021). Due to its versatility, VOD has found utility in a wide range of applications, including monitoring drought and vegetation conditions (Van Dijk et al., 2013; Crocetti et al., 2020; Kumar et al., 2021; Moesinger et al., 2022; Vreugdenhil et al., 2022; Dorigo et al., 2021, 2022; Zotta et al., 2023), phenology analysis (Jones et al., 2011, 2014; Dannenberg et al., 2020), and biomass monitoring (Liu et al., 2015; Rodríguez-Fernández et al., 2018; Brandt et al., 2018; Fan et al., 2019; Mialon et al., 2020; Wigneron et al., 2021; Qin et al., 2021; Bousquet et al., 2021; Olivares-Cabello et al., 2021; Yang et al., 2022, 2023). It is also instrumental in estimating the likelihood of fire occurrence and monitoring fuel moisture (Forkel et al., 2017, 2019, 2023; Schmidt et al., 2023; Mukunga et al., 2023). VOD's applicability extends to crop yield assessment (Chaparro et al., 2018; Mateo-Sanchis et al., 2019) and prediction (Büechi et al., 2022). It has also been used to estimate gross primary production (Teubner et al., 2018, 2019, 2021; Wild et al., 2022) and to model land evapotranspiration (Martens et al., 2017). Furthermore, VOD contributes to the understanding of ecosystem resilience (Boulton et al., 2022; Smith et al., 2022, 2023) and aids in assessing vegetation responses to precipitation (Harris et al., 2022).
VOD has been derived from various satellite radiometers (Owe et al., 2008; Meesters et al., 2005; Konings et al., 2016; Wigneron et al., 2007) and scatterometers (Vreugdenhil et al., 2016; Liu et al., 2023). However, these sensors come with varying lifespans and exhibit distinctive characteristics depending on their observation frequencies, incidence angles, orbital characteristics, radiometric quality, and spatial coverage. To conduct long-term studies, merging data from multiple satellite sensors and addressing the systematic biases among them becomes necessary.
Moesinger et al. (2020) introduced the global long-term microwave VOD Climate Archive (VODCA v1) by combining VOD retrievals derived using the Land Parameter Retrieval Model (LPRM; Owe et al., 2008; Van der Schalie et al., 2017) from multiple passive sensors: the Special Sensor Microwave/Imager (SSM/I), the Microwave Imager on board the Tropical Rainfall Measuring Mission (TMI), the Advanced Microwave Scanning Radiometer – Earth Observing System (AMSR-E), WindSat, and the Advanced Microwave Scanning Radiometer 2 (AMSR2). VODCA v1 provides separate products for microwave observations in three different spectral frequency bands: the C-band (period 2002–2018), X-band (1997–2018), and Ku-band (1987–2017). This allows for preserving the unique sensitivity of the individual frequencies to the structural elements of the canopy. VODCA v1 harmonises the VOD observations by first scaling SSM/I, TMI, and WindSat to the climatology of AMSR-E VOD. AMSR2 VOD is scaled to TMI VOD (which in the first step was rescaled to AMSR-E) within the orbital coverage, i.e. within latitudes 38° N and S. Outside of this latitudinal range, AMSR2 is scaled to the last 3 years of AMSR-E VOD instead, even though the sensors have no temporal overlap. After scaling the sensor data, the temporally overlapping observations are fused by taking their average.
Although VODCA v1 is a state-of-the-art dataset for long-term analysis, it also faces several limitations (Tagesson et al., 2021): a notable constraint lies in the approach used for merging AMSR2 VOD data. The scaling approach described above has resulted in a spatial break in trends, specifically in North America at 35° N (Moesinger et al., 2020). Additionally, averaging temporally overlapping observations without considering their individual quality characteristics (i.e. through “unweighted averaging”) equally weighs high-quality and noisy observations, e.g. those affected by residual radio frequency interference (RFI). Furthermore, even though the single-frequency products provided by VODCA v1 retain the unique response to vegetation characteristics of each band, they have different lifespans, with only VODCA v1 Ku-band covering 30 years of data, thus being the only product to fulfil the World Meteorological Organization standard period for calculating climate normals (World Meteorological Organization, 2017). Moreover, the single-frequency products have occasional observation gaps related to the observation wavelength. Given that all three VODCA frequencies, despite their small differences in sensitivity, represent the upper vegetation layer (Moesinger et al., 2020, 2022; Wild et al., 2022), combining them would lead to an improved temporal sampling. Thus, the resulting product could be a robust alternative for studying long-term canopy dynamics. Moreover, VODCA v1 does not include a product in the L-band frequency, which has shown to be useful for many purposes, most importantly for monitoring AGB (Rodríguez-Fernández et al., 2018).
Therefore, to complement VODCA v1, we introduce two new datasets, hereafter referred to as VODCA v2. First, we present the methodological improvements compared to the previous version, including a new merging approach. Second, we introduce a multi-frequency merged product of unprecedented coverage (34 years), named VODCA CXKu, with lower random error levels and better temporal and spatial coverage than the single-frequency products. Third, we introduce an L-band product (VODCA L) obtained by merging LPRM-derived VOD observations from the Soil Moisture and Ocean Salinity (SMOS) and the Soil Moisture Active Passive (SMAP) missions covering the period 2010–2021. VODCA v2 does not encompass an update of the single-frequency C-, X-, and Ku products, as the novel merging methodology presented in this paper particularly affects the merging of multiple frequencies, which have their specific sensitivities to noise. To evaluate the new data records and assess which ecosystem canopy dynamics are represented by VODCA CXKu, we compare it to other satellite and in situ variables. We use the fraction of absorbed photosynthetically active radiation (FAPAR) derived from optical remote sensing because, theoretically, there is a strong link between plant water status and the capacity of vegetation canopies to intercept solar radiation (Cammalleri et al., 2022). We also use the slope of the backscatter incidence angle relation of MetOp ASCAT (Vreugdenhil et al., 2016). This radar observable is sensitive to vegetation water content and fresh biomass (Steele-Dunne et al., 2019; Petchiappan et al., 2022). Additionally, we use two ground-based vegetation datasets: Normalized Microwave Reflection Index (NMRI) measurements obtained from GPS reflectometry and sap flow observations from the SAPFLUXNET network. We evaluate the temporal and spatial sensitivity of VODCA L to biomass using yearly AGB maps. We conclude the paper by discussing the strengths and limitations of the products as well as potential future improvements.
2.1 Vegetation optical depth datasets
2.1.1 The Land Parameter Retrieval Model (LPRM)
VODCA v2 uses VOD datasets produced by Planet Labs in the framework of the European Space Agency Climate Change Initiative (CCI) (https://climate.esa.int/en/projects/soil-moisture/, last access: 10 January 2024) and the Copernicus Climate Change Service (C3S) (https://climate.copernicus.eu/, last access: 10 January 2024). For C-, X- and Ku-band frequencies, these datasets are derived from passive microwave radiometer data through LPRM v7, in the case of L-band through LPRM v6.2 (Dorigo et al., 2023). These are the algorithm versions used in the ESA CCI Soil Moisture v08.1 (Dorigo et al., 2023). LPRM is based on the radiative transfer model (RTM) proposed by Mo et al. (1982) and simultaneously retrieves soil moisture and VOD (Meesters et al., 2005) from V- and H-polarised microwave observations. LPRM distinguishes itself from other retrieval algorithms (e.g. Jackson, 1993; Mladenova et al., 2014; Konings et al., 2016) by its applicability to a wide range of frequencies (i.e. 1–20 GHz) and by using an analytical solution proposed by Meesters et al. (2005) for the derivation of VOD. Additionally, LPRM uses a frequency-dependent parametrisation independent of land cover and is thus unconstrained by any ancillary vegetation data (Van der Schalie et al., 2017). LPRM uses land surface temperature (LST) data derived from Ka-band observations (Holmes et al., 2009) for the C-, X-, and Ku-band sensors. For the L-band sensors, LST is derived from an intercalibrated dataset based on six passive microwave sensors, as described in van der Schalie et al. (2021).
2.1.2 Passive microwave sensor data
The passive microwave sensors used in VODCA v2 are presented in Fig. 1 and Table 1. The sensors newly introduced with this version are the Special Sensor Microwave Imager (SSM/I) F17, the Global Precipitation Measurement (GPM) Microwave Imager (GMI), and the Soil Moisture and Ocean Salinity (SMOS) Microwave Imaging Radiometer using Aperture Synthesis (MIRAS) and Soil Moisture Active Passive (SMAP) radiometer (Van der Schalie et al., 2017). Only nighttime retrievals are used since they are proven to have a lower temperature-related error than daytime retrievals (Owe et al., 2008).
The Special Sensor Microwave/Imager (SSM/I) is carried on board a series of DMSP (Defence Meteorological Satellite Program) satellites. Out of the seven frequencies used by SSM/I to take global measurements (Wentz, 1997), we use daily Ku-band retrievals from F08, F11, F13, and F17 spanning June 1987 to April 2015. To ensure consistency between the SSM/I sensors, VOD observations are retrieved from brightness temperature (Tb) data from the intercalibrated Fundamental Climate Data Record (FCDR) of Tb (Berg et al., 2016, 2018; Berg, 2021).
The Tropical Rainfall Measuring Mission (TRMM) Microwave Imager (TMI) has a non-polar orbit between 35° N and S, leading to increased coverage and varying overpass times in that region. TMI provides measurements in nine frequencies, of which we use the X-band (10.7 GHz) and Ku-band (19.4 GHz) (Kummerow et al., 1998).
The Advanced Microwave Scanning Radiometer – Earth Observing System (AMSR-E) on board the EOS Aqua (NASA) satellite provided global measurements between 19 June 2002 and 27 September 2011. Measurements are available in six frequencies, of which we use the C-band (6.9 GHz), X-band (10.7 GHz), and Ku-band (18.7 GHz) (Kawanishi et al., 2003; Knowles et al., 2006).
Table 1Specifications of the VODCA v2 input sensors. AECT shows the local ascending equatorial crossing times (local time), while DECT shows the local descending equatorial crossing times.
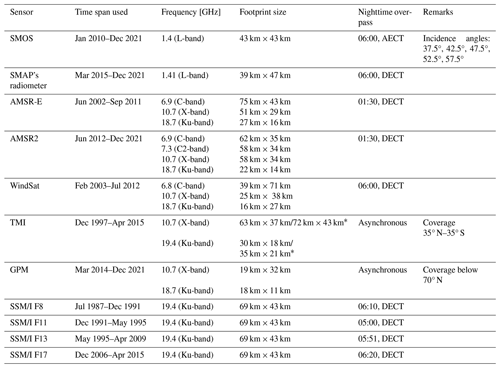
* The second set of footprints shown for TMI results from the altitude boosting, which happened in 2001, from 350 to 400 km.
WindSat on board Coriolis is a multi-frequency polarimetric microwave radiometer developed by the Naval Research Laboratory. It has been in an 840 km sun-synchronous orbit since January 2003 and provides global measurements in five frequencies, of which we use the C- (6.8 GHz), X- (10.7 GHz), and Ku-band (18.7 GHz) (Gaiser et al., 2004). Even though WindSat is still operational, we did not use data past July 2012 due to restricted access.
The Advanced Microwave Radiometer 2 (AMSR2) on board GCOM-W (Global Change Observation Mission – Water) initiated by JAXA (Japan Aerospace Exploration Agency) is the follow-on instrument of AMSR-E installed on Aqua. AMSR2 provides daily measurements in six frequencies, similar to AMSR-E, between 7 GHz and 89 GHz, of which we use the C- (6.9 GHz), X- (10.7 GHz), and Ku-band (18.7 GHz). Compared to AMSR-E, it incorporates a second C-band channel (C2) at 7.3 GHz aimed at mitigating the radio frequency interference (RFI) of 6.9 GHz (Meier et al., 2018).
GPM is a follow-up mission of TRMM initiated by NASA and JAXA and includes a consortium of international partners whose microwave sensors constitute the GPM constellation. The GPM core observatory, launched on 27 February 2014, carries the GPM microwave imager (GMI), which provides daily measurements in 10–183 GHz, of which we use the X- (10.65 GHz) and Ku-band (18.7 GHz). The GPM has a non-polar orbit and provides global coverage, except for latitudes higher than 70° (Draper et al., 2015).
The SMOS mission is ESA's second Earth Explorer mission and was launched in November 2009. SMOS carries the Microwave Imaging Radiometer with Aperture Synthesis (MIRAS), which is an interferometric L-band (1.4 GHz) 2-D radiometer that takes measurements for multiple incidence angles between 0–65°. The observations have a temporal resolution of 2 to 3 d (Kerr et al., 2010). Although SMOS operates in a protected band (1400–1427 MHz), RFI affects observations in many areas of the world (Oliva et al., 2012).
The SMAP mission, designed to map soil moisture and determine freeze–thaw state, was launched in January 2015. It carries an L-band radiometer (1.41 GHz) that takes observations at an incidence angle of 40°. SMAP's radiometer has a temporal resolution of 2 to 3 d (Entekhabi et al., 2010).
2.2 Ancillary data
ERA5-Land is a global land surface reanalysis dataset, which provides hourly output starting in 1981, with a 9 km spatial resolution (Muñoz-Sabater et al., 2021). We use ERA5-Land upper soil temperature (stl1; 0–7 cm; Muñoz-Sabater et al., 2021) to mask VOD observations recorded whenever the soil temperature was below 275.15 K (2 °C). Observations under frozen conditions are not used because the dielectric properties of water change drastically. ERA5-Land stl1 is used in addition to the internal flagging coming with LPRM, which makes use of the K-, Ku, and Ka-bands to detect frozen conditions (van der Vliet et al., 2020).
2.3 Evaluation data
2.3.1 MODIS FAPAR
To evaluate the plausibility of temporal patterns of VODCA CXKu, we used the fraction of absorbed photosynthetic radiation (FAPAR) derived from the Moderate-resolution Imaging Spectroradiometer (MODIS) on board the Terra and Aqua satellites (https://doi.org/10.5067/MODIS/MCD15A2H.061, Myneni and Park, 2021). FAPAR is a biophysical variable that represents the fraction of radiation in the range of 400–700 nm that is absorbed by the green elements of the vegetation canopy for photosynthesis (Myneni et al., 2002) and is expressed as a non-dimensional value. FAPAR is a fundamental quantity related to the photosynthetic processes of plants, making it a pivotal indicator of the intensity of the terrestrial carbon cycle (Mason et al., 2010). Changes in VOD and FAPAR are expected to correlate because high VWC means more leaf tissue, which leads to more photosynthesis and, therefore, to higher FAPAR. Moreover, we expect agreement between the vegetation indicators because plant water status significantly influences a canopy's ability to intercept solar radiation (Osakabe et al., 2014). Both VOD and FAPAR have been widely used for vegetation condition monitoring. To match the VODCA dataset, we aggregated the native 500 m FAPAR data to the VODCA grid by taking the average. We use FAPAR data from February to August 2020. For the analyses using FAPAR, VODCA CXKu has been averaged to 8-daily observations to match its temporal resolution.
2.3.2 ASCAT slope
We compare the temporal patterns of VODCA CXKu with active microwave remote sensing data from the ASCAT scatterometer on board the MetOp satellites. The instruments measure vertically polarised backscatter at incidence angles between 25 and 65° recorded at a 5.25 GHz frequency (C-band). ASCAT slope, derived using the TU Wien Soil Moisture Retrieval algorithm (Hahn et al., 2017), is a parameter of the second-order Taylor polynomial used to describe the incidence angle dependence of backscatter. The slope is sensitive to scattering mechanisms, where surface scattering leads to a steep slope, and volume scattering causes scattering in all directions, thus leading to a flatter slope. With increasing vegetation density, the volume scattering increases, and the slope flattens (Vreugdenhil et al., 2020). It has been shown that the slope is correlated with vegetation density (Hahn et al., 2017; Vreugdenhil et al., 2017), above-ground fresh biomass (Steele-Dunne et al., 2019), and vegetation phenology and water status (Pfeil et al., 2020; Petchiappan et al., 2022), similar to VOD. These studies also outline the importance of further research to overcome the limited understanding of the spatio-temporal dynamics of the slope parameter. As such, ASCAT slope is a relatively young parameter that has not yet been fully understood but can potentially offer valuable insight into vegetation water dynamics across a diverse range of biomes. Therefore, comparing VODCA with ASCAT slope serves more as a mutual evaluation of patterns, driven by similar vegetation properties, and less as a validation of the VODCA dataset. We argue that it is beneficial to provide such a comparison because ASCAT slope is also derived from microwave remote sensing and uses radar observations. Therefore, it is an entirely independent dataset.
The ASCAT slope dataset used in this study is calculated from the EUMETSAT MetOp-A ASCAT SZR Level 1b Fundamental Climate Data Record, which was preprocessed as described in Hahn et al. (2017). A dynamic slope is calculated from ASCAT backscatter and incidence angle using the method developed by Melzer (2013) and demonstrated by Hahn et al. (2017). This method yields slope values for each day based on an Epanechnikov kernel with a half-width window of 21 d. We use data only from MetOp-A, for 2007 to 2021, on descending overpass with 9:30 (local) overpass time. This time is considered advantageous from a plant physiology point of view because the impact of dew should be less than at pre-dawn values (Steele-Dunne et al., 2019). We resampled the ASCAT slope dataset to match the VODCA grid by averaging all points within a VODCA grid cell. For the analysis involving ASCAT slope, ASCAT data and VODCA CXKu observations have been aggregated to 8-daily values to allow comparison with the results for FAPAR.
2.3.3 PBO network NMRI
We use the Plate Boundary Observatory (PBO) Normalized Microwave Reflection Index (NMRI) dataset (Larson and Small, 2014) for the period 2008 to 2016 to assess temporal VOD dynamics. NMRI is a metric related to VWC, calculated using the interference between direct and reflected GPS signals, transmitted at a frequency of 1.5 GHz (L-band). Daily NMRI is available for over 300 sites in the western United States and Alaska. The footprint of these measurements covers an area of at least 1000 m2. The PBO sites are mostly installed on grassland and shrubland, while having limited representation in regions with higher biomass. NMRI was already used in vegetation monitoring studies complementary to optical-based products, such as the normalised difference vegetation index (NDVI; Evans et al., 2014; Small et al., 2018). In addition, phenological parameters derived from PBO NMRI were compared with those obtained from AMSR-E Ku-band VOD, which indicated broad regional agreement despite the large differences in relative footprint sizes and microwave frequency (Jones et al., 2014). Due to data gaps in the short (9 years) time series caused by freezing conditions and RFI, we aggregate daily NMRI and VOD to monthly values by taking the median before calculating anomalies. We use loess decomposition (Cleveland et al., 1990) to obtain anomalies. We did not use PBO stations within VODCA grid cells with an open-water fraction of over 50 %. This resulted in a selection of 296 stations.
2.3.4 SAPFLUXNET sap flow
We use in situ sap flow data from SAPFLUXNET (SFN 0.1.5, https://doi.org/10.5281/zenodo.3971689, Poyatos et al., 2021), the first global database of plant-level sap flow measurements, to assess the temporal patterns of VODCA CXKu in respect to plant transpiration. Sap flow sensors measure the transpiration flow in stems, branches, and trunks as the ascent of sap within xylem tissues (Vandegehuchte and Steppe, 2013). VOD is directly related to leaf water potential (Konings and Gentine, 2017) and also to transpiration as it represents the non-linear response of vegetation to soil drying (Martens et al., 2017). Therefore, we expect a clear connection between VOD and sap flow.
For each site, SAPFLUXNET contains half-hourly tree-level sap flow for different trees, accompanied by tree metadata, site information, and hydro-meteorological data. We use the method proposed by Bittencourt et al. (2023) for preprocessing sap flow data from tree level to satellite footprint level. This includes (1) removing the stations that have less than 6 months of data, (2) filtering out nighttime data (sun altitude < 0°), (3) averaging the data from hourly to daily sap flow for each tree, (4) standardising the daily average sap flow per tree by calculating Z scores, and (5) averaging trees per site and thus scaling the temporal variability from tree level to site level. Bittencourt et al. (2023) argue that Z scores remove the differences in absolute values across sites while preserving information on temporal variability. After preprocessing, 98 SAPFLUXNET stations remain. To analyse if VODCA CXKu manages to capture events of low, median, and high transpiration, we extract the VOD data at the SAPFLUXNET sites and take the monthly 5th, 50th, and 95th percentile from both VOD and sap flow. Following this step, we standardise the VOD and sap flow percentiles with Z scores so that the variability in sap flow and transpiration is now in the same range.
2.3.5 AGB
We use the dynamic above-ground biomass dataset by Xu et al. (2021) to assess the VODCA L spatial and temporal patterns. Xu AGB provides yearly global maps for the period 2000–2019, with a spatial resolution of 10 × 10 km2, derived by applying the method developed by Saatchi et al. (2011) using a consistent set of satellite images. For this purpose, time series of microwave (QuickSat) and optical (MODIS) satellite imagery are used in a machine learning framework trained against ground inventory plots, airborne lidar, and spaceborne lidar data from the Geoscience Laser Altimeter System (GLAS) on board the Ice, Cloud, and land Elevation Satellite (ICESat). The maps give AGB estimates in Mg ha−1.
Various studies highlighted the sensitivity of VOD to AGB (e.g. Liu et al., 2015; Rodríguez-Fernández et al., 2018; Mialon et al., 2020; Frappart et al., 2020; Schmidt et al., 2023), emphasising stronger agreement of L-band VOD to AGB compared to Ku-, X-, and C-bands, especially in densely vegetated areas, such as forests. Recent studies (Qin et al., 2021; Dou et al., 2023) have shown that the annual 95th percentile of the daily observations is more sensitive to inter-annual biomass change than other aggregating metrics, likely because it manages to minimise the annual changes in the dielectric properties of vegetation caused by water stress. Moreover, Dou et al. (2023) have shown that nighttime observations are more suitable than daytime observations for estimating decadal (10-yearly) biomass carbon dynamics.
To analyse the sensitivity of VODCA L to AGB, we aggregate VODCA L to yearly 95th percentiles, calculated from 10-daily median VOD, to match the AGB temporal resolution and also to reduce the water-related seasonal phenology (Dou et al., 2023). The Xu AGB maps are resampled to match the VODCA grid by taking the average observations within a 0.25° cell.
2.3.6 SMOS-IC VOD
To assess if the spatial change patterns of VODCA L are a result of natural variability, we use SMOS-IC VOD v2 (Wigneron et al., 2021; Li et al., 2021, 2022, 2020), produced by INRAE (Institut National de Recherche Agronomiques) Bordeaux Soil Moisture and VOD Products and made available at https://ib.remote-sensing.inrae.fr/ (last access: 12 January 2024). SMOS-IC uses the L-band Microwave Emission of the Biosphere (L-MEB) model to derive VOD and soil moisture from SMOS Tb (Wigneron et al., 2021). V2 employs an improved optimisation process that considers a priori information on VOD over a period of 10 d for each retrieval (Li et al., 2020). SMOS-IC provides daily data in the global EASE (Equal-Area Scalable Earth) Grid version 2 with a sampling resolution of 25 km.
To analyse the change in spatial patterns of SMOS-IC VOD compared to VODCA L, we resample it to match the VODCA grid using nearest-neighbour interpolation and aggregate it to yearly maps.
2.3.7 ESA CCI Landcover
We use the ESA CCI Landcover v2 (available at https://maps.elie.ucl.ac.be/CCI/viewer/, last access: 12 January 2024) for the epoch 2010 to analyse VOD characteristics per land cover (LC) type. The LC map provided at 300 m resolution has been derived by combining MERIS surface reflectance data acquired during 2008–2012 and ground observations (CCI, 2017). We resampled and projected the map onto a common 0.25° grid using the majority class according to the CCI-LC User Tool (CCI, 2017). We aggregated the LC classes to bare soil, sparse vegetation, grassland, cropland, shrubs, broadleaf deciduous forest (BDF), broadleaf evergreen forest (BEF), needle-leaf evergreen forest (NEF), needle-leaf deciduous forest (NDF), and mixed forest (MF) to enable better visualisation (Fig. A1).
3.1 General framework
The methodology for creating VODCA v2 (and v1) products is based on the methodology for creating harmonised long-term multi-satellite-based climate data records within the ESA Soil Moisture CCI project (Dorigo et al., 2017; Gruber et al., 2019). In the following, we will focus on the VODCA v2 methodology (Fig. 2).
First, the LPRM-derived single-sensor VOD data are preprocessed (Sect. 3.2) and scaled to a chosen reference sensor using cumulative distribution function (CDF) matching to remove the systematic biases between sensors (Sect. 3.3). After scaling, we compute the per-pixel first-order temporal autocorrelation (autocorrelation with a lag of one period, AC(1)) for each sensor and overlapping period, which we use as an indicator of the random error (Sect. 3.4). Next, we calculate weights based on the AC(1) for each location and overlapping period. These weights are used for fusing the scaled single-sensor observations (Sect. 3.5).
We compute the new products VODCA L and VODCA CXKu independently. VODCA CXKu incorporates only high-frequency observations. We did not include the lower frequency L-band in the multi-frequency product as the latter is more sensitive to the VWC in the woody components of the vegetation layer compared to the higher frequencies (Schmidt et al., 2023). Several studies have already shown that VOD observations from the C-, X-, and Ku-band frequencies are highly correlated with each other, except for biomes with little inter- and intra-annual variability (desert and humid tropics) (Moesinger et al., 2020; Wild et al., 2022; Moesinger et al., 2022). Notably, the work of Moesinger et al. (2022) is very relevant in this respect because it merges C-, X-, and Ku-band observations to create a standardised vegetation optical depth index (SVODI) and carries out a temporal correlation analysis to show that there is strong agreement between bands (Moesinger et al., 2022, Fig. 1). We provide the results of a spatial (Fig. A3) and temporal correlation (Fig. A2) analysis based on data from the descending overpass of AMSR2 (June 2012–December 2021), which was used as input in the multi-frequency VODCA CXKu product. Both the temporal and spatial analysis reveal strong and very strong, respectively, agreements between bands. Therefore, from a scientific point of view, it is legitimate to merge them into a single dataset with improved information content, temporal sampling, and reduced noise.
VODCA v2 does not entail single-frequency C-, X-, and Ku products for two reasons: first, as mentioned earlier, the AC(1) method employed in the production of VODCA CXKu (Sect. 3.4) is particularly relevant when merging VOD observations from multiple frequencies due to their distinctive sensitivity to noise. Second, in the new scaling framework (Sect. 3.3), we use the SSM/I F17 Ku-band as a reference for scaling AMSR2 C-, X-, and Ku-band observations. This step, which is needed to bridge the gap between AMSR-E and AMSR2, implies the use of observations from multiple frequencies. Therefore, the single-frequency products would not be completely independent anymore but would rely on Ku-band observations for scaling. As we acknowledge the merit of the C-, X-, and Ku-band single-frequency products, we plan to continue their temporal extension with the VODCA v1 framework.
3.2 Preprocessing
In VODCA v2, we expanded on the preprocessing methodology described in detail in Moesinger et al. (2020). Similarly to VODCA v1, we did the following:
-
We projected the data onto a common, regular 0.25°×0.25° grid using nearest-neighbour resampling.
-
We selected the closest nighttime value in a window of ±12 h for every 00:00 UTC.
-
We masked for RFI using flags provided with the LPRM VOD data and based on de Nijs et al. (2015).
-
We masked negative VOD retrievals.
-
In the case of the AMSR2 C-band, we used observations from the 6.9 GHz band if available; otherwise, observations from the 7.3 GHz band were used instead (if unmasked) to fill gaps.
-
In the case of SSM/I, we concatenated VOD data from the sensors F8, F11, and F13 to a single record since they are retrieved from intercalibrated Tb and do not overlap temporally.
Concerning the RFI flagging, we mention that for the C-, X-, and Ku-band observations, the RFI detection uses the estimation of the standard error between two different frequencies (de Nijs et al., 2015). For SMOS, since only one frequency is available, we use the RFI probability information supplied with the SMOS Level 3 data. For SMAP, we use only the internal RFI mitigation supplied with the Level 3 data because it already uses additional frequencies to filter out RFI contaminated observations (Dorigo et al., 2017).
We also utilised a new flag included in the L3 data from LPRM. This flag pertains to the analytical method for VOD retrieval detailed in Meesters et al. (2005), employing the Microwave Polarisation Difference Index (MPDI) to mitigate temperature-related effects on Tb. This adjustment results in a parameter more closely associated with the dielectric properties of emitting surfaces, as outlined in Owe et al. (2001). Negative MPDI values reflect cases where the horizontal Tb is higher than the vertical Tb and the model does not converge. These values are flagged.
Although the flagging of frozen surfaces and snow cover has significantly improved with the new LPRM versions (van der Vliet et al., 2020), we also use ERA5-Land surface soil temperature stl1 because it allows for more conservative masking when applying 275.15 K (2 °C) as a threshold.
In order to reduce the random error levels before merging the sensors, we removed outliers using a standard median filter (known as a Hampel filter; Pearson (2002)). For each window, the Hampel filter compares each observation with the median absolute deviation (MAD). The observations are considered outliers if they exceed the MAD by a certain number of times. We used the Hampel filter with a window size of 120 d and a threshold of 3 MADs. The window size of 120 d was chosen to preserve the seasonality and ensure that outliers are identified without being misinterpreted as part of the seasonal trend. A threshold of 3 MADs has been selected to eliminate significant deviations that cannot be explained, given that we are looking at gradual changes in vegetation. We did not choose a lower MAD to prevent excluding valuable data.
CDF matching reliability depends on the correct representation of the statistical moments of data distribution. Therefore, in the case of VODCA L, we temporally resampled the input sensors SMOS and SMAP to 10 d medians before CDF matching. This temporal downsampling was necessary for two reasons. First, the original temporal coverage of the SMOS and SMAP sensors is significantly imbalanced in some areas, with SMAP providing a much denser set of observations (Fig. A17) due to different masking strategies employed to both datasets. Although the flags of the SMOS and SMAP products show a similar general spatial pattern, SMOS is flagged more extensively and with more seasonal variation than SMAP, likely due to different thresholds for, for example, topography, vegetation, and open water (van der Vliet et al., 2020). The flagging discrepancy between products can lead to differences in the respective value distributions, making CDF matching challenging. Second, by aggregating the datasets into 10 d medians, apart from achieving a more equitable distribution, we obtain much smoother datasets with lower noise levels and outliers, leading to improved CDF matching.
Following preprocessing, the VOD datasets comprise daily estimates for the C-, X-, and Ku-bands. The L-band includes three estimates each month, specifically on the 1st, 11th, and 21st. These observations represent the first 10 d of the month, the subsequent 10 d, and the remaining days for that month.
3.3 CDF matching
We use the VODCA v1 CDF matching method, which combines piecewise linear interpolation with linear least-squares regression (Moesinger et al., 2020). This method provides more robust scaling parameters by fitting a linear model using the sorted observations smaller than the second percentile with an intercept through the second percentile. This way, all the data between the lowest and second-lowest percentiles are used instead of just the lowest value (Moesinger et al., 2020).
Computing VODCA CXKu entails scaling SSM/I, TMI, and WindSat on a band-to-band basis to AMSR-E X-band observations. The X-band has been chosen as the scaling reference because it exhibits the highest correlation with both the C- and Ku-band, as shown in Moesinger et al. (2022) and Wild et al. (2022). The choice of AMSR-E as the reference sensor is motivated by its temporal overlap with these sensors and its superior temporal and spatial resolution, as outlined in the work of Liu et al. (2011). Scaling AMSR2 and GPM observations to AMSR-E is not optimal as there is no temporal overlap. More precisely, VODCA v1 scaled AMSR2 to TMI if enough overlap was available or directly to AMSR-E, without temporal overlap, above and below 35° latitude N and S, respectively (Moesinger et al., 2022). This led to spatial inconsistencies in VODCA v1 (Moesinger et al., 2020, Fig. 13b, c herein). Therefore, we changed the approach in VODCA v2 and used SSMI F17 Ku-band observations (scaled to AMSR-E X-band ) as reference to bridge the gap between AMSR-E and AMSR2. For VODCA L, we use SMAP as reference because it has a better spatio-temporal sampling than SMOS.
3.4 Temporal autocorrelation as a measure of random error
Various techniques have been proposed to estimate weights for an optimal merging of satellite data, e.g. for soil moisture, sea surface temperature, and precipitation (Beck et al., 2021). For soil moisture, Gruber et al. (2017) and Kim et al. (2020) proposed merging techniques that make use of the random errors estimated with the triple collocation approach. Kim et al. (2015) maximised the temporal correlation with a reference dataset to obtain weights. To compute weights, these studies use external datasets, e.g. model data (Gruber et al., 2017; Kim et al., 2020) or reanalysis data (Kim et al., 2015). Unlike soil moisture, VOD is a radiative transfer model parameter rather than a well-defined biogeophysical variable (Li et al., 2021). As no model or independent reference VOD dataset is available, we use autocorrelation instead to quantify the uncertainty of VOD observations.
The use of autocorrelation with a lag of one period (AC(1)) as a measure of random error relies on the assertion that there should be a high degree of temporal AC between subsequent observations since VOD is related to gradual changes in plant water content and biomass (Momen et al., 2017; Konings et al., 2016; Moesinger et al., 2020). Hence, a lower AC(1) represents a higher random error of a dataset. However, AC(1) is not only sensitive to random or measurement errors but also to changes in the dynamical stability (resilience) of a system (Boulton et al., 2022; Smith et al., 2022, 2023). Therefore, AC(1) can only be seen as an error indicator when we compare measurements of the same area (pixel) over the same time period. Otherwise, when comparing AC(1) values of the same pixel but over different periods, the difference in AC(1) measurements obtained could reflect changes in the dynamic stability in one of the observed periods. Because of that, in the VODCA v2 framework, we compute weights based on AC(1) at each location for each overlapping period between sensors, and we use only collocated observations. AC(1) means 1 d in the case of VODCA CXKu and 10 d for VODCA L.
3.5 Weighted merging
For a given sensor s, pixel p, and date t, we obtain the weight by scaling its AC(1) value between 0 and 1 using MinMax scaling, as shown in Eq. (1). The AC(1) can take values between −1 and 1. Then, we normalise the values for each pixel, observation date, and available sensor s so that their sum equals 1. As shown in Eq. (2), we do this by dividing the for each sensor by the sum of values of the n available sensors at time t.
Following the calculation of weights, VODCA L and VODCA CXKu are obtained by multiplying the weights for each observation date, pixel, and sensor by the corresponding CDF-matched sensor values , as shown in Eq. (3).
4.1 Global patterns
To evaluate the characteristics of VODCA CXKu and VODCA L, in Fig. 3a–d we show global maps of temporally averaged VOD together with Xu AGB and MODIS FAPAR for the common period (2010–2019). In addition, Fig. 3e shows the average VODCA CXKu, VODCA L, AGB, and FAPAR per latitude. At the global scale, the VODCA v2 products show similar patterns, with high VOD values in tropical (e.g. Amazon Basin, Congo Basin) and boreal (e.g. Northern Russia, Canada) forests and low VOD values in arid and sparsely vegetated areas (e.g. Sahara). However, in VODCA L, the relative difference between tropical and boreal forests is much larger than for VODCA CXKu. VODCA L is, on average, 37 % higher in the tropical forest compared to boreal forests, while VODCA CXKu is only 4 % higher (latitudes −5 to 5°: mean VODCA L = 0.40, mean VODCA CXKu = 0.87; latitudes 50° to 60°: mean VODCA L = 0.29, mean VODCA CXKu = 0.84). The figure shows that the spatial distribution of VODCA L is more similar to that of the AGB. These results are also supported by the spatial correlation analysis (Table A1), which shows that AGB agrees better with VODCA L (Spearman's R: 0.874) than with VODCA CXKu (Spearman's R: 0.800). This confirms the theoretical assumption that L-band VOD is sensitive to the whole vegetation layer including stems, while high-frequency VOD is more sensitive to the upper canopy (Schmidt et al., 2023). Regarding absolute VOD values, VODCA CXKu is generally higher than VODCA L since the attenuation of microwave radiation increases with frequency due to increasing canopy interference (Moesinger et al., 2020). However, the difference in absolute values between VODCA CXKu and VODCA L is also due to the different parametrisations employed in the retrieval algorithms (LPRM 7.0 vs. LPRM 6.2), especially concerning the single scattering albedo and roughness parameter (Van der Schalie et al., 2017; Dorigo et al., 2017). The surface roughness parameter is much lower in the LPRM v7 retrievals used by VODCA CXKu, which automatically leads to higher VOD. In the LPRM v6.2 retrievals used for VODCA L, the larger roughness reduces the VOD values (Dorigo et al., 2023). However, in the following analyses, we focus on the temporal dynamics and the relative spatial patterns of the products. As shown in Fig. A15c, VODCA CXKu exhibits the same value range for each land cover class as X-band VOD (Fig. A15d) because the latter is used as reference for the CDF matching. VODCA L (Fig. A15a) has the same absolute value range as SMAP (Fig. A15b).
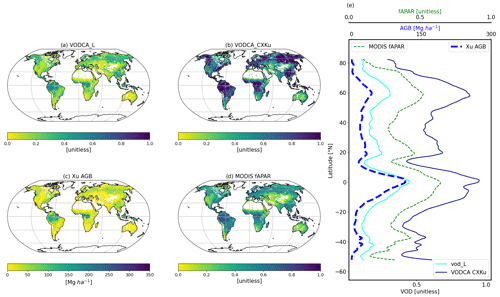
Figure 3Temporally averaged VOD for VODCA L (a) and VODCA CXKu (b). Average Xu AGB (c) and MODIS FAPAR (d). Per-latitude average of all four products (e). Temporal averages are computed over the overlapping period (2010–2019). We only show the spatial overlap between products.
We assess the patterns of vegetation variability in VODCA v2 by looking at the per-pixel coefficient of variation (CV) (Fig. 4). The CV gives a measure of the seasonality dynamics, and we computed it by dividing the standard deviation of monthly VOD by the mean VOD. To avoid bias, the pixels with a fractional cover (Fig. A4) of less than 10 % of observations in the overlapping period between products and bare soils (Fig. A1) are masked. For comparison, we also provide the monthly MODIS FAPAR CV (Fig. 4c). Additionally, Fig. A16 shows the CV distribution per LC class for all three products. We observe low values around the Equator across all three products, indicating low intra-annual variability caused by stable, all-year-round high vegetation density. In contrast, we observe relatively high CV values in grassland and cropland, which exhibit very strong intra-annual variability. In VODCA CXKu, BDF displays higher CV values than VODCA L, likely due to the upper canopy's stronger seasonal dynamics compared to the vegetation layer's woody components (Li et al., 2021).

Figure 4Spatial pattern of the CV for VODCA L (a), VODCA CXKu (b), and MODIS FAPAR (c) for the overlapping period (2010–2021). The range of the colour bar for (c) is wider because the CV in MODIS FAPAR is higher. We only show the spatial overlap between products.
VODCA CXKu and VODCA L have similar coverage (Fig. A4a, b, c), with VODCA L providing no data around most of the Sahara and Arabian Peninsula due to CDF matching failing because of the low number of observations in SMOS VOD (Fig. A17). In northern latitudes, the fewer observations are due to the masking of frozen surfaces and snow cover in winter.
4.2 Spatio-temporal consistency
To ensure that the merging of multiple sensors and frequencies has not affected the continuity of VOD through time and space, we look at yearly global and hemisphere time series and at several time–latitude plots at monthly and yearly scales.
The global and hemisphere time series for VODCA CXKu (Fig. 5) show a clear positive trend, consistent with reports on global greening based on optical satellite sources (e.g. Piao et al., 2020; Chen et al., 2024; Zhang et al., 2017). The patterns of decrease in 2003 and increase in 2012, although coincident with the introduction of AMSR-E and AMSR2, respectively, can also be observed in MODIS FAPAR (Fig. A6), so we attribute them to natural variability. Although the best intercalibrated SSM/I Tb record available (Berg et al., 2016, 2018) was used to retrieve VOD, we cannot exclude residual bias between F8 and F11 as a cause for the increase in VOD past 1992 due to a lack of credible validation data. To our knowledge, no independent VOD datasets provide data before 1992, while all optical-based vegetation datasets are multi-sensor products with known calibration issues (Brown et al., 2006; Tian et al., 2015).
VOD anomalies from high-frequency observations have been observed to coincide with El Niño–Southern Oscillation (ENSO) variations (Dorigo et al., 2021, 2022; Zotta et al., 2023), especially in the Southern Hemisphere, where there is a clear connection between ENSO and vegetation activity (Martens et al., 2017). Negative VODCA CXKu anomalies can be observed in El Niño events (e.g. 1998–1999, 1991–1992), while positive anomalies can be observed in La Niña events (e.g. 2010–2011, 2011–2012). In VODCA L (Fig. 6), the fluctuations in the time series are minor. While the magnitude of the anomalies is considerably smaller, similar peaks as in VODCA CXKu emerge (e.g. 2012, 2014, 2020).
The seasonal dynamics of monthly VODCA CXKu over time and space (Fig. 7 upper) show consistent patterns with higher VOD in the summer months due to the increase in temperature (in the northern–southern region) or in precipitation (in the subtropics). In VODCA L (Fig. 7 lower), the seasonal patterns are less prevalent, which is to be expected because it also contains information on the woody components of the vegetation layer, which is more constant throughout the year. The seasonality and magnitude of VOD are consistent over time and space in both datasets. Most anomalies in VODCA CXKu and VODCA L (Fig. A5) appear limited in time, and their start and end do not coincide with sensor changes, thus indicating natural variability. Most patterns of negative and positive anomalies in VODCA CXKu are consistent with those of MODIS FAPAR (Fig. A14) and leaf area index (LAI) (Moesinger et al. (2020), Fig. 6). As already mentioned, we cannot exclude residual bias between SSM/I F08 and F11 as a possible cause for the low VOD anomalies before 1992.
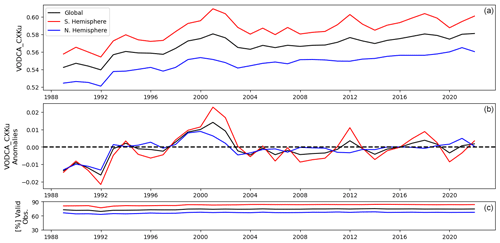
Figure 5Global and hemisphere time series of yearly VODCA CXKu showing the bulk signal (a), detrended anomalies (b), and percentage of valid observations (c).
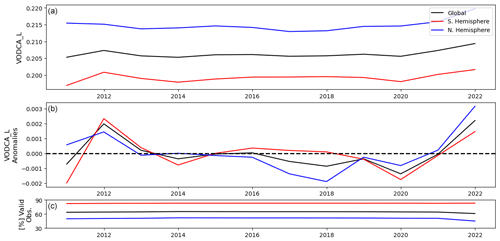
Figure 6Global and hemisphere time series of yearly VODCA L showing the bulk signal (a), detrended anomalies (b), and percentage of valid observations (c).
The yearly AC(1) appears consistent through time in VODCA CXKu (Fig. 8 upper), with some latitudes experiencing a slight increase coincident with the introduction of AMSR-E (June 2002) and TMI (December 1997). At the same time, no consistent decreases in AC(1) can be observed, suggesting that no sensor has led to an increase in random error compared to the previous state of the product. In VODCA L (Fig. 8), we see an increase in AC(1) in almost all latitudes, coincident with the introduction of SMAP (March 2015). These results suggest that fusing observations in the overlapping period has led to a more robust product in terms of random error than using only SMOS observations. As a result of this analysis, we reiterate that we expected to see to some degree of change in AC(1) with the merging of sensors, as VODCA CXKu and VODCA L are harmonised (through the removal of bias between sensors and fusion of overlapping observations) but not homogenised (forcing same data characteristics throughout the entire period covered by the merged product). Therefore, it is crucial to consider the influence of heterogeneous sensor constellation through time for research that delves into higher-order statistics such as variance and autocorrelation temporally (Smith et al., 2023).
To be noted that in VODCA L, above 60° N starting 2021, very strong anomalies can be observed that likely cannot be explained by natural variability. Given that these patterns also coincide with a decrease in AC(1), they are likely a result of either faulty retrieval or residual RFI.
4.3 Changes in AC(1)
To evaluate the change in random error levels in VODCA CXKu as a result of using data from multiple frequencies, we computed single-sensor frequencies with the same VODCA v2 merging framework. We looked at the change in AC(1) between single- and multi-frequency products using only overlapping observations between products, given that the AC(1) coefficient strongly depends on the temporal resolution (Moesinger et al., 2020). Almost everywhere, VODCA CXKu exhibits higher AC(1) values than the single-frequency products. A notable exception is the slightly higher AC(1) in VODCA Ku around desert regions such as the Sahara, although it is of a questionable nature since LPRM struggles to retrieve VOD around that area (Moesinger et al., 2020) and around parts of Mexico. The magnitude of AC(1) change seems to decrease with increasing frequency, possibly due to the larger number of sensors used with increasing frequency in the single-frequency products.
Compared to the LPRM SMOS product, VODCA L exhibits much higher AC(1) almost globally (Fig. 9d). In contrast, VODCA L shows areas with both increased and decreased AC(1) compared to LPRM SMAP (Fig. 9e). The areas with decreased AC(1) are primarily arid regions and deserts. A possible reason is the high difference in performance between SMOS and SMAP in these areas, as assessed with AC(1). When the single-sensor datasets are combined, the random noise of SMOS introduces additional random error into the merged dataset, reducing its overall AC(1). The mentioned decrease in AC(1) compared to SMAP was also observed by Moesinger et al. (2020) and is not inherent to the weighted merging procedure. These results indicate that the merging procedure employed for VODCA L is not flawless in all circumstances, and further research needs to be conducted to assess if a global optimum could be achieved. In particular, testing whether to use only SMAP data in the overlapping period could be an interesting topic for future studies. Nevertheless, VODCA L represents a viable alternative to existing long-term L-band VOD products, providing a longer observation period (2010–2021) than SMAP (2015–2021) and globally decreased random error levels compared to SMOS.
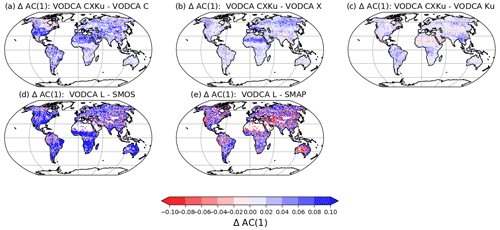
Figure 9Difference in AC(1) between VODCA CXKu and VODCA C (a), VODCA X (b), and VODCA Ku (c). Difference in AC(1) between VODCA L and SMOS (d) and SMAP (e). Only collocated observations in time and space have been used. Blue regions indicate an increase in AC(1) in the VODCA v2 products, while red regions indicate a decrease.
4.4 Trends
We conducted a trend analysis to understand how VOD has changed over recent decades and assess the plausibility of change patterns in the products. We employed the Theil–Sen regressor on annual medians and masked slopes with upper and lower confidence intervals having opposite signs. We looked at trends for the complete product period (Fig. 10a, b); the overlapping period between VODCA L, VODCA CXKu, and FAPAR (Fig. 10a, c, d); and the overlapping period between VODCA L and Xu AGB (Fig. 10e, f). As the Xu AGB maps show forest AGB, the analyses in Fig. 10e and f are limited to locations corresponding to BEF BDF, NEF, NDF, and MF land cover classes.
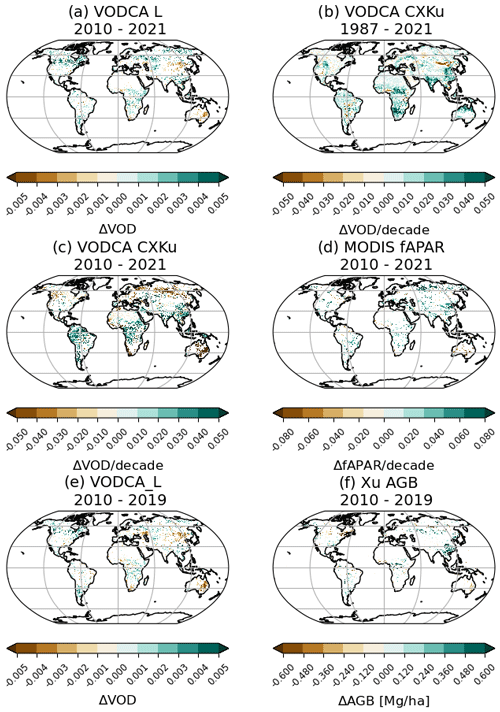
Figure 10Trends over the entire product period calculated with the Theil–Sen regressor for VODCA L (a) and VODCA CXKu (b). Trends for the overlapping period 2010–2021 for VODCA CXKu (c) and MODIS FAPAR (d). Trends for the overlapping period 2010–2019 for VODCA L (e) and Xu AGB (f). Trends are considered not significant and masked when the upper and lower confidence intervals have conflicting signs.
Due to the short time series of the overlapping period between VODCA L, VODCA CXKu, and FAPAR and between VODCA L and Xu AGB, few pixels show significant trends. However, VODCA CXKu shows more substantial agreement in trends with FAPAR (Pearson correlation coefficient of 0.57) than VODCA L (correlation coefficient of 0.33). This is expected since VODCA L is less sensitive to variations in the upper canopy. Similar trends can be observed in VODCA CXKu and FAPAR in regions such as Africa, Australia, China, and India, while differing patterns can be seen in boreal forests. We observe consistent VODCA L and AGB trends in regions along the eastern coast of Australia, western Africa, China, Alaska, and Siberia. Some differences emerge in areas like Canada and the Congo Basin.
Some of the trend discrepancies in boreal forests between the VODCA products, FAPAR and AGB, are due to the fact that retrieving VOD in this area is challenging. Various complicating ecosystem properties, such as open-water bodies, snow cover, and frozen soil conditions (as mentioned in Vreugdenhil et al., 2016; Vreugdenhil et al., 2020; Li et al., 2021), make it challenging to retrieve VOD accurately. Additionally, boreal soils have a high organic content, leading to distinct dielectric behaviours (Wigneron et al., 2017; Bousquet et al., 2021), which are not adequately accounted for in most retrieval algorithms, including LPRM 7.0 and LPRM 6.2, used for VODCA CXKu and VODCA L, respectively.
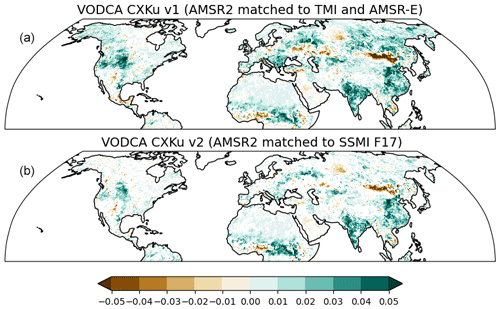
Figure 11Trends (1987–2021) for VODCA CXKu v1 computed with the Moesinger et al. (2020) satellite constellation and CDF matching framework, by merging AMSR2 to TMI below 35° N latitude and AMSR-E further north (a), and for VODCA CXKu v2 computed with the method from this paper, by matching AMSR2 to SSMI F17 (b). The same colour bar as in Fig. 10b and c was used.
From a technical perspective, the improved merging methodology employed in VODCA CXKu has addressed a spatial break in trends observed in VODCA v1 X and Ku around 35° N latitude in North America (as discussed in Moesinger et al., 2020). To illustrate this improvement, we computed a version of VODCA CXKu, which uses the same sensor constellation (SSMI without F17, TMI, WindSat, AMSR-E, and AMSR2) and CDF matching of AMSR2 as used in Moesinger et al. (2020) and is hereby referred to as VODCA CXKu v1. As can be observed in Fig. A19, the trends of the two VODCA CXKu products are very similar (Pearson's R 0.84), with differences primarily in magnitude. Matching AMSR2 to TMI below 35° N latitude and to AMSR-E without temporal overlap further north leads to a clear spatial break in North America (Fig. 11 top) and to a consequent positive bias above 35° N latitude. In VODCA v2, the trends have improved spatially due to the global use of SSMI F17 as reference in the CDF matching of AMSR2 and GPM (Fig. 11 bottom). To further illustrate the benefit of using SSMI F17 to scale AMSR2 observations, in Fig. A13 we show the time series of both VODCA CXKu v1 and v2 and AMSR2 matched to AMSR-E and SSMI F17, respectively, at a location outside the coverage of TMI. We can clearly observe that scaling AMSR2 to AMSR-E did not produce the desired outcome, which led to bias in the later period of VODCA CXKu v1.
4.5 Temporal dynamics of the upper canopy
4.5.1 MODIS FAPAR
Generally, considering the bulk signal (Fig. 12a), VODCA CXKu agrees very well with FAPAR over vast areas, e.g. Africa, Australia, Europe, the Indian subcontinent and parts of North America, indicating that the products have similar seasonal dynamics. The best level of agreement is found in short vegetation types, i.e. grassland (median R=0.57), cropland (0.56), shrubs (0.59), and BDF (0.49) (Fig. 13, Table A2). The weakest correlations are observed in NEF, NDF, BEF, and MF. Similar results have been observed when comparing high-frequency VOD products with various other optical vegetation indicators such as LAI (Moesinger et al., 2020; Vreugdenhil et al., 2017), NDVI (Li et al., 2021; Liu et al., 2011), and EVI (enhanced vegetation index; Li et al., 2021). The tropical regions are dominated by weak positive and weak negative correlations, possibly due to low intra-annual variability in VOD (Liu et al., 2011). Another reason for the reduced correlations in this area could be drought periods during which VOD reduces as a result of lower VWC while FAPAR possibly increases because more radiation reaches the canopy, thus increasing photosynthetic activity (Myneni et al., 2007). As mentioned earlier, the reduced correlations over the northern latitudes could have been caused by artefacts originating from the retrieval algorithm, possibly impacting the VOD seasonality or from differences in phenology between VOD and FAPAR. Regarding phenology, studies found a lag in boreal forests between other optical-based vegetation indicators, such as NDVI and EVI, with VOD-based start-of-season (SOS) preceding that based on optical data (Dannenberg et al., 2020; Jones et al., 2012). This could be explained by snowmelt, which increases the water supply, and hence sap flow and the water amount in the canopy (Dannenberg et al., 2020). VODCA CXKu and FAPAR anomalies (Fig. 12b) are positively correlated over wide areas, respecting the same spatial distribution in land cover classes (Fig. A20, Table A2) and regions of strong and weak agreement.
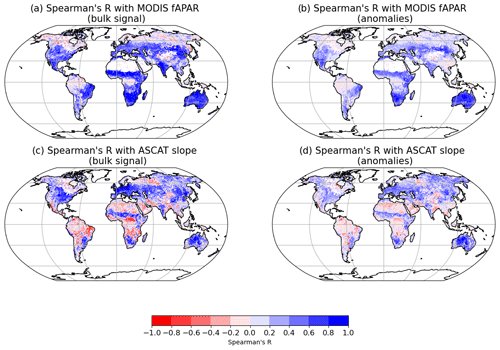
Figure 12Spearman's R between 8-daily VODCA CXKu and MODIS FAPAR over the period 2000–2021 on the bulk signal (a) and anomalies (b). Spearman's R between 8-daily VODCA CXKu and ASCAT slope over the period 2007–2021 on the bulk signal (c) and anomalies (d).
Even though VODCA L is largely sensitive to deeper vegetation layers, we also analyse its agreement with FAPAR (Figs. A21; A23). As expected, agreement between VODCA L and FAPAR is lower than between VODCA CXKu and FAPAR across all biomes and regions. The best level of agreement can be found in shrubs, needle-leaf, and mixed forests.
4.5.2 ASCAT slope
Concerning the bulk signal, vast areas with high positive correlations can be observed, e.g. in Europe, Australia, parts of North America, the Sahel region, and parts of southern Africa (Fig. 8c, d). Weak positive-to-negative correlations can be observed, for example, around the tropical region, Sahara, Arabian Peninsula, parts of Canada, Siberia, and northern Europe. Regarding the tropical regions, as observed in previous studies (Vreugdenhil et al., 2016), the cause could be the low intra-annual variability for both active and passive data. In the northern latitudes, the low correlations are due to challenging environmental conditions for the retrieval algorithms (Vreugdenhil et al., 2016; Moesinger et al., 2020). We can observe positive correlations, especially in grassland (median R=0.48 bulk signal, R=0.32 anomalies) and cropland (0.48, 0.32), as shown in Figs. 13 and A20 and Table A2. Conversely, low positive-to-negative correlations occur in BEF, BDF, NEF, MF, bare soil, and shrubs. These results were expected, as several studies reported similar agreement and disagreement patterns between ASCAT-derived vegetation indicators and passive VOD (Vreugdenhil et al., 2016, 2017, 2022). In BDF, the low correlations were attributed to the active signal being dominated by changes in vegetation structure due to an increase in tree foliage during the growing season, with leaves absorbing or forward-scattering the signal (Vreugdenhil et al., 2017; Dostálová et al., 2018). Similarly, disagreement in the subtropical regions of South America is likely caused by the sensitivity of ASCAT slope to vegetation structure changes, in pixels with heterogeneous landscape. Over deserts and other arid regions with sparse vegetation (e.g. shrubs), low agreement with ASCAT data could be explained by the presence of subsurface soil scattering in the active signal (Hahn et al., 2017; Vreugdenhil et al., 2020; Wagner et al., 2022). Subsurface scattering occurs during dry conditions when the signal penetrates the subsurface. This leads to volume scattering and, thus, to a flatter slope. Interestingly, there is good agreement between VODCA CXKu and ASCAT slope in NDF in the Russian Far East over both the bulk signal and the anomalies. As mentioned earlier, surface conditions in these regions are difficult for the retrieval algorithms but may similarly affect active and passive microwave observations. The good agreement in this area with ASCAT slope indicates a decoupling of phenology between optical and microwave-derived vegetation indicators (Fan et al., 2023), meaning that the latter could provide valuable, complementary information to optical information.
As expected, the agreement between VODCA L and ASCAT slope is lower than between VODCA CXKu and FAPAR (Figs. A21, A22, and A23).
4.5.3 PBO NMRI
Generally, there is good agreement between monthly VODCA CXKu and NMRI over the bulk signal (243 stations with significant correlations; Fig. 14a) and anomalies (173 stations with significant correlations; Fig. 14b), with a median Pearson's R of 0.55 and 0.44, respectively. Few stations exhibit weak positive–weak negative correlations, likely due to residual RFI, which is known to affect the C-band and, to a lesser extent, the X-band (de Nijs et al., 2015, Fig. A25) in the United States. We also show VODCA CXKu and NMRI correlation maps for daily observations (Fig. A26a) and time series for the BRUCESPRIN PBO station (Fig. A26b). The agreement is also good at a daily time step, with a median R of 0.40, indicating that VODCA CXKu can capture the daily variations in NMRI. These results confirm the findings of Jones et al. (2014), showing that passive VOD (VODCA CXKu) follows the variations in NMRI, despite the huge difference in footprint size.
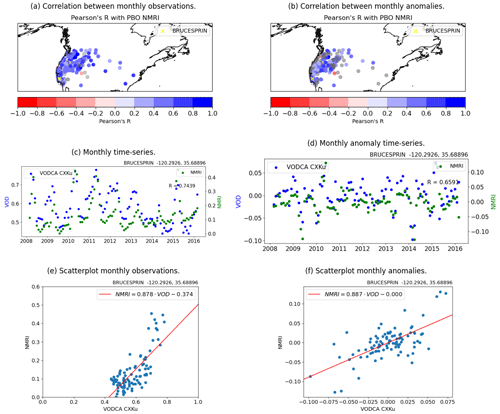
Figure 14Pearson's R between monthly VODCA CXKu and NMRI for the PBO stations over the bulk signal (a) and anomalies (b). The stations with non-significant correlations are shown in grey. Time series over the bulk signal (c) and anomalies (d) of VODCA CXKu (blue) and PBO NMRI (green) and scatter plot over the bulk signal (e) and over anomalies (f) for a station with good agreement between datasets (BRUCESPRIN, lat 35.68°, long −120.29°, indicated with a cross in the correlation maps).
The agreement between NMRI and VODCA L is weaker in terms of both bulk signal (121 stations with significant correlations; Fig. 15a) and anomalies (40 stations with significant correlations; Fig. 15b), with a median Pearson's R of 0.36 and 0.28, respectively. This outcome is somewhat surprising, considering that NMRI measurements are derived from L-band GPS signals. One possible explanation for the much better agreement of NMRI with VODCA CXKu could be the sensitivity to green vegetation, which is known to increase with higher frequencies (Li et al., 2021), especially given the PBO sites' locations in areas with shorter vegetation, such as grasslands and shrublands.
4.5.4 SAPFLUXNET
We examined how sensitive VODCA CXKu is to sap flow on days with low, normal, and high transpiration rates in the scatter plots from Fig. 16a and using the Pearson and Spearman regression coefficients. We only considered stations with a significant correlation between VODCA CXKu and sap flow (Fig. 16b). We observed positive correlations between VODCA CXKu and sap flow during normal (Spearman's R: 0.52, 51 stations with significant correlations; Pearson's R 0.48, 50 stations with significant correlations) and high (Spearman's R: 0.48, 53 stations with significant correlations; Pearson's R 0.43, 54 stations with significant correlations) transpiration days. The agreement between VODCA CXKu and sap flow during days with low transpiration (5th percentile) is weaker (Spearman's R: 0.39, 37 stations with significant correlations; Pearson's R: 0.35, 27 stations with significant correlations). The lower correlations and the lower number of stations with significant correlations indicate a weaker linear relationship between VOD and sap flow, compared to days with normal and high transpiration rates. Generally, the high number of stations where the correlation between VODCA CXKu and sap flow is non-significant is likely caused by the short temporal overlap between datasets, with an average of 21 observations, compared to 31 observations on average for the stations where a significant relationship has been found.
Figures 16b and A24 show the spatial distribution of the SAPFLUXNET stations used in this analysis and the agreement between VODCA CXKu and sap flow for each station. The highest correlations can be observed for days with normal transpiration, with a median Spearman's R of 0.67 followed by high (median Spearman's R: 0.64) and low (median Spearman's R: 0.57) transpiration days (Fig. A24). In contrast, the agreement is weaker on days with low transpiration rates. Compared to the global analysis (as performed in Fig. 16a), the higher correlations on a station basis indicate that the complex, non-linear relationship between VOD and sap flow is better described when modelled at each location.
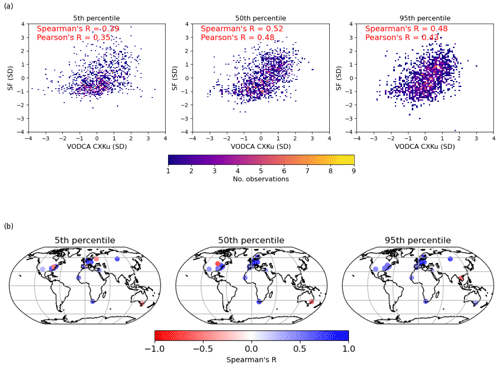
Figure 16(a) Density scatter plots outlining the relationship between VODCA CXKu and sap flow (SF) standard deviations (SD) for the 5th, 50th, and 95th percentiles of monthly data, for the stations with significant correlations. The colour bar shows the number of observations in each bin. (b) Maps showing the agreement between SF (SD) and VODCA CXKu (SD) for each SAPFLUXNET station, for 5th, 50th, and 95th percentiles of monthly data. Stations with non-significant correlations are masked (p>0.05).
4.6 AGB
Generally, there is very good yearly spatial agreement between VODCA L and Xu AGB, with Spearman's R values around 0.86 for each year. The relationship between VODCA L and Xu AGB follows a logistic function (Fig. A27) as found in earlier studies investigating the connection between L-band VOD and AGB maps (Rodríguez-Fernández et al., 2018; Mialon et al., 2020).
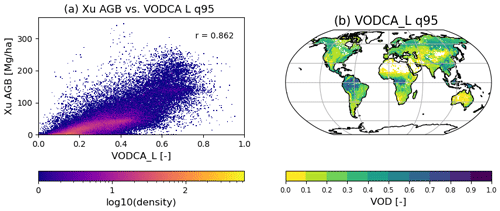
Figure 17(a) Temporal–spatial relationship between VODCA L q95 (95 % quantile) and Xu AGB over all overlapping years. The scatter plot is coloured by the density of observations. Spearman's r is shown in the upper right side. (b) Median of VODCA L q95 of each year in 2010–2019.
Regarding the temporal dynamics, our analysis (Fig. 18) is limited to the availability of only annual Xu AGB observations. We calculate the difference in VODCA L, SMOS-IC VOD and AGB between 2011 and 2019, similar to Araza et al. (2023). Araza et al. (2023) investigate the change in AGB for forested areas based on four multi-date AGB maps: Xu AGB, SMOS-derived AGB (Wigneron et al., 2021), ESA CCI AGB (Santoro and Cartus, 2021), and a carbon flux model (Harris et al., 2021). In our analysis, we are more interested in the agreement between positive and negative change patterns rather than the absolute change. Patterns of decreasing VODCA L agree with decreases in Xu AGB and the maps presented in Araza et al. (2023), e.g. for the Siberian boreal forest, west and central Africa, southwestern Amazon, and the east coast of Australia. These are either well-known deforestation hotspots (Song et al., 2018; Feng et al., 2022) or areas that have been affected by severe wildfires in the past decade according to the Global Fire Atlas (Andela et al., 2019). Patterns of increasing VODCA L coincide with increases in AGB around China, western Canada, and scattered locations across Europe and Asia. Some of these locations have been subject to reforestation efforts in the last decade (Song et al., 2018). The comparison with Xu AGB also reveals areas with mismatching change patterns, such as the North American boreal forests and the Amazon basin. However, the distribution of positive and negative change patterns in VODCA L is similar to that of SMOS-IC VOD, including in the areas with no agreement with Xu AGB. Therefore, the dissimilar patterns are not caused by artefacts originating from the VODCA L merging framework. Differences between VODCA L and SMOS-IC VOD can be observed mainly in magnitude, which makes sense since VODCA L uses a different retrieval algorithm and includes observations from SMAP.
To enable comparison, we provide the same type of analysis in Fig. A28 for VODCA CXKu. As expected, since VODCA CXKu entails information largely on the upper canopy dynamics, trends and change patterns are more dissimilar to those observed for Xu AGB, especially in boreal and tropical forests.
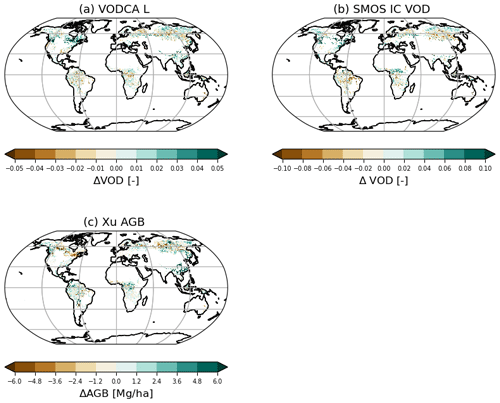
Figure 18Difference between the years 2019 and 2011 for (a) VODCA L, (b) SMOS-IC VOD, and (c) Xu AGB (method of Araza et al. (2023) for reducing the inter-annual variability of the original time series). The analysis is limited to forested areas.
VODCA v2 is open-access and available at https://doi.org/10.48436/t74ty-tcx62 (Zotta et al., 2024).
In VODCA v2, two new VOD datasets were introduced: VODCA CXKu, a daily multi-frequency product spanning 1987 to 2021, and VODCA L, a 10-daily L-band product covering the period 2010–2021. The datasets were computed by scaling data from each satellite mission and frequency band to a reference mission and band (SMAP for VODCA L and AMSR-E X-band for VODCA CXKu) using CDF matching. We made several changes compared to VODCA v1. First, instead of three single high-frequency products, we provide VODCA CXKu, which uses observations from the C-, X-, and Ku-band frequencies and is indicative of VWC dynamics in the upper canopy. Combining the high-frequency bands maximises the information contained while increasing the number of daily observations and reducing noise. Second, we merged VOD estimates using a novel weighted merging method that relies on temporal first-order autocorrelation (AC(1)) to compute weights for locations and time steps where multiple observations are available. The assumption is that VOD, linked to gradual changes in vegetation water content, should exhibit a high degree of temporal AC(1) between subsequent observations, while sudden changes indicate noise. Third, VODCA v2 CXKu includes two additional high-frequency sensors, SSM/I F17 and GPM GMI. Specifically, SSM/I F17 addresses the gap between AMSR-E and AMSR2, which in VODCA v1 led to trend breaks above 35° N and below 35° S. We demonstrated that due to these methodological improvements, VODCA CXKu exhibits lower random error levels (higher AC(1)) than the single-frequency products. VODCA L shows higher AC(1) compared to LPRM-derived SMOS globally and areas with increased and decreased AC(1) compared to LPRM-derived SMAP. Therefore, VODCA L has the advantage of a longer time series compared to SMAP and lower random error levels compared to SMOS. The areas with decreased AC(1) are primarily arid regions and deserts. We showed that the spatial trend patterns have been significantly improved in VODCA CXKu due to using SSM/I F17.
In summary, our validation results show the following:
-
VODCA CXKu and MODIS FAPAR demonstrate similar temporal patterns in various regions, especially for short vegetation types and broadleaf forests, as observed in literature with other optical vegetation indicators. Artefacts from the retrieval algorithm are likely causing dissimilarities in boreal forests, while in tropical regions, the lack of agreement is due to the minimal intra-annual variability in VOD.
-
VODCA CXKu agrees with ASCAT slope, particularly in cropland, grassland, and needle-leaf deciduous forest. However, weak correlations were found in needle-leaf evergreen and broadleaf forests, consistent with prior studies.
-
VODCA CXKu aligns well with in situ NMRI data at daily and monthly aggregations. Even though NMRI uses L-band GPS observations, the agreement with VODCA L is weak. This is likely because VODCA L is predominantly sensitive to woody biomass, while the NMRI stations are mainly located in grassland and cropland. Also, the difference in footprint size may play a role.
-
Preliminary findings suggest that VODCA CXKu captures transpiration patterns, especially on days with medium and high transpiration, but further research is needed to disentangle the VOD–sap flow connection.
-
Yearly estimates of VODCA L correspond closely with yearly Xu AGB maps, with their relationship being described by a logistic function. Trends and changes in VODCA L exhibit similar patterns to Xu AGB and with previous studies in deforestation, reforestation, and wildfire hotspots. Further research is required to analyse sub-yearly patterns.
-
VODCA CXKu and VODCA L show mostly consistent patterns through time and space, unaffected by the fusion of multiple sensors and frequencies. However, in VODCA CXKu, we cannot exclude residual bias between SSM/I F8 and F11, even though the best available intercalibrated brightness temperature datasets have been used to retrieve VOD.
Based on our findings, we conclude that VODCA CXKu provides useful complementary information to optical vegetation indicators to study the vegetation canopy response to climate variability and anthropogenic impacts. We suggest using it for long-term vegetation monitoring studies, focusing on short vegetation types and broadleaf forests. We recommend that users consider the possibility of residual bias between data before 1992 and after. Nevertheless, for research that delves into higher-order statistics such as variance and autocorrelation temporally, it is crucial to consider the influence of the heterogeneous sensor constellation through time, as these statistics may also be sensitive to the overall noise levels, which vary over time. VODCA L provides valuable insight into biomass and biomass change, but further research is needed to determine its suitability for intra-annual AGB monitoring. Given that our methodology for creating VODCA L is not flawless in all circumstances (e.g. arid regions), future studies should explore alternative methods for merging SMOS and SMAP.
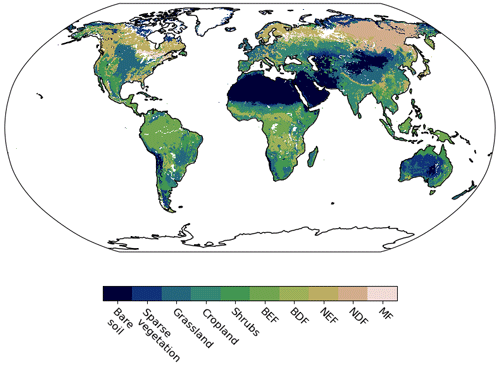
Figure A1ESA CCI Landcover map v2 (https://maps.elie.ucl.ac.be/CCI/viewer/, last access: 8 October 2024) for 2010, aggregated to major classes. Locations containing open water have been masked.
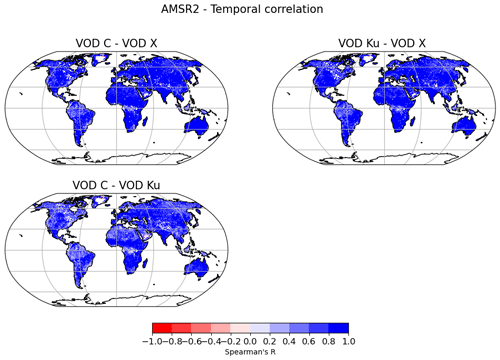
Figure A2Spearman's R between AMSR2 (2012–2021) VOD C, VOD X, and VOD Ku data. The correlations are based on daily data.
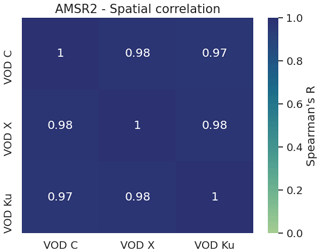
Figure A3Spatial correlation (Spearman's R) between average AMSR2 (2012–2021) VOD C, VOD X, and VOD Ku data.

Figure A4Fractional coverage of the VODCA v2 products, expressed as the total number of available observations divided by the total number of possible observations in the overlapping period of January 2010–December 2021. Pixels that have a fractional cover of exactly 0 are shown in white.
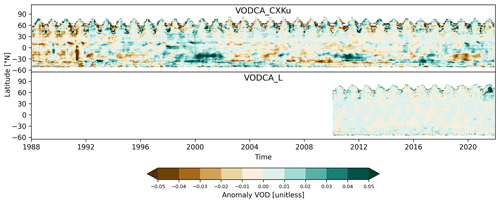
Figure A5Hovmöller diagrams showing anomalies of the monthly means per latitude for VODCA CXKu and VODCA L. Anomalies have been computed as deviations from the climatology of the periods 1990–2020 (VODCA CXKu) and 2010–2021 (VODCA L).
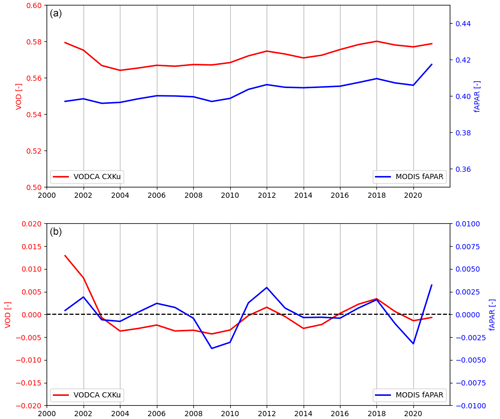
Figure A6Yearly global time series of VODCA CXKu and FAPAR for the bulk signal (a) and for anomalies (b).
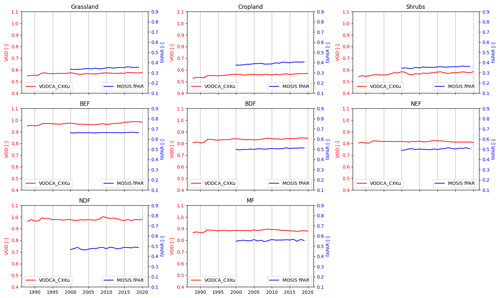
Figure A7Yearly time series per land cover class for VODCA CXKu and MODIS FAPAR. ESA CCI LC was used.
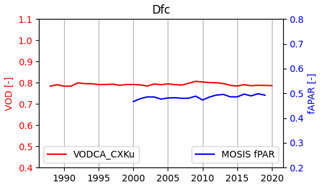
Figure A9Yearly time series for the Dfc climate, corresponding to boreal forest, for VODCA CXKu and MODIS FAPAR.
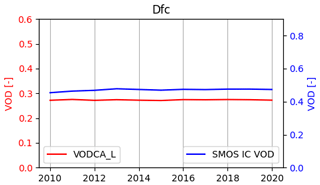
Figure A10Yearly time series for the Dfc climate, corresponding to boreal forest, for VODCA L and SMOS IC VOD.
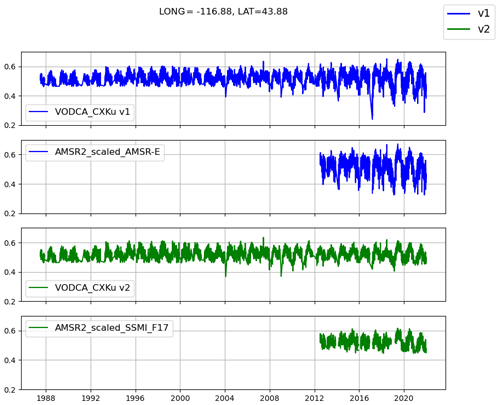
Figure A13Time series of VODCA CXKu v1 (blue, computed with the old methodology), AMSR2 scaled to AMSR-E (blue), VODCA CXKu v2 (green), and AMSR2 scaled to SSMI F17 (green), at a location where TMI is not available.
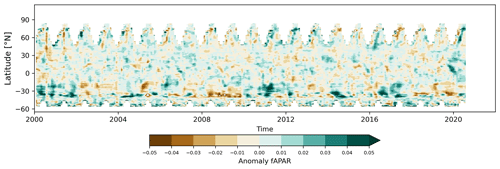
Figure A14Hovmöller diagram showing anomalies of the monthly means per latitude for MODIS FAPAR. Anomalies have been computed as deviations from the long-term climatology (2000–2020).
Table A1 Spatial correlation computed over the overlapping period 2010–2019, between the VOD products, FAPAR and AGB.
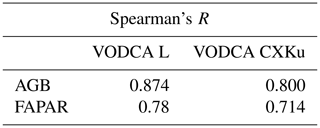
Table A2 Median Spearman's R between VODCA CXKu and MODIS FAPAR and ASCAT slope for the bulk signal and anomalies.
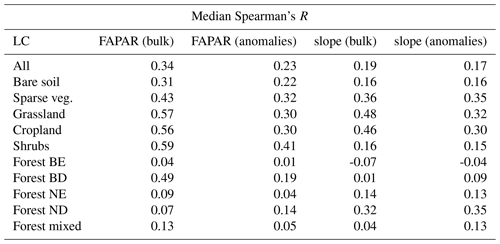
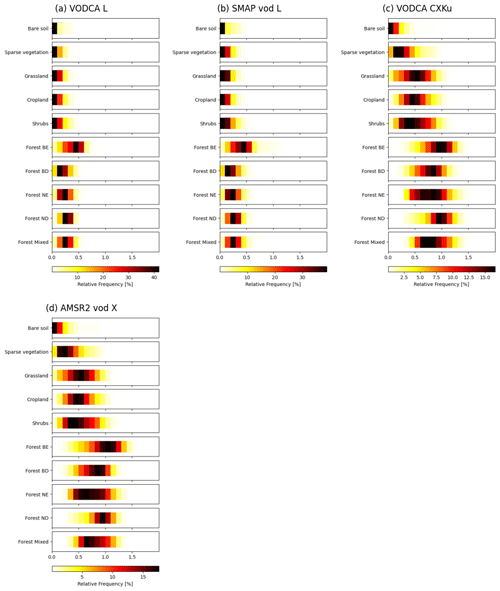
Figure A15Value ranges per LC class for VODCA L (a), SMAP VOD L (b), VODCA CXKu (c), and AMSR2 VOD X (d). Bins are coloured by the relative frequency in percent of the respective values. ESA CCI LC was used.
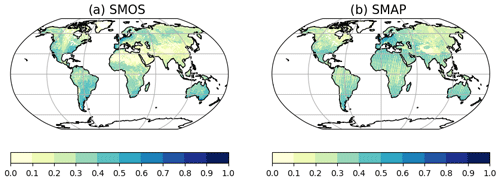
Figure A17Fractional cover of (a) SMOS (2010–2021) and (b) SMAP VOD (2015–2021), after flagging. Pixels that have a fractional cover of exactly 0 are shown in white.
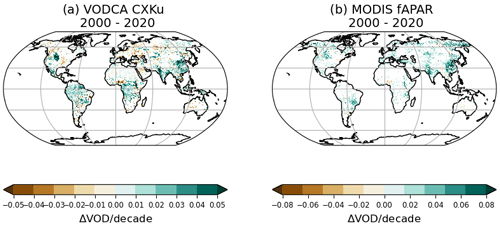
Figure A18Trends for the overlapping period (February 2000–August 2020) for (a) VODCA CXKu and (b) FAPAR.
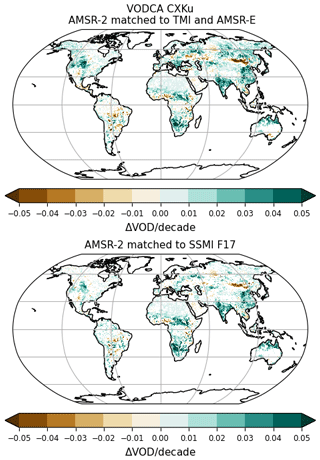
Figure A19Trends (1987–2021) for VODCA CXKu computed with the Moesinger et al. (2020) satellite constellation and CDF matching framework, by merging AMSR2 to TMI below 35° N latitude and AMSR-E above, and for VODCA CXKu computed with the method from this paper, by matching AMSR2 to SSMI F17.
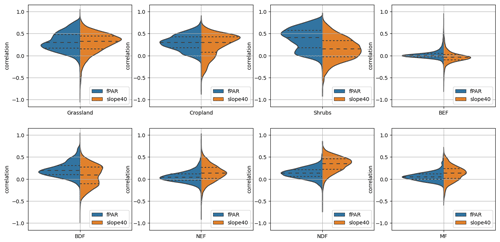
Figure A20Violin plots showing the distribution of Spearman's R between 8-daily VODCA CXKu and MODIS FAPAR (blue) and VODCA CXKu and ASCAT slope (orange) calculated on anomalies, per land cover class (a–j).
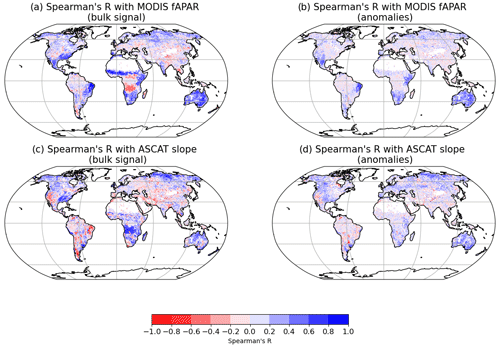
Figure A21Spearman's R between monthly VODCA L and MODIS FAPAR over the period 2010–2021 on the bulk signal (a) and anomalies (b). Spearman's R between monthly VODCA L and ASCAT slope over the period 2010–2021 on the bulk signal (c) and anomalies (d).
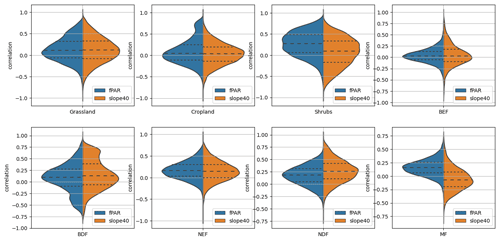
Figure A22Violin plots showing the distribution of Spearman's R between monthly VODCA L and MODIS FAPAR (blue) and VODCA L and ASCAT slope (orange) on the bulk signal, per land cover class.
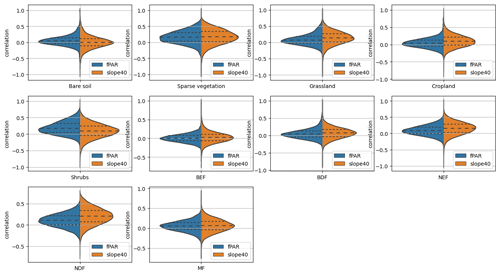
Figure A23Violin plots showing the distribution of Spearman's R between monthly VODCA L and MODIS FAPAR (blue) and VODCA L and ASCAT slope (orange) over anomalies, per land cover class.
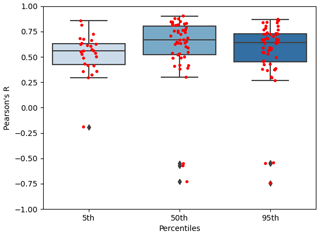
Figure A24Agreement between VODCA CXKu (SD) and sap flow (SD) for the monthly 5th, 50th, and 95th percentiles. Red points represent the correlation for each station.
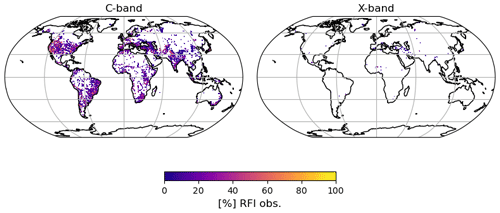
Figure A25Percentage of observations affected by RFI in the AMSR2 (2012–2021) C- and X-band. The internal flag provided with the LPRM data was used.
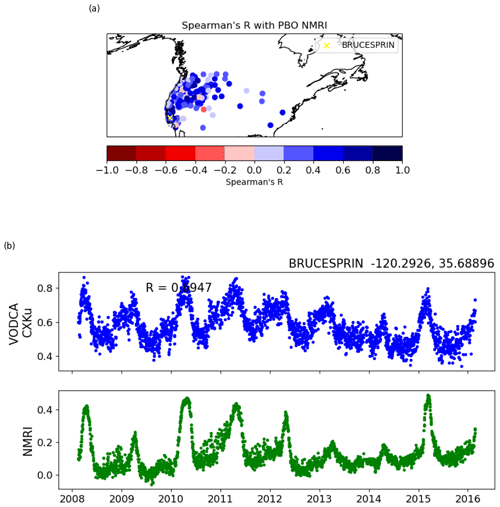
Figure A26(a) Pearson's R between daily VODCA CXKu and NMRI for each PBO station. Only sites with significant correlation are shown. (b) Time series of VODCA CXKu (blue) and PBO NMRI (green) for a station with above-average agreement between datasets.
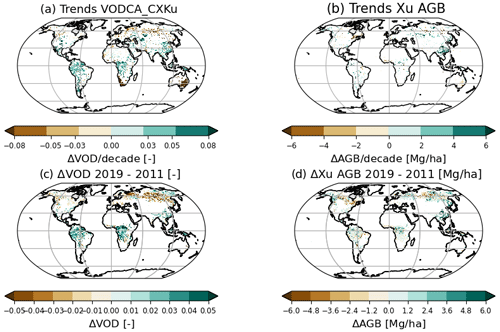
Figure A28(a) Theil–Sen trends for VODCA CXKu for 2011–2020. (b) Theil–Sen trends for Xu AGB for the same period. Difference between the years 2019–2011 for (c) VODCA CXKu and (d) Xu AGB (method of Araza et al., 2023).
WD and RMZ designed the study. RZ performed the analysis and wrote the paper. WP preprocessed auxiliary and evaluation data. All authors contributed to discussions about the methods and results and provided feedback on the paper and data.
The contact author has declared that none of the authors has any competing interests.
Publisher's note: Copernicus Publications remains neutral with regard to jurisdictional claims made in the text, published maps, institutional affiliations, or any other geographical representation in this paper. While Copernicus Publications makes every effort to include appropriate place names, the final responsibility lies with the authors.
The authors acknowledge the TU Wien University Library for financial support through its Open Access Funding Programme.
We thank an anonymous reviewer and Xiaojun Li for reviewing this paper. Their feedback helped significantly improve our paper.
This research has been supported by the Vienna University of Technology (TU Wien) through its Open Access Funding Programme and by the Wissenschaftspreis 2015, a personal grant awarded to Wouter Dorigo.
This paper was edited by Dalei Hao and reviewed by Xiaojun Li and one anonymous referee.
Andela, N., Morton, D. C., Giglio, L., Paugam, R., Chen, Y., Hantson, S., van der Werf, G. R., and Randerson, J. T.: The Global Fire Atlas of individual fire size, duration, speed and direction, Earth Syst. Sci. Data, 11, 529–552, https://doi.org/10.5194/essd-11-529-2019, 2019. a
Araza, A., Herold, M., de Bruin, S., Ciais, P., Gibbs, D. A., Harris, N., Santoro, M., Wigneron, J.-P., Yang, H., Málaga, N., Nesha, K., Rodriguez-Veiga, P., Brovkina, O., Brown, H. C., Chanev, M., Dimitrov, Z., Filchev, L., Fridman, J., García, M., Gikov, A., Govaere, L., Dimitrov, P., Moradi, F., Muelbert, A. E., Novotný, J., Pugh, T. A., Schelhaas, M.-J., Schepaschenko, D., Stereńczak, K., and Hein, L.: Past decade above-ground biomass change comparisons from four multi-temporal global maps, Int. J. Appl. Earth Obs., 118, 103274, https://doi.org/10.1016/j.jag.2023.103274, 2023. a, b, c, d, e
Beck, H. E., Pan, M., Miralles, D. G., Reichle, R. H., Dorigo, W. A., Hahn, S., Sheffield, J., Karthikeyan, L., Balsamo, G., Parinussa, R. M., van Dijk, A. I. J. M., Du, J., Kimball, J. S., Vergopolan, N., and Wood, E. F.: Evaluation of 18 satellite- and model-based soil moisture products using in situ measurements from 826 sensors, Hydrol. Earth Syst. Sci., 25, 17–40, https://doi.org/10.5194/hess-25-17-2021, 2021. a
Berg, W.: GPM SSMI on F08 Common Calibrated Brightness Temperatures L1C 1.5 hours 13 km V07, Greenbelt, MD, USA, Goddard Earth Sciences Data and Information Services Center (GES DISC) [data set], https://doi.org/10.5067/GPM/SSMI/F08/1C/07, 2021. a
Berg, W., Bilanow, S., Chen, R., Datta, S., Draper, D., Ebrahimi, H., Farrar, S., Jones, W. L., Kroodsma, R., McKague, D., Payne, V., Wang, J., Wilheit, T., and Yang, J. X.: Intercalibration of the GPM microwave radiometer constellation, J. Atmos. Ocean. Tech., 33, 2639–2654, https://doi.org/10.1175/JTECH-D-16-0100.1, 2016. a, b
Berg, W., Kroodsma, R., Kummerow, C. D., and McKague, D. S.: Fundamental climate data records of microwave brightness temperatures, Remote Sens., 10, 1306, https://doi.org/10.3390/rs12040671, 2018. a, b
Bittencourt, P., Rowland, L., Sitch, S., Poyatos, R., Miralles, D. G., and Mencuccini, M.: Bridging Scales: An Approach to Evaluate the Temporal Patterns of Global Transpiration Products Using Tree-Scale Sap Flow Data, J. Geophys. Res.-Biogeo., 128, e2022JG007308, https://doi.org/10.1029/2022JG007308, 2023. a, b
Boulton, C. A., Lenton, T. M., and Boers, N.: Pronounced loss of Amazon rainforest resilience since the early 2000s, Nat. Clim. Change, 12, 271–278, https://doi.org/10.1038/s41558-022-01287-8, 2022. a, b
Bousquet, E., Mialon, A., Rodriguez-Fernandez, N., Prigent, C., Wagner, F. H., and Kerr, Y. H.: Influence of surface water variations on VOD and biomass estimates from passive microwave sensors, Remote Sens. Environ., 257, 112345, https://doi.org/10.1016/j.rse.2021.112345, 2021. a, b
Brandt, M., Yue, Y., Wigneron, J. P., Tong, X., Tian, F., Jepsen, M. R., Xiao, X., Verger, A., Mialon, A., Al-Yaari, A., Wang, K., and Fenshold, R.: Satellite-observed major greening and biomass increase in south China karst during recent decade, Earth's Future, 6, 1017–1028, https://doi.org/10.1016/j.rse.2021.112345, 2018. a
Brown, M. E., Pinzón, J. E., Didan, K., Morisette, J. T., and Tucker, C. J.: Evaluation of the consistency of long-term NDVI time series derived from AVHRR, SPOT-vegetation, SeaWiFS, MODIS, and Landsat ETM+ sensors, IEEE T. Geosci. Remote, 44, 1787–1793, https://doi.org/10.1109/TGRS.2005.860205, 2006. a
Büechi, P. E., Fischer, M., Grlj, A., Crocetti, L., Trnka, M., and Dorigo, W. A.: Improving predictions of crop yield loss in years of severe droughts by integrating Earth observation and climate data in a machine learning framework. A case study for the Pannonian basin, Conference presentation, 2022. a
Cammalleri, C., McCormick, N., and Toreti, A.: Analysis of the relationship between yield in cereals and remotely sensed fAPAR in the framework of monitoring drought impacts in Europe, Nat. Hazards Earth Syst. Sci., 22, 3737–3750, https://doi.org/10.5194/nhess-22-3737-2022, 2022. a
CCI, L. C.: Product user guide version 2.0, UCL-Geomatics, London, UK, 2017. a, b
Chaparro, D., Piles, M., Vall-Llossera, M., Camps, A., Konings, A. G., and Entekhabi, D.: L-band vegetation optical depth seasonal metrics for crop yield assessment, Remote Sens. Environ., 212, 249–259, https://doi.org/10.1016/j.rse.2018.04.049, 2018. a
Chaparro, D., Duveiller, G., Piles, M., Cescatti, A., Vall-Llossera, M., Camps, A., and Entekhabi, D.: Sensitivity of L-band vegetation optical depth to carbon stocks in tropical forests: a comparison to higher frequencies and optical indices, Remote Sens. Environ., 232, 111303, https://doi.org/10.1016/j.rse.2019.111303, 2019. a
Chen, X., Chen, T., He, B., Liu, S., Zhou, S., and Shi, T.: The global greening continues despite increased drought stress since 2000, Global Ecol. Conserv., 49, e02791, https://doi.org/10.1016/j.gecco.2023.e02791, 2024. a
Cleveland, R. B., Cleveland, W. S., McRae, J. E., and Terpenning, I.: STL: A seasonal-trend decomposition, J. Off. Stat, 6, 3–73, 1990. a
Crocetti, L., Forkel, M., Fischer, M., Jurečka, F., Grlj, A., Salentinig, A., Trnka, M., Anderson, M., Ng, W.-T., Kokalj, Ž., Bucur, A., and Dorigo, W.: Earth Observation for agricultural drought monitoring in the Pannonian Basin (southeastern Europe): current state and future directions, Reg. Environ. Change, 20, 1–17, https://doi.org/10.1007/s10113-020-01710-w, 2020. a
Dannenberg, M., Wang, X., Yan, D., and Smith, W.: Phenological characteristics of global ecosystems based on optical, fluorescence, and microwave remote sensing, Remote Sens., 12, 671, https://doi.org/10.3390/rs12040671, 2020. a, b, c
de Nijs, A. H., Parinussa, R. M., de Jeu, R. A., Schellekens, J., and Holmes, T. R.: A methodology to determine radio-frequency interference in AMSR2 observations, IEEE T. Geosci. Remote, 53, 5148–5159, https://doi.org/10.1109/TGRS.2015.2417653, 2015. a, b, c
Dorigo, W., Wagner, W., Albergel, C., Albrecht, F., Balsamo, G., Brocca, L., Chung, D., Ertl, M., Forkel, M., Gruber, A., Haas, E., Hamer, P., Hirschi, M., de Jeu, R., Kidd, R., Liu, Y., Miralles, D., Mistelbauer, T., Nicolai-Shaw, N., Parinussa, R., Pratola, C., Reimer, C., van der Schalie, R., Seneviratne, S., Smolander, T., and Lecomte, P.: ESA CCI Soil Moisture for improved Earth system understanding: State-of-the art and future directions, Remote Sens. Environ., 203, 185–215, https://doi.org/10.1016/j.rse.2017.07.001, 2017. a, b, c
Dorigo, W., Mösinger, L., van der Schalie, R., Zotta, R.-M., Scanlon, T. M., and De Jeu, R.: Long-term monitoring of vegetation state through passive microwave satellites [in State of the Climate in 2020], B. Am. Meteorol. Soc., 102, S110–S112, https://doi.org/10.1175/2021BAMSStateoftheClimate.1, 2021. a, b
Dorigo, W., Zotta, R., van der Schalie, R., Preimesberger, W., Mösinger, L., and De Jeu, R.: Vegetation Optical Depth [in State of the Climate in 2021], B. Am. Meteorol. Soc., 103, S108–S109, https://doi.org/10.1175/BAMS-D-22-0092.1, 2022. a, b
Dorigo, W., Preimesberger, W., Stradiotti, P., Kidd, R., van der Schalie, R., van der Vliet, M., Rodriguez-Fernandez, N., Madelon, R., and Baghdadi, N.: ESA Climate Change Initiative Plus – Soil Moisture Algorithm Theoretical Baseline Document (ATBD) Supporting Product Version 08.1 (version 1.1), Zenodo https://doi.org/10.5281/zenodo.8320869, 2023. a, b, c
Dostálová, A., Wagner, W., Milenković, M., and Hollaus, M.: Annual seasonality in Sentinel-1 signal for forest mapping and forest type classification, Int. J. Remote Sens., 39, 7738–7760, https://doi.org/10.1080/01431161.2018.1479788, 2018. a
Dou, Y., Tian, F., Wigneron, J.-P., Tagesson, T., Du, J., Brandt, M., Liu, Y., Zou, L., Kimball, J. S., and Fensholt, R.: Reliability of using vegetation optical depth for estimating decadal and interannual carbon dynamics, Remote Sens. Environ., 285, 113390, https://doi.org/10.1016/j.rse.2022.113390, 2023. a, b, c
Draper, D. W., Newell, D. A., Wentz, F. J., Krimchansky, S., and Skofronick-Jackson, G. M.: The global precipitation measurement (GPM) microwave imager (GMI): Instrument overview and early on-orbit performance, IEEE J. Sel. Top. Appl. Earth Obs., 8, 3452–3462, https://doi.org/10.1109/JSTARS.2015.2403303, 2015. a
Entekhabi, D., Njoku, E. G., O’Neill, P. E., Kellogg, K. H., Crow, W. T., Edelstein, W. N., Entin, J. K., Goodman, S. D., Jackson, T. J., Johnson, J., Kimball, J., Piepmeier, J. R., Koster, R. D., Martin, N., Mcdonald, K., Moghaddam, M., Moran, S., Reichle, R., Shi, J. C., Spencer, M. W., Thurman, S. W., Tsang, L., and Van Zyl, J.: The soil moisture active passive (SMAP) mission, P. IEEE, 98, 704–716, https://doi.org/10.1109/JPROC.2010.2043918, 2010. a
Evans, S. G., Small, E., and Larson, K.: Comparison of vegetation phenology in the western USA determined from reflected GPS microwave signals and NDVI, Int. J. Remote Sens., 35, 2996–3017, https://doi.org/10.1080/01431161.2014.894660, 2014. a
Fan, L., Wigneron, J.-P., Ciais, P., Chave, J., Brandt, M., Fensholt, R., Saatchi, S. S., Bastos, A., Al-Yaari, A., Hufkens, K., Qin, Y., Xiao, X., Chen, C., Myneni, R. B., Fernandez-Moren, R., Mialon, A., Rodriguez-Fernandez, N. J., Kerr, Y., Tian, F., and Penuelas, J.: Satellite-observed pantropical carbon dynamics, Nat. Plants, 5, 944–951, https://doi.org/10.1038/s41477-019-0478-9, 2019. a
Fan, L., Wigneron, J.-P., Ciais, P., Chave, J., Brandt, M., Sitch, S., Yue, C., Bastos, A., Li, X., Qin, Y., Yuan, Q., Schepaschenko, D., Mukhortova, L., Li, X., Liu, X., Mengjia, W., Frappart, F., Xiao, X., Chen, J., Ma, M., Wen, J., Chen, X., Yang, H., Van Wees, D., and Fensholt, R.: Siberian carbon sink reduced by forest disturbances, Nat. Geosci., 16, 56–62, https://doi.org/10.1038/s41561-022-01087-x, 2023. a
Feng, Y., Zeng, Z., Searchinger, T. D., Ziegler, A. D., Wu, J., Wang, D., He, X., Elsen, P. R., Ciais, P., Xu, R., Guo, Z., Peng, L., Tao, Y, Spracklen, D. V., Holden, J., Liu, X., Zheng, Y., Xu, P., Chen, J., Jiang, X., Song, X.-P., Lakshmi, V., Wood, E. F., and Zheng, C.: Doubling of annual forest carbon loss over the tropics during the early twenty-first century, Nat. Sustain., 5, 444–451, https://doi.org/10.1038/s41893-022-00854-3, 2022. a
Forkel, M., Dorigo, W., Lasslop, G., Teubner, I., Chuvieco, E., and Thonicke, K.: A data-driven approach to identify controls on global fire activity from satellite and climate observations (SOFIA V1), Geosci. Model Dev., 10, 4443–4476, https://doi.org/10.5194/gmd-10-4443-2017, 2017. a
Forkel, M., Dorigo, W., Lasslop, G., Chuvieco, E., Hantson, S., Heil, A., Teubner, I., Thonicke, K., and Harrison, S. P.: Recent global and regional trends in burned area and their compensating environmental controls, Environ. Res. Commun., 1, 051005, https://doi.org/10.1088/2515-7620/ab25d2, 2019. a
Forkel, M., Schmidt, L., Zotta, R.-M., Dorigo, W., and Yebra, M.: Estimating leaf moisture content at global scale from passive microwave satellite observations of vegetation optical depth, Hydrol. Earth Syst. Sci., 27, 39–68, https://doi.org/10.5194/hess-27-39-2023, 2023. a
Frappart, F., Wigneron, J.-P., Li, X., Liu, X., Al-Yaari, A., Fan, L., Wang, M., Moisy, C., Le Masson, E., Aoulad Lafkih, Z., Valle, C., Ygorra, B., and Baghdadi, N.: Global monitoring of the vegetation dynamics from the Vegetation Optical Depth (VOD): A review, Remote Sens., 12, 2915, https://doi.org/10.3390/rs12182915, 2020. a
Gaiser, P.W., St Germain, K. M., Twarog, E. M., Poe, G. A., Purdy, W., Richardson, D., Grossman, W., Jones, W. L., Spencer, D., Golba, G., Cleveland, J., Choy, L., Bevilacqua, R. M., and Chang, P. S.: The WindSat spaceborne polarimetric microwave radiometer: Sensor description and early orbit performance, IEEE T. Geosci. Remote, 42, 2347–2361, https://doi.org/10.1109/TGRS.2004.836867, 2004. a
Gruber, A., Dorigo, W. A., Crow, W., and Wagner, W.: Triple collocation-based merging of satellite soil moisture retrievals, IEEE T. Geosci. Remote, 55, 6780–6792, https://doi.org/10.1109/TGRS.2017.2734070, 2017. a, b
Gruber, A., Scanlon, T., van der Schalie, R., Wagner, W., and Dorigo, W.: Evolution of the ESA CCI Soil Moisture climate data records and their underlying merging methodology, Earth Syst. Sci. Data, 11, 717–739, https://doi.org/10.5194/essd-11-717-2019, 2019. a
Hahn, S., Reimer, C., Vreugdenhil, M., Melzer, T., and Wagner, W.: Dynamic characterization of the incidence angle dependence of backscatter using metop ASCAT, IEEE J. Sel. Top. Appl. Earth Obs., 10, 2348–2359, https://doi.org/10.1109/JSTARS.2016.2628523, 2017. a, b, c, d, e
Harris, B. L., Taylor, C. M., Weedon, G. P., Talib, J., Dorigo, W., and Van Der Schalie, R.: Satellite-observed vegetation responses to intraseasonal precipitation variability, Geophys. Res. Lett., 49, e2022GL099635, https://doi.org/10.1029/2022GL099635, 2022. a
Harris, N. L., Gibbs, D. A., Baccini, A., Birdsey, R. A., de Bruin, S., Farina, M., Fatoyinbo, L., Hansen, M. C., Herold, M., Houghton, R. A., Potapov, P. V., Requena Suarez, D., Roman-Cuesta, R. M., Saatchi, S. S., Slay, C. M., Turubanova, S. A., and Tyukavina, A.: Global maps of twenty-first century forest carbon fluxes, Nat. Clim. Change, 11, 234–240, https://doi.org/10.1038/s41558-020-00976-6, 2021. a
Holmes, T., De Jeu, R., Owe, M., and Dolman, A.: Land surface temperature from Ka band (37 GHz) passive microwave observations, J. Geophys. Res.-Atmos., 114, D04113, https://doi.org/10.1029/2008JD010257, 2009. a
Jackson, T. and Schmugge, T.: Vegetation effects on the microwave emission of soils, Remote Sens. Environ., 36, 203–212, 1991. a, b
Jackson, T. J.: III. Measuring surface soil moisture using passive microwave remote sensing, Hydrol. Process., 7, 139–152, 1993. a
Jones, M. O., Jones, L. A., Kimball, J. S., and McDonald, K. C.: Satellite passive microwave remote sensing for monitoring global land surface phenology, Remote Sens. Environ., 115, 1102–1114, 2011. a
Jones, M. O., Kimball, J. S., Jones, L. A., and McDonald, K. C.: Satellite passive microwave detection of North America start of season, Remote Sens. Environ., 123, 324–333, 2012. a
Jones, M. O., Kimball, J. S., Small, E. E., and Larson, K. M.: Comparing land surface phenology derived from satellite and GPS network microwave remote sensing, Int. J. Biometeorol., 58, 1305–1315, 2014. a, b, c
Kawanishi, T., Sezai, T., Ito, Y., Imaoka, K., Takeshima, T., Ishido, Y., Shibata, A., Miura, M., Inahata, H., and Spencer, R. W.: The Advanced Microwave Scanning Radiometer for the Earth Observing System (AMSR-E), NASDA's contribution to the EOS for global energy and water cycle studies, IEEE T. Geosci. Remote, 41, 184–194, 2003. a
Kerr, Y. H. and Njoku, E. G.: A semiempirical model for interpreting microwave emission from semiarid land surfaces as seen from space, IEEE T. Geosci. Remote, 28, 384–393, 1990. a
Kerr, Y. H., Waldteufel, P., Wigneron, J.-P., Delwart, S., Cabot, F., Boutin, J., Escorihuela, M.-J., Font, J., Reul, N., Gruhier, C., Juglea, S., Drinkwater, M., Hahne, A., Martin-Neira, M., and Macklenburg, S.: The SMOS mission: New tool for monitoring key elements ofthe global water cycle, P. IEEE, 98, 666–687, https://doi.org/10.1109/JPROC.2010.2043032, 2010. a
Kim, S., Parinussa, R. M., Liu, Y. Y., Johnson, F. M., and Sharma, A.: A framework for combining multiple soil moisture retrievals based on maximizing temporal correlation, Geophys. Res. Lett., 42, 6662–6670, 2015. a, b
Kim, S., Pham, H. T., Liu, Y. Y., Marshall, L., and Sharma, A.: Improving the combination of satellite soil moisture data sets by considering error cross correlation: A comparison between triple collocation (TC) and extended double instrumental variable (EIVD) alternatives, IEEE T. Geosci. Remote, 59, 7285–7295, 2020. a, b
Knowles, K., Savoie, M., Armstrong, R., and Brodzik, M. J.: AMSR-E/Aqua Daily EASE-Grid Brightness Temperatures, Version 1, Boulder, Colorado USA, NASA National Snow and Ice Data Center Distributed Active Archive Center [data set], https://doi.org/10.5067/XIMNXRTQVMOX, 2006. a
Konings, A. G. and Gentine, P.: Global variations in ecosystem-scale isohydricity, Glob. Change Biol., 23, 891–905, 2017. a
Konings, A. G., Piles, M., Rötzer, K., McColl, K. A., Chan, S. K., and Entekhabi, D.: Vegetation optical depth and scattering albedo retrieval using time series of dual-polarized L-band radiometer observations, Remote Sens. Environ., 172, 178–189, 2016. a, b, c
Konings, A. G., Rao, K., and Steele-Dunne, S. C.: Macro to micro: microwave remote sensing of plant water content for physiology and ecology, New Phytol., 223, 1166–1172, 2019. a
Kumar, S. V., Holmes, T., Andela, N., Dharssi, I., Vinodkumar, Hain, C., Peters-Lidard, C., Mahanama, S. P., Arsenault, K. R., Nie, W., and Getirana, A.: The 2019–2020 Australian drought and bushfires altered the partitioning of hydrological fluxes, Geophys. Res. Lett., 48, e2020GL091411, https://doi.org/10.1029/2020GL091411, 2021. a
Kummerow, C., Barnes, W., Kozu, T., Shiue, J., and Simpson, J.: The tropical rainfall measuring mission (TRMM) sensor package, J. Atmos. Ocean. Tech., 15, 809–817, 1998. a
Larson, K. M. and Small, E. E.: Normalized microwave reflection index: A vegetation measurement derived from GPS networks, IEEE J. Sel. Top. Appl. Earth Obs., 7, 1501–1511, 2014. a
Li, X., Wigneron, J.-P., Frappart, F., Fan, L., Wang, M., Liu, X., Al-Yaari, A., and Moisy, C.: Development and validation of the SMOS-IC version 2 (V2) soil moisture product, in: IGARSS 2020-2020 IEEE International Geoscience and Remote Sensing Symposium, 4434–4437, https://doi.org/10.1109/IGARSS39084.2020.9323324, 2020. a, b
Li, X., Wigneron, J.-P., Frappart, F., Fan, L., Ciais, P., Fensholt, R., Entekhabi, D., Brandt, M., Konings, A. G., Liu, X., Wang, M., Al-Yaari, A. , and Moisy, C.: Global-scale assessment and inter-comparison of recently developed/reprocessed microwave satellite vegetation optical depth products, Remote Sens. Environ., 253, 112208, https://doi.org/10.1016/j.rse.2020.112208, 2021. a, b, c, d, e, f, g, h
Li, X., Wigneron, J.-P., Frappart, F., De Lannoy, G., Fan, L., Zhao, T., Gao, L., Tao, S., Ma, H., Peng, Z., Liu, X., Wang, H., Wang, M., Moisy, C., and Ciais, P.: The first global soil moisture and vegetation optical depth product retrieved from fused SMOS and SMAP L-band observations, Remote Sens. Environ., 282, 113272, https://doi.org/10.1016/j.rse.2022.113272, 2022. a
Liu, X., Wigneron, J.-P., Wagner, W., Frappart, F., Fan, L., Vreugdenhil, M., Baghdadi, N., Zribi, M., Jagdhuber, T., Tao, S., Li, X., Wang, H., Wang, M., Bai, X., Mousa, B. G., and Ciais, P.: A new global C-band vegetation optical depth product from ASCAT: Description, evaluation, and inter-comparison, Remote Sens. Environ., 299, 113850, https://doi.org/10.1016/j.rse.2023.113850, 2023. a
Liu, Y. Y., De Jeu, R. A., McCabe, M. F., Evans, J. P., and Van Dijk, A. I.: Global long-term passive microwave satellite-based retrievals of vegetation optical depth, Geophys. Res. Lett., 38, L18402, https://doi.org/10.1029/2011GL048684, 2011. a, b, c
Liu, Y. Y., Van Dijk, A. I., De Jeu, R. A., Canadell, J. G., McCabe, M. F., Evans, J. P., and Wang, G.: Recent reversal in loss of global terrestrial biomass, Nat. Clim. Change, 5, 470–474, 2015. a, b
Martens, B., Miralles, D. G., Lievens, H., van der Schalie, R., de Jeu, R. A. M., Fernández-Prieto, D., Beck, H. E., Dorigo, W. A., and Verhoest, N. E. C.: GLEAM v3: satellite-based land evaporation and root-zone soil moisture, Geosci. Model Dev., 10, 1903–1925, https://doi.org/10.5194/gmd-10-1903-2017, 2017. a, b, c
Mason, P., Zillman, J., Simmons, A., Lindstrom, E., Harrison, D., Dolman, H., Bojinski, S., Fischer, A., Latham, J., and Rasmussen, J.: Implementation plan for the global observing system for climate in support of the UNFCCC (2010 Update), http://www.ecopuerto.com/bicentenario/informes/PlanClima-Cop15.pdf (last access: 12 January 2024), 2010. a
Mateo-Sanchis, A., Piles, M., Muñoz-Marí, J., Adsuara, J. E., Pérez-Suay, A., and Camps-Valls, G.: Synergistic integration of optical and microwave satellite data for crop yield estimation, Remote Sens. Environ., 234, 111460, https://doi.org/10.1016/j.rse.2019.111460, 2019. a
Meesters, A. G., De Jeu, R. A., and Owe, M.: Analytical derivation of the vegetation optical depth from the microwave polarization difference index, IEEE Geosci. Remote Sens. Lett., 2, 121–123, 2005. a, b, c, d
Markus, T., Comiso, J. C., and Meier, W. N.: AMSR-E/AMSR2 Unified L3 Daily 25 km Brightness Temperatures & Sea Ice Concentration Polar Grids, Version 1 Boulder, Colorado USA, NASA National Snow and Ice Data Center Distributed Active Archive Center [data set], https://doi.org/10.5067/TRUIAL3WPAUP, 2018. a
Melzer, T.: Vegetation modelling in WARP 6.0, Proceedings of the EUMETSAT Meteorological Satellite Conference, Vienna, Austria, https://www-cdn.eumetsat.int/files/2020-04/pdf_conf_p_s1_07_melzer_v.pdf (last access: 3 december 2022), 2013. a
Mialon, A., Rodríguez-Fernández, N. J., Santoro, M., Saatchi, S., Mermoz, S., Bousquet, E., and Kerr, Y. H.: Evaluation of the sensitivity of SMOS L-VOD to forest above-ground biomass at global scale, Remote Sens., 12, 1450, https://doi.org/10.3390/rs12091450, 2020. a, b, c
Mladenova, I., Jackson, T., Njoku, E., Bindlish, R., Chan, S., Cosh, M., Holmes, T., De Jeu, R., Jones, L., Kimball, J., Paloscia, S., and Santi, E.: Remote monitoring of soil moisture using passive microwave-based techniques—Theoretical basis and overview of selected algorithms for AMSR-E, Remote Sens. Environ., 144, 197–213, https://doi.org/10.1016/j.rse.2014.01.013, 2014. a
Mo, T., Choudhury, B., Schmugge, T., Wang, J. R., and Jackson, T.: A model for microwave emission from vegetation-covered fields, J. Geophys. Res.-Oceans, 87, 11229–11237, 1982. a, b
Moesinger, L., Dorigo, W., de Jeu, R., van der Schalie, R., Scanlon, T., Teubner, I., and Forkel, M.: The global long-term microwave Vegetation Optical Depth Climate Archive (VODCA), Earth Syst. Sci. Data, 12, 177–196, https://doi.org/10.5194/essd-12-177-2020, 2020. a, b, c, d, e, f, g, h, i, j, k, l, m, n, o, p, q, r, s
Moesinger, L., Zotta, R.-M., van der Schalie, R., Scanlon, T., de Jeu, R., and Dorigo, W.: Monitoring vegetation condition using microwave remote sensing: the standardized vegetation optical depth index (SVODI), Biogeosciences, 19, 5107–5123, https://doi.org/10.5194/bg-19-5107-2022, 2022. a, b, c, d, e, f
Momen, M., Wood, J. D., Novick, K. A., Pangle, R., Pockman, W. T., McDowell, N. G., and Konings, A. G.: Interacting effects of leaf water potential and biomass on vegetation optical depth, J. Geophys. Res.-Biogeo., 122, 3031–3046, 2017. a
Mukunga, T., Forkel, M., Forrest, M., Zotta, R.-M., Pande, N., Schlaffer, S., and Dorigo, W.: Effect of Socioeconomic Variables in Predicting Global Fire Ignition Occurrence, Fire, 6, 197, https://doi.org/10.3390/fire6050197, 2023. a
Muñoz-Sabater, J., Dutra, E., Agustí-Panareda, A., Albergel, C., Arduini, G., Balsamo, G., Boussetta, S., Choulga, M., Harrigan, S., Hersbach, H., Martens, B., Miralles, D. G., Piles, M., Rodríguez-Fernández, N. J., Zsoter, E., Buontempo, C., and Thépaut, J.-N.: ERA5-Land: a state-of-the-art global reanalysis dataset for land applications, Earth Syst. Sci. Data, 13, 4349–4383, https://doi.org/10.5194/essd-13-4349-2021, 2021. a, b
Myneni, R. and Park, T.: MODIS/Terra+ Aqua Leaf Area Index/FPAR 4-Day L4 Global 500 m SIN Grid V061, The Land Processes Distributed Active Archive Center (LP DAAC): Sioux Falls, SD, USA, https://doi.org/10.5067/MODIS/MCD15A3H.061, 2021. a
Myneni, R. B., Hoffman, S., Knyazikhin, Y., Privette, J., Glassy, J., Tian, Y., Wang, Y., Song, X., Zhang, Y., Smith, G., Lotsch A., Friedl, M., Morisette, J. T., Votava, P., Nemani, R. R., and Running, S. W.: Global products of vegetation leaf area and fraction absorbed PAR from year one of MODIS data, Remote Sens. Environ., 83, 214–231, https://doi.org/10.1016/S0034-4257(02)00074-3, 2002. a
Myneni, R. B., Yang, W., Nemani, R. R., Huete, A. R., Dickinson, R. E., Knyazikhin, Y., Didan, K., Fu, R., Negrón Juárez, R. I., Saatchi, S. S., Hashimoto, H., Ichii, K., Shabanov, N. V., Tan, B., Ratana, P., Privette, J. L., Morisette, J. T., Vermote, E. F., Roy, D. P., Wolfe, R. E., Friedl, M. A., Running, S. W., Votava, P., El-Saleous, N., Devadiga, S., Su, Y., and Salomonson, V. V.: Large seasonal swings in leaf area of Amazon rainforests, P. Natl. Acad. Sci. USA, 104, 4820–4823, https://doi.org/10.1073/pnas.0611338104, 2007. a
Oliva, R., Daganzo, E., Kerr, Y. H., Mecklenburg, S., Nieto, S., Richaume, P., and Gruhier, C.: SMOS radio frequency interference scenario: Status and actions taken to improve the RFI environment in the 1400–1427-MHz passive band, IEEE T. Geosci. Remote, 50, 1427–1439, 2012. a
Olivares-Cabello, C., Chaparro, D., Vall-llossera, M., and Camps, A.: Monitoring Forest Above-Ground Biomass from Multifrequency Vegetation Optical Depth: A Preliminary Study, in: 2021 IEEE International Geoscience and Remote Sensing Symposium IGARSS, 6012–6015, https://doi.org/10.1109/IGARSS47720.2021.9553770, 2021. a, b
Osakabe, Y., Osakabe, K., Shinozaki, K., and Tran, L.-S. P.: Response of plants to water stress, Front. Plant Sci., 5, https://doi.org/10.3389/fpls.2014.00086, 2014. a
Owe, M., de Jeu, R., and Walker, J.: A methodology for surface soil moisture and vegetation optical depth retrieval using the microwave polarization difference index, IEEE T. Geosci. Remote, 39, 1643–1654, 2001. a
Owe, M., de Jeu, R., and Holmes, T.: Multisensor historical climatology of satellite-derived global land surface moisture, J. Geophys. Res.-Earth, 113, F01002, https://doi.org/10.1029/2007JF000769, 2008. a, b, c, d
Pearson, R. K.: Outliers in process modeling and identification, IEEE T. Control Syst. Tech., 10, 55–63, 2002. a
Petchiappan, A., Steele-Dunne, S. C., Vreugdenhil, M., Hahn, S., Wagner, W., and Oliveira, R.: The influence of vegetation water dynamics on the ASCAT backscatter–incidence angle relationship in the Amazon, Hydrol. Earth Syst. Sci., 26, 2997–3019, https://doi.org/10.5194/hess-26-2997-2022, 2022. a, b
Pfeil, I., Wagner, W., Forkel, M., Dorigo, W., and Vreugdenhil, M.: Does ASCAT observe the spring reactivation in temperate deciduous broadleaf forests?, Remote Sens. Environ., 250, 112042, https://doi.org/10.1016/j.rse.2020.112042, 2020. a
Piao, S., Wang, X., Park, T., Chen, C., Lian, X., He, Y., Bjerke, J. W., Chen, A., Ciais, P., Tømmervik, H., Nemani, R. R., and and Myneni, R. B.: Characteristics, drivers and feedbacks of global greening, Nat. Rev. Earth Environ., 1, 14–27, https://doi.org/10.1038/s43017-019-0001-x, 2020. a
Poyatos, R., Granda, V., Flo, V., Adams, M. A., Adorján, B., Aguadé, D., Aidar, M. P. M., Allen, S., Alvarado-Barrientos, M. S., Anderson-Teixeira, K. J., Aparecido, L. M., Arain, M. A., Aranda, I., Asbjornsen, H., Baxter, R., Beamesderfer, E., Berry, Z. C., Berveiller, D., Blakely, B., Boggs, J., Bohrer, G., Bolstad, P. V., Bonal, D., Bracho, R., Brito, P., Brodeur, J., Casanoves, F., Chave, J., Chen, H., Cisneros, C., Clark, K., Cremonese, E., Dang, H., David, J. S., David, T. S., Delpierre, N., Desai, A. R., Do, F. C., Dohnal, M., Domec, J.-C., Dzikiti, S., Edgar, C., Eichstaedt, R., El-Madany, T. S., Elbers, J., Eller, C. B., Euskirchen, E. S., Ewers, B., Fonti, P., Forner, A., Forrester, D. I., Freitas, H. C., Galvagno, M., Garcia-Tejera, O., Ghimire, C. P., Gimeno, T. E., Grace, J., Granier, A., Griebel, A., Guangyu, Y., Gush, M. B., Hanson, P. J., Hasselquist, N. J., Heinrich, I., Hernandez-Santana, V., Herrmann, V., Hölttä, T., Holwerda, F., Irvine, J., Isarangkool Na Ayutthaya, S., Jarvis, P. G., Jochheim, H., Joly, C. A., Kaplick, J., Kim, H. S., Klemedtsson, L., Kropp, H., Lagergren, F., Lane, P., Lang, P., Lapenas, A., Lechuga, V., Lee, M., Leuschner, C., Limousin, J.-M., Linares, J. C., Linderson, M.-L., Lindroth, A., Llorens, P., López-Bernal, Á., Loranty, M. M., Lüttschwager, D., Macinnis-Ng, C., Maréchaux, I., Martin, T. A., Matheny, A., McDowell, N., McMahon, S., Meir, P., Mészáros, I., Migliavacca, M., Mitchell, P., Mölder, M., Montagnani, L., Moore, G. W., Nakada, R., Niu, F., Nolan, R. H., Norby, R., Novick, K., Oberhuber, W., Obojes, N., Oishi, A. C., Oliveira, R. S., Oren, R., Ourcival, J.-M., Paljakka, T., Perez-Priego, O., Peri, P. L., Peters, R. L., Pfautsch, S., Pockman, W. T., Preisler, Y., Rascher, K., Robinson, G., Rocha, H., Rocheteau, A., Röll, A., Rosado, B. H. P., Rowland, L., Rubtsov, A. V., Sabaté, S., Salmon, Y., Salomón, R. L., Sánchez-Costa, E., Schäfer, K. V. R., Schuldt, B., Shashkin, A., Stahl, C., Stojanović, M., Suárez, J. C., Sun, G., Szatniewska, J., Tatarinov, F., Tesař, M., Thomas, F. M., Tor-ngern, P., Urban, J., Valladares, F., van der Tol, C., van Meerveld, I., Varlagin, A., Voigt, H., Warren, J., Werner, C., Werner, W., Wieser, G., Wingate, L., Wullschleger, S., Yi, K., Zweifel, R., Steppe, K., Mencuccini, M., and Martínez-Vilalta, J.: Global transpiration data from sap flow measurements: the SAPFLUXNET database, Earth Syst. Sci. Data, 13, 2607–2649, https://doi.org/10.5194/essd-13-2607-2021, 2021. a
Qin, Y., Xiao, X., Wigneron, J.-P., Ciais, P., Brandt, M., Fan, L., Li, X., Crowell, S., Wu, X., Doughty, R., Zhang, Y., Liu, F., Sitch, S., and Moore III, B.: Carbon loss from forest degradation exceeds that from deforestation in the Brazilian Amazon, Nat. Clim. Change, 11, 442–448, https://doi.org/10.1038/s41558-021-01026-5, 2021. a, b
Rodríguez-Fernández, N. J., Mialon, A., Mermoz, S., Bouvet, A., Richaume, P., Al Bitar, A., Al-Yaari, A., Brandt, M., Kaminski, T., Le Toan, T., Kerr, Y. H., and Wigneron, J.-P.: An evaluation of SMOS L-band vegetation optical depth (L-VOD) data sets: high sensitivity of L-VOD to above-ground biomass in Africa, Biogeosciences, 15, 4627–4645, https://doi.org/10.5194/bg-15-4627-2018, 2018. a, b, c, d
Saatchi, S. S., Harris, N. L., Brown, S., Lefsky, M., Mitchard, E. T., Salas, W., Zutta, B. R., Buermann, W., Lewis, S. L., Hagen, S., Petrova, S., White, L., Silman, M., and Morel, A.: Benchmark map of forest carbon stocks in tropical regions across three continents, P. Nat. Acad. Sci. USA, 108, 9899–9904, https://doi.org/10.1073/pnas.1019576108, 2011. a
Santoro, M. and Cartus, O.: ESA biomass climate change initiative (Biomass_cci): Global datasets of forest above-ground biomass for the years 2010, 2017 and 2018, v2, Cent. Environ. Data Anal, https://doi.org/10.5285/af60720c1e404a9e9d2c145d2b2ead4, 2021. a
Sawada, Y., Tsutsui, H., Koike, T., Rasmy, M., Seto, R., and Fujii, H.: A field verification of an algorithm for retrieving vegetation water content from passive microwave observations, IEEE T. Geosci. Remote, 54, 2082–2095, 2015. a
Schmidt, L., Forkel, M., Zotta, R.-M., Scherrer, S., Dorigo, W. A., Kuhn-Régnier, A., van der Schalie, R., and Yebra, M.: Assessing the sensitivity of multi-frequency passive microwave vegetation optical depth to vegetation properties, Biogeosciences, 20, 1027–1046, https://doi.org/10.5194/bg-20-1027-2023, 2023. a, b, c, d, e
Small, E. E., Roesler, C. J., and Larson, K. M.: Vegetation response to the 2012–2014 California drought from GPS and optical measurements, Remote Sens., 10, 630, https://doi.org/10.3390/rs10040630, 2018. a
Smith, T., Traxl, D., and Boers, N.: Empirical evidence for recent global shifts in vegetation resilience, Nat. Clim. Change, 12, 477–484, 2022. a, b
Smith, T., Zotta, R.-M., Boulton, C. A., Lenton, T. M., Dorigo, W., and Boers, N.: Reliability of resilience estimation based on multi-instrument time series, Earth Syst. Dynam., 14, 173–183, https://doi.org/10.5194/esd-14-173-2023, 2023. a, b, c
Song, X.-P., Hansen, M. C., Stehman, S. V., Potapov, P. V., Tyukavina, A., Vermote, E. F., and Townshend, J. R.: Global land change from 1982 to 2016, Nature, 560, 639–643, 2018. a, b
Steele-Dunne, S. C., Hahn, S., Wagner, W., and Vreugdenhil, M.: Investigating vegetation water dynamics and drought using Metop ASCAT over the North American Grasslands, Remote Sens. Environ., 224, 219–235, 2019. a, b, c
Tagesson, T., Tian, F., Schurgers, G., Horion, S., Scholes, R., Ahlström, A., Ardö, J., Moreno, A., Madani, N., Olin, S., and Fensholt, R.: A physiology-based Earth observation model indicates stagnation in the global gross primary production during recent decades, Glob. Change Biol., 27, 836–854, https://doi.org/10.1111/gcb.15424, 2021. a
Teubner, I. E., Forkel, M., Jung, M., Liu, Y. Y., Miralles, D. G., Parinussa, R., Van der Schalie, R., Vreugdenhil, M., Schwalm, C. R., Tramontana, G., Camps-Valls, G., and Dorigo, W. A.: Assessing the relationship between microwave vegetation optical depth and gross primary production, Int. J. Appl. Earth Obs., 65, 79–91, https://doi.org/10.1016/j.jag.2017.10.006, 2018. a, b
Teubner, I. E., Forkel, M., Camps-Valls, G., Jung, M., Miralles, D. G., Tramontana, G., Van der Schalie, R., Vreugdenhil, M., Mösinger, L., and Dorigo, W. A.: A carbon sink-driven approach to estimate gross primary production from microwave satellite observations, Remote Sens. Environ., 229, 100–113, 2019. a
Teubner, I. E., Forkel, M., Wild, B., Mösinger, L., and Dorigo, W.: Impact of temperature and water availability on microwave-derived gross primary production, Biogeosciences, 18, 3285–3308, https://doi.org/10.5194/bg-18-3285-2021, 2021. a
Tian, F., Fensholt, R., Verbesselt, J., Grogan, K., Horion, S., and Wang, Y.: Evaluating temporal consistency of long-term global NDVI datasets for trend analysis, Remote Sens. Environ., 163, 326–340, 2015. a
Tian, F., Wigneron, J.-P., Ciais, P., Chave, J., Ogée, J., Peñuelas, J., Ræbild, A., Domec, J.-C., Tong, X., Brandt, M., Mialon, A., Rodriguez-Fernandez, N., Tagesson, T., Al-Yaari, A., Kerr, Y., Chen, C., Myneni, R. B., Zhang, W., Ardö, J., and Fensholt, R.: Coupling of ecosystem-scale plant water storage and leaf phenology observed by satellite, Nat. Ecol. Evol., 2, 1428–1435, https://doi.org/10.1038/s41559-018-0630-3, 2018. a
Van der Schalie, R., de Jeu, R. A., Kerr, Y. H., Wigneron, J.-P., Rodríguez-Fernández, N. J., Al-Yaari, A., Parinussa, R. M., Mecklenburg, S., and Drusch, M.: The merging of radiative transfer based surface soil moisture data from SMOS and AMSR-E, Remote Sens. Environ., 189, 180–193, 2017. a, b, c, d
van der Schalie, R., van der Vliet, M., Rodríguez-Fernández, N., Dorigo, W. A., Scanlon, T., Preimesberger, W., Madelon, R., and de Jeu, R. A.: L-band soil moisture retrievals using microwave based temperature and filtering. Towards model-independent climate data records, Remote Sens., 13, 2480, https://doi.org/10.3390/rs13132480, 2021. a
van der Vliet, M., van der Schalie, R., Rodriguez-Fernandez, N., Colliander, A., de Jeu, R., Preimesberger, W., Scanlon, T., and Dorigo, W.: Reconciling flagging strategies for multi-sensor satellite soil moisture climate data records, Remote Sens., 12, 3439, https://doi.org/10.3390/rs12203439, 2020. a, b, c
Van Dijk, A. I., Beck, H. E., Crosbie, R. S., De Jeu, R. A., Liu, Y. Y., Podger, G. M., Timbal, B., and Viney, N. R.: The Millennium Drought in southeast Australia (2001–2009): Natural and human causes and implications for water resources, ecosystems, economy, and society, Water Resour. Res., 49, 1040–1057, 2013. a
Vandegehuchte, M. W. and Steppe, K.: Corrigendum to: Sap-flux density measurement methods: working principles and applicability, Funct. Plant Biol., 40, 1088–1088, 2013. a
Vreugdenhil, M., Dorigo, W. A., Wagner, W., De Jeu, R. A., Hahn, S., and Van Marle, M. J.: Analyzing the vegetation parameterization in the TU-Wien ASCAT soil moisture retrieval, IEEE T. Geoscie. Remote, 54, 3513–3531, 2016. a, b, c, d, e, f, g
Vreugdenhil, M., Hahn, S., Melzer, T., Bauer-Marschallinger, B., Reimer, C., Dorigo, W. A., and Wagner, W.: Assessing vegetation dynamics over mainland Australia with Metop ASCAT, IEEE J. Sel. Top. Appl. Earth Obs., 10, 2240–2248, 2017. a, b, c, d
Vreugdenhil, M., Navacchi, C., Bauer-Marschallinger, B., Hahn, S., Steele-Dunne, S., Pfeil, I., Dorigo, W., and Wagner, W.: Sentinel-1 cross ratio and vegetation optical depth: A comparison over Europe, Remote Sens., 12, 3404, https://doi.org/10.3390/rs12203404, 2020. a, b, c
Vreugdenhil, M., Greimeister-Pfeil, I., Preimesberger, W., Camici, S., Dorigo, W., Enenkel, M., van der Schalie, R., Steele-Dunne, S., and Wagner, W.: Microwave remote sensing for agricultural drought monitoring: Recent developments and challenges, Front. Water, 4, 1045451, https://doi.org/10.3389/frwa.2022.1045451, 2022. a, b
Wagner, W., Lindorfer, R., Melzer, T., Hahn, S., Bauer-Marschallinger, B., Morrison, K., Calvet, J.-C., Hobbs, S., Quast, R., Greimeister-Pfeil, I., and Vreugdenhil, M.: Widespread occurrence of anomalous C-band backscatter signals in arid environments caused by subsurface scattering, Remote Sens. Environ., 276, 113025, https://doi.org/10.1016/j.rse.2022.113025, 2022. a
Wentz, F. J.: A well-calibrated ocean algorithm for special sensor microwave/imager, J. Geophys. Res.-Oceans, 102, 8703–8718, 1997. a
Wigneron, J.-P., Kerr, Y.,Waldteufel, P., Saleh, K., Escorihuela, M.-J., Richaume, P., Ferrazzoli, P., De Rosnay, P., Gurney, R., Calvet, J.-C., Grant, J. P., Guglielmetti, M., Hornbuckle, B., Mätzler, C., Pellarin, T., and Schwank, M.: L-band Microwave Emission of the Biosphere (L-MEB) Model: Description and calibration against experimental data sets over crop fields, Remote Sens. Environ., 107, 639–655, 2007. a
Wigneron, J.-P., Jackson, T. J., O'Neill, P., De Lannoy, G., de Rosnay, P., Walker, J. P., Ferrazzoli, P., Mironov, V., Bircher, S., Grant, J. P., Kurum, M., Schwank, M., Munoz-Sabater, J., Das, N., Royer, A., Al-Yaari, A., Al Bitar, A., Fernandez-Moran, R., Lawrence, H., Mialon, A., and Kerr, Y.: Modelling the passive microwave signature from land surfaces: A review of recent results and application to the L-band SMOS & SMAP soil moisture retrieval algorithms, Remote Sens. Environ., 192, 238–262, https://doi.org/10.1016/j.rse.2017.01.024, 2017. a
Wigneron, J.-P., Li, X., Frappart, F., Fan, L., Al-Yaari, A., De Lannoy, G., Liu, X., Wang, M., Le Masson, E., and Moisy, C.: SMOS-IC data record of soil moisture and L-VOD: Historical development, applications and perspectives, Remote Sens. Environ., 254, 112238, https://doi.org/10.1016/j.rse.2020.112238, 2021. a, b, c, d
Wild, B., Teubner, I., Moesinger, L., Zotta, R.-M., Forkel, M., van der Schalie, R., Sitch, S., and Dorigo, W.: VODCA2GPP – a new, global, long-term (1988–2020) gross primary production dataset from microwave remote sensing, Earth Syst. Sci. Data, 14, 1063–1085, https://doi.org/10.5194/essd-14-1063-2022, 2022. a, b, c
World Meteorological Organization: WMO guidelines on the calculation of climate normals, 18, WMO-No. 1203, 2017. a
Xu, L., Saatchi, S. S., Yang, Y., Yu, Y., Pongratz, J., Bloom, A. A., Bowman, K., Worden, J., Liu, J., Yin, Y., Domke, G., McRoberts, R. E., Woodall, C., Nabuurs, G.-J., de-Miguel, S., Keller, M., Harris, N., Maxwell, S., and Schime, D.: Changes in global terrestrial live biomass over the 21st century, Sci. Adv., 7, eabe9829, https://doi.org/10.1126/sciadv.abe9829, 2021. a
Yang, H., Ciais, P., Wigneron, J.-P., Chave, J., Cartus, O., Chen, X., Fan, L., Green, J. K., Huang, Y., Joetzjer, E., Kay, H., Makowski, D., Maignan, F., Santoro, M., Tao, S., Liu, L., and Yao, Y.: Climatic and biotic factors influencing regional declines and recovery of tropical forest biomass from the 2015/16 El Niño, P. Natl. Acad. Sci. USA, 119, e2101388119, https://doi.org/10.1073/pnas.2101388119, 2022. a
Yang, H., Ciais, P., Frappart, F., Li, X., Brandt, M., Fensholt, R., Fan, L., Saatchi, S., Besnard, S., Deng, Z., Bowring, S., and Wigneron, J. P.: Global increase in biomass carbon stock dominated by growth of northern young forests over past decade, Nat. Geosci., 16, 886–892, https://doi.org/10.1038/s41561-023-01274-4, 2023. a
Zhang, Y., Song, C., Band, L. E., Sun, G., and Li, J.: Reanalysis of global terrestrial vegetation trends from MODIS products: Browning or greening?, Remote Sens. Environ., 191, 145–155, 2017. a
Zotta, R., van der Schalie, R., Preimesberger, W., Mösinger, L., De Jeu, R., and Dorigo, W.: Vegetation Optical Depth [in State of the Climate in 2022], B. Am. Meteorol. Soc., 104, S110–S112, 2023. a, b
Zotta, R.-M., Moesinger, L., van der Schalie, R., Preimesberger, W., Frederikse, T., De Jeu, R., and Dorigo, W.: VODCA v2: Multi-sensor, multi-frequency vegetation optical depth data for long-term canopy dynamics and biomass monitoring (1.0.0), TU Wien [data set], https://doi.org/10.48436/7sjqa-fyw66, 2024. a, b


