the Creative Commons Attribution 4.0 License.
the Creative Commons Attribution 4.0 License.
 | 09 Oct 2024
Crop-specific management history of phosphorus fertilizer input (CMH-P) in the croplands of the United States: reconciliation of top-down and bottom-up data sources
Peiyu Cao
Franco Bilotto
Carlos Gonzalez Fischer
Mario Herrero
Understanding and assessing the spatiotemporal patterns in crop-specific phosphorus (P) fertilizer management are crucial for enhancing crop yield and mitigating environmental problems. The existing P fertilizer dataset, derived from sales data, depicts an average application rate over total cropland at the county level but overlooks cross-crop variations. Conversely, the survey-based dataset offers crop-specific application details at the state level yet lacks inter-state variability. By reconciling these two datasets, we developed long-term gridded maps to characterize crop-specific P fertilizer application rates, timing, and methods across the contiguous US at a resolution of 4 km × 4 km from 1850 to 2022. We found that P fertilizer application rate over fertilized areas in the US increased from 0.9 g P m−2 yr−1 in 1940 to 1.9 g P m−2 yr−1 in 2022, with substantial variations among crops. However, approximately 40 % of cropland nationwide has remained unfertilized in the recent decade. The hotspots for P fertilizer use have shifted from the southeastern and eastern US to the Midwest and the Great Plains over the past century, reflecting changes in cropland area, crop choices, and P fertilizer use across different crops. Pre-planting (fall and spring) and broadcast application are prevalent among corn, soybean, and cotton in the Midwest and the Southeast, indicating a high P loss risk in these regions. In contrast, wheat and barley in the Great Plains receive the most intensive P fertilization at planting and via non-broadcast application. The P fertilizer management dataset developed in this study can advance our comprehension of agricultural P budgets and facilitate the refinement of best P fertilizer management practices to optimize crop yield and to reduce P loss. Datasets are available at https://doi.org/10.5281/zenodo.10700821 (Cao et al., 2024).
- Article
(11482 KB) - Full-text XML
-
Supplement
(1626 KB) - BibTeX
- EndNote


Phosphorus (P) is fundamental for life on Earth, serving as a crucial component of genetic material, cellular membranes, and adenosine triphosphate for energy storage. The application of P has facilitated unprecedented increases in food, feed, fiber, and fuel production and is one of the cornerstones of modern agriculture (Tilman et al., 2002). Before the 19th century, the major P sources for agricultural land were animal and human excreta, along with slaughterhouse byproducts (Cordell et al., 2009; Bouwman et al., 2013). Starting around the mid-to-late 19th century, the production of mineral P fertilizers from phosphate rock grew rapidly until after the middle 20th century (Lu and Tian, 2017). The application of mineral P fertilizer increased from 1.0 to 1.7 Tg P yr−1 from 1960 to 2017 in the US (Samreen, 2019), rectifying the P deficiency of soils. However, P application was found to exceed the crop needs by up to 50 % in many regions across the US (Glibert, 2020; Sabo et al., 2021). A substantial part of the surplus P, defined as the difference between the input and removal by crops, can be lost through soluble P in runoff and subsurface flow and through particulate P in soil erosion. These losses can accumulate along transport pathways such as soils, riparian areas, streams, and wetlands, leading to long-term impacts on P loading (Sharpley et al., 2013; Stackpoole et al., 2019). Increased P loading has contributed to the harmful algal blooms and large hypoxia zone which degrade aquatic ecosystems and harm coastal economies by destroying habitats, disrupting the food web, and damaging tourism and fisheries (Zhang et al., 2010). To improve P use efficiency in agriculture and to mitigate the environmental impacts of excessive P, it is essential to understand the spatial distribution and temporal dynamics of P fertilizer use.
Developing a contemporary P fertilizer dataset is challenging due to incomplete data from multiple sources and the lack of information on crop-specific applications. Previous studies have shown the historical county-level P fertilizer consumption in the US from 1945 to 2017, following a top-down approach that relies on state-level fertilizer sales data and county-level fertilizer expenditure data (Alexander and Smith, 1990; Falcone, 2021; Brakebill and Gronberg, 2017). In these studies, the average P fertilizer application was estimated by dividing the consumption by the total cropland area within each county. These top-down P fertilizer databases utilize a single value for the average P fertilizer use, overlooking cross-crop variations. Additionally, the percentage of fertilized area relative to the total planting area varies significantly among different crops (USDA-ERS, 2019). As not all planting areas are fertilized, distributing the total P fertilizer application over the total planting area has underestimated the actual application rate in the fertilized fields. Characterizing the spatial and temporal heterogeneity of crop-specific P fertilizer application rates due to different P demands across crop types can offer deeper insights into P use efficiency, budget trajectories, and P-loading analysis (Sabo et al., 2021; Stackpoole et al., 2019; Swaney and Howarth, 2019). P fertilizer management practices, such as application timing and method, also differ among crop types and are crucial for optimal nutrient management. For example, over 30 % of rice fields in the US received injected P fertilizer, whereas around 40 % of corn fields received broadcasting P fertilizer (USDA-ERS, 2024), implying high potential P loss by runoff and erosion from corn fields. A bottom-up approach, based on crop-specific P fertilizer application rates and management practices over the treated areas, can help to improve the performance of models and develop P fertilizer conserving strategies. However, to the best of our knowledge, there is a lack of comprehensive bottom-up databases that provide long-term, spatially explicit, crop-specific P fertilizer management data across the US.
By combining the top-down (total P consumption and average P application rate) and bottom-up (crop-specific P application rate) datasets, we developed a spatially explicit time series database to characterize agricultural P fertilizer application rates, timing, and methods in the contiguous US (CONUS) at a 4 km resolution from 1850 to 2022. The main objectives of this study are (1) to characterize the spatiotemporal patterns of P fertilizer application rates across the US over the last 170 years by considering P fertilizer management differences among crops and (2) to investigate the spatial patterns of P fertilizer application timing and methods.
We reconstructed the annual state-level crop-specific P fertilizer (hereafter referred to as P) application rate from 1850 to 2022 using the same methodology as in Cao et al. (2018) by integrating and gap-filling multiple sources. Subsequently, the crop-specific P fertilizer application rate was adjusted to match the state-level total P consumption. Using the same approach as in Zhang et al. (2021), we further downscaled the application rate to the county level during 1930–2022 based on the county-level P consumption and cropland acreage of each crop type (Ye et al., 2024). We split the annual P application rate generated above into four application timings and three application methods according to the statewide crop-specific survey data during the study period. The datasets of crop-specific P fertilizer management (application rate, timing, and method) generated above were then spatialized into gridded maps based on annual time series maps of crop area and type at the spatial resolution of 1 km × 1 km across the CONUS (Ye et al., 2024) (Fig. 1).
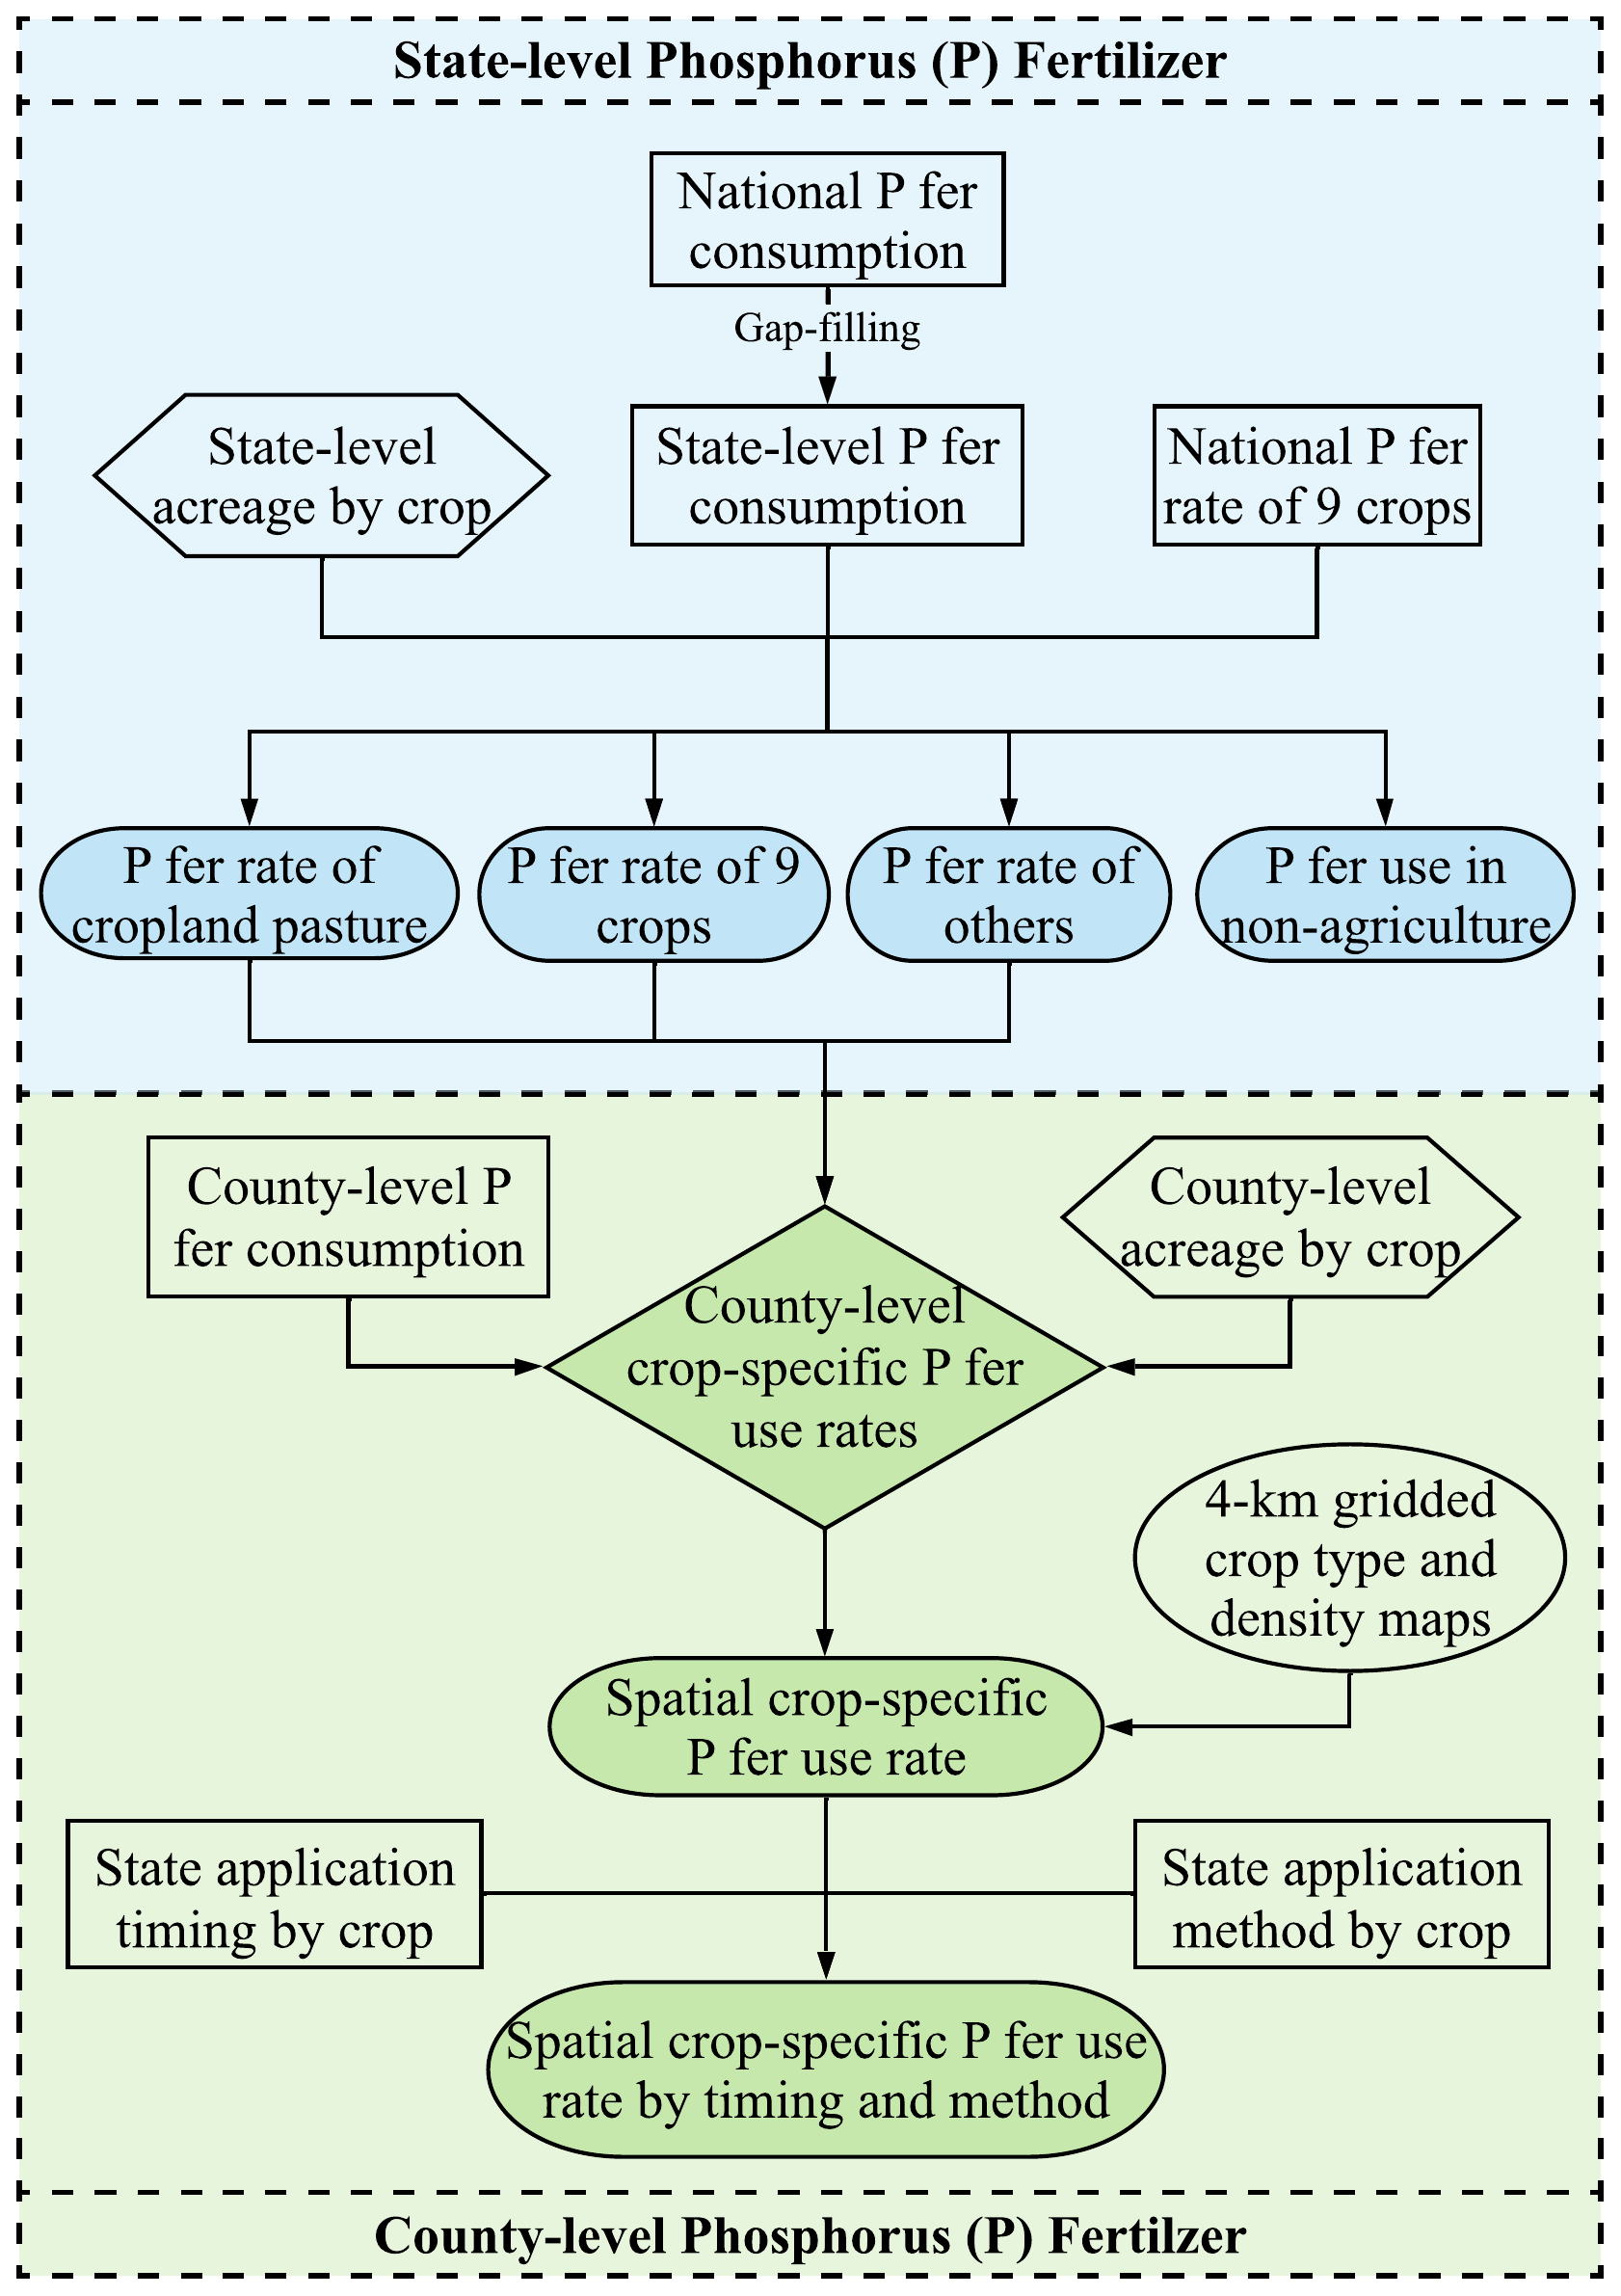
Figure 1Diagram for P fertilizer management dataset development. The upper blue box represents the data development of state-level crop-specific P fertilizer application rates based on the bottom-up dataset. The lower green box represents the data development of county-level P fertilizer application rate by reconciling the top-down and bottom-up datasets.
2.1 Historical P fertilizer use rate reconstruction
2.1.1 P fertilizer consumption
We obtained the historical P consumption from 1850 to 2022 for the CONUS by harmonizing the national P consumption data from Mehring et al. (1957) for 1850–1951, from USDA (1971) for 1952–1959, from USDA-ERS (2019) for 1960–2015, and from FAO (2021) for 2016–2022.
We integrated the annual state-level P consumption from multiple sources that cover different periods during 1930–2016 (Table S1 in the Supplement). We gap-filled the unavailable state-level P consumption data for the periods prior to 1930 and during 2017–2022 by means of one-way interpolation (Eq. 1) using the national P consumption generated above as a reference. On the other hand, the periods of 1970–1975 and 1978–1987 were gap-filled by distance-weighted interpolation (Eq. 2). The state-level P consumption generated above includes all crops, cropland pastures, permanent pastures, and non-farm lands (Table S2). By harmonizing and linearly interpolating the ratio of the P consumption of these lands to the total consumption from multiple sources, we calculated the P consumption of croplands, cropland pastures, permanent pastures, and non-farms from 1850 to 2022 in each state (see Supplement for details). We calculated the state-level P application rate of croplands by dividing the P fertilizer consumption of croplands by the total cropland area of each state.
Based on state fertilizer sales data provided by AAPFCO (2022) and county-level fertilizer expenditure data from the USDA Census, the county-level P consumption was estimated every 5 years from 1950 to 2017, with 1987–2016 being annually interpolated (Falcone, 2021; NuGIS, 2022). The missing years were interpolated using Eq. (2) during the periods of 1950–1986 and 2013–2016 and using Eq. (1) before 1950 and after 2017, using the state-level P consumption generated above as a reference. The state shares of different lands were applied to estimate the P consumption of these lands in each county.
In the above, the phrase “raw data” refers to the raw data that contain missing values, “referenced trend” is the complete data providing inter-annual variations that raw data can refer to, i and j are the beginning and ending years of the gap, and i+k is the kth missing year. Equation (1) was used when the beginning or ending year was unavailable, whereas Eq. (2) was used when both years were available.
2.1.2 Referenced state-level crop-specific P application rate
The national P application rates of nine major crop types, including corn, soybean, winter wheat, spring wheat, cotton, sorghum, rice, barley, and durum wheat, from 1927 to 2022 were obtained by integrating multiple data sources (Table S4). In contrast to the state-level P application rate generated in Sect. 2.1.1, reflecting the inter-annual variation of each state, the national crop-specific P application rate characterizes the variation of each crop at the national scale. We gap-filled the national crop-specific P application rate for the period of 1850–2022 by using state-level P application rates as a reference. For the period before 1927, when national crop-specific P application rates were unavailable, Eq. (1) was used to retrieve the P application rate of each crop. For the period from 1927 to 2022, the cubic-spline interpolation method was used to gap-fill P application rates when raw data were missing for less than 3 consecutive years. On the other hand, Eq. (2) was applied to gap-filling when data were found to be missing for more than 3 consecutive years.
Four regression models, quadratic, cubic, exponential, and logarithmic functions, were built between the interpolated national crop-specific P application rates and the raw state-level crop-specific P application rates of nine crops from 1954 to 2022. The best-fitting model was used to adjust the national crop-specific P application rates (Cao et al., 2018). Finally, the interpolated national crop-specific P application rates from 1850 to 1953 with no adjustments and those from 1954 to 2022 with adjustments jointly served as the referenced state-level crop-specific P application rate trend.
2.1.3 State- and county-level crop-specific P application rates
We obtained the state-level crop-specific P application rates of nine crops from 1954 to 2022 from the same data sources as for national crop-specific P application rates (Table S4). This includes the information regarding P application rates in the fertilized croplands and the percentage of fertilized croplands. Due to the lack of information required to identify the fertilized croplands spatially, the P application rates were adjusted by multiplying use rates with fertilized-cropland percentages. For winter wheat, spring wheat, and durum wheat, only the total P consumption of these three wheat types was available at the state level for the period of 1954–1989. The wheat types planted in each state were determined based on the Agricultural Chemical Use Survey (USDA-NASS, 2021). We calculated the fractions of P consumption for each wheat type in relation to the total P consumption of all wheat types in each state in 1990. This fraction was used to estimate the P consumption of each wheat type for the period of 1954–1989. The P application rate of each wheat type was then calculated as P consumption divided by the planting area of the corresponding wheat type.
For the period from 1850 to 1953, the state-level P application rates of nine crops were gap-filled by Eq. (1) using the referenced P application rate generated in Sect. 2.1.2. On the other hand, Eq. (2) and the cubic-spline method were used to gap-fill the missing years between 1954 and 2022 for instances of, respectively, more or less than 3 consecutive years of missing data. The P consumption of cropland pasture calculated in Sect. 2.1.1 was divided by the area in each state to generate the cropland pasture P application rate. The P consumption of all other crops in each state was calculated by subtracting the P consumption of nine crops, cropland pastures, permanent pastures, and non-farms from the state total P consumption. The P use rate of “other crops” was generated by dividing the P consumption by the area of other crops. Due to the mismatch between state total P consumption from top-down sales data and crop-specific P consumption from the bottom-up survey, the summed P consumption of nine major crops exceeds the state total P amount in some states (Fig. S1 in the Supplement), resulting in a negative rate of other crops. We adjusted the crop-specific application rates of major crops to match the state total P consumption by assuming that total P consumption data from top-down sources are more reliable. First, we reconstructed the positive application rates of other crops in each state. If the 10-year moving average of the positive application rates of the other crops was available, we used it to replace the negative rates of the other crops. Otherwise, if the moving average was unavailable, we interpolated the gaps using the area-weighted mean of other crops across all states within the corresponding region as the reference trend. The selection of Eqs. (1) and (2) for interpolation depends on the availability of the beginning and ending year of the gap. After excluding the P fertilizer consumption of cropland pastures, other crops, permanent pastures, and non-farm uses from the state total P consumption, we used the remaining total consumption to scale the crop-specific P fertilizer application rates for major crops. Specifically, for certain crops that exhibit abnormal change trends in some states due to inadequate survey data (e.g., corn in Illinois), we manually adjusted the rates for these crops to align with the differences (Fig. S2).
By assuming that the relative ratios of P application rates among crop types in counties follow their state-level patterns in the same year, the crop-specific P application rate generated above was downscaled from the state level to the county level using Eq. (3) from 1930 to 2022. The P consumption of each crop within a given county was calculated by multiplying the state-level P application rate by the planting acreage. A scaler was then calculated by dividing the county total P consumption by the summation of the P consumption of all crop types to adjust the state-level P use rates for each crop within this county.
In the above, P rate is the P application rate of crop type i in a given county; P consct is the annual county P consumption; P rate is the P application rate of crop type j in state “st”; area is county-level planting area of crop type j; and crops include the nine aforementioned crops, cropland pastures, and other crops.
2.2 P fertilizer application timing
By using the same approach as Cao et al. (2018), we estimated the P use at four application timings: fall (previous year), spring (before planting), at planting, and after planting of nine major crops in each state from 1996 to 2013 from a statewide survey by USDA-ERS (2024) (Table S5). The raw data include crop-specific P fertilizer application rates and percentages of the fertilized cropland for each of the four timings in each state. We calculated the P fertilizer consumption at each timing by multiplying the application rate with the area percentage and the total cropland area. The fraction of the P fertilizer consumption at each timing was used to split the annual P fertilizer application rate generated in Sect. 2.1 into four application timings. The years before 1996 and after 2013 were assumed to adopt the same application-timing strategy as the years 1996 and 2013, respectively. We linearly interpolated the fractions of missing years between 1996 and 2013. The average application-timing fraction based on the fraction of the eight abovementioned major crops (excluding winter wheat), peanuts, and oats was used for cropland pastures and other crops.
2.3 P fertilizer application method
USDA-ERS (2024) reported, for each crop, the percentages of cropland fertilized by five P application methods during 1996–2013 based on a statewide survey (Table S5). For the years before 1996 and after 2013, we assume that farmers adopted the same application method strategy as the years 1996 and 2013, respectively. Due to the low adoption rate of the two mixed methods (mixed method with incorporation and mixed method without incorporation, <5 %), we regrouped all five methods into three types: no broadcasting (e.g., chisel, knifed in, and banded in), incorporation (broadcasting with incorporation and mixed method with incorporation), and no incorporation (broadcasting without incorporation and mixed method without incorporation). We calculated the fraction of cropland fertilized by each method in relation to the total fertilized cropland to split the annual P application rate into three application methods. The average application method fraction of eight major crops (excluding winter wheat), peanuts, and oats was used for cropland pastures and other crops.
2.4 Developing gridded maps for characterizing P fertilizer management history
To characterize the variation in spatial P fertilizer management information, we assigned the state-level (1850–1929) and county-level (1930–2021) crop-specific P fertilizer management data generated above to 1 km × 1 km gridded maps based on historical crop type distribution maps of the CONUS from 1850 to 2022 developed by Ye et al. (2024). It is worth noting that the P fertilizer management information remains consistent for the same crop within a given county but varies across crops, while 1 km annual crop type and area maps help add spatial heterogeneity in terms of P fertilizer input within a county. The crop type distribution maps were developed using satellite images and imputed county-level planting area of each crop type from the USDA National Agricultural Statistics Service (USDA-NASS, 2024). We timed the gridded P application rate with crop density maps to convert the unit of P use rate from grams P per cropland area to grams P per land area. The crop density maps were reconstructed by integrating various sources of inventory and satellite data, representing the percentage of cropland within each pixel. More details about the land cover maps can be found in Ye et al. (2024). We then resampled the P fertilizer management maps a 4 km × 4 km resolution for display purposes. To examine the regional discrepancy of P fertilizer management in the study area, we partitioned the CONUS into seven regions according to the US-FNCA (2022), including the Northwest (NW), the Southwest (SW), the Northern Great Plains (NGP), the Southern Great Plains (SGP), the Midwest (MW), the Northeast (NE), and the Southeast (SE).
3.1 Magnitude and spatiotemporal patterns of P fertilizer uses
The amount of total P consumption in the US kept a moderately increasing trend from 0.002 Tg P yr−1 in 1850 to 0.3 Tg P yr−1 in 1930, followed by a rapid rise to 2.2 Tg P yr−1 by 1980. After a swift fall to 1.6 Tg P yr−1 in 1987, P consumption experienced large inter-annual fluctuations, reaching 1.7 Tg P yr−1 in 2022 (Fig. 2a). In 1980, corn was the primary consumer in terms of P fertilizer use (43 % of national consumption), followed by other crops (17 %), soybean (11 %), and winter wheat (10 %). Conversely, other crop types accounted for less than 10 % of the total use. In 2022, corn remained the dominant P fertilizer consumer (37 %). However, the shares of other crops and soybean increased to 23 % and 19 %, respectively, in 2022, while the shares of other crop types diminished or remained stagnant (Figs. 2b and S3). The P application rate on fertilized areas rapidly increased from 0.9 g P m−2 yr−1 in 1940 to 2.5 g P m−2 yr−1 in 1979 and then declined to 1.9 g P m−2 yr−1 in 2022. In contrast, the P application rate over all cropland gradually increased from a low level of 0.3 g P m−2 yr−1 in 1940, reaching its peak at 1.2 g P m−2 yr−1 in 1979 and leveling off at 1.1 g P m−2 yr−1 in 2022. It exhibited a smaller range of fluctuations over time. Correspondingly, a dramatic elevation in P application rate was found among various crops from 1940 to 1980, with increments ranging from 0.5 g P m−2 yr−1 in durum wheat to 2.4 g P m−2 yr−1 in corn (Fig. 2c). From 1980 to 2020, large decreases in application rates were found in corn, winter wheat, sorghum, and cropland pasture, while large increases were found in spring wheat, rice, and durum wheat. As an increasing proportion of total cropland received P fertilizer from 1940 to 2022, the gap between P fertilizer use rate over all cropland and over fertilized area has been narrowing for most crops, except for soybean and cropland pasture.
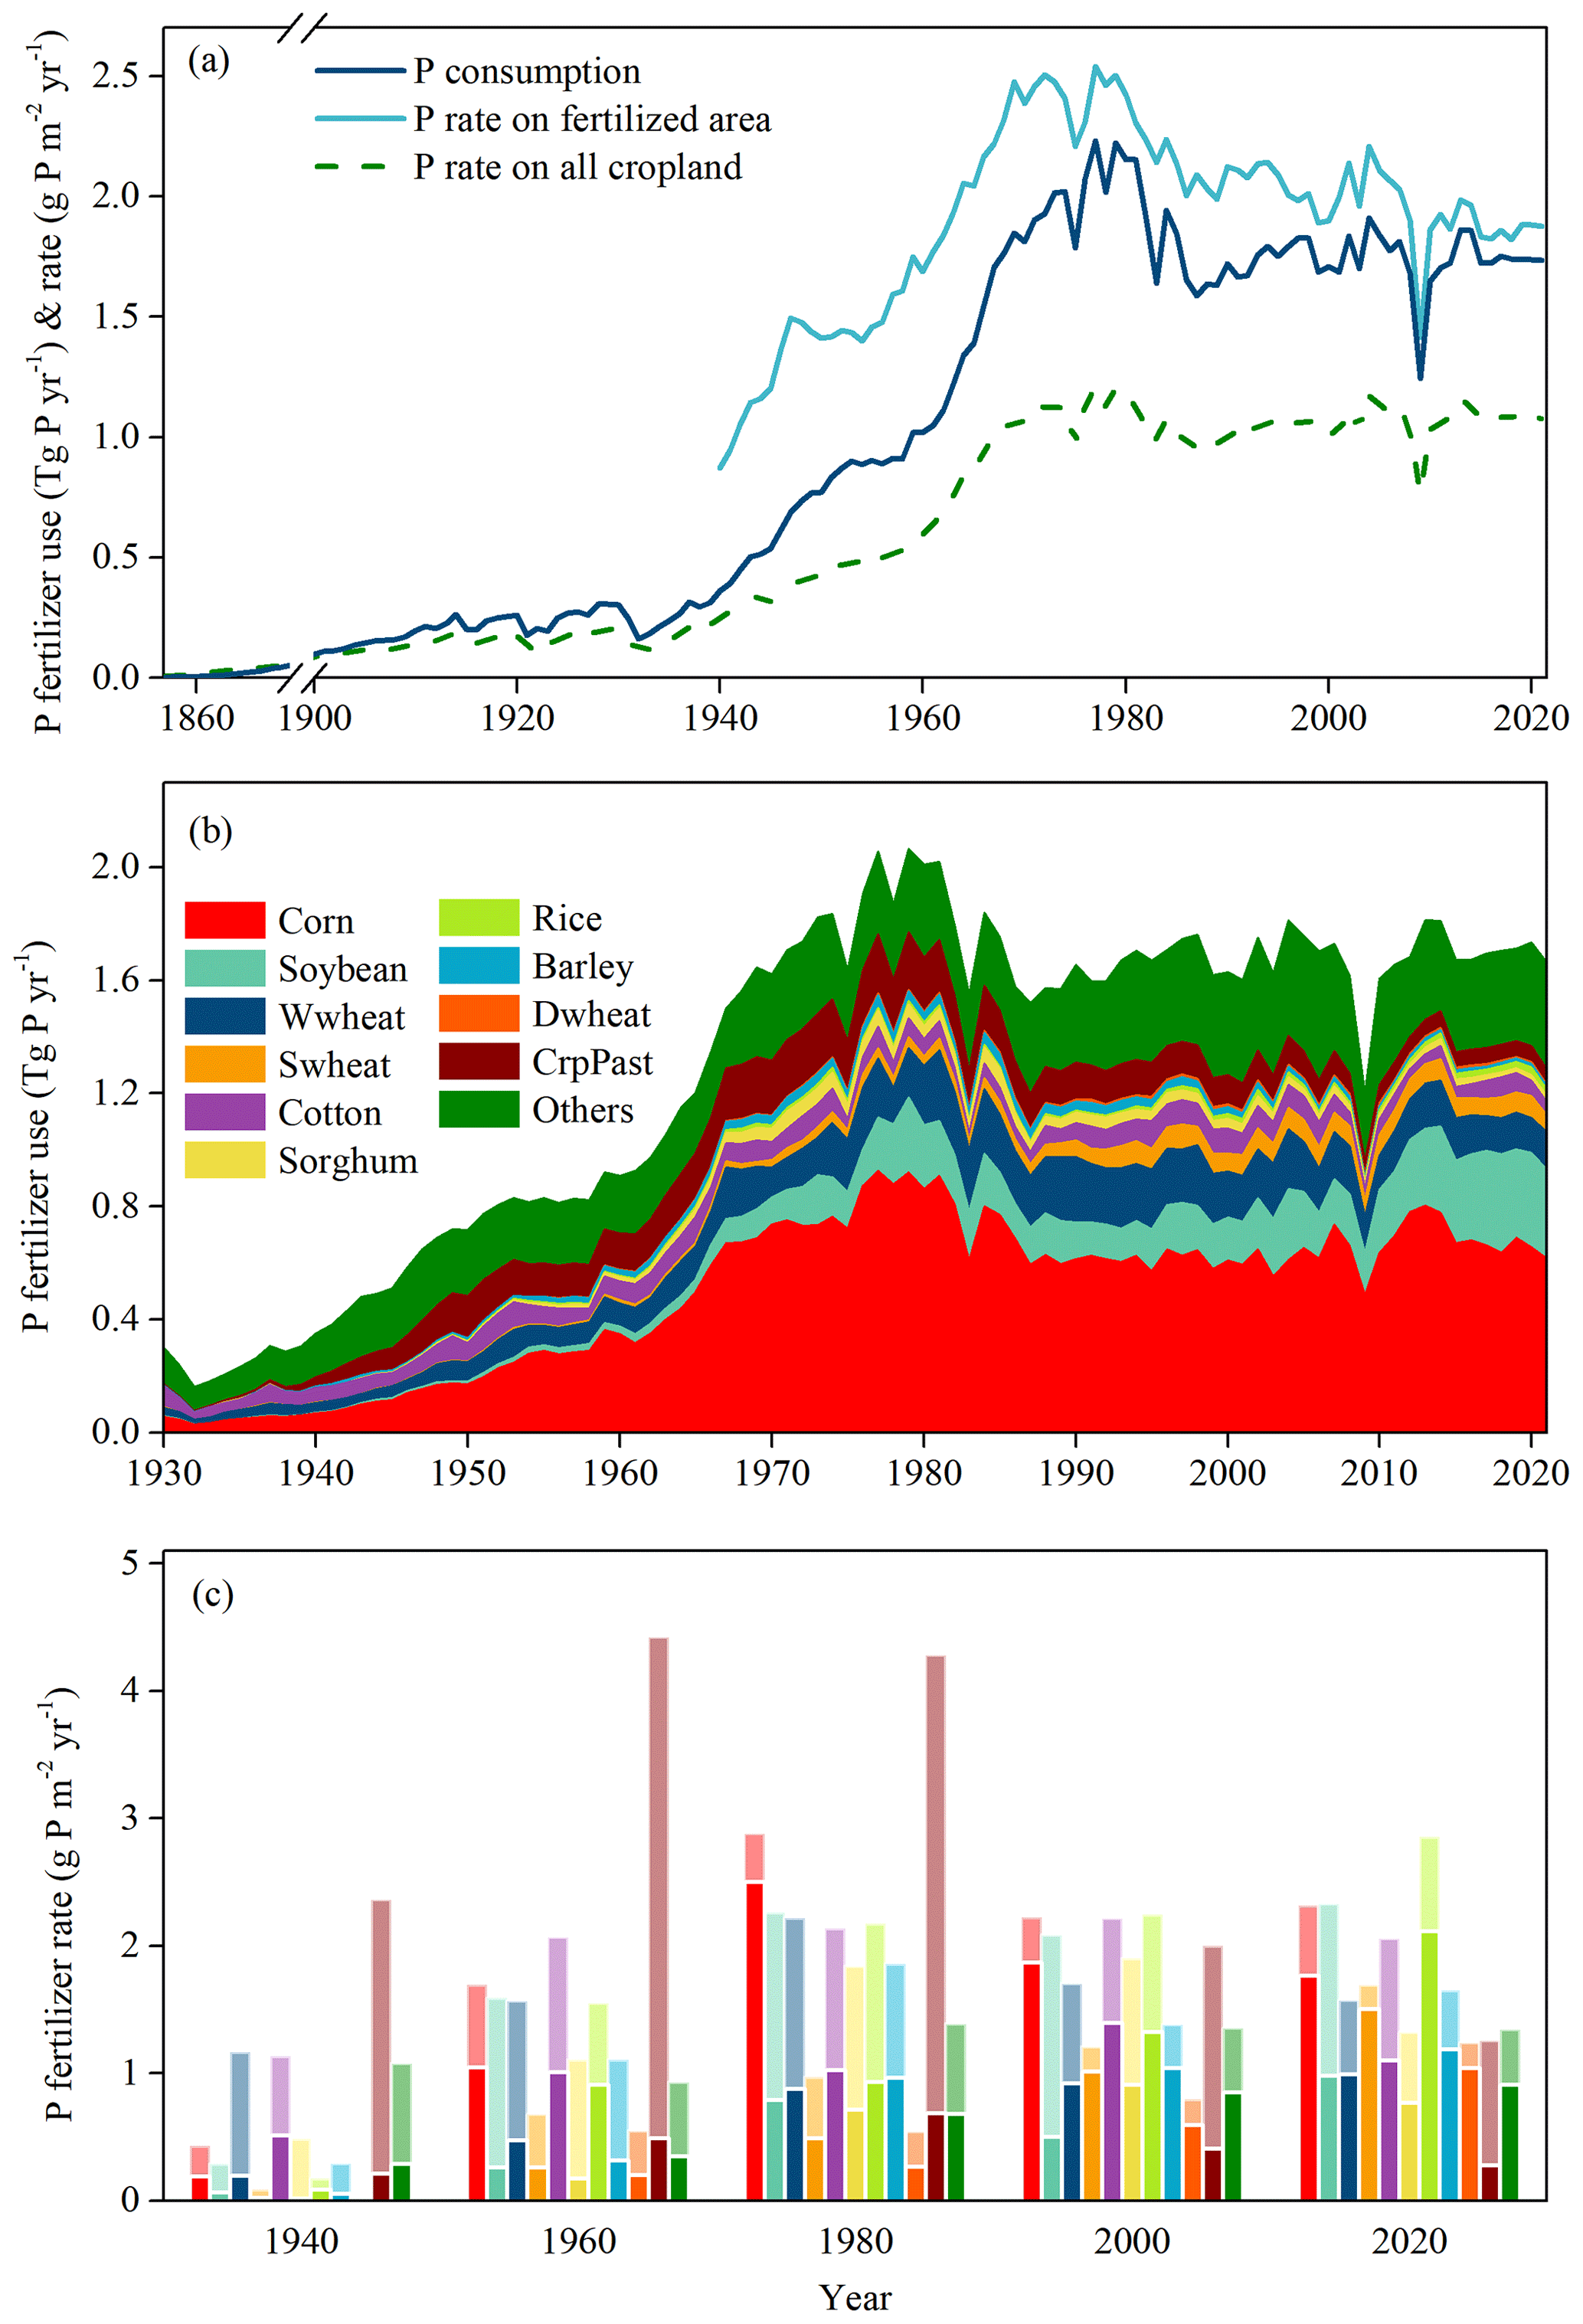
Figure 2Time series of P fertilizer consumption and average application rates for all crops (a) and P fertilizer consumption (b) and application rates (c) for 11 specific crops in the contiguous US. All cropland is the total planting area, while the fertilized area is the proportion of the cropland that receives P fertilizer. In (c), light-colored bars denote the application rate over fertilized area, and dark-colored bars show the modified application rate with the assumption that the county-level P fertilizer consumption was distributed over all the croplands. Both start from zero on the y axis.
Geospatially, as the P fertilizer consumption declined in the southeastern and eastern US and increased in the Midwest and the Northern Great Plains from 1900, the hotspot of P use has shifted correspondingly (Figs. 3 and 4). Low application rates (<0.4 g P m−2 yr−1) were common in the eastern US before 1940. The application rates in the Midwest and along the West Coast showed remarkable increases to above 1.0 g P m−2 yr−1 by 1980. After 2000, the east of the Northern Great Plains and the Midwest became the US hotspots, displaying the most intensive P fertilizer use.
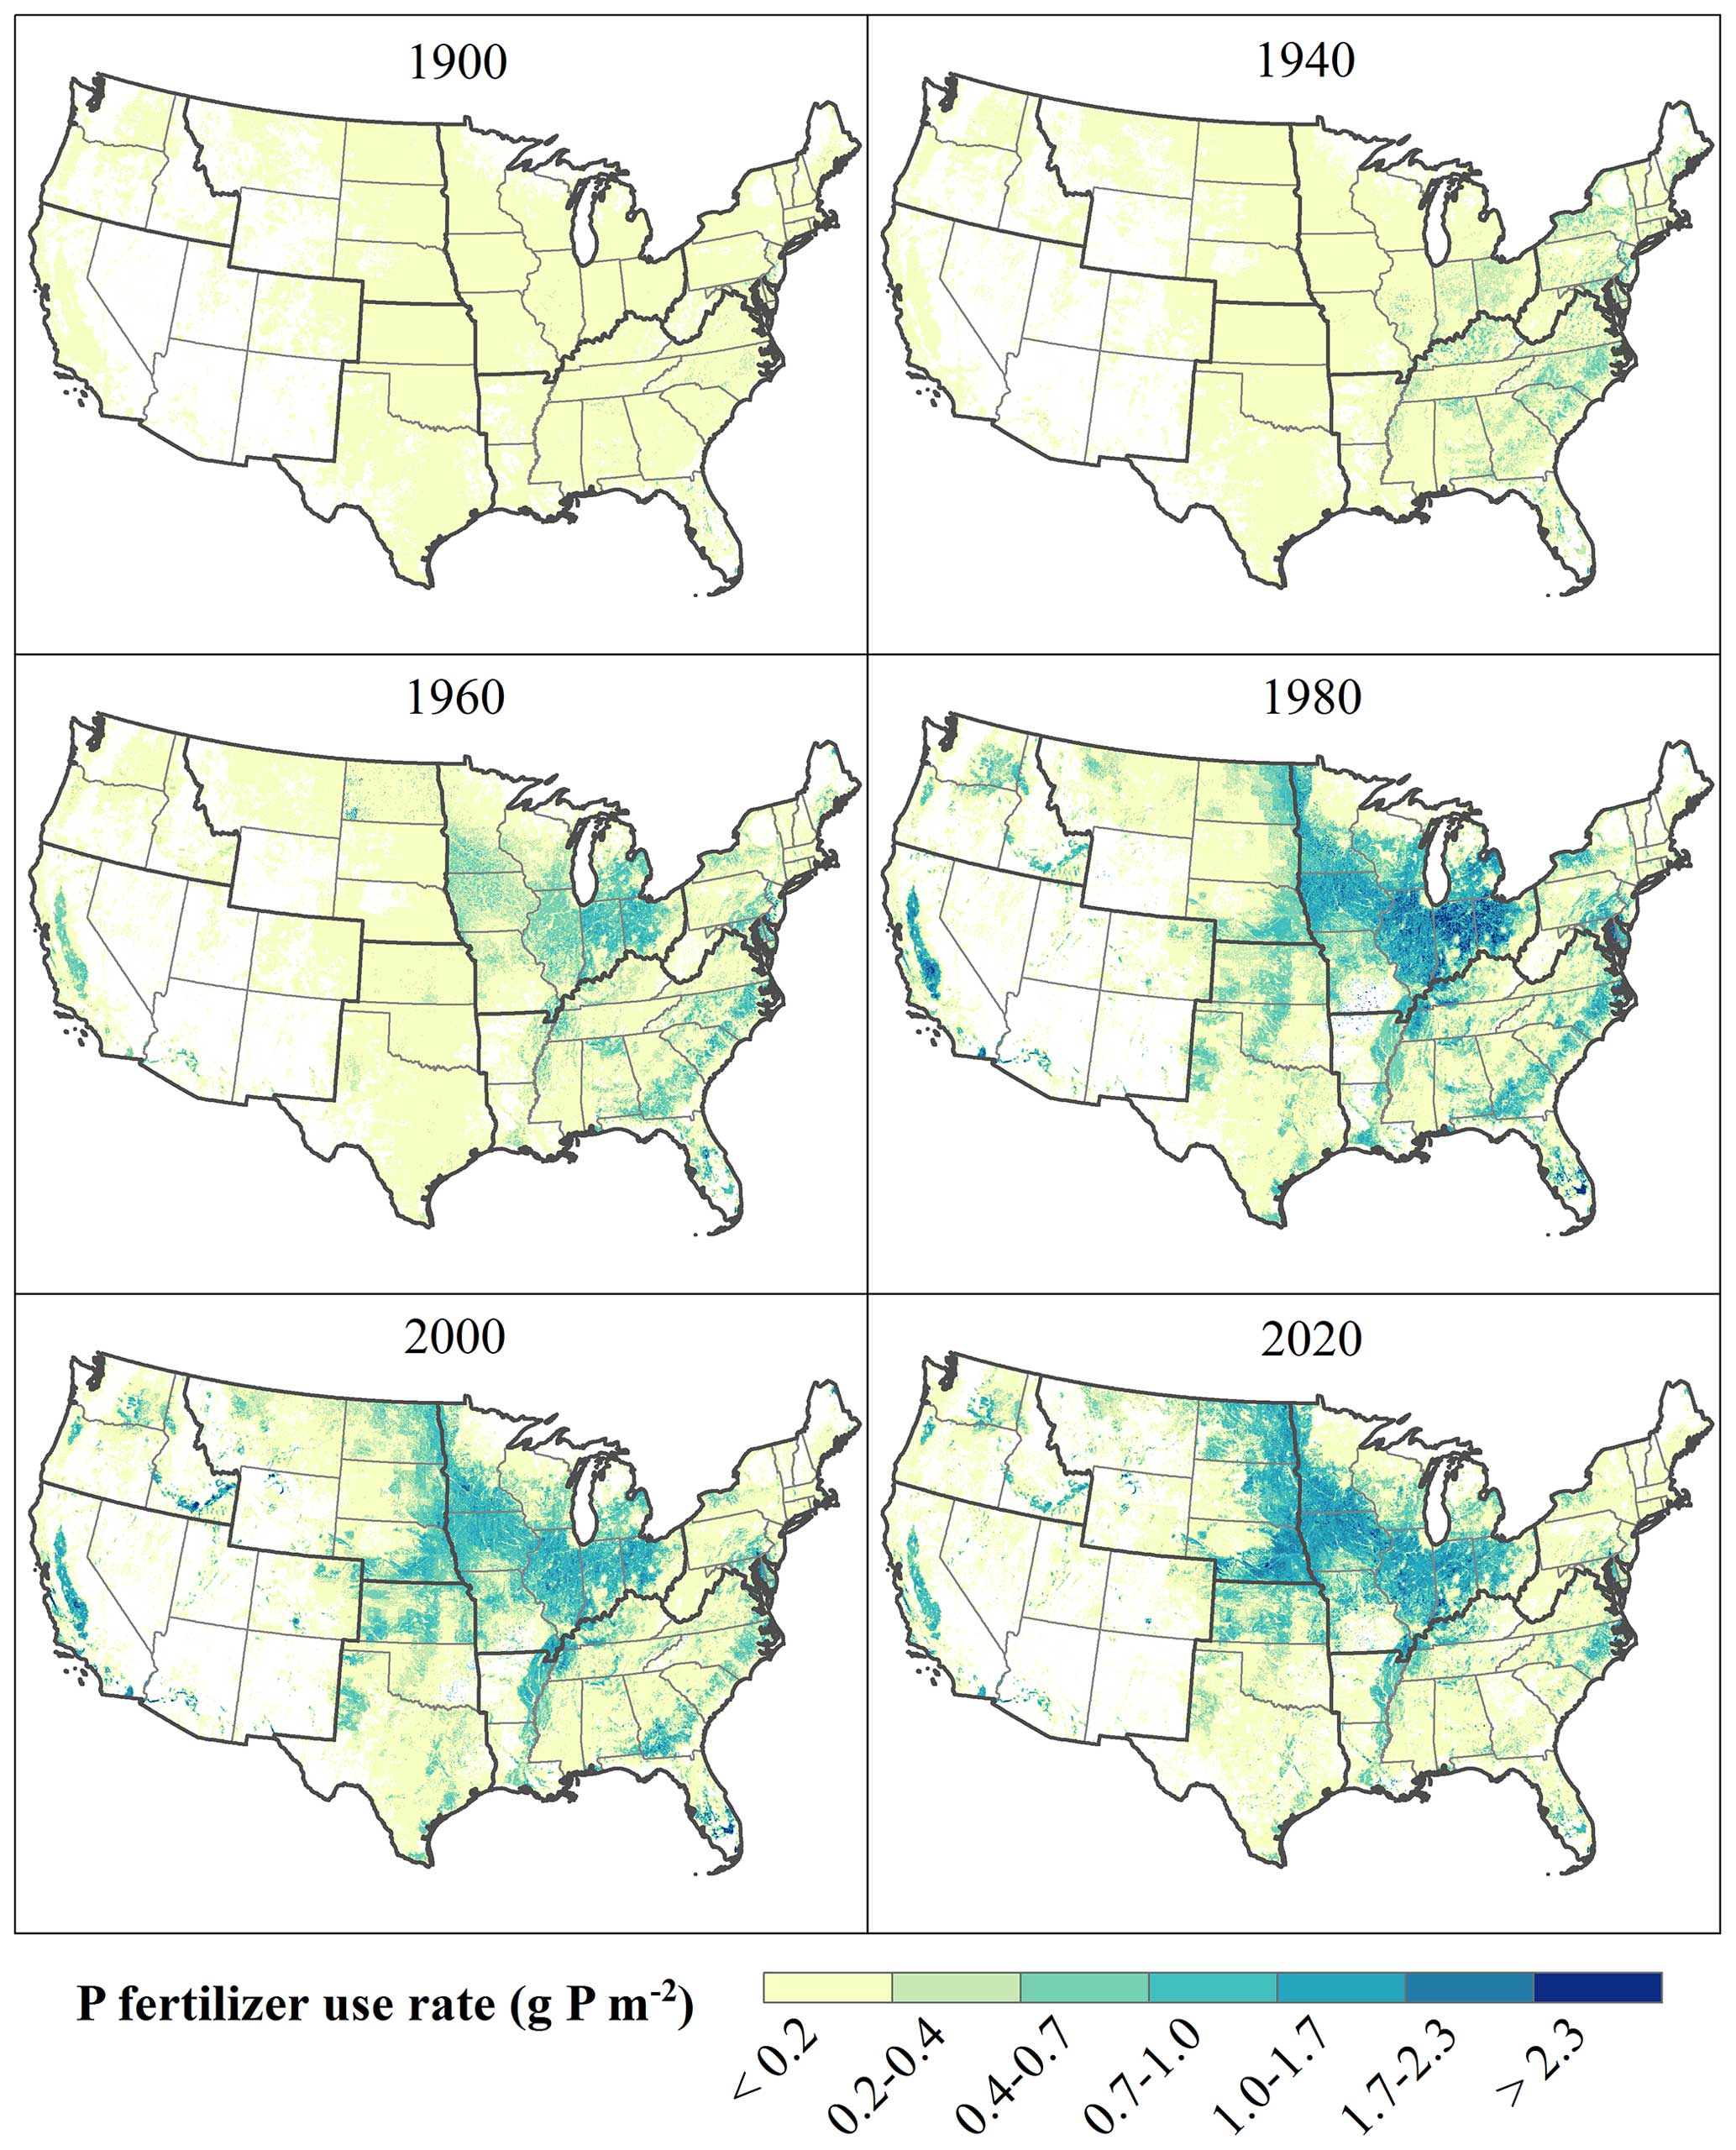
Figure 3Spatial distribution of P fertilizer application rates in the 1990s, 1940s, 1960s, 1980s, 2000s, and 2020s in the contiguous US at a resolution of 4 km × 4 km, with regions framed as NW (Northwest), NGP (Northern Great Plains), SGP (Southern Great Plains), SW (Southwest), MW (Midwest), SE (Southeast), and NE (Northeast). The maps generated for 1900, 1940, and 1960 relied on state-level crop-specific data. Subsequent maps, post-1960, utilized county-level crop-specific data. The values on the map represent the P fertilizer use rate over all land areas and can be converted to P fertilizer use rate per unit cropland area by lining up with our crop type and area database (Ye et al., 2024).
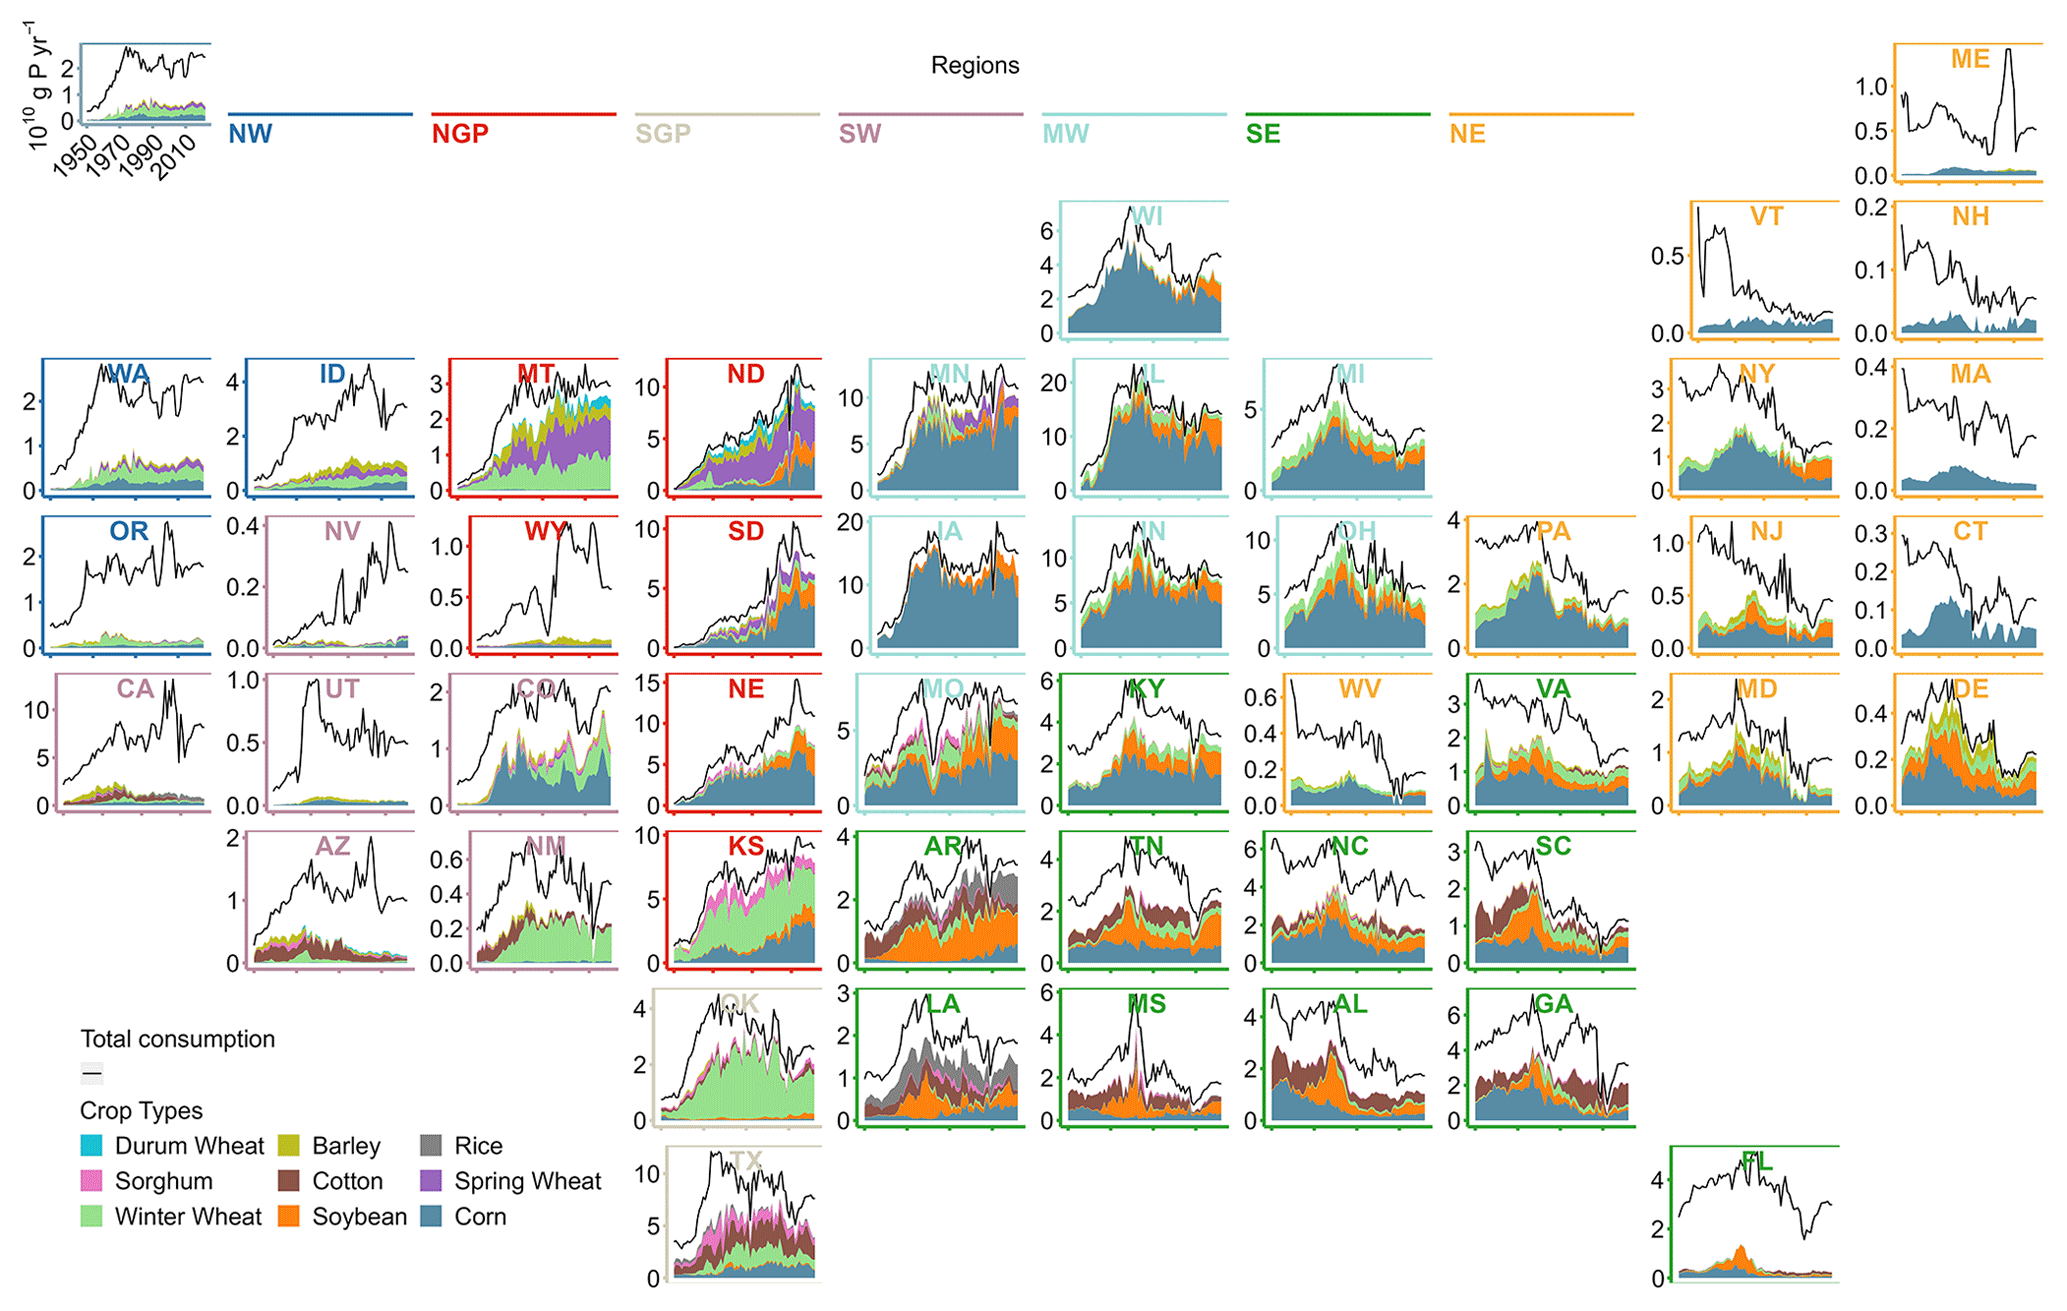
Figure 4Time series of P fertilizer consumption by each state and nine major crops from 1950 to 2022 in the contiguous US. The top-left figure illustrates the scales of the x axis and y axis. The solid black line in each subplot represents total P fertilizer consumption, and the stacked area represents P fertilizer consumption by nine major crops. NW is the Northwest, NGP is the Northern Great Plains, SGP is the Southern Great Plains, SW is the Southwest, MW is the Midwest, SE is the Southeast, and NE is the Northeast.
The P use in the Midwest and the Northern Great Plains is dominated by the nine major crops, whereas, in other regions, like the Northwest, Southwest, and Northeast, other crops account for a considerable share of P use (Fig. 4). Owing to their wide cultivation, corn and soybean were the primary recipients of P nationwide in the most recent decade (the 2020s). The intense P fertilizer use is concentrated in the Midwest and the Northern Great Plains for corn (>0.8 g P m−2 yr−1) and for soybean (0.5–1.2 g P m−2 yr−1) (Fig. 5). In comparison, the P uses of the remaining seven major crops are mainly distributed across different regions. A low application rate (<0.5 g P m−2 yr−1) is applied to cotton in the Southeast and the Southern Great Plains. Sorghum is planted mainly in the Southern Great Plains, with an application rate of <0.2 g P m−2 yr−1. Rice is highly concentrated along the rice belt and in part of California, with a relatively high application rate (0.5–0.8 g P m−2 yr−1). P fertilizer applied to barley, spring wheat, and durum wheat is distributed in the Northern Great Plains at a moderate rate (0.3–0.8 g P m−2 yr−1). Winter wheat has a wider spatial distribution, with a low application rate, except in some regions in Kansas, Oklahoma, and Montana (0.3–0.5 g P m−2 yr−1).
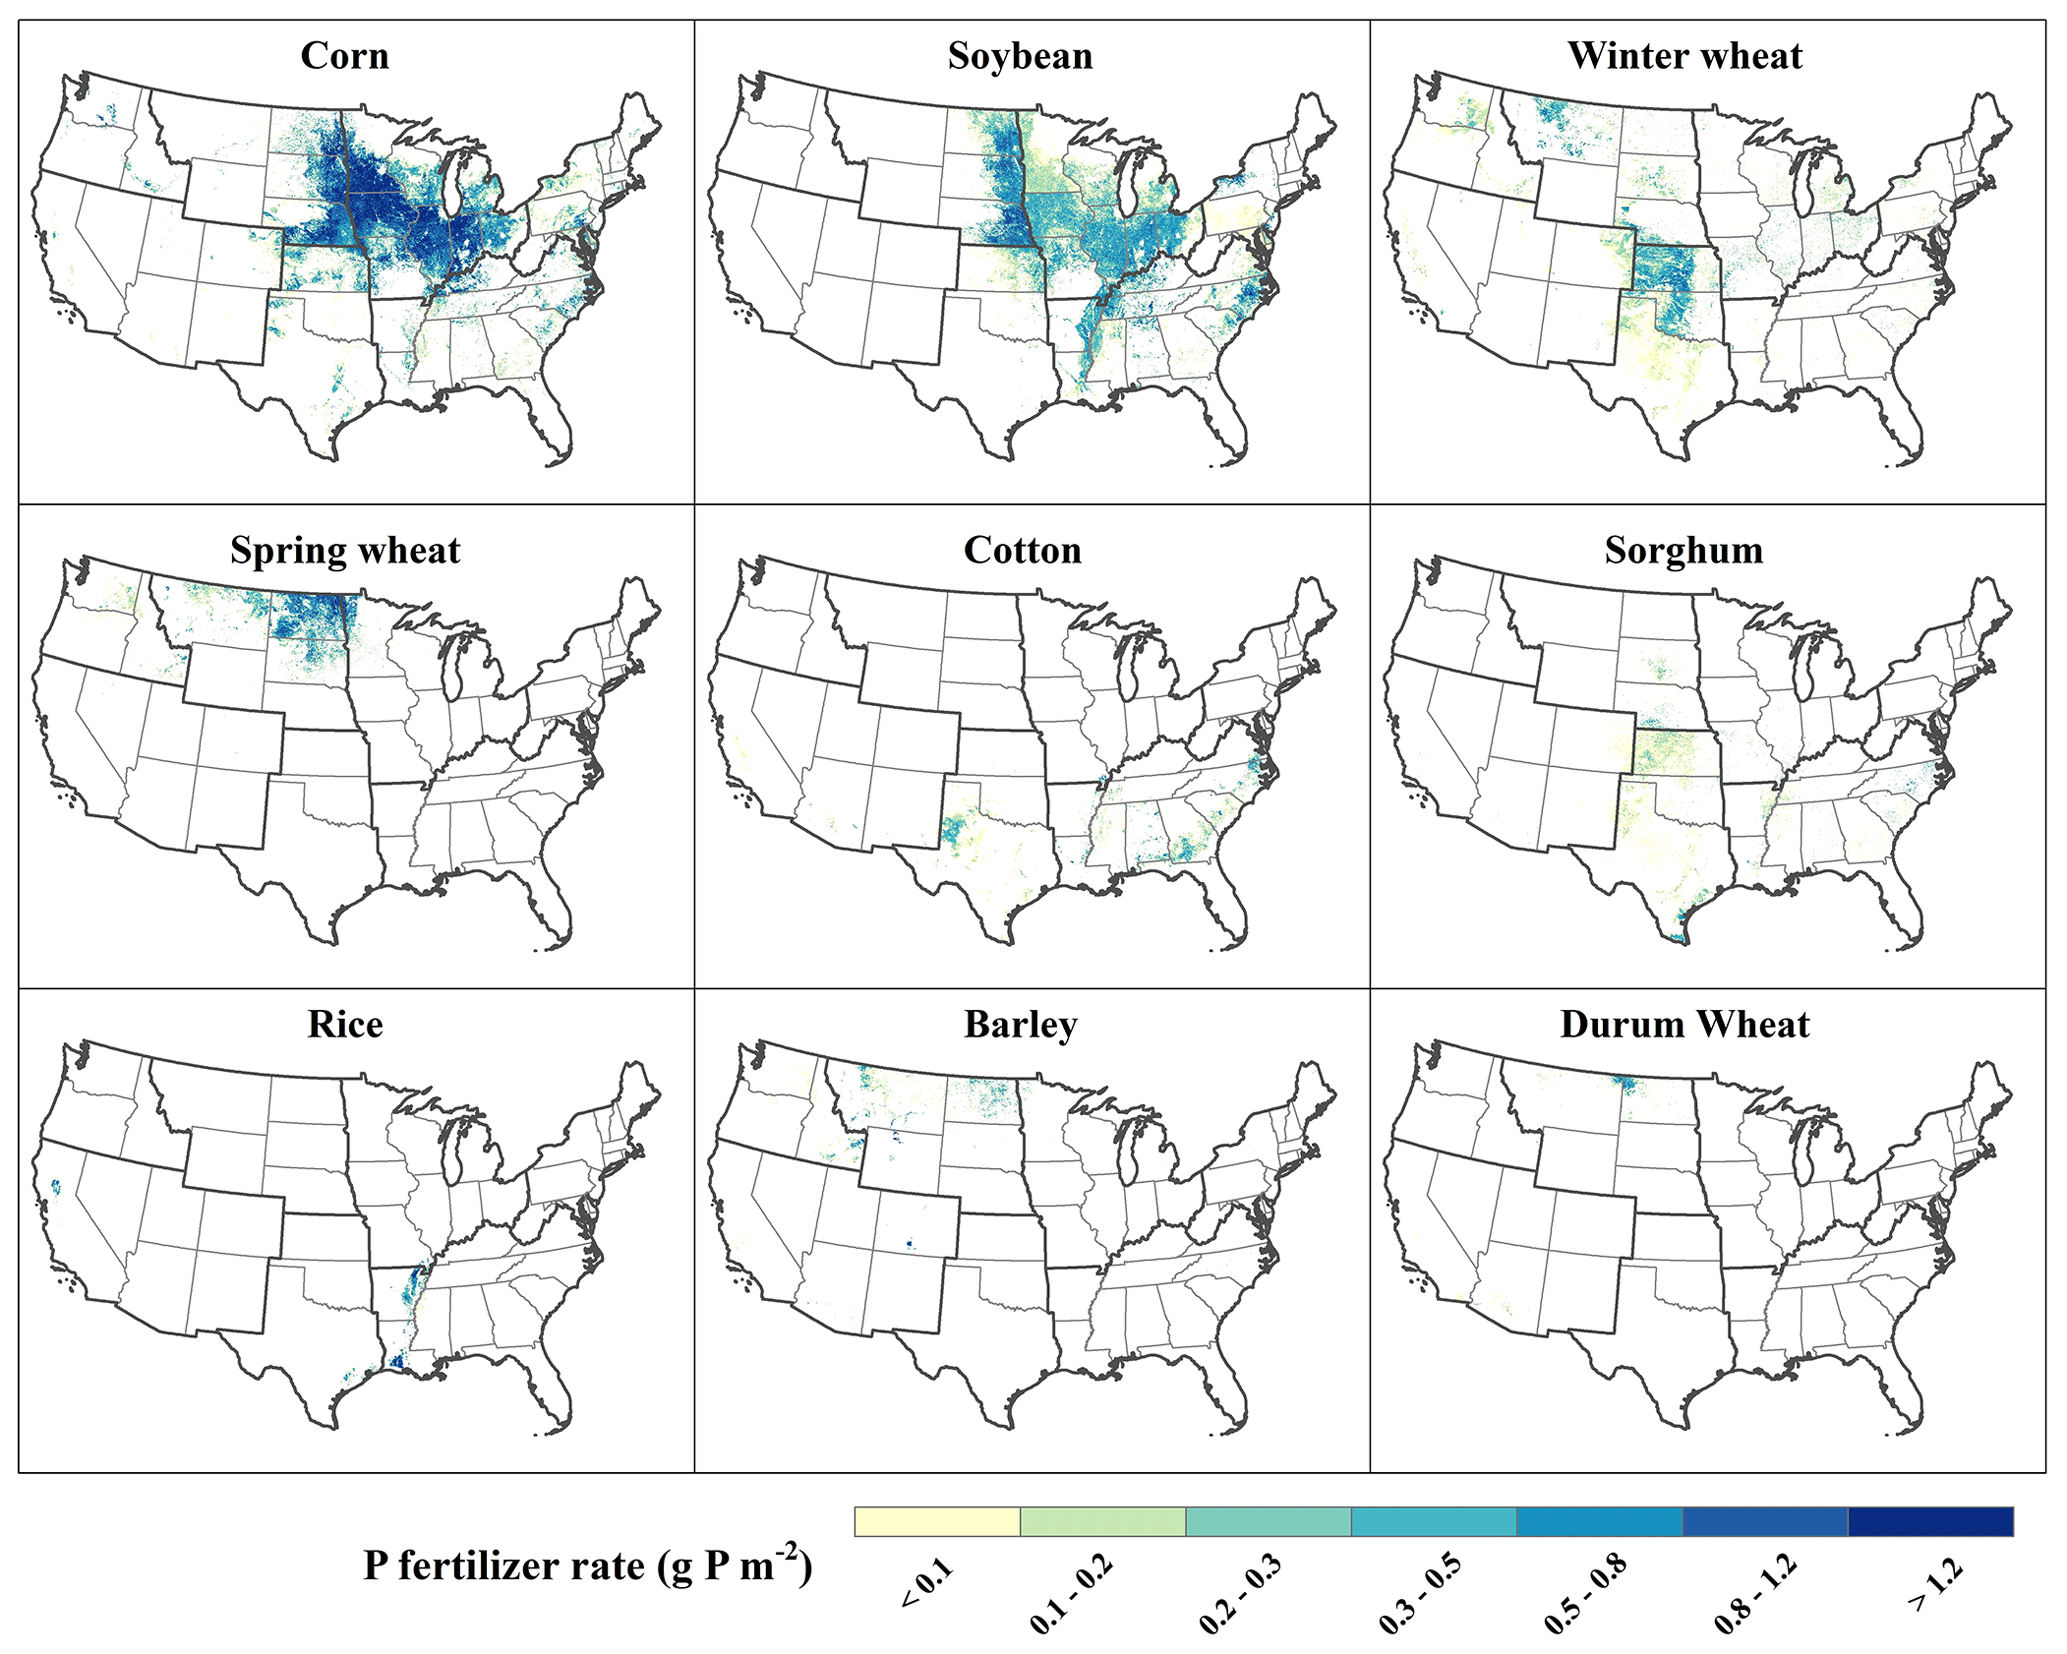
Figure 5Spatial distribution of P fertilizer application rates for nine major crops in 2020 at 4 km × 4 km resolution, with regions framed as NW (Northwest), NGP (Northern Great Plains), SGP (Southern Great Plains), SW (Southwest), MW (Midwest), SE (Southeast), and NE (Northeast). The values on the map represent the P fertilizer use rate over all land areas and can be converted to P fertilizer use rate per unit cropland area by lining up with our crop type and area database (Ye et al., 2024).
3.2 Patterns of P fertilizer application timings
Nationwide, corn, soybean, and cotton producers favor fall and spring applications before planting. Conversely, producers of all three wheats and barley apply a large portion of annual P fertilizer at planting (Fig. 6). The timing of P application varies significantly across the CONUS (Fig. S4). Fall application prevails in the Midwest and the Southern Great Plains (>40 %), especially in Iowa (>60 %) and Illinois (>50 %) (Fig. S4a). Relatively high portions of P fertilizer, up to 20 %, are also applied in fall in the Southeast, the eastern Northern Great Plains, and the Northwest. In comparison, P applied in spring before planting dominates across the nation, especially in the east of the US (Fig. S4b). Intense P application (>50 %) at planting is prevalent in the Northeast, the Northwest, and the northern parts of both the Northern Great Plains and the Southern Great Plains (Fig. S4c). Application after planting is the least popular application timing (<20 %) in the nation, which mainly occurs in the Southern Great Plains, the Southeast, and some other states (e.g., Michigan, Nebraska, and Washington) (Fig. S4d). In contrast to the wider distribution of different timing ratios, the hotspots of P application rate for four timings were found in the Midwest, the Great Plains, and the rice belt due to the generally low application rate in other regions (Fig. 7). Intense P fertilizer was applied in the fall in the Midwest (>0.6 g P m−2) (Fig. 7a), particularly in Iowa and Illinois. Spring application was concentrated in the corn belt and rice belt, with rates greater than 0.5 g P m−2 yr−1 (Fig. 7b). Farmers in the Northern Great Plains, Kansas, Indiana, and Wisconsin favored application at planting (Fig. 7c). After-planting applications were minimal (<0.2 g P m−2 yr−1) in the rice belt and Nebraska (Fig. 7d).
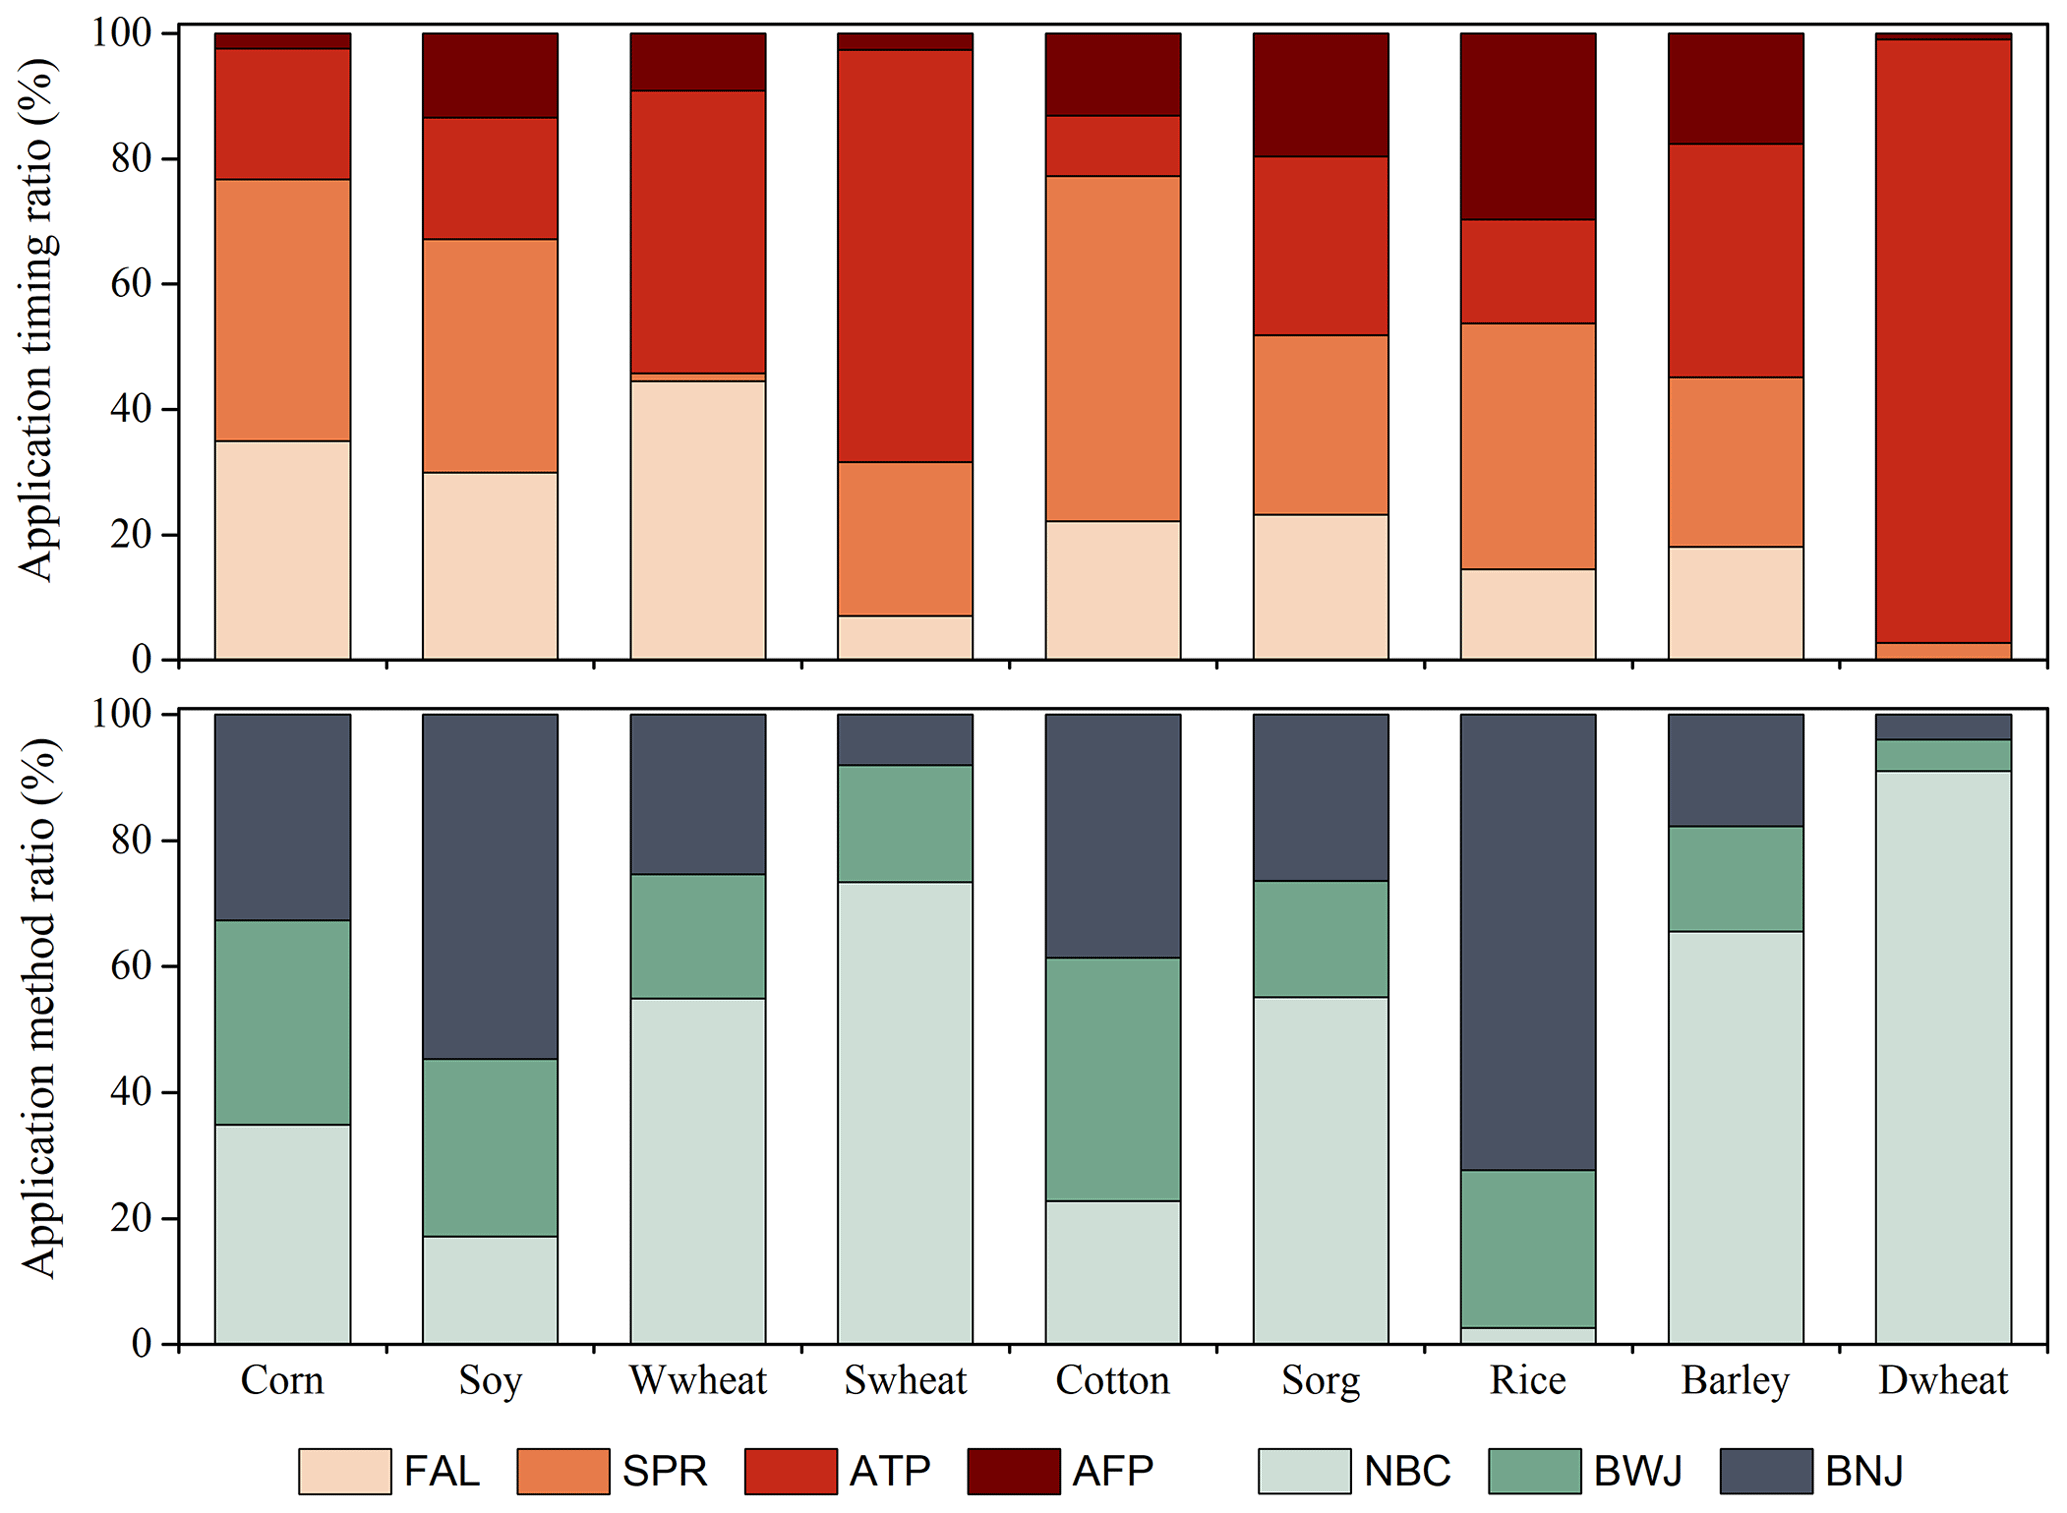
Figure 6The share of each application timing and method for nine major crops in the US. FAL is fall application in the previous year. SPR is spring application before planting. ATP is application at planting. AFP is application after planting. NBC is non-broadcasting. BWJ is broadcasting with injection, which is mixed or injected after broadcasting. BNJ is broadcasting without injection.
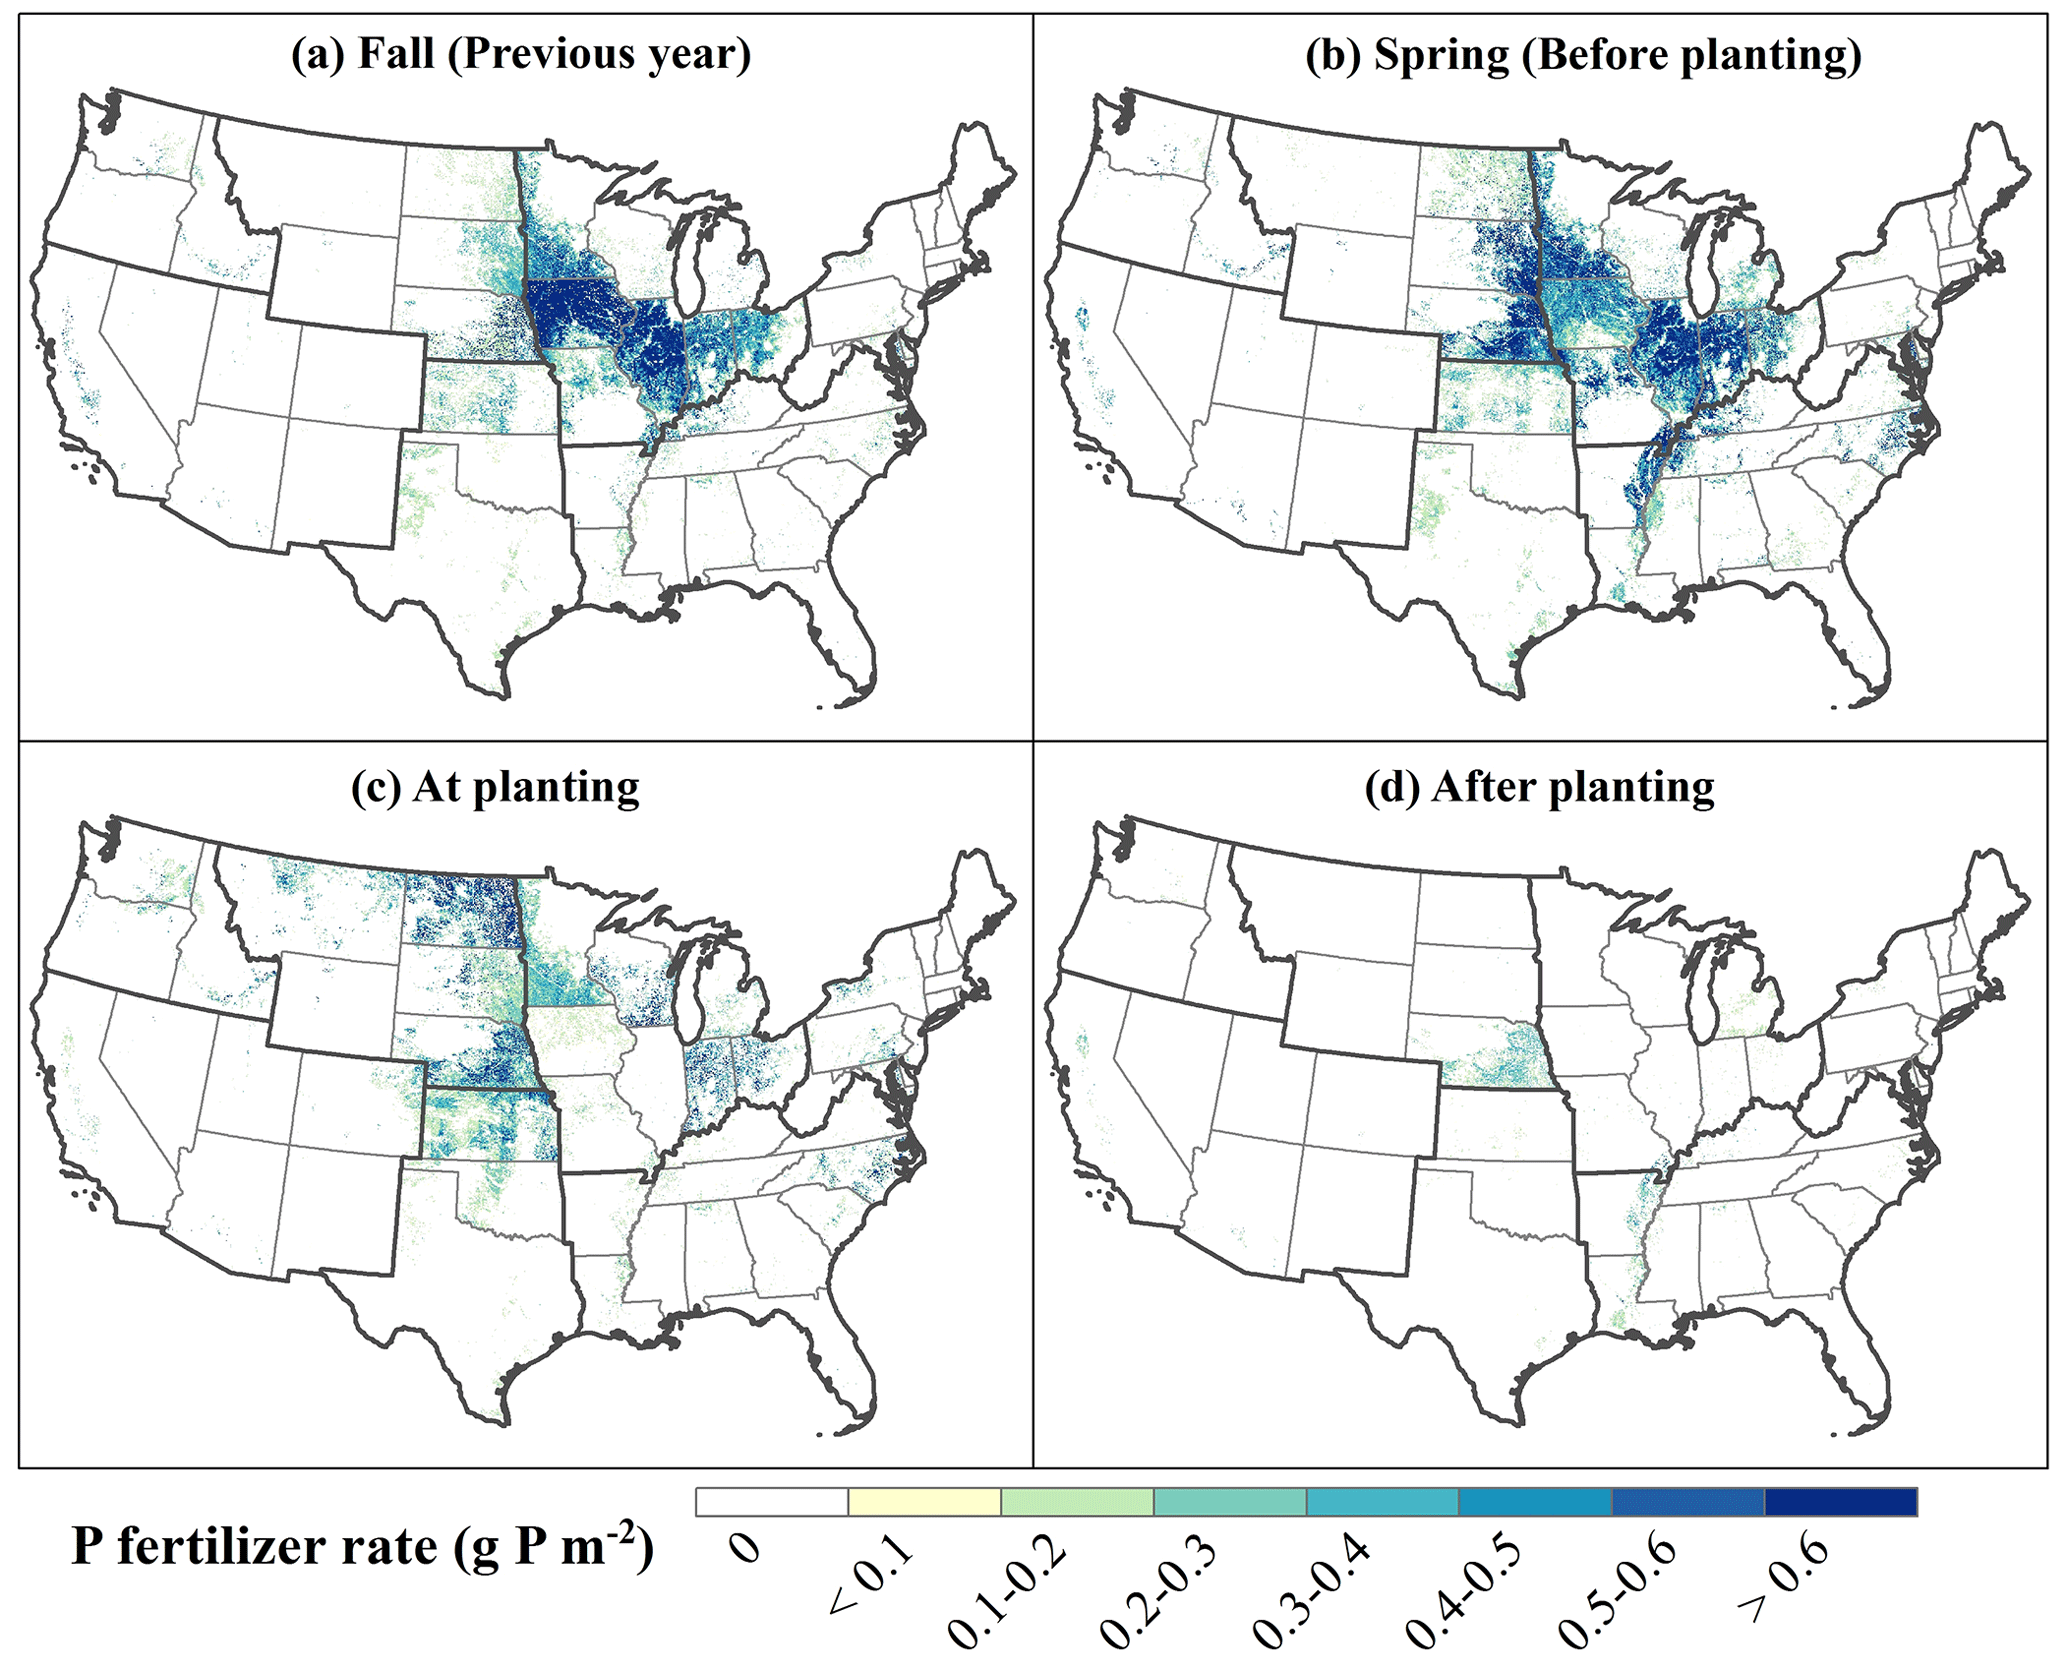
Figure 7Spatial distribution of P fertilizer application rates at four application timings across the contiguous US in 2020.
3.3 Patterns of P fertilizer application methods
Nationally, broadcast application is popular among corn, soybean, cotton, and rice. In contrast, the non-broadcast method (e.g., injection and side-dress) dominates among the three wheat types, sorghum, and barley (Fig. 6). The adoption of the P application method differs substantially among regions (Fig. S5). Non-broadcasting is predominantly used in Wisconsin, Michigan, the Great Plains, and the Northwest (Fig. S5a). Broadcasting with incorporation is widespread in the CONUS. However, the adoption rate is relatively low (<40 %) in most of the region (Fig. S5b). In comparison, high P application by broadcasting without incorporation (> 50 %) is mainly distributed in the Midwest and the Southeast (Fig. S5c). Due to the intense use of P fertilizer in the corn belt and rice belt, the hotspots of P application rate (>0.6 g P m−2 yr−1) for three methods were found in various regions within these two belts (Fig. 8). Non-broadcast application is prevalent in the Northern Great Plains, Kansas, and Minnesota (Fig. 8a). Intense application of P fertilizer via broadcasting with incorporation was observed in Minnesota and Illinois (Fig. 8b). The corn belt and rice belt received most of their P fertilizer through broadcasting without incorporation (Fig. 8c).
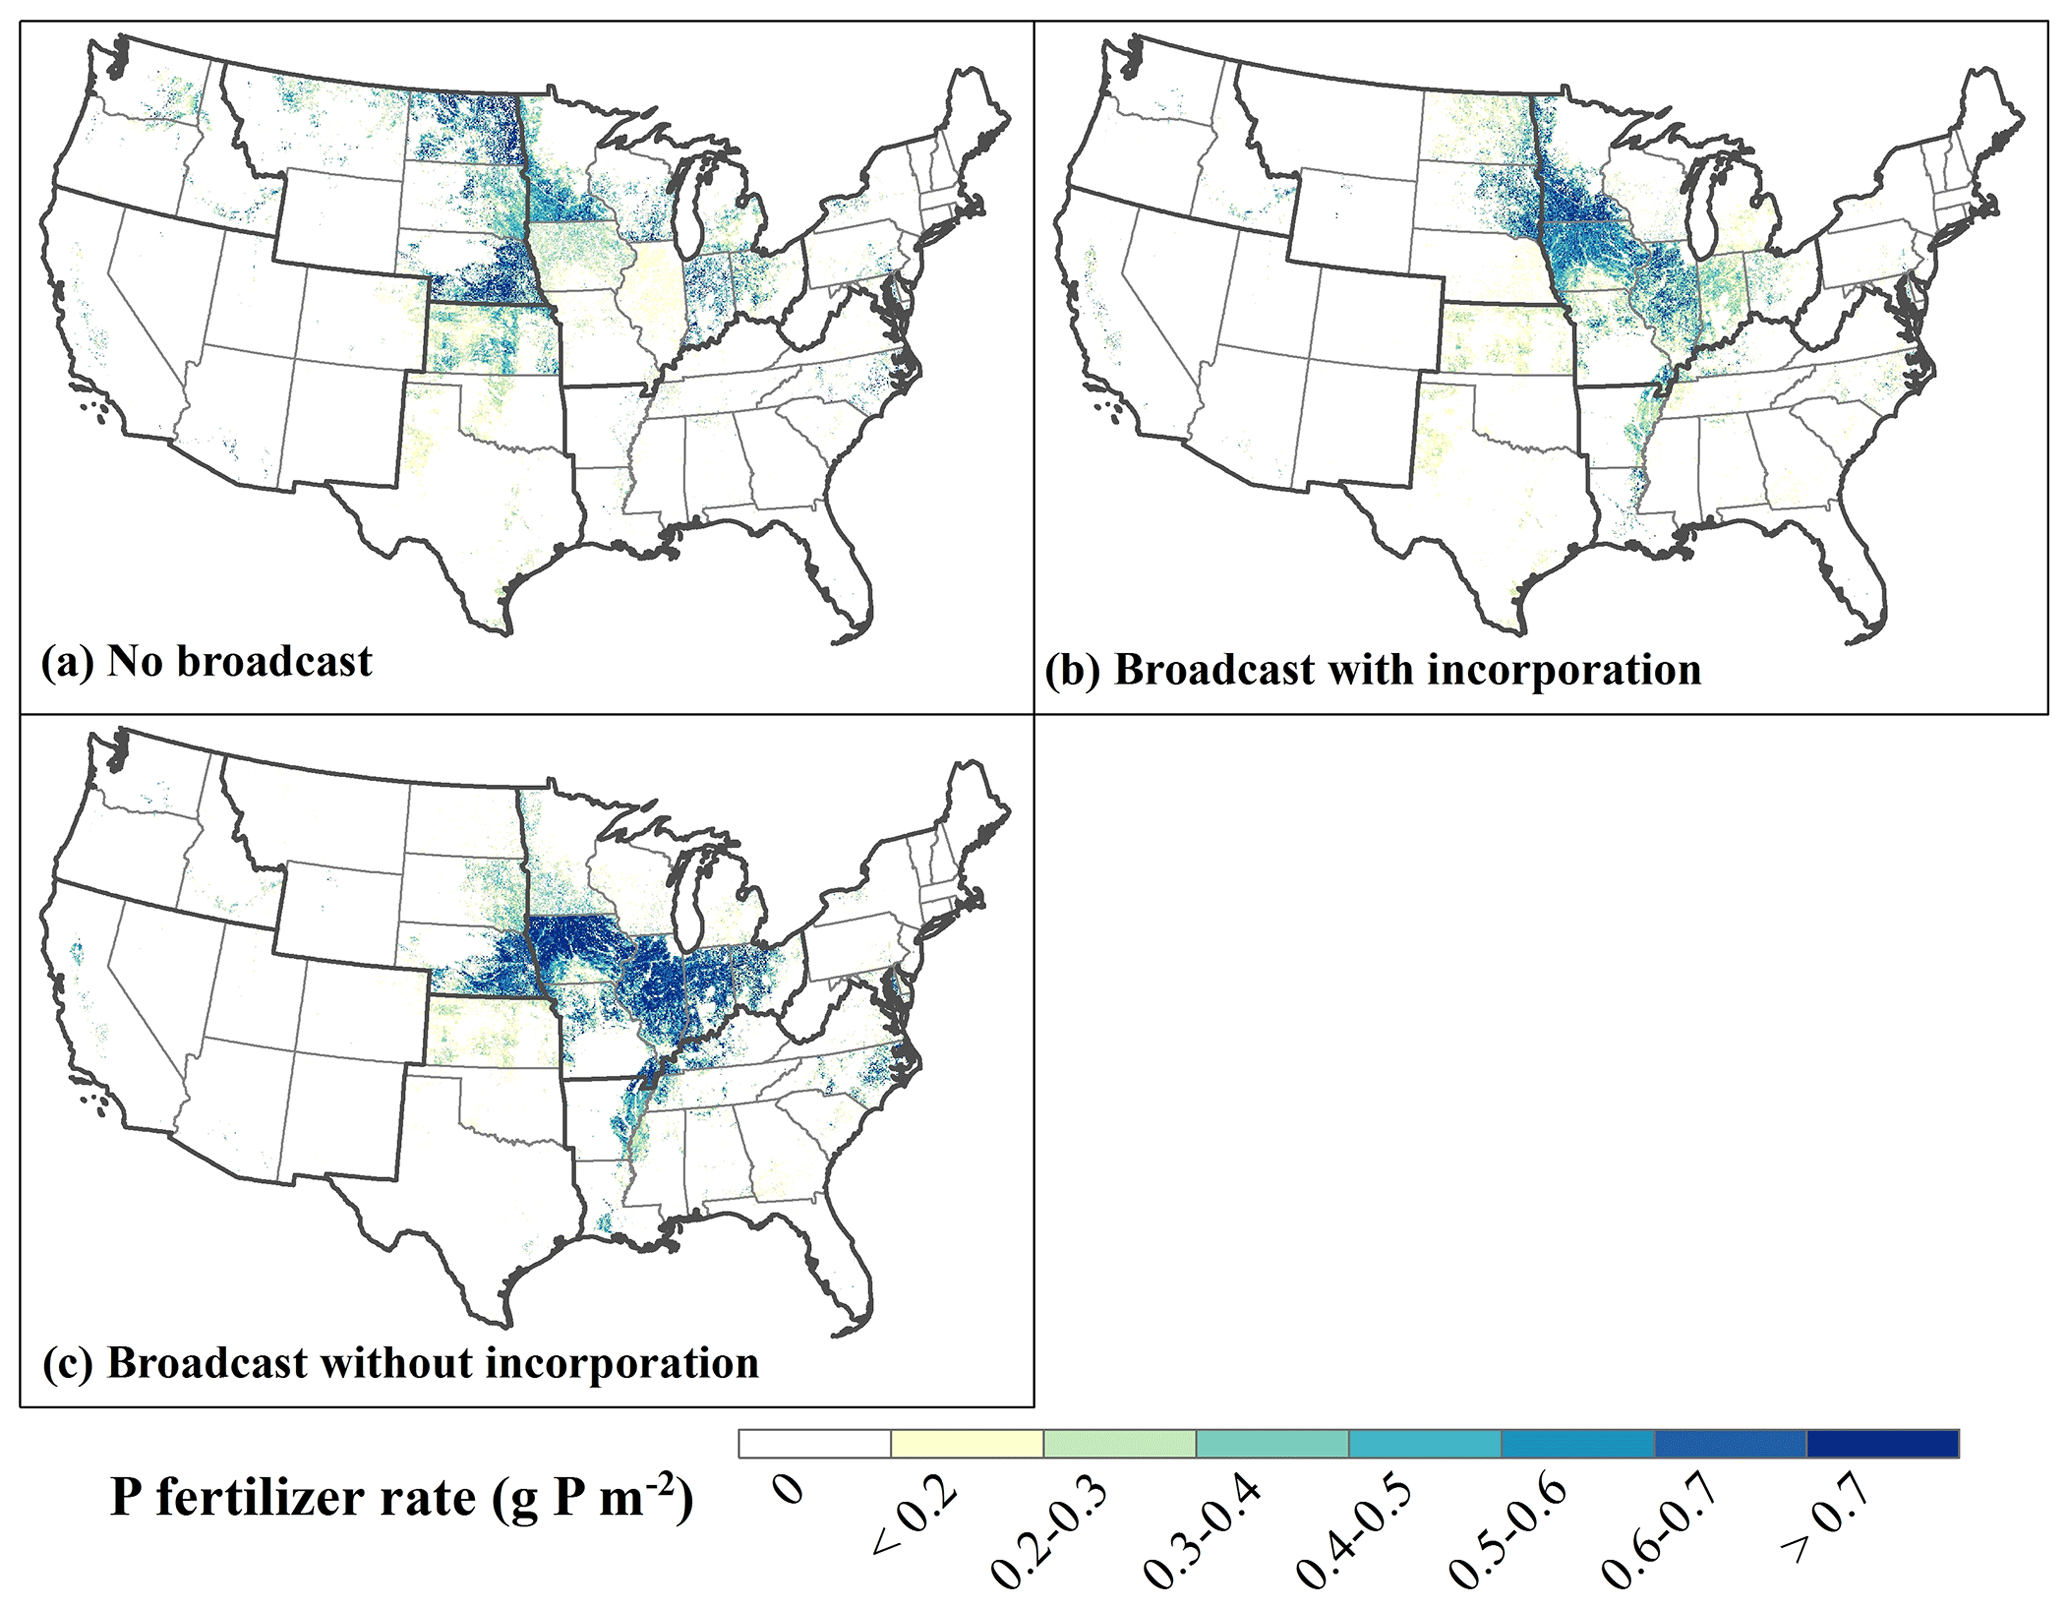
Figure 8Spatial distribution of P fertilizer application rates in three application methods across the contiguous US in 2020.
4.1 Adjustments and improvements in state-level crop-specific P application rate
The national total P consumption obtained from the gap-filled bottom-up data in this study, summed from all major crops, cropland pastures, permanent pastures, and non-farm uses, aligns well with the diverse top-down data sources in terms of both magnitude and inter-annual variations (Fig. S6). However, the bottom-up source displays a larger P consumption by certain crops in certain states (e.g., corn in Illinois), contributing to the divergences between these two approaches, notably after 2010 (Figs. S1 and S2). These overestimations may be caused by distorted crop-specific P application rates and/or fertilized area percentages derived from an inadequate survey pool. By modifying the surveyed crop-specific P application rate at the state level, we matched the state total P consumption between bottom-up and top-down approaches (Fig. 4). Despite the bottom-up source offering insights into cross-crop variations in P application rate, it overlooks the inter-state variability. Based on the total P consumption and crop-specific planting area in each county, we scaled the P application rate of each crop from the state level to the county level, which portrays greater variability across counties. Particularly, the ranges are wider for corn, soybean, winter wheat, sorghum, and barley (0–6 g P m−2 yr−1) than those for spring wheat, cotton, rice, durum, cropland pasture, and other crops (Fig. 9). In addition, downscaling the state-level P application rate to the county level augments the clarity of the geospatial pattern (Fig. 10). Top-down sources calculated the average P use rate in each county by dividing the total P consumption by all cropland areas, yielding a uniform value within each county but contrasting patterns across counties (Fig. 10a, d, g). Conversely, our map based on bottom-up sources at the state level detailed the spatial heterogeneity in intensive agricultural regions, highlighting the cross-crop differences in P fertilizer use (Fig. 10b, e, h). By combining these two sources, our map characterizes spatial variability across counties and crop types (Fig. 10c, f, j). It highlights the region with intense P use, indicated by the top-down source, but also differentiates P application rates among crops within each county, indicated by the bottom-up source. This is particularly evident in the southern part of Missouri and along the boundary between Minnesota and Dakotas (Fig. 10c and j). Accurate information on fertilizer management is essential for improving agricultural sustainability (Dhillon et al., 2017). Different crops have distinct P needs, and tailoring P use based on these needs can enhance the efficiency of P fertilizer utilization, maximizing crop yield while mitigating environmental impacts (Sabo et al., 2021). Moreover, detailed information on crop-specific P fertilizer management is important for assessing P losses attributed to runoff, erosion, and leaching, contributing to the development of agricultural policies (Daloğlu et al., 2012). Given the significance of crop-specific information, we advocate for the incorporation of cross-crop variations into the development of P fertilizer datasets.
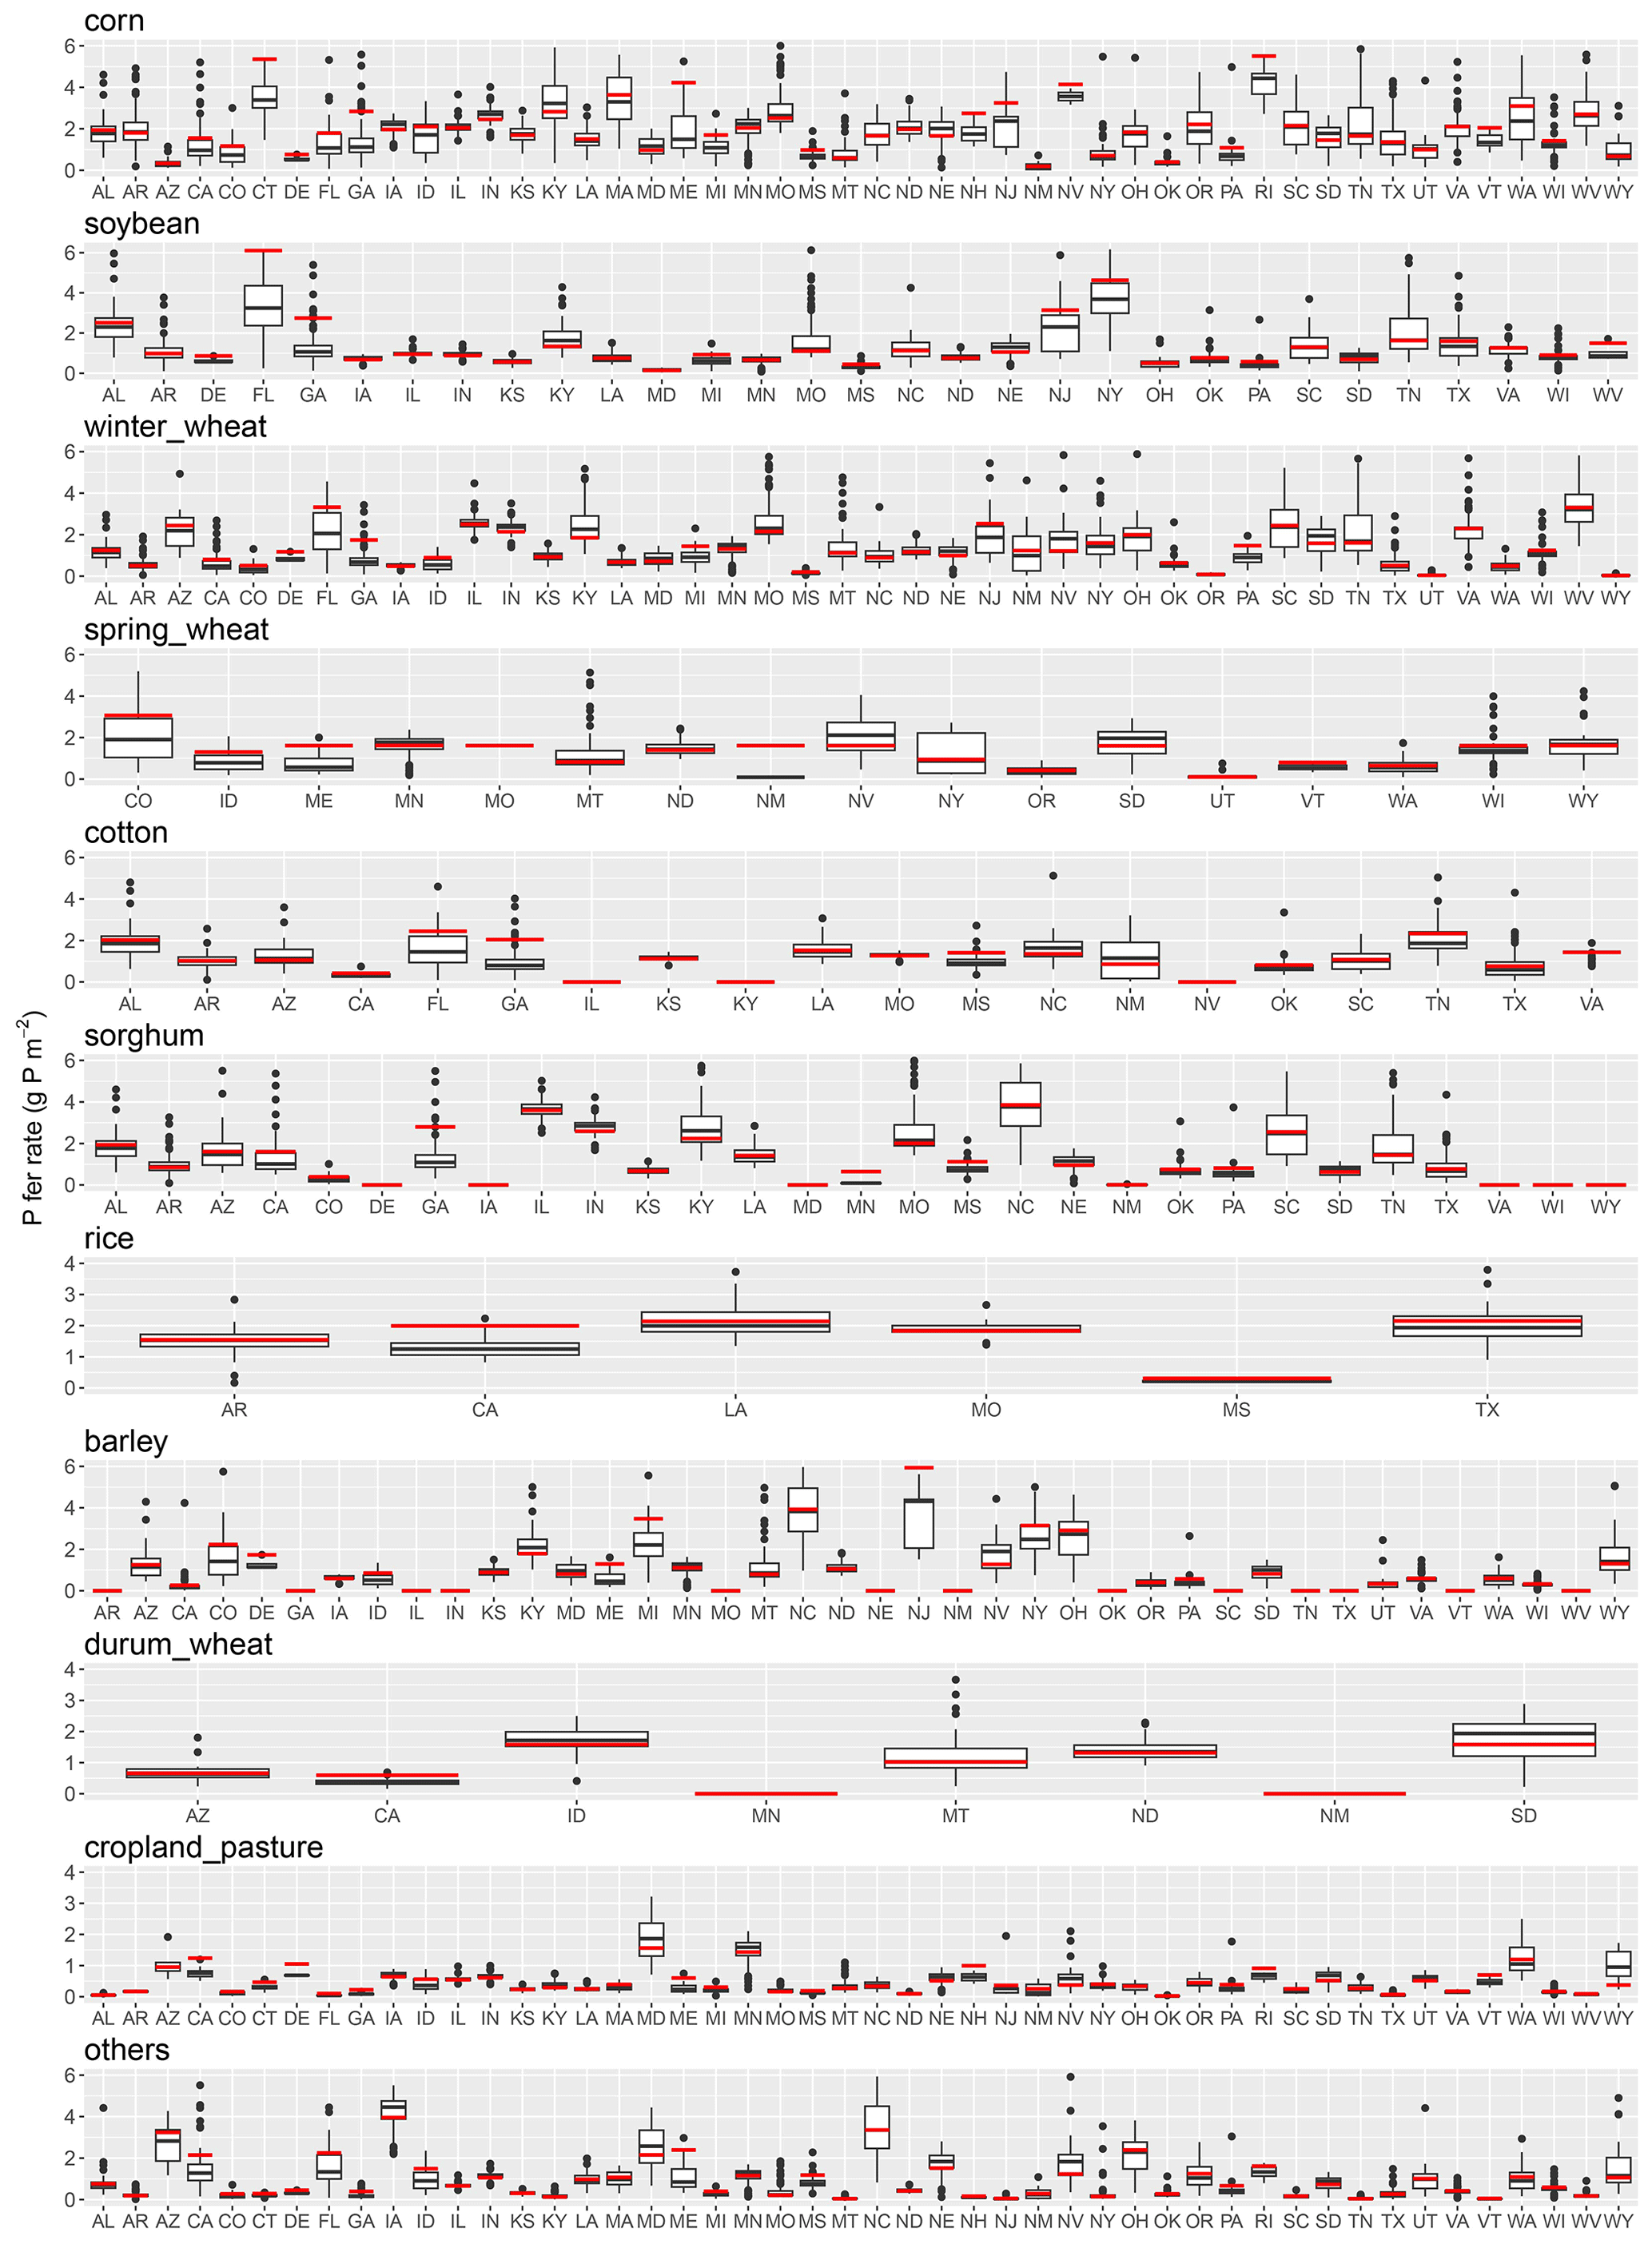
Figure 9Comparison between state-level (red line) and county-level average (black boxplot) crop-specific P fertilizer application rate in primary crop-planting states in 2015. Boxes include 25 %–75 % of county-level P fertilizer application rates, black lines are mean values, whiskers comprise the whole range of data, and dots are outliers.
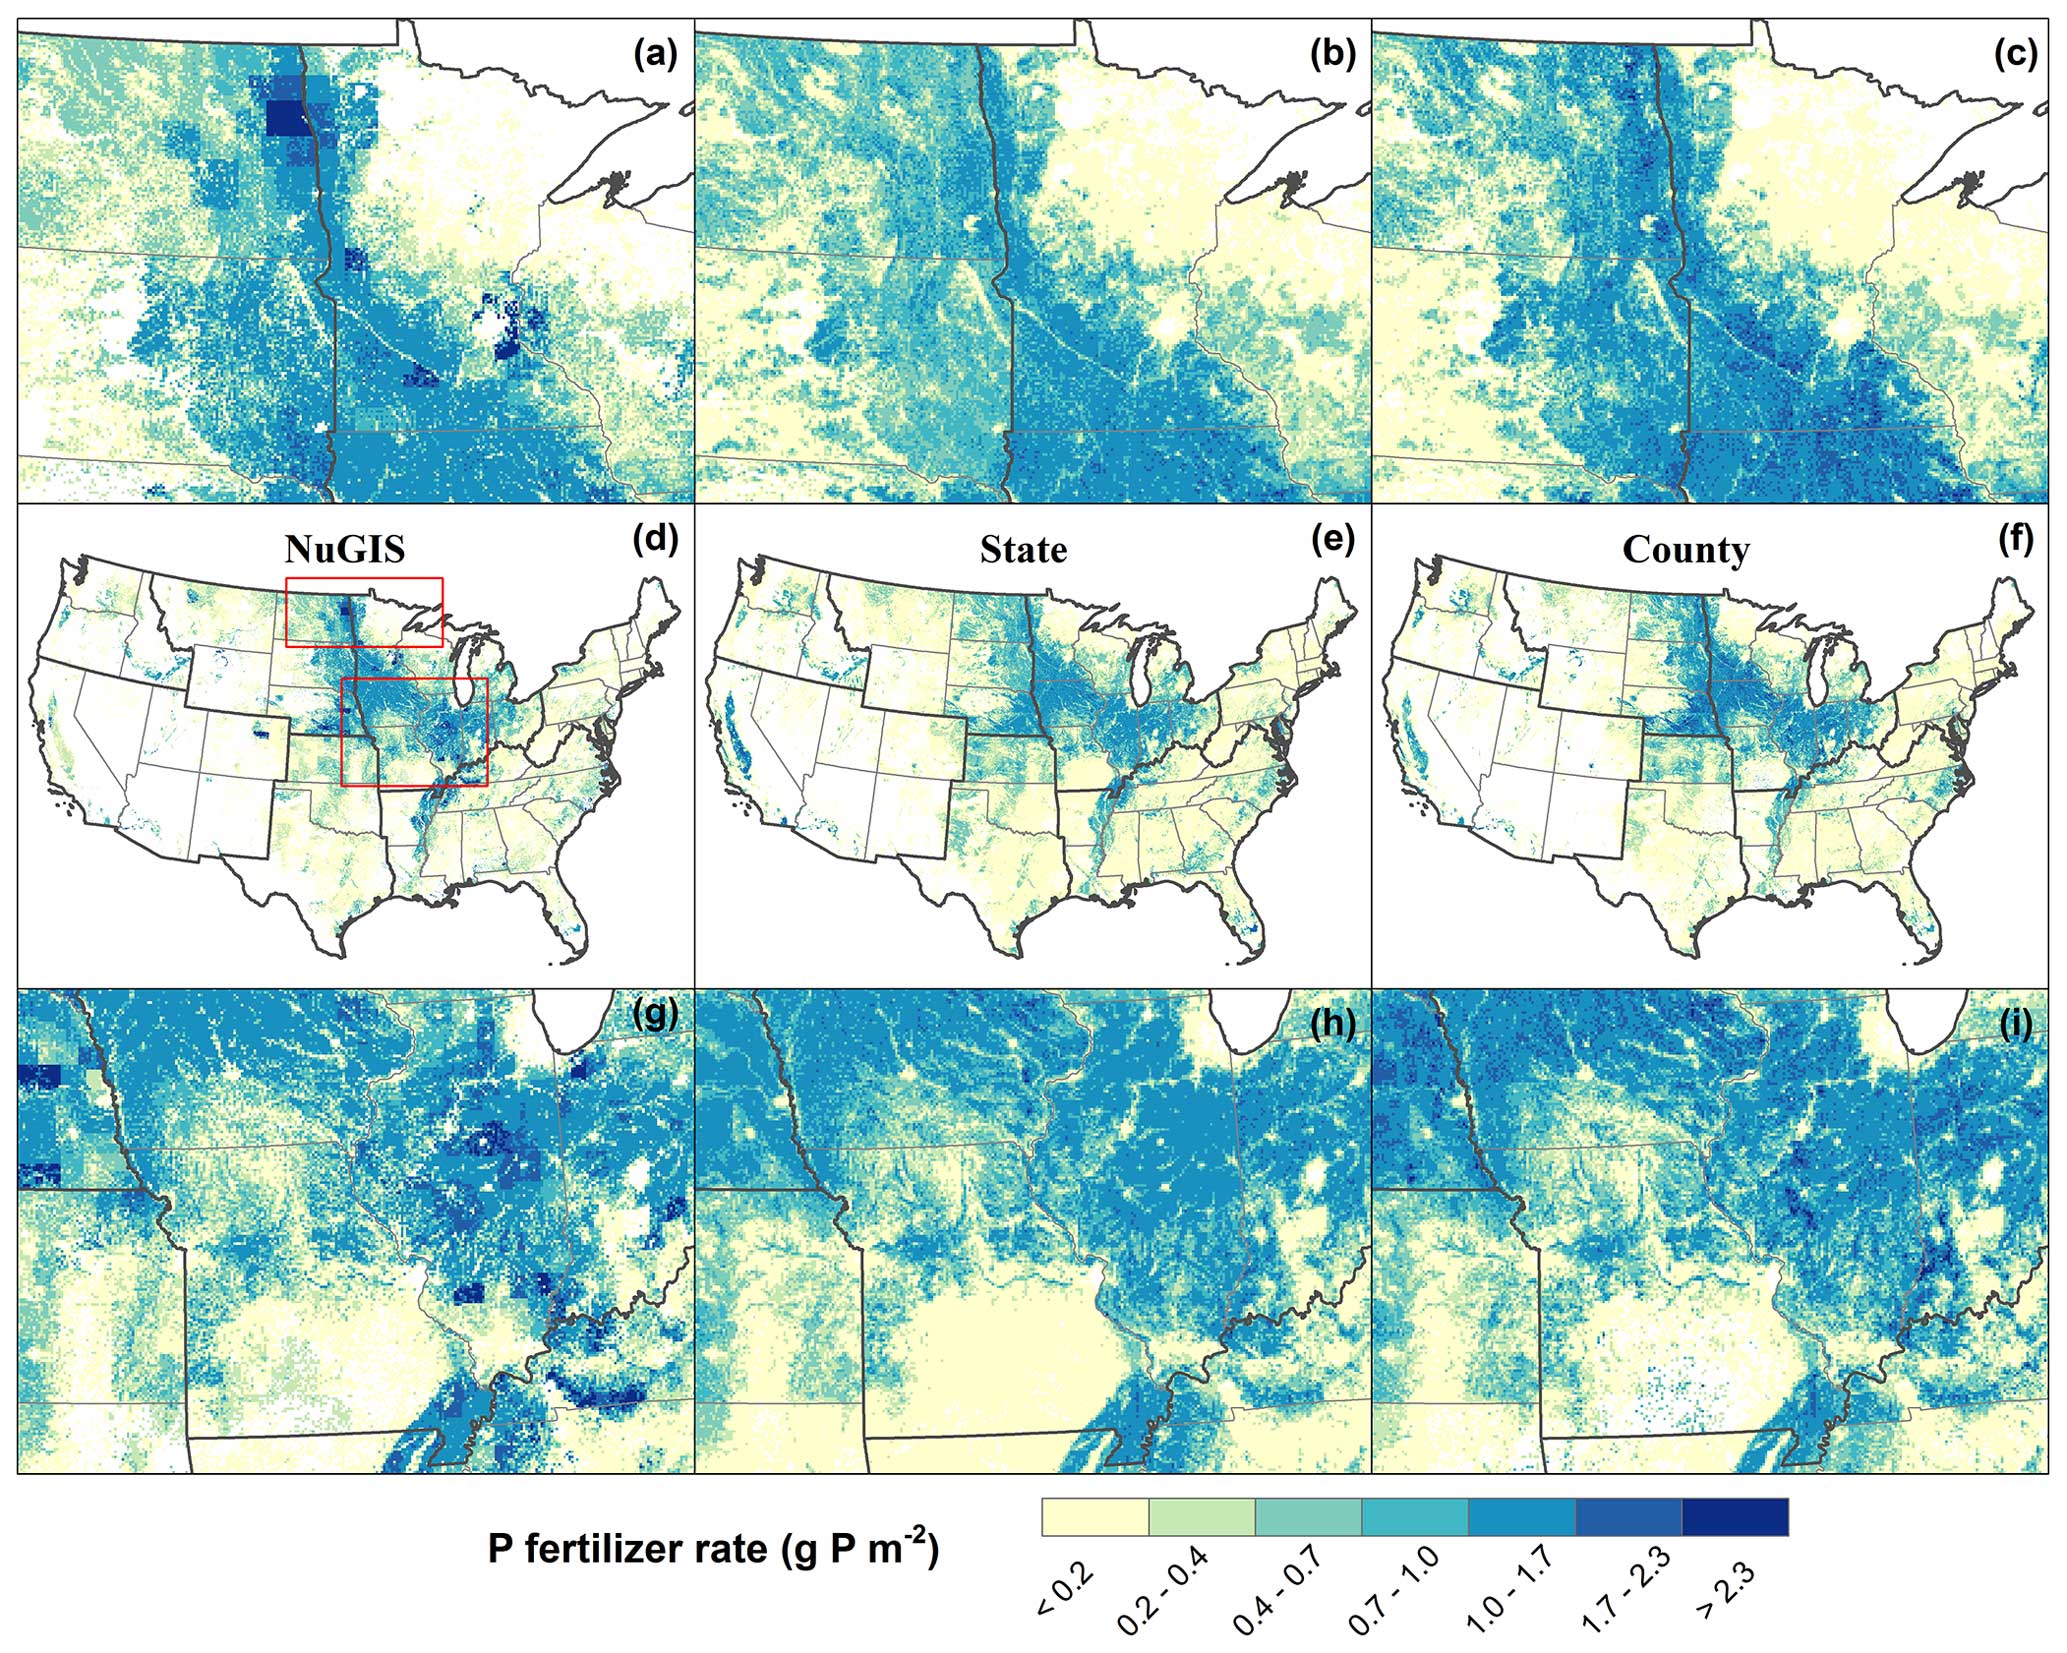
Figure 10Comparison of spatial distribution of P fertilizer application rate in the contiguous US in 2016. NuGIS (a, d, g) represents the average application rate derived from county-level sales data. State (b, d, h) and county (c, f, i) data used for plotting represent the crop-specific P fertilizer application rate at the state and county level, respectively, as developed in this study. To make it comparable, the same cropland map was used to mask out the cropland extent for NuGIS. Two red boxes in panel (d) were zoomed in to demonstrate more details in the top and bottom panels.
4.2 Temporal and spatial dynamics of P fertilizer management
Concurrently with the historical changes in US cropland since 1850, P use has experienced different stages of change, similarly to nitrogen fertilizer use (Cao et al., 2018), influenced by various factors. From 1850 to 1940, the primary crops, corn, cotton, and winter wheat, were mainly concentrated in the eastern US. The constrained production of phosphate rock and the low demand due to limited crop productivity contributed to the low level of P consumption and application rate. As cropland expanded to the Midwest and the Great Plains from 1940 to 1980, the consumption of P fertilizer peaked after a sharp increase, driven by the rising application rate and percentage of fertilized area across various crops (Figs. 2–5). The major contributors to P consumption during this period were corn in the Midwest and spring wheat and winter wheat in the Great Plains. Following a brief decline in the 1980s due to improved fertilizer use efficiency, increased use of animal manure, and the farm crisis (Scholz et al., 2013; Bouwman et al., 2017; Zhang and Tidgren, 2018), P consumption has stabilized, with annual fluctuations primarily being caused by changes in grain demand and fertilizer prices (US-EPA, 1993). Throughout this period, P consumption continued to decline in the eastern US while increasing or leveling off in other regions, driven by the continued expansion of corn and soybean at the expense of other crops (Figs. 2–5). Another possible factor contributing to the decline in P consumption is that the generous high-rate P application over a half-century has raised soil P level so much that it made it possible to have a lower application and still meet crop demands (Sabo et al., 2021; Bian et al., 2022).
In the past decade, the average percentage of P-fertilized area in the US was around 60 % (including cropland and pasture), which is notably lower than that for nitrogen fertilizer (Fig. S7). The percentage of fertilized area varies among crops, ranging from 42 % for soybean to 89 % for spring wheat. Estimating P use efficiency and P losses in agricultural systems relies strongly on the precise application rate of P fertilizer (Solangi et al., 2023). It is noteworthy that, when we develop the environmental assessments that are sensitive to P fertilizer application rates, the results might be biased when not considering the fertilized-area percentage, especially for the crops with lower fertilized-area percentages, such as soybean, cotton, and sorghum.
Despite the fact that the application of P fertilizer after planting is strongly recommended for improving P fertilizer use efficiency and minimizing P losses to the environment, this application timing remains the least popular choice for major crops in the US. Notably, rice in the US rice belt, sorghum in the Southern Great Plains, and cotton along the southwestern coast were major contributors to post-planting applications. In contrast, both fall and spring applications before planting, leaving P susceptible to loss (King et al., 2018), have been widely adopted across multiple crops in the CONUS due to lower fertilizer prices, the availability of labor, and the easy-to-use operating equipment (Carver et al., 2022). Winter wheat in the Southern Great Plains and the Northwest received over 40 % of its annual P fertilizer in the fall, potentially contributing to a boost in yield. However, corn and soybean farmers in the Midwest, cotton farmers in the Southwest and north of Texas, and sorghum farmers in the Southern Great Plains favor fall application, implying a high potential risk for P loss (Nelson et al., 2023; Yuan et al., 2013). Except for winter wheat, spring wheat, and durum wheat, all other crops receive more than a quarter of their annual P fertilizer in spring before application. Despite being closer to the planting date, the P fertilizer applied during early spring may be prone to loss via runoff, erosion, and leaching during intense rainfall (Williams and King, 2020; Algoazany et al., 2007). Application at planting is more prevalent among winter wheat and spring wheat in the Southern Great Plains and the Northern Great Plains, respectively.
Non-broadcasting application is commonly found for winter wheat, durum wheat, and barley in the Northwest and Northern Great Plains and for spring wheat, cotton, and sorghum in the Southern Great Plains. In addition, corn farmers in Wisconsin, Michigan, and the Northeast apply most of their annual P fertilizer using the non-broadcast method. The non-broadcasting has been considered to be a more conservative management to prevent P loss (Carver et al., 2022; Smith et al., 2016). However, broadcasting, including post-incorporation and non-incorporation, remains widespread across the US, particularly in the Midwest (hotspot for P fertilizer use) and the Southeast.
4.3 Uncertainty
The uncertainties of this database are mainly due to several aspects. (1) The reconstructed P fertilizer management data extend back to 1850. However, compared to the national P use information, finer-scale sources at the state and county level are only available from the 1930s onwards. Due to the absence of earlier data, we interpolated the state-level P fertilizer consumption use back to 1850 by assuming its inter-annual variations are consistent with the national data. This approach to addressing the temporal gaps may introduce larger uncertainties in the state-level temporal trajectories before the 1930s. (2) There is limited information on P use in cropland pastures and permanent pastures at finer temporal and spatial resolutions, contributing to uncertain estimates for other crops. (3) Due to the lack of information on where croplands are fertilized, we assumed that all the croplands in each state were fertilized but at a lower rate by multiplying the rates in the fertilized cropland with the percentage of fertilized cropland. This could lead to an underestimation of P fertilizer use rate in fertilized areas and overestimation in non-fertilized areas, especially when the state-level fertilized-cropland percentage is low. (4) Adjustments were made to crop-specific P fertilizer use rates at the state level to reconcile top-down and bottom-up data sources. However, the paucity of detailed crop-specific information may introduce biases in our adjustments made for certain crops. (5) The composition of the other crops differs across states. All crop types under other crops within each state receive equal P application rates, which may bias the application rate for some crop types. (6) Due to the lack of finer-spatial-resolution information, we assumed that the crop-specific P application timing and method are identical within each state. However, the spatial heterogeneity in terms of the application timing and method may be overlooked. Therefore, a finer-resolution spatial and temporal survey capturing crop-specific P application rate, timing, and method will be invaluable for enhancing our understanding of the spatiotemporal patterns of P fertilizer management information in the US.
The P fertilizer management dataset is publicly available via ZENODO at https://doi.org/10.5281/zenodo.10700821 (Cao et al., 2024).
By harmonizing various data sources, we reconstructed a long-term spatially explicit P fertilizer management dataset at a 4 km × 4 km resolution from 1850 to 2022 in the CONUS. We discussed the divergence between top-down (total P consumption) and bottom-up (crop-specific P fertilizer use) data sources, underscoring the necessity to improve crop-specific management information in future surveys. The newly developed dataset, leveraging the strengths of both data sources, highlights cross-crop variabilities in the long-term use of P fertilizer among counties. The results reveal a substantial increase in P fertilizer consumption and application rate from 1850 to 2022, notably during 1940–1980. However, the magnitude and long-term changing trend differed significantly across crop types. It is worth noting that approximately 40 % of cropland in the US does not receive P fertilizer inputs. Since 1850, the hotspots of P fertilizer use have shifted from the southeastern and eastern US to the Midwest and the Great Plains, driven by changes in cropland distribution and P fertilizer application rate across different crop types. Additionally, P fertilizer application timing and method vary substantially across crop types and regions. Corn, soybean, and cotton in the Midwest and the Southeast receive over 60 % of their annual P fertilizer pre-planting and through broadcasting. Conversely, winter wheat, spring wheat, durum wheat, and barley in the Great Plains and the Northwest predominantly receive their annual P fertilizer at and post-planting and via non-broadcasting. Promoting efficient P fertilizer management, encompassing the proper application rate, timing, and method, is essential for enhancing P use efficiency and thus contributes to economic, social, and environmental sustainability and profitability.
The supplement related to this article is available online at: https://doi.org/10.5194/essd-16-4557-2024-supplement.
CL, PC, and BY conceptualized the paper and developed the methodology. PC and BY reconstructed the dataset. PC and BY prepared the paper with contributions from CL, FB, CGF, and MH.
At least one of the (co-)authors is a member of the editorial board of Earth System Science Data. The peer-review process was guided by an independent editor, and the authors also have no other competing interests to declare.
Publisher’s note: Copernicus Publications remains neutral with regard to jurisdictional claims made in the text, published maps, institutional affiliations, or any other geographical representation in this paper. While Copernicus Publications makes every effort to include appropriate place names, the final responsibility lies with the authors.
We are grateful for the helpful comments and suggestions from the reviewers and the editorial team.
This work is supported by the Iowa Nutrient Research Center, the ISU College of Liberal Arts and Sciences Dean's Faculty Fellowship, and the NSF CAREER grant (no. 1945036).
The article processing charges for this open-access publication were covered by the Iowa State University Library.
This paper was edited by Hao Shi and reviewed by two anonymous referees.
AAPFCO (Association of American Plant Food Control Officials): Commercial Fertilizers, http://www.aapfco.org/publications.html (last access: 20 December 2021), 2022.
Alexander, R. B. and Smith, R. A.: County level estimates of nitrogen and phosphorus fertilizer use in the United States, 1945 to 1985, U.S. Geological Survey, Books and Open-File Reports [distributor], No. 90-130, Reston, Virginia, USA, https://pubs.usgs.gov/publication/ofr90130 (last access: 30 September 2024), 1990.
Algoazany, A. S., Kalita, P. K., Czapar, G. F., and Mitchell, J. K.: Phosphorus Transport through Subsurface Drainage and Surface Runoff from a Flat Watershed in East Central Illinois, USA, J. Environ. Qual., 36, 681–693, https://doi.org/10.2134/jeq2006.0161, 2007.
Bian, Z., Pan, S., Wang, Z., Yao, Y., Xu, R., Shi, H., Kalin, L., Anderson, C., Justic, D., Lohrenz, S., and Tian, H.: A Century-Long Trajectory of Phosphorus Loading and Export From Mississippi River Basin to the Gulf of Mexico: Contributions of Multiple Environmental Changes, Global Biogeochem. Cy., 36, e2022GB007347, https://doi.org/10.1029/2022GB007347, 2022.
Bouwman, A. F., Beusen, A. H. W., Lassaletta, L., Van Apeldoorn, D. F., Van Grinsven, H. J. M., Zhang, J., and Ittersum Van, M. K.: Lessons from temporal and spatial patterns in global use of N and P fertilizer on cropland, Sci. Rep., 7, 40366, https://doi.org/10.1038/srep40366, 2017.
Bouwman, L., Goldewijk, K. K., Van Der Hoek, K. W., Beusen, A. H. W., Van Vuuren, D. P., Willems, J., Rufino, M. C., and Stehfest, E.: Exploring global changes in nitrogen and phosphorus cycles in agriculture induced by livestock production over the 1900–2050 period, P. Natl. Acad. Sci. USA, 110, 20882–20887, https://doi.org/10.1073/pnas.1012878108, 2013.
Brakebill, J. W. and Gronberg, J. M.: County-Level Estimates of Nitrogen and Phosphorus from Commercial Fertilizer for the Conterminous United States, 1987–2012, U.S. Geological Survey data release, https://doi.org/10.5066/F7H41PKX, 2017.
Cao, P., Lu, C., and Yu, Z.: Historical nitrogen fertilizer use in agricultural ecosystems of the contiguous United States during 1850–2015: application rate, timing, and fertilizer types, Earth Syst. Sci. Data, 10, 969–984, https://doi.org/10.5194/essd-10-969-2018, 2018.
Cao, P., Yi, B., Bilotto, F., Gonzalez Fischer, C., Herrero, M., and Lu, C.: Annual crop-specific management history of phosphorus fertilizer input (CMH-P) in the croplands of United States from 1850 to 2022: Application rate, timing, and method, Zenodo [data set], https://doi.org/10.5281/zenodo.10700821, 2024.
Carver, R. E., Nelson, N. O., Roozeboom, K. L., Kluitenberg, G. J., Tomlinson, P. J., Kang, Q., and Abel, D. S.: Cover crop and phosphorus fertilizer management impacts on surface water quality from a no-till corn-soybean rotation, J. Environ. Manage., 301, 113818, https://doi.org/10.1016/j.jenvman.2021.113818, 2022.
Cordell, D., Drangert, J. O., and White, S.: The story of phosphorus: Global food security and food for thought, Global Environ. Chang., 19, 292–305, https://doi.org/10.1016/j.gloenvcha.2008.10.009, 2009.
Daloğlu, I., Cho, K. H., and Scavia, D.: Evaluating Causes of Trends in Long-Term Dissolved Reactive Phosphorus Loads to Lake Erie, Environ. Sci. Technol., 46, 10660–10666, https://doi.org/10.1021/es302315d, 2012.
Dhillon, J., Torres, G., Driver, E., Figueiredo, B., and Raun, W. R.: World Phosphorus Use Efficiency in Cereal Crops, Agron. J., 109, 1670–1677, https://doi.org/10.2134/agronj2016.08.0483, 2017.
Falcone, J. A.: Estimates of county-level nitrogen and phosphorus from fertilizer and manure from 1950 through 2017 in the conterminous United States, Open-File Report, Reston, VA, 20 pp., https://doi.org/10.3133/ofr20201153, 2021.
FAO (Food and Agriculture Organization of the United Nations): FAO online database, http://www.fao.org/faostat/en/#data/RF (last access: 30 September 2024), 2021.
Glibert, P. M.: From hogs to HABs: impacts of industrial farming in the US on nitrogen and phosphorus and greenhouse gas pollution, Biogeochemistry, 150, 139–180, https://doi.org/10.1007/s10533-020-00691-6, 2020.
King, K. W., Williams, M. R., LaBarge, G. A., Smith, D. R., Reutter, J. M., Duncan, E. W., and Pease, L. A.: Addressing agricultural phosphorus loss in artificially drained landscapes with 4R nutrient management practices, J. Soil Water Conserv., 73, 35–47, https://doi.org/10.2489/jswc.73.1.35, 2018.
Lu, C. and Tian, H.: Global nitrogen and phosphorus fertilizer use for agriculture production in the past half century: shifted hot spots and nutrient imbalance, Earth Syst. Sci. Data, 9, 181–192, https://doi.org/10.5194/essd-9-181-2017, 2017.
Mehring, A. L., Adams, J. R., and Jacob, K. D.: Statistics on Fertilizers and Liming Materials in the United States, USDA-Agricultural Research Service, Statistical Bulletin No. 191, Washington, D.C., USA, 1957.
Nelson, N. O., Roozeboom, K. L., Yeager, E. A., Williams, J. R., Zerger, S. E., Kluitenberg, G. J., Tomlinson, P. J., Abel, D. S., and Carver, R. E.: Agronomic and economic implications of cover crop and phosphorus fertilizer management practices for water quality improvement, J. Environ. Qual., 52, 113–125, https://doi.org/10.1002/jeq2.20427, 2023.
NuGIS: Nutrient Use Geographic Information System, https://nugis.tfi.org/ (last access: 20 December 2022), 2022.
Sabo, R. D., Clark, C. M., Gibbs, D. A., Metson, G., Todd, M. J., LeDuc, S. D., Greiner, D., Fry, M. M., Polinsky, R., Yang, Q., Tian, H., and Compton, J. E.: Phosphorus Inventory for the Conterminous United States (2002–2012), J. Geophys. Res.-Biogeo., 126, e2020JG005684, https://doi.org/10.1029/2020JG005684, 2021.
Samreen, S.: Phosphorus Fertilizer: The Original and Commercial Sources, edited by: Zhang, S. K. E.-T., IntechOpen, Rijeka, Chap. 6, https://doi.org/10.5772/intechopen.82240, 2019.
Scholz, R. W., Ulrich, A. E., Eilittä, M., and Roy, A.: Sustainable use of phosphorus: a finite resource, Sci. Total Environ., 461, 799–803, 2013.
Sharpley, A., Jarvie, H. P., Buda, A., May, L., Spears, B., and Kleinman, P.: Phosphorus Legacy: Overcoming the Effects of Past Management Practices to Mitigate Future Water Quality Impairment, J. Environ. Qual., 42, 1308–1326, https://doi.org/10.2134/jeq2013.03.0098, 2013.
Smith, D. R., Harmel, R. D., Williams, M., Haney, R., and King, K. W.: Managing Acute Phosphorus Loss with Fertilizer Source and Placement: Proof of Concept, Agricultural & Environmental Letters, 1, 150015, https://doi.org/10.2134/ael2015.12.0015, 2016.
Solangi, F., Zhu, X., Khan, S., Rais, N., Majeed, A., Sabir, M. A., Iqbal, R., Ali, S., Hafeez, A., Ali, B., Ercisli, S., and Kayabasi, E. T.: The Global Dilemma of Soil Legacy Phosphorus and Its Improvement Strategies under Recent Changes in Agro-Ecosystem Sustainability, ACS Omega, 8, 23271–23282, https://doi.org/10.1021/acsomega.3c00823, 2023.
Stackpoole, S. M., Stets, E. G., and Sprague, L. A.: Variable impacts of contemporary versus legacy agricultural phosphorus on US river water quality, P. Natl. Acad. Sci. USA, 116, 20562–20567, https://doi.org/10.1073/pnas.1903226116, 2019.
Swaney, D. P. and Howarth, R. W.: Phosphorus use efficiency and crop production: Patterns of regional variation in the United States, 1987–2012, Sci. Total Environ., 685, 174–188, https://doi.org/10.1016/j.scitotenv.2019.05.228, 2019.
Tilman, D., Cassman, K., Matson, P., Naylor, R., and Polasky, S.: Agricultural sustainability and intensive production practices, Nature, 418, 671–677, https://doi.org/10.1038/nature01014, 2002.
USDA (U.S. Department of Agriculture): Consumption of Commercial Fertilizers, Primary Plant Nutrients, and Micronutrients, 1850–1969, USDA-Statistical Reporting Service, Crop Reporting Board, Statistical Bulletin No. 472, Washington, D.C., USA, 1971.
USDA-ERS (U.S. Department of Agriculture-Economic Research Service): Fertilizer Use and Price, https://www.ers.usda.gov/data-products/fertilizer-use-and-price.aspx (last access: 30 September 2024), 2019.
USDA-ERS (U.S. Department of Agriculture-Economic Research Service): Tailored Reports: Crop Production Practices, https://data.ers.usda.gov/reports.aspx?ID=17883 (last access: 30 September 2024), 2024.
USDA-NASS (U.S. Department of Agriculture-National Agricultural Service): Agricultural Chemical Use Program, https://www.nass.usda.gov/Surveys/Guide_to_NASS_Surveys/Chemical_Use/index.php (last access: 30 September 2024), 2021.
USDA-NASS (U.S. Department of Agriculture-National Agricultural Statistics Service): Quick Stats Tools, https://quickstats.nass.usda.gov/ (last access: 30 September 2024), 2024.
US-EPA (U.S.-Environmental Protection Agency): Phosphoric acid and phosphatic fertilizers: a profile, Office of Air Quality Planning and Standards, North Carolina, USA, https://www.epa.gov/sites/default/files/2020-07/documents/phosphoric-acid-phosphatic-fertilizers_ip_07-1993.pdf (last access: 30 September 2024), 1993.
US-FNCA: U.S. Fourth National Climate Assessment, http://www.globalchange.gov/nca4 (last access: 20 December 2022), 2022.
Williams, M. R. and King, K. W.: Changing Rainfall Patterns Over the Western Lake Erie Basin (1975–2017): Effects on Tributary Discharge and Phosphorus Load, Water Resour. Res., 56, e2019WR025985, https://doi.org/10.1029/2019WR025985, 2020.
Ye, S., Cao, P., and Lu, C.: Annual time-series 1 km maps of crop area and types in the conterminous US (CropAT-US): cropping diversity changes during 1850–2021, Earth Syst. Sci. Data, 16, 3453–3470, https://doi.org/10.5194/essd-16-3453-2024, 2024.
Yuan, Y., Locke, M. A., Bingner, R. L., and Rebich, R. A.: Phosphorus losses from agricultural watersheds in the Mississippi Delta, J. Environ. Manage., 115, 14–20, https://doi.org/10.1016/j.jenvman.2012.10.028, 2013.
Zhang, J., Gilbert, D., Gooday, A. J., Levin, L., Naqvi, S. W. A., Middelburg, J. J., Scranton, M., Ekau, W., Peña, A., Dewitte, B., Oguz, T., Monteiro, P. M. S., Urban, E., Rabalais, N. N., Ittekkot, V., Kemp, W. M., Ulloa, O., Elmgren, R., Escobar-Briones, E., and Van der Plas, A. K.: Natural and human-induced hypoxia and consequences for coastal areas: synthesis and future development, Biogeosciences, 7, 1443–1467, https://doi.org/10.5194/bg-7-1443-2010, 2010.
Zhang, J., Cao, P., and Lu, C.: Half-Century History of Crop Nitrogen Budget in the Conterminous United States: Variations Over Time, Space and Crop Types, Global Biogeochem. Cy., 35, e2020GB006876, https://doi.org/10.1029/2020GB006876, 2021.
Zhang, W. and Tidgren, K.: The current farm downturn vs the 1920s and 1980s farm crises: An economic and regulatory comparison, Agr. Econ. Rev., 78, 396–411, 2018.