the Creative Commons Attribution 4.0 License.
the Creative Commons Attribution 4.0 License.
 | 08 Oct 2024
Modeling fuel-, vehicle-type-, and age-specific CO2 emissions from global on-road vehicles in 1970–2020
Liu Yan
Qiang Zhang
Kebin He
Vehicles are among the most important contributors to global anthropogenic CO2 emissions. However, the lack of fuel-, vehicle-type-, and age-specific information about global on-road CO2 emissions in existing datasets, which are available only at the sector level, makes these datasets insufficient for supporting the establishment of emission mitigation strategies. Thus, a fleet turnover model is developed in this study, and CO2 emissions from global on-road vehicles from 1970 to 2020 are estimated for each country. Here, we analyze the evolution of the global vehicle stock over 50 years, identify the dominant emission contributors by vehicle and fuel type, and further characterize the age distribution of on-road CO2 emissions. We find that trucks accounted for less than 5 % of global vehicle ownership but represented more than 20 % of on-road CO2 emissions in 2020. The contribution of diesel vehicles to global on-road CO2 emissions doubled during the 1970–2020 period, driven by the shift in the fuel-type distribution of vehicle ownership. The proportion of CO2 emissions from vehicles in developing countries such as China and India in terms of global emissions from newly registered vehicles significantly increased after 2000, but global CO2 emissions from vehicles that had survived more than 15 years in 2020 still originated mainly from developed countries such as the United States and countries in the European Union. The data are publicly available at https://doi.org/10.6084/m9.figshare.24548008 (Yan et al., 2024).
- Article
(3037 KB) - Full-text XML
-
Supplement
(2947 KB) - BibTeX
- EndNote


To meet the Paris Agreement's 1.5° long-term temperature goal, many efforts have been made to determine pathways for reducing the emissions of greenhouse gases such as CO2 (Matthews and Caldeira, 2008; Meinshausen et al., 2009; Rogelj et al., 2018; Davis et al., 2018; Höhne et al., 2020). Historical emission data and consistent emission series of on-road vehicles, which are key sources of CO2 emissions, are important inputs for Earth system models, atmospheric chemistry and transport models, and integrated assessment models to support studies on both climate change and global climate governance (Bhalla et al., 2014; Janssens-Maenhout et al., 2019; Lelieveld et al., 2015; Shindell et al., 2011; Silva et al., 2016; Unger et al., 2010). Thus, estimating long-term CO2 emissions from global on-road vehicles with detailed source information is necessary as deep greenhouse gas emission reductions are pursued.
Several global emission inventories that cover emissions from on-road vehicles have been developed and are widely used in global research and modeling. CO2 emissions from on-road vehicles can be derived from global anthropogenic emission inventories, including the Emissions Database for Global Atmospheric Research (EDGAR), the Open-source Data Inventory for Atmospheric CO2 (ODIAC), the Carbon Emission and Accounts Datasets (CEADs), and the Peking University (PKU)-CO2 inventory. On-road CO2 emissions are estimated with the total fuel consumption of the road sector at the country level and fleet average emission factors in EDGAR (Amstel et al., 1999; Crippa et al., 2016, 2018; Janssens-Maenhout et al., 2019). Following the method in EDGAR, local data sources are introduced more often in ODIAC (Boden et al., 2016, 2017; Oda et al., 2018), CEDS (Hoesly et al., 2018), and PKU-CO2 (Wang et al., 2013) when estimating on-road CO2 emissions. Global CO2 emissions from on-road vehicles in these widely used emission inventories are estimated as a whole at the sector level in each country using the fuel-based method, and fleet structure information (e.g., fuel-, vehicle-type-, and age-specific characteristics) for on-road CO2 emissions is omitted. Technology-based models such as the Greenhouse Gas and Air Pollution Interactions and Synergies (GAINS) (Klimont et al., 2017) and Speciated Pollutant Emissions Wizard (SPEW)-Trend (Bond et al., 2004, 2007; Yan et al., 2011, 2014) models can be used to describe fleet structure information on emissions from global on-road vehicles, but emission inventories based on these models only include emissions of air pollutants.
Here, a new global inventory of fuel-, vehicle-type-, and age-specific CO2 emissions from on-road vehicles for each country from 1970 to 2020 is developed with the global fleet turnover model, in which six types of fuels, five types of vehicles, and 231 countries are considered. Based on this inventory, we analyze the evolution of the global vehicle stock over 50 years, identify the dominant emission contributors by vehicle and fuel type, and further characterize the age distribution of on-road CO2 emissions. Compared to the publicly available on-road CO2 emissions from previous studies, CO2 emissions in this study have more detailed source categories which are refined into vehicle and fuel type. With the age distribution simulated by our fleet turnover model, CO2 emissions offered in this study would better support the policymaking of emission mitigation.
2.1 Methodological framework
For a given country c, the annual CO2 emissions from on-road vehicles in year y are estimated as follows:
where y is the target year, which ranges from 1970 to 2020; i is the age of the vehicles registered in the year (y−i); T is the lifetime of vehicles; v is the vehicle type, which includes two types of light-duty vehicles, i.e., passenger cars (PLDVs) and light commercial vehicles (CLDVs), two types of heavy-duty vehicles, i.e., buses and trucks, and motorcycles (MCs); and f is the fuel type, which includes gasoline, diesel, natural gas (NG), liquefied petroleum gas (LPG), electricity, and other fuels. As shown in Eq. (1), annual CO2 emissions () are estimated by the vehicle stock (), the fleet-average fuel structure (), the annual average kilometers traveled (), the fleet-average fuel economy (), the age distribution of the vehicle stock (), and the CO2 emission factor (EFc,f). can be modeled using the Gompertz function (Eq. 2), which is an S-shaped curve determined by two negative parameters (α and β), with the saturated vehicle stock per 1000 people (V∗), per capita gross domestic product (GDP; E), and population (Populationc,y) as inputs. The age distribution of the vehicle stock (), which represents the proportion of surviving vehicles registered in the year (y−i) to the target year y, is modeled on the basis of the dynamic balance function (Eqs. 3 and 4) using the number of newly registered vehicles () and survival rates (). Fuel consumption by vehicle type, which is calculated using , , , , and , is constrained by the total on-road fuel consumption () at the country level (Eq. 5).
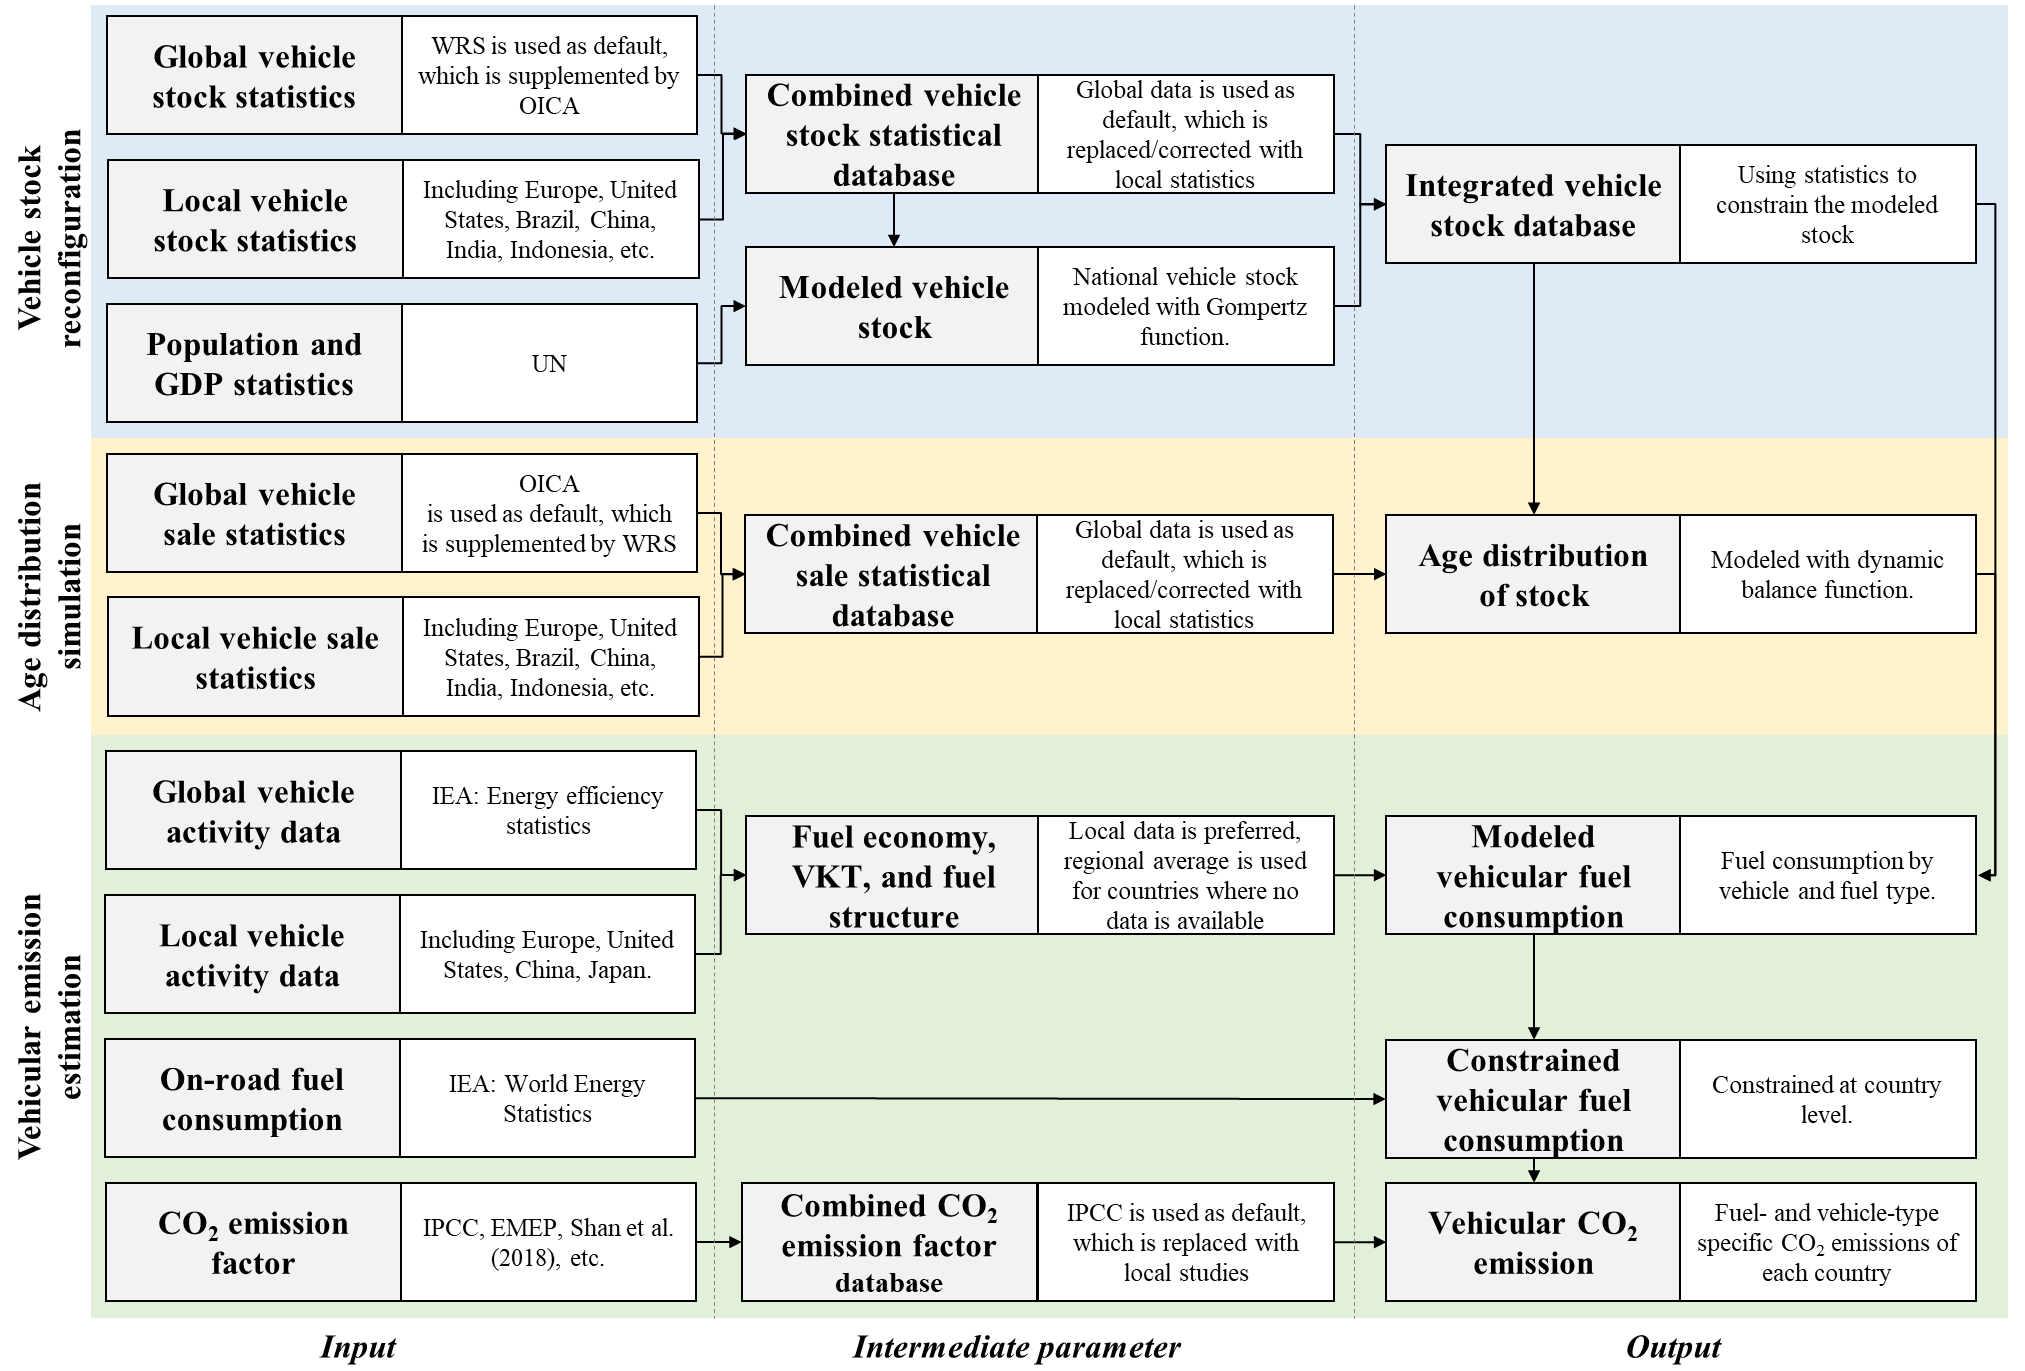
In this study, the fleet turnover emission model (Fig. 1) is constructed based on Eqs. (1)–(5). Specifically, we first build an integrated vehicle stock database by combining and harmonizing the available vehicle stock data from a series of global, regional, and national statistics and filling data gaps with the modeled stock based on the Gompertz function (Eq. 2). Second, the age distribution of the stock is simulated with a combined vehicle sale statistical database and an integrated vehicle stock database using the dynamic balance function (Eqs. 3 and 4). Third, vehicular fuel consumption is estimated using outputs from the first two steps and other vehicle-activity-related data and is constrained by national fuel consumption statistics (Eq. 5). Finally, fuel- and vehicle-type-specific CO2 emissions from global on-road vehicles from 1970 to 2020 are modeled on the basis of constrained vehicular fuel consumption and CO2 emission factors (Eq. 1).
2.2 Modeling the vehicle stock
In the first step, an integrated vehicle stock database from 1970 to 2020 was constructed with both statistical and modeled data. The statistical data used in this study were collected from various available vehicle stock statistics, in which global statistics were used as the default vehicle stock and local statistics were used to supplement and amend the default data. When statistical data were unavailable for a country in a given year, vehicle stock modeled by the Gompertz function was used.
To determine the default vehicle stock database, two widely used vehicle stock statistics from the World Road Statistics (WRS) 2021 Edition (IRF, 2024) and the International Organization of Motor Vehicle Manufacturers (OICA, 2024) were collected and compared. We found that the trends of vehicle stock in the WRS and OICA data were similar, but the absolute value of the vehicle stock in the OICA data was lower than that in the WRS data, especially for developing countries (Fig. S2 in the Supplement). Taking India as an example, the vehicle stock in the OICA data was 85 % less than that in the WRS data. To further confirm the reliability of these two global databases, local statistics were used for comparison. The WRS data were more similar to the local vehicle statistics than were the OICA data (Fig. S2). After comprehensive consideration of spatiotemporal coverage, updating frequency and stability, and data reliability, the WRS data were used as the default for global vehicle statistics, and the OICA data were used if there were no data available from the WRS.
We also collected a series of local statistics as supplements and amendments to the global vehicle statistics, in which 49 developing and developed countries were included (ACEA, 2024; CEIC, 2024; EC, 2024; JAMA, 2024; MEIC, 2024; MOSPI, 2024; NBS, 2024; TEDB, 2024). By coupling multiple global and local vehicle databases, a vehicle statistical database combined by vehicle category was established in this study. As the division of vehicle types varied among the statistics, we established a mapping relationship of vehicle types between this study and other data sources (Table S2 in the Supplement).
Given that statistical data for vehicles were unavailable before 2000 for most countries, the Gompertz function, which was often applied to establish the relationship between vehicle ownership and economic indicators (Dargay and Gately, 1999; Dargay et al., 2007; Huo and Wang, 2012), was subsequently used in this study to model the vehicle stock. In this study, per capita GDP was calculated with national GDP (NBS; UNdata; WB, 2024) and population (NBS; WPP, 2024) as the economic indicators. The saturated vehicle stock per 1000 people was first derived from previous studies (Huo and Wang, 2012) and then adjusted by the maximal vehicle stock per 1000 people calculated using statistical data. The combined vehicle statistical database was used to estimate parameters (α and β) of the Gompertz function at the country level. For countries whose R square (R2) of the country-level regression was less than 0.5, regional or global α and β regression parameters were used instead (Zheng et al., 2014).
To verify the vehicle stock modeled by the Gompertz function, we compared it with the statistical vehicle stock for countries in years when statistics were available. The relative deviation ratios in countries with the top 85 % of the global vehicle stock were between −28 % and 25.6 %. The ranges of the relative deviations in the rest of the countries were a bit larger due to the limited availability of statistics. Figures 2a and S3 in the Supplement show the comparison in 2015, a year with more statistical data. The deviation of the modeled vehicle stock from the statistics in most countries was less than ±25 %, especially in the United States, countries in the European Union, China, and India. The relatively good consistency between the modeled and statistical vehicle stock indicates the relatively high reliability of this model. Therefore, a long-term integrated vehicle stock database (1970–2020) was constructed by constraining the modeled vehicle stock using the combined vehicle statistical database.
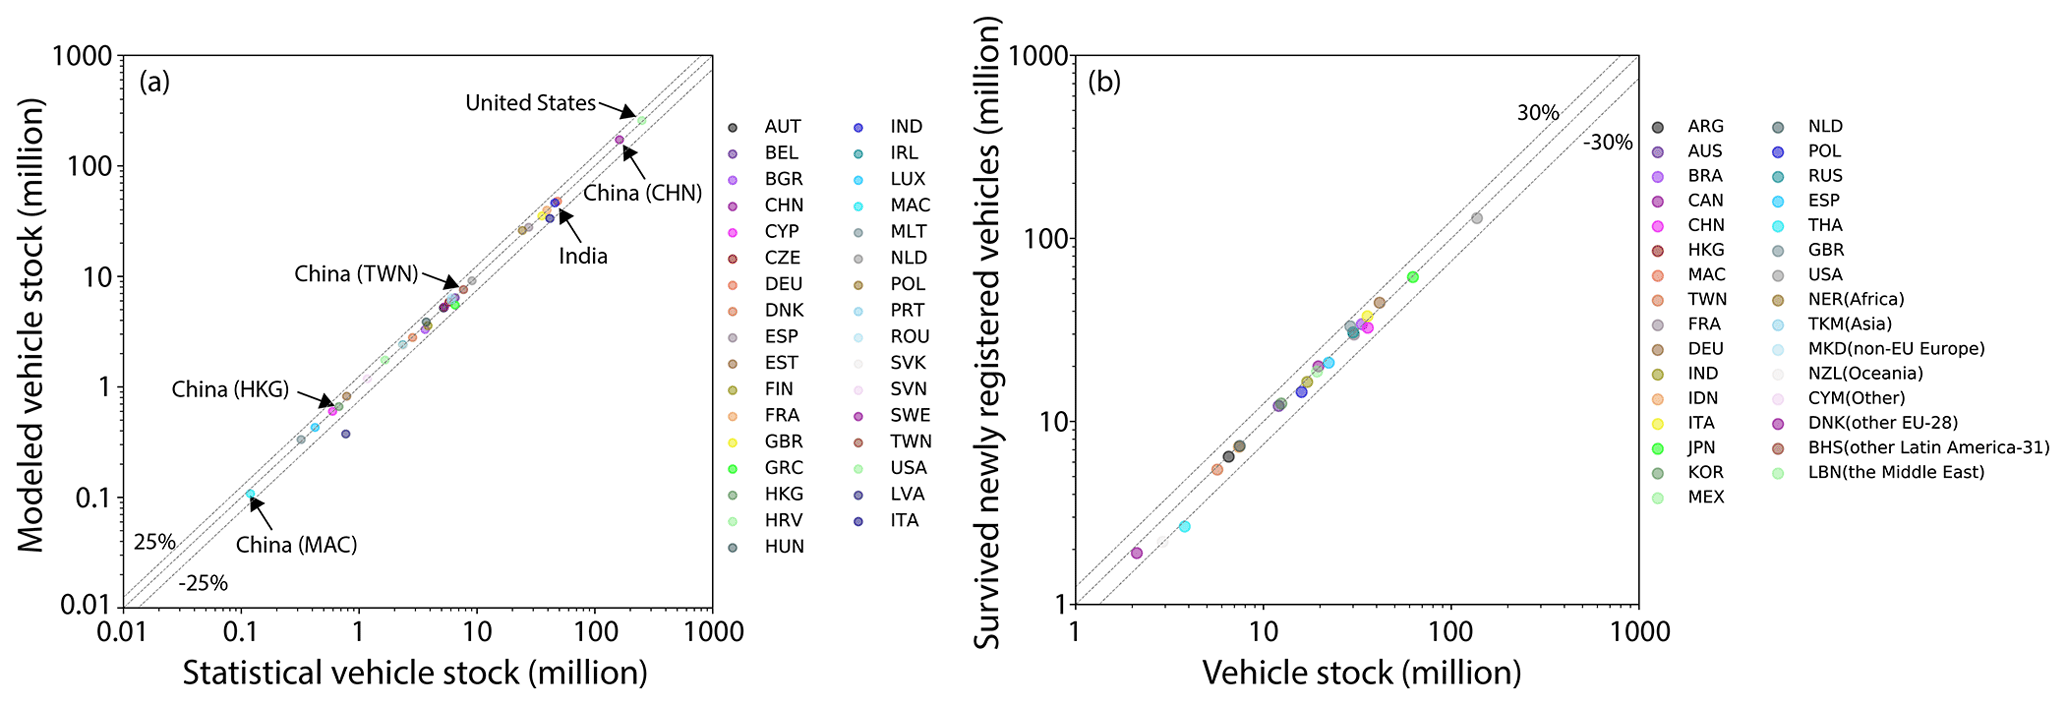
Figure 2Verification of the modeled vehicle stock in the United States, the European Union, China, and India (a) and the age distribution for PLDVs (b) in 2015.
2.3 Modeling the age distribution of vehicle stock
Then, the age distribution of the stock was modeled using the dynamic balanced function with the integrated vehicle stock database set up in the first step and a combined vehicle sale statistical database. Similar to the combination of vehicle stock statistics, OICA data were used as the default vehicle sale database with WRS data as a supplement after comparison, and local statistics (ACEA; CEIC; EC; JAMA; MEIC; NBS; TEDB) were also involved to correct the default database. Limited by the temporal coverage of the statistical data, vehicle sales were not available for most countries before 2005. Therefore, the newly registered vehicles for missing years were back-calculated with the dynamic balanced function, in which the vehicle stock from the previous step and the survival rates derived from available studies and reports (Huo and Wang, 2012; Yan et al., 2011, 2014; Zheng et al., 2014) were inputs. Here we classified 231 countries into two types: focus countries and broader regions (Table S1 in the Supplement). Twenty countries owning the top 75 % of global vehicles were classified as focus countries, for which the dynamic balanced function was built at the country level. The remaining 211 countries were marked as broader regions and further combined into eight regions according to the roadmap region definition (ICCT, 2012). In each broader region, data in a representative country with the most abundant statistics in a region were used to build the dynamic balanced function, and the age distribution in this country was assumed to be able to represent that in other countries belonging to the same region. The age distribution in this study was not simulated for MCs due to the limitation of the data availability, and we assumed that they shared the same age distribution as PLDVs.
To verify the age distribution modeled by the dynamic balanced function, the relative deviation between the simulated vehicle stock based on newly registered vehicles and survival rates and the vehicle stock in the first step was used as the validation indicator. Except for several years in Argentina and Thailand, the relative deviation ratios of light-duty vehicles during 1970–2020 range from −30.9 % to 30.8 %, and heavy-duty vehicles had larger relative deviation ratios which were between −36.5 % and 34.9 %. Taking 2015 as an example, the relative deviation ratios in most countries were less than ±30 % (Figs. 2b and S4 in the Supplement). The relatively good consistency between the vehicle stock and simulation indicated that the dynamic balance function set up in this study could model the entry of newly registered vehicles well and that the retirement of existing vehicles and the estimated age distribution were reliable.
2.4 Estimates of fuel consumption
In the third step, we estimated the initial vehicular fuel consumption based on outputs from the first two steps and parameters, including the annual average kilometers traveled (VKT), fuel structure, and fuel economy. Then the initial vehicular fuel consumption was constrained with energy statistics from World Energy Statistics (IEA1, 2024) at the country level, which was finally used in CO2 estimation. VKT, fuel structure, and fuel economy are rarely available in global statistics annually. This study used fleet-average data, which were estimated based on vehicle kilometers, the vehicle stock, vehicle-kilometer energy intensity, and fuel consumption by category in energy efficiency statistics (IEA2, 2019). These indexes for 39 countries (accounting for 43 %–73 % of the global vehicle stock) during the 2000–2018 period can be found in energy efficiency statistics. For countries that were not covered in energy efficiency statistics, the regional or global mean VKT, fuel structure, and fuel economy were used. For missing years, we assumed that the values of these three parameters were similar to those of the adjacent year. There are few local statistics or studies that evaluate the VKT, fuel structure, and fuel economy; therefore, these parameters were supplemented and revised only for the United States, Europe, China, and Japan using local statistics or studies (ACEA; IEA3, 2024; JAMA; MEIC; TEDB; TRACCS, 2024).
As a validation of fuel consumption, the initial vehicular fuel consumption was compared to energy statistics by fuel type (Fig. S5 in the Supplement). The ranges of the relative deviation ratios of gasoline, diesel, NG, and LPG were −23 % to 3 %, −19 % to 9 %, −22 % to 34 %, and −39 % to 14 %, respectively. As CO2 is not directly emitted as exhaust by electrical vehicles, whether they were running, starting, or parking, electricity was not considered in the estimation of vehicular fuel consumption in this study. The consistency of the simulation with statistics ensured the feasibility of constraining the modeled fuel consumption using statistics.
2.5 Estimates of CO2 emissions and uncertainty assessment
Finally, vehicular CO2 emissions were estimated using the constrained vehicular fuel consumption from a previous step and a combined CO2 emission factor database in which emission factors from the Intergovernmental Panel on Climate Change (IPCC, 2024) were used as the default emission factors, and local studies (EEA, 2024; Shan et al., 2018) were used as supplements and amendments. As the CO2 emission factor is influenced mainly by the fuel type and country, the estimation of CO2 emissions would not be interfered with by the simplified assumption for MCs in modeling the age distribution.
Following the method in Crippa et al. (2018, 2019), the corresponding uncertainty (σ) of CO2 emissions from on-road vehicles in year y for a given country c is calculated as follows:
where σAD and σEF are the uncertainties (%) of the activity data (the constrained fuel consumption of on-road vehicles) and CO2 emission factors. Based on the assumption of a lognormal distribution of the calculated uncertainties (Bond et al., 2004), we evaluated the upper and lower ranges of the CO2 estimate by multiplying and dividing the base emissions in this study by 1+σ (Crippa et al., 2018).
As CO2 uncertainty can vary significantly among countries (Marland et al., 1999; Olivier et al., 2014) and the primary source of uncertainty of the CO2 estimate from on-road vehicles is the activity data rather than emission factors (GPG, 2000), the main step in CO2 uncertainty assessment is to evaluate the uncertainty of national activity data. In this study, 231 countries were divided into several groups (Table S1) in the uncertainty assessment, in accordance with the IPCC's tiered approach and EDGAR (Janssens-Maenhout et al., 2019). Here we assume that countries belonging to the OECD in 1990 (OECD90) have the lowest uncertainties in their fuel consumption data because they were economically stable and would have a good statistical infrastructure. In the same line, fuel consumption data in countries with Economies in Transition of 1990 (EIT90) are more uncertain than those of OECD90 but less so than those from the other remaining non-Annex-I countries. Exceptions to the country grouping are made for Australia, Canada, China, India, Japan, Russia, Ukraine, the United States, and countries belonging to the 15 member countries of the European Union (EU15), whose uncertainty values of fuel consumption data were obtained from Olivier et al. (2016) and Hong et al. (2017). Uncertainty values for CO2 emission factors were retrieved from the European Environment Agency (EEA).
Table S4 in the Supplement shows the corresponding uncertainty of CO2 emissions at both the global and regional levels during 1970–2020 on the basis of Eq. (6). The uncertainty in the global on-road CO2 emissions is estimated to range from −7.2 % to 8.1 %, which is close to the expert judgment suggested value (approximately ±5 %) in GPG (2000). Because sufficient local data were used in the CO2 estimation, the United States and the European Union have the lowest uncertainties in the ranges −3.8 % to 4.0 % and −2.9 % to 3.0 %, respectively. India also has a relatively low uncertainty that varies between −4.7 % and 5.0 % because of the low uncertainty derived from Janssens-Maenhout et al. (2019), in which India is classified as a country with well-developed statistical systems. Due to their less-developed statistical systems, “Latin America + Canada” and the “Middle East + Africa” have the largest uncertainties, which range from −12.3 % to 14.6 % and from −15.4 % to 18.3 %, respectively. Hong et al. (2017) found that the apparent uncertainties in oil consumption statistics in China during 1996–2003 were relatively large, with an average apparent uncertainty ratio of 15.8 % that led to the relatively higher uncertainty in China's on-road CO2 emissions in the range −12.6 % to 14.4 %. It was also found that uncertainties at the regional level decreased over time with the development of statistical systems in more countries. However, uncertainty in global on-road CO2 emissions slightly increased during 1970–2020 due to the growing contribution of regions with higher uncertainty to the global total CO2 emissions.
3.1 Evolution of the global vehicle stock, 1970–2020
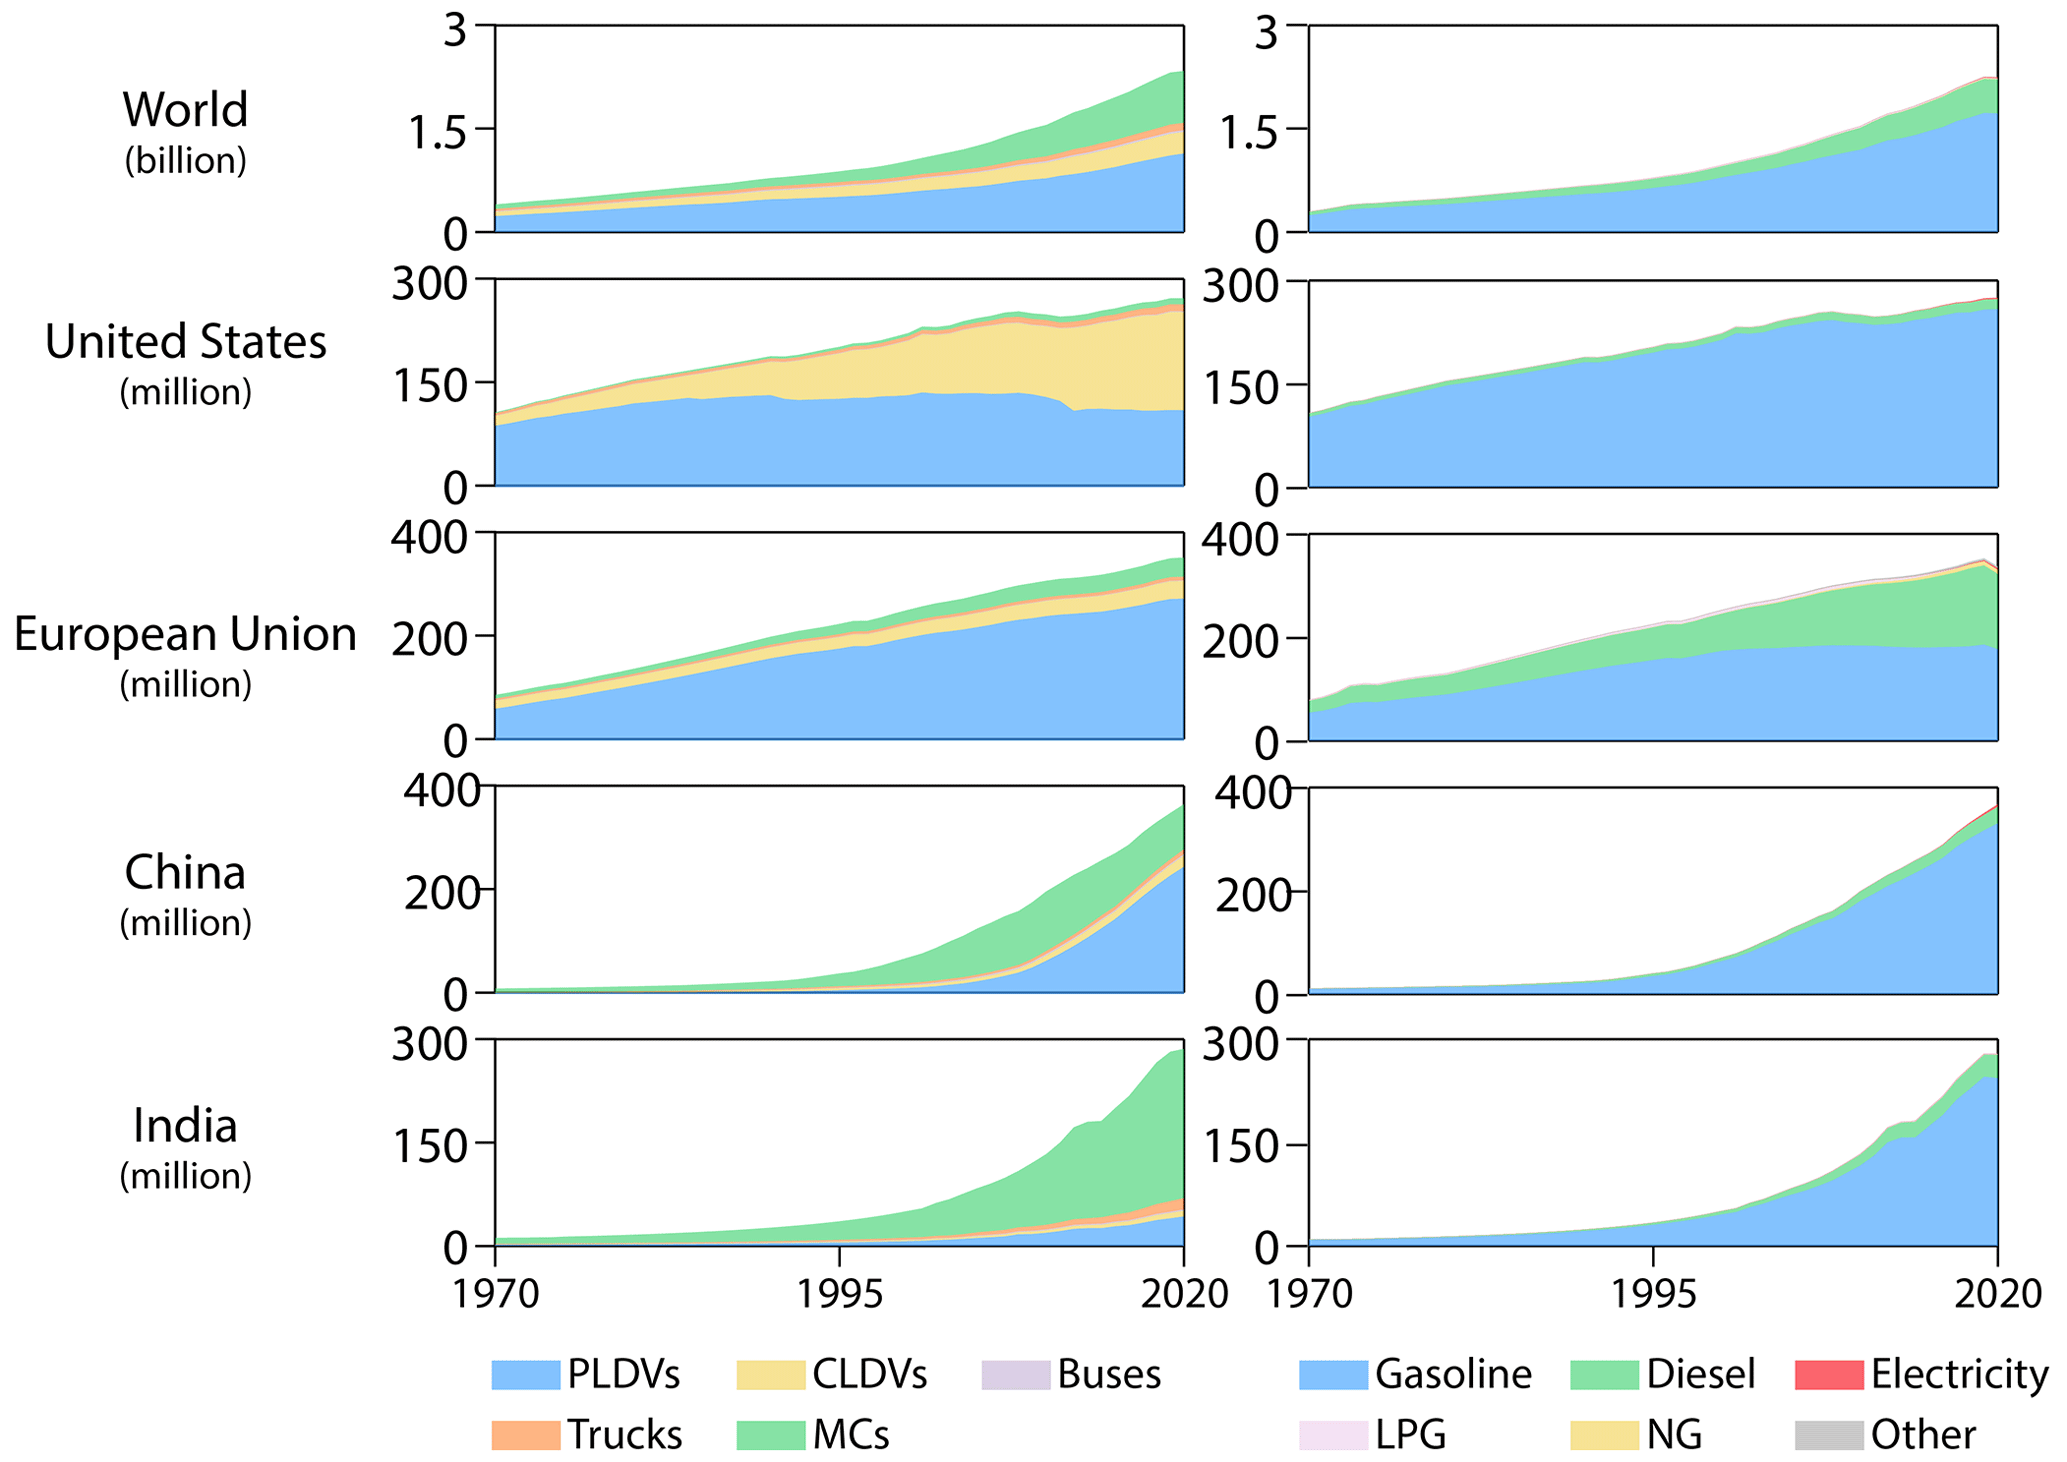
The global vehicle stock continuously increased from 0.3 billion in 1970 to 2.3 billion in 2020, and there is both consistency and variety between countries in terms of the distributions of vehicles and fuel types (Figs. 3 and S7 in the Supplement). In 1970, PLDVs were the major vehicle type in the United States (83 %) and the European Union (88 %) but had relatively low proportions in China (23 %) and India (5 %). The high proportion of PLDVs in the United States and the European Union, as well as the dominant position of these two regions in terms of the global vehicle stock (Fig. S6 in the Supplement), led to more than 70 % of global vehicles being PLDVs in 1970. The proportion of PDLVs in China significantly increased and reached 68 % in 2020, having replaced MCs to become the dominant vehicle type. Although the stock of PLDVs in India also increased substantially during the 1970–2020 period, MCs with a proportion of 78 % of the vehicle stock in 2020 were still the most frequently used vehicles in India, benefiting from the local warm climate. The majority of vehicles in the European Union in 2020 were still PLDVs, for which the proportion was 79 %, but the dominant vehicle type in the United States has changed from PLDVs to CLDVs, and CLDVs accounted for 50 % of the local vehicle stock. As the dominant position of developed countries in global vehicle stock was replaced by developing countries during the 1970–2020 period (Fig. S6), the share of MCs in the global vehicle stock increased accordingly to 32 %, and the proportion of PLDVs decreased to 50 % in 2020.
Unlike the changes in the vehicle-type distribution during the 1970–2020 period, the fuel structure of the vehicle stock was consistent in most regions. Currently, the majority of the vehicle stock worldwide still consists of gasoline and diesel vehicles, which together accounted for 98 % of the global vehicle stock in 2020. Gasoline was the major fuel type for vehicles in most countries from 1970 to 2020, but the dieselization of PLDVs in regions such as the European Union (Fig. S10 in the Supplement) led to a larger proportion of diesel vehicles in the local vehicle stock. For example, the share of diesel vehicles in the European Union increased from 29 % in 1970 to 43 % in 2020. Although the share of electrical vehicles in the vehicle stock was still much lower than that of gasoline and diesel vehicles, the stock of global electrical PLDVs has reached 10.2 million, and in this regard the growth has been the fastest in the last 8 years.

Figure 4Global CO2 emissions from 1970 to 2020 by vehicle and fuel type. The panels are organized by fuel type (rows) and vehicle type (columns).
3.2 CO2 emissions from global on-road vehicles
Global CO2 emissions from on-road vehicles continued to increase overall from 1.7 Gt in 1970 to 5.4 Gt in 2020 (Fig. 4). Profiting from the integrated global vehicle database developed in this study, we further analyzed the vehicle- and fuel-type-specific characteristics of CO2 emissions from global on-road vehicles. On-road CO2 emissions were concentrated in specific vehicle and fuel types throughout the period. From 1970 to 2020, almost all global CO2 emissions from on-road vehicles came from gasoline and diesel vehicles due to their dominant proportion in the vehicle stock (Fig. S10). In 1970, 78 % and 21.5 % of global on-road CO2 emissions were exhausted from gasoline and diesel vehicles, respectively, and in 2020 these emissions together accounted for 96 % of global on-road CO2 emissions; only the ranking of the contributions changed. With continuous dieselization during the 1970–2020 period (Fig. S10), the contribution of diesel vehicles to global on-road CO2 emissions increased to 47 % in 2020. Although CO2 emissions from vehicles using other fuels (here, NG and LPG) continued to grow during the 1970–2020 period, their proportions were still quite slight compared to those of gasoline and diesel vehicles.
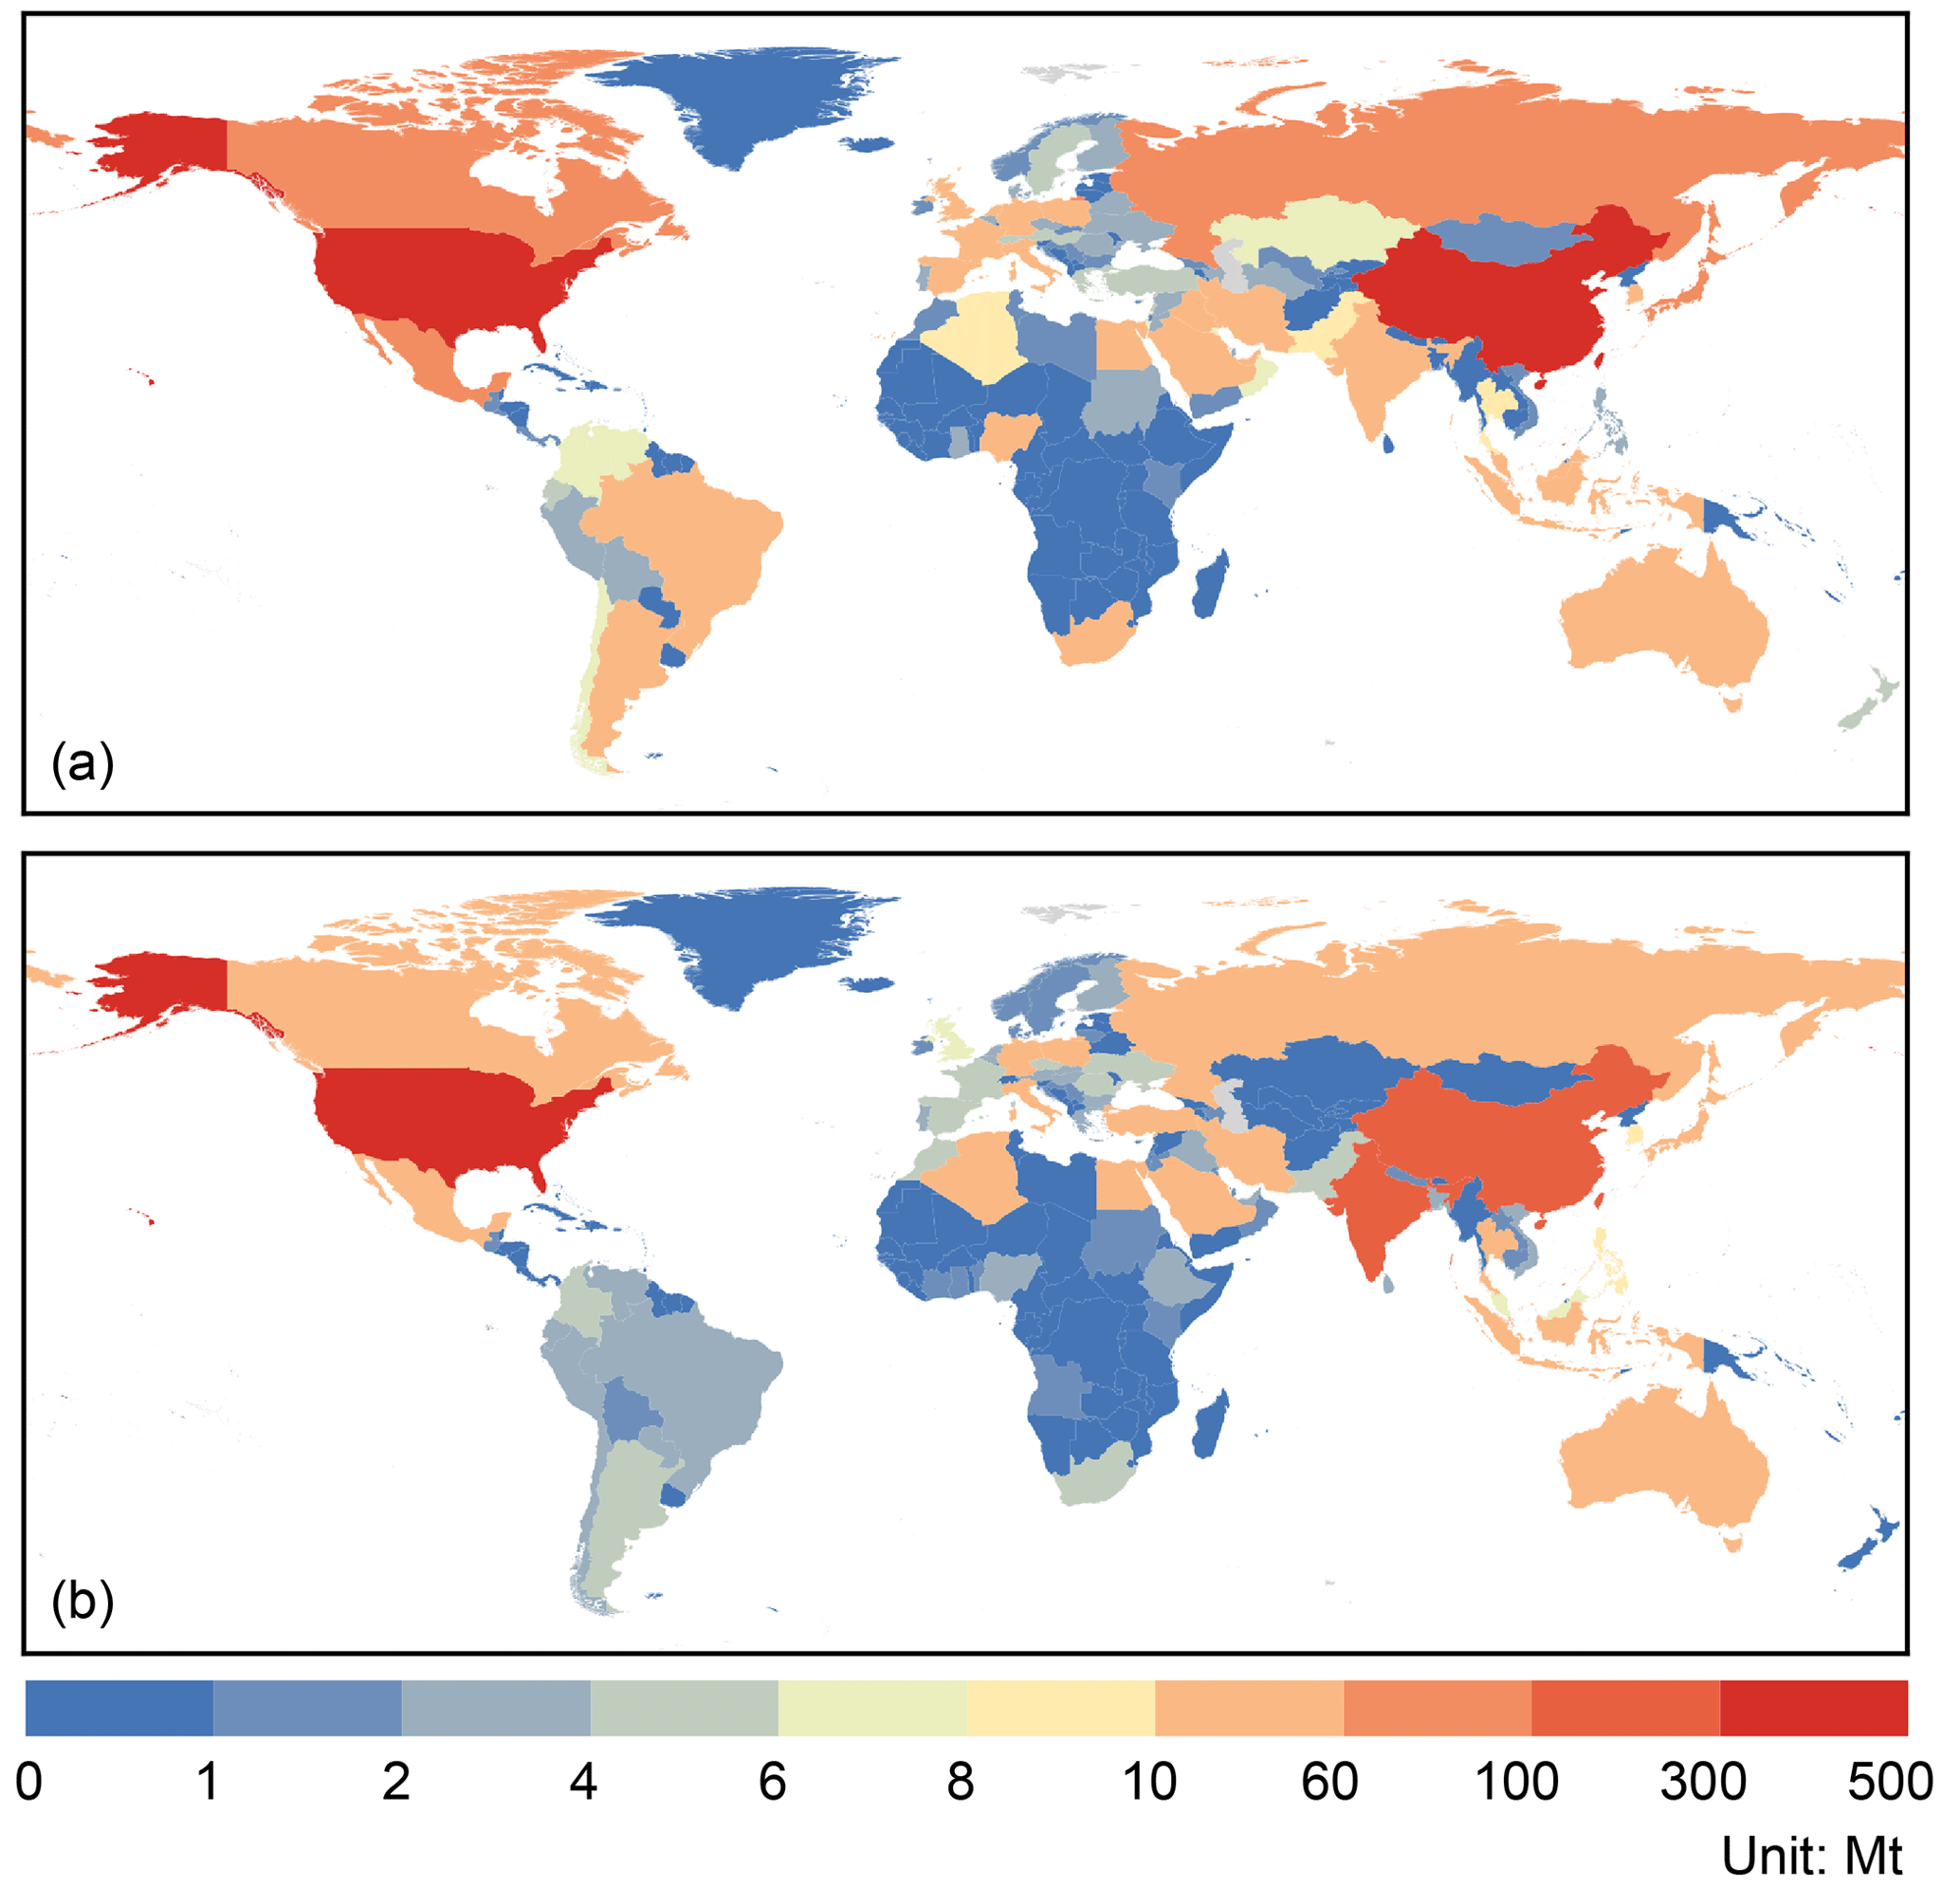
Figure 5Maps of on-road CO2 emissions from the top two contributors worldwide: (a) gasoline PLDVs and (b) diesel trucks.
PLDVs, accounting for the largest share of the global vehicle stock, were also the main source of global on-road CO2 emissions and contributed more than 47 % of global CO2 emissions from on-road vehicles during the 1970–2020 period. Although MCs accounted for the second largest share of the global vehicle stock, CO2 emissions from MCs were not comparable to those from PLDVs. In 2020, the proportions of PLDVs and MCs in the global vehicle stock were 50 % and 32 %, respectively, and their CO2 emissions were 2.6 and 0.3 Gt, respectively, which accounted for 48 % and 5 %, respectively, of global on-road CO2 emissions. In contrast, trucks with a fairly low share of the global vehicle stock contributed the second largest share of global on-road CO2 emissions. During the 1970–2020 period, trucks accounted for less than 5 % of the global vehicle stock but exhausted 17 % of global on-road CO2 emissions in 1970, and their contribution increased to 22 % in 2020. As most PLDVs are gasoline vehicles and the majority of trucks are powered by diesel, gasoline PLDVs and diesel trucks are among the top two vehicle- and fuel-type-specific contributors to global on-road CO2 emissions. In 2020, the CO2 emissions from gasoline PLDVs and diesel trucks were 1.8 and 1.1 Gt, respectively, accounting for 33 % and 20 %, respectively, of global on-road CO2 emissions.

Figure 5 shows the geographical distribution of the two largest contributors to global on-road CO2 emissions in 2020, i.e., gasoline PLDVs and diesel trucks. Global on-road CO2 emissions were highly concentrated in several countries. In 2020, the top 10 countries contributed 69 % and 71 % of global CO2 emissions exhausted from gasoline PLDVs and diesel trucks, respectively. The United States was still the largest contributor to global CO2 emissions from both gasoline PLDVs and diesel trucks, whose contributions were up to 25 % and 28 %, respectively. With the continuous improvement in China's economic development, the country became the leading market for global vehicles in 2020 (Fig. S6) and accounted for 18 % and 19 %, respectively, of CO2 emissions from global gasoline PLDVs and diesel trucks. Although growth in on-road CO2 emissions in developed countries slowed down after 2000 (Fig. S8 in the Supplement), the contributions of gasoline PLDVs and diesel trucks in developed countries were still greater than those in developing countries, especially for gasoline PLDVs. For example, the ownership of gasoline PLDVs in Canada and India was relatively close in 2020, at 22.5 and 21.2 million, respectively, but the CO2 emissions from gasoline PLDVs in Canada were 83.5 Mt, which is 3 times greater than that in India.
We further analyzed the influence of shifts in the fuel-type distribution of vehicle ownership (Fig. S10) on the fuel structure of on-road CO2 emissions (Figs. 6 and S11 in the Supplement). In 1970, CO2 emissions from PLDVs were mainly exhausted from gasoline vehicles, as the majority of PLDVs in most regions were powered by gasoline, and diesel vehicles exhausted only 7 % of CO2 emissions from PLDVs worldwide. In 2020, gasoline vehicles were still the dominant contributor to CO2 emissions from PLDVs in the United States and China, but the contribution of diesel vehicles increased significantly in the European Union and India and accounted for 61 % and 50 %, respectively, of local CO2 emissions from PLDVs. Influenced by the dieselization of PLDVs in regions such as the European Union and India, the contribution of diesel vehicles to CO2 emissions from PLDVs in 2020 also increased to 28 %. For CLDVs, the contribution of diesel vehicles was more than 50 % in the European Union, China, and India, but in the remaining regions CO2 emissions were still mainly from gasoline vehicles. Buses and trucks were also dieselized during the 1970–2020 period, and diesel vehicles have become the dominant contributor to CO2 emissions from buses and trucks, both regionally and globally. Therefore, controlling emissions from diesel vehicles, especially buses and trucks, holds great significance for reducing global on-road CO2 emissions.
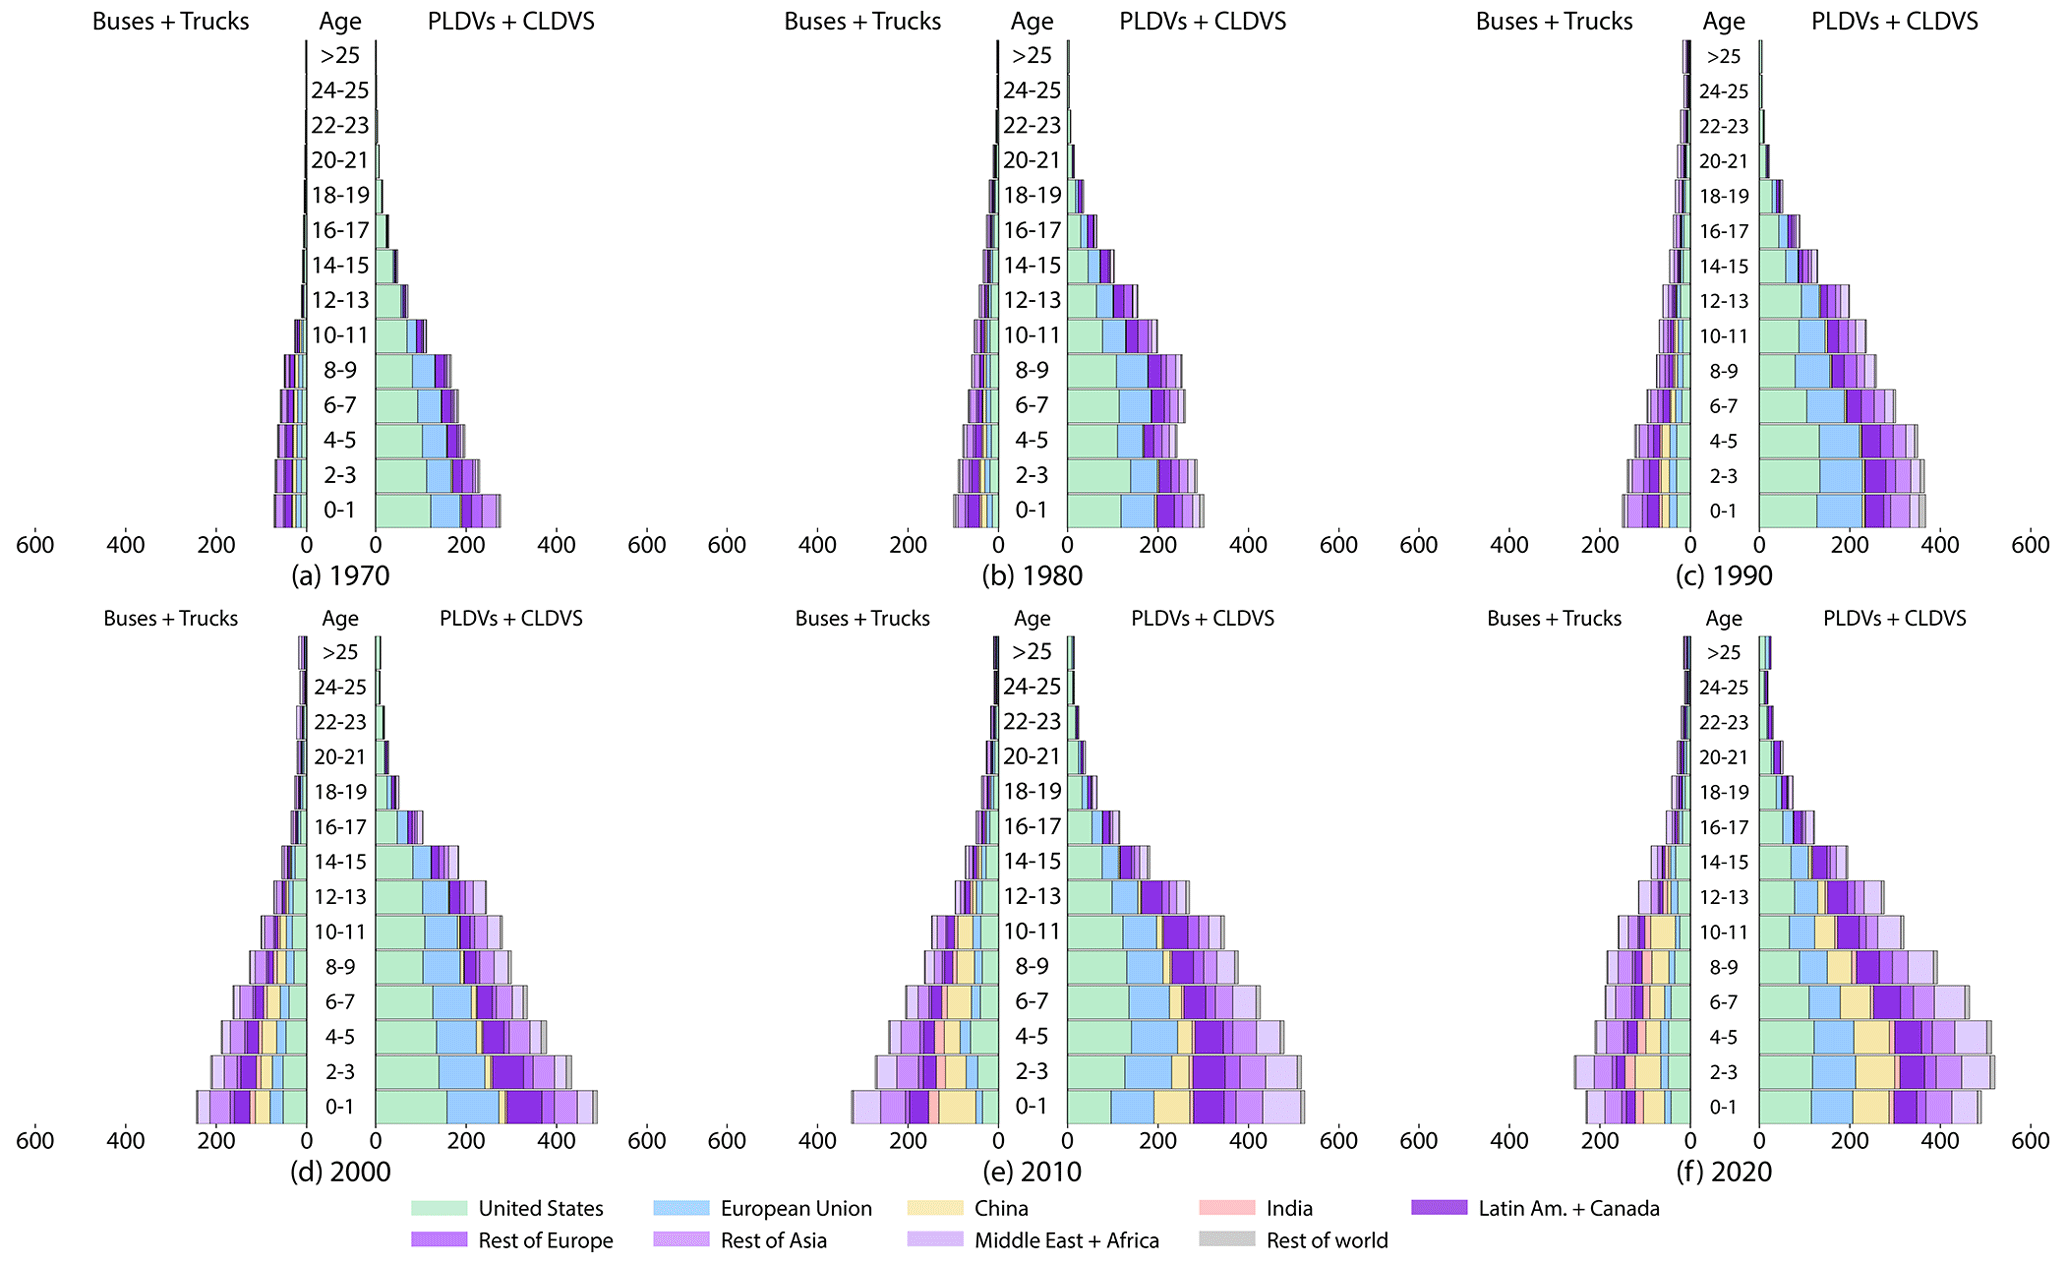
Figure 7Shares of CO2 emissions by vehicle age. In each panel, the bars from left to right show the proportions of the world, the United States (US), the European Union (EU), China, and India, which is accounted for by the vehicles in the vehicle age categories. The panels are organized by year (rows) and vehicle type (columns).
3.3 Age distribution of CO2 emissions
On the basis of the fleet turnover emission model built in this study, the age distribution of global on-road CO2 emissions was estimated and analyzed (Fig. 7). The contribution of old vehicles (those that survived more than 15 years) to CO2 emissions was relatively low, regardless of whether they were light-duty or heavy-duty vehicles. In 1970, old vehicles contributed 4 % and 6 % of CO2 emissions from light-duty and heavy-duty vehicles, respectively. Although the contribution of old vehicles to CO2 emissions increased, they still contributed only approximately 10 % of CO2 emissions from both light-duty and heavy-duty vehicles in 2020. As emissions of air pollutants such as particulate matter (PM) may increase with age because of degradation in engine performance and air pollution control equipment (Yan et al., 2011), the contributions of old vehicles to emissions of air pollutants could be much greater than those of CO2. Therefore, controlling old vehicles may not be significant in mitigating CO2 emissions but could lead to effective air pollutant emission co-reductions.
Global CO2 emissions from vehicles of all ages were mainly contributed by developed countries, such as the United States and countries in the European Union before 2000, as these countries had the majority of global vehicles during that period. After 2000, the contributions of vehicles in developing countries such as China and India to global on-road CO2 emissions increased significantly, especially for CO2 emissions from vehicles younger than 10 years. Taking CO2 emissions from light-duty vehicles aged 0 to 1 year as an example, the proportion of these vehicles in China increased from 1 % in 1970 to 16 % in 2020, while the proportion of these vehicles in the United States decreased from 44 % in 1970 to 23 % in 2020. CO2 emissions from old vehicles in 2020 were still mainly exhausted by vehicles in developed countries such as the United States and in the European Union, which is related to the longer lifetimes and earlier development of vehicles in these countries. For example, old vehicles in the United States contributed nearly half of the CO2 emissions exhausted from old light-duty vehicles worldwide in 2020.
The fuel-, vehicle-type-, and age-specific CO2 emission data presented herein cover the period from 1970 to 2020 at the country level. The data are available as open data at https://doi.org/10.6084/m9.figshare.24548008 (Yan et al., 2024).
Our study constructed a fuel-, vehicle-type-, and age-specific CO2 emission inventory from 1970 to 2020 of global on-road vehicles covering 231 countries, five types of fuel, and five types of vehicles. In this model, the best available statistics on the vehicle stock and sales were used to model the vehicle stock via the Gompertz function as well as the age distribution based on the dynamic balanced relationship between the vehicle stock and vehicle sales. Statistical fuel consumption was used to constrain the estimated vehicular fuel consumption at the country level, and emission factors from both the IPCC and local studies were used to estimate CO2 emissions. On the basis of our CO2 emission inventory with detailed information, the evolution of the global vehicle stock over 50 years was analyzed, the dominant emission contributors by vehicle and fuel type were identified, and the age distribution of on-road CO2 emissions was also characterized. We found that trucks accounted for less than 5 % of global vehicle ownership but represented more than 20 % of on-road CO2 emissions in 2020. The contribution of diesel vehicles to global on-road CO2 emissions doubled during the 1970–2020 period, driven by the shift in the fuel-type distribution of vehicle ownership. The proportion of CO2 emissions from vehicles in developing countries such as China and India in terms of global emissions from newly registered vehicles significantly increased after 2000, but global CO2 emissions from vehicles that survived more than 15 years in 2020 still originated mainly from developed countries such as the United States and countries in the European Union.
The fleet turnover model built in this study could also be used for estimating global on-road emissions of air pollutants, which are more significantly influenced by the vehicle-type distribution, fuel structure, and age distribution of the fleet. However, these fuel-, vehicle-type-, and age-specific characteristics have not yet been discussed in existing studies. In the future, our model could help improve the global emission inventory of air pollutants from on-road vehicles and further support analyses of co-reductions in CO2 and air pollutant emissions from global on-road vehicles as well as the potential air quality and climate co-benefits. In addition to the uncertainty quantification for our CO2 emission data, we further verified the reliability of CO2 emissions in this study by comparing them to those of other widely used global, regional, and national emission inventories in which long-term CO2 emissions are available (Fig. S12 in the Supplement). The CO2 emissions in this study not only exhibited good consistency with other global emission inventories at the global scale but were also more similar to local emissions than those in other global or regional emission inventories at the country and regional levels.
The data related to the figures in this article are available in the Supplement file Figures.zip. The supplement related to this article is available online at: https://doi.org/10.5194/essd-16-4497-2024-supplement.
LY collected the data, developed the fleet turnover model, and constructed the database of fuel-, vehicle-type-, and age-specific CO2 emissions from global on-road vehicles during the 1970–2020 period. LY and QZ discussed the expansion of the database. LY wrote the paper with the help of all the co-authors.
At least one of the (co-)authors is a member of the editorial board of Earth System Science Data. The peer-review process was guided by an independent editor, and the authors also have no other competing interests to declare.
Publisher’s note: Copernicus Publications remains neutral with regard to jurisdictional claims made in the text, published maps, institutional affiliations, or any other geographical representation in this paper. While Copernicus Publications makes every effort to include appropriate place names, the final responsibility lies with the authors.
This research has been supported by the National Natural Science Foundation of China (grant nos. 41921005, 42130708, and 72140003) and the New Cornerstone Science Foundation through the XPLORER PRIZE.
This paper was edited by Jing Wei and reviewed by two anonymous referees.
Amstel, A. V., Olivier, J., and Janssen, L.: Analysis of differences between national inventories and an Emissions Database for Global Atmospheric Research (EDGAR), Environ. Sci. Policy, 2, 275–293, https://doi.org/10.1016/S1462-9011(99)00019-2, 1999.
Bhalla, K., Brauer, M., Burnett, R., Cohen, A. R., Freedman, G., Leach-Kemon, K., Murray, C. J. L., Shahraz, S., and Shotten, M. S.: Transport for Health: The Global Burden of Disease from Motorized Road Transport, Global Road Safety Facility, Institute for Health Metrics and Evaluation, The World Bank, http://documents.worldbank.org/curated/en/984261468327002120/ Transport-for-health-the-global-burden-of-disease-from-motorized-road-transport (last access: 4 January 2024), 2014.
Boden, T. A., Marland, G., and Andres, R. J.: Global, Regional, and National Fossil-Fuel CO2 Emissions, Carbon Dioxide Information Analysis Center, Oak Ridge National Laboratory, U.S. Department of Energy, Oak Ridge, Tenn., USA, https://doi.org/10.3334/CDIAC/00001_V2016, 2016.
Boden, T. A., Marland, G., and Andres, R. J.: Global, Regional, and National Fossil-Fuel CO2 Emissions, Carbon Dioxide Information Analysis Center, Oak Ridge National Laboratory, U.S. Department of Energy, Oak Ridge, Tenn., USA, https://doi.org/10.3334/CDIAC/00001_V2017, 2017.
Bond, T. C.: A technology-based global inventory of black and organic carbon emissions from combustion, J. Geophys. Res., 109, D14203, https://doi.org/10.1029/2003JD003697, 2004.
Bond, T. C., Bhardwaj, E., Dong, R., Jogani, R., Jung, S., Roden, C., Streets, D. G., Trautmann, N. M.: Historical emissions of black and organic carbon aerosol from energy-related combustion, 1850–2000, Global Biogeochem. Cy., 21, GB2018, https://doi.org/10.1029/2006GB002840, 2007.
CEIC: https://insights.ceicdata.com, last access: 4 January 2024.
Crippa, M., Janssens-Maenhout, G., Guizzardi, D., and Galmarini, S.: EU effect: Exporting emission standards for vehicles through the global market economy, J. Environ Manage., 183, 959–971, https://doi.org/10.1016/j.jenvman.2016.09.068, 2016.
Crippa, M., Guizzardi, D., Muntean, M., Schaaf, E., Dentener, F., van Aardenne, J. A., Monni, S., Doering, U., Olivier, J. G. J., Pagliari, V., and Janssens-Maenhout, G.: Gridded emissions of air pollutants for the period 1970–2012 within EDGAR v4.3.2, Earth Syst. Sci. Data, 10, 1987–2013, https://doi.org/10.5194/essd-10-1987-2018, 2018.
Crippa, M., Janssens-Maenhout, G., Guizzardi, D., Van Dingenen, R., and Dentener, F.: Contribution and uncertainty of sectorial and regional emissions to regional and global PM2.5 health impacts, Atmos. Chem. Phys., 19, 5165–5186, https://doi.org/10.5194/acp-19-5165-2019, 2019.
Dargay, J. and Gately, D.: Income's effect on car and vehicle ownership, worldwide: 1960–2015, Transport. Res. Pt. A, 33, 101–138, https://doi.org/10.1016/S0965-8564(98)00026-3, 1999.
Dargay, J., Gately, D., and Sommer, M.: Vehicle Ownership and Income Growth, Worldwide: 1960–2030, Energy J., 28, 143–170, https://doi.org/10.5547/ISSN0195-6574-EJ-VOL28-NO4-7, 2007.
Davis, S. J., S. Lewis, N. S., Shaner, M. R., Aggarwal, S., Arent, D. J., Azevedo, I., Benson, S. M., Bradley, T. H., Brouwer, J., Chiang, Y. M., Clack, C. T. M., Cohen, A., Doig, S. J., Edmonds, J., Fennell, P. S., Field, C. B., Hannegan, B., Hodge, B. M., Hoffert, M. I., Ingersoll, E., Jaramillo, P., Lackner, K. S., Mach, K. J., Mastrandrea, M. D., Ogden, J. M., Peterson, P. F., Sanchez, D. L., Sperling, D., Stagner, J., Trancik, J. E., Yang, C. J., and Caldeira, K.: Net-zero emissions energy systems, Science, 360, 6496, https://doi.org/10.1126/sceince/aas9793, 2018.
European Automobile Manufacturers Association (ACEA): Vehicles in use Europe 2017, https://www.acea.auto/, last access: 4 January 2024.
European Commission (EC): https://ec.europa.eu/, last access: 4 January 2024.
European Environment Agency (EEA): EMEP/EEA air pollutant emission inventory guidebook 2019, https://www.eea.europa.eu/publications/emep-eea-guidebook-2019, last access: 25 September 2024.
GPG: Good Practice Guidance and Uncertainty Management in National Greenhouse Gas Inventories, in: Intergovernmental Panel on Climate Change (IPCC), edited by: Penman J., Kruger D., Galbally I., Hiraishi T., Nyenzi B., Emmanuel S., Buendia L., Hoppaus R., Martinsen T., Meijer J., Miwa K., and Tanabe K., IPCC/OECD/IEA/IGES, Hayama, Japan, https://www.ipcc-nggip.iges.or.jp/public/gp/english/ (last access: 4 February 2024), 2000.
Hoesly, R. M., Smith, S. J., Feng, L., Klimont, Z., Janssens-Maenhout, G., Pitkanen, T., Seibert, J. J., Vu, L., Andres, R. J., Bolt, R. M., Bond, T. C., Dawidowski, L., Kholod, N., Kurokawa, J.-I., Li, M., Liu, L., Lu, Z., Moura, M. C. P., O'Rourke, P. R., and Zhang, Q.: Historical (1750–2014) anthropogenic emissions of reactive gases and aerosols from the Community Emissions Data System (CEDS), Geosci. Model Dev., 11, 369–408, https://doi.org/10.5194/gmd-11-369-2018, 2018.
Höhne, N., Elzen, M. D., Rogelj, J., Metz, B., Fransen, T., Kuramochi, T., Olhoff, A., Alcamo, J., Winkler, H., Fu, S., Schaeffer, M., Schaeffer, R., Peters, G. P., Maxwell, S., and Dubash, N. K.: Emissions: world has four times the work or one-third of the time, Nature, 579, 25–28, https://doi.org/10.1038/d41586-020-00571-x, 2020.
Hong, C., Zhang, Q., He, K., Guan, D., Li, M., Liu, F., and Zheng, B.: Variations of China's emission estimates: response to uncertainties in energy statistics, Atmos. Chem. Phys., 17, 1227–1239, https://doi.org/10.5194/acp-17-1227-2017, 2017.
Huo, H. and Wang, M.: Modeling future vehicle sales and stock in China, Energ. Pol., 43, 17–29, https://doi.org/10.1016/j.enpol.2011.09.063, 2012.
Intergovernmental Panel on Climate Change (IPCC): 2006 IPCC Guidelines for National Greenhouse Gas Inventories, https://www.ipcc-nggip.iges.or.jp/public/2006gl/index.html, last access: 4 January 2024.
International Energy Agency (IEA1): Energy Statistics and Balances of OECD and non-OECD countries, 1960–2020, Paris, 2022, https://www.iea.org/data-and-statistics/data-sets, last access: 25 September 2024.
International Energy Agency (IEA2): Energy Efficiency Statistics 2019 Edition [data set], Paris, 2019, https://www.iea.org/data-and-statistics/data-sets, last access: 25 September 2024.
International Energy Agency (IEA3): Global EV Outlook 2023, https://www.iea.org/reports/global-ev-outlook-2023, last access: 4 January 2024.
International Road Federation (IRF): IRF Wold Road Statistics (WRS) 2021 Edition, IRF [data set], https://worldroadstatistics.org/, last access: 4 January 2024.
Janssens-Maenhout, G., Crippa, M., Guizzardi, D., Muntean, M., Schaaf, E., Dentener, F., Bergamaschi, P., Pagliari, V., Olivier, J. G. J., Peters, J. A. H. W., van Aardenne, J. A., Monni, S., Doering, U., Petrescu, A. M. R., Solazzo, E., and Oreggioni, G. D.: EDGAR v4.3.2 Global Atlas of the three major greenhouse gas emissions for the period 1970–2012, Earth Syst. Sci. Data, 11, 959–1002, https://doi.org/10.5194/essd-11-959-2019, 2019.
Japan Automobile Manufacturers Association (JAMA): https://www.jama.org/, last access: 4 January 2024.
Klimont, Z., Kupiainen, K., Heyes, C., Purohit, P., Cofala, J., Rafaj, P., Borken-Kleefeld, J., and Schöpp, W.: Global anthropogenic emissions of particulate matter including black carbon, Atmos. Chem. Phys., 17, 8681–8723, https://doi.org/10.5194/acp-17-8681-2017, 2017.
Lelieveld, J., Evans, J. S., Fnais, M., Giannadaki, D., and Pozzer, A.: The contribution of outdoor air pollution sources to premature mortality on a global scale, Nature, 525, 367–371, https://doi.org/10.1038/nature15371, 2015.
Marland, G., Brenkert, A., and Olivier, J.: CO2 from fossil fuel burning: A comparison of ORNL and EDGAR estimates of national emissions, Environ. Sci. Policy, 2, 265–274, 1999.
Matthews, H. D. and Caldeira, K.: Stabilizing climate requires near-zero emissions, Geophys. Res. Lett., 35, L04705, https://doi.org/10.1029/2007GL032388, 2008.
Meinshausen, M., Meinshausen, N., Hare, W., Raper, S. C., Frieler, K., Knutti, R., Frame, D. J., and Allen, M. R.: Greenhouse-gas emission targets for limiting global warming to 2 °C, Nature, 458, 1158–1162, https://doi.org/10.1038/nature08017, 2009.
Ministry of Statistics and Programme Implementation (MOSPI): https://mospi.gov.in/, last access: 4 January 2024.
Multi-resolution Emission Inventory model for Climate and air pollution research (MEIC): http://meicmodel.org.cn/, last access: 4 January 2024.
National Bureau of Statistics of China (NBS): https://data.stats.gov.cn/, last access: 4 January 2024.
Oda, T., Maksyutov, S., and Andres, R. J.: The Open-source Data Inventory for Anthropogenic CO2, version 2016 (ODIAC2016): a global monthly fossil fuel CO2 gridded emissions data product for tracer transport simulations and surface flux inversions, Earth Syst. Sci. Data, 10, 87–107, https://doi.org/10.5194/essd-10-87-2018, 2018.
Olivier, J. G. J., Janssens-Maenhout, G., Muntean, M., and Peters, J. A. H. W.: Trends in global CO2 emissions: 2014 report, European Commission – PBL Netherlands Environmental Assessment Agency, The Hague, JRC93171/PBL1490 report, ISBN 978-94-91506-87-1, 2014.
Olivier, J. G. J., Janssens-Maenhout, G., Muntean, M., and Peters, J. A. H. W.: Trends in global CO2 emissions: 2016 Report, no. 2315, PBL Netherlands Environmental Assessment Agency, The Hague, 2016.
Organisation Internationale des Constructeurs d'Auto (OICA): World vehicle in use: 2005–2015, https://www.oica.net/category/vehicles-in-use/, last access: 4 January 2024.
Rogelj, J., Shindell, D., Jiang, K., Fifita, S., Forster, P., Ginzburg, V., Handa, C., Kheshgi, H., Kobayashi, S., Kriegler, E., Mundaca, L., Séférian, R., and Vilariño, M. V.: Mitigation Pathways Compatible with 1.5 °C in the Context of Sustainable Development, in: Global Warming of 1.5 °C, An IPCC Special Report on the impacts of global warming of 1.5 °C above pre-industrial levels and related global greenhouse gas emission pathways, in the context of strengthening the global response to the threat of climate change, sustainable development, and efforts to eradicate poverty, edited by: Masson-Delmotte, V., Zhai, P., Pörtner, H.-O., Roberts, D., Skea, J., Shukla, P. R., Pirani, A., Moufouma-Okia, W., Péan, C., Pidcock, R., Connors, S., Matthews, J. B. R., Chen, Y., Zhou, X., Gomis, M. I., Lonnoy, E., Maycock, T., Tignor, M., and Waterfield, T., Cambridge University Press, Cambridge, UK and New York, NY, USA, 93–174, https://doi.org/10.1017/9781009157940.004, 2018.
Shan, Y., Guan, D., Zheng, H., Ou, J., Li, Y., Meng, J., Mi, Z., Liu, Z., and Zhang, Q.: China CO2 emission accounts 1997–2015, Sci. Data, 5, 170201, https://doi.org/10.1038/sdata.2017.201, 2018.
Shindell, D., Faluvegi, G., Walsh, M., Anenberg, S. C., and Milly, G.: Climate, health, agricultural and economic impacts of tighter vehicle-emission standards, Nat. Clim. Change, 1, 59–66, https://doi.org/10.1038/nclimate1066, 2011.
Silva, R., Adelman, Z., Fry, M. M., and West, J. J.: The impact of individual anthropogenic emissions sectors on the global burden of human mortality due to ambient air pollution, Environ. Health Perspect., 124, 1776–1784, https://doi.org/10.1289/EHP177, 2016.
The International Council on Clean Transportation (ICCT): Global Transportation Roadmap Model Documentation and User Guide, https://theicct.org/event/transportation-roadmap-energy-climate/ (last access 25 September 2024), 2012.
Transport data collection supporting the quantitative analysis of measures relating to transport and climate change (TRACCS): https://traccs.emisia.com/, last access: 4 January 2024.
Transportation Energy Data Book (TEDB): https://tedb.ornl.gov/data, last access: 4 January 2024.
UNdata: http://data.un.org/, last access: 4 January 2024.
Unger, N., Bond, T. C., Wang, J. S., Koch, D. M., Menon, S., Shindell, D. T., Bauer, S.: Attribution of climate forcing to economic sectors, P. Natl. Acad. Sci., 107, 3382–3387, https://doi.org/10.1073/pnas.0906548107, 2010.
Wang, R., Tao, S., Ciais, P., Shen, H. Z., Huang, Y., Chen, H., Shen, G. F., Wang, B., Li, W., Zhang, Y. Y., Lu, Y., Zhu, D., Chen, Y. C., Liu, X. P., Wang, W. T., Wang, X. L., Liu, W. X., Li, B. G., and Piao, S. L.: High-resolution mapping of combustion processes and implications for CO2 emissions, Atmos. Chem. Phys., 13, 5189–5203, https://doi.org/10.5194/acp-13-5189-2013, 2013.
World Bank (WB): https://data.worldbank.org/, last access: 4 January 2024.
World Population Prospects 2022 (WPP): https://population.un.org/wpp/, last access: 4 January 2024.
Yan, F., Winijkul, E., Jung, S., Bond, T. C., and Streets, D. G.: Global emission projections of particulate matter (PM): I. Exhaust emissions from on-road vehicles, Atmos. Environ., 45, 4830–4844, https://doi.org/10.1016/j.atmosenv.2011.06.018, 2011.
Yan, F., Winijkul, E., Bond, T. C., and Streets, D. G.: Global emission projections of particulate matter (PM): II. Uncertainty analyses of on-road vehicle exhaust emissions, Atmos. Environ., 87, 189–199, https://doi.org/10.1016/j.atmosenv.2014.01.045, 2014.
Yan, L., Zhang, Q., and He, K. B.: CO2 emissions from global on-road vehicles by vehicle- and fuel- type for each country during 1970–2020, Figshare [data set], https://doi.org/10.6084/m9.figshare.24548008, 2024.
Zheng, B., Huo, H., Zhang, Q., Yao, Z. L., Wang, X. T., Yang, X. F., Liu, H., and He, K. B.: High-resolution mapping of vehicle emissions in China in 2008, Atmos. Chem. Phys., 14, 9787–9805, https://doi.org/10.5194/acp-14-9787-2014, 2014.