the Creative Commons Attribution 4.0 License.
the Creative Commons Attribution 4.0 License.
 | 28 Aug 2024
Early-life dispersal traits of coastal fishes: an extensive database combining observations and growth models
Marine Di Stefano
David Nerini
Itziar Alvarez
Giandomenico Ardizzone
Patrick Astruch
Gotzon Basterretxea
Aurélie Blanfuné
Denis Bonhomme
Antonio Calò
Ignacio Catalan
Carlo Cattano
Adrien Cheminée
Romain Crec'hriou
Amalia Cuadros
Antonio Di Franco
Carlos Diaz-Gil
Tristan Estaque
Robin Faillettaz
Fabiana C. Félix-Hackradt
José Antonio Garcia-Charton
Paolo Guidetti
Loïc Guilloux
Jean-Georges Harmelin
Mireille Harmelin-Vivien
Manuel Hidalgo
Hilmar Hinz
Jean-Olivier Irisson
Gabriele La Mesa
Laurence Le Diréach
Philippe Lenfant
Enrique Macpherson
Sanja Matić-Skoko
Manon Mercader
Marco Milazzo
Tiffany Monfort
Joan Moranta
Manuel Muntoni
Matteo Murenu
Lucie Nunez
M. Pilar Olivar
Jérémy Pastor
Ángel Pérez-Ruzafa
Serge Planes
Nuria Raventos
Justine Richaume
Elodie Rouanet
Erwan Roussel
Sandrine Ruitton
Ana Sabatés
Thierry Thibaut
Daniele Ventura
Laurent Vigliola
Dario Vrdoljak
Vincent Rossi
Early-life stages play a key role in the dynamics of bipartite life cycle marine fish populations. Difficult to monitor, observations of these stages are often scattered in space and time. While Mediterranean coastlines have often been surveyed, no effort has been made to assemble historical observations. Here we build an exhaustive compilation of dispersal traits for coastal fish species, considering in situ observations and growth models (Di Stefano et al., 2023; https://doi.org/10.17882/91148).
Our database contains over 110 000 entries collected from 1993 to 2021 in various subregions. All observations are harmonized to provide information on dates and geolocations of both spawning and settlement, along with pelagic larval durations. When applicable, missing data and associated confidence intervals are reconstructed from dynamic energy budget theory.
Statistical analyses allow traits’ variability to be revisited and sampling biases to be revealed across taxa, space and time, hence providing recommendations for future studies and sampling. Comparison of observed and modelled entries provides suggestions to improve the feed of observations into models. Overall, this extensive database is a crucial step to investigate how marine fish populations respond to global changes across environmental gradients.
- Article
(2795 KB) - Full-text XML
-
Supplement
(1741 KB) - BibTeX
- EndNote


The pelagic early-life stages of marine organisms with bipartite life cycles are key to understanding spatiotemporal dynamics of marine populations (Dubois et al., 2016), especially for fish species with high site fidelity as adults. These stages have pronounced dispersive abilities and are highly sensitive to environmental factors, leading to potentially high mortality rates, ultimately influencing juveniles’ replenishment (Gaines et al., 2007; Hidalgo et al., 2019). For benthic or demersal coastal fish, early life is decomposed into different stages for which many different classifications and names exist due to their complexity. They are generally based on ontogenic characters, age and size and sometimes differ from one species to another, as summarized by Vigliola and Harmelin-Vivien (2001). Building upon comprehensive classifications of Kendall et al. (1984) and Catalan et al. (2014), here we use a simplified life cycle based on sizes and generalized wording in the following. Gametes are first released during spawning events, and eggs are fertilized almost immediately, marking the start of the dispersive phase. They then hatch into larvae, drifting and eventually swimming toward coastal areas, and individuals become settlers as soon as they settle in nurseries, considered here the end of the early-life dispersive phase. After settlement, juvenile fish grow in nurseries generally until maturity, when they recruit into adult populations (these parts of the life cycle are not considered here).
Studying these early-life stages requires a good knowledge of when and where propagules (eggs and larvae) are released into the water column during spawning (Di Stefano et al., 2022), of their dispersal routes (Legrand et al., 2019), and of conditions faced during this dispersive phase (Torrado et al., 2021). Indeed, as small organisms, the development, growth and survival of eggs and larvae are highly impacted by abiotic factors such as changes in temperature or oxygen but also by other biotic pressures such as predation or food availability (Pineda et al., 2007). Ocean currents also influence dispersal trajectories, affecting potential preys and conditions encountered along their drift, as well as the settlement success in nurseries (White et al., 2019). Thus, the population connectivity of bipartite life cycle fish species is mainly driven by early-life stages, especially for relatively sedentary species (Gaines et al., 2007). However, the difficulty of monitoring these stages in situ (costly, time-consuming) leads to a paucity of observations, scattered in space and time. It thus limits our understanding of the control they exert on population dynamics, especially over long timescales and when considering the tremendous variability of oceanographic processes (Bates et al., 2018).
Nevertheless, many coastlines, such as in the Mediterranean Sea, have often been studied over several decades with independent research projects carried out in various sub-regions (Harmelin-Vivien et al., 1995; Olivar et al., 2014). Exploited for centuries (Tsikliras et al., 2015) and recognized as a climate change hotspot (Lionello and Scarascia, 2018; Soto-Navarro et al., 2020), the Mediterranean Sea and its coastlines are biodiversity hubs (Myers et al., 2000; Coll et al., 2010) and are well suited to addressing the role of anthropogenic pressures and climate change in marine populations (Lejeusne et al., 2010; Matić-Skoko et al., 2020). For instance, Bianchi and Morri (2003) report increasing occurrences of warm-water species, and Marbà et al. (2015) review the warming-induced impacts on the survival and phenology of Mediterranean biota. However, ecological studies with long-term and broad-scale perspectives are limited, especially because observations are rarely pooled together, even when performed with similar sampling methods (e.g. Faillettaz et al., 2020).
Inspired by review studies on fish biological traits, such as spawning periods based on gonadosomatic index (Tsikliras et al., 2010) or pelagic larval durations (PLDs) based on otolithometry (Macpherson and Raventos, 2006), as well as comparative studies of different sampling methods (e.g. Catalan et al., 2014), our goal here is to build an extensive compilation of historical data of early-life traits from multiple sources. We focus on the Mediterranean basin to benefit from relatively high data availability while addressing knowledge gaps both in fish phenological traits (Daskalaki et al., 2022) and in early-life stage connectivity (Hidalgo et al., 2017). As such, we aim to gather the numerous published and unpublished data on Mediterranean marine coastal fish species (benthic and demersal) to provide the most comprehensive information to date on their traits. To do so, one original aspect of this work is to use growth models from dynamic energy budget (DEB) theory (Marques et al., 2018; Kooijman et al., 2020), which allows us to enrich observations with modelled estimates in a coherent and robust manner. Such a database helps to provide evidence and interpret ongoing changes of fish population dynamics, linked to climate change and anthropogenic threats occurring in the Mediterranean Sea.
In this study, we pool data collected over several decades with various standardized methods in multiple studies (including both direct observations and indirect methods or models) and harmonize them into a uniform dataset of dates and locations of both spawning and settlement, as well as of PLDs. When possible, missing information has been reconstructed based on the online Add-My-Pet database (AmP; Kooijman, 2009). In its present state, the database also encompasses several taxa, including some patrimonial and exploited coastal fish species, and provides measures of uncertainties and sampling characteristics. Statistical analyses of this consolidated database allow us to describe overall taxonomic and spatiotemporal coverage and evaluate potential sampling gaps. We finally discuss our original approach and suggest future research directions for both modelling and observational perspectives, including connectivity or trait-ecology studies at climatic and basin scales that this database should promote.
2.1 Database construction
2.1.1 Compilation procedure
The screening of studies focusing on early-life stages of coastal fish species was conducted in November 2021. A PRISMA flow diagram summarizes all different steps (see Fig. S1). For this compilation, we gather 44 datasets sampled in the north-western and central Mediterranean Sea (including the Adriatic Sea), shared by 51 data providers (see authors of the current article and Table S1). Data are collected along Spanish, French, Italian, Croatian and Montenegrin coastlines. The database covers a period from 1993 to 2021, spanning 29 years of observations. Entries implemented in this database are obtained by diverse standardized sampling methods (direct and indirect measures of early-life traits), depending on studies' aim: otoliths' data extracted from individuals collected by hand nets; datasets of settlers and juveniles sampled by underwater visual census (UVC), shore seines and light traps; and fish eggs and larvae sampled with plankton nets. Each of these techniques is standardized, peer-reviewed and widely accepted by the scientific community (see “Material and methods” of the cited papers). The actual database represents entries characterized by sampling information, taxa, early-life dates and locations. Each row of the database is called an entry and may involve multiple individuals at a specific stage (i.e. eggs, larvae, settlers or juveniles). Each column is called a variable.
2.1.2 Harmonization procedure
The spawning date is defined as the exact day when eggs are released by adults in open water (Kendall et al., 1984). As some sampling methods sampled just-hatched larvae, their spatiotemporal information is also considered linked to spawning when length is not available. The review of Pauly and Pullin (1988) records a mean of 2 d and a maximum of 5 d between spawning and hatching for Mediterranean fish species, which is acceptable given the range of uncertainty taken into account in the rest of the study (see Sect. 2.2). The settlement date is defined as the transition between the larval pelagic stage and the juvenile coastal stage (Kendall et al., 1984; Vigliola and Harmelin-Vivien, 2001) and is known to occur at a rather stable length for each Mediterranean coastal fish species (Raventos et al., 2021). The PLD is defined as the time of pelagic dispersal between these two events (spawning and settlement).
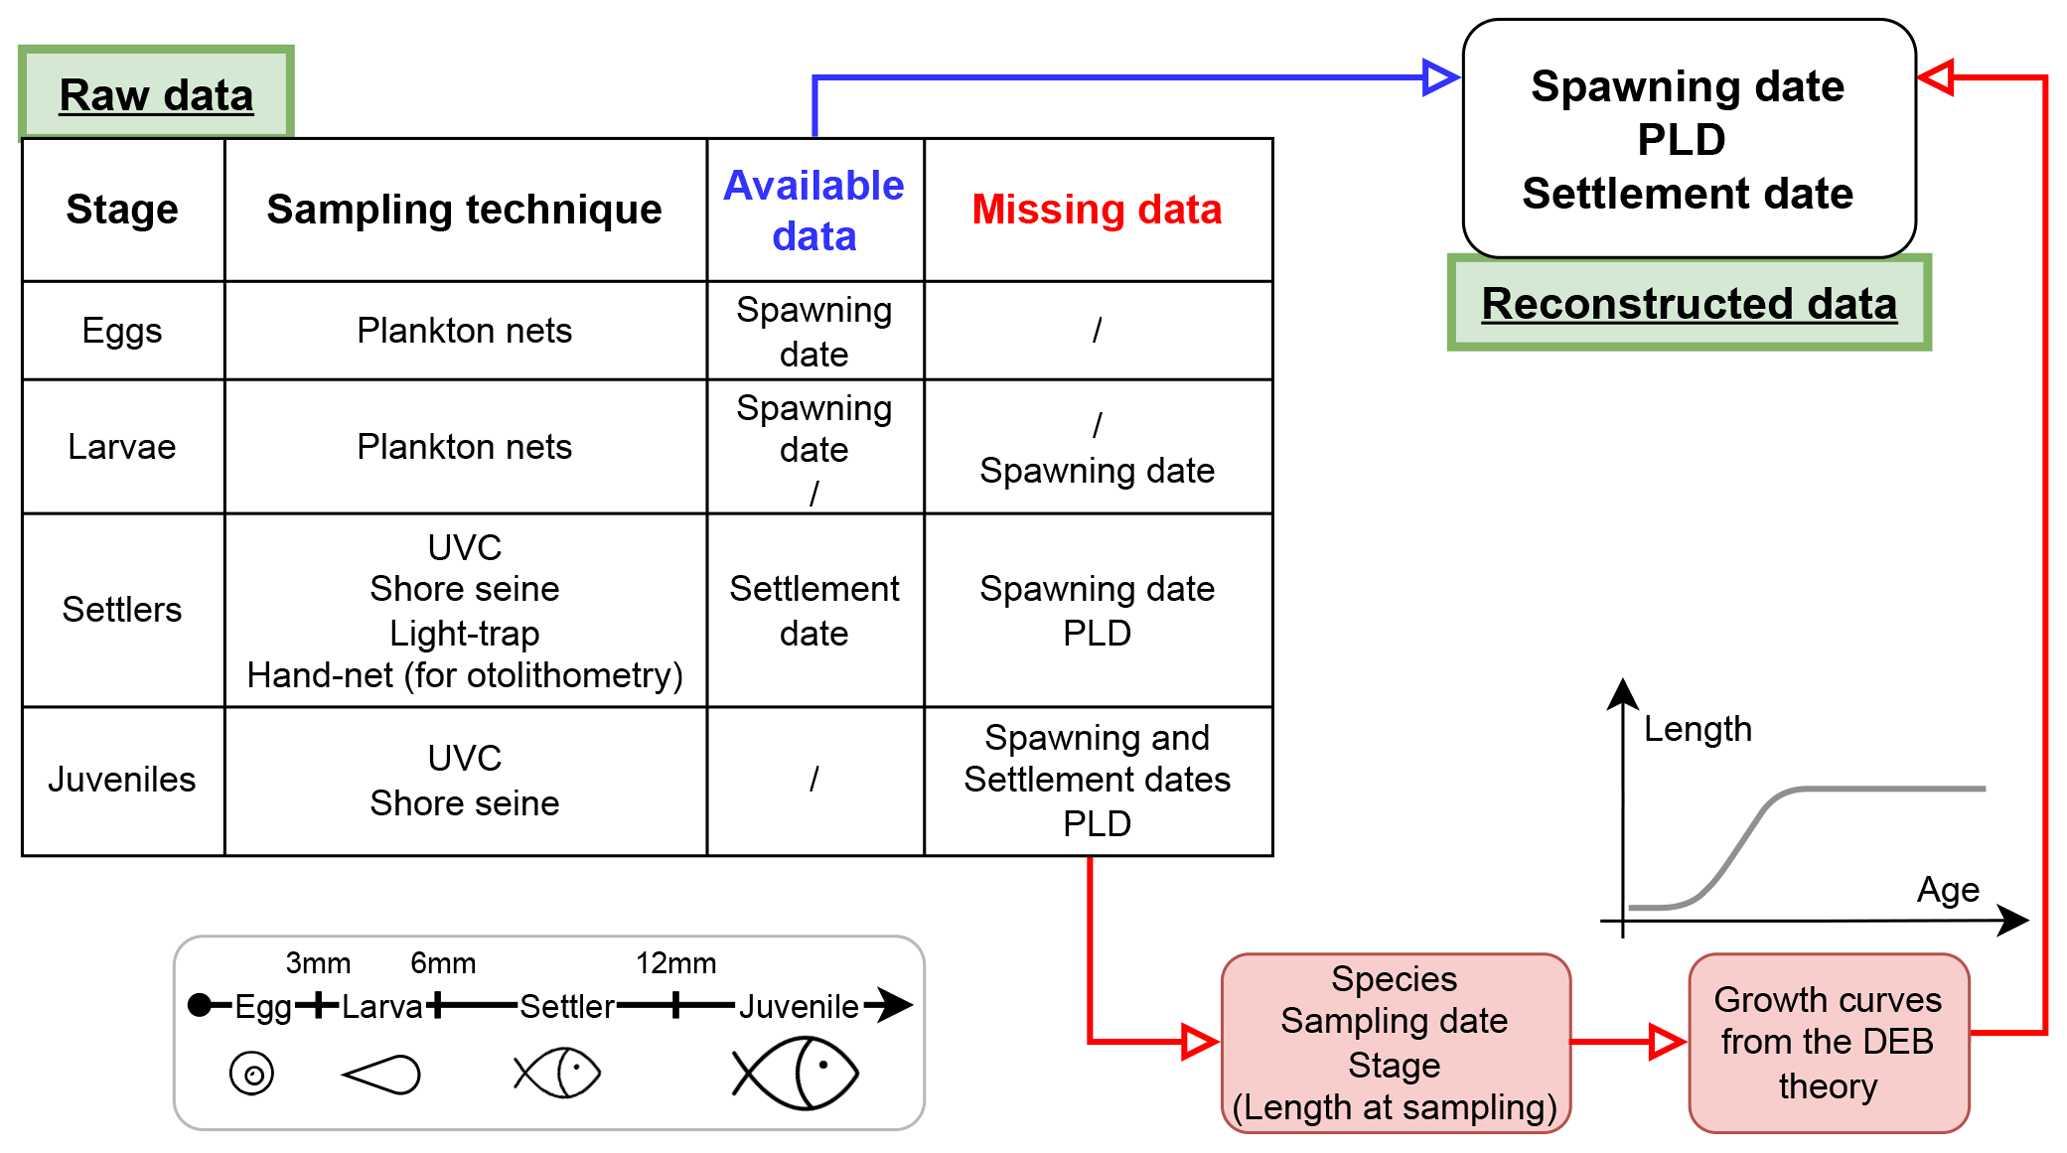
Figure 1Workflow applied to each entry of the database, as a function of stage, sampling technique and available information (e.g. date of spawning or settlement, available or missing) to obtain the database. The length category associated with each stage is also displayed.
Some sampling techniques directly provide the required information on both events, whereas other methods required data processing (Fig. 1). In fact, samples gathered in this database are not necessarily caught during studied phenological events but sometimes right after (methodology described in Sect. 2.2). For instance, otolithometry provides information on both spawning and settlement dates (Di Franco and Guidetti, 2011; Cattano et al., 2017), whereas the UVC method only provides the sampling date of juveniles (Cuadros et al., 2017; Mercader et al., 2019). In this latter case, both spawning and settlement dates have been determined using a DEB-model-based approach (see Sect. 2.2).
Dates of spawning and settlement are recorded as SpawningDate_mean and SettlementDate_mean variables (see Sect. 2.2 for further information on averages). SpawningDetermination and SettlementDetermination variables explain how these dates are determined (reconstruction, sampling date or otolithometry). The pelagic larval duration (PLD_mean variable) is computed as the number of days between these two dates (Green et al., 2009). Along with the mean phenological information, the standard deviation of each entry is stated as SpawningDate_std, SettlementDate_std and PLD_std variables, in days (see Sect. 2.2 for further information on standard deviation).
Spatial information is recorded in the database as Latitude and Longitude variables, in decimal degrees. Thus, these coordinates are associated with a specific event, spawning or settlement, in the CoordinatesType variable, depending on the stage of the individual and on the sampling method. For methods giving information on eggs and just-hatched larvae (e.g. bongo net), the sampling location has been used as a proxy for the spawning location. For juvenile datasets, we assume that juveniles live in the same area as settlers in nurseries, so the sampling location relates to the settlement location.
Other general sampling variables are implemented if available (see Table S2 and metadata of the database in SEANOE). The main information used in the following sections is the SamplingDate variable along with the SamplingLength variable when available, standing for the total length of individuals in millimetres, but also the Stage variable and, necessarily, the taxon (Family, Genus and Species variables). However, as the sampling design changes between entries, specific sampling information might sometimes be missing for some entries and is replaced by NA (not available).
2.2 Reconstruction of missing data
One unique feature of this database is the compilation and harmonization of data collected with different sampling methods. Some allow direct access to dates of spawning and/or settlement. Others do not allow the timing of both events to be estimated. A process commonly used to indirectly estimate these missing dates based on species-dependent growth models (or age–length curves) is back-calculation modelling. In this study, species-specific growth models based on DEB theory (Kooijman et al., 2020; Kooijman, 2009) are used to estimate missing spawning and/or settlement dates. These growth models are freely available on the Add-my-Pet database (AmP; already used to study fish; see van der Meer and Kooijman, 2014), which compiles metabolic and energetic information on a large number of animal species.
2.2.1 DEB theory and models
DEB theory applies for the study of age–length growth of a large variety of organisms as it uses models describing metabolic processes by exploiting conservation law for energy and mass (Agüera et al., 2017). It is thus adaptable to any homeostatic system exchanging flows of energy and mass between inside and outside, at the individual level (Kooijman, 2010). DEB theory is not only based on data to build models but also on the general shape of species and on the resultant information on exchanges of the organism with environment. Thus, it makes this theory highly stable regardless of input data, which validates and substantiates our choice of DEB models to describe individual-specific growth (Marques et al., 2018). These models also integrate the effect of environment on organisms by considering food intake or ambient temperature when evaluating model parameters (Kooijman, 2010). It helps to provide a realistic physiological basis of growth dynamics modulated by environmental variability all along their life cycle (Marques et al., 2018).
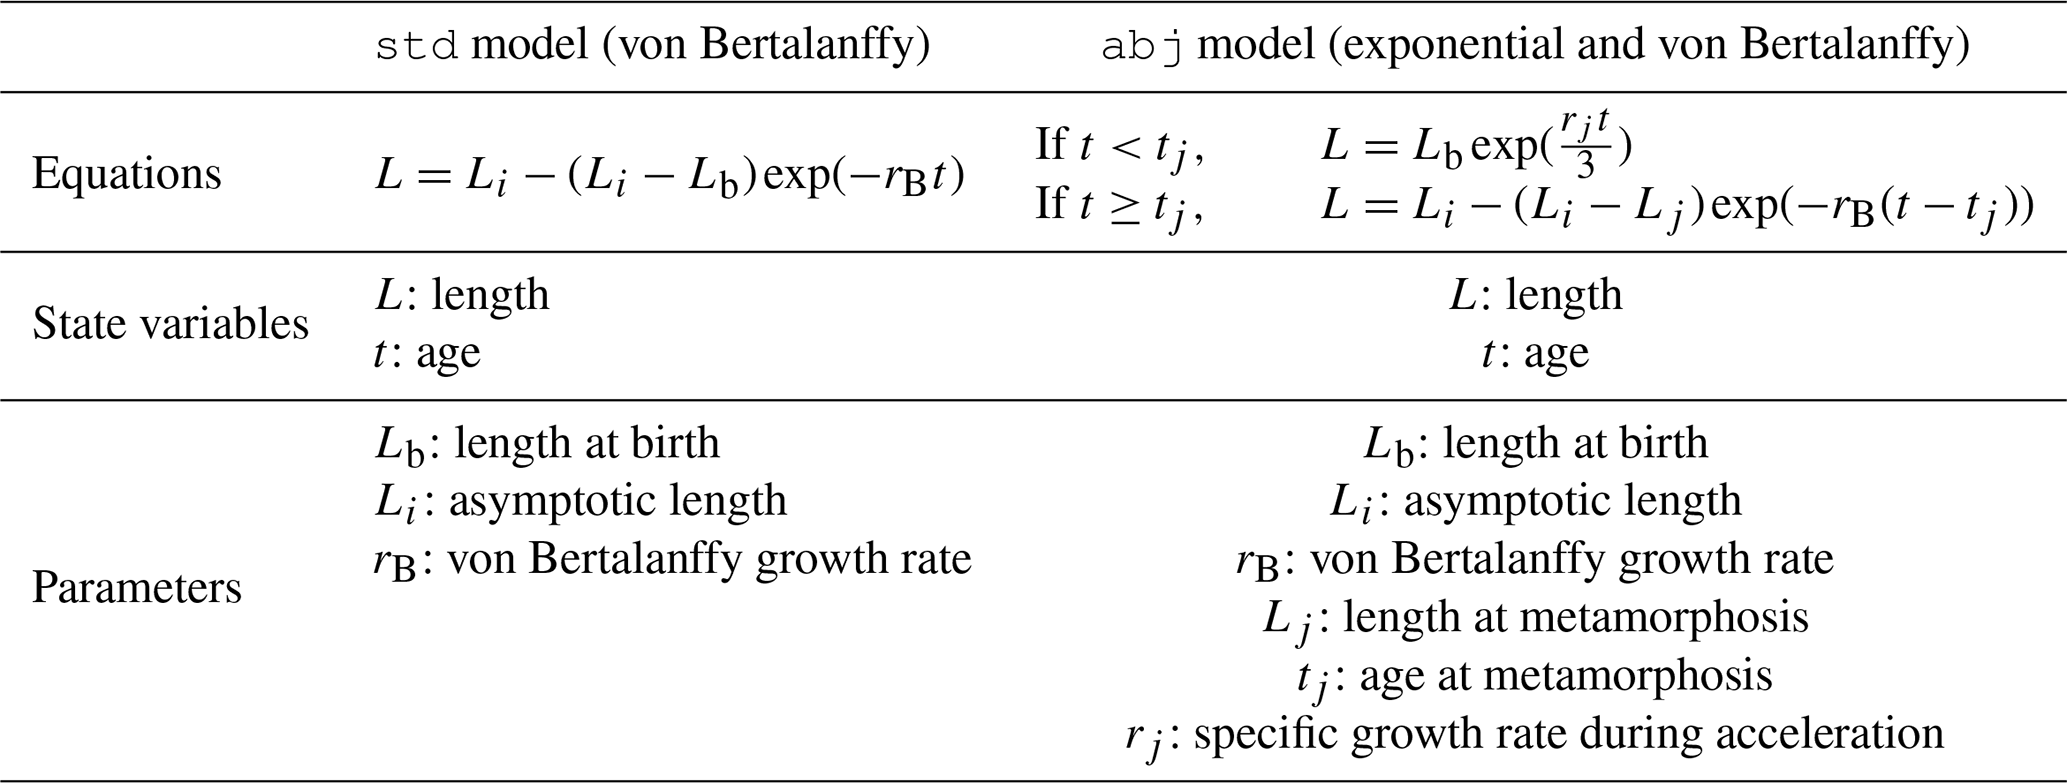
In this theory, different growth models are described according to different life stages. Their classification is based on the type of metabolic acceleration, to better fit with species life cycle. The common DEB growth model denoted as the std model is based on the von Bertalanffy growth curve (Table 1). It is supposed to apply to species without prominent larval phases and morphological metamorphosis. The AmP database only proposes this model for a few fish species (Chelon labrosus; Chelon ramada; Chelon saliens; Gobius niger; Gobius paganellus; Macroramphosus scolopax; Scomberesox saurus; Zeus faber; and also Mugil liza, Mugil cephalus and Mugil curema species used for the genus-based reconstruction of Mugil sp.). The DEB growth model used for all other species is adapted to a bipartite life cycle (Table 1; Kooijman, 2010). Denoted as the abj model, the latter splits the growth curve in two parts. The first part describes exponential growth of the larval phase (metabolic acceleration) finishing at morphological metamorphosis. The second part is a von Bertalanffy growth curve.
While the growth models advised by DEB theory (std or abj) are used here, it is worth noting that the original von Bertalanffy growth model (basis of the std model, excluding tj; von Bertalanffy, 1938) has been largely questioned in fisheries science as it obviously lacks biological realism in excluding early-life stages (Vasbinder and Ainsworth, 2020). The abj model is indeed built upon a modified von Bertalanffy growth curve (including tj; Beverton and Holt, 1957), while adding an exponential curve to best describe larval growth (Vasbinder and Ainsworth, 2020).
Table 1Growth models used for the reconstruction of missing PLDs and spawning and settlement dates. Length is in millimetres (mm), age in days (d) and growth rate per day (d−1) (Kooijman, 2010). Except Lb directly extracted from AmP, all parameter values are susceptible to change with food and temperature conditions.
2.2.2 Reconstruction process
The reconstruction process can involve PLD, spawning date Db and settlement date Dsettl. Four different stages are considered in the organisms' early lifetime. Their specific length ranges are adapted from the generalized life cycle of littoral demersal Mediterranean fish species suggested by Catalan et al. (2014): (1) eggs and just-hatched larvae (<3 mm), (2) larvae (3–6 mm), (3) settlers (6–12 mm), and (4) juveniles (>12 mm). These size ranges determine which trait can be estimated (see Fig. S2). Note that, strictly speaking, hatch differs from birth. Hatch is the event when larvae free themselves from the egg membrane; birth generally refers to the time when larvae start feeding, as in some cases the mouth needs slightly more time to open. During this short time interval (spanning a few hours to a few days for slow-development species), development relies on the yolk sac, whose energy is a function of the mother’s investment into reproduction (Kooijman, 2010). Here, we disregard the distinction between hatch and birth and the associated duration by assuming that hatching is the beginning of fish early-life stages.
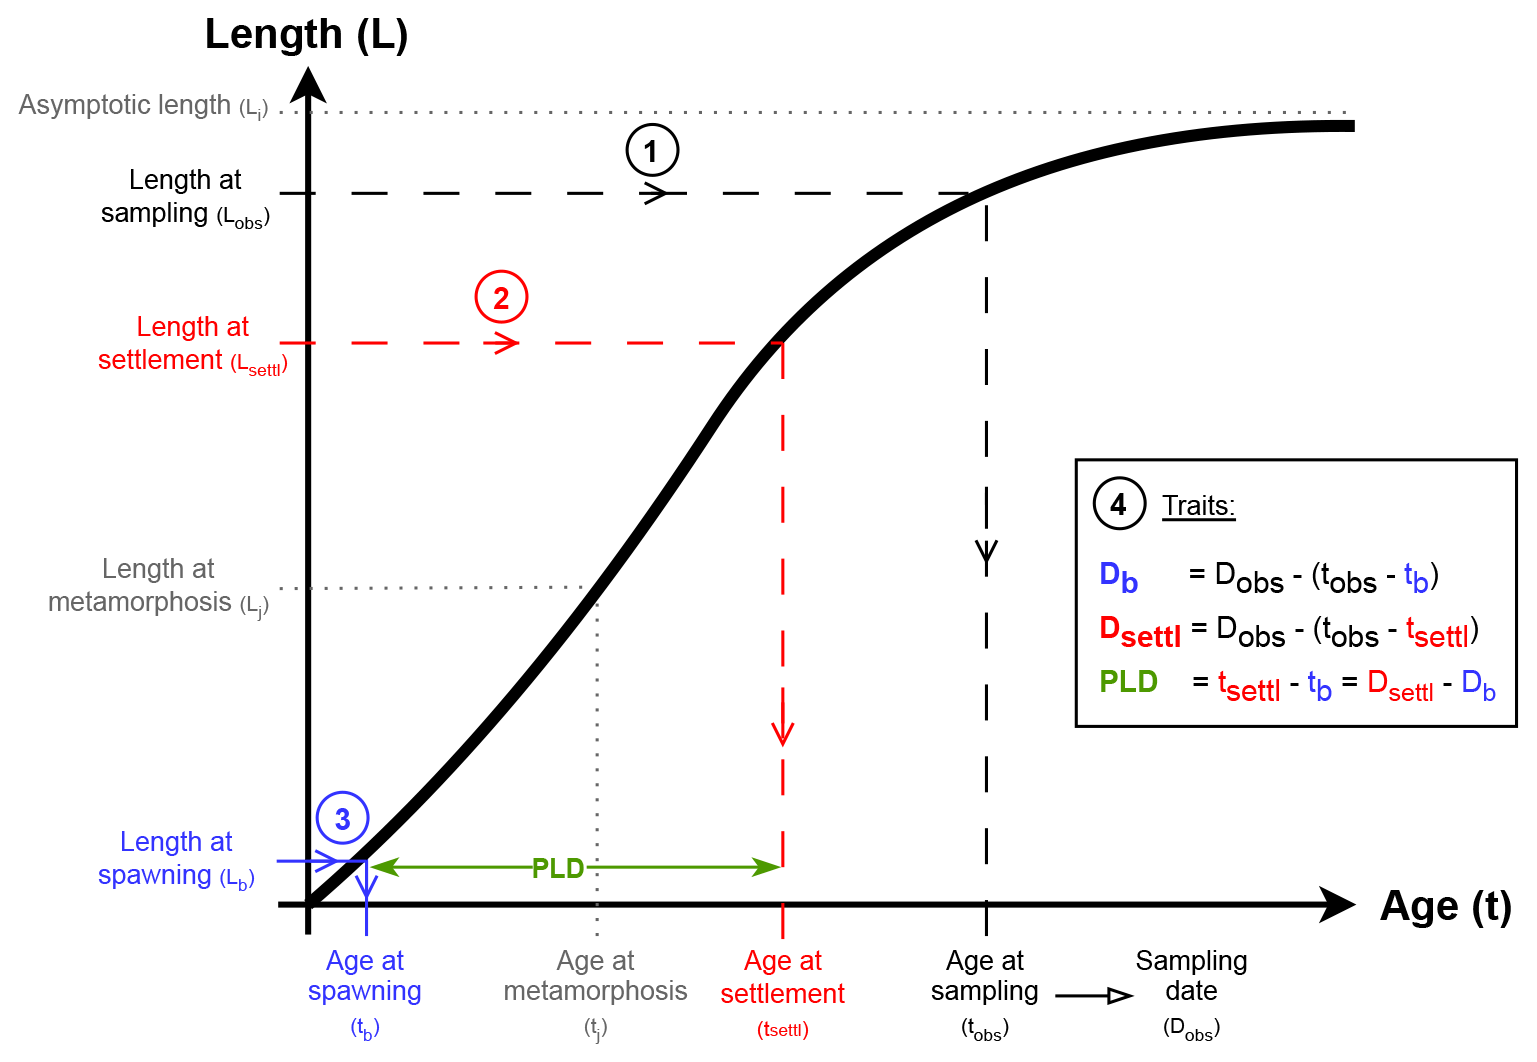
Figure 2Summary of the reconstruction process for one exemplary species-specific growth curve (black thick line). Except Lb directly extracted from AmP, all parameters are food-dependent (f) and temperature-dependent (T). Circled numbers represent the successive steps of the reconstruction. Blue is associated with spawning, red with settlement, green with PLD and black with sampling. Grey annotations and parameters (Lj, Li, tj) do not intervene in the reconstruction (see also Table 1).
Consider an age–length growth curve of a given fish species with known parameters (Table 1 and black curve on Fig. 2). Consider now a length at sampling Lobs of that fish species at sampling date Dobs, in so that spawning date Db, settlement date Dsettl and PLD can be estimated. Using the reciprocal growth model with the Lobs entry, we get the age at sampling tobs (step 1 in Fig. 2). In the same way, the age at settlement tsettl and the age at spawning tb are deduced respectively from the length at settlement Lsettl (step 2 in Fig. 2) and the length at spawning Lb (step 3 in Fig. 2). Finally, PLD, spawning date Db and settlement date Dsettl are estimated using equations in Fig. 2 (step 4, ; and ). When Lobs≥Li, the estimation process is not reliable, and PLD and spawning and settlement dates are set to NA values in the database.
Sources of variability in previous estimates are twofold. First, regardless of the DEB model used in Table 1, parameters that control growth curve shape are indeed dependent on environmental factors encountered by organisms throughout their lifetime. As specified by Kooijman (2009) and Kooijman (2010), DEB growth model parameters vary with temperature (T) and food ingestion capability (f). Details for computation of length and growth parameters are given in AmP codes (Kooijman, 2009, 2010). Finally, length at settlement Lsettl is the second source of variability since its value changes between individuals.
It is possible to include these different sources of variability in the estimation process when taking some values for T, f and Lsettl that range in realistic intervals. It is admitted that annual variations of Mediterranean seawater temperature range from 15 to 25 °C (Garcia-Monteiro et al., 2022). According to Kooijman (2010), food ingestion capability f is a quantity lying between 0 (absence of food) and 1 (food ad libitum). A rather favourable range of was selected arbitrarily, since collected individuals have survived their early-life stages. Indeed, lower values of food would have reflected that individuals could have died during dispersal. Finally, Catalan et al. (2014) suggest that length at settlement ranges from 6 to 12 mm for most littoral demersal Mediterranean fish species. However, some genera like Atherina sp., Lipophrys sp. and Hippocampus sp. present length at birth Lb (i.e. length at hatching) higher than 6 mm in AmP parameters. In this case, a choice is made to randomly pick length at settlement Lsettl between 12 and 30 mm.
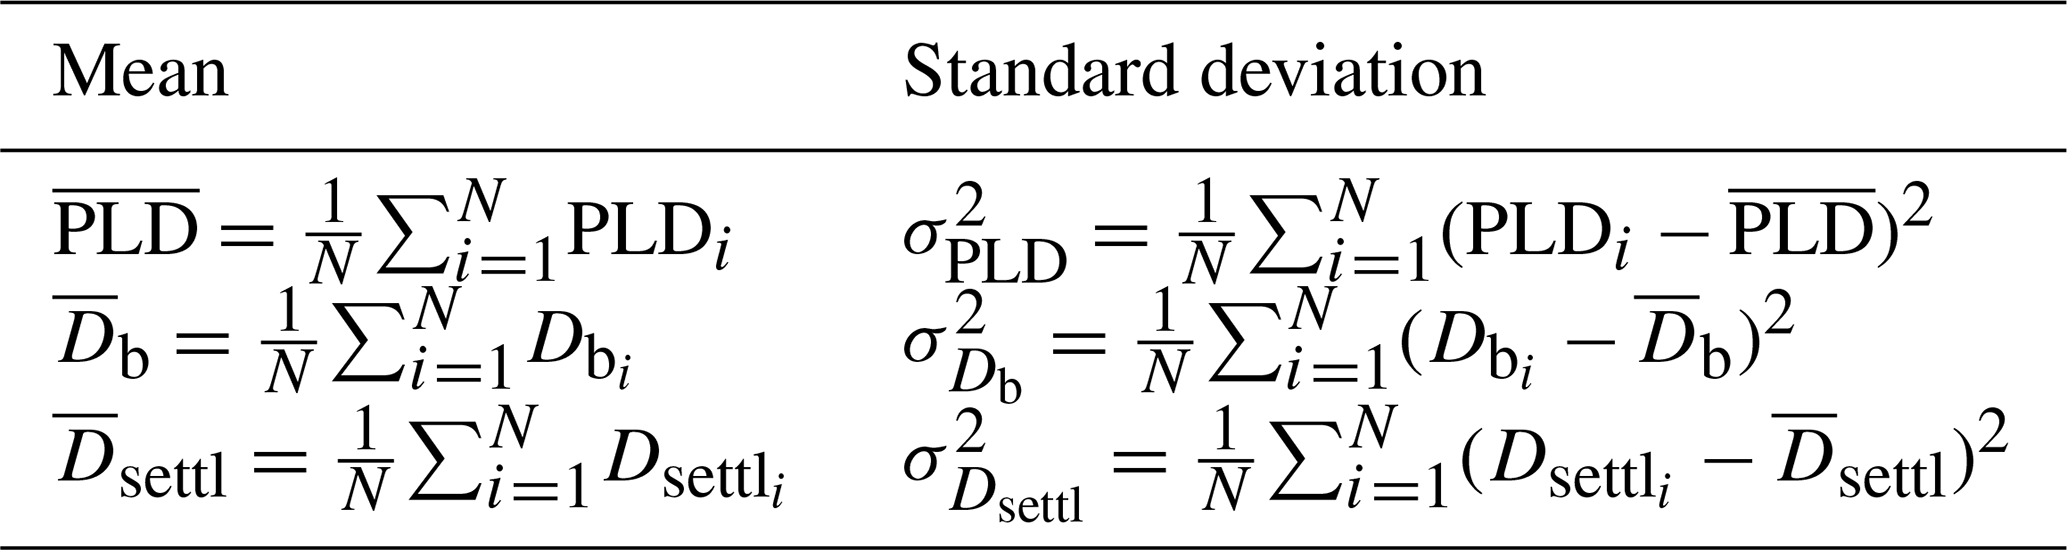
For each entry, the reconstruction process described in Fig. 2 is reiterated 50 times (see Fig. S6) using values of T, f and Lsettl uniformly drawn from their respective range. Estimations of PLD, spawning date Db and settlement date Dsettl are then taken as the mean value of these 50 estimations (Table 2). Empirical standard deviations (Table 2) are also computed (recorded as SpawningDate_mean and SpawningDate_std, PLD_mean and PLD_std, and SettlementDate_mean and SettlementDate_std in the database; see Fig. S7 for the range of PLD variability).
Table 2Equations of means and associated standard deviations of PLD, spawning date Db and settlement date Dsettl for N=50 reconstructions, where environmental conditions are randomly drawn from , and (or ).
A total of 55 fish species are reconstructed based on the list of species available in AmP (see Table S4), using the parameters extracted from the AmP portal on the 11 July 2022 (https://www.bio.vu.nl/thb/deb/deblab/add_my_pet/, Kooijman, 2009). In SpawningDetermination and SettlementDetermination variables, these entries are defined by the “reconstruction species-based” category. If a species is not in AmP (110 species) or only represented by a genus, a mean growth curve is constructed using available AmP species curves from the same genus (see Tables S4, S5 and S6). Reconstruction is thus defined as “genus-based” in SpawningDetermination and SettlementDetermination variables (see Tables S5 and S6). In other cases, NA is attributed to all traits in the database variables.
2.3 Statistical analyses
In the Results section, temporal distributions of sampling, spawning and settlement periods are displayed as circular-plots using von Mises kernel density estimates (Fisher, 1993). These representations allow the seasonality of traits to be observed, considering the periodicity of the studied processes. Data in “sampling date” or “otolithometry” subcategories of SpawningDetermination and SettlementDetermination variables are considered observed data. Species-based or genus-based reconstructed dates are considered reconstructed data. Circular uniform probability distributions are displayed as a baseline to simulate uniform probabilities over an annual cycle.
In Sect. 3.2, PLD data are grouped into similar categories (e.g. observed, reconstructed and composite), whose distributions are fitted using Gaussian mixture models (Bouveyron et al., 2019). Observed PLDs come from otolithometry data since spawning and settlement dates are fully derived from observations. Reconstructed PLDs are represented by juvenile data as both spawning and settlement dates are reconstructed. Finally, composite PLDs are estimated when mixing observed settlement date and reconstruct spawning date (settlers data).
3.1 General description of the database
The total number of entries (rows in the database) is 118 661, among which 79 645 entries (67.1 % of the database) provide information on both spawning and settlement, thus allowing for the computation of PLDs. Dates and locations of spawning are given by 95 796 entries (80.7 %), while the same information on settlement is given by 82 801 entries (69.8 %). Some entries only characterize spawning (16 151 rows, 13.6 %) or settlement (3156 entries, 2.7 %), thus preventing the estimation of PLDs. Overall, 19 709 entries (16.6 %) only provide information on spawning or settlement locations but not on dates.
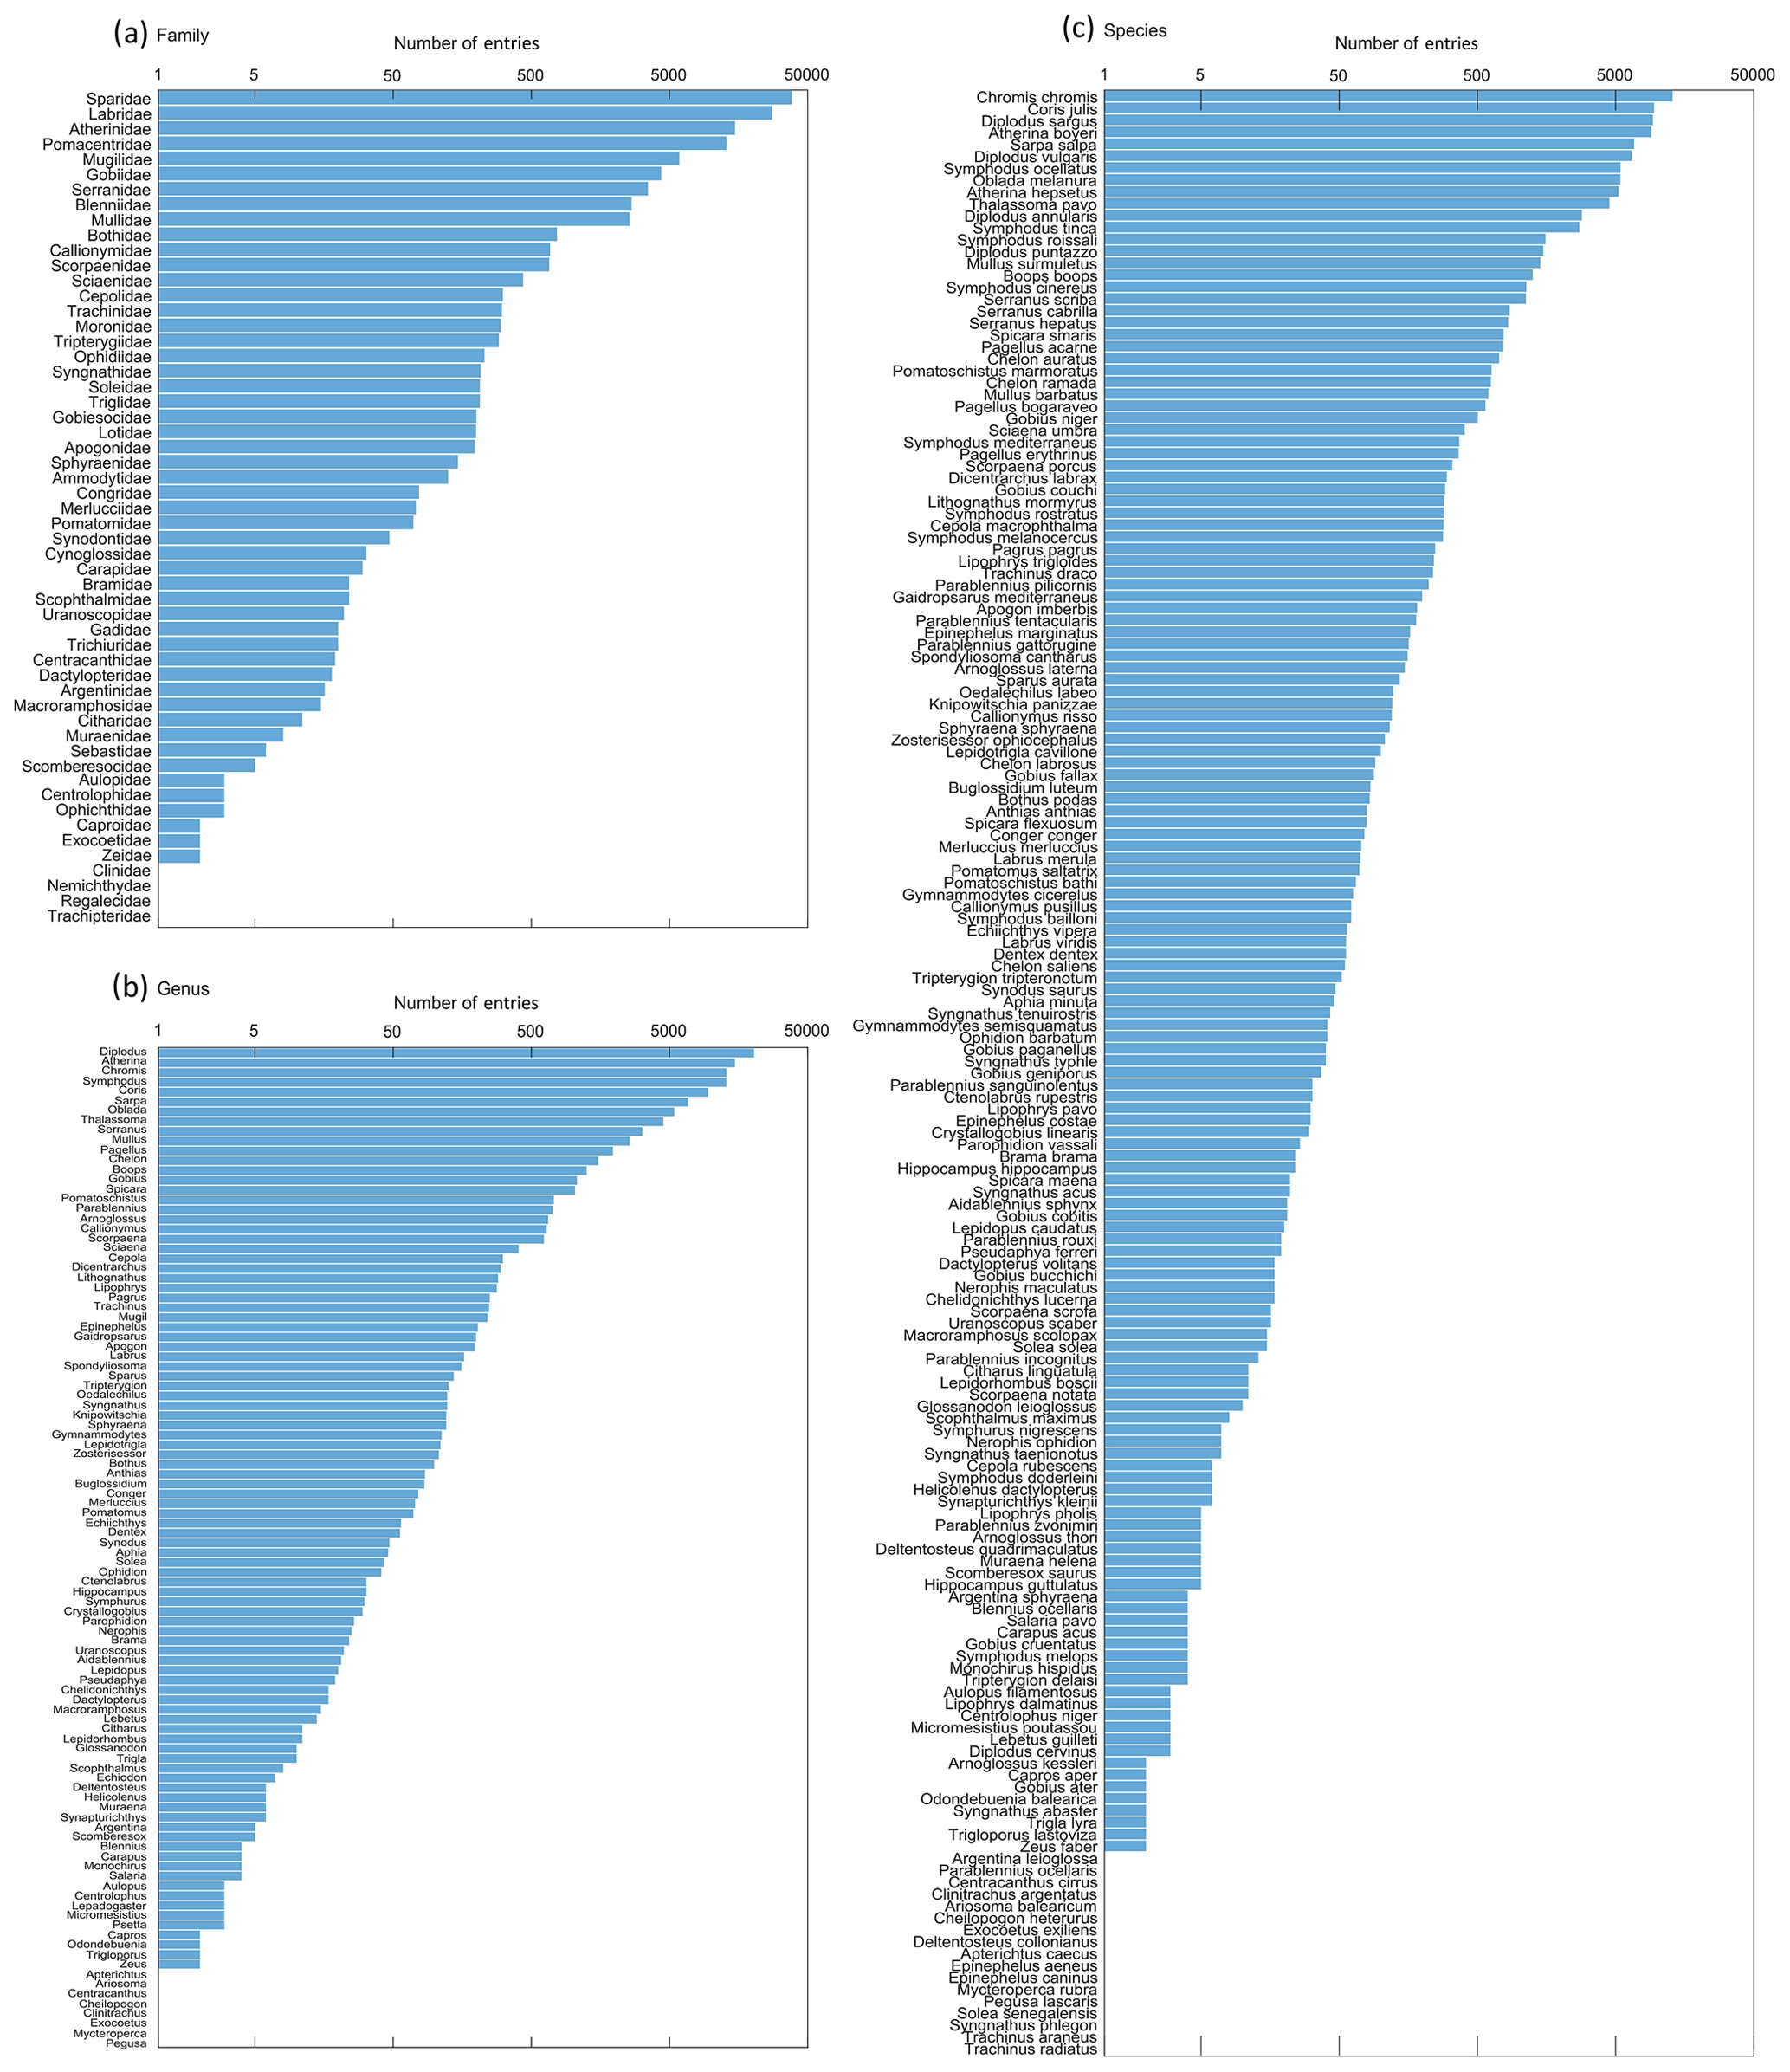
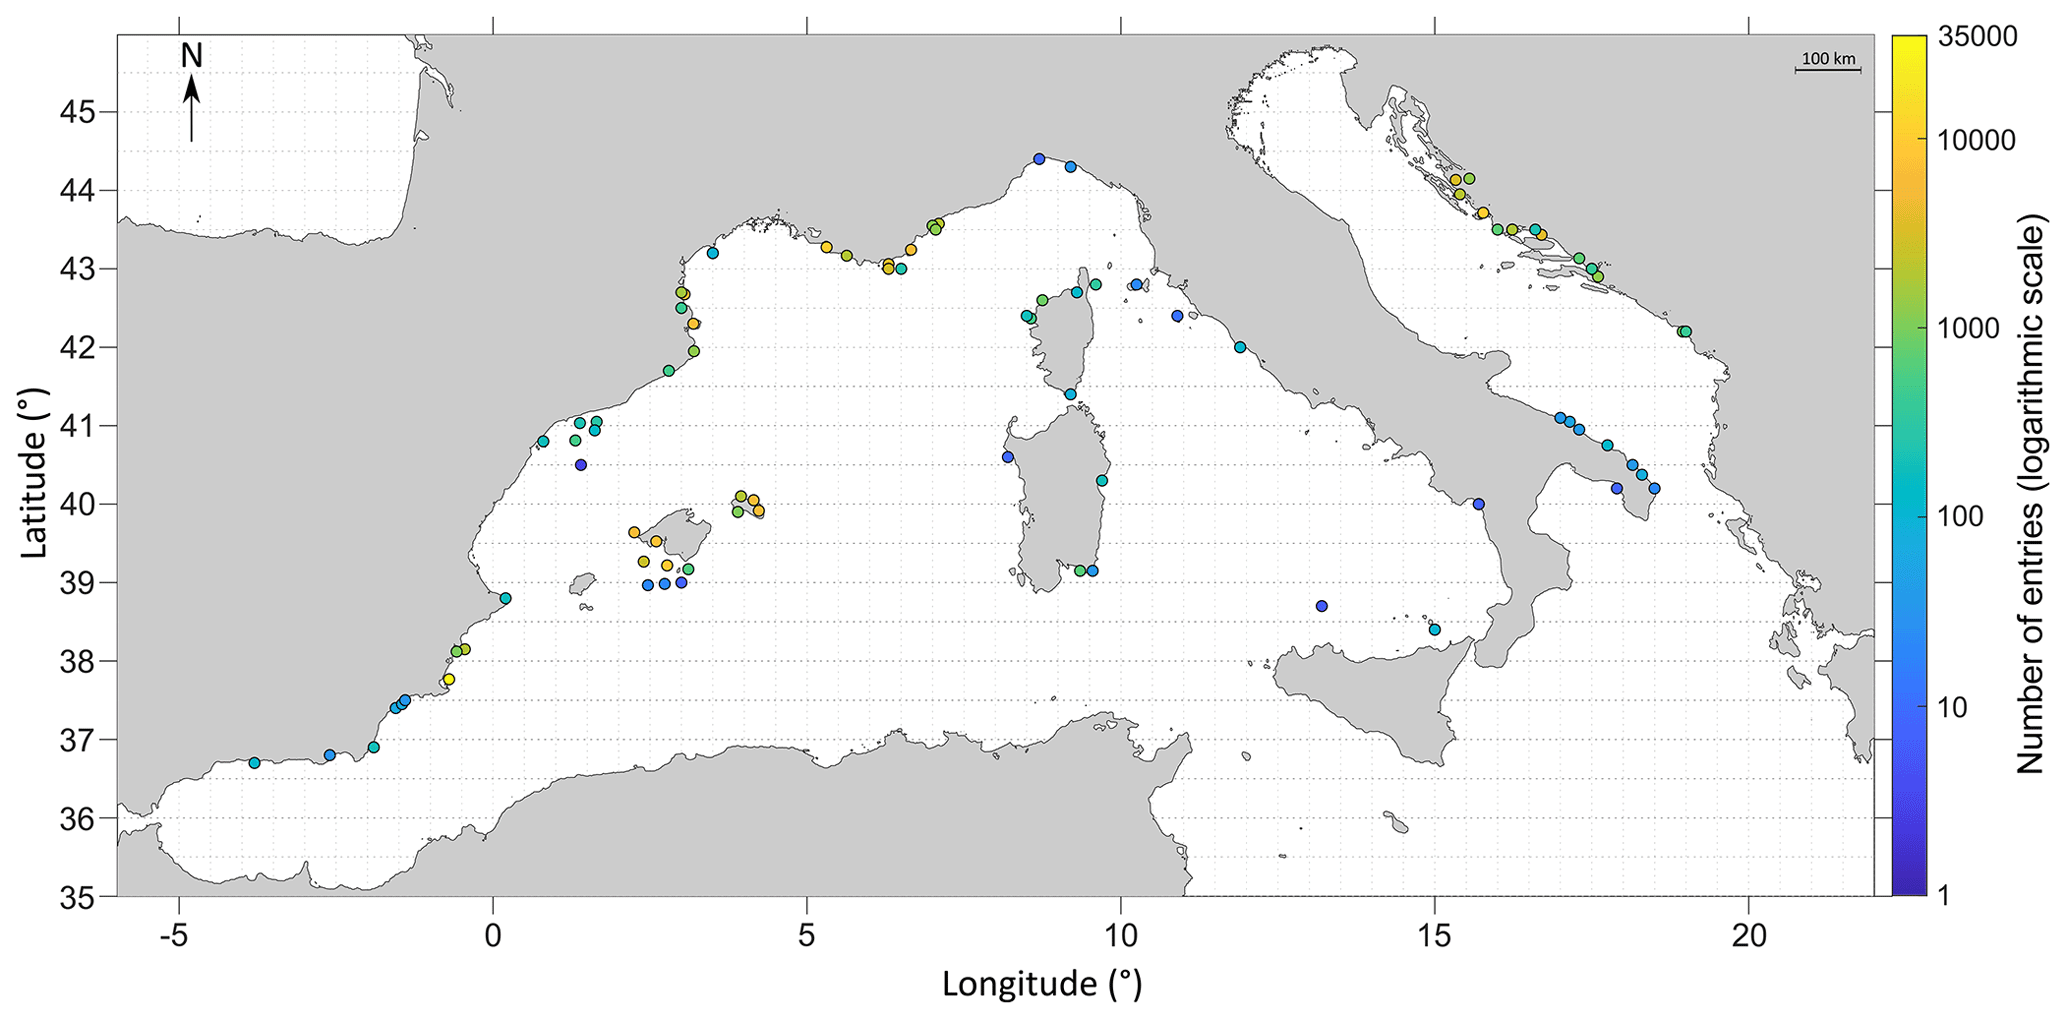
Figure 4Number of entries sampled per node. Each node is 0.5° in latitude per 0.5° in longitude, which represents around 50 km in latitude per 50 km in longitude. The coordinate system used is WGS84.
A total of 55 families, 102 genera and 165 species are recorded in the database (see Table S3). The most represented family is Sparidae with 38 259 entries (32.2 %), the most represented genus is Diplodus with 20 416 entries (17.2 %) and the most represented species is Chromis chromis with 12 914 entries (10.9 %) (Fig. 3). Note that there are more entries when enumerated per family and per genus than per species due to the proportion of data for which only the family (9858 entries, 8.3 % of the database) or the genus (5110 entries, 4.3 % of the database) is specified (e.g. eggs and larvae sampled by plankton nets are difficult to identify at species level, as well as very young juveniles sampled by UVC).
This database combines information derived from 11 general sampling techniques. Entries mainly come from UVC (72 860 entries; see Fig. S3a), followed by shore seines (20 555 entries), both of which mostly capture juvenile fishes (89 458 entries; see Fig. S3b). They have been generally collected near the surface: 90 % of the data are associated with depths ranging from 0 to 10 m, while the maximum depth recorded in the database is 175 m, sampled with a plankton net.
Concerning the spatial coverage of the database, the most represented ecoregion as defined by Spalding et al. (2007) is the western Mediterranean with 96 455 entries, followed by the Adriatic Sea with 21 764 entries, compared to the least represented regions, the Alboran Sea with 434 entries and the Ionian Sea with only 8 entries. Note that the sampling has been spatially widespread in some regions with a low number of entries (Catalan shorelines, for instance), whereas some locations (very restricted in space, such as reference sites or institutional time series) have been repeatedly sampled over time to study temporal variability (Fig. 4). Moreover, certain areas are represented by multiple species (for instance, the Balearic archipelago, where general sampling techniques such as bongo nets are employed), whereas some are limited to one to a few species (Italian coasts in general, focusing especially on a few Sparidae species such as Diplodus sargus). Overall, areas with the highest number of entries are coastlines from Marseilles to Nice, the border between France and Spain, the Balearic archipelago (especially in Menorca and in the south-west of the island of Majorca), coastlines around Murcia, and Croatian shores.
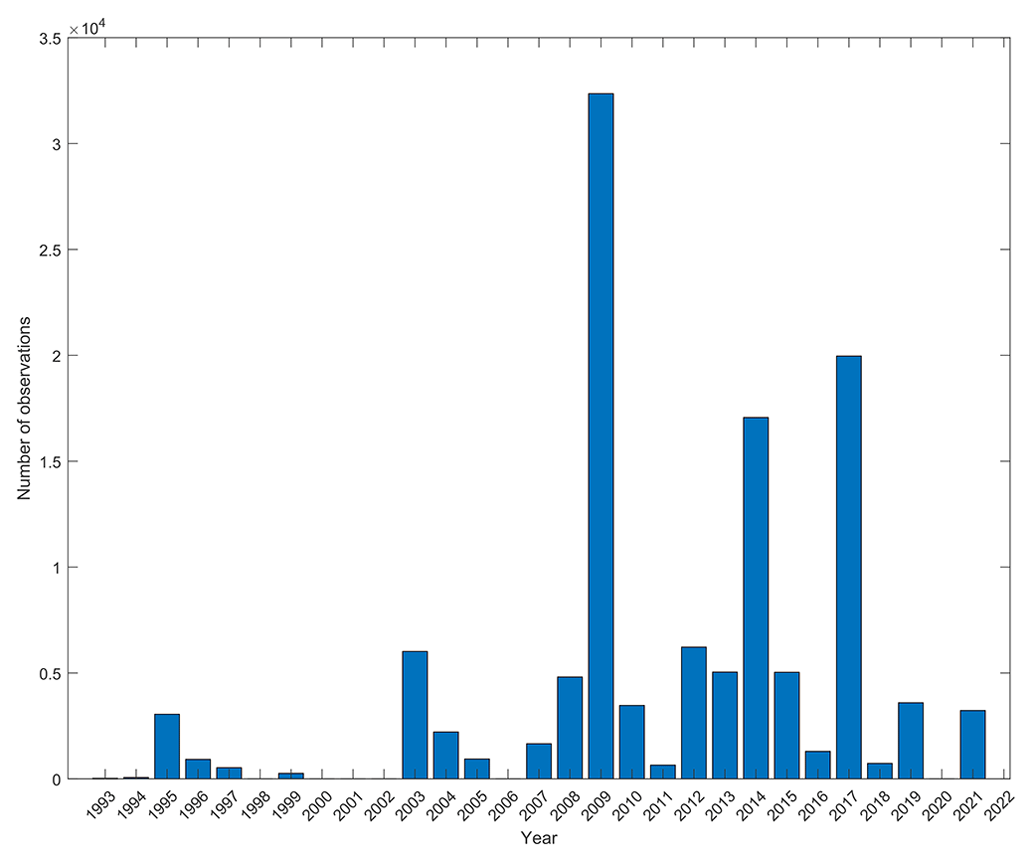
Considering time dimension, the database covers 29 years (1993 to 2021), with a noticeable gap of sampling efforts around the beginning of the 2000s. The 2010s are well sampled, while the most recent years (around 2020s) are not (Fig. 5). Over an annual cycle, one can see that sampling has mainly been performed from May to early August and in September–October (Fig. 6a). There is a clear lack of sampling in winter from December to mid-March but also in early spring (late March to April). All spawning and settlement dates cover the whole year (bold black curves on Fig. 6b and c). More precisely, spawning prevails from March to mid-June and from July to mid-August, while it weakens from September to January (Fig. 6b). Regarding settlement, it spans February to June, with local minima from July to September and from October to January (Fig. 6c, black curve). Across the entire database, PLDs range from a minimum of 4 d to a maximum of 250 d. Density estimates of PLDs reveal three distinct peaks at 20, 37 and 64 d (Fig. 7, bold black curve).
3.2 Comparison between observed and reconstructed data
To evaluate the impact of combining direct and indirect estimates, we grouped data into two broad categories: observed data (i.e. determined directly at sampling or thanks to otolithometry) versus reconstructed data (i.e. reconstructed using DEB theory, based on species or genus information). Observed data represent 15 097 entries for spawning dates (15.8 % of total spawning data) and 14 343 entries for settlement dates (17.3 % of total settlement data). Reconstructed dates sum up to 80 699 entries for spawning (84.2 % of total spawning data) and 68 458 entries for settlement (82.7 % of total settlement data), from which species-based reconstruction represents respectively 64 154 spawning entries (79.5 % of spawning reconstruction and 67.0 % of total spawning data) and 55 847 settlement entries (81.6 % of settlement reconstruction and 67.4 % of total settlement data). Consequently, the remaining 16 545 spawning entries (20.5 % of reconstructed spawning dates and 17.3 % of total spawning data) and 12 611 settlement entries (18.4 % of reconstructed settlement dates and 15.2 % of total settlement data) concern genus-based reconstructions.
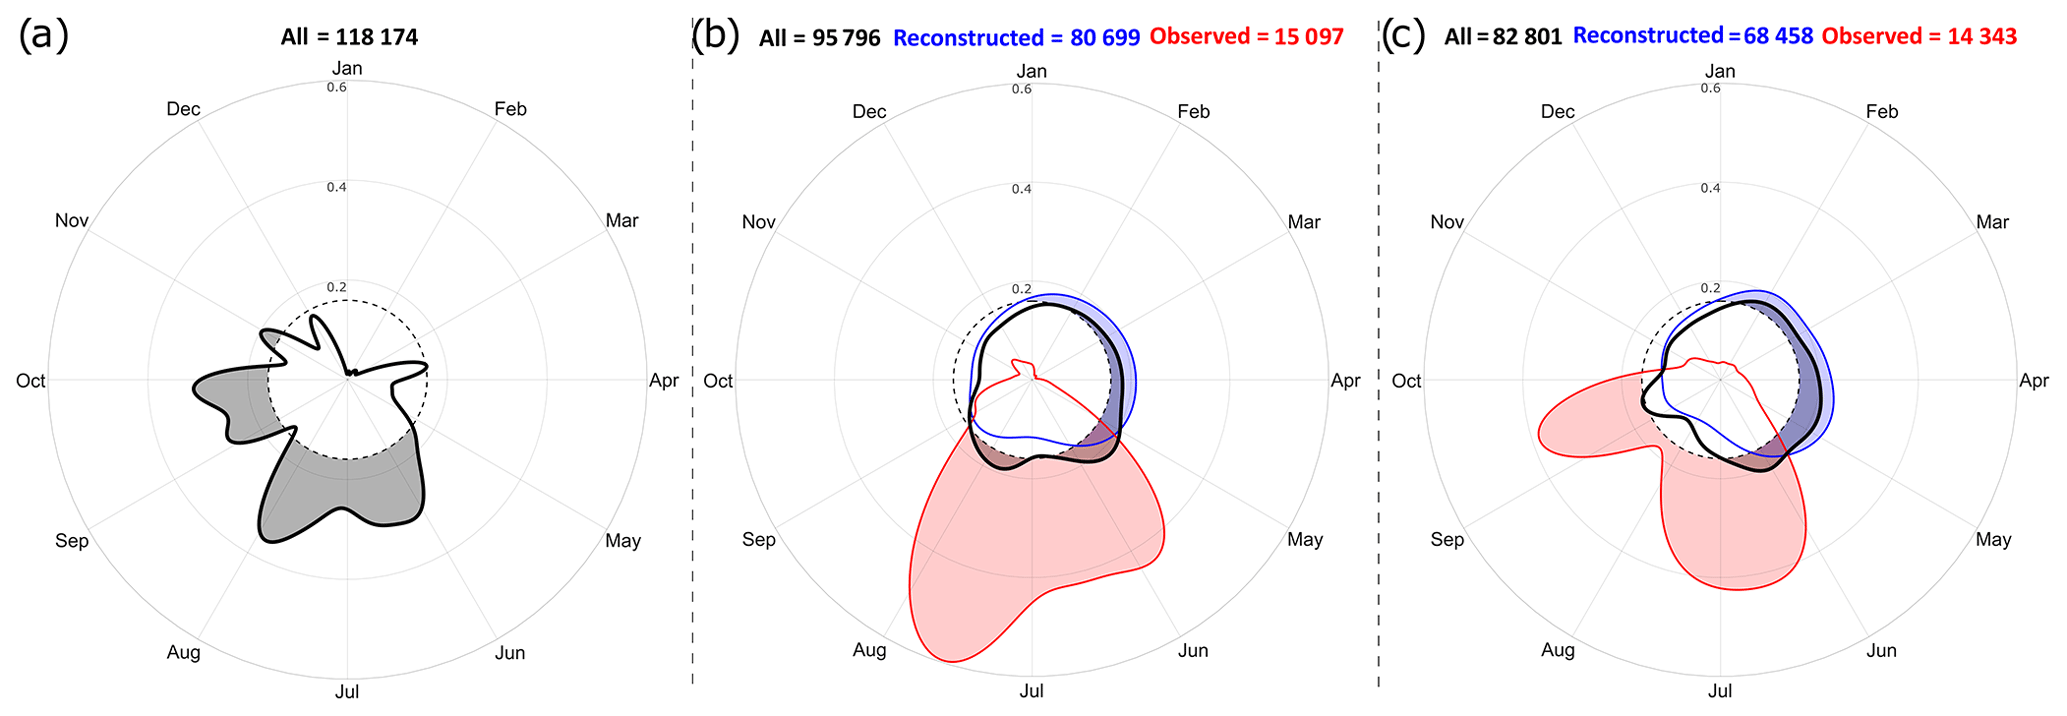
Figure 6Kernel circular-density estimates of the (a) sampling, (b) spawning and (c) settlement comparing all data (bold black curves), observed data (red curves) and reconstructed data (blue curves). Shaded area under a contour line displays high-density regions above uniform distribution (dashed circle). No sampling date is available for some otolithometry data (487 entries); thus the number of sampling dates in (a) is not equal to the number of entries in the database.
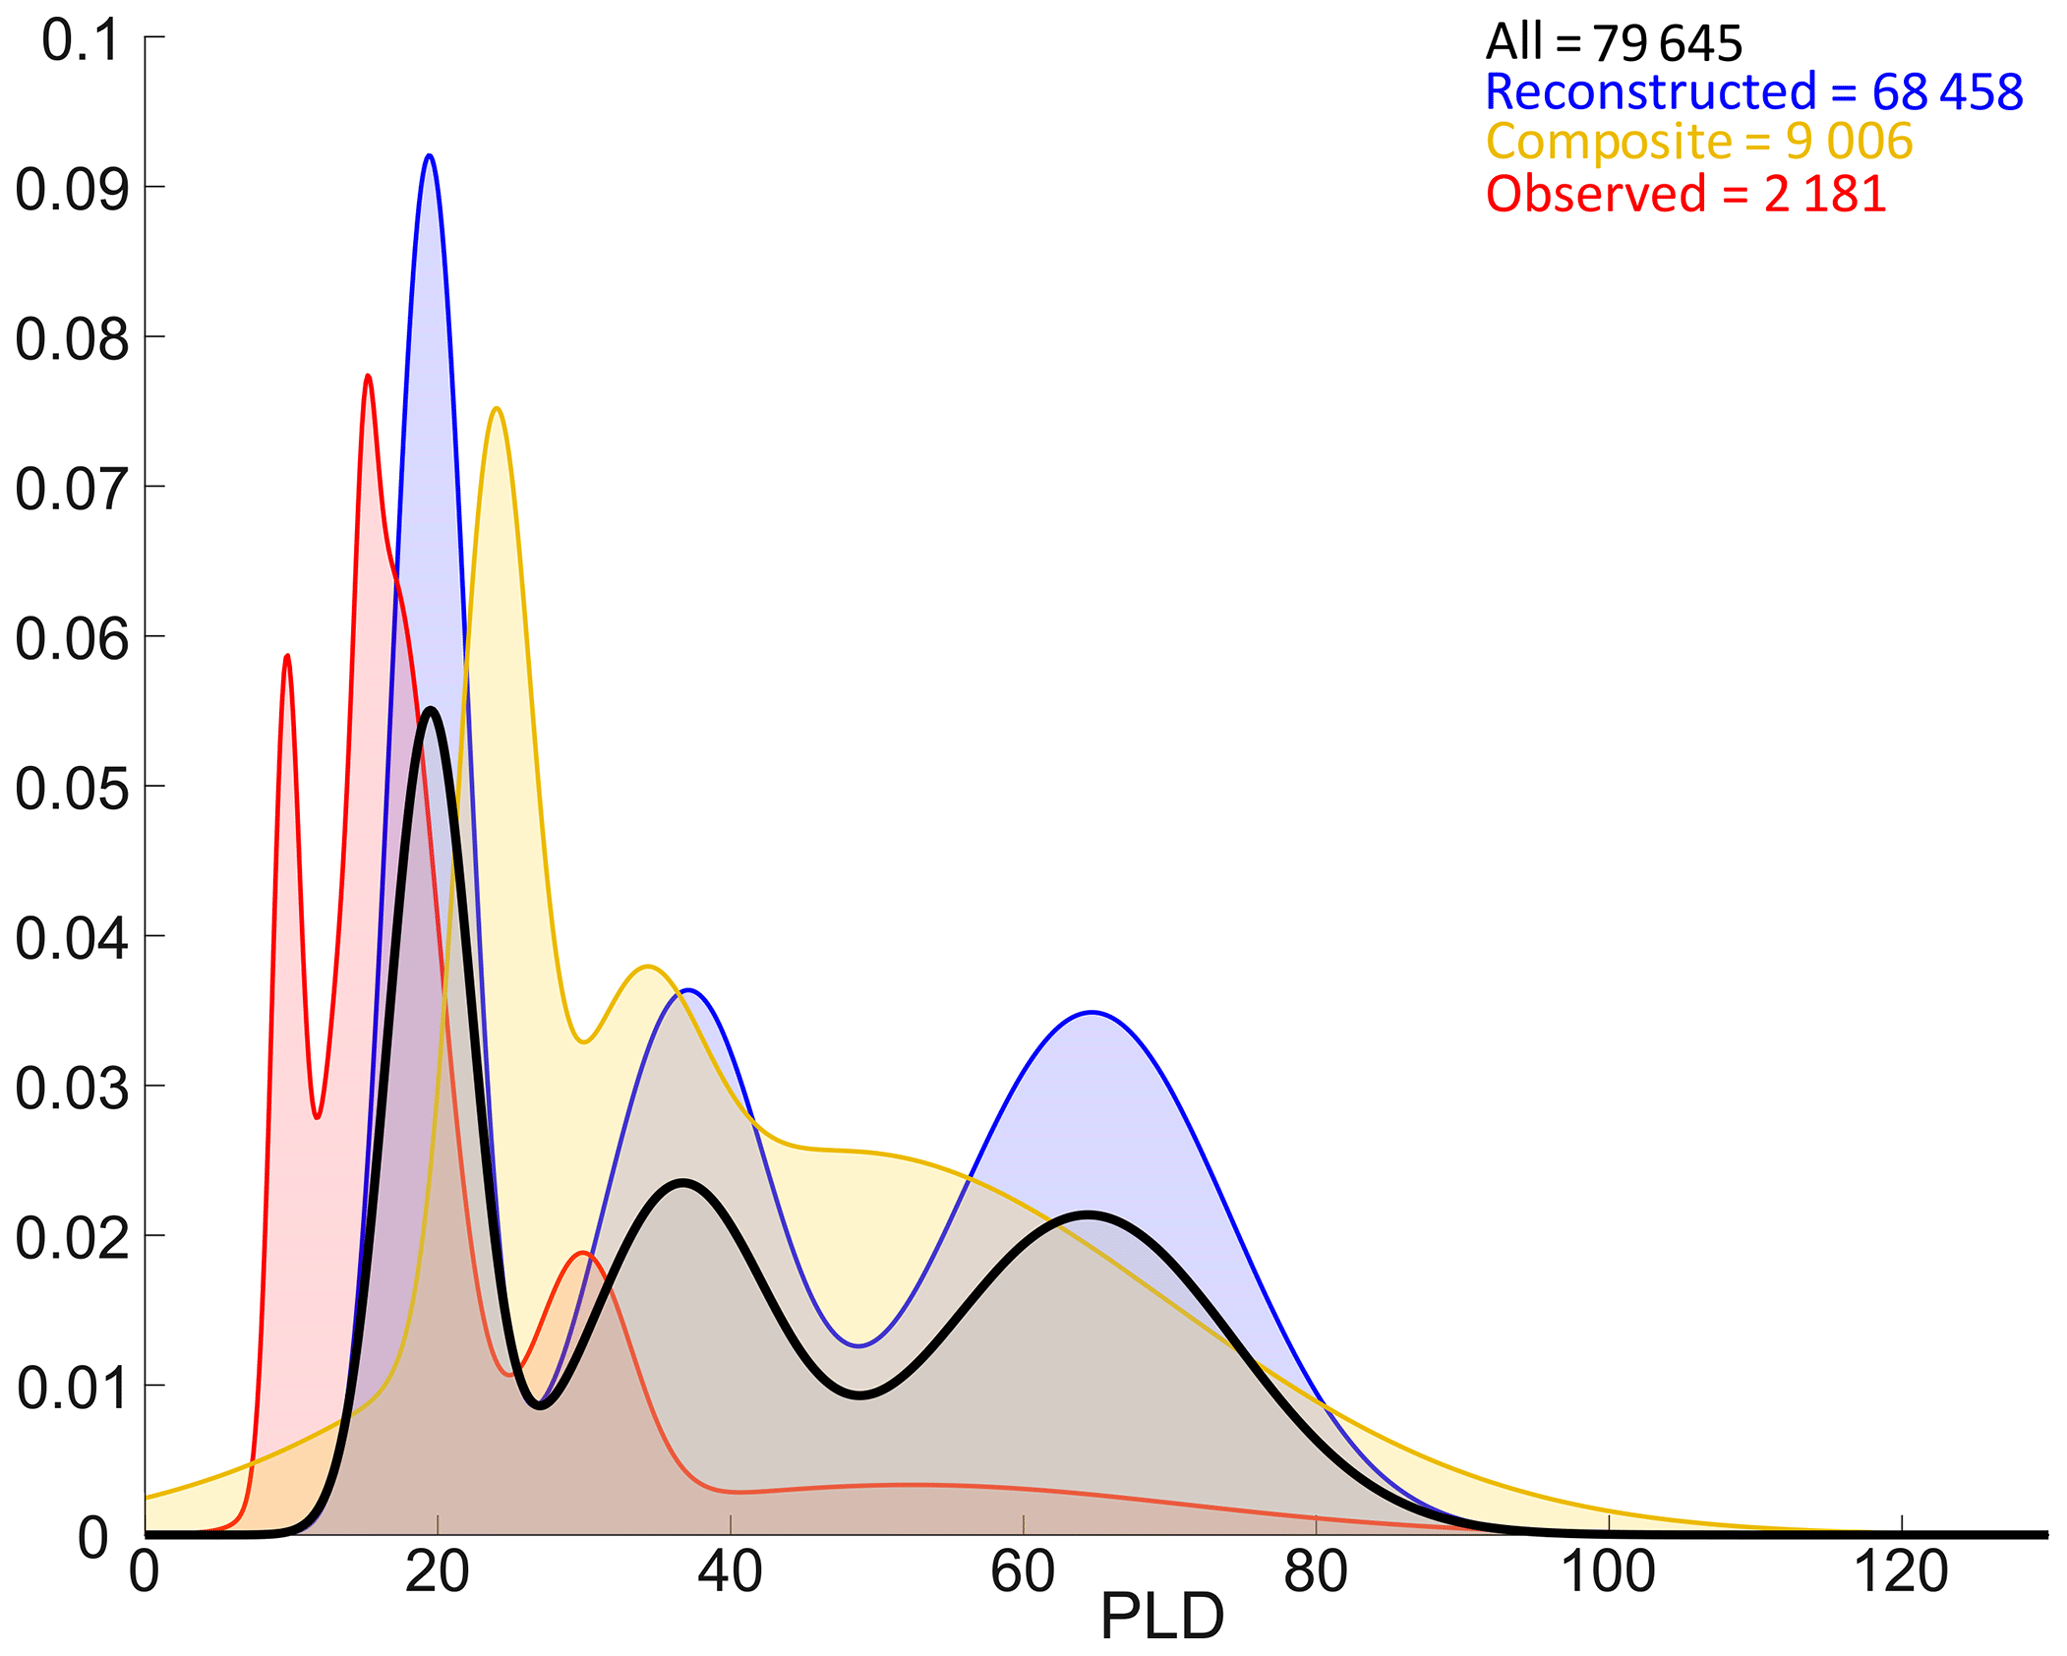
Figure 7Density estimates (Gaussian mixture models) of all PLDs (bold black curve), observed PLDs (red curve), reconstructed PLDs (blue curve) and composite PLDs (estimated from observed settlement dates and reconstructed spawning dates, yellow curve). Note that while this figure represents the distribution of all PLDs across the database, the shapes of densities are also affected by non-uniform taxonomical sampling, as reported in Fig. 3.
Observed spawning dates occur from mid-May to mid-August (Fig. 6b, red curve); observed settlement dates mainly take place from mid-May to late July and from mid-August to late September (Fig. 6c, red curve). While this temporal shift of a few months could be partly explained by the expected delay between spawning and settlement events, there is also an evident lack of information for spawning from September to April and for settlement from October to May as well as in August. Reconstructed dates for both spawning and settlement are rather well distributed over an annual cycle (Figs. 6b and c, blue curves), although slightly less information is available from June to late December.
For both spawning and settlement, annual distributions of all data are very similar to those of reconstructed data, being less skewed than observed data. The overall shape of all data is however influenced by observed ones, as shown by the seasonal maxima from May to August for spawning and from June to late September for settlement. Nevertheless, annual distributions of reconstructed data and observed data are quite different, as are all data and observed data. In fact, spawning (settlement respectively) mainly occurs in distinct periods for each of these categories.
PLDs are separated into three broad categories: fully observed data represent 2181 entries (2.7 % of total PLD data), fully reconstructed data represent 68 458 entries (86.0 % of total PLD data) and composite data (e.g. PLDs estimated from observed settlement dates and reconstructed spawning dates) represent 9006 entries (11.3 % of total PLD data). In the database, observed PLDs range between 6.5 and 88 d, and the distribution peaks around 10, 16 and 29 d (Fig. 7). Composite PLDs range from 3.9 to 250.5 d with peaks at 24, 34 and 48 d. Reconstructed data span 6.2 to 191.8 d, and the peaks around 20, 37 and 65 d are very similar to those of all PLDs. PLDs of any category follow similar multi-modal distributions with three peaks (Fig. 7). Peaks derived from all PLDs and those from reconstructed PLDs overlap, whereas observed and composite data peaks tend to be shifted to lower values (except the first peak of composite data). It is worth noting that reconstructed data have a substantial influence on the final distribution of PLDs (Fig. 7) as well as on the ones of spawning and settlement dates (Fig. 6) since they are 5 times more numerous than observed data.
4.1 Early-life trait analysis
Based on the current ecological literature, a large majority of Mediterranean coastal fish species are known to spawn (and settle) during a specific season or period, usually lasting 2–4 months (Tsikliras et al., 2010), which can be observed in the database with Mullus barbatus, for instance (Suau and Vives, 1957). Contradicting this view of mostly restricted phenology for coastal fish, the database highlights more continuous phenomena with longer periods (spanning several months) during which spawning and settlement occur, both at the database scale (black bold curve in Fig. 6) and at the species level (e.g. Diplodus sargus). In fact, field studies are often limited in space and time and/or in the variety of species and techniques (or may consider stocks only, such as Tsikliras et al., 2010). They are rarely made simultaneously in different regions and often disregard interannual variability, even thought these scales are clearly relevant to best apprehend temperature-triggered spawning events (Di Stefano et al., 2022). In the future, more accurate information on early-life traits (spawning or settlement) could be obtained by carrying out regular sampling throughout the year and within several regions.
Nonetheless, physiological studies such as those studying the gonadosomatic index, a good proxy for the fish reproductive cycle (Conover, 1992; Tsikliras et al., 2010; Mouine et al., 2012), also support the idea that the species-specific periods favourable for spawning are longer than those derived locally. Our results thus advocate for compiling extensive observations over large scales before determining meaningful ecological envelopes. Note also that the gonadosomatic index evaluates adults' spawning potential, whereas here we assess spawning periods, including direct egg observations but, most of all, a posteriori information from individuals that have already survived the dispersal phase. As such, we are not estimating spawning dates from the entire population but only from survivors, which could introduce a survivor bias. In fact, growth-selective mortality could play a role here so that traits of survivors from a given year favouring slow growers may be different from those of another year favouring fast growers (Pepin et al., 2014). Nevertheless, here we integrate information from different life stages (e.g. eggs, larvae, settlers and juveniles), suggesting they are affected by various selective pressures and mortality rates. We thus find that the spawning process is longer than previously thought, so individuals sampled in a specific place could come from a batch of eggs spawned from different periods and not only from similar patches of peak spawning (Di Franco et al., 2015; Legrand et al., 2019).
In Fig. 7, the distribution of all PLDs points out three categories: short (around 20 d, 2–3 weeks), medium (around 35 d, 1 month) and long (around 65 d, 2 months) PLDs. The same patterns appear for observed, composite and reconstructed PLDs, sometimes with little shifts. These three categories obtained with large statistics, including many observed otolithometry-derived short and medium PLDs, are consistent with previous studies (Raventos and Macpherson, 2001; Macpherson and Raventos, 2006) and could serve as a reference for future ecological or connectivity studies using generic PLDs in the Mediterranean Sea, as done in Dubois et al. (2016) and Legrand et al. (2022). From a more evolutionary point of view, these dispersal timescales could be associated with typical residence times of coastal waters in order to balance auto-recruitment and larval export/import (Dubois et al., 2016). Residence times in the coastal ocean span 5–10 d in small embayments (Hernandez-Carrasco et al., 2013), 2–20 d in large bays (Rubio et al., 2020) and 31–90 d in the entire Mediterranean according to a global modelling study (Liu et al., 2019). While residence times depend on local bathymetry (e.g. geometric enclosure) and (sub)mesoscale activity, these physical timescales are indeed in good agreement with biological timescales of dispersion revealed by our data compilation. It suggests a potential adaptation mechanism at the community level in temperate and open seascape, as previously documented in relatively enclosed tropical reefs (Paris and Cowen, 2004). Studying Mediterranean fish species reared under controlled conditions, Lika et al. (2014) also suggest that dispersal is key to the coupling found between temperature and metabolic acceleration at larval stage.
Note also that early-life traits exhibit a certain plasticity linked to other abiotic factors. For the Diplodus genus, Vigliola (1998) shows that short PLDs are often associated with spring and summer settlement (Diplodus sargus), whereas long PLDs are often seen during autumn and winter (Diplodus vulgaris), perhaps because larvae must endure the coldest temperatures along their drift, limiting their growth (Green and Fisher, 2004). More recently, Raventos et al. (2021) document a tight link between PLD and environmental factors (seawater temperature in this case) prevailing during pelagic dispersal.
It must be considered that early-life traits compiled here can be slightly biased by over-represented fish species. Observed PLDs are otolithometry data, and these ones mainly concern Sparidae (Diplodus sp., Sarpa salpa, Oblada melanura) but also Chromis chromis, Coris julis and Symphodus sp. genera, known for their short PLDs (Macpherson and Raventos, 2006). On the other hand, the long tails of distribution of all PLDs are due to the numerous samples of Parablennius sp. and Lipophrys sp., two genera of the Blenniidae family for which males take care of eggs until hatching (Almada et al., 1992; Giacomello and Rasotto, 2005), as well as Hippocampus sp. exhibiting specific reproductive processes (i.e. eggs and just-hatched larvae growing inside the male brood pouch and then drifting during 8 weeks; Curtis and Vincent, 2006). Indeed, the possible relationship linking long PLDs with fish species practising egg parental care remains to be investigated, as this behaviour tends to protect the eggs from predation and favour the release of larger larvae, potentially limiting early-life mortality during pelagic dispersal.
4.2 Uncertainties resulting from sampling efforts
Sampling biases in such databases can arise due to spatially and/or temporally restricted sampling efforts, as well as to heterogeneous taxonomic coverage. While former bias sources are usually linked to practical constraints, the latter may also reflect behavioural discrepancies. For instance, cryptobenthic species from the Blenniidae or Gobiidae family are rarely identified at species level. In addition, they are difficult to observe in the field at all stages as they are hidden in seagrass meadows and macroalgae on rocky reefs and are thus less studied, despite recognized anthropogenic impacts on these species (Brandl et al., 2018). In fact, investigations mainly focus on accessible habitats and assemblages, especially shallow coastal habitats identified as the depth range where most coastal fishes are thought to settle (e.g. Sparidae and Labridae; Harmelin-Vivien et al., 1995; Cheminee et al., 2021). Nevertheless, settlement also occurs in deeper habitats of other types (e.g. sandy/muddy bottoms) for numerous taxa but with still few data up to now (except for well-studied species such as Merluccius merluccius; Druon et al. (2015)).
The database covers almost 3 decades but with substantial gaps in the late 1990s–early 2000s, late 2000s and the most recent period (late 2010s–early 2020s). This is related to the lack of sampling effort during certain periods but also to the evolution in sampling technique uses. In fact, highly destructive methods (such as dynamite and rotenone toxin) were essentially used to sample juveniles until the 1990s in parallel with classical methods such as nets and were progressively replaced by the non-extractive UVC method (Harmelin-Vivien et al., 1985) and light traps. The low quantity of data sampled during the most recent period (around 2020s) is probably due to data that have not been processed or did not lead to a peer-reviewed publication yet; therefore researchers are less willing to share their data. Note that the status of the ecosystems where data were collected may have changed. In fact, as this database spans a long period and many places, anthropogenic pressures and climate change may have modified the habitat or fish populations' phenology, potentially leading to a shift in fish traits.
Future sampling efforts should aim at being more continuous over an annual cycle and cover all months and seasons, such as Diaz-Gil et al. (2019) in the Mediterranean Sea or Bograd et al. (2003) in the Californian Current System. In fact, our results show that spawning and settlement occur pretty much all year long when considering many fish species, which is not seen on the distribution of sampling efforts. A noticeable difference is the clear prominence of sampling during summer as compared to winter (Fig. 6). The same observations are made by Brady et al. (2020) in freshwater studies. Thus, harsh winter conditions may discourage researchers from planning fieldwork in coastal areas, particularly for UVC involving divers. Note also the clear lack of sampling in August that may be linked to summer vacation periods of most European countries. Even though the combination of both direct and reconstructed data allows this sampling bias to be partially overcome, a temporally restricted sampling for settlement will undoubtedly reflect itself in the reconstructed spawning dates. For instance, as the Boops boops settlement is only observed from April to June for rather short PLDs (around 15 d), spawning can only be estimated as occurring at the end of winter and in the spring. In other words, for this species, it is not possible to verify if the absence of spawning between July and December is for biological reasons or because of an uneven sampling of the settlement. In fact, most published studies have been mainly focusing on shallow warm-season organisms that are considered, as a potential common biased belief, to be more ecologically or fishery-relevant species than those with wide thermal tolerances and/or inhabiting greater depths, whereas they might be equally important.
Concerning space, the majority of projects constituting the database are especially targeting the core or surroundings of marine reserves (a co-location procedure using marine protected areas of national statute from MedPAN and SPA/RAC (2021) reveals that this applies to more than 50 % of entries; not shown), while the rest are spread out over various unprotected areas, probably targeted by fisheries. The most represented reserves are Cabrera, Calanques and Port-Cros national parks but also Cabo de Palos, Cerbère-Banyuls and the North Minorcan Marine Reserve. Marine protected areas are known to house higher biomasses with larger fishes, i.e. more effective spawners (Lester et al., 2009; Edgar et al., 2014) and higher reproductive outputs (Marshall et al., 2019). Moreover, intense fishing pressure has been shown to shift reproductive and life history fish traits, which might ultimately impact the phenology of spawning and settlement (Heino et al., 2013). As such, this spatial sampling bias may also slightly affect retrieved spawning and settlement periods.
The precision of both species identification and length determination is also dependent on the sampling methodology. For instance, UVC is a non-harvesting method, so the length measurement is only based on the visual appreciation of the observer (to the nearest centimetre or half-centimetre, which can be a rough estimator for precise growth models), and observers have been shown to overestimate juvenile sizes (Edgar et al., 2004). Juvenile data may also be less accurate to determine early-life locations as active movements may affect connectivity (Di Franco et al., 2015). Conversely, harvesting methods like bongo nets or traps consist in keeping organisms in solutions and then measuring them precisely (to the nearest millimetre) in the laboratory. What can appear as small differences of sizes (1 cm, for instance) may indeed affect our results through the simplified categorization of life stages and reverberate across the precision of the reconstruction (e.g. the standard deviation of the trait). Note that the sensitivity of our results to size determination might differ from one species to another. For instance, it should be less important for fish species with specific body shapes, such as Coris julis, which is a relatively long fish at adult stage; therefore, slight imprecision would have little impact on age determination. No alternative predictor of age (such as fish weight) is used in the study as AmP growth curves are mainly based on length–age relationships, and most studies record length only, especially when using no-take methods such as UVC (Harmelin-Vivien et al., 1985; Cheminee et al., 2017; Cuadros et al., 2019).
Since DEB theory conserves mass, future works may revisit the proposed reconstruction process by exploiting species-specific size–weight–shape relationships. This study exploits size information because of its wide availability, whereas weight measurements of fish early-life stages are more difficult to carry out in the field and depend on the sampling technique, explaining their scarcity.
A last source of uncertainties comes from the non-exhaustive compilation of data due to a lack of answers from the researchers contacted or an incomplete screening of the literature. In fact, we focus on the entire Mediterranean Sea, but we could only retrieve data from the north-western Mediterranean basin and the Adriatic Sea. Limited financial and human resources, as well as the complex geopolitical situation, may explain why sampling is scarce, not yet digitized or even absent in some countries in the Mediterranean Rim. Further studies could expand our methodology to integrate south-western and eastern Mediterranean basins.
4.3 Uncertainties resulting from the use of growth models derived from DEB theory
While the std model is well adapted to adults' life cycle, here we retain the abj model, best adapted to the entire life cycle as it explicitly models the fish early-life stages (when available on the AmP website; see Sect. 2.2). Different bioenergetics and environmental conditions indeed apply to sedentary and dispersive stages (transition from a passive pelagic life to an active coastal life), explaining the separation of the growth curve in two equations in the abj model (Kooijman et al., 2011; Kooijman, 2014). For remaining fish species, we have to exploit the von Bertalanffy growth curve of the std model. In fact, limited observational data implemented in the AmP dataset of these fish species might have prevented AmP contributors from defining their abj parameters. Another possibility is that some fish species may have been well studied and are indeed known to follow the std life cycle. Nevertheless, the abj model is a one-parameter extension of the std model. When Lj=Lb, the former reduces to the latter and data can also be fitted with the std model, exhibiting similar or smaller mean relative error. Note that fisheries scientists often describe fish growth using the yield-per-recruit model of Beverton and Holt (1957) when performing stock assessment. By providing the expected lifetime yield per fish recruited into the stock at a specified age, it is used by fisheries managers to understand and predict the biological and economical effects of fishing on the stocks and helps them to take suitable measures to ensure sustainable exploitation. In this context, further work is needed to reach a consensus on a generalized growth model (encompassing both exponential larval growth and logistic adult growth) that could then be used in stock assessment exercises.
Development is highly sensitive to temperature, varying with location, season and depth (Dahlke et al., 2020). Moreover, the position of early-life stages in the water column is correlated to the size of the individual, also impacting food selection and thus changes in diet. However, due to the difficulty of getting local temperature and food data across the entire Mediterranean, unique T and f are uniformly drawn 50 times for each growth curve, and the retained growth curve is an average of the former ones (see parameter range in Table 2). More realistic results could be obtained when considering evolving temperature and food conditions encountered along the Lagrangian trajectory of a modelled larva, as done in Lagunes et al. (2024). Overall, the coupling of bioenergetics models with dispersal and ocean models holds a lot of promise, such as providing the mechanistic basis for projecting climate change effects on marine living resources (Rose et al., 2024).
Settlement and metamorphosis events are sometimes considered to occur concomitantly, especially in otolithometry studies (Di Franco and Guidetti, 2011), or settlement may also be considered a part of metamorphosis, a behavioural event in an extended-in-time morphological process (Vigliola and Harmelin-Vivien, 2001). Metamorphosis is however an ontogenic process (development biology) whereas settlement is rather an ecological event. In fact, metamorphosis is a more or less continuous process as the larvae acquire the ability to swim progressively toward the end of the dispersive phase. As metamorphosis is a fixed-in-time event in DEB theory, we decide to separate metamorphosis and settlement in the mathematical reconstruction process. The randomly chosen lengths at settlement Lsettl are then considered different from lengths at metamorphosis Lj determined by the DEB model, even if they can be close or equal. Moreover, previous tests fixing Lsettl equal to Lj led to distorted growth curves, as this assumption is not applicable to all species. Finally, the length classification used for this study (based on the literature) is a way to generalize models for Mediterranean coastal species, but classification limits are obviously species-specific and even individual-specific in reality.
For the genus-based reconstruction, we choose to average all different growth curves of species from the same genus into a unique growth curve for the genus (see Tables S5 and S6). This has not been done with families as there could be major differences among fish species belonging to the same family. Even if reconstructing data at genus level is questionable, this choice allows more data to be reconstructed and thus provides first insights into the early-life traits of some less studied genera or species. Finally, this process points out a need to determine missing growth parameters in AmP in order to obtain more reliable growth models, missing for some highly exploited fish species such as Mullus surmuletus.
In this study, we combine field observations and DEB modelling, potentially resulting in two sources of errors. They are however independent since DEB parameters are initially estimated based on observational datasets that are not contained in our compilation. In fact, depending on the studied area, early-life stages could have faced particular environmental conditions and different predatory or competitive pressures, favouring, for instance, the emergence of various asymptotic lengths Li when modelling growth and explaining why we accounted for environmental variability within the DEB model. Note also that growth models provided by AmP have a measure of goodness of fit through the mean relative error and symmetric mean squared error (Kooijman, 2009). Tests were conducted on one of the main species of the database (Diplodus sargus) to determine the impact of this uncertainty on the reconstruction results (see Fig. S4). Differences on reconstructed dates represent 1–2 d maximum. We disregard the intrinsic uncertainty of DEB growth models as we preferred to explicitly integrate the variability of environmental processes via the introduction of f and T. Finally, as DEB theory is based on metabolism and shape of the species (Kooijman, 2010), the impact of the data used to feed parameters of these growth models should be limited.
Note, however, that, even with well-fitted AmP growth models, our reconstructions might still be biased if their initial input datasets do not properly comprehend the full range of natural variability. In fact, many AmP parameter values are computed from data collected in the wild (e.g. for species of the Diplodus genus), but data are often limited in number, space and time. Also, some AmP parameters are determined based on laboratory experiments (i.e. under controlled abiotic conditions, as for Atherina boyeri) or estimated from other species of the same genus (e.g. the age at birth of Diplodus sargus, representing hatching, originates from Diplodus puntazzo's one). Moreover, some species-specific models are built by considering observations pertaining to one given life stage. While the few models fitted on early-life data may distort adult part of the curve (e.g. Diplodus puntazzo or Pagellus erythrinus), most models originate from adults' data only, suggesting less reliability of the early-life part of the growth curve, extrapolated from the adults' one (e.g. Chromis chromis or Epinephelus marginatus). Others are fed with too few points (e.g. Atherina boyeri or Uranoscopus scaber). In this respect, all early-life entries compiled here can serve as a new independent dataset to improve some of the AmP growth curves.
Finally, when comparing species-specific PLDs gathered in our database against those derived from otolithometry (known as a reliable estimator of PLDs) in the literature, the range of values is generally consistent despite a few noticeable discrepancies. For instance, Lithognathus mormyrus and Bothus podas reconstructed PLDs are around 5 and 4 months respectively, much higher values than 1-month PLDs derived from otolithometry by Ayyildiz and Altin (2021) and by Macpherson and Raventos (2006) for each species respectively. While our estimates seem more aligned with typical PLDs of high-latitude slow-developing species adapted to cold climates, it is also possible that the small sample sizes for Bothus podas or the narrow sampling windows for Lithognathus mormyrus would by themselves explain the mismatches. In other words, a highly locally adapted subpopulation surveyed by sampling that is too restricted could return PLDs that are not representative of the full variability of dispersal traits expected at basin scale (the impact of this sampling bias has already been observed in terrestrial studies; Wisz et al., 2008; Mentges et al., 2021). Another example of mismatch concerns Chromis chromis: the mean PLD of our database is about 3 times higher than PLDs documented in the literature. To clarify reasons behind this mismatch, we compared reconstructed PLDs using (i) the AmP default fit and (ii) a fit using only one-third of the smallest-length observations (not shown). With this specific fit, reconstructed PLDs are more concordant with the literature than those obtained with the default fit, relying mainly on large lengths from adult observations. These two exemplary issues point out the constant necessity to test models against observations as well as to feed more high-quality observations of all stages into DEB growth models to better constrain parameters. Overall, it calls for more regular and tight interactions between field and theoretical ecologists.
4.4 Perspectives: future data reuse
First, this compilation of early-life dispersal traits (namely dates and locations of both spawning and settlement, along with PLDs) for bipartite life cycle coastal fishes will allow, in combination with other trait databases (Teletchea and Teletchea, 2020), ecological analyses to be performed that focus on the phenotype variability for a given species or comparatively among various species at both organism and population levels. Previous research suggests a substantial sensitivity of fish early-life traits to ongoing climate change (Pankhurst and Munday, 2011; Llopiz et al., 2014; Donelson et al., 2019). This database covering almost 3 decades, which may be updated in the near future as new observations become available, could foster further analyses of trait variability over longer, near-climatic, temporal scales. When analysed in concert with environmental factors derived from satellites, operational ocean models or other aggregated datasets (e.g. Tyberghein et al., 2012; Assis et al., 2018), they would also allow traits' plasticity to be studied. Overall, it should contribute to reconciling ecological and evolutionary considerations. For instance, Harmelin-Vivien et al. (1995) state that Diplodus sargus and Diplodus vulgaris share the same nurseries but in different seasons due to potential selective evolution. This database could help to verify if this kind of association also occurs in other environments and if it may evolve through time when the climate changes.
Moreover, PLDs and the dates and locations of spawning and settlement should promote further connectivity studies and provide reliable constraints (by informing when and where dispersive stages start and end) for dispersal models at the population level or at the community level, with random samples drawn into different distribution functions, representative of Mediterranean bipartite coastal fish (such as general PLD values used in Dubois et al., 2016, or Legrand et al., 2022). Of course, species-specific analyses of dispersal traits, such as PLD, can be easily carried out by filtering the database accordingly. The results of such analyses could further feed marine spatial planning tools combining scientific, economic and sociological approaches and resulting in comprehensive maps, providing guidance to decision-makers (e.g. Marxan and Marxan Connect software; Vigo et al., 2024).
Connectivity and climatic studies could even be combined to better understand how marine assemblages are being re-shuffled spatially (e.g. moving poleward), while considering the plasticity of dispersal traits. Finally, the classical match–mismatch hypothesis (Cushing, 1990) could be explicitly tested based on modelling space- and time-dependent spawning, dispersal and settlement together to better understand early-life mortality rates and how they control interannual variations or long-term trends in fish recruitment (Hidalgo et al., 2019; Ferreira et al., 2023).
More generally, current eco-evolutionary theory postulates that traits' plasticity may arise from phenotypic and/or genetic components. Phenotypic plasticity describes the ability of an organism to change traits in response to environmental variations without genomic modifications. Although still being debated, genetic plasticity would refer to similar changes in a trait across multiple environments due to differences in allelic expression and to changing interactions among loci. Also called “genetic assimilation” and supposedly being transferable to next generations, it is when environmentally induced phenotypic variations become constitutively produced (i.e. being encoded in the genome, they no longer require environmental signals for expression). In both cases, the breadth of diversity encompassed by this database is proportional to (i) the number of species sampled, (ii) the absolute number of sampled individuals for a given species, (iii) the spatial representativeness of sampling across the entire distribution range of the given species, and (iv) the time coverage and temporal frequency of sampling over its existence (e.g. from speciation to extinction). As such, the reliability of the dispersal traits and of their variability contained within this database relates to the completeness of the input data (whose sampling gaps have been determined previously). In other words, the higher the number of future new entries, the more informative and accurate the database will become.
Following the application of FAIR principles (Findable, Accessible, Interoperable, and Reusable studies and data; Wilkinson et al., 2016) in marine ecology, our original methodology could democratize the creation of large databases combining observed, modelled or mixed data from multiple sources and places. Considering the limited funding for research as well as elevated costs and complications of field campaigns, we believe this kind of initiative could be further developed to limit data retention and data loss while increasing the explanatory power of existing datasets, which may not be harmonized or accessible otherwise. As required by most public founders, instructions are to grant access to standardized, accessible, permanent and renewable records on historical data, generally stocked on paper or on obsolete storage technologies, otherwise destined to disappear. Data diffusion has become easier via the use of numerical sharing tools and online data repositories, favouring the development of similar initiatives in the Mediterranean Sea or elsewhere. Here we present the first version of a database that, we hope, will be used and further developed by the research community. Indeed, the methodology has been fully described previously, and the SEANOE data repository allows for updates and expansion of the database content. Such updates will concern (i) any newly observed entries by ongoing research projects, (ii) ancient entries that authors could not share with us in due time and (iii) entries that are already reconstructed that could be recomputed as soon as the AmP database is updated (both through better-fitted parameters and newly covered species). More generally, potential future works could aim at linking those databases automatically and relaying aggregated results in the well-known FishBase community website (https://fishbase.se/, last access: 19 August 2024).
Data are freely available as a unique dataset and associated metadata on the data repository SEANOE at https://doi.org/10.17882/91148 (Di Stefano et al., 2023). MATLAB codes of DEB growth models are available on each species page of the Add-My-Pet website at https://www.bio.vu.nl/thb/deb/deblab/add_my_pet/ (Kooijman, 2009) (in “Collection” and “Species Name”).
The supplement related to this article is available online at: https://doi.org/10.5194/essd-16-3851-2024-supplement.
Authors confirm contribution to the paper as follows:
-
MDS, DN and VR realized the study conception and design.
-
VR and DN provided critical feedback on the experiments.
-
MDS and DN performed the statistical models.
-
MDS analysed and interpreted the results, with contributions from VR and DN.
-
MDS led the writing of the manuscript.
-
VR and DN reviewed the initial and final versions of the paper and provided critical feedback.
-
IA, GA, PA, GB, AB, DB, ACa, IC, CC, ACh, RC, ACu, ADF, CDG, TE, RF, FCFH, JAGC, PG, LG, JGH, MHV, MH, HH, JOI, GLM, LLD, PL, EM, SMS, MMe, MMi, TM, JM, MMun, MMur, LN, MPO, JP, APR, SP, NR, JR, ElR, ErR, SR, AS, TT, DVe, LV and DVr provided data, reviewed the manuscript and provided critical feedback.
The contact author has declared that none of the authors has any competing interests.
Publisher’s note: Copernicus Publications remains neutral with regard to jurisdictional claims made in the text, published maps, institutional affiliations, or any other geographical representation in this paper. While Copernicus Publications makes every effort to include appropriate place names, the final responsibility lies with the authors.
The authors acknowledge support from Région Sud for Marine Di Stefano's PhD grant and co-funding by Port-Cros National Park through a project supported by the Prince Albert II of Monaco Foundation. The authors thank Maurice Libes for his help and advice on database formatting and on data repositories. The authors acknowledge Nathaniel Bensoussan for his valuable help in quickly handling the MAPAMED dataset and Witold Podlejski for his precious mathematical help and advice. For sharing data they collected, the authors also thank the following data samplers and/or researchers who were part of the initial projects and studies: Franco Biagi, Laureline Chassaing, Bret Danilowicz, René Galzin, Antoni Garcia-Rubies, Adrien Goujard, Dulcic Jakov, Jean-Yves Jouvenel, Marine Leteurtrois, Nicolas Lucchini, Ciara O'Leary, Hector Torrado and Leonardo Tunesi.
This research has been partially supported by the European Space Agency (ESA) via the 4DMEDSEA project (grant no. 4000141547/23/IDT).
This paper was edited by Marta Rufino and reviewed by Sebastiaan A. L. M. Kooijman, Pierre Pepin, and one anonymous referee.
Agüera, A., Ahn, I.-Y., Guillaumot, C., and Danis, B.: A Dynamic Energy Budget (DEB) model to describe Laternula elliptica (King, 1832) seasonal feeding and metabolism, PLOS ONE, 12, e0183848, https://doi.org/10.1371/journal.pone.0183848, 2017. a
Almada, V. C., Gonçalves, E. J., De Oliveira, R. F., and Barata, E. N.: Some features of the territories in the breeding males of the intertidal blenny Lipophrys pholis (Pisces: Blenniidae), J. Mar. Biol. Assoc. UK, 72, 187–197, https://doi.org/10.1017/S0025315400048876, 1992. a
Assis, J., Tyberghein, L., Bosch, S., Verbruggen, H., Serrão, E. A., De Clerck, O., and Tittensor, D.: Bio‐ORACLE v2.0: Extending marine data layers for bioclimatic modelling, Global Ecol. Biogeogr., 27, 277–284, https://doi.org/10.1111/geb.12693, 2018. a
Ayyildiz, H. and Altin, A.: Pelagic larval duration and early growth of striped seabream, Lithognathus mormyrus inhabiting the Gökçeada shallow waters, Turkey, Research in Marine Sciences, 6, 883–895, 2021. a
Bates, A. E., Helmuth, B., Burrows, M. T., Duncan, M. I., Garrabou, J., Guy-Haim, T., Lima, F., Queiros, A. M., Seabra, R., Marsh, R., Belmaker, J., Bensoussan, N., Dong, Y., Mazaris, A. D., Smale, D., Wahl, M., and Rilov, G.: Biologists ignore ocean weather at their peril, Nature, 560, 299–301, https://doi.org/10.1038/d41586-018-05869-5, 2018. a
Beverton, R. J. S. and Holt, S. J.: On the dynamics of exploited fish populations., Great Britain Fishery Investigation Series II, 19, 533, https://books.google.fr/books/about/On_the_Dynamics_of_Exploited_Fish_Popula.html?id=1JntoCImKC8C&redir_esc=y (last access: 25 August 2024), 1957. a, b
Bianchi, Nike, C. and Morri, C.: Global sea warming and “tropicalization” of the Mediterranean Sea: biogeographic and ecological aspects, Biogeographia – The Journal of Integrative Biogeography, 24, https://doi.org/10.21426/B6110129, 2003. a
Bograd, S. J., Checkley, D. A., and Wooster, W. S.: CalCOFI: a half century of physical, chemical, and biological research in the California Current System, Deep-Sea Res. Pt. II, 50, 2349–2353, https://doi.org/10.1016/S0967-0645(03)00122-X, 2003. a
Bouveyron, C., Celeux, G., Murphy, T. B., and Raftery, A. E. (Eds.): Model-based clustering and classification for data science: with applications in R, Cambridge series in statistical and probabilistic mathematics, Cambridge University Press, Cambridge, New York, NY, ISBN 978-1-108-49420-5, 2019. a
Brady, M. E., Chione, A. M., and Armstrong, J. B.: Missing pieces in the full annual cycle of fish ecology: a systematic review of the phenology of freshwater fish research, bioRxiv [preprint], https://doi.org/10.1101/2020.11.24.395665, 2020. a
Brandl, S. J., Goatley, C. H. R., Bellwood, D. R., and Tornabene, L.: The hidden half: ecology and evolution of cryptobenthic fishes on coral reefs, Biol. Rev., 93, 1846–1873, https://doi.org/10.1111/brv.12423, 2018. a
Catalan, I. A., Dunand, A., Alvarez, I., Alos, J., Colinas, N., and Nash, R. D.: An evaluation of sampling methodology for assessing settlement of temperate fish in seagrass meadows, Mediterr. Mar. Sci., 15, 338, https://doi.org/10.12681/mms.539, 2014. a, b, c, d
Cattano, C., Calò, A., Di Franco, A., Firmamento, R., Quattrocchi, F., Sdiri, K., Guidetti, P., and Milazzo, M.: Ocean acidification does not impair predator recognition but increases juvenile growth in a temperate wrasse off CO2 seeps, Mar. Environ. Res., 132, 33–40, https://doi.org/10.1016/j.marenvres.2017.10.013, 2017. a
Cheminee, A., Pastor, J., Bianchimani, O., Thiriet, P., Sala, E., Cottalorda, J.-M., Dominici, J.-M., Lejeune, P., and Francour, P.: Juvenile fish assemblages in temperate rocky reefs are shaped by the presence of macro-algae canopy and its three-dimensional structure, Scientific Reports, 7, 14638, https://doi.org/10.1038/s41598-017-15291-y, 2017. a
Cheminee, A., Le Direach, L., Rouanet, E., Astruch, P., Goujard, A., Blanfune, A., Bonhomme, D., Chassaing, L., Jouvenel, J.-Y., Ruitton, S., Thibaut, T., and Harmelin-Vivien, M.: All shallow coastal habitats matter as nurseries for Mediterranean juvenile fish, Scientific Reports, 11, 14631, https://doi.org/10.1038/s41598-021-93557-2, 2021. a
Coll, M., Piroddi, C., Steenbeek, J., Kaschner, K., Ben Rais Lasram, F., Aguzzi, J., Ballesteros, E., Bianchi, C. N., Corbera, J., Dailianis, T., Danovaro, R., Estrada, M., Froglia, C., Galil, B. S., Gasol, J. M., Gertwagen, R., Gil, J., Guilhaumon, F., Kesner-Reyes, K., Kitsos, M.-S., Koukouras, A., Lampadariou, N., Laxamana, E., Lopez-Fe de la Cuadra, C. M., Lotze, H. K., Martin, D., Mouillot, D., Oro, D., Raicevich, S., Rius-Barile, J., Saiz-Salinas, J. I., San Vicente, C., Somot, S., Templado, J., Turon, X., Vafidis, D., Villanueva, R., and Voultsiadou, E.: The Biodiversity of the Mediterranean Sea: Estimates, Patterns, and Threats, PLOS ONE, 5, e11842, https://doi.org/10.1371/journal.pone.0011842, 2010. a
Conover, D. O.: Seasonality and the scheduling of life history at different latitudes, J. Fish Biol., 41, 161–178, https://doi.org/10.1111/j.1095-8649.1992.tb03876.x, 1992. a
Cuadros, A., Cheminee, A., Thiriet, P., Moranta, J., Vidal, E., Sintes, J., Sagrista, N., and Cardona, L.: The three-dimensional structure of Cymodocea nodosa meadows shapes juvenile fish assemblages at Fornells Bay (Minorca Island), Regional Studies in Marine Science, 14, 93–101, https://doi.org/10.1016/j.rsma.2017.05.011, 2017. a
Cuadros, A., Moranta, J., Cardona, L., Thiriet, P., Francour, P., Vidal, E., Sintes, J., and Cheminee, A.: Juvenile fish in Cystoseira forests: influence of habitat complexity and depth on fish behaviour and assemblage composition, Mediterr. Mar. Sci., 20, 380–392, https://doi.org/10.12681/mms.18857, 2019. a
Curtis, J. M. R. and Vincent, A. C. J.: Life history of an unusual marine fish: survival, growth and movement patterns of Hippocampus guttulatus Cuvier 1829, J. Fish Biol., 68, 707–733, https://doi.org/10.1111/j.0022-1112.2006.00952.x, 2006. a
Cushing, D. H.: Plankton Production and Year-class Strength in Fish Populations: an Update of the Match/Mismatch Hypothesis, in: Advances in Marine Biology, vol. 26, pp. 249–293, Elsevier, ISBN 978-0-12-026126-0, https://doi.org/10.1016/S0065-2881(08)60202-3, 1990. a
Dahlke, F. T., Wohlrab, S., Butzin, M., and Pörtner, H.-O.: Thermal bottlenecks in the life cycle define climate vulnerability of fish, Science, 369, 65–70, https://doi.org/10.1126/science.aaz3658, 2020. a
Daskalaki, E., Koufalis, E., Dimarchopoulou, D., and Tsikliras, A. C.: Scientific progress made towards bridging the knowledge gap in the biology of Mediterranean marine fishes, PLOS ONE, 17, e0277383, https://doi.org/10.1371/journal.pone.0277383, 2022. a
Diaz-Gil, C., Grau, A., Grau, A. M., Palmer, M., Cabrera, R., Jordà, G., and Catalan, I. A.: Changes in the juvenile fish assemblage of a Mediterranean shallow Posidonia oceanica seagrass nursery area after half century, Mediterr. Mar. Sci., 20, 603, https://doi.org/10.12681/mms.19510, 2019. a
Di Franco, A. and Guidetti, P.: Patterns of variability in early-life traits of fishes depend on spatial scale of analysis, Biol. Letters, 7, 454–456, https://doi.org/10.1098/rsbl.2010.1149, 2011. a, b
Di Franco, A., Calò, A., Pennetta, A., De Benedetto, G., Planes, S., and Guidetti, P.: Dispersal of larval and juvenile seabream: Implications for Mediterranean marine protected areas, Biol. Conserv., 192, 361–368, https://doi.org/10.1016/j.biocon.2015.10.015, 2015. a, b
Di Stefano, M., Legrand, T., Di Franco, A., Nerini, D., and Rossi, V.: Insights into the spatio‐temporal variability of spawning in a territorial coastal fish by combining observations, modelling and literature review, Fish. Oceanogr., 32, 70–90, https://doi.org/10.1111/fog.12609, 2022. a, b
Di Stefano, M., Nerini, D., Alvarez Ellacuria, I., Ardizzone, G., Astruch, P., Basterretxea, G., Blanfune, A., Bonhomme, D., Calò, A., Catalan, I., Cattano, C., Cheminee, A., Crec'Hriou, R., Cuadros, A., Di Franco, A., Diaz-Gil, C., Estaque, T., Faillettaz, R., Felix-Hackradt, F. C., Garcia-Charton, J. A., Guidetti, P., Guilloux, L., Harmelin, J.-G., Harmelin-Vivien, M., Hidalgo, M., Hinz, H., Irisson, J.-O., La Mesa, G., Le Direach, L., Lenfant, P., Macpherson, E., Matić-Skoko, S., Mercader, M., Milazzo, M., Monfort, T., Moranta, J., Muntoni, M., Murenu, M., Nunez, L., Olivar, M. P., Pastor, J., Perez-Ruzafa, a., Planes, S., Raventos, N., Richaume, J., Rouanet, E., Roussel, E., Ruitton, S., Sabates, A., Thibaut, T., Ventura, D., Vigliola, L., Vrdoljak, D., and Rossi, V.: Compilation of locations, larval durations and dates of spawning and settlement for coastal fishes in the Mediterranean Sea, SEANOE [data set], https://doi.org/10.17882/91148, 2023. a, b
Donelson, J. M., Sunday, J. M., Figueira, W. F., Gaitan-Espitia, J. D., Hobday, A. J., Johnson, C. R., Leis, J. M., Ling, S. D., Marshall, D., Pandolfi, J. M., Pecl, G., Rodgers, G. G., Booth, D. J., and Munday, P. L.: Understanding interactions between plasticity, adaptation and range shifts in response to marine environmental change, Philos. T. Roy. Soc. B, 374, 20180186, https://doi.org/10.1098/rstb.2018.0186, 2019. a
Druon, J.-N., Fiorentino, F., Murenu, M., Knittweis, L., Colloca, F., Osio, C., Merigot, B., Garofalo, G., Mannini, A., Jadaud, A., Sbrana, M., Scarcella, G., Tserpes, G., Peristeraki, P., Carlucci, R., and Heikkonen, J.: Modelling of European hake nurseries in the Mediterranean Sea: An ecological niche approach, Prog. Oceanogr., 130, 188–204, https://doi.org/10.1016/j.pocean.2014.11.005, 2015. a
Dubois, M., Rossi, V., Ser-Giacomi, E., Arnaud-Haond, S., Lopez, C., and Hernandez-Garcia, E.: Linking basin-scale connectivity, oceanography and population dynamics for the conservation and management of marine ecosystems: Large-scale connectivity and management of marine ecosystems, Global Ecol. Biogeogr., 25, 503–515, https://doi.org/10.1111/geb.12431, 2016. a, b, c, d
Edgar, G. J., Barrett, N. S., and Morton, A. J.: Biases associated with the use of underwater visual census techniques to quantify the density and size-structure of fish populations, J. Exp. Mar. Biol. Ecol., 308, 269–290, https://doi.org/10.1016/j.jembe.2004.03.004, 2004. a
Edgar, G. J., Stuart-Smith, R. D., Willis, T. J., Kininmonth, S., Baker, S. C., Banks, S., Barrett, N. S., Becerro, M. A., Bernard, A. T. F., Berkhout, J., Buxton, C. D., Campbell, S. J., Cooper, A. T., Davey, M., Edgar, S. C., Försterra, G., Galvan, D. E., Irigoyen, A. J., Kushner, D. J., Moura, R., Parnell, P. E., Shears, N. T., Soler, G., Strain, E. M. A., and Thomson, R. J.: Global conservation outcomes depend on marine protected areas with five key features, Nature, 506, 216–220, https://doi.org/10.1038/nature13022, 2014. a
Faillettaz, R., Voue, R., Crec’hriou, R., Garsi, L., Lecaillon, G., Agostini, S., Lenfant, P., and Irisson, J.: Spatio-temporal patterns of larval fish settlement in the northwestern Mediterranean Sea, Mar. Ecol. Prog. Ser., 650, 153–173, https://doi.org/10.3354/meps13191, 2020. a
Ferreira, A. S. A., Neuheimer, A. B., and Durant, J. M.: Impacts of the match-mismatch hypothesis across three trophic levels – a case study in the North Sea, ICES J. Mar. Sci., 80, 308–316, https://doi.org/10.1093/icesjms/fsac237, 2023. a
Fisher, N. I.: Statistical Analysis of Circular Data, Cambridge University Press, Cambridge, ISBN 978-0-521-56890-6, https://doi.org/10.1017/CBO9780511564345, 1993. a
Gaines, S. D., Gaylord, B., Gerber, L. R., Hastings, A., and Kinlan, B. P.: Connecting Places: The Ecological Consequences of Dispersal in the Sea, Oceanography, 20, 90–99, 2007. a, b
Garcia-Monteiro, S., Sobrino, J., Julien, Y., Sòria, G., and Skokovic, D.: Surface Temperature trends in the Mediterranean Sea from MODIS data during years 2003–2019, Regional Studies in Marine Science, 49, 102086, https://doi.org/10.1016/j.rsma.2021.102086, 2022. a
Giacomello, E. and Rasotto, M. B.: Sexual dimorphism and male mating success in the tentacled blenny, Parablennius tentacularis (Teleostei: Blenniidae), Mar. Biol., 147, 1221–1228, https://doi.org/10.1007/s00227-005-0023-4, 2005. a
Green, B. S. and Fisher, R.: Temperature influences swimming speed, growth and larval duration in coral reef fish larvae, J. Exp. Mar. Biol. Ecol., 299, 115–132, https://doi.org/10.1016/j.jembe.2003.09.001, 2004. a
Green, B. S., Mapstone, B. D., Carlos, G., Begg, G. A., and Nielsen, J. L., eds.: Tropical Fish Otoliths: Information for Assessment, Management and Ecology, in: Reviews: Methods and Technologies in Fish Biology and Fisheries, vol. 11, edited by: Green, B. S., Mapstone, B. D., Carlos, G., Begg, G. A., Springer Netherlands, Dordrecht, ISBN 978-1-4020-5775-5, https://doi.org/10.1007/978-1-4020-5775-5, 2009. a
Harmelin-Vivien, M. L., Harmelin, J.-G., Chauvet, C., Duval, C., Galzin, R., Lejeune, P., Barnabe, G., Blanc, F., Chevalier, R., Duclerc, J., and Lasserre, G.: Evaluation visuelle des peuplements et populations de poissons: methodes et problemes, Rev. Ecol. (Terre Vie), 40, 467–539, 1985. a, b
Harmelin-Vivien, M. L., Harmelin, J.-G., and Leboulleux, V.: Microhabitat requirements for settlement of juvenile sparid fishes on Mediterranean rocky shores, Hydrobiologia, 300/301, 309–320, 1995. a, b, c
Heino, M., Baulier, L., Boukal, D. S., Ernande, B., Johnston, F. D., Mollet, F. M., Pardoe, H., Therkildsen, N. O., Uusi-Heikkilä, S., Vainikka, A., Arlinghaus, R., Dankel, D. J., Dunlop, E. S., Eikeset, A. M., Enberg, K., Engelhard, G. H., Jørgensen, C., Laugen, A. T., Matsumura, S., Nussle, S., Urbach, D., Whitlock, R., Rijnsdorp, A. D., and Dieckmann, U.: Can fisheries-induced evolution shift reference points for fisheries management?, ICES J. Mar. Sci., 70, 707–721, https://doi.org/10.1093/icesjms/fst077, 2013. a
Hernández-Carrasco, I., López, C., Orfila, A., and Hernández-García, E.: Lagrangian transport in a microtidal coastal area: the Bay of Palma, island of Mallorca, Spain, Nonlin. Processes Geophys., 20, 921–933, https://doi.org/10.5194/npg-20-921-2013, 2013. a
Hidalgo, M., Kaplan, D. M., Kerr, L. A., Watson, J. R., Paris, C. B., and Browman, H. I.: Advancing the link between ocean connectivity, ecological function and management challenges, ICES J. Mar. Sci., 74, 1702–1707, https://doi.org/10.1093/icesjms/fsx112, 2017. a
Hidalgo, M., Rossi, V., Monroy, P., Ser‐Giacomi, E., Hernandez‐Garcia, E., Guijarro, B., Massuti, E., Alemany, F., Jadaud, A., Perez, J. L., and Reglero, P.: Accounting for ocean connectivity and hydroclimate in fish recruitment fluctuations within transboundary metapopulations, Ecol. Appl., 29, e01913, https://doi.org/10.1002/eap.1913, 2019. a, b
Kendall, A. W. J., Ahlstrom, E., and Moser, H. G.: Early Life Hisfory Stages of Fishes and Their Characters, Ontogeny and Systematics of Fishes – Ahlstrom Symposium, 8447, 11–22, https://swfsc-publications.fisheries.noaa.gov/publications/CR/1984/8447.PDF (last access: 25 August 2024), 1984. a, b, c
Kooijman, S.: Add my Pet portal [code], https://www.bio.vu.nl/thb/deb/deblab/add_my_pet/ (last access: 19 August 2024), 2009. a, b, c, d, e, f, g
Kooijman, S.: Metabolic acceleration in animal ontogeny: An evolutionary perspective, J. Sea Res., 94, 128–137, https://doi.org/10.1016/j.seares.2014.06.005, 2014. a
Kooijman, S. A., Lika, K., Augustine, S., Marn, N., and Kooi, B. W.: The energetic basis of population growth in animal kingdom, Ecol. Model., 428, 109055, https://doi.org/10.1016/j.ecolmodel.2020.109055, 2020. a, b
Kooijman, S. A. L. M.: Dynamic Energy Budget Theory for Metabolic Organisation, Third edition, Cambridge University Press, ISBN 978-0-521-13191-9, https://doi.org/10.1017/CBO9780511805400, 2010. a, b, c, d, e, f, g, h, i
Kooijman, S. A. L. M., Pecquerie, L., Augustine, S., and Jusup, M.: Scenarios for acceleration in fish development and the role of metamorphosis, J. Sea Res., 66, 419–423, https://doi.org/10.1016/j.seares.2011.04.016, 2011. a
Lagunes, M. J., Berline, L., Di Stefano, M., and Rossi, V.: Integrating Individual-Based Models to improve our understanding of the impacts of environmental conditions on fish early-life stages, Ecol. Model., submitted, 2024. a
Legrand, T., Di Franco, A., Ser-Giacomi, E., Calo, A., and Rossi, V.: A multidisciplinary analytical framework to delineate spawning areas and quantify larval dispersal in coastal fish, Mar. Environ. Res., 151, 104761, https://doi.org/10.1016/j.marenvres.2019.104761, 2019. a, b
Legrand, T., Chenuil, A., Ser-Giacomi, E., Arnaud-Haond, S., Bierne, N., and Rossi, V.: Spatial coalescent connectivity through multi-generation dispersal modelling predicts gene flow across marine phyla, Nat. Commun., 13, 5861, https://doi.org/10.1038/s41467-022-33499-z, 2022. a, b
Lejeusne, C., Chevaldonne, P., Pergent-Martini, C., Boudouresque, C. F., and Perez, T.: Climate change effects on a miniature ocean: the highly diverse, highly impacted Mediterranean Sea, Trends Ecol. Evol., 25, 250–260, https://doi.org/10.1016/j.tree.2009.10.009, 2010. a
Lester, S. E., Halpern, B. S., Grorud-Colvert, K., Lubchenco, J., Ruttenberg, B. I., Gaines, S. D., Airame, S., and Warner, R. R.: Biological effects within no-take marine reserves: a global synthesis, Mar. Ecol. Prog. Ser., 384, 33–46, https://doi.org/10.3354/meps08029, 2009. a
Lika, K., Kooijman, S. A., and Papandroulakis, N.: Metabolic acceleration in Mediterranean Perciformes, J. Sea Res., 94, 37–46, https://doi.org/10.1016/j.seares.2013.12.012, 2014. a
Lionello, P. and Scarascia, L.: The relation between climate change in the Mediterranean region and global warming, Reg. Environ. Change, 18, 1481–1493, https://doi.org/10.1007/s10113-018-1290-1, 2018. a
Liu, X., Dunne, J. P., Stock, C. A., Harrison, M. J., Adcroft, A., and Resplandy, L.: Simulating Water Residence Time in the Coastal Ocean: A Global Perspective, Geophys. Res. Lett., 46, 13910–13919, https://doi.org/10.1029/2019GL085097, 2019. a
Llopiz, J., Cowen, R., Hauff, M., Ji, R., Munday, P., Muhling, B., Peck, M., Richardson, D., Sogard, S., and Sponaugle, S.: Early Life History and Fisheries Oceanography: New Questions in a Changing World, Oceanography, 27, 26–41, https://doi.org/10.5670/oceanog.2014.84, 2014. a
Macpherson, E. and Raventos, N.: Relationship between pelagic larval duration and geographic distribution of Mediterranean littoral fishes, Mar. Ecol. Prog. Ser., 327, 257–265, https://doi.org/10.3354/meps327257, 2006. a, b, c, d
Marbà, N., Jordà, G., Agusti, S., Girard, C., and Duarte, C. M.: Footprints of climate change on Mediterranean Sea biota, Frontiers in Marine Science, 2, 56, https://doi.org/10.3389/fmars.2015.00056, 2015. a
Marques, G. M., Augustine, S., Lika, K., Pecquerie, L., Domingos, T., and Kooijman, S. A. L. M.: The AmP project: Comparing species on the basis of dynamic energy budget parameters, PLOS Comput. Biol., 14, e1006100, https://doi.org/10.1371/journal.pcbi.1006100, 2018. a, b, c
Marshall, D. J., Gaines, S. D., Warner, R. R., Barneche, D. R., and Bode, M.: Underestimating the benefits of marine protected areas for the replenishment of fished populations, Front. Ecol. Environ., 17, 407–413, https://doi.org/10.1002/fee.2075, 2019. a
Matić-Skoko, S., Vrdoljak, D., Uvanović, H., Pavičić, M., Tutman, P., and Bojanić Varezić, D.: Early evidence of a shift in juvenile fish communities in response to conditions in nursery areas, Scientific Reports, 10, 21078, https://doi.org/10.1038/s41598-020-78181-w, 2020. a
MedPAN and SPA/RAC: MAPAMED, the database of MArine Protected Areas in the MEDiterranean, 2019 edition, version 2, https://www.mapamed.org/ (last access: 19 August 2024), 2021. a
Mentges, A., Blowes, S. A., Hodapp, D., Hillebrand, H., and Chase, J. M.: Effects of site‐selection bias on estimates of biodiversity change, Conserv. Biol., 35, 688–698, https://doi.org/10.1111/cobi.13610, 2021. a
Mercader, M., Blazy, C., Di Pane, J., Devissi, C., Merciere, A., Cheminee, A., Thiriet, P., Pastor, J., Crec'hriou, R., Verdoit‐Jarraya, M., and Lenfant, P.: Is artificial habitat diversity a key to restoring nurseries for juvenile coastal fish? Ex situ experiments on habitat selection and survival of juvenile seabreams, Restor. Ecol., 27, 1155–1165, https://doi.org/10.1111/rec.12948, 2019. a
Mouine, N., Francour, P., Ktari, M.-H., and Chakroun-Marzouk, N.: Reproductive biology of four Diplodus species Diplodus vulgaris, D. annularis, D. sargus sargus and D. puntazzo (Sparidae) in the Gulf of Tunis (central Mediterranean), J. Mar. Biol. Assoc. UK, 92, 623–631, https://doi.org/10.1017/S0025315411000798, 2012. a
Myers, N., Mittermeier, R. A., Mittermeier, C. G., da Fonseca, G. A. B., and Kent, J.: Biodiversity hotspots for conservation priorities, Nature, 403, 853–858, https://doi.org/10.1038/35002501, 2000. a
Olivar, M. P., Sabates, A., Alemany, F., Balbin, R., Fernandez de Puelles, M. L., and Torres, A. P.: Diel-depth distributions of fish larvae off the Balearic Islands (western Mediterranean) under two environmental scenarios, J. Marine Syst., 138, 127–138, https://doi.org/10.1016/j.jmarsys.2013.10.009, 2014. a
Pankhurst, N. W. and Munday, P. L.: Effects of climate change on fish reproduction and early life history stages, Mar. Freshwater Res., 62, 1015, https://doi.org/10.1071/MF10269, 2011. a
Paris, C. B. and Cowen, R. K.: Direct evidence of a biophysical retention mechanism for coral reef fish larvae, Limnol. Oceanogr., 49, 1964–1979, https://doi.org/10.4319/lo.2004.49.6.1964, 2004. a
Pauly, D. and Pullin, R. S. V.: Hatching time in spherical, pelagic, marine fish eggs in response to temperature and egg size, Environ. Biol. Fish., 22, 261–271, https://doi.org/10.1007/BF00004892, 1988. a
Pepin, P., Robert, D., Bouchard, C., Dower, J. F., Falardeau, M., Fortier, L., Jenkins, G. P., Leclerc, V., Levesque, K., Llopiz, J. K., Meekan, M. G., Murphy, H. M., Ringuette, M., Sirois, P., and Sponaugle, S.: Once upon a larva: revisiting the relationship between feeding success and growth in fish larvae, ICES J. Mar. Sci., 72, 359–373, https://doi.org/10.1093/icesjms/fsu201, 2014. a
Pineda, J., Hare, J. A., and Sponaugle, S.: Larval Transport and Dispersal in the Coastal Ocean and Consequences for Population Connectivity, Oceanography, 20, 22–39, 2007. a
Raventos, N. and Macpherson, E.: Planktonic larval duration and settlement marks on the otoliths of Mediterranean littoral fishes, Mar. Biol., 138, 1115–1120, https://doi.org/10.1007/s002270000535, 2001. a
Raventos, N., Torrado, H., Arthur, R., Alcoverro, T., and Macpherson, E.: Temperature reduces fish dispersal as larvae grow faster to their settlement size, J. Anim. Ecol., 90, 1419–1432, https://doi.org/10.1111/1365-2656.13435, 2021. a, b
Rose, K. A., Holsman, K., Nye, J. A., Markowitz, E. H., Banha, T. N. S., Bednaršek, N., Bueno-Pardo, J., Deslauriers, D., Fulton, E. A., Huebert, K. B., Huret, M., Ito, S. I., Koenigstein, S., Li, L., Moustahfid, H., Muhling, B. A., Neubauer, P., Paula, J. R., Siddon, E. C., Skogen, M. D., Spencer, P. D., Van Denderen, P. D., Van Der Meeren, G. I., and Peck, M. A.: Advancing bioenergetics-based modeling to improve climate change projections of marine ecosystems, Mar. Ecol. Prog. Ser., 732, 193–221, https://doi.org/10.3354/meps14535, 2024. a
Rubio, A., Hernandez-Carrasco, I., Orfila, A., Gonzalez, M., Reyes, E., Corgnati, L., Berta, M., Griffa, A., and Mader, J.: Section 2.8: A Lagrangian approach to monitor local particle retention conditions in coastal areas, J. Oper. Oceanogr., 13, S1–S172, https://doi.org/10.1080/1755876X.2020.1785097, 2020. a
Soto-Navarro, J., Jorda, G., Amores, A., Cabos, W., Somot, S., Sevault, F., Macias, D., Djurdjevic, V., Sannino, G., Li, L., and Sein, D.: Evolution of Mediterranean Sea water properties under climate change scenarios in the Med-CORDEX ensemble, Clim. Dynam., 54, 2135–2165, https://doi.org/10.1007/s00382-019-05105-4, 2020. a
Spalding, M. D., Fox, H. E., Allen, G. R., Davidson, N., Ferdana, Z. A., Finlayson, M., Halpern, B. S., Jorge, M. A., Lombana, A., Lourie, S. A., Martin, K. D., McManus, E., Molnar, J., Recchia, C. A., and Robertson, J.: Marine Ecoregions of the World: A Bioregionalization of Coastal and Shelf Areas, BioScience, 57, 573–583, https://doi.org/10.1641/B570707, 2007. a
Suau, P. and Vives, F.: Contribucion al estudio del salmonete de fango (Mullus barbatus L.) del Mediterraneo occidental, Invest. Pesq., 9, 97–118, 1957. a
Teletchea, S. and Teletchea, F.: STOREFISH 2.0: a database on the reproductive strategies of teleost fishes, Database, 2020, baaa095, https://doi.org/10.1093/database/baaa095, 2020. a
Torrado, H., Mourre, B., Raventos, N., Carreras, C., Tintore, J., Pascual, M., and Macpherson, E.: Impact of individual early life traits in larval dispersal: A multispecies approach using backtracking models, Prog. Oceanogr., 192, 102518, https://doi.org/10.1016/j.pocean.2021.102518, 2021. a
Tsikliras, A. C., Antonopoulou, E., and Stergiou, K. I.: Spawning period of Mediterranean marine fishes, Rev. Fish Biol. Fisher., 20, 499–538, https://doi.org/10.1007/s11160-010-9158-6, 2010. a, b, c, d
Tsikliras, A. C., Dinouli, A., Tsiros, V.-Z., and Tsalkou, E.: The Mediterranean and Black Sea Fisheries at Risk from Overexploitation, PLOS ONE, 10, e0121188, https://doi.org/10.1371/journal.pone.0121188, 2015. a
Tyberghein, L., Verbruggen, H., Pauly, K., Troupin, C., Mineur, F., and De Clerck, O.: Bio-ORACLE: a global environmental dataset for marine species distribution modelling, Global Ecol. Biogeogr., 21, 272–281, https://doi.org/10.1111/j.1466-8238.2011.00656.x, 2012. a
van der Meer, J. and Kooijman, S. B. A.: Inference on energetics of deep-sea fish that cannot be aged: The case of the hagfish, J. Sea Res., 94, 138–143, https://doi.org/10.1016/j.seares.2014.07.007, 2014. a
Vasbinder, K. and Ainsworth, C.: Early life history growth in fish reflects consumption-mortality tradeoffs, Fish. Res., 227, 105538, https://doi.org/10.1016/j.fishres.2020.105538, 2020. a, b
Vigliola, L.: Contrôle et regulation du recrutement des Sparidae (Poissons, Teleosteens) en Mediterranee: importance des processus pre- et post-installation benthique, PhD thesis, Universite de la Mediterranee (Aix Marseille II), Centre d'Oceanologie de Marseille, https://theses.fr/1998AIX22082 (last access: 25 August 2024), 1998. a
Vigliola, L. and Harmelin-Vivien, M.: Post-settlement ontogeny in three Mediterranean reef fish species of the genus Diplodus, B. Mar. Sci., 68, 271–286, 2001. a, b, c
Vigo, M., Hermoso, V., Navarro, J., Sala-Coromina, J., Company, J. B., and Giakoumi, S.: Dynamic marine spatial planning for conservation and fisheries benefits, Fish Fish., 25, 630–646, https://doi.org/10.1111/faf.12830, 2024. a
von Bertalanffy, L.: A quantitative theory of organic growth: inquiries on growth laws II, Hum. Biol., 10, 181–213, 1938. a
White, J. W., Carr, M. H., Caselle, J. E., Washburn, L., Woodson, C. B., Palumbi, S. R., Carlson, P. M., Warner, R. R., Menge, B. A., Barth, J. A., Blanchette, C. A., Raimondi, P. T., and Milligan, K.: Connectivity, Dispersal, and Recruitment: Connecting Benthic Communities and the Coastal Ocean, Oceanography, 32, 50–59, https://doi.org/10.5670/oceanog.2019.310, 2019. a
Wilkinson, M. D., Dumontier, M., Aalbersberg, I. J., Appleton, G., Axton, M., Baak, A., Blomberg, N., Boiten, J.-W., da Silva Santos, L. B., Bourne, P. E., Bouwman, J., Brookes, A. J., Clark, T., Crosas, M., Dillo, I., Dumon, O., Edmunds, S., Evelo, C. T., Finkers, R., Gonzalez-Beltran, A., Gray, A. J., Groth, P., Goble, C., Grethe, J. S., Heringa, J., 't Hoen, P. A., Hooft, R., Kuhn, T., Kok, R., Kok, J., Lusher, S. J., Martone, M. E., Mons, A., Packer, A. L., Persson, B., Rocca-Serra, P., Roos, M., van Schaik, R., Sansone, S.-A., Schultes, E., Sengstag, T., Slater, T., Strawn, G., Swertz, M. A., Thompson, M., van der Lei, J., van Mulligen, E., Velterop, J., Waagmeester, A., Wittenburg, P., Wolstencroft, K., Zhao, J., and Mons, B.: The FAIR Guiding Principles for scientific data management and stewardship, Scientific Data, 3, 160018, https://doi.org/10.1038/sdata.2016.18, 2016. a
Wisz, M. S., Hijmans, R. J., Li, J., Peterson, A. T., Graham, C. H., Guisan, A., and NCEAS Predicting Species Distributions Working Group: Effects of sample size on the performance of species distribution models, Divers. Distrib., 14, 763–773, https://doi.org/10.1111/j.1472-4642.2008.00482.x, 2008. a