the Creative Commons Attribution 4.0 License.
the Creative Commons Attribution 4.0 License.
 | 27 Aug 2024
Generation of global 1 km all-weather instantaneous and daily mean land surface temperatures from MODIS data
Bing Li
Guanpeng Dong
Xiaobang Liu
Yufang Zhang
Land surface temperature (LST) serves as a crucial variable in characterizing climatological, agricultural, ecological, and hydrological processes. Thermal infrared (TIR) remote sensing provides high temporal and spatial resolutions for obtaining LST information. Nevertheless, TIR-based satellite LST products frequently exhibit missing values due to cloud interference. Prior research on estimating all-weather instantaneous LST has predominantly concentrated on regional or continental scales. This study involved generating a global all-weather instantaneous and daily mean LST product spanning from 2000 to 2020 using XGBoost. Multisource data, including Moderate-Resolution Imaging Spectroradiometer (MODIS) top-of-atmosphere (TOA) observations, surface radiation products, and reanalysis data, were employed. Validation using an independent dataset of 77 individual stations demonstrated the high accuracy of our products, yielding root mean squared errors (RMSEs) of 2.787 K (instantaneous) and 2.175 K (daily). The RMSE for clear-sky conditions was 2.614 K for the instantaneous product, which is slightly lower than the cloudy-sky RMSE of 2.931 K. Our instantaneous and daily mean LST products exhibit higher accuracy compared to the MODIS official LST product (instantaneous RMSE = 3.583 K; daily 3.105 K) and the land component of the fifth generation of the European ReAnalysis (ERA5-Land) LST product (instantaneous RMSE = 4.048 K; daily 2.988 K). Significant improvements are observed in our LST product, notably at high latitudes, compared to the official MODIS LST product. The LST dataset from 2000 to 2020 at the monthly scale, the daily mean LST on the first day of 2010 can be freely downloaded from https://doi.org/10.5281/zenodo.4292068 (Li et al., 2024), and the complete product will be available at https://glass-product.bnu.edu.cn/ (last access: 22 August 2024).
- Article
(17369 KB) - Full-text XML
- BibTeX
- EndNote


Land surface temperature (LST) is the skin temperature of the Earth's surface and one of the crucial parameters in the surface energy balance and the hydrothermal cycle (Tomlinson et al., 2011; Bastiaanssen et al., 1998). LST retrieval from in situ measurements or satellites are widely used in many scientific fields (Kappas and Phan, 2018), such as climate change (Weng, 2009; Auger et al., 2021), urban heat islands (Zhou et al., 2018), drought monitoring (Wan et al., 2010), longwave radiation estimation (Cheng and Liang, 2016), evapotranspiration (Kalma et al., 2008), soil moisture estimation (Zhang et al., 2015), and air temperature estimation (Rao et al., 2019; Shen et al., 2020; Chen et al., 2021). High-precision measurements of LST aid in the recording of the long-term global temperature trends; thus, the International Geosphere–Biosphere Programme (IGBP) lists it as one of its priority parameters (Townshend et al., 2007). Owing to the complex and rapid variation in temporal and spatial scales, in situ measurements cannot provide regional LST or capture the spatial variation in LST. Remote sensing has become the only way to obtain LST with high spatial and temporal resolution on regional to global scales (Li et al., 2013).
Over the past few decades, substantial advancements have been made in the LST retrieval from remote sensing satellites. The retrieval of satellite LST products is predominantly accomplished using thermal infrared (TIR) remote sensing data (Li et al., 2013). These LST products typically exhibit a notable spatial resolution, which is exemplified by the Visible Infrared Imaging Radiometer Suite (VIIRS) boasting a resolution of 750 m, the Advanced Very High Resolution Radiometer (AVHRR) having a resolution of 0.05° (J. Ma et al., 2020; J. Li et al., 2023a), and the Moderate-Resolution Imaging Spectroradiometer (MODIS) satellite sporting a resolution of 1 km (Wan and Li, 1997; Wan, 2014). Nevertheless, due to the constrained penetration capability of thermal radiation, TIR data are exclusively applicable to observing LST under clear-sky conditions. Global average annual cloud coverage has been reported to exceed 70 % (Mercury et al., 2012). The lack of data has significantly constrained the application of LST products. Consequently, all-weather LST estimation is one of the difficulties in need of an urgent solution.
Besides data gaps due to cloud contamination, extending the temporal scale of LST poses a significant challenge in retrieving LST remote sensing products, requiring urgent attention. LST, a dynamic physical attribute, exhibits temporal variation. However, satellite-derived LST captures only instantaneous observations at specific times and angles. Instead of focusing solely on instantaneous LST, certain researchers emphasize the importance of daily, monthly, or yearly average LST to track the impact of increasing LST on glaciers, ice sheets, and vegetation within the Earth's ecosystem (Lawrimore et al., 2011). Currently, for MODIS LST products, there exist daily instantaneous L2 products, daily gridded instantaneous L3 products, and 8 d synthetic products (Wan, 2014). Nevertheless, there's an absence of L4 products encompassing daily mean, monthly, and annual LST data. Hence, estimating the daily mean LST based on limited MODIS observations holds significant importance. Acquiring the daily mean LST allows for the estimation of monthly or annual mean LST, which is crucial for prolonged monitoring across diverse research domains like climate change, agriculture, and drought studies.
As for filling LST gaps under cloudy-sky conditions, researchers have explored various methods (Z. L. Li et al., 2023). One type of approach is based on space–time information, such as interpolation and fusion methods (Pede and Mountrakis, 2018). Interpolation methods usually utilize temporally or spatially proximate clear-sky pixel information to fill in the pixels under cloudy-sky conditions. Nevertheless, the efficacy of the interpolation method is contingent on the accessibility of clear-sky pixels. The reconstruction outcomes prove less satisfactory in instances of extensive missing regions or prolonged periods of cloud cover (Metz et al., 2014; Zhang et al., 2018, 2022). In recent years, spatiotemporal fusion methods have been explored for obtaining all-weather LST (Chen et al., 2015; Long et al., 2020; Wu et al., 2021). The essence of spatiotemporal fusion for LST involves deriving high-spatial-resolution LST at time t0 from its counterpart with coarse spatial resolution at the identical time instance, achieved through the application of a scale conversion factor (Long et al., 2020; Wu et al., 2021). Due to the algorithm's complexity, fusion methods are commonly evaluated within limited geographical scopes, with their applicability constrained when extended to larger areas. Furthermore, both interpolation and spatiotemporal fusion methods hinge on information derived from clear-sky pixels, yielding reconstructed theoretical clear-sky LST rather than the real cloudy-sky LST. In order to obtain the actual LST under cloudy-sky conditions, one type of approach considers the physical processes of the surface energy balance (SEB). Jin and Dickinson (2000) introduced a method utilizing SEB to account for the effect of changes in solar radiation on LST during cloudy conditions. This approach corrects clear-sky LST using the SEB equation to derive actual cloudy-sky LST. Over time, the SEB-based method has been refined for geostationary satellites (Jia et al., 2022; Zhang et al., 2024; Liu et al., 2023) and MODIS data (Yu et al., 2014; Zeng et al., 2018; Jia et al., 2021). However, widespread application is limited due to gaps in data coverage and the necessity of meteorological SEB parameters (e.g., air temperature and wind speed), which make obtaining accurate data on a large scale challenging.
Apart from the mentioned methods for LST retrieval under cloudy-sky conditions, alternative approaches utilize all-weather data like microwave data, reanalysis data, or model simulations to derive the cloudy-sky information. Passive microwave (PMW) data are less affected by cloud contamination, providing a possibility for all-weather LST estimations (Duan et al., 2017b; Holmes et al., 2009). However, the existing microwave observations usually have coarse resolutions (e.g., the Advanced Microwave Scanning Radiometer for EOS, AMSR-E, with 25 km). Since the land surface microwave emissivity is sensitive to land surface characteristics and difficult to measure, the accuracy of the PMW LST data is relatively lower than that of TIR LST (McFarland et al., 1990). In addition, PMW data basically have swath gaps, especially at low latitudes, which makes it difficult to obtain full-coverage LST data (Holmes et al., 2009; Zhou et al., 2015). Thus, LST retrieval from PMW data cannot satisfy the requirements of high precision and refined applications. Some scholars have explored the possibility of combining PMW and TIR data to estimate the all-weather LST. These methods perform well on regional or national scales (Xu and Cheng, 2021; Duan et al., 2017b; Zhang et al., 2020; Wu et al., 2022). However, owing to the availability of PMW data and the complexity of algorithms, it is difficult to achieve long-term production on a global scale.
In comparison, reanalysis data can provide another way for all-weather LST estimation, with all-weather observations and long-term and seamless characteristics. After updating of reanalysis and modeled data, spatial resolution and accuracy are improved (Muñoz-Sabater et al., 2021). Several studies, which were well implemented on the regional scale, have attempted to utilize reanalysis data combined with TIR (Long et al., 2020; Zhang et al., 2021; Tang et al., 2024) and PMW data (Zhang et al., 2020; Zhou et al., 2022) to obtain the all-weather LST. In recent years, researchers have a growing interest in the estimation of global all-weather LST. Shiff et al. (2021) integrated modeled temperature data to supplement missing values in MODIS LST using Google Earth Engine (GEE). Nevertheless, the proposed approach solely addressed missing pixels, potentially introducing border effects. Globally, continuous spatiotemporal LST data at a resolution of 0.05° have been generated, rectifying reconstructed missing data under cloudy-sky conditions using reanalysis data (Yu et al., 2022). Additionally, global seamless 8 d and monthly average LST data featuring a 30 arcsec resolution were created by integrating reanalysis data (Yao et al., 2023). These studies confirm the potential of reanalysis data for estimating the all-weather LST, yet there remains ample room for exploration at a spatiotemporal scale of 1 km d−1.
Regarding daily mean LST, researchers have investigated acquiring it from polar-orbiting satellites. Specifically, they have employed MODIS instantaneous LSTs to estimate the daily mean LST (Williamson et al., 2014; Xing et al., 2021). The maximum–minimum method determined the daily mean LST by averaging its maximum and minimum values, exhibiting a strong correlation with the surface air temperature (Williamson et al., 2014). Despite its relatively low accuracy, it presents a straightforward means of estimating daily mean LST using the limited observations from polar-orbiting satellites. Another approach involves the diurnal temperature cycle (DTC), which employs various nonlinear models based on heat conduction and energy balance equations (Inamdar et al., 2008; Duan et al., 2012; Sun and Pinker, 2005; Aires et al., 2004) and is capable of retrieving daily mean LST. However, the DTC method requires specific satellite observation counts within a daily cycle, which is an existing challenge for all-weather daily mean LST retrieval and especially for polar-orbiting satellites. Hong et al. (2021) proposed a framework which combines the annual temperature cycle (ATC) and DTC to retrieve the all-weather daily mean LST at a spatial resolution of 0.5° × 0.5° (Hong et al., 2022). Xing et al. (2021) utilized global in situ measurements and multiple linear regression to enhance the MODIS daily mean LST model accuracy under clear-sky conditions. Then, J.-H. Li et al. (2023b) integrated pre-2000 polar-orbiting satellite data to improve the global daily mean LST model. Most methods mentioned are applicable exclusively under clear-sky conditions, and all-weather estimation remains a challenge. Besides, the sine or cosine assumed in the DTC and the multiple linear regression equations may not necessarily fit the relationship between instantaneous observations and daily mean value. Thus, more appropriate relational models need to be constructed. The main limitation of MODIS daily mean LST estimation has been its restricted observations. Swath-type MODIS data can provide more observations, which potentially improves the accuracy, but few researchers have attempted. Obtaining the all-weather daily mean LST from polar-orbiting satellite observations (e.g., MODIS), particularly on a global scale with a 1 km spatial resolution, still remains a significant challenge.
Recently, machine learning and deep learning techniques have gained significant traction in remote sensing due to their superior model-fitting capabilities (Ma et al., 2019; Yuan et al., 2020). Scholars have investigated LST retrieval using different learning techniques across various satellite platforms (Mao et al., 2018; Li et al., 2021; Ma et al., 2024). However, the majority of these methods utilized clear-sky pixels as the true value to construct the model, possibly failing to capture the relationship under cloudy-sky conditions. Additionally, learning methods have not yet been applied in the estimation of the daily mean LST. Our former research has estimated the all-weather LST from MODIS data using a random forest (RF) algorithm over the conterminous United States (Li et al., 2021). Considering the urgency of obtaining the all-weather LST on a global scale and expanding the daily mean timescale, this study refined our previously developed algorithm for an all-weather instantaneous LST product and developed a new method for a daily mean LST product on a global scale. The improvements over our previous study include (1) more sufficient information (MODIS top-of-atmosphere (TOA) information was taken into account), (2) expanding the estimated LST timescale (a novel algorithm was proposed to estimate both instantaneous and daily mean LST), and (3) higher-efficiency algorithm and larger region (the global all-weather LST products were generated).
The rest of the paper is organized as follows. Section 2 describes the data used in this paper. Section 3 provides a summary of the proposed method. The results are presented in Sect. 4. A discussion part is presented in Sect. 5. Section 6 is the data availability. Finally, Sect. 7 presents the conclusions.
In this study, the remote sensing data, reanalysis data, and in situ measurements from 2002–2018 were used to construct all-weather LST models. These data, spanning 2000 to 2020, along with the developed models were used to generate the instantaneous and daily mean LST products. In situ measurements validated the accuracy of the proposed algorithm and the generated products. The data used are described in detail in the sections that follow.
2.1 Remotely sensed and reanalysis data
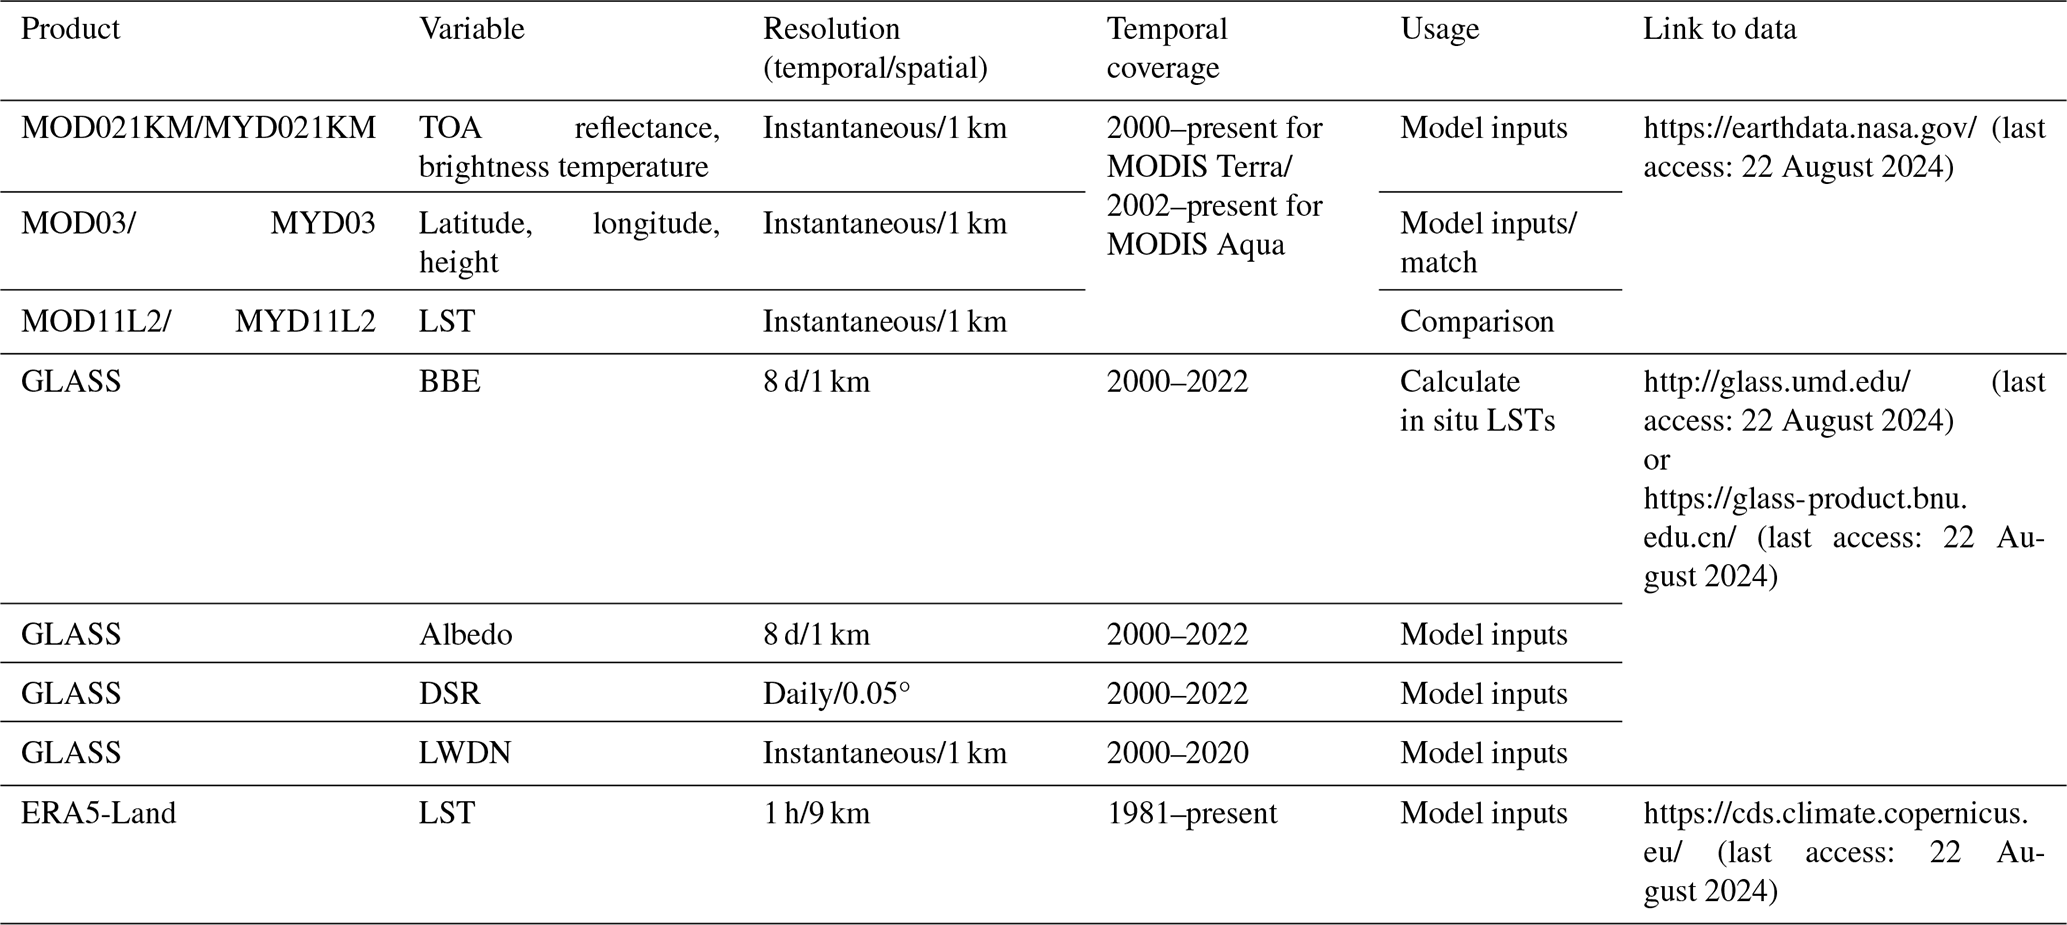
The remote sensing data and reanalysis data used in this study are summarized in Table 1. Among them, remote sensing data are mainly from official MODIS products and the Global LAnd Surface Satellite (GLASS) product suite. MOD021KM and MYD021KM are MODIS TOA observational datasets. The shortwave bands (B1–B7 and B19) and longwave bands (B27–B36) were selected as model inputs. Geolocation information was obtained from MODIS geolocation data (MOD03 and MYD03). The coordinates from MODIS geolocation data were used to match up with products and in situ measurements, while height, solar zenith angle, solar azimuth angle, view zenith angle, and view azimuth angle were used as the model inputs. MODIS LST (MOD11L2/MYD11L2) was used for the comparison and identification of cloudy-sky conditions. The GLASS product suite includes at least 12 land surface variables, which have high spatial resolutions (1 km and 0.05°), long-term temporal coverage (1981–present), spatial continuity, and high quality (Liang et al., 2021, 2013). In this study, we used the following four products from the GLASS product suite: broadband emissivity (BBE), broadband albedo (albedo), downward solar radiation (DSR), and surface downwelling longwave radiation (LWDN). The BBE product was used to obtain in situ LST (Cheng and Liang, 2013). The albedo was used as the model input to describe surface characteristics (Qu et al., 2014; Q. Liu et al., 2013; Qu et al., 2016). Because LST is affected by both solar radiation and surface longwave radiation, DSR and LWDN were also used in the model construction (Cheng et al., 2017; Zhang et al., 2019).
In recent years, an enhanced global dataset for the land component of the fifth generation of the European ReAnalysis (ERA5-Land) product has been in development (Muñoz-Sabater et al., 2021; Hersbach et al., 2020). ERA5-Land describes a consistent long-term evolution of water and energy cycles over land. It was generated through global high-resolution numerical integrations of the European Centre for Medium-Range Weather Forecasts (ECMWF) land surface model driven by the downscaled meteorological forcing from the ERA5 climate reanalysis. Compared with the previous ERA-Interim (80 km) and ERA (31 km) products, ERA5-Land has a higher spatial resolution (9 km) and temporal resolution (1 h). Because ERA5-Land LST includes worldwide and all-weather data, it was used in the model construction as the background value and also for comparison. ERA5-Land LST is hereafter referred to as ERA LST.
2.2 In situ measurements
To obtain in situ LSTs, we collected upwelling and downwelling longwave radiation measurements from 315 sites with different land cover types and geolocations on a global scale. Both instantaneous and daily mean in situ LSTs were retrieved from in situ measurements. As shown in Fig. 1, ground measurements from 238 stations were used to develop the proposed model (blue circles), whereas the measurements from the remaining 77 stations (red circles) were selected as part of an independent validation dataset to evaluate the performance of the trained model. The collection sites were mainly taken from eight observation networks, which are described in the following paragraphs.
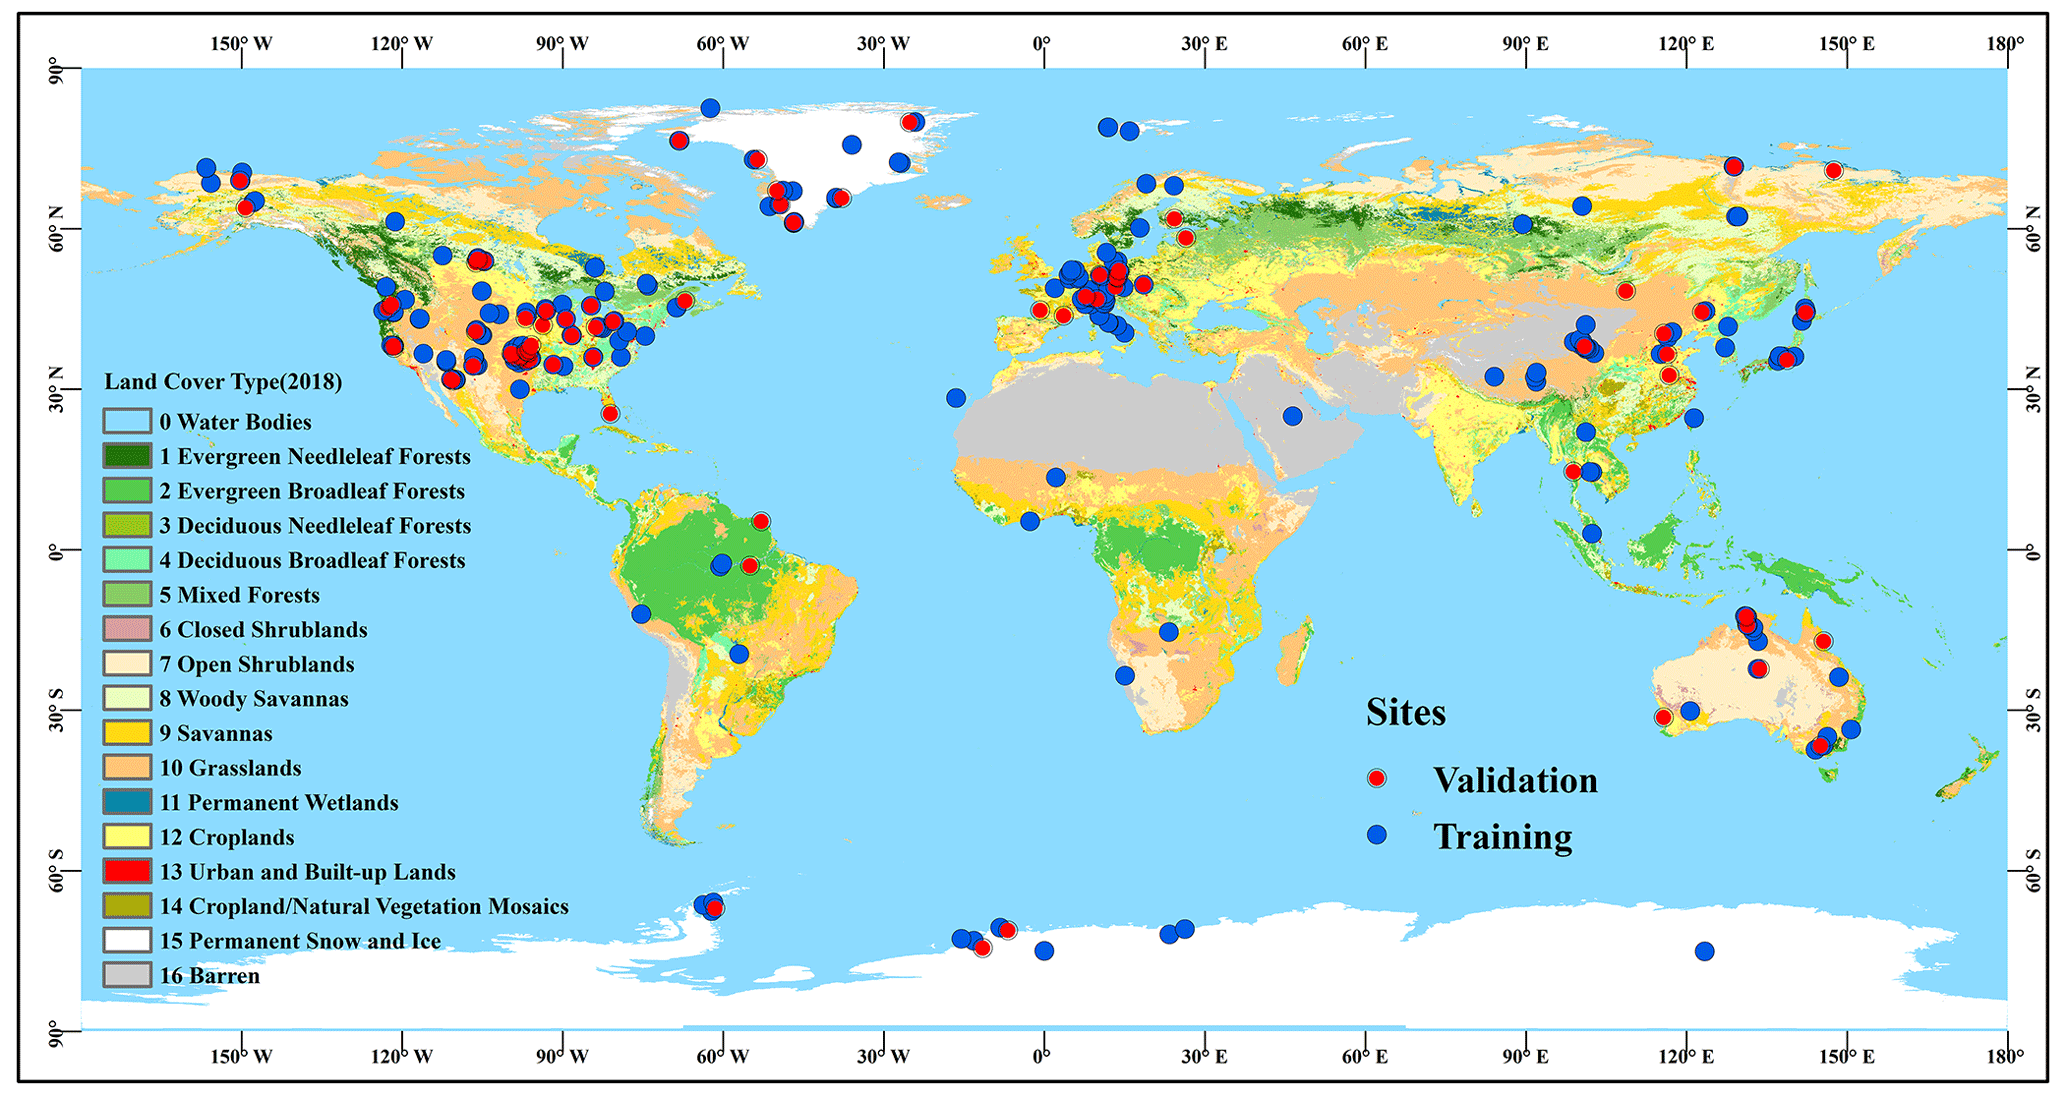
Figure 1Spatial distribution of the selected sites on a global scale. Land use cover types of 2018 (background color shading) were from the MODIS land use cover product MCD12C1. The sites used for model training are shown in blue circles while the separated validation sites are shown in red circles.
AmeriFlux (https://ameriflux.lbl.gov/, last access: 22 August 2024) is a network of stations that continuously measures ecosystem carbon dioxide, water, energy fluxes, and related environmental variables using eddy covariance techniques (Baldocchi, 2003). The network was launched in 1996 and was established to connect research at field sites representing major climate and ecological biomes. The network has more than 260 past and present flux towers, and sites with longwave radiation measurements were selected. These sites are distributed across North, Central, and South America. The observation interval of these sites was 0.5 h.
FLUXNET (https://fluxnet.org/, last access: 22 August 2024) is a global network of micrometeorological tower sites that uses eddy covariance methods to measure carbon dioxide, water vapor, and energy fluxes (Baldocchi et al., 2001). It has more than 500 flux towers worldwide that operate on a long-term basis. The overarching goal of the FLUXNET data collection is to provide information for the validation of remote sensing products, such as net primary productivity and energy fluxes. Sites with longwave radiation records were used in this study. The observation interval of the sites was 0.5 h.
The Baseline Surface Radiation Network (BSRN; https://bsrn.awi.de/, last access: 22 August 2024) is a project of the Data and Analysis Panel of the Global Energy and Water Exchanges (GEWEX) under the umbrella of the World Climate Research Programme (WCRP) (Ohmura et al., 1998). The purpose of this network is to provide validation materials for satellite radiometry and climate models. It further aims to detect long-term variations in the radiation field at the Earth's surface, which play a vital role in climate change (Driemel et al., 2018). The stations (currently 74 in total, of which 58 are active) are distributed in contrasting climatic zones, covering a latitude range from 80° N to 90° S. The required longwave radiation measurements were obtained with high accuracy and at a high time resolution (1–3 min).
AsiaFlux (https://www.asiaflux.net/, last access: 22 August 2024) is a scientific community with the aim of developing collaborative research and datasets on carbon, water, and energy cycles in key Asian ecosystems. AsiaFlux has grown from beings a small network in 1999 to a multi-national science community with more than 400 members from 28 countries (Yamamoto, 2005). Currently, there are 109 flux towers in Asia, and more sites are underway. The biomes covered in AsiaFlux range from rainforests near the Equator to tundras in the Arctic and Antarctic and from wetlands near the sea level to grasslands at high altitudes, such as the Tibetan Plateau. Most sites have a time resolution of 0.5 h, while 15 min and 1 h are used for individual sites.
The Atmospheric Radiation Measurement (ARM; https://www.arm.gov/, last access: 22 August 2024) program, supported by the US Department of Energy, is a project for atmospheric measurement and modeling. The purpose of the project was to detect processes that affect atmospheric radiation and describe these processes in climate models (Stokes and Schwartz, 1994). The quantities measured at these stations included longwave and shortwave radiation, cloud properties, water vapor, other radiation-related quantities, and meteorological variables. These sites had the high temporal resolution of 1 min.
The Ice and Climate group at the Institute for Marine and Atmospheric Research of Utrecht University (UU/IMAU, https://www.projects.science.uu.nl/iceclimate/, last access: 22 August 2024) has deployed several automatic weather stations (AWSs) on different glaciers around the world (Antarctica, Greenland, Alps, Norway, Iceland, and Svalbard) and in different climate regimes. The stations were designed to operate on a long-term basis and measure meteorological and radiation variables in remote regions under harsh weather conditions. The main purpose of these stations is to detect the energy balance in these regions in view of climate change and sea-level variation. The stations from the IMAU project have time resolutions of 1 and 2 h.
Denmark launched the Programme for Monitoring of the Greenland Ice Sheet (PROMICE; https://www.promice.dk/, last access: 22 August 2024) to detect variations in the mass balance of the Greenland ice sheet. Several weather stations were established on the ice sheet to provide filed data for modeling and validation. The weather stations were equipped with CNR1 or CNR4 instruments to measure radiation data with a time resolution of 10 min.
The National Tibetan Plateau Data Center (TPDC; http://data.tpdc.ac.cn, last access: 22 August 2024) has integrated and released various scientific data from the Qinghai–Tibet Plateau and surrounding regions. Integrated data resources include the atmosphere, cryosphere, hydrosphere, and energy balance. Among these data sources, there are various published ground measurements. We selected several stations in the Heihe Basin (Liu et al., 2018), Haihe Basin (S. M. Liu et al., 2013), and Qinghai–Tibet Plateau (Y. Ma et al., 2020). The time resolutions of these stations were 10 min, 30 min, and 1 h, respectively.
Some stations from various flux networks overlapped, and we curated observations with extended time series and enhanced the time resolution. Attaining high model accuracy necessitates superior in situ measurements, which requires rigorous quality assessment. Initially, adjacent stations that potentially cause interference were removed alongside the manual elimination of anomalous observations and discontinuous measurements. Subsequently, the collection sites were strategically dispersed globally. Figure 2 depicts a histogram illustrating the distribution of land cover types and climate zones across the sites. Each land cover type was accounted for, and additional sites encompassing waterbodies were incorporated to estimate LST for inland water. The stations were dispersed across five distinct climate zones, with a higher concentration in temperate and continental climates. What is also important is that we meticulously gathered data from numerous high-latitude stations within a polar climate to address substantial estimation uncertainties in the area.
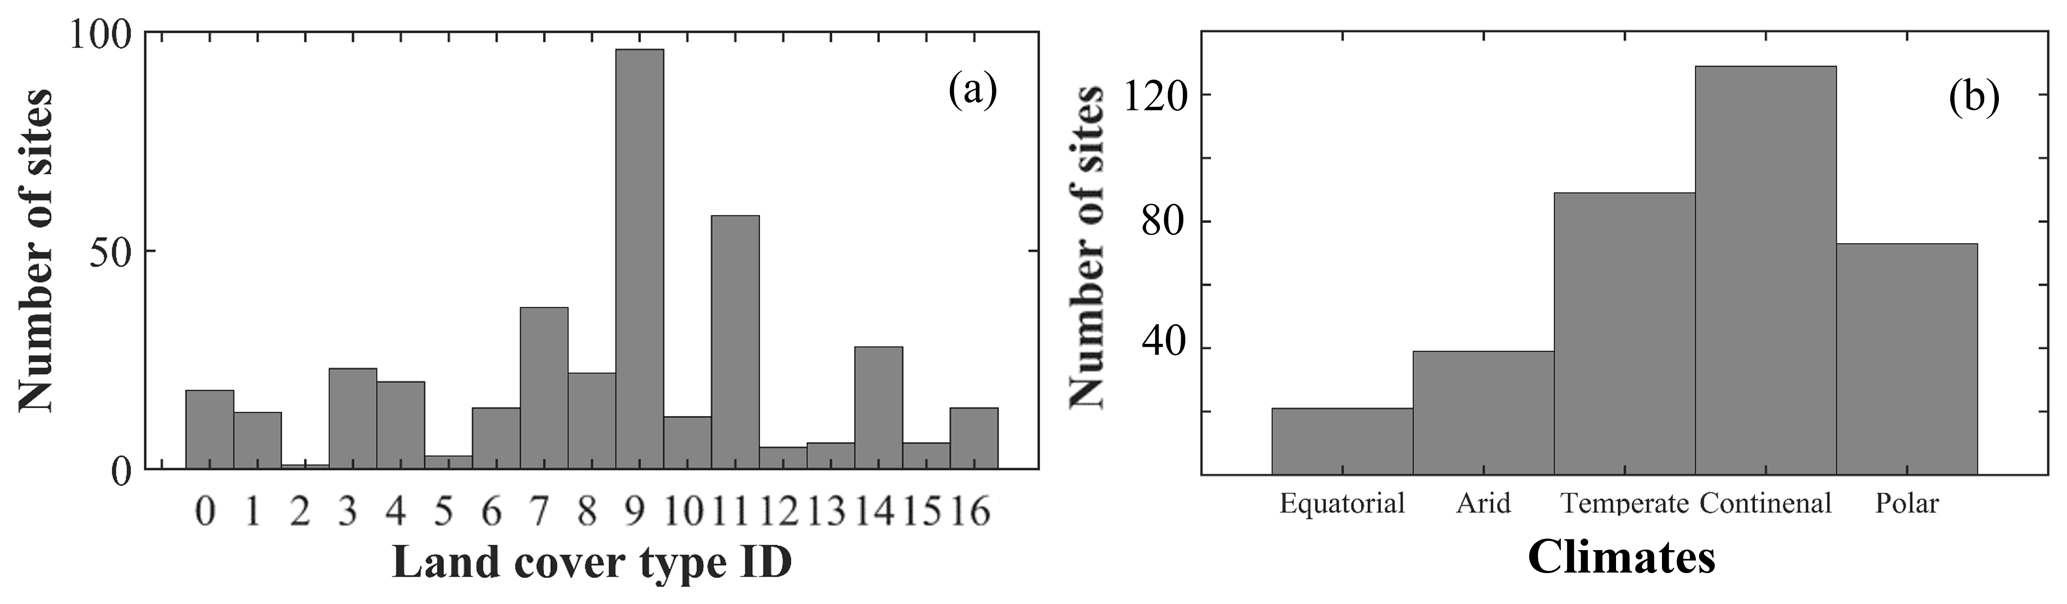
Figure 2Land cover types (a) and climate zones (b) of sites. The land surface type represented by the x axis in panel (a) refers to the legend in Fig. 1.
The study's comprehensive framework is depicted in Fig. 3. Initially, the in situ LST and remote sensing data underwent preprocessing and pairing. Subsequently, the data pairs were randomly divided into two segments: one for model training and validation, while the other served as an independent dataset for model evaluation. The XGBoost algorithm was employed to sequentially develop models for instantaneous and daily mean LST while also conducting parameter tuning. The estimated all-weather instantaneous LST served as an input for the daily mean LST model. Ultimately, the optimal models underwent separate evaluation and comparison with alternative products.
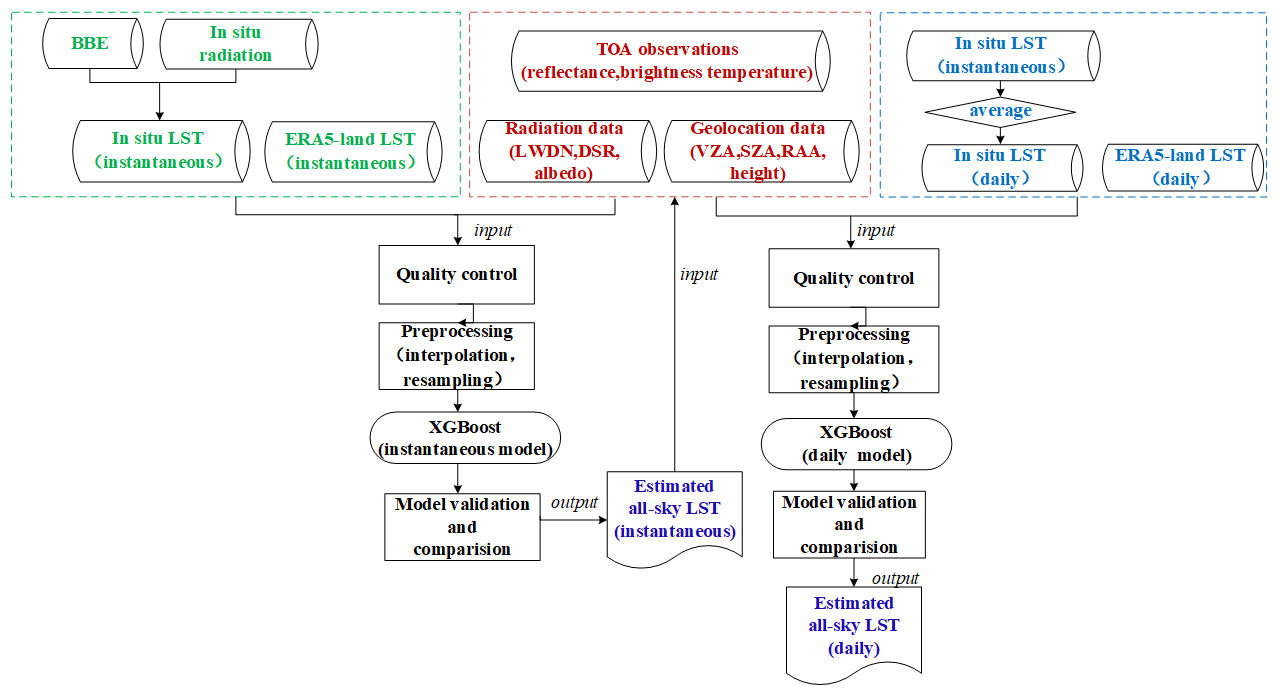
Figure 3Flowchart of the XGBoost algorithm for all-weather instantaneous and daily mean LST estimation.
3.1 Data preprocessing
3.1.1 In situ instantaneous LST
The in situ LST in this study was calculated from surface broadband emissivity and in situ upwelling and downwelling longwave radiation according to Stefan–Boltzmann's law as follows:
where TS represents the in situ LST, Fup is the upwelling longwave radiation, Fdn is the downwelling longwave radiation, ε is surface broadband emissivity, and σ is the Stefan–Boltzmann constant ( W m−2 K−4).
Surface broadband emissivity was acquired from the GLASS BBE product through nearest-neighbor interpolation to derive daily values. Fup and Fdn were derived from in situ measurements. Due to varying observation intervals across different networks, spanning from 1 min to 1 h, a linear interpolation method was applied to determine the in situ LST corresponding to the MODIS satellite observation time.
3.1.2 Daily mean LST
To construct a daily mean LST model, the in situ daily mean LST and ERA daily mean LST are required. Once the instantaneous LST from in situ measurements was obtained, the daily mean in situ LST was calculated according to Eq. (2). The ERA daily mean LST was obtained using Eq. (3).
LSTDS and LSTDE represent the daily mean in situ LST and ERA daily mean LST, respectively, and n is the count of the in situ measurements per day. LSTIS and LSTIE are the instantaneous in situ LST values calculated from Eq. (1) and ERA LST, respectively. If the in situ measurements were incomplete in a day, the record for that day was not used.
One traditional daily mean LST method, which was retrieved from the official MODIS Aqua LST data for both daytime and nighttime (Williamson et al., 2014), was used for comparison. The retrieval equation can be expressed as follows:
where LSTDM represents the retrieval of the daily mean LST, and LSTAD and LSTAN represent the daytime and nighttime LSTs, respectively, from the official MODIS Aqua LST data.
3.1.3 Data normalization
Due to discrepancies in spatial and temporal resolutions among the utilized products, preprocessing was conducted. The albedo and BBE had an 8 d temporal resolution, and the daily data were acquired through nearest-neighbor interpolation. DSR and ERA LST were adjusted to a spatial resolution of 1 km via the nearest-neighbor interpolation. The ERA LST, with a temporal resolution of 1 h, was linearly interpolated to obtain the reanalysis LST at the satellite observation time. Matching between in situ measurements and satellite data was performed based on coordinates from MOD03/MYD03 products.
3.2 Developing the estimation algorithm
Extreme gradient boosting (XGBoost) is an effective and scalable gradient boosting implementation introduced by Chen and Guestrin (2016). It amalgamates multiple classification and regression trees to create a robust learner. In regression, the initial tree is constructed based on split features, which is then followed by the creation of subsequent trees to capture residuals from the preceding ones. Additional trees are iteratively generated until they meet the stopping criteria. Notably, the regression trees within XGBoost are interrelated, progressively diminishing the residuals of predictions with new trees. The ultimate prediction is derived by aggregating scores from each tree.
In contrast to the RF method, which also employs decision trees (Breiman, 2001), XGBoost operates in parallel. Its algorithm design incorporates column blocks for parallel learning and cache-aware access and facilitates out-of-core computation, substantially boosting computational efficiency. Owing to XGBoost's notable efficiency and precision, many studies in remote sensing have adopted this algorithm for regression tasks (Liu et al., 2021; Kim et al., 2021; Zhang et al., 2023). In this research, XGBoost was implemented using the scikit-learn package in Python. Experiments were performed on a computer equipped with a 3.60 GHz CPU and 64 GB RAM, utilizing the same dataset and features. Detailed hyperparameters are elucidated in Sect. 3.3.
3.3 Model development
The dataset for 2002–2018 was compiled on a global scale. Samples from 238 sites were randomly chosen for model training. The remaining samples from 77 sites were used as an independent dataset for the model validation. The features used to construct the instantaneous LST model included MODIS TOA observations, ERA LST, DSR, LWDN, albedo, and geolocation data. MODIS TOA observations were used to describe the contributions of shortwave and longwave radiation to the LST. Additionally, solar radiation greatly changes influenced by clouds. Hence, DSR was used to reflect the effect of solar radiation on the LST (Zeng et al., 2018). Longwave radiation is less affected by the atmosphere, has certain penetration, and has a close correlation and interaction with the LST during the daytime and nighttime. In this study, LWDN was used to reflect the effect of thermal infrared radiation on LST. LST is also influenced by land cover types, and broadband albedo was used to represent land surface characteristics. In addition, geolocation information, such as solar angles, view angles, and height, also affects LST retrieval from satellites. All the input variables were all-weather conditions with high resolution. In addition, ERA LST can provide all-weather LST, but with coarse resolution (0.1°). It was considered a background field and provided an initial value for the model. After the instantaneous model was constructed, the daily mean model was developed. Research has confirmed linear or nonlinear relationships between the daily mean LST and instantaneous LST for polar-orbiting satellites (Xing et al., 2021; Duan et al., 2014). Hence, the instantaneous retrieval of all-weather LST data was used in the daily LST model. In addition, the ERA daily LST rather than the ERA LST was used as the initial value in the daily LST model. Except in the case of these two variables, the inputs of the two models were the same. Specifically, the daily mean LST was finally retrieved from the average of multiple observations in 1 d.
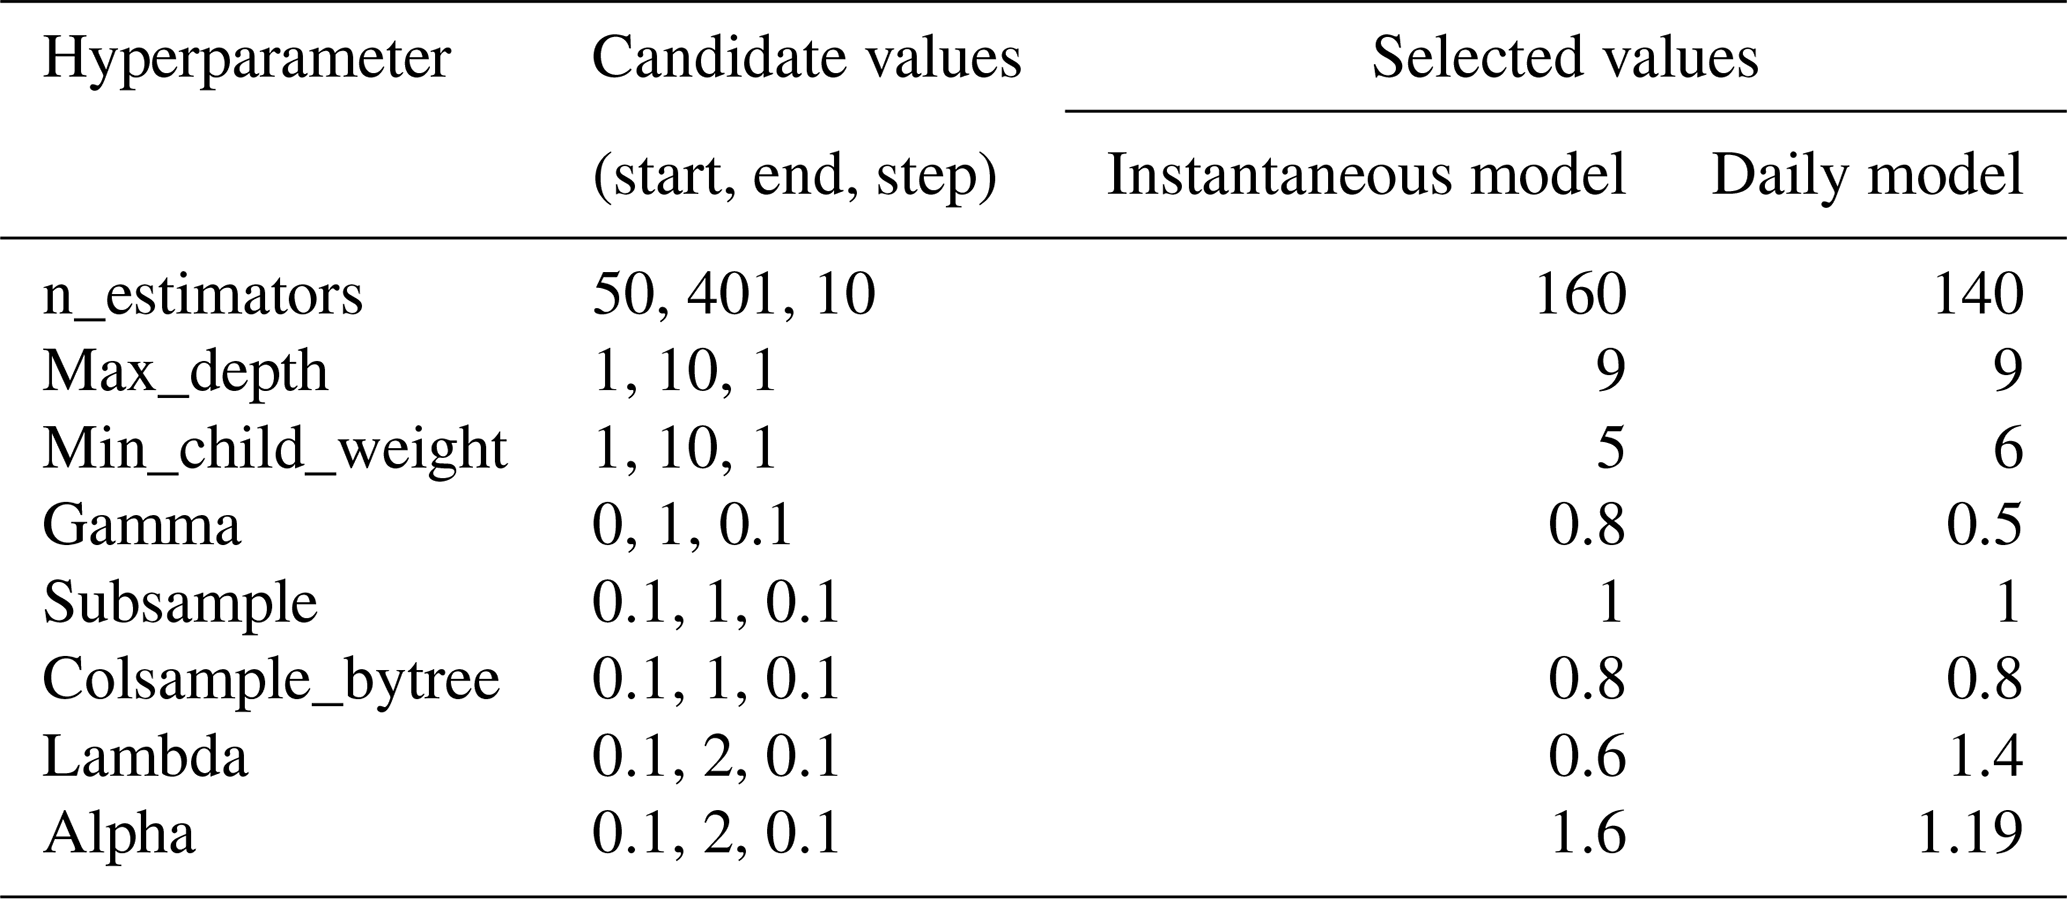
Model tuning was performed to prevent the overfitting of the models. Several hyperparameters in XGBoost needed to be tuned, including the number of gradient boosted trees (n_estimators), the maximum depth of trees (Max_depth), the minimum sum of weights of all observations required in a child (Min_child_weight), the minimum loss reduction required to make a split (gamma), the fraction of observations that is to be random samples for each tree (subsample), and the fraction of columns that is to be randomly sampled for each tree (Colsample_bytree). Lambda and alpha represent the regularization of the weights in XGBoost, which can improve the speed performance. A random search combined with a grid search was used to tune the model. Table 2 presents the candidate values of the random search and the final settings for the two LST models.
Table 2Candidate values and selected values of hyperparameters in XGBoost.
3.4 Evaluation approaches
In this study, validation of training and independent datasets of separated ground measurements was used to evaluate the instantaneous and daily mean LST models. The widely used 10-fold cross validation (10-CV) method was used to evaluate the stability of the models. Model performance was then assessed for different weather conditions and observation times. In addition, time series of individual sites and spatial distribution at regional and global scales were chosen to further demonstrate the effectiveness of the developed models. Finally, the proposed framework and generated products were compared with those of previous studies and products.
4.1 Model training and validation
In general, 70 % of the dataset was used for the model training. The remaining dataset was used for model adjustment and validation. Independent validation and 10-CV results were used to evaluate the models. Figures 4 and 5 show the accuracies of the instantaneous and daily mean LST models, respectively. As seen in the scatter density plots, all the validation results for both instantaneous and daily models are close to the 1:1 line, with R2 values ranging from 0.974 to 0.990. The root mean squared errors (RMSEs) of the training and validation results were 2.413 and 2.787 K for the instantaneous model, while they were 1.758 and 2.175 K for the daily mean LST model. Both models showed high accuracy in model training and validation, with no obvious overfitting. The 10-CV method is also used to comprehensively validate the models, and the results of both models are also satisfactory, with RMSEs of 2.421 and 1.808 K for the instantaneous and daily mean LST models, respectively. Overall, the validations from the independent dataset and 10-CV results show acceptable accuracy and robustness of the two models. Both models are robust. The daily mean LST model shows a higher accuracy than the instantaneous LST model. This is probably because the daily mean LST is obtained by averaging multiple observations in 1 d, which reduces the uncertainty. In addition, some daily inputs (daily mean in situ LST and ERA LST) used in the daily model have less uncertainty than instantaneous observations.
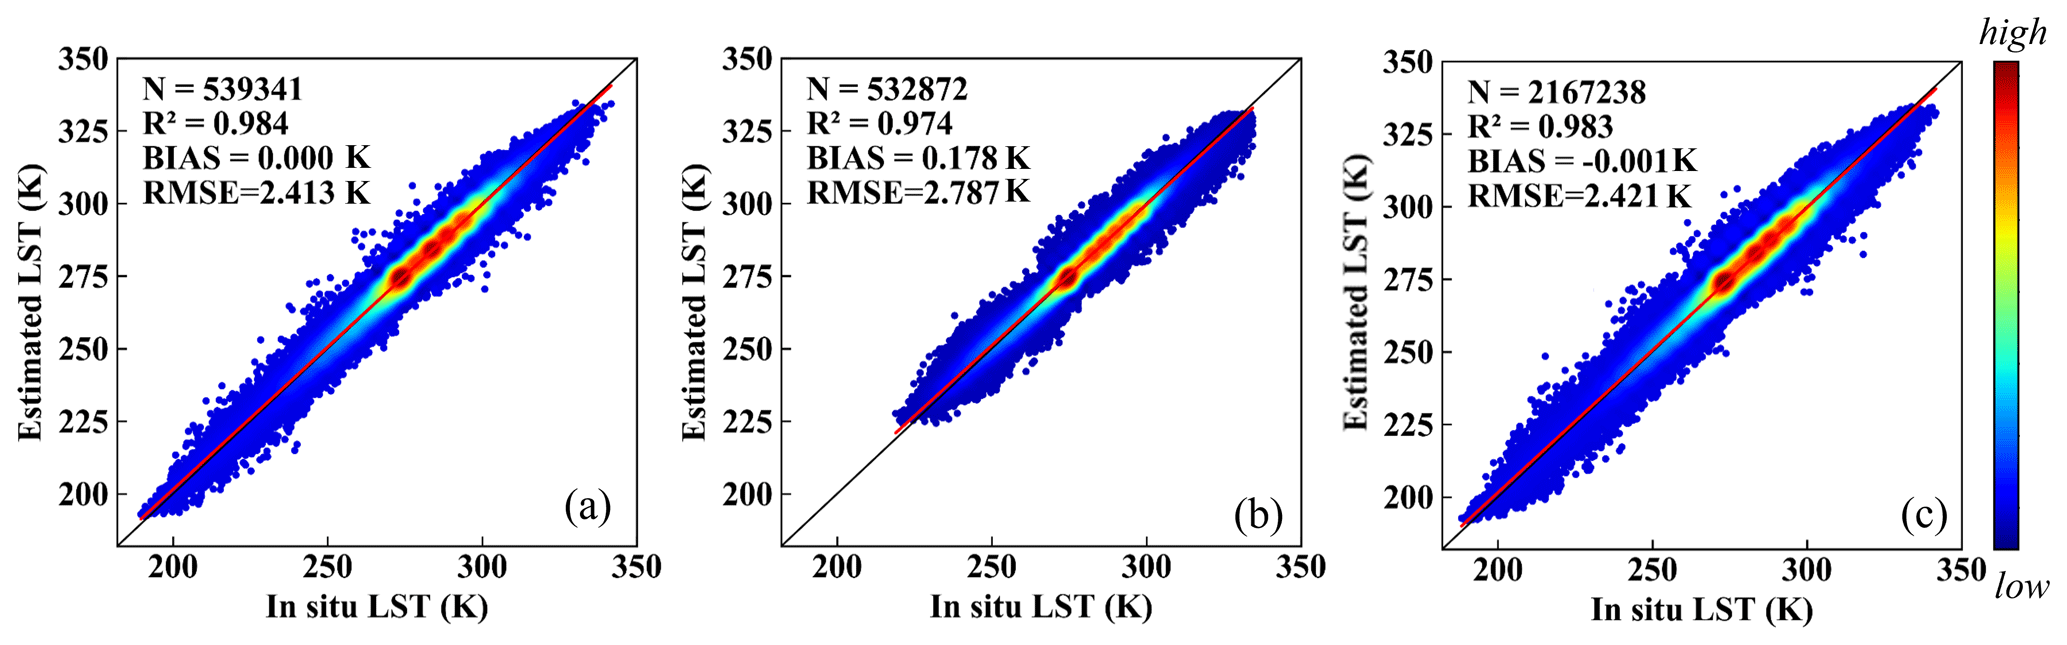
Figure 4The (a) training, (b) independent validation, and (c) 10-CV results of the instantaneous LST model.
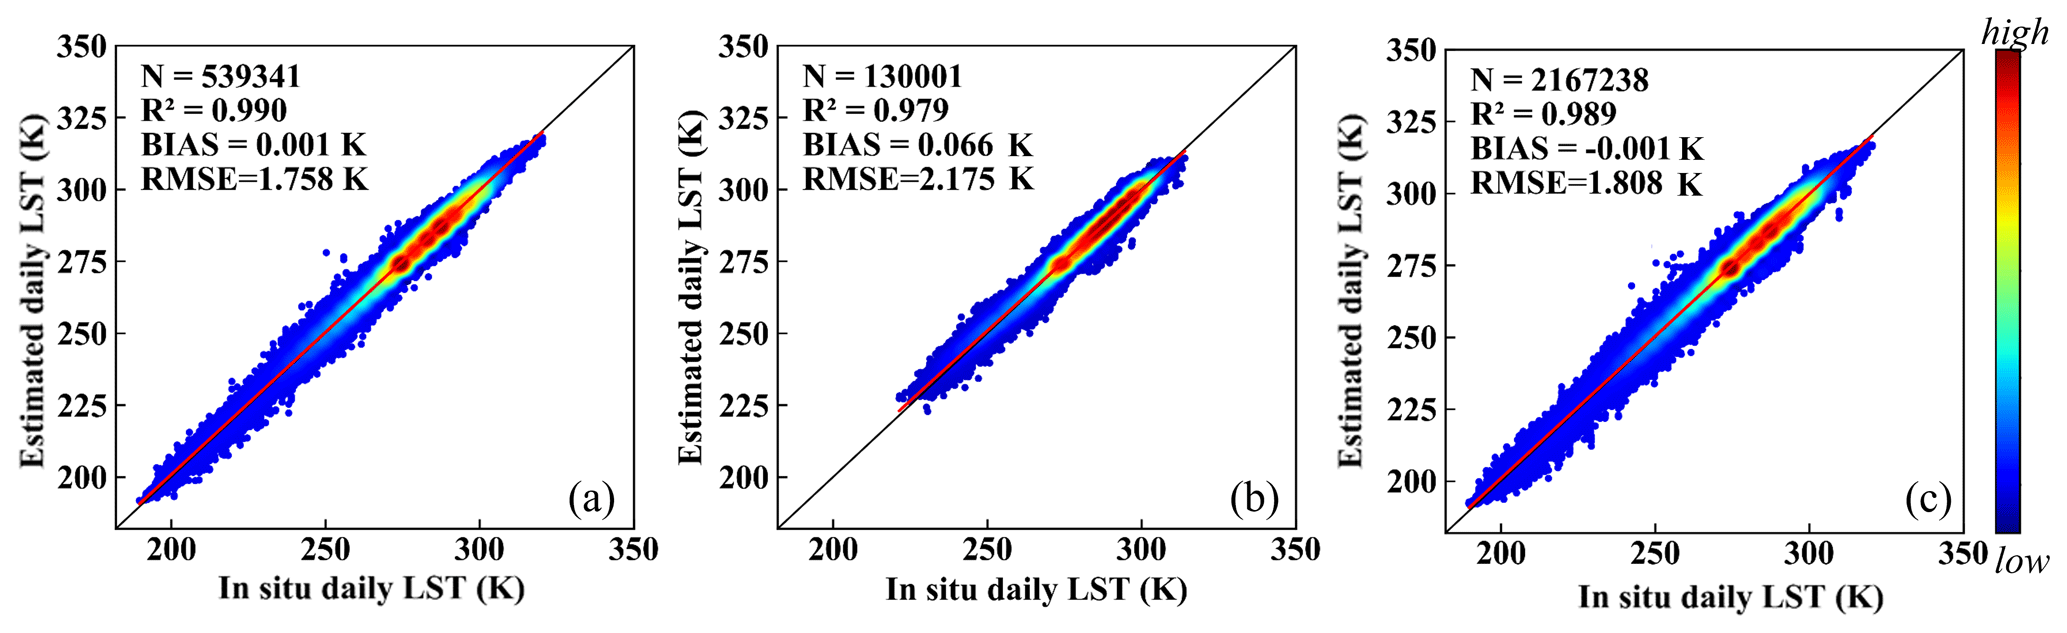
Figure 5The (a) training, (b) independent validation, and (c) 10-CV results of the daily mean LST model.
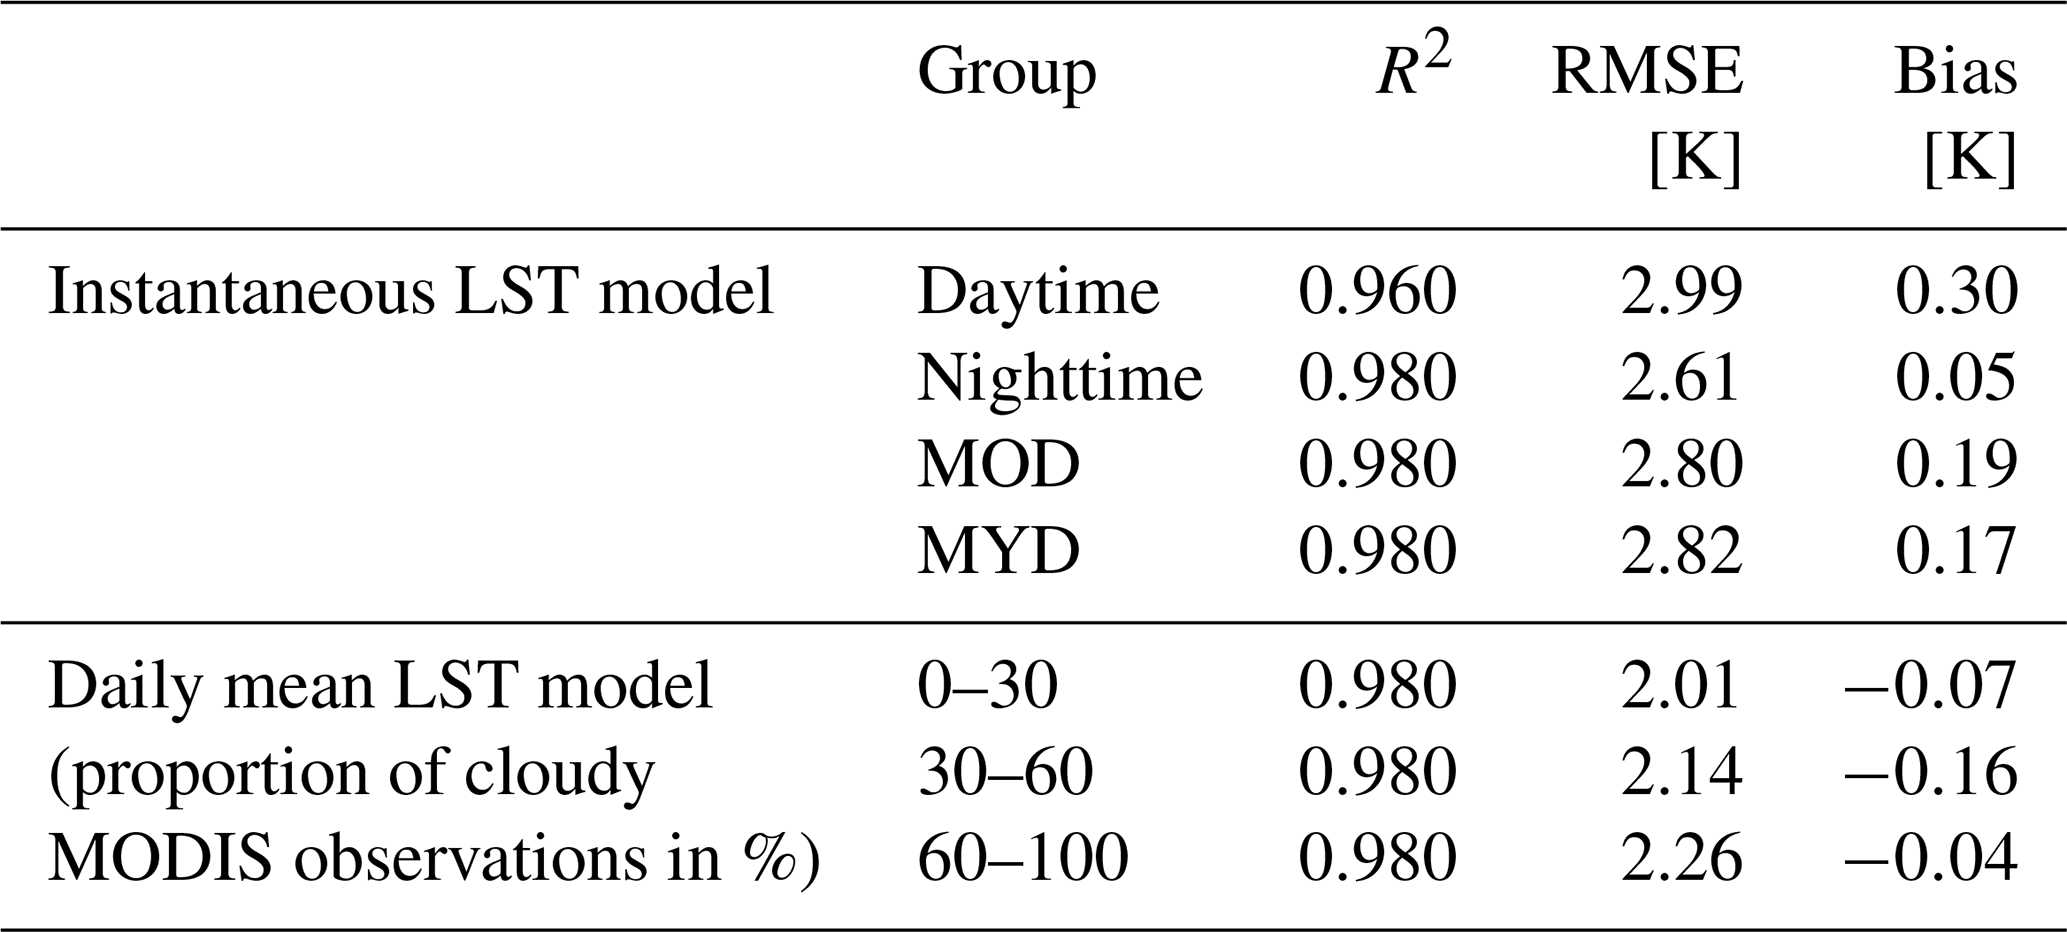
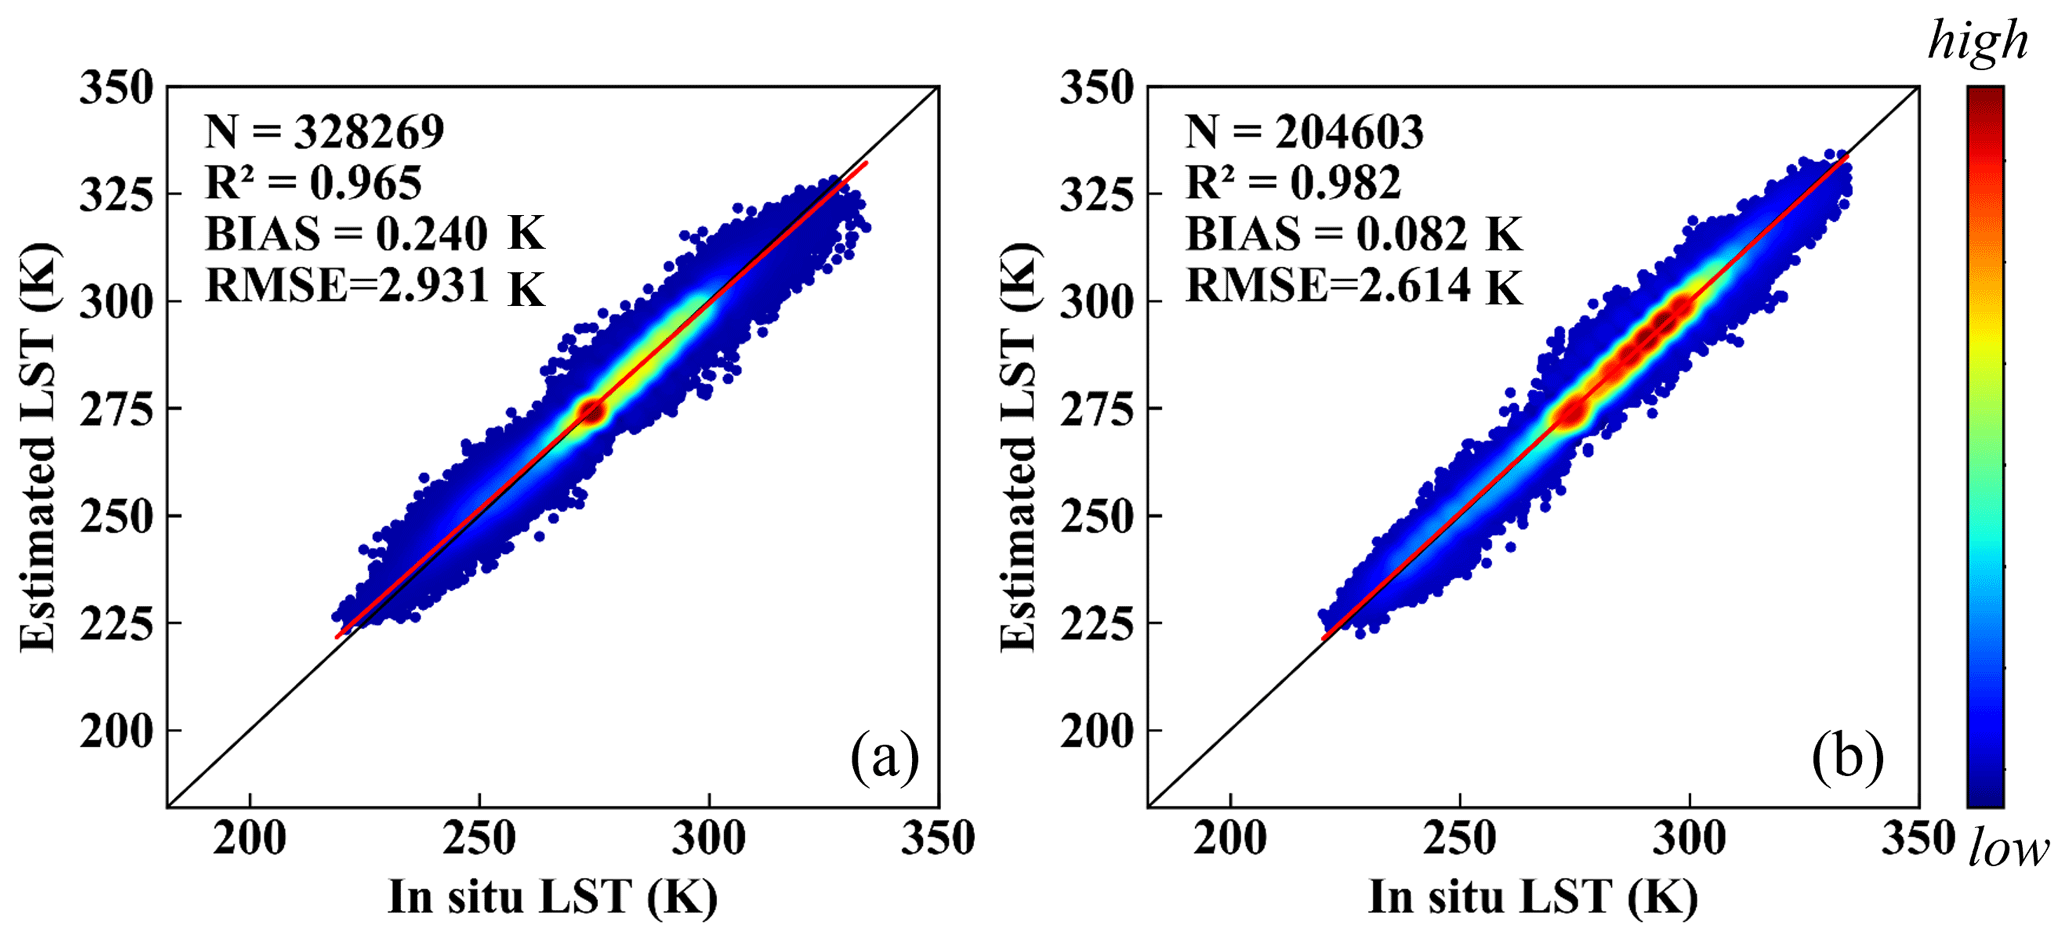
In addition, we further verify the model performance under different conditions using an independent dataset. Table 3 presents the validation results for different observation times and satellites for the instantaneous model. The RMSEs are 3.03 and 2.67 K for daytime and nighttime data, respectively. The accuracy of nighttime data is higher than that of daytime data. This is probably because of the absence of differential solar heating and higher spatial–temporal heterogeneity during the daytime (Duan et al., 2019; Liu et al., 2023). In addition, the LST value during the daytime is higher than that during nighttime, which results in a higher RMSE value. For the validation of the MOD and MYD satellites, the RMSE of MOD is nearest to that of MYD. We further verify the accuracy in the presence and absence of clouds; the density plots are shown in Fig. 6. The accuracy under clear-sky conditions was relatively higher, with an RMSE of 2.614 K, whereas the RMSE is 2.931 K under cloudy-sky conditions. More effective observation information and higher accuracy of inputs under clear-sky conditions result in a higher accuracy of clear-sky estimation. This phenomenon is also present in other studies (Ma et al., 2024; Duan et al., 2023). Furthermore, to explore whether clouds have an effect on daily mean LST retrieval, we calculate the accuracy under different cloud proportions, as shown in Table 3. The results show that the RMSE values slightly increased as the proportion of cloudy-sky observations increased. This demonstrates that cloud contamination has a limited impact on the daily mean LST estimation in the proposed method.
Table 3Validation for different observation times, satellites, and weather conditions of the instantaneous LST model and the proportion of cloudy-sky MODIS observations of the daily mean LST model.
4.2 Validation and assessment
4.2.1 Evaluation across individual sites
The validation of the instantaneous and daily mean LST for individual sites is shown in Fig. 7. The darker the color of the circles, the higher the level of error. RMSEs range from 1.16 to 4.90 K for instantaneous LST and 0.89 to 3.96 K for daily mean LST. The corresponding histograms show that the accuracy of nearly 75 % of sites is below 3 K and 2.5 K for instantaneous and daily mean LST, respectively. Stations distributed throughout the continental United States with intensive LST monitoring generally have higher accuracy. High accuracy is also observed at stations in Alaska and Greenland, whereas a relatively lower accuracy is observed in the Antarctic. In Europe, most stations perform well, with the exception of some stations in the east. The stations in Asia are relatively discrete, with relatively lower accuracy for individual sites in western China, which is probably due to the high elevation and complex terrain (Jia et al., 2023). In addition, several stations distributed in Australia, Africa, and South America also perform well in both models. In general, the results indicate a satisfactory predictive ability of both instantaneous and daily mean LST models at most individual sites.
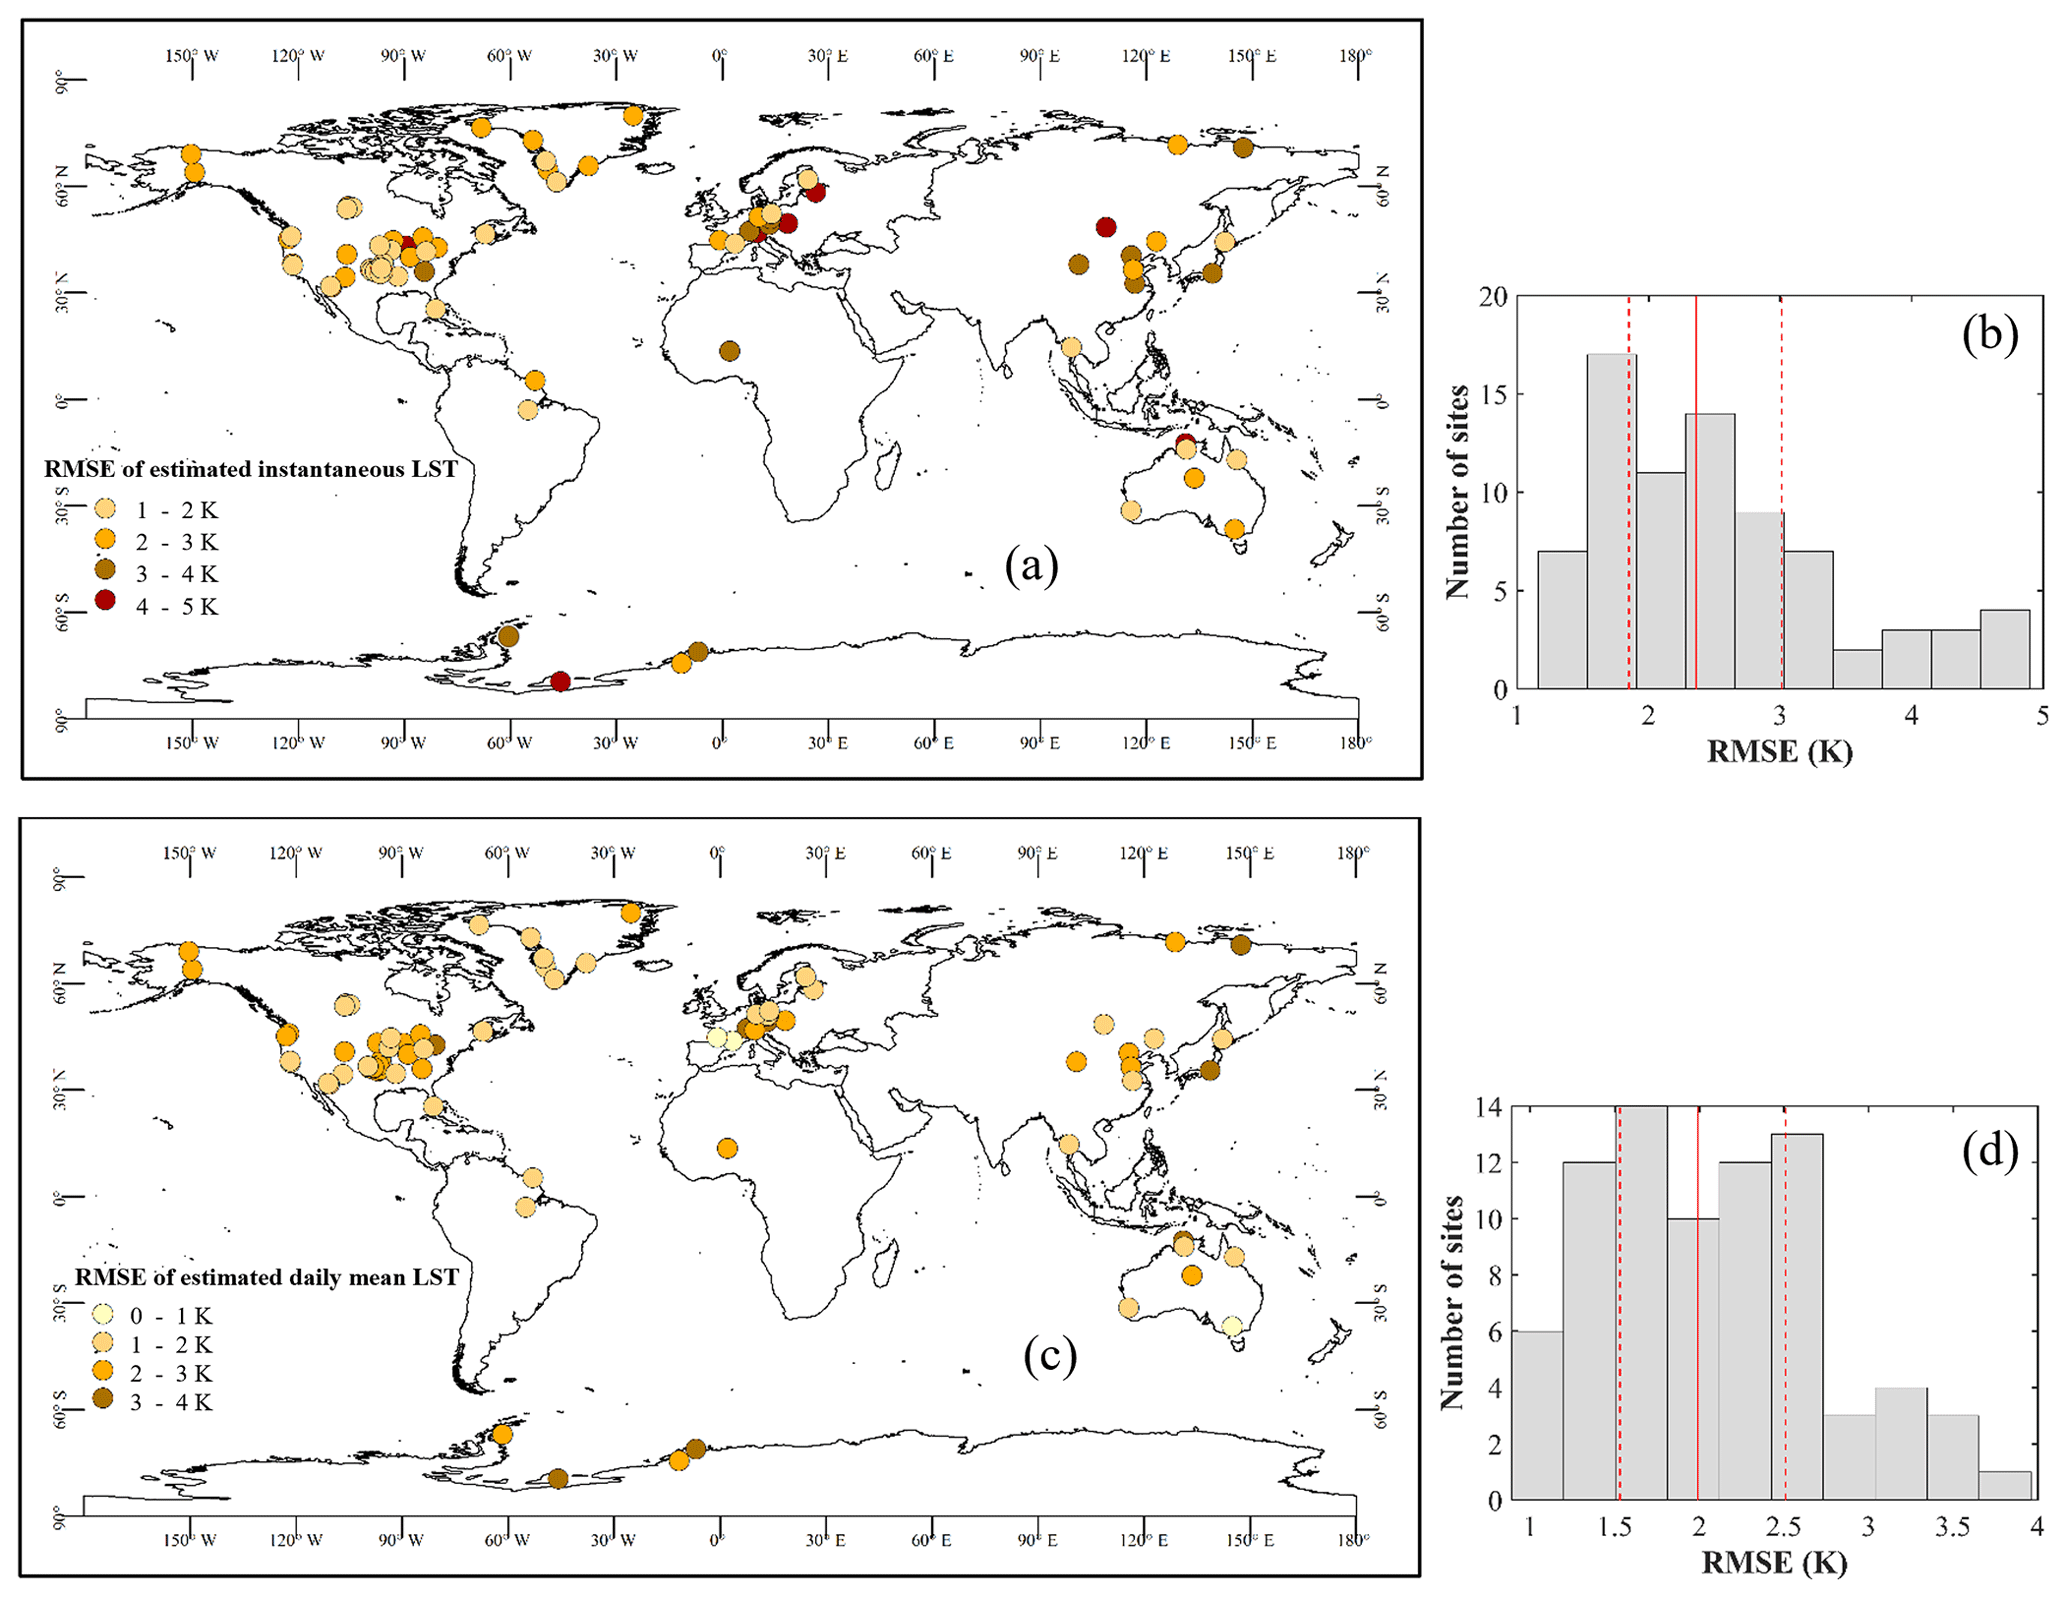
Figure 7Validation of individual sites for instantaneous LST (a), daily mean LST (c) and their corresponding histograms (b, d).
4.2.2 Evaluation across land cover types and elevation
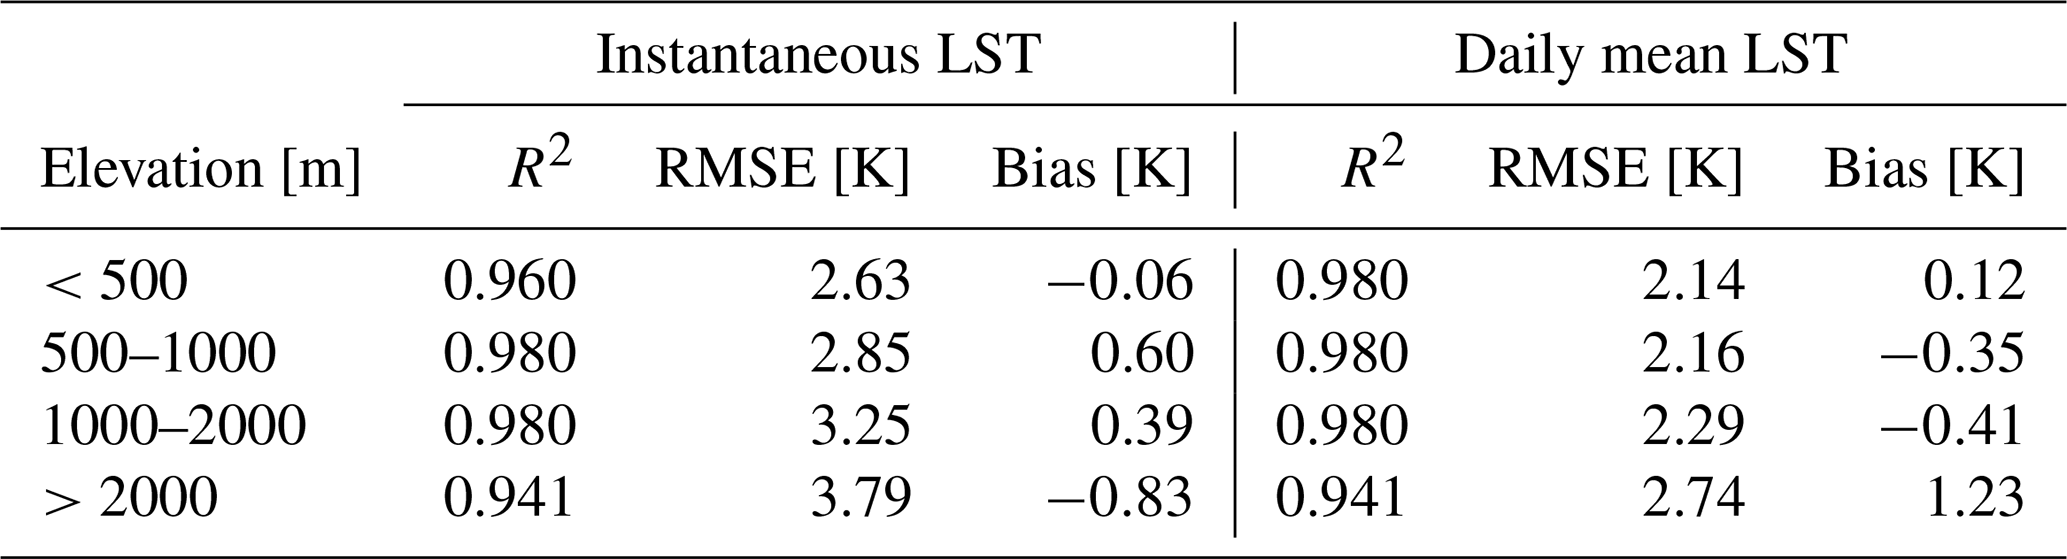
LST is closely related to land cover types. The validation results for different land cover types are presented in Table 4. The results indicated that the data had high accuracies for most land cover types. For instantaneous LST, the RMSEs of most vegetation types were below 3 K, except for shrublands, which had an RMSE of 3.04 K. Among the vegetation types, cropland had an outstanding RMSE of 2.55 K. The accuracies of vegetation types for daily mean LST were higher than those of instantaneous LST, with RMSEs of approximately 2 K, except for shrublands, which had an RMSE of 2.55 K. The accuracy in waterbodies was also satisfactory, with RMSEs of 2.43 and 2.04 K for instantaneous and daily mean LSTs, respectively. For both models, the accuracy of instantaneous and daily mean LSTs in snow/ice with RMSEs of 2.94 and 2.35 K, respectively, were notably improved compared with that found in our previous study (Li et al., 2021). This is probably due to the higher number of samples from high latitudes, which improved the model robustness in snow/ice. However, the accuracy for urban and barren areas was relatively low. This is likely due to the high heterogeneity of urban areas, high albedo, and low specific heat capacity of barren land (Duan et al., 2017a). In general, for different land cover types, the daily mean model showed higher accuracy than the instantaneous model, and both models had acceptable accuracy. In addition, we summarized the accuracy of the different elevation ranges in Table 5. The results indicate that elevation has an impact on LST retrieval accuracy. The relatively poor accuracy at high elevations is probably due to the harsh natural environment and complex terrain, which was also reflected in another study (Zhao et al., 2019).
Table 4Validation of instantaneous and daily mean LST models for various land cover types.
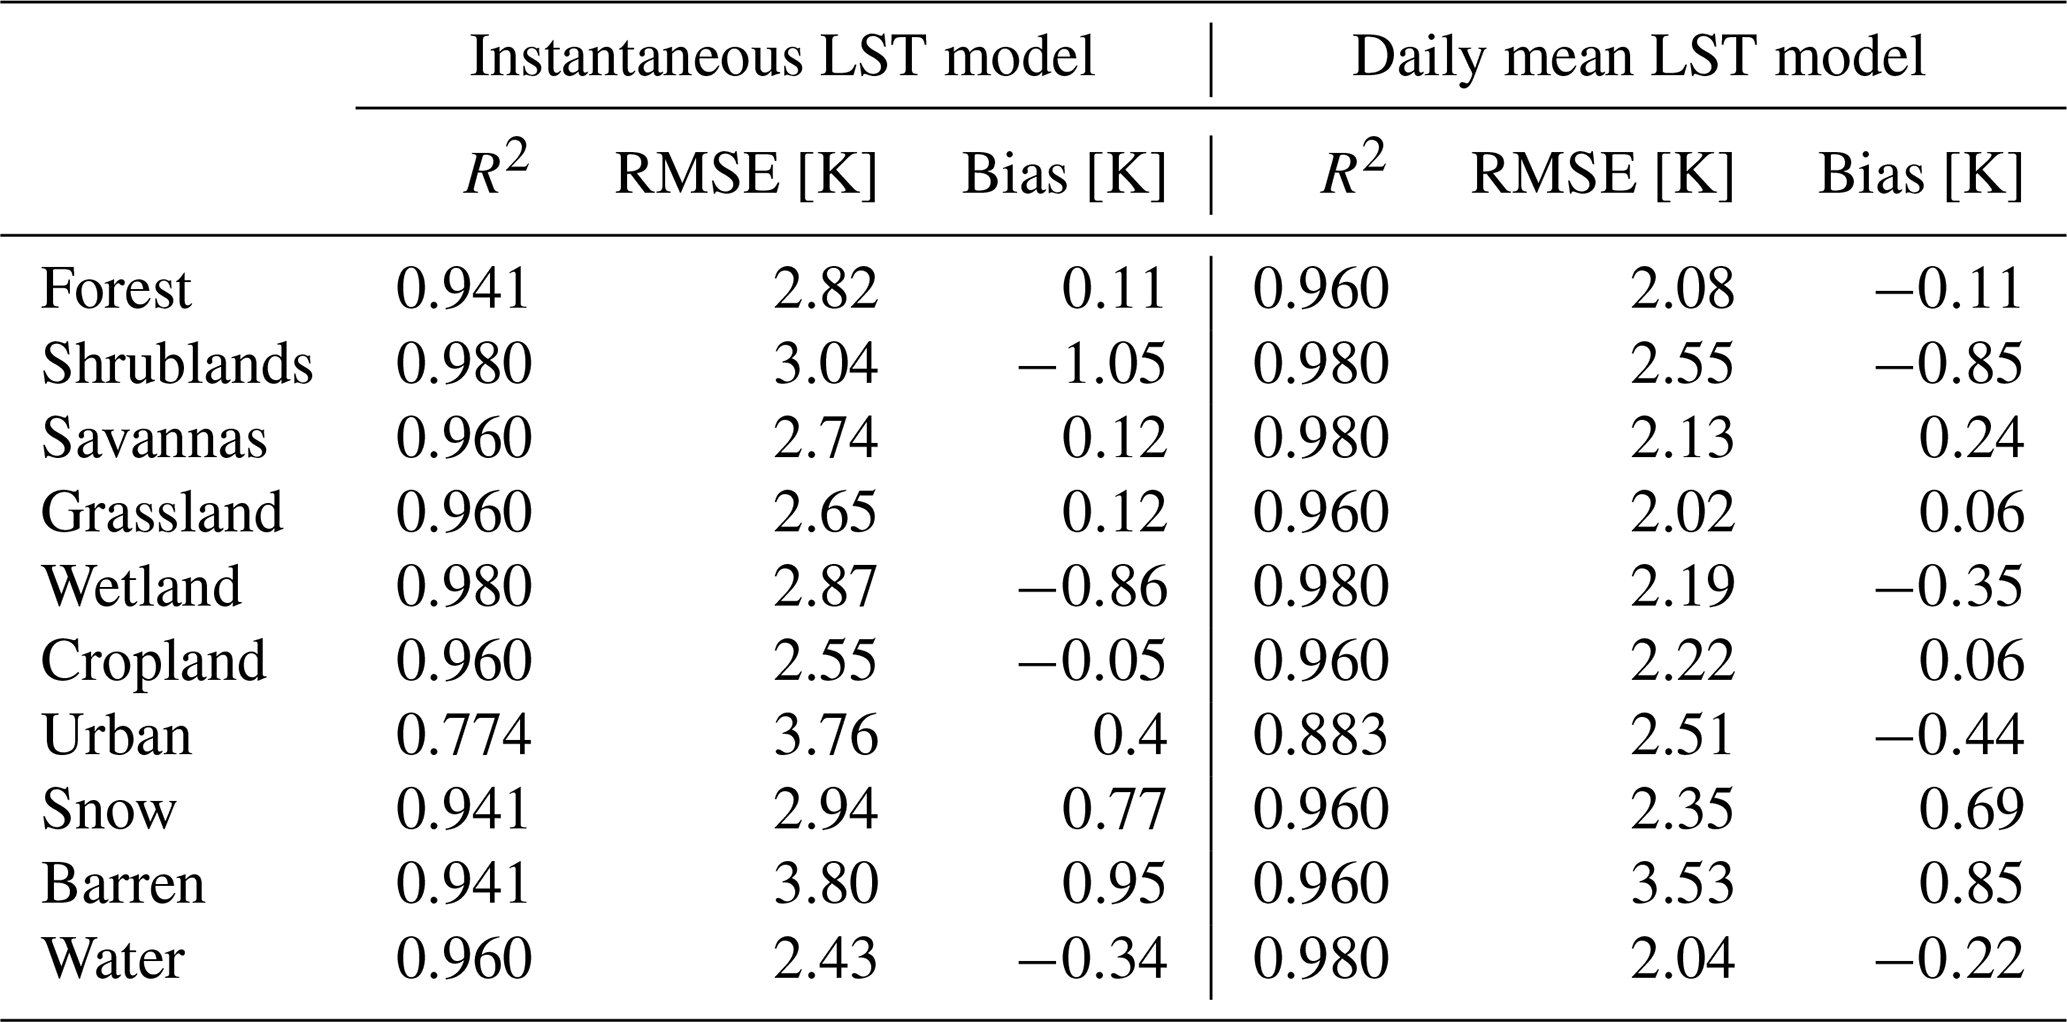
Table 5Validation of the instantaneous and daily mean LST models for different elevations.
4.2.3 Comparison with other products
Official MODIS and ERA LST data were used for comparison with our LST products. Figure 8 presents the accuracies of ERA LST (RMSE = 4.048 K) and official MODIS LST (RMSE = 3.583 K), both of which were lower than the accuracy of the estimated LST proposed in this study (RMSE = 2.787 K; Fig. 4b). Furthermore, we noted that the official MODIS LST data had several abnormal points (Fig. 8b). The polar regions (Antarctica and the Arctic Pole) were verified separately from the other regions, as shown in Fig. 9. The results indicate that the majority of outliers were from stations located in Antarctica and the Arctic Pole (Fig. 9b), which is probably because of cloud contamination. Owing to the spectral similarities between the ice and snow, the misjudgment of clouds leads to cloud top temperatures rather than LSTs (Østby et al., 2014; Liu et al., 2010). In contrast, the proposed method was unaffected by cloud contamination (Fig. 9a).
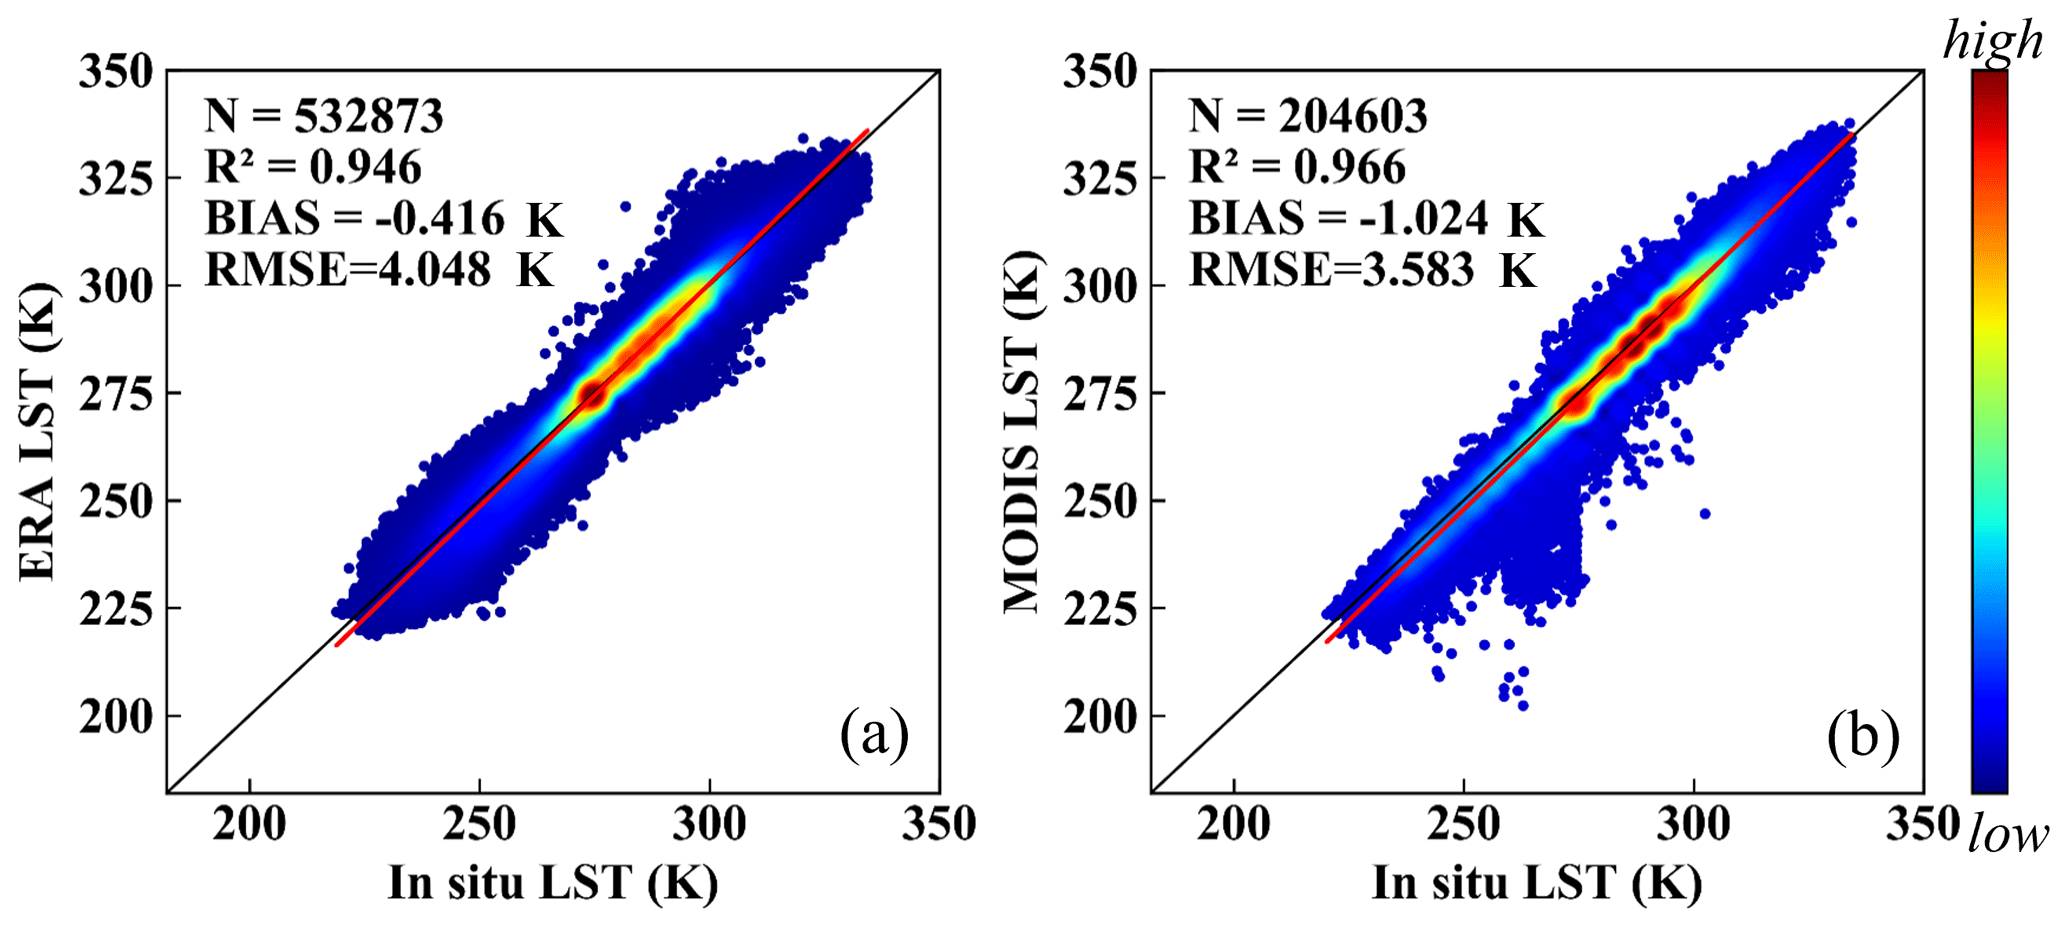
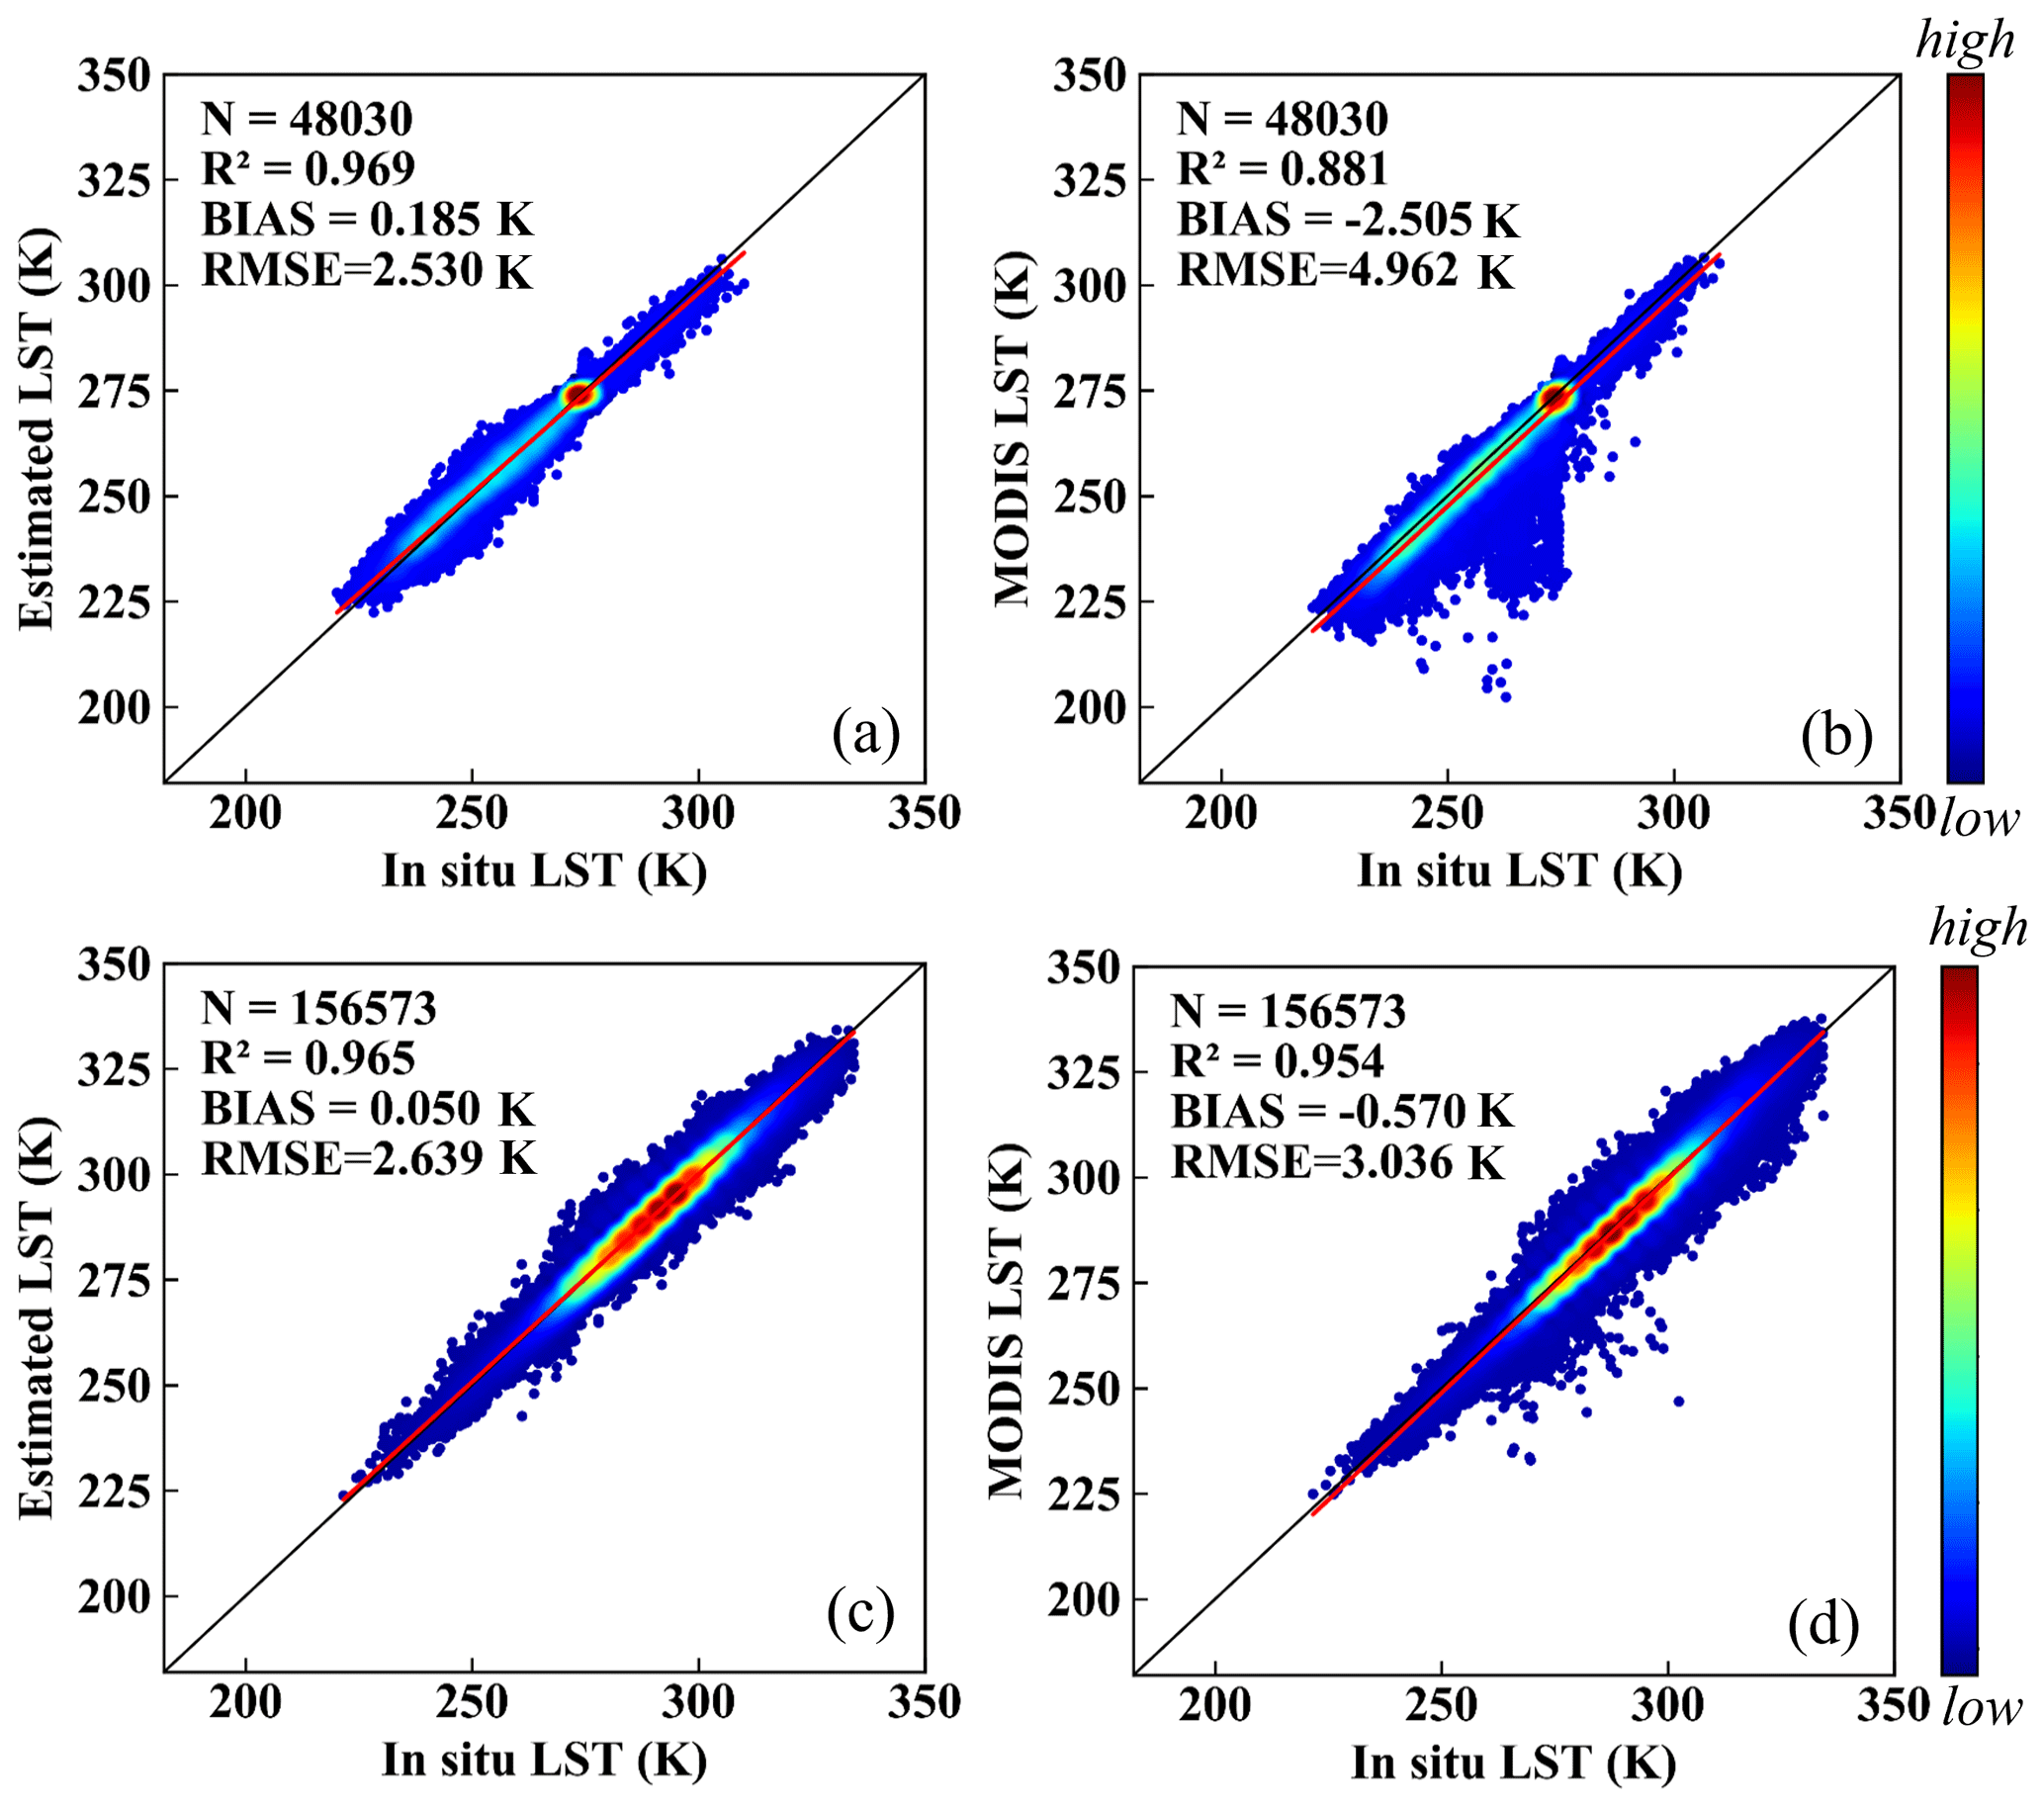
Figure 9Density plots of estimated instantaneous clear-sky LST (a, c) and MODIS LST (b, d) in polar regions (first row) and other regions (second row).
The ERA daily mean LST from Eq. (3) and official MODIS LST from Eq. (4) were used for comparison (Fig. 10). The ERA daily LST had an acceptable accuracy, with an RMSE of 2.988 K. The RMSE of the daily mean official MODIS LST was 3.105 K. The accuracy of the MODIS official LST was relatively lower compared to what was reported in a previous study. This may be due to the large uncertainty in the official MODIS LST in polar regions. When removing the observations in polar regions, the accuracy improved, with an RMSE of 2.799 K, similar to the result in previous studies (Williamson et al., 2014; Xing et al., 2021). The proposed method in this study has a higher accuracy than the daily mean LST from ERA and official MODIS LST, with an RMSE of 2.175 K on the global scale (Fig. 5b). Moreover, the daily mean LST obtained from official MODIS LST is only suitable under clear-sky conditions, whereas the daily mean LST obtained in this study is suitable for all-weather conditions.
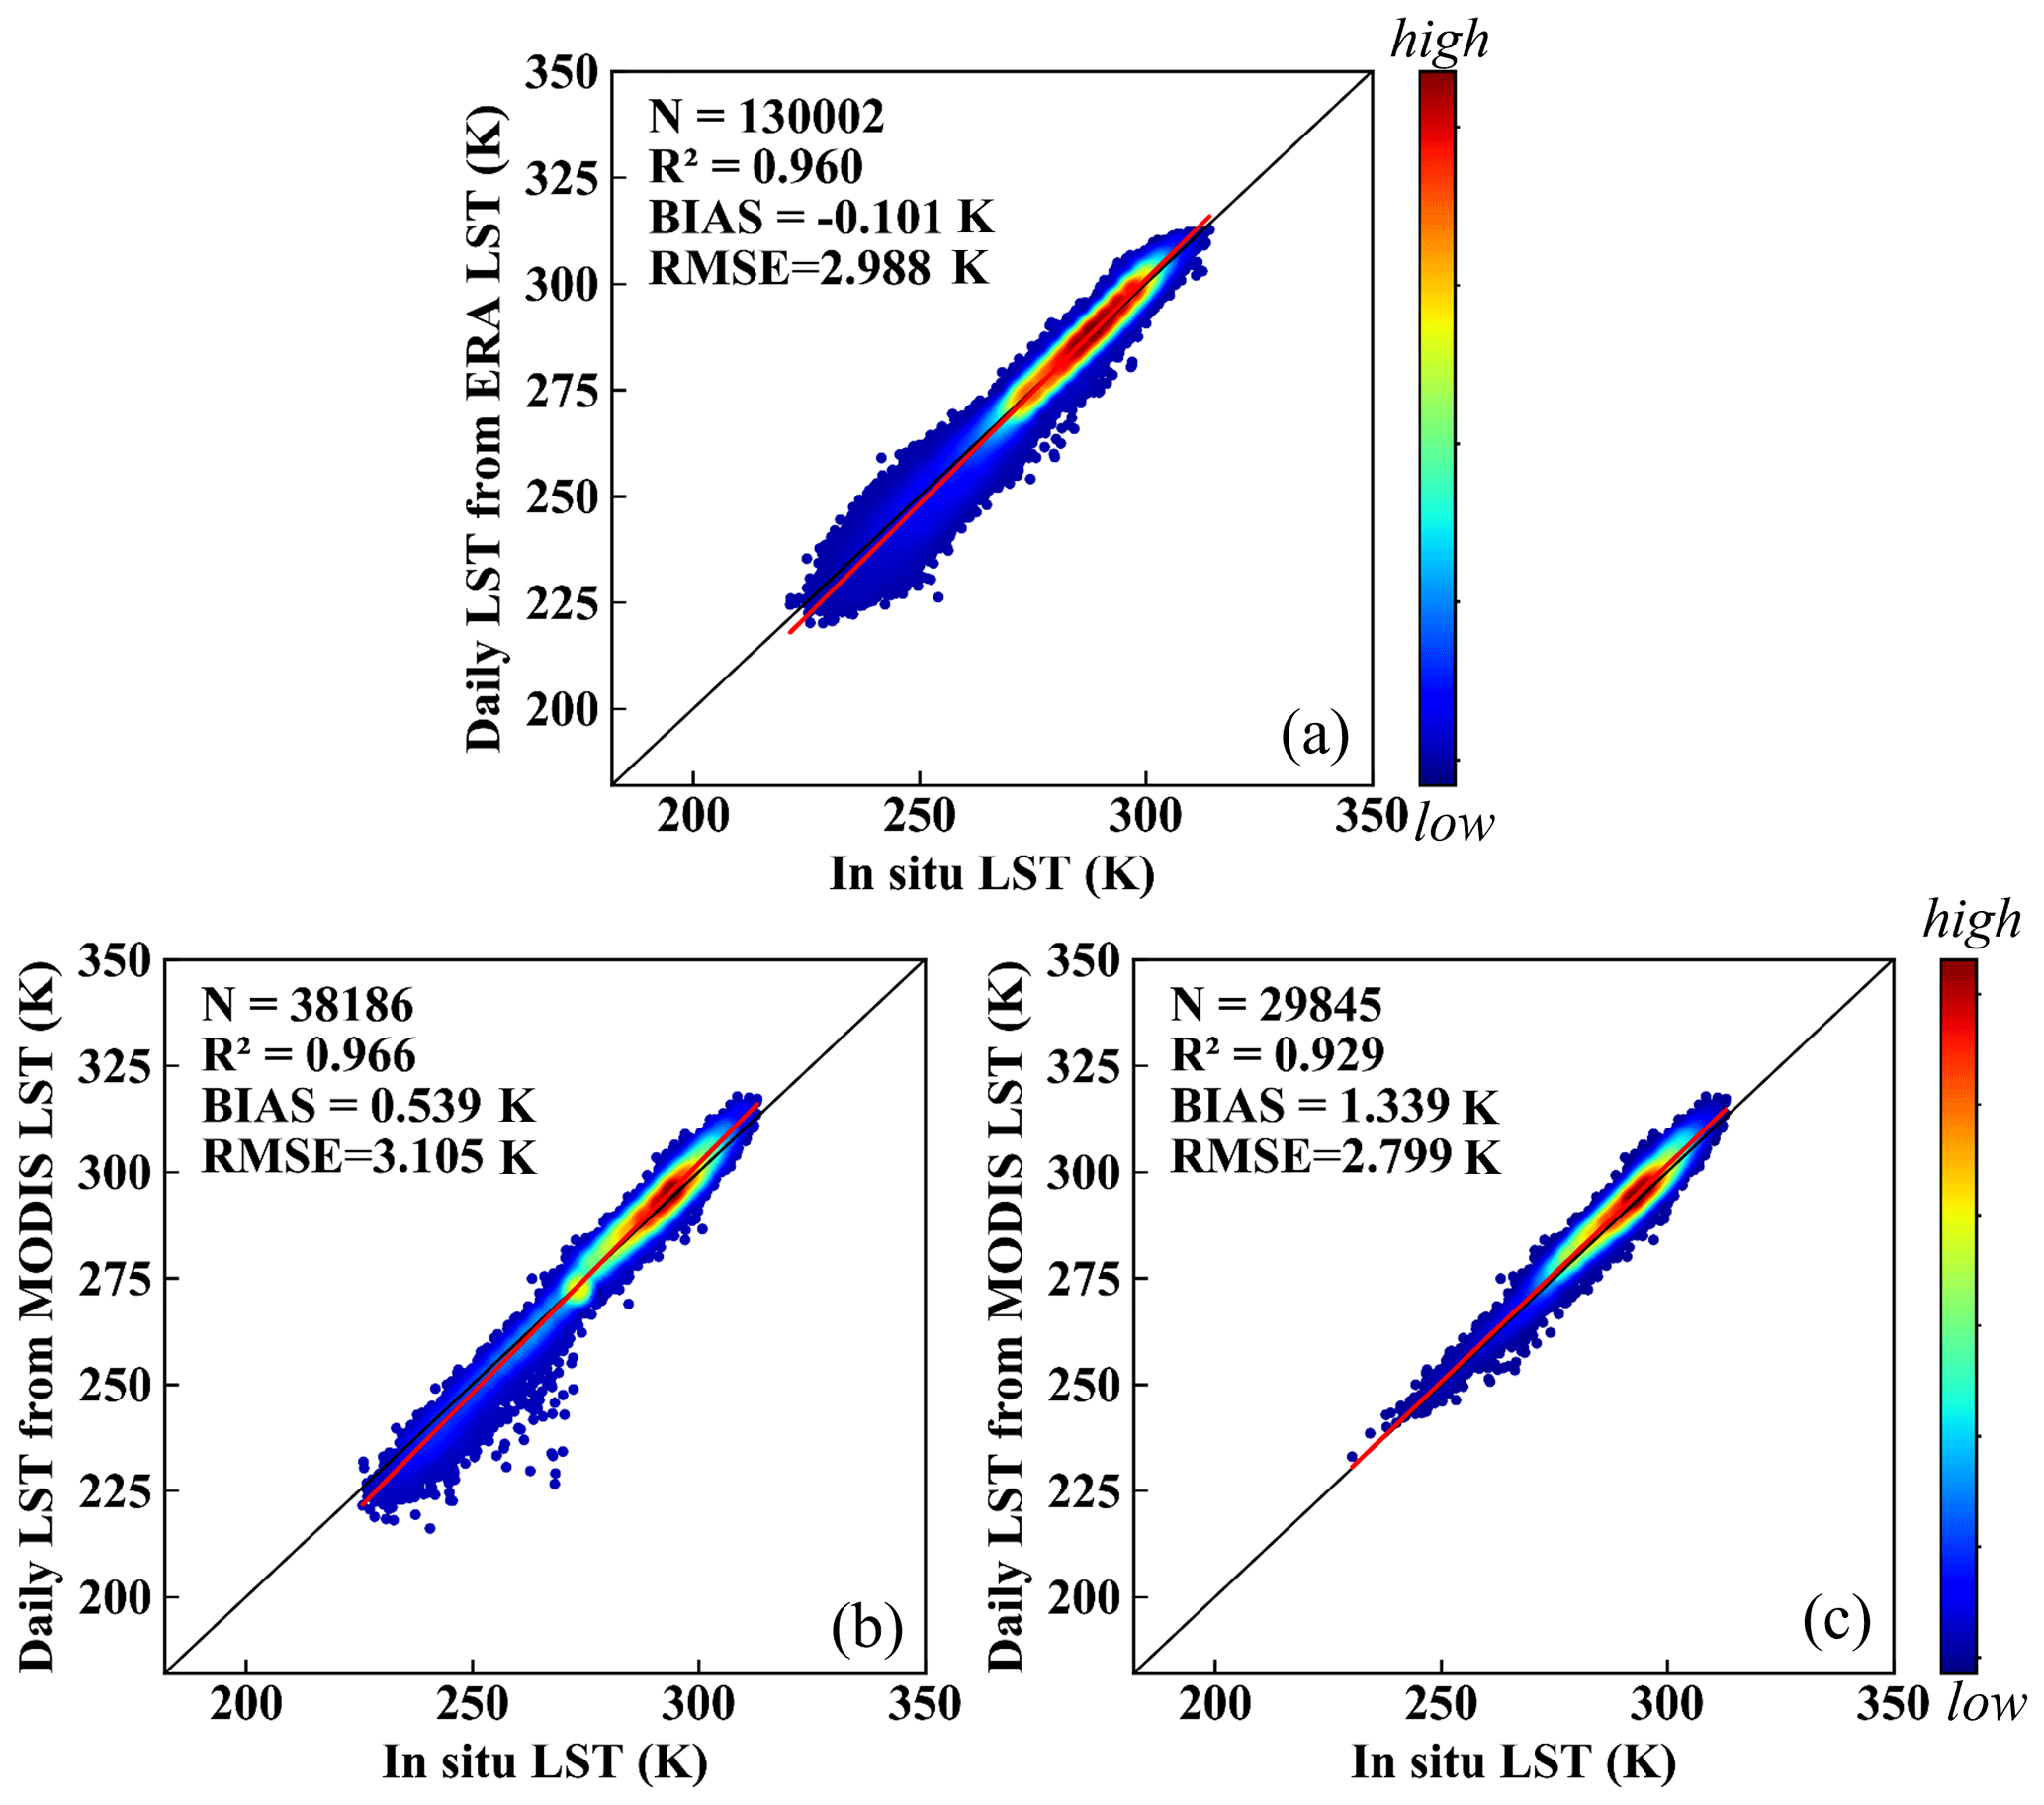
Figure 10Density plots of (a) ERA daily mean LST, (b) official MODIS daily mean LST, and (c) official MODIS daily mean LST except polar regions.
4.3 Spatiotemporal performance
To further evaluate the temporal performance of the estimated LST, four in situ LST measurements from different latitudes in 2010 were evaluated. Initially, instantaneous LST was examined separately for daytime and nighttime and MODIS LST was provided for comparison (Fig. 11). The RMSE values of estimated instantaneous LST were of comparable accuracy to the MODIS LST. The nighttime LST points were more concentrated than the daytime LST. The estimated LST curves are in good agreement with the in situ LST and MODIS LST curves but are more continuous than the curve of MODIS LST. Discontinuities observed at high-latitude stations (latitude 79.835, longitude −25.166) were due to polar day and night phenomena. The daily mean LST was also examined using in situ LST measurements (Fig. 12). The daily mean LST retrieved from MODIS official LST was used for comparison. The results indicated higher accuracy and better consistency compared to instantaneous LST. The estimated daily LST also depicted more complete curves than the daily mean LST from MODIS LST and captured the seasonal variation trends. The results demonstrate that both estimated instantaneous LST and daily mean LST can correctly reflect the temporal variations in LST.
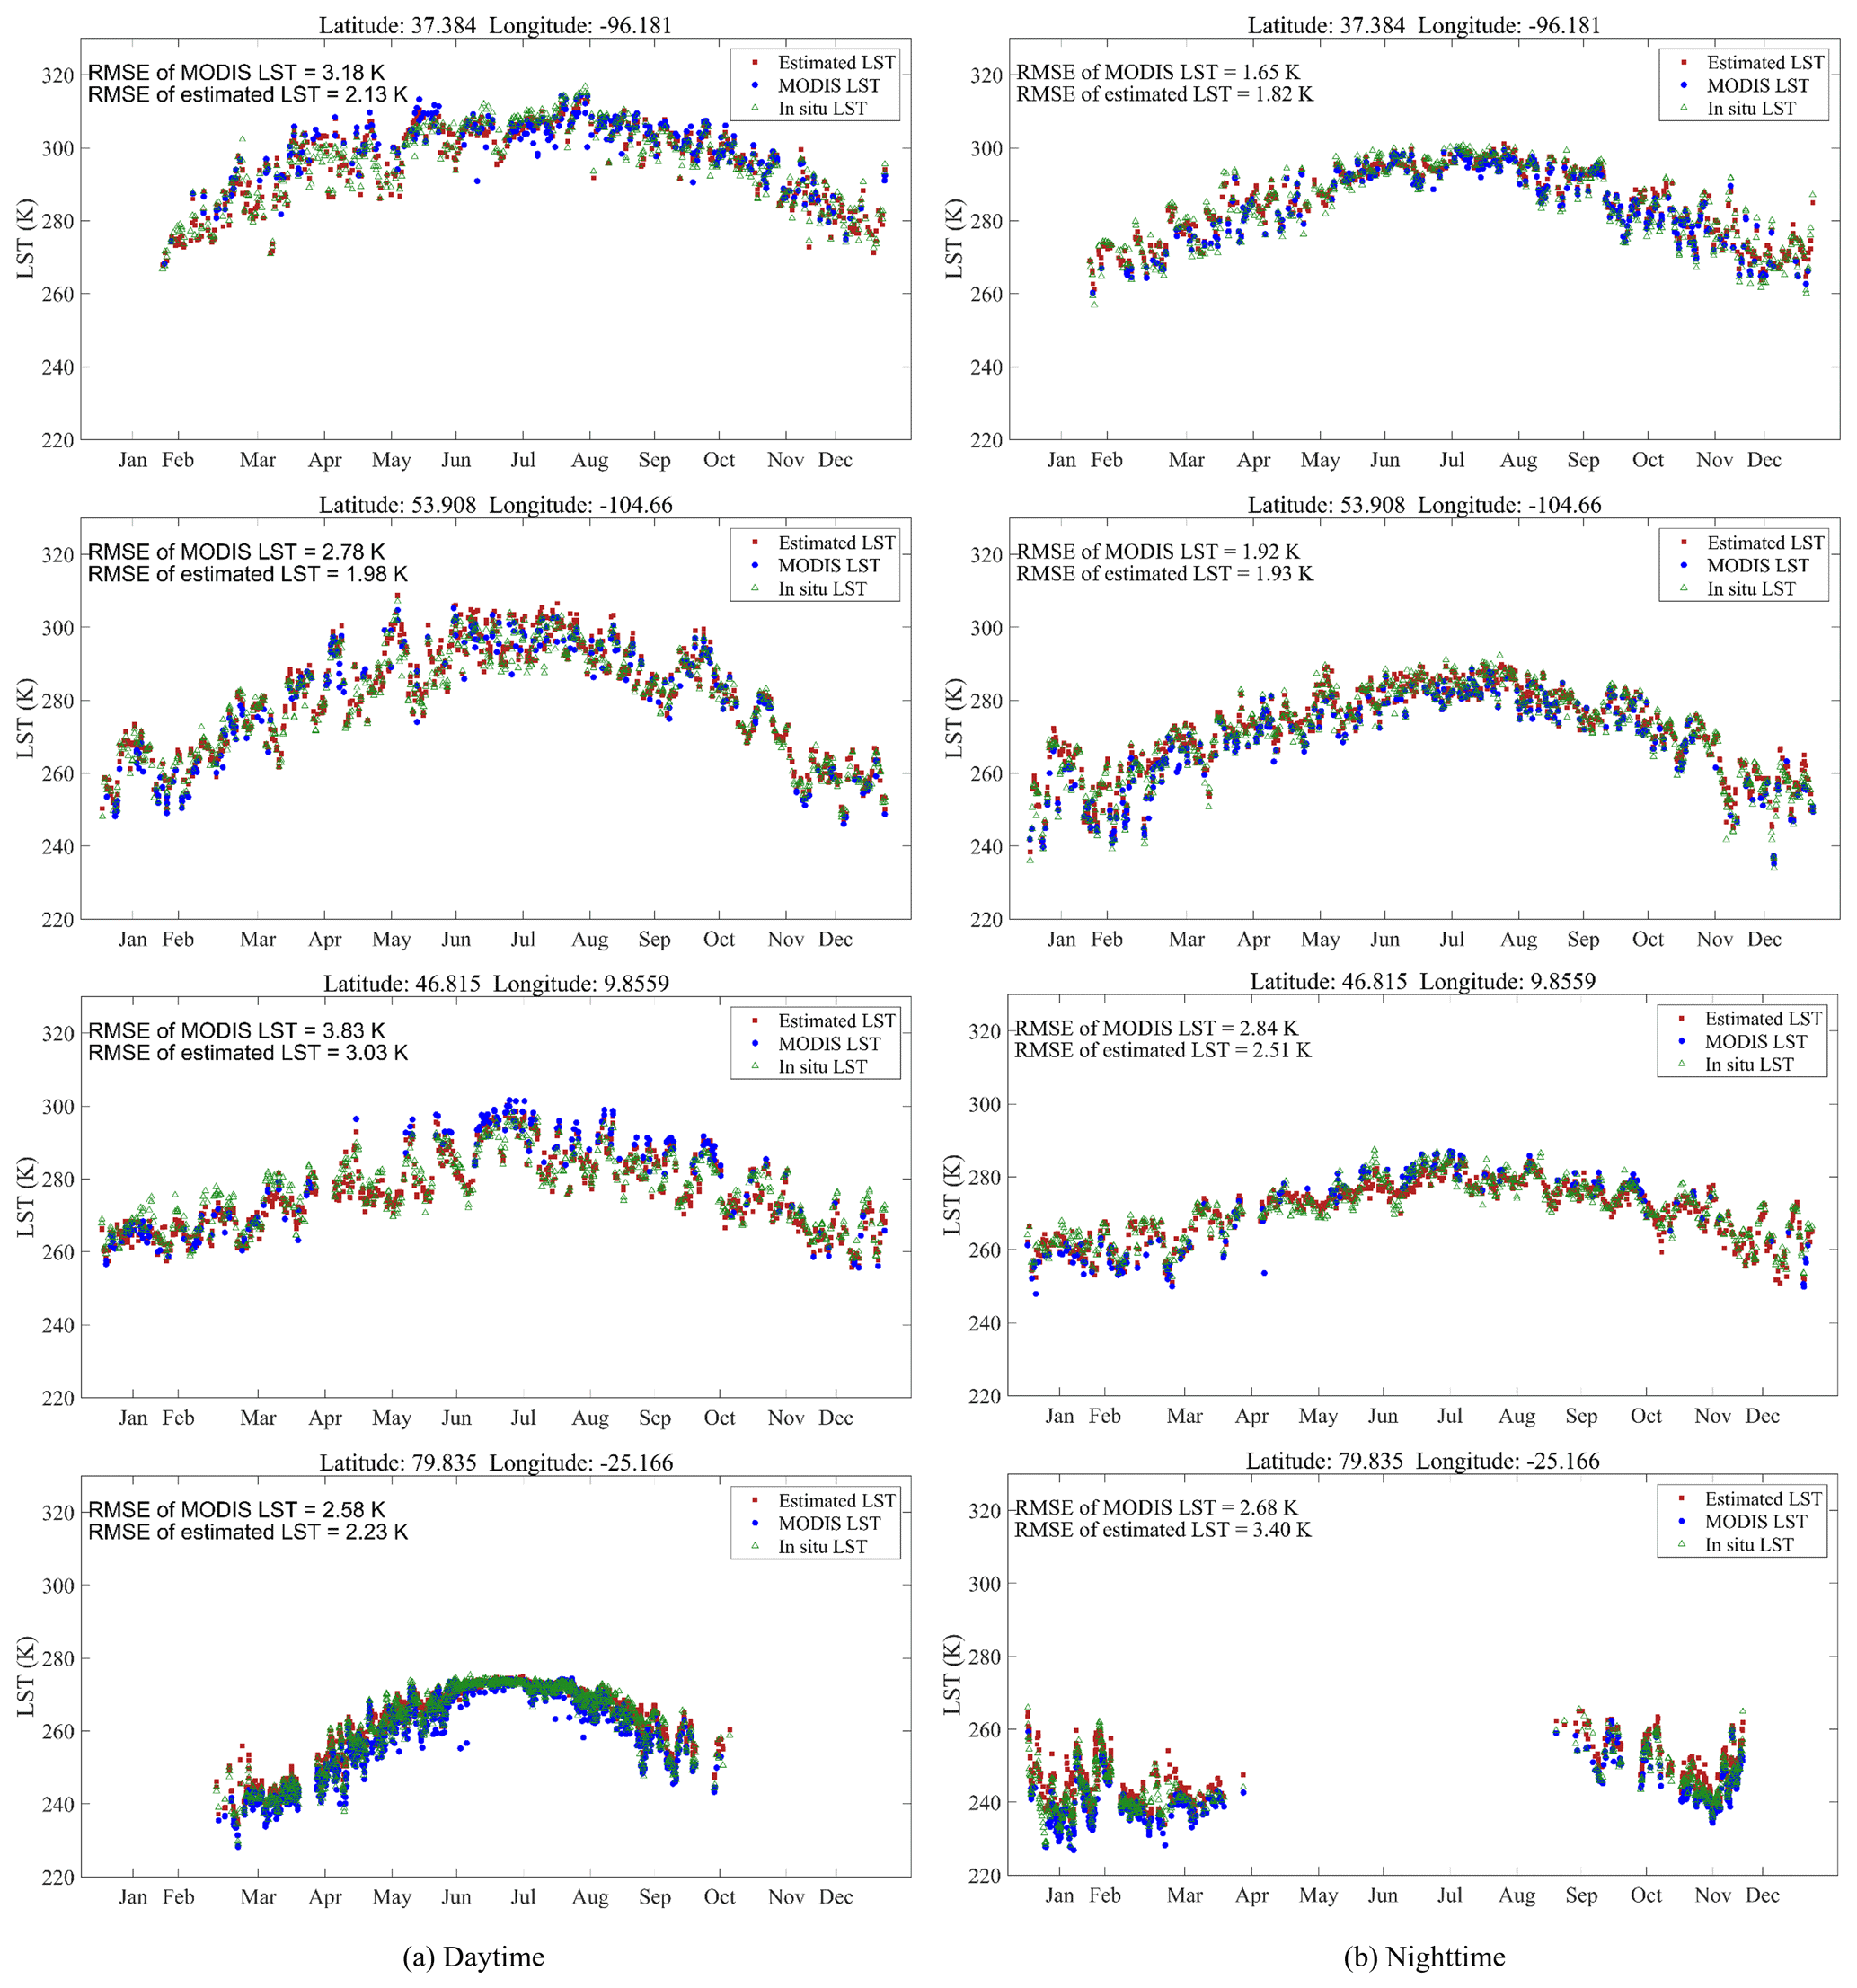
Figure 11Time series of the estimated instantaneous LST, MODIS LST, and in situ LST at four sites from different regions in 2010 for (a) daytime and (b) nighttime.
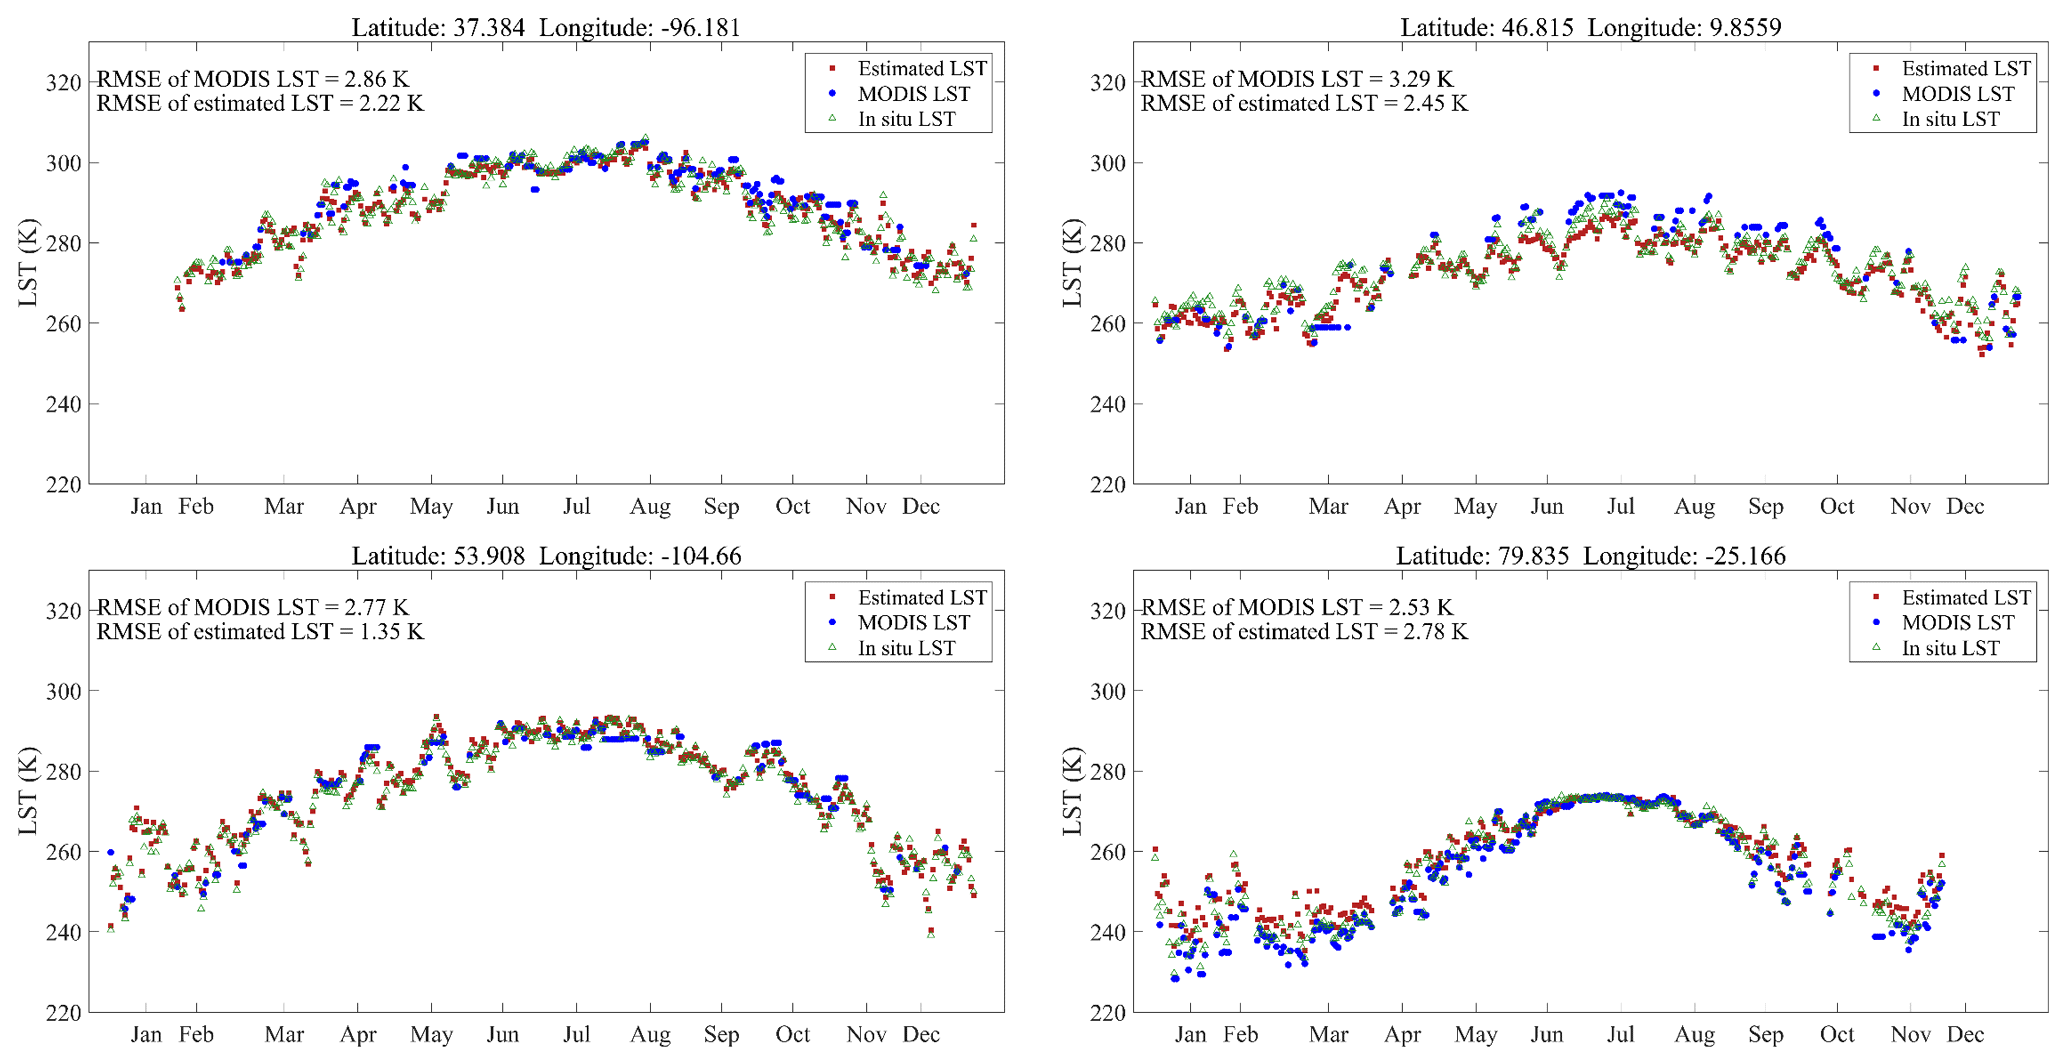
Figure 12Time series of the estimated daily mean LST, daily mean LST retrieved from MODIS LST, and in situ LST at four sites from different regions in 2010.
To further evaluate the spatial performance of the proposed methods, regional distributions and global maps were compared. Figures 13 and 14 present the spatial details of the estimated instantaneous LST and daily mean LST from tiles H10V04, H23V04, and H24V05. One of the grids, H24V05, is located on the Tibetan Plateau and contains mountainous terrain. The instantaneous and daily mean LSTs from ERA LST and MODIS LST were used for comparison. MODIS LST had missing values caused by cloud contaminants for both instantaneous and daily mean LST, while our method achieved spatially continuous estimation. In addition, the estimated LSTs had spatial patterns similar to those of MODIS LST under clear-sky conditions. Compared with the ERA LST, which was used as the model input, our results showed more spatial details and corrected the underestimation in some regions. In particular, the results for H24V05 reflect that the estimated LST has mountainous details. This demonstrates that our approach applies to mountainous regions with high heterogeneity. The spatial details of the daily mean LST show similar conclusions (Fig. 14). However, there may exist boundary effects in some complex terrains, which is probably due to the introduction of ERA data with coarse resolution. Overall, for both instantaneous and daily mean LSTs, the proposed methods executed the spatially contiguous LST and depicted the spatial LST details and variations.
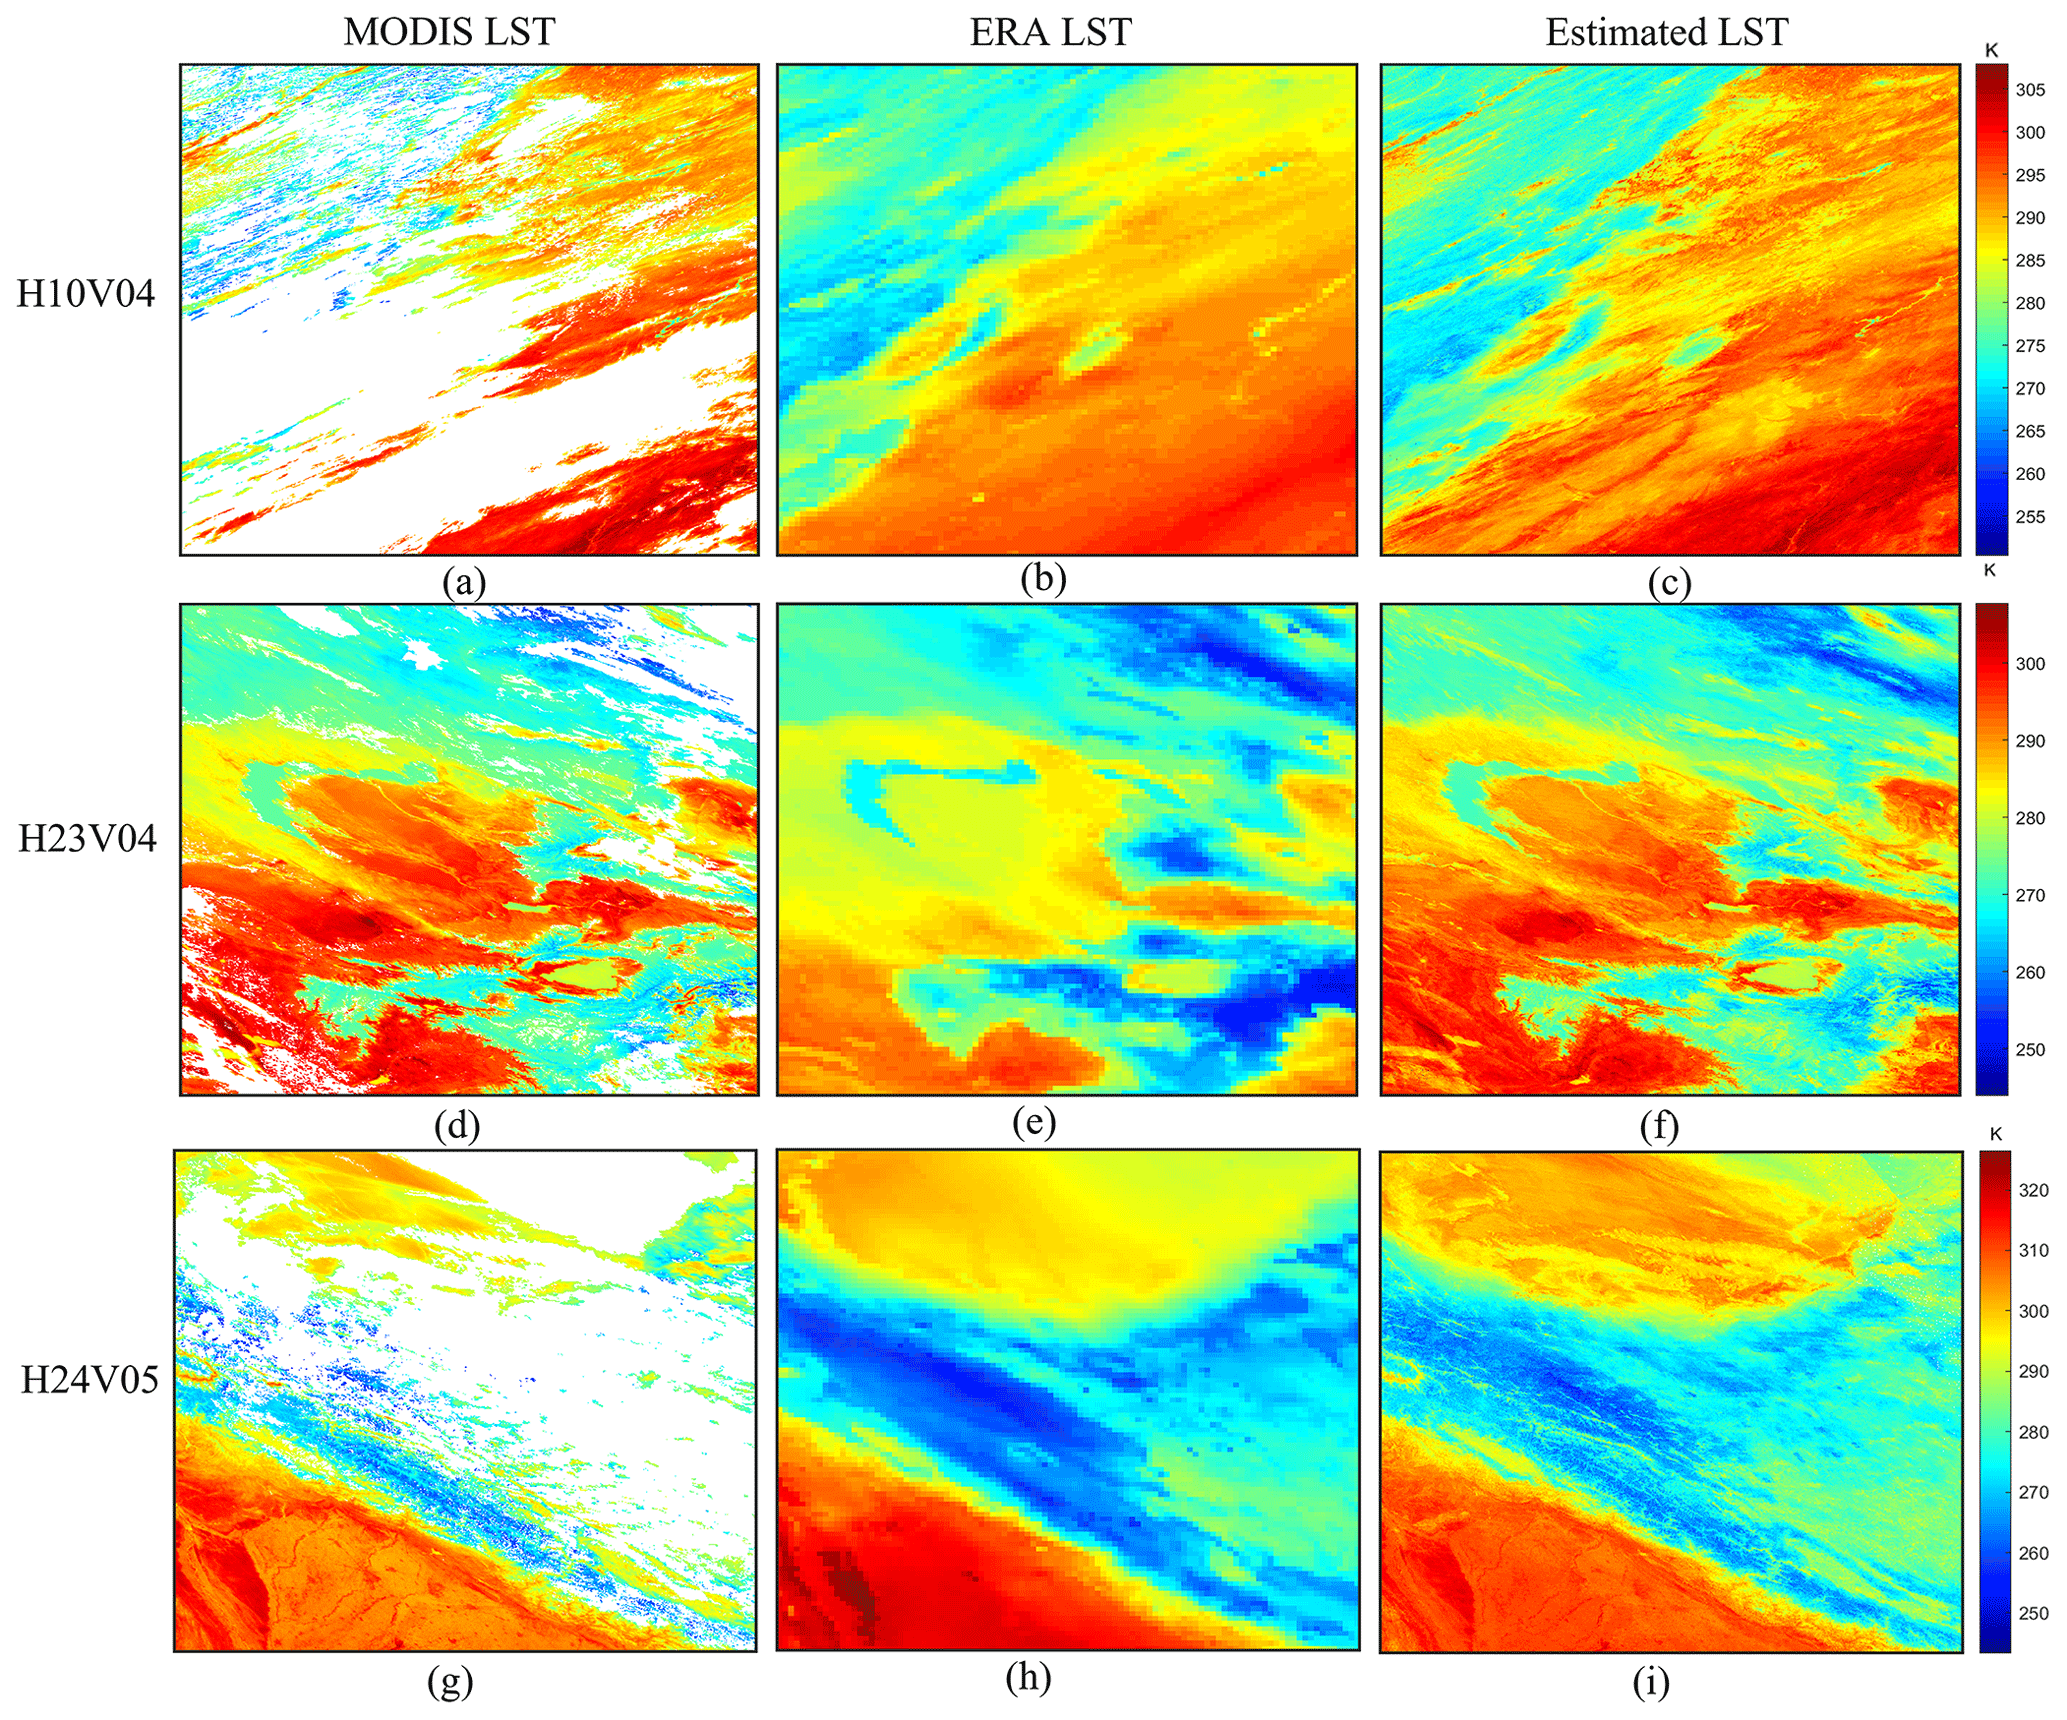
Figure 13Spatial details of the MODIS LST (a, d, g), ERA LST (b, e, h), and estimated instantaneous LST (c, f, i) of three tiles, H10V04 (a, b, c), H23V04 (d, e, f), and H24V05 (g, h, i) from the 90th day in 2010.
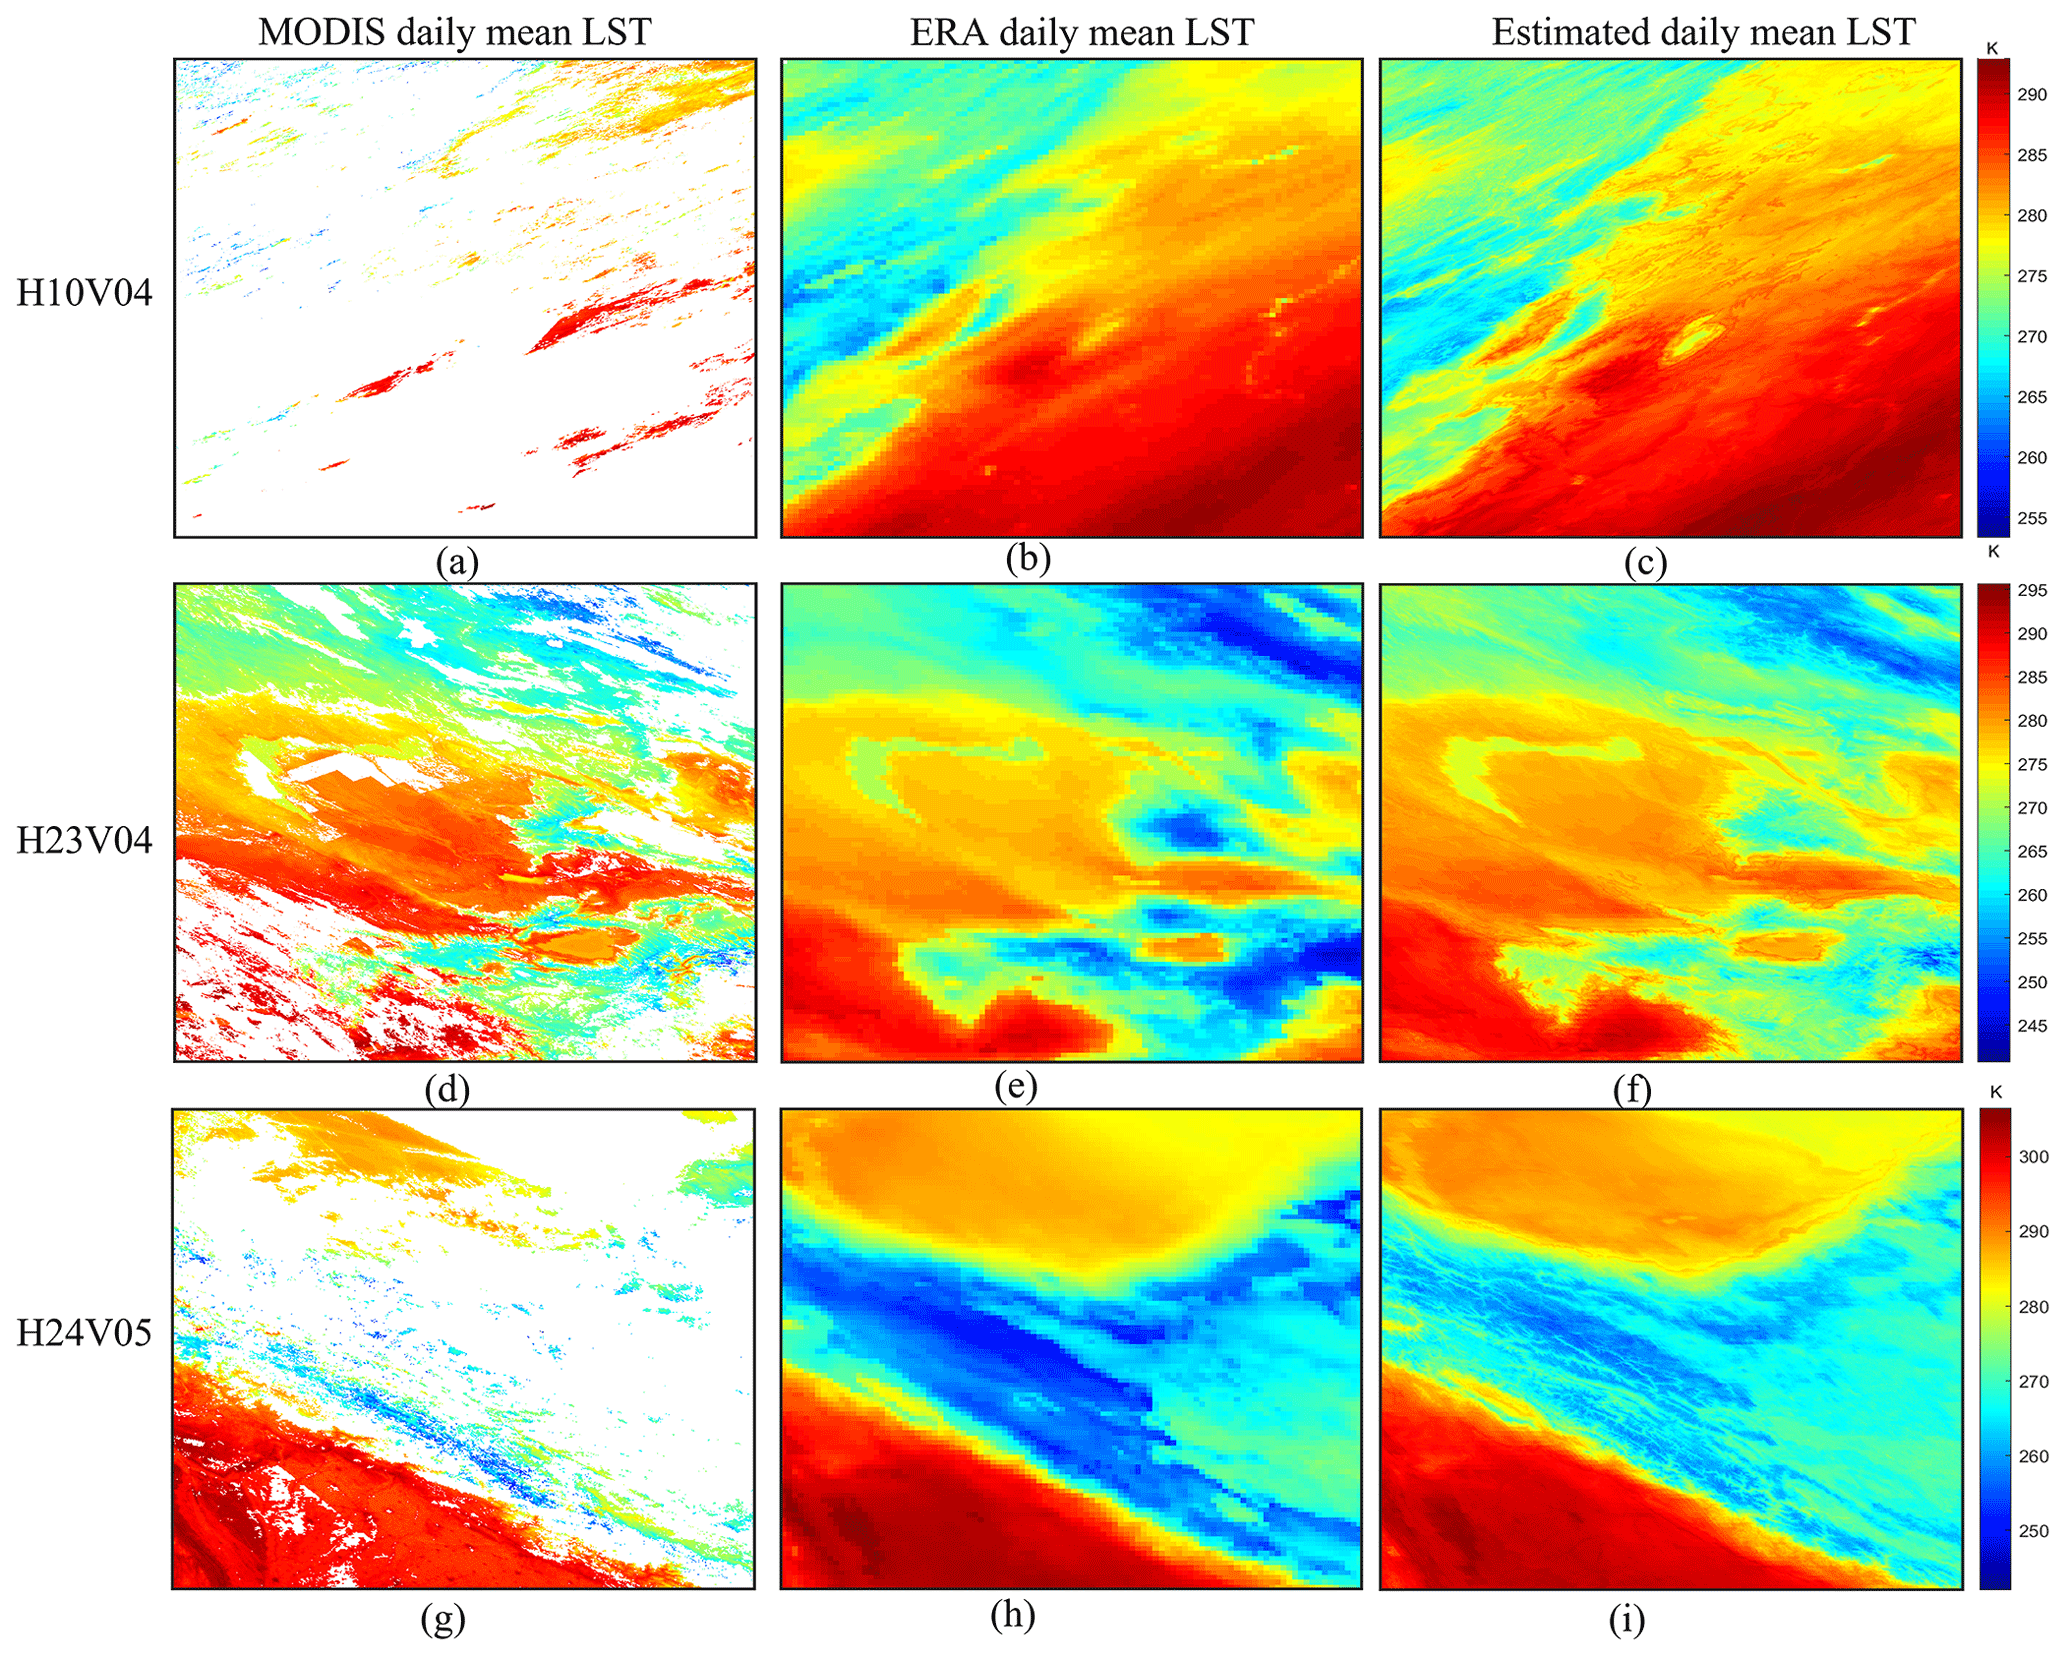
Figure 14Spatial details of the daily mean LST retrieved from MODIS LST (a, d, g), ERA LST (b, e, h), and estimated daily mean LST (c, f, i) of three tiles, H10V04 (a, b, c), H23V04 (d, e, f), and H24V05 (g, h, i) from the 90th day in 2010.
The urban heat island effect is one of the main applications of LST data. To further assess the spatial details of the estimated all-weather LST and the potential of urban heat island applications, we selected four cities in different regions around the globe and demonstrated the estimated LST in conjunction with the boundary of urban regions extracted using global artificial impervious area data (Li et al., 2020), as shown in Fig. 15. The figure shows that the built-up areas of four cities present higher LSTs than the periphery, and confirms that our estimated all-weather LSTs can capture the urban heat island phenomenon and present relevant details.
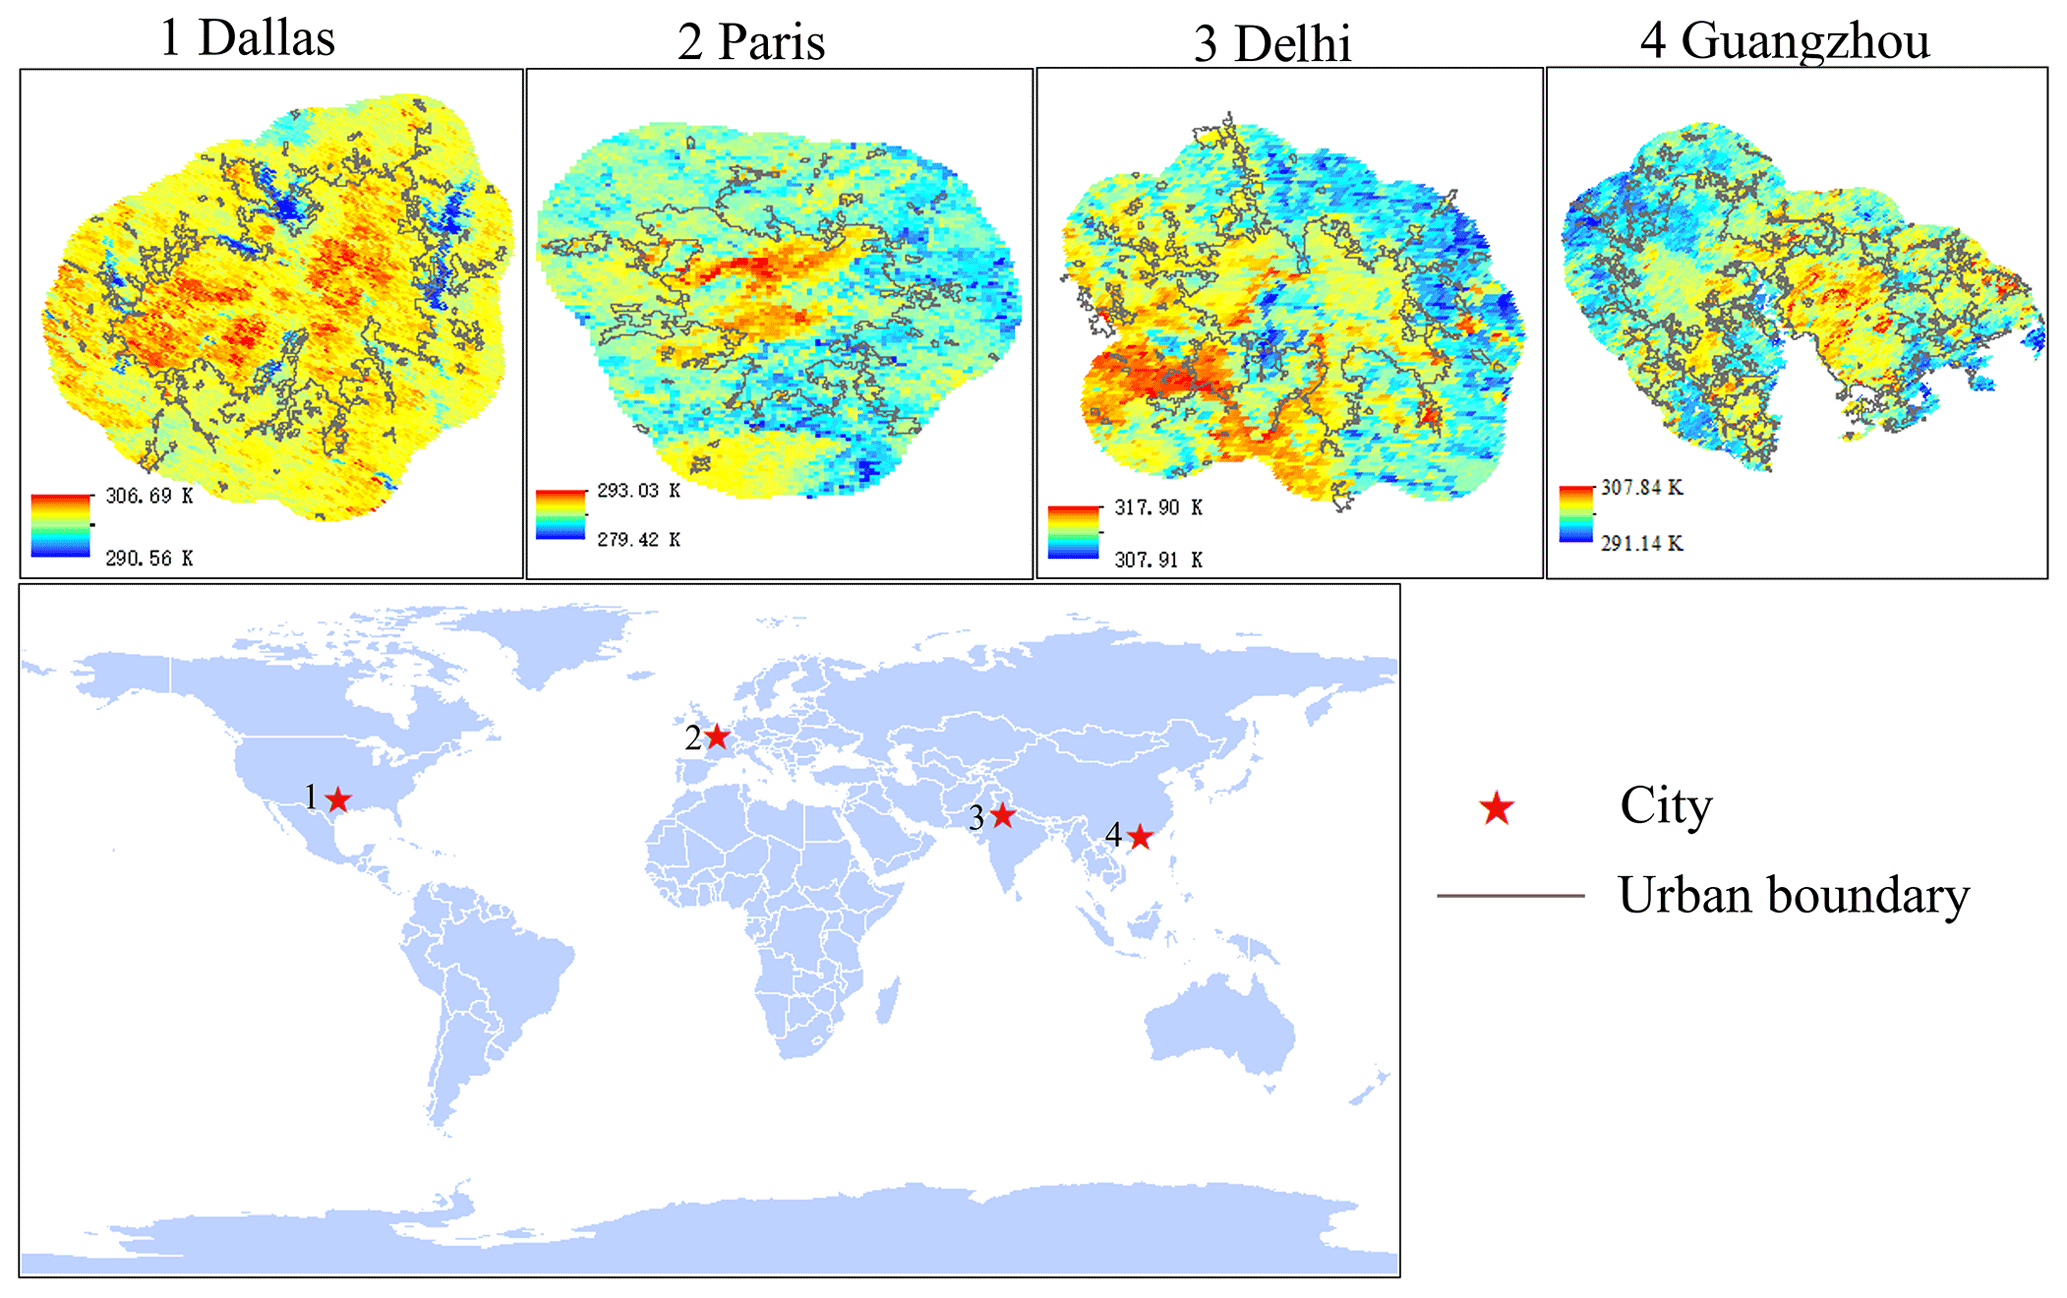
Figure 15Spatial pattern of the estimated all-weather LST in four representative cities. The black lines are the boundary of urban regions extracted using global artificial impervious area data.
In addition, Figs. 16 and 17 show the estimated instantaneous and daily mean LST on the global scale on days 90 and 270 of 2010. The instantaneous and daily mean LST from MODIS LST are shown for comparison. The estimated instantaneous and daily LSTs had similar spatial patterns to the corresponding LST from MODIS. All of the results reflected broad spatiotemporal variations. For instance, LSTs were relatively higher at middle and low latitudes and lower in the Arctic and Antarctic. The instantaneous LST exhibited a larger range than the daily mean LST. In addition, the proposed method achieved the all-weather LST retrievals. For the instantaneous LST (Fig. 16), a small number of gaps in tropical regions were there due to the polar-orbiting satellite configuration. The daily mean LST (Fig. 17) was spatially continuous. Overall, the proposed instantaneous LST and daily mean LST perform well on a global scale.
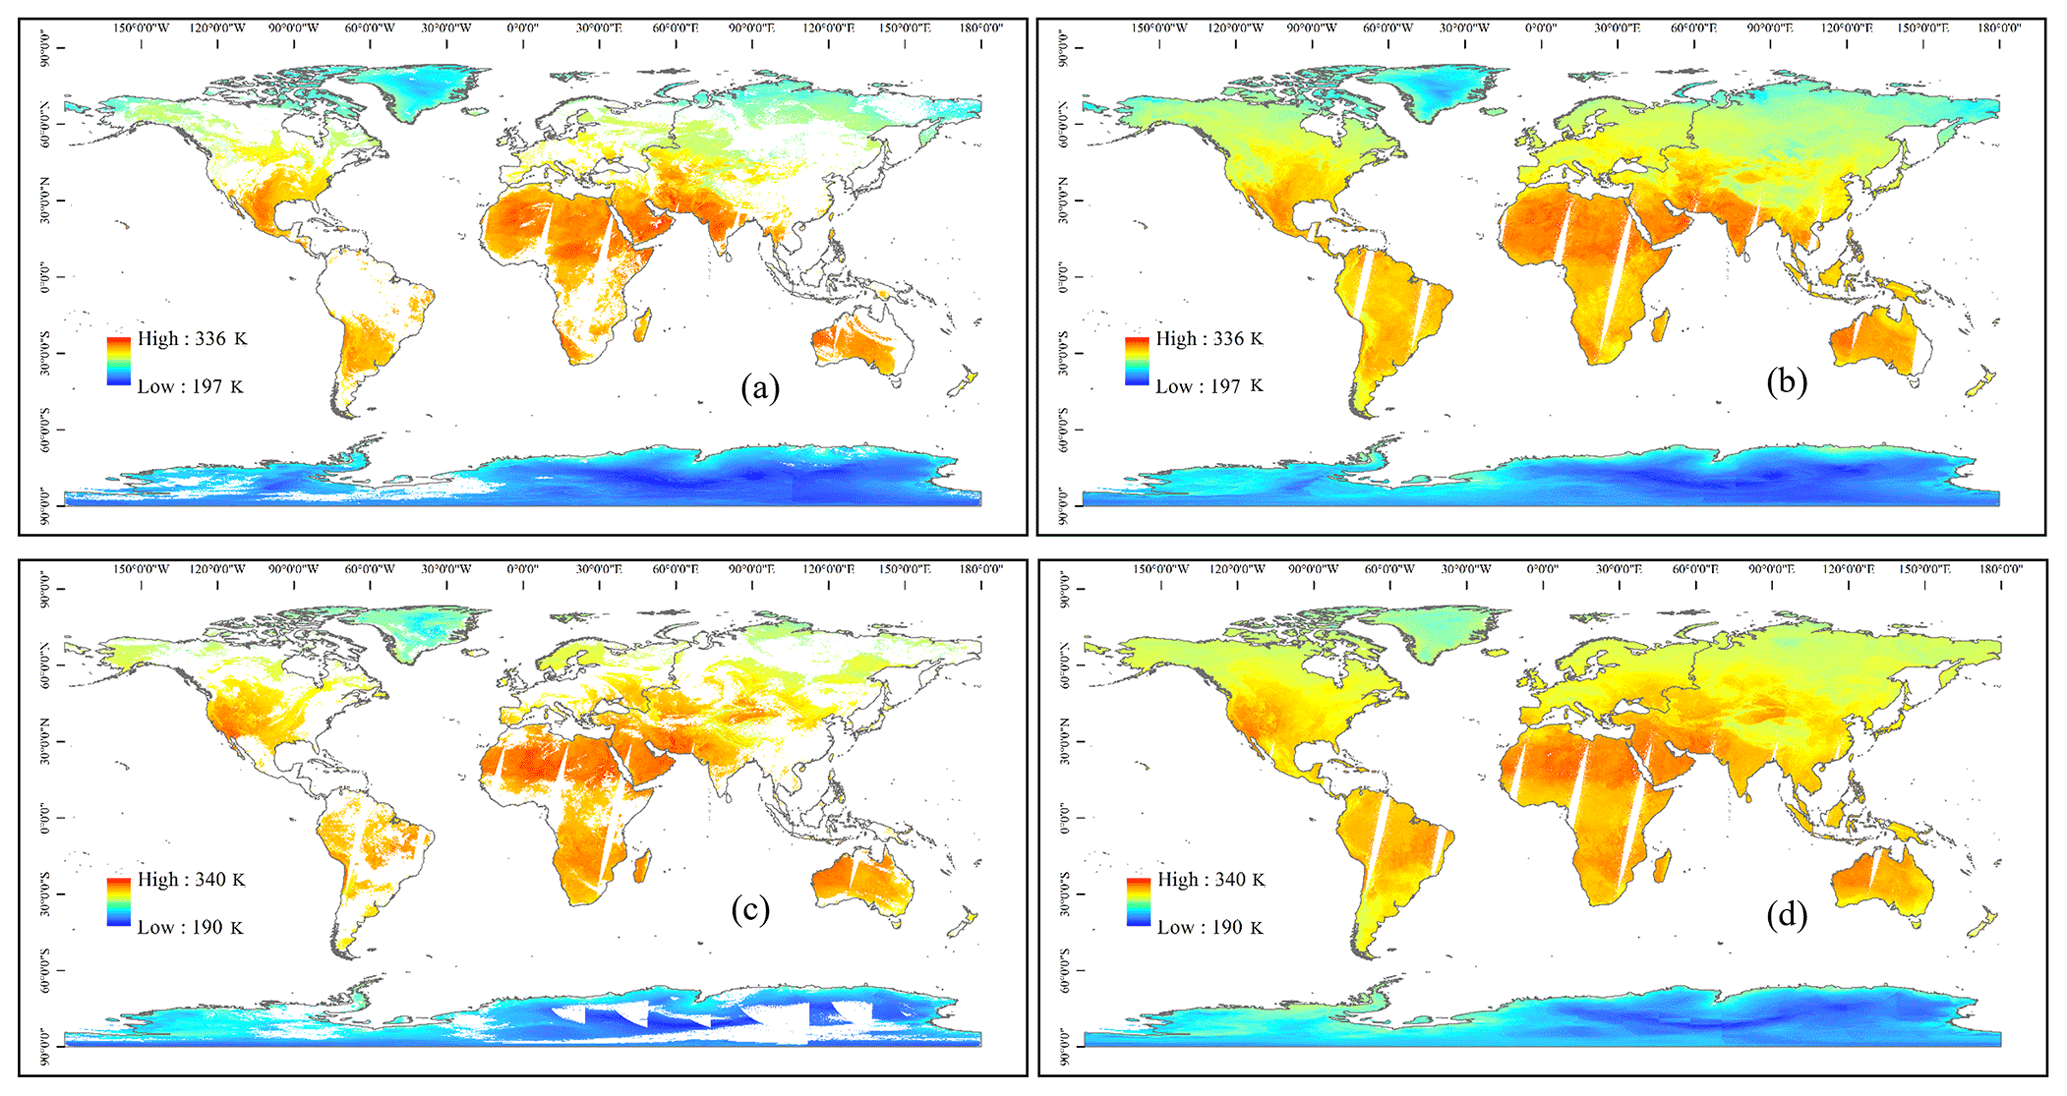
Figure 16Spatial patterns of MODIS LST (a, c) and estimated instantaneous LST (b, d) on a global scale on days 90 (first row) and 270 (second row) of 2010.
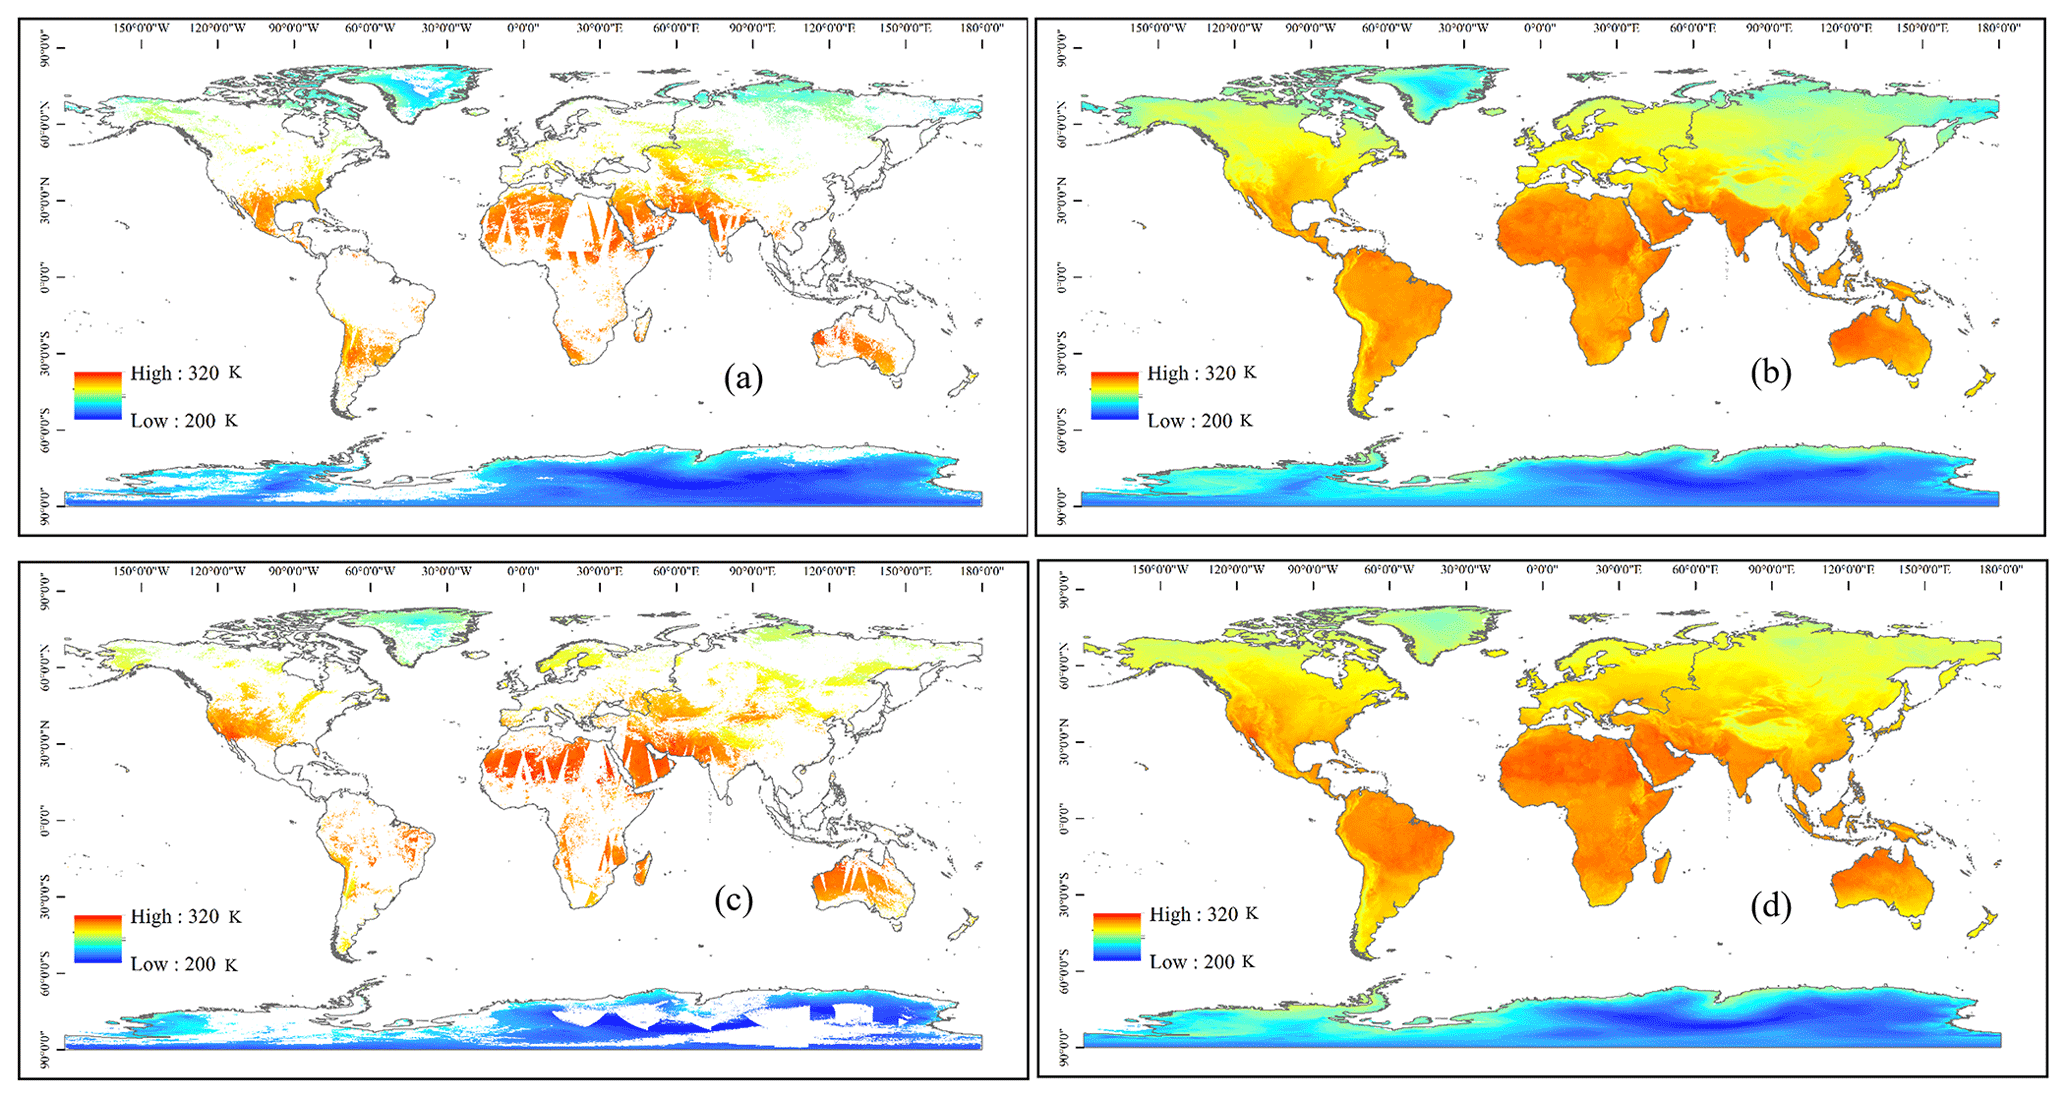
Figure 17Spatial patterns of daily mean LST retrieved from (a, c) MODIS LST and (b, d) estimated daily mean LST on a global scale on days 90 (first row) and 270 (second row) of 2010.
Although several LST satellite products have been published, they are missing data for cloudy-sky conditions. Existing research on all-weather LST has mostly been conducted at the regional scale. This study proposes a highly accurate and efficient algorithm to retrieve all-weather LST on a global scale from multisource data, including MODIS TOA, surface radiation, reanalysis, and in situ data. An all-weather daily mean LST algorithm was also proposed. Both the estimated instantaneous and daily mean LST had acceptable accuracy. In addition, the algorithm performs well based on independent ground measurements and space–time verification.
5.1 Effect of introducing MODIS TOA information and ERA LST
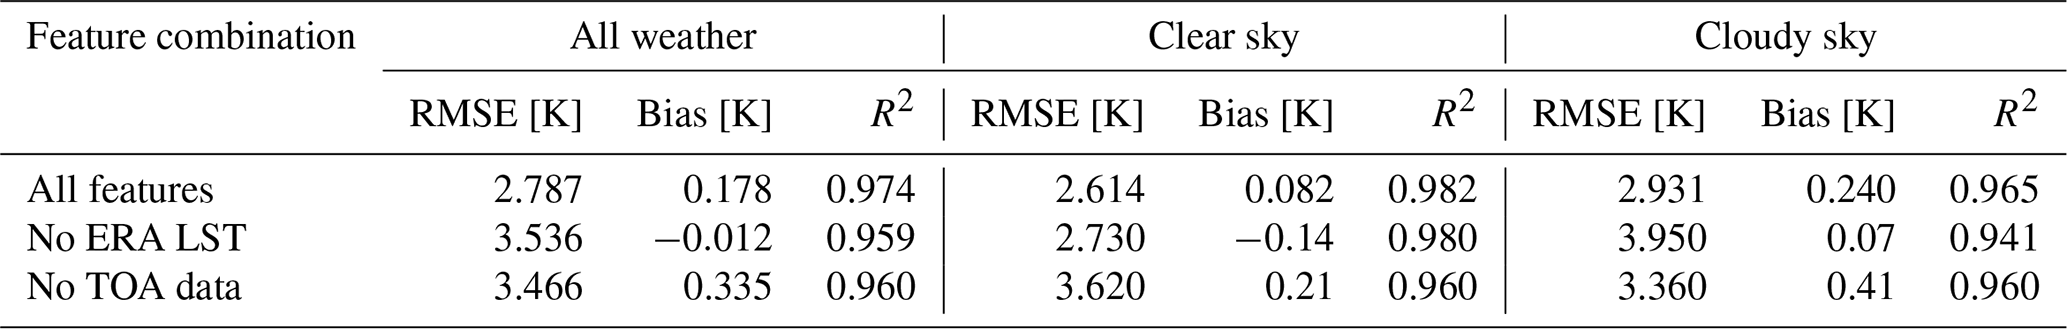
In view of the complexity of global climate conditions and to include more information to estimate the all-weather LST, we introduced MODIS TOA data on the basis of using surface variables. In addition, since the Global Land Data Assimilation System (GLDAS) LST used in previous studies did not have global coverage (the Antarctica region was missing), we introduced the ERA LST in this study, which has not only global coverage, but also a higher spatiotemporal resolution (0.1° and 1 h). We conducted experiments with combinations of different features to clarify the effect of introducing MODIS TOA information and ERA LST under different weather conditions. A comparison between the removal of ERA LST and MODIS TOA data in the models is shown in Table 6. The results show that when the ERA LST and TOA data were removed, the accuracy of the model greatly reduced. The RMSEs increased from 2.787 to 3.536 and 3.466 K when ERA LST and TOA data were removed, respectively. However, the accuracy changes in the two feature combinations under different weather conditions were significantly different. When ERA LST was eliminated, although the accuracies of both weather conditions were reduced, the RMSE increase for the cloudy sky (0.95 K) was significantly greater than that for the clear sky (0.09 K). When the TOA data were removed, the results were the opposite. The accuracy of clear-sky LST estimation significantly decreased. Overall, introducing MODIS TOA information and ERA LST significantly improved the model accuracy. In addition, it can be inferred that ERA LST provides more effective information for cloudy-sky LST estimation, while TOA data contribute more to clear-sky conditions.
Table 6The accuracy of the independent dataset with different feature combinations for the instantaneous LST model.
5.2 Effect of station density on the model accuracy
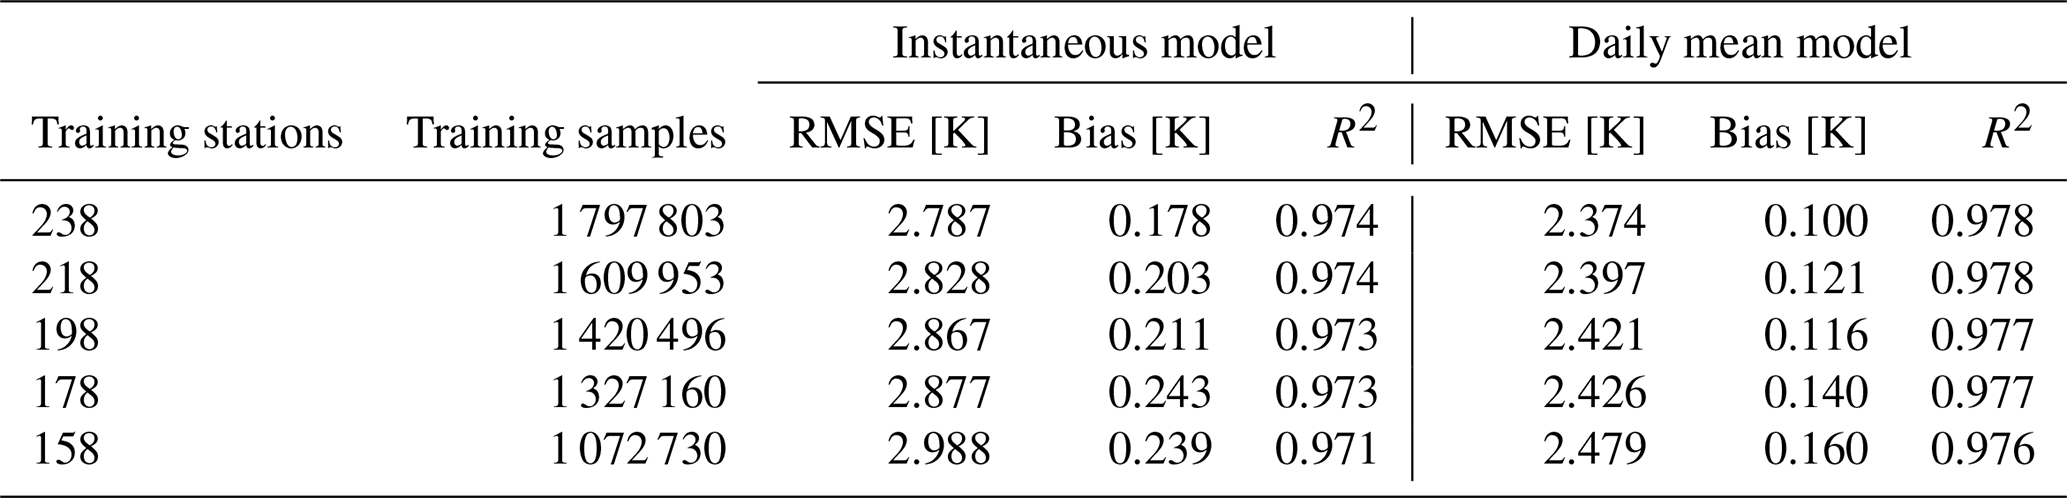
To further evaluate the station density on the model accuracy, experiments were conducted with different station densities. Firstly, the stations were reduced randomly in the training dataset, and the model performance was evaluated based on the same test samples. The accuracies of the instantaneous and daily mean models are shown in Table 7. The results show that the accuracy of both models decreases as the number of stations in the training sample decreases. When the number of stations in the training sample is reduced from 238 to 158, the RMSE of the instantaneous model increases from 2.787 to 2.988 K and the RMSE of the daily model increases from 2.374 to 2.479 K. The experiment indicates that the model accuracy is affected by the station density but to a limited extent when there is a sufficient number of samples. It may be that the long time series of station data used in the experiment provided relatively sufficient samples.
Table 7The training and testing accuracy of instantaneous and daily mean LST with the number of stations decreasing in the model training.
5.3 Effect of multiple MODIS observations
In contrast to most studies using MODIS data in sinusoidal projection, we used swath-type MODIS data to estimate the daily mean LST in this study. MODIS swath data can provide a higher number of observations, particularly at high latitudes. Furthermore, we statistically analyzed the relationship between the daily mean LST model error and MODIS observation frequency. Figure 18 shows that the error decreased with an increase in the MODIS observation frequency. For high-latitude areas with more observations, the model accuracy at high latitudes was improved. This demonstrates the superiority of using MODIS data in swath types with more observations to construct a daily mean LST model.
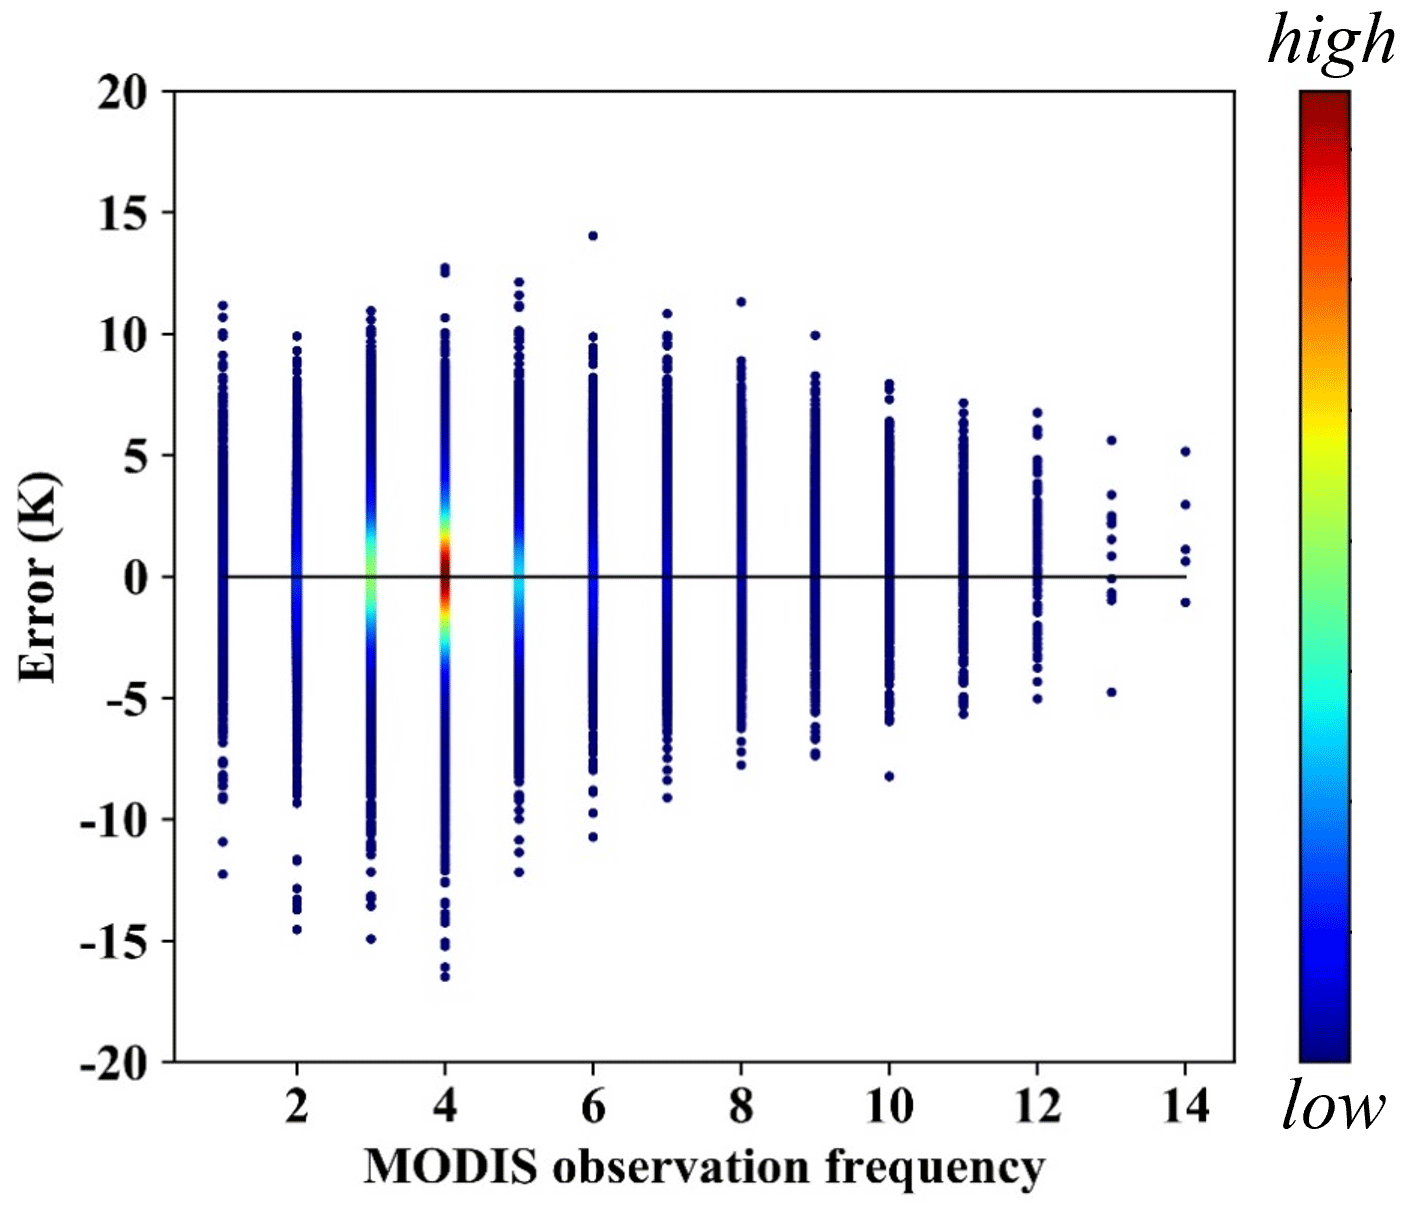
Figure 18Density plots of daily mean LST model error with respect to MODIS observation frequency.
5.4 Effect of in situ measurements in the model
In contrast to previous studies that used machine learning algorithms, in situ measurements were used to construct the model instead of clear-sky MODIS LST. In situ measurements can obtain the real LST under cloudy-sky conditions without obtaining the hypothetical LST from clear-sky MODIS LST. In addition, LST from in situ measurements is close to the hemispherical LST or observing the LST from the zenith. In contrast, MODIS LST is a directional LST, with view angles ranging from 0° to >60°, resulting in a significant thermal radiation directionality (TRD) effect (Cao et al., 2019; Ermida et al., 2017). This results in a difference in the LST of the same object at different observation angles. Theoretically, the proposed instantaneous LST weakens the influence of the TRD effect, which was been confirmed in our previous study (Li et al., 2021).
5.5 Effect of the new algorithm on product generation
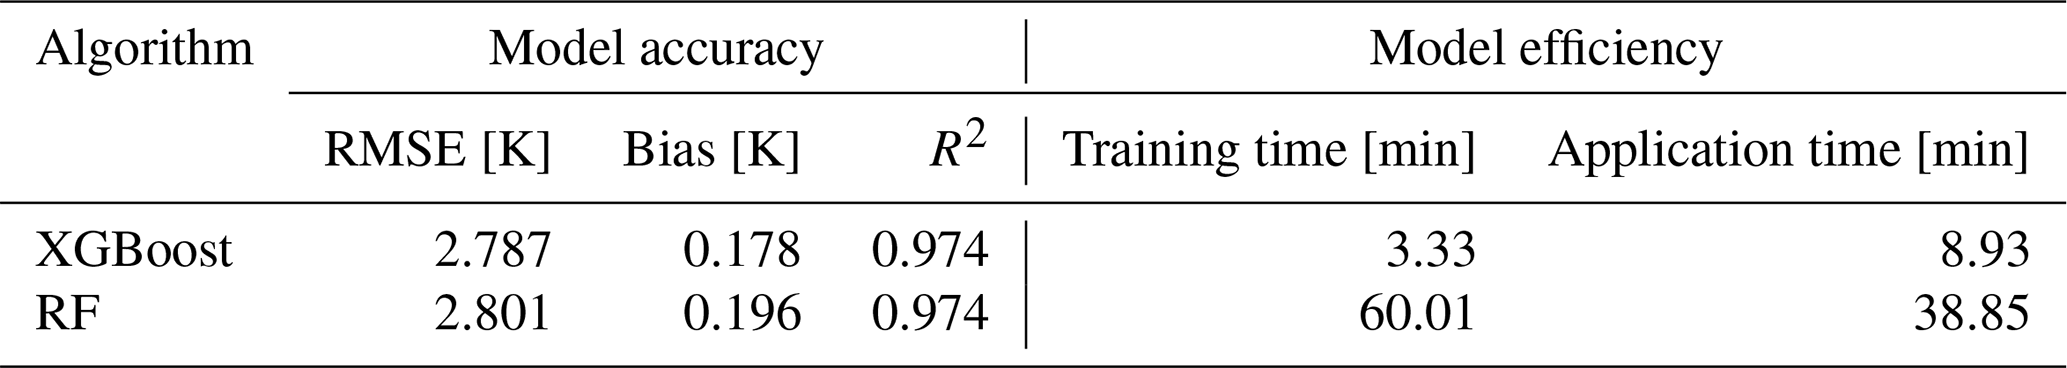
In a previous study, a RF algorithm was used to estimate the all-weather LST over the conterminous United States (Li et al., 2021). Although the RF algorithm performs well, the application efficiency needs to be considered for generating global products. Hence, the model accuracy and efficiency were compared using RF and XGBoost. The model accuracies of RF and XGBoost were comparable, with RMSEs of 2.787 and 2.801 K, respectively (Table 8). However, training the XGBoost model took significantly less time, taking up 3.33 min compared to 60.01 min for RF training. XGBoost also showed outstanding performance in the model application. As an example, XGBoost took 8.93 min to produce 100 LST swath-type images, while the RF model took 38.85 min (Table 8). Considering the quantities of swath files on the global scale, XGBoost is a better choice for long-sequence product generation, with high accuracy and efficiency.
Table 8Comparison of algorithms of model accuracy and efficiency.
5.6 Limitations
However, this study has certain limitations. Despite enhancements in LST accuracy on ice and snow surfaces, accuracy remains comparatively lower in barren and urban areas. Additionally, while the study aimed to select the highest possible number of representative ground stations for the long-term sequence, the spatial distribution was non-uniform, potentially impacting the generality of data-driven models. Furthermore, the accuracy of the high-altitude model was marginally lower, which can possibly be attributed to the complex climatic environment and topographic conditions. For mountainous areas with complex terrain, there may be boundary effects, which is probably due to the reanalysis data with coarse resolution. Future investigations could employ advanced methods, such as deep learning, to develop a more adaptive model that incorporates spatial and temporal information. Moreover, integration with other satellite sensors has the potential to extend the temporal–spatial resolution and time span of all-weather LST products.
The global all-weather LST data at monthly scale from 2000–2020 can be freely downloaded from https://doi.org/10.5281/zenodo.4292068 (Li et al., 2024), the daily mean LST on the first day of year 2010 is freely available at Li et al. (2024), and all data will be available at https://glass-product.bnu.edu.cn/dload.html (Li and Liang, 2024).
LST is a crucial parameter of the Earth's energy budget, and current LST satellite products are affected by cloud contamination, resulting in missing values. This study attempted to retrieve all-weather instantaneous and daily mean LSTs on a global scale. A new framework that generates a global, long-sequence LST product is proposed. Multiple all-weather datasets from MODIS TOA observations, surface radiation data, geolocation data, reanalysis data, and ground measurements were used to construct the models.
Based on the XGBoost algorithm and multisource data from 2002–2018, all-weather instantaneous and daily mean LST models were successively built. The validation of the independent dataset showed high accuracy. The 10-fold cross validation demonstrated the robustness of the models. For the instantaneous LST model, clear-sky LST showed higher accuracy than cloudy-sky LST, while cloud contamination had limited effects on daily mean LST estimations. Both models performed well for most land cover types and geolocation conditions. The time series for validation at the four sites from different regions was temporally contiguous. The results showed high consistency with in situ measurements and the corresponding official MODIS LST. The spatial distributions of MODIS tiles showed more spatial details than the ERA LST. Global mapping illustrated spatial continuity and similar patterns with instantaneous and daily mean LSTs from the official MODIS LST data.
Compared with previous products, adding TOA observations effectively improved the accuracy of the instantaneous model, especially under clear-sky conditions. Moreover, multiple effective swath-type observations from the MODIS data significantly improved the accuracy of the daily mean LST model. In contrast to the MODIS and ERA LSTs, the proposed all-weather method has a higher accuracy and is less affected by cloud contamination, especially at high latitudes. In terms of product generation, XGBoost has higher precision and efficiency compared with RF and provides effective support for mass data production.
Overall, the proposed models were effective and robust, demonstrating the potential of estimating all-weather instantaneous and daily mean LSTs from multisource data. The constructed models can be used to generate long-sequence LST products from 2000 to the present. The generated product is a combination of 1 km all-weather instantaneous and daily mean LST products on a global scale. It has great significance for studies on climate change, surface energy balance, and many other scientific fields. In the future, new methods involving spatial and temporal information, as well as other satellite sensors, should be considered to expand the spatiotemporal monitoring capabilities of LST products.
SL and BL developed the methodology and designed the experiments. BL, HM, XL, and YZ collected and processed the data. BL wrote the first draft of the paper under the supervision of other authors. All authors participated in the review and editing of the paper.
At least one of the (co-)authors is a member of the editorial board of Earth System Science Data. The peer-review process was guided by an independent editor, and the authors also have no other competing interests to declare.
Publisher's note: Copernicus Publications remains neutral with regard to jurisdictional claims made in the text, published maps, institutional affiliations, or any other geographical representation in this paper. While Copernicus Publications makes every effort to include appropriate place names, the final responsibility lies with the authors.
We gratefully acknowledge the data support from the National Earth System Science Data Center of the National Science & Technology Infrastructure of China (http://www.geodata.cn, last access: 22 August 2024). The product can also be downloaded from https://glass-product.bnu.edu.cn (last access: 22 August 2024). We also thank the National Aeronautics and Space Administration team for providing the MODIS product data as a free download via the following website: https://earthdata.nasa.gov/ (last access: 22 August 2024). We also appreciated that the ERA5-Land reanalysis data are available at https://cds.climate.copernicus.eu/ (last access: 22 August 2024). Additionally, authors would like to acknowledge several networks, including AmeriFlux, AsiaFlux, ARM, BSRN, FLUXNET, IMAU, PROMICE, and TPDC, which provide valuable ground measurements in this study.
This research has been supported by the National Natural Science Foundation of China (grant nos. 42301438 and 42090011), the Key Scientific and Technological Project of Henan Province (grant no. 232102321103), and a project funded by the China Postdoctoral Science Foundation (grant no. 2023M730941).
This paper was edited by Jing Wei and reviewed by two anonymous referees.
Aires, F., Prigent, C., and Rossow, W. B.: Temporal interpolation of global surface skin temperature diurnal cycle over land under clear and cloudy conditions, J. Geophys. Res.-Atmos., 109, 313–331, https://doi.org/10.1029/2003JD003527, 2004.
Auger, M., Morrow, R., Kestenare, E., Sallee, J. B., and Cowley, R.: Southern Ocean in-situ temperature trends over 25 years emerge from interannual variability, Nat. Commun., 12, 514, https://doi.org/10.1038/s41467-020-20781-1, 2021.
Baldocchi, D., Falge, E., Gu, L., Olson, R., Hollinger, D., Running, S., Anthoni, P., Bernhofer, C., Davis, K., Evans, R., Fuentes, J., Goldstein, A., Katul, G., Law, B., Lee, X., Malhi, Y., Meyers, T., Munger, W., Oechel, W., Paw, K. T., Pilegaard, K., Schmid, H. P., Valentini, R., Verma, S., Vesala, T., Wilson, K., and Wofsy, S.: FLUXNET: A New Tool to Study the Temporal and Spatial Variability of Ecosystem–Scale Carbon Dioxide, Water Vapor, and Energy Flux Densities, B. Am. Meteorol. Soc., 82, 2415–2434, https://doi.org/10.1175/1520-0477(2001)082<2415:fantts>2.3.co;2, 2001.
Baldocchi, D. D.: Assessing the eddy covariance technique for evaluating carbon dioxide exchange rates of ecosystems: past, present and future, Global Change Biol., 9, 479–492, https://doi.org/10.1046/j.1365-2486.2003.00629.x, 2003.
Bastiaanssen, W. G., Menenti, M., Feddes, R., and Holtslag, A.: A remote sensing surface energy balance algorithm for land (SEBAL). 1. Formulation, J. Hydrol., 212, 198–212, 1998.
Breiman, L.: Random forests, Mach. Learn., 45, 5–32, https://doi.org/10.1023/a:1010933404324, 2001.
Cao, B., Liu, Q., Du, Y., Roujean, J.-L., Gastellu-Etchegorry, J.-P., Trigo, I. F., Zhan, W., Yu, Y., Cheng, J., Jacob, F., Lagouarde, J.-P., Bian, Z., Li, H., Hu, T., and Xiao, Q.: A review of earth surface thermal radiation directionality observing and modeling: Historical development, current status and perspectives, Remote Sens. Environ., 232, 111304, https://doi.org/10.1016/j.rse.2019.111304, 2019.
Chen, B., Huang, B., and Xu, B.: Comparison of Spatiotemporal Fusion Models: A Review, Remote Sens., 7, 1798–1835, https://doi.org/10.3390/rs70201798, 2015.
Chen, T. and Guestrin, C.: Xgboost: A scalable tree boosting system, Proceedings of the 22nd acm sigkdd international conference on knowledge discovery and data mining, San Francisco, California, USA, https://doi.org/10.1145/2939672.2939785, 785–794, 2016.
Chen, Y., Liang, S., Ma, H., Li, B., He, T., and Wang, Q.: An all-sky 1 km daily land surface air temperature product over mainland China for 2003–2019 from MODIS and ancillary data, Earth Syst. Sci. Data, 13, 4241–4261, https://doi.org/10.5194/essd-13-4241-2021, 2021.
Cheng, J. and Liang, S.: Estimating global land surface broadband thermal-infrared emissivity using advanced very high resolution radiometer optical data, Int. J. Digit. Earth, 6, 34–49, 2013.
Cheng, J. and Liang, S.: Global Estimates for High-Spatial-Resolution Clear-Sky Land Surface Upwelling Longwave Radiation From MODIS Data, IEEE T. Geosci. Remote, 54, 4115–4129, https://doi.org/10.1109/tgrs.2016.2537650, 2016.
Cheng, J., Liang, S., Wang, W., and Guo, Y.: An efficient hybrid method for estimating clear-sky surface downward longwave radiation from MODIS data, J. Geophys. Res.-Atmos., 122, 2616–2630, https://doi.org/10.1002/2016jd026250, 2017.
Driemel, A., Augustine, J., Behrens, K., Colle, S., Cox, C., Cuevas-Agulló, E., Denn, F. M., Duprat, T., Fukuda, M., Grobe, H., Haeffelin, M., Hodges, G., Hyett, N., Ijima, O., Kallis, A., Knap, W., Kustov, V., Long, C. N., Longenecker, D., Lupi, A., Maturilli, M., Mimouni, M., Ntsangwane, L., Ogihara, H., Olano, X., Olefs, M., Omori, M., Passamani, L., Pereira, E. B., Schmithüsen, H., Schumacher, S., Sieger, R., Tamlyn, J., Vogt, R., Vuilleumier, L., Xia, X., Ohmura, A., and König-Langlo, G.: Baseline Surface Radiation Network (BSRN): structure and data description (1992–2017), Earth Syst. Sci. Data, 10, 1491–1501, https://doi.org/10.5194/essd-10-1491-2018, 2018.
Duan, S.-B., Li, Z.-L., Wang, N., Wu, H., and Tang, B.-H.: Evaluation of six land-surface diurnal temperature cycle models using clear-sky in situ and satellite data, Remote Sens. Environ., 124, 15–25, https://doi.org/10.1016/j.rse.2012.04.016, 2012.
Duan, S.-B., Li, Z.-L., Tang, B.-H., Wu, H., Tang, R., Bi, Y., and Zhou, G.: Estimation of Diurnal Cycle of Land Surface Temperature at High Temporal and Spatial Resolution from Clear-Sky MODIS Data, Remote Sens., 6, 3247–3262, https://doi.org/10.3390/rs6043247, 2014.
Duan, S.-B., Li, Z.-L., Cheng, J., and Leng, P.: Cross-satellite comparison of operational land surface temperature products derived from MODIS and ASTER data over bare soil surfaces, ISPRS J. Photogramm. Remote, 126, 1–10, https://doi.org/10.1016/j.isprsjprs.2017.02.003, 2017a.
Duan, S.-B., Li, Z.-L., and Leng, P.: A framework for the retrieval of all-weather land surface temperature at a high spatial resolution from polar-orbiting thermal infrared and passive microwave data, Remote Sens. Environ., 195, 107–117, https://doi.org/10.1016/j.rse.2017.04.008, 2017b.
Duan, S. B., Li, Z. L., Li, H., Gottsche, F. M., Wu, H., Zhao, W., Leng, P., Zhang, X., and Coll, C.: Validation of Collection 6 MODIS land surface temperature product using in situ measurements, Remote Sens. Environ., 225, 16–29, https://doi.org/10.1016/j.rse.2019.02.020, 2019.
Duan, S.-B., Lian, Y., Zhao, E., Chen, H., Han, W., and Wu, Z.: A Novel Approach to All-Weather LST Estimation Using XGBoost Model and Multisource Data, IEEE T. Geosci. Remote, 61, 1–14, https://doi.org/10.1109/tgrs.2023.3324481, 2023.
Ermida, S. L., DaCamara, C. C., Trigo, I. F., Pires, A. C., Ghent, D., and Remedios, J.: Modelling directional effects on remotely sensed land surface temperature, Remote Sens. Environ., 190, 56–69, https://doi.org/10.1016/j.rse.2016.12.008, 2017.
Hersbach, H., Bell, B., Berrisford, P., Hirahara, S., Horányi, A., Muñoz-Sabater, J., Nicolas, J., Peubey, C., Radu, R., Schepers, D., Simmons, A., Soci, C., Abdalla, S., Abellan, X., Balsamo, G., Bechtold, P., Biavati, G., Bidlot, J., Bonavita, M., Chiara, G., Dahlgren, P., Dee, D., Diamantakis, M., Dragani, R., Flemming, J., Forbes, R., Fuentes, M., Geer, A., Haimberger, L., Healy, S., Hogan, R. J., Hólm, E., Janisková, M., Keeley, S., Laloyaux, P., Lopez, P., Lupu, C., Radnoti, G., Rosnay, P., Rozum, I., Vamborg, F., Villaume, S., and Thépaut, J. N.: The ERA5 global reanalysis, Q. J. Roy. Meteor. Soc., 146, 1999–2049, https://doi.org/10.1002/qj.3803, 2020.
Holmes, T. R. H., De Jeu, R. A. M., Owe, M., and Dolman, A. J.: Land surface temperature from Ka band (37 GHz) passive microwave observations, J. Geophys. Res., 114, D04113, https://doi.org/10.1029/2008jd010257, 2009.
Hong, F., Zhan, W., Göttsche, F.-M., Lai, J., Liu, Z., Hu, L., Fu, P., Huang, F., Li, J., Li, H., and Wu, H.: A simple yet robust framework to estimate accurate daily mean land surface temperature from thermal observations of tandem polar orbiters, Remote Sens. Environ., 264, 112612, https://doi.org/10.1016/j.rse.2021.112612, 2021.
Hong, F., Zhan, W., Göttsche, F.-M., Liu, Z., Dong, P., Fu, H., Huang, F., and Zhang, X.: A global dataset of spatiotemporally seamless daily mean land surface temperatures: generation, validation, and analysis, Earth Syst. Sci. Data, 14, 3091–3113, https://doi.org/10.5194/essd-14-3091-2022, 2022.
Inamdar, A. K., French, A., Hook, S., Vaughan, G., and Luckett, W.: Land surface temperature retrieval at high spatial and temporal resolutions over the southwestern United States, J. Geophys. Res., 113, D07107, https://doi.org/10.1029/2007jd009048, 2008.
Jia, A., Ma, H., Liang, S., and Wang, D.: Cloudy-sky land surface temperature from VIIRS and MODIS satellite data using a surface energy balance-based method, Remote Sens. Environ., 263, 112566, https://doi.org/10.1016/j.rse.2021.112566, 2021.
Jia, A., Liang, S., and Wang, D.: Generating a 2-km, all-sky, hourly land surface temperature product from Advanced Baseline Imager data, Remote Sens. Environ., 278, 113105, https://doi.org/10.1016/j.rse.2022.113105, 2022.
Jia, A., Liang, S., Wang, D., Ma, L., Wang, Z., and Xu, S.: Global hourly, 5 km, all-sky land surface temperature data from 2011 to 2021 based on integrating geostationary and polar-orbiting satellite data, Earth Syst. Sci. Data, 15, 869–895, https://doi.org/10.5194/essd-15-869-2023, 2023.
Jin, M. and Dickinson, R. E.: A generalized algorithm for retrieving cloudy sky skin temperature from satellite thermal infrared radiances, J. Geophys. Res.-Atmos., 105, 27037–27047, https://doi.org/10.1029/2000jd900318, 2000.
Kalma, J. D., McVicar, T. R., and McCabe, M. F.: Estimating land surface evaporation: A review of methods using remotely sensed surface temperature data, Surv. Geophys., 29, 421–469, 2008.
Kappas, M. and Phan, T. N.: Application of MODIS land surface temperature data: a systematic literature review and analysis, J. Appl. Remote Sens., 12, 1, https://doi.org/10.1117/1.jrs.12.041501, 2018.
Kim, M., Brunner, D., and Kuhlmann, G.: Importance of satellite observations for high-resolution mapping of near-surface NO2 by machine learning, Remote Sens. Environ., 264, 112573, https://doi.org/10.1016/j.rse.2021.112573, 2021.
Lawrimore, J. H., Menne, M. J., Gleason, B. E., Williams, C. N., Wuertz, D. B., Vose, R. S., and Rennie, J.: An overview of the Global Historical Climatology Network monthly mean temperature data set, version 3, J. Geophys. Res., 116, D19121, https://doi.org/10.1029/2011jd016187, 2011.
Li, B. and Liang, S.: All-weather 1km land surface temperature at global scale from 2000–2020 from MODIS data, GLASS [data set], https://glass-product.bnu.edu.cn/dload.html (last access: 22 August 2024), 2024.
Li, B., Liang, S., Liu, X., Ma, H., Chen, Y., Liang, T., and He, T.: Estimation of all-sky 1 km land surface temperature over the conterminous United States, Remote Sens. Environ., 266, 112707, https://doi.org/10.1016/j.rse.2021.112707, 2021.
Li, B., Liang, S., Ma, H., Liu, X., He, T., and Zhang, Y.: All-weather 1 km land surface temperature at global scale from 2000–2020 from MODIS data, Zenodo [data set], https://doi.org/10.5281/zenodo.4292068, 2024.
Li, J.-H., Li, Z.-L., Liu, X., and Duan, S.-B.: A global historical twice-daily (daytime and nighttime) land surface temperature dataset produced by Advanced Very High Resolution Radiometer observations from 1981 to 2021, Earth Syst. Sci. Data, 15, 2189–2212, https://doi.org/10.5194/essd-15-2189-2023, 2023a.
Li, J.-H., Li, Z.-L., Liu, X., Duan, S.-B., Si, M., Shang, G., and Zhang, X.: A generalized method for retrieving global daily mean land surface temperature from polar-orbiting thermal infrared sensor instantaneous observations, Int. J. Remote Sens., 1–22, https://doi.org/10.1080/01431161.2023.2225229, 2023b.
Li, X., Gong, P., Zhou, Y., Wang, J., Bai, Y., Chen, B., Hu, T., Xiao, Y., Xu, B., Yang, J., Liu, X., Cai, W., Huang, H., Wu, T., Wang, X., Lin, P., Li, X., Chen, J., He, C., Li, X., Yu, L., Clinton, N., and Zhu, Z.: Mapping global urban boundaries from the global artificial impervious area (GAIA) data, Environ. Res. Lett., 15, 094044, https://doi.org/10.1088/1748-9326/ab9be3, 2020.
Li, Z.-L., Tang, B.-H., Wu, H., Ren, H., Yan, G., Wan, Z., Trigo, I. F., and Sobrino, J. A.: Satellite-derived land surface temperature: Current status and perspectives, Remote Sens. Environ., 131, 14–37, https://doi.org/10.1016/j.rse.2012.12.008, 2013.
Li, Z. L., Wu, H., Duan, S. B., Zhao, W., Ren, H., Liu, X., Leng, P., Tang, R., Ye, X., Zhu, J., Sun, Y., Si, M., Liu, M., Li, J., Zhang, X., Shang, G., Tang, B. H., Yan, G., and Zhou, C.: Satellite Remote Sensing of Global Land Surface Temperature: Definition, Methods, Products, and Applications, Rev. Geophys., 61, e2022RG000777, https://doi.org/10.1029/2022rg000777, 2023.
Liang, S., Zhao, X., Liu, S., Yuan, W., Cheng, X., Xiao, Z., Zhang, X., Liu, Q., Cheng, J., Tang, H., Qu, Y., Bo, Y., Qu, Y., Ren, H., Yu, K., and Townshend, J.: A long-term Global LAnd Surface Satellite (GLASS) data-set for environmental studies, Int. J. Digit. Earth, 6, 5–33, https://doi.org/10.1080/17538947.2013.805262, 2013.
Liang, S., Cheng, J., Jia, K., Jiang, B., Liu, Q., Xiao, Z., Yao, Y., Yuan, W., Zhang, X., Zhao, X., and Zhou, J.: The Global Land Surface Satellite (GLASS) Product Suite, B. Am. Meteorol. Soc., 102, E323–E337, https://doi.org/10.1175/bams-d-18-0341.1, 2021.
Liu, Q., Wang, L., Qu, Y., Liu, N., Liu, S., Tang, H., and Liang, S.: Preliminary evaluation of the long-term GLASS albedo product, Int. J. Digit. Earth, 6, 69–95, https://doi.org/10.1080/17538947.2013.804601, 2013.
Liu, S., Li, X., Xu, Z., Che, T., Xiao, Q., Ma, M., Liu, Q., Jin, R., Guo, J., Wang, L., Wang, W., Qi, Y., Li, H., Xu, T., Ran, Y., Hu, X., Shi, S., Zhu, Z., Tan, J., Zhang, Y., and Ren, Z.: The Heihe Integrated Observatory Network: A Basin-Scale Land Surface Processes Observatory in China, Vadose Zone J., 17, 180072, https://doi.org/10.2136/vzj2018.04.0072, 2018.
Liu, S. M., Xu, Z. W., Zhu, Z. L., Jia, Z. Z., and Zhu, M. J.: Measurements of evapotranspiration from eddy-covariance systems and large aperture scintillometers in the Hai River Basin, China, J. Hydrol., 487, 24–38, https://doi.org/10.1016/j.jhydrol.2013.02.025, 2013.
Liu, W., Cheng, J., and Wang, Q.: Estimating Hourly All-Weather Land Surface Temperature From FY-4A/AGRI Imagery Using the Surface Energy Balance Theory, IEEE T. Geosci. Remote, 61, 1–18, https://doi.org/10.1109/tgrs.2023.3254211, 2023.
Liu, X., Liang, S., Li, B., Ma, H., and He, T.: Mapping 30 m Fractional Forest Cover over China's Three-North Region from Landsat-8 Data Using Ensemble Machine Learning Methods, Remote Sens., 13, 2592, https://doi.org/10.3390/rs13132592, 2021.
Liu, Y., Ackerman, S. A., Maddux, B. C., Key, J. R., and Frey, R. A.: Errors in Cloud Detection over the Arctic Using a Satellite Imager and Implications for Observing Feedback Mechanisms, J. Climate, 23, 1894–1907, https://doi.org/10.1175/2009jcli3386.1, 2010.
Long, D., Yan, L., Bai, L., Zhang, C., Li, X., Lei, H., Yang, H., Tian, F., Zeng, C., Meng, X., and Shi, C.: Generation of MODIS-like land surface temperatures under all-weather conditions based on a data fusion approach, Remote Sens. Environ., 246, 111863, https://doi.org/10.1016/j.rse.2020.111863, 2020.
Ma, J., Zhou, J., Göttsche, F.-M., Liang, S., Wang, S., and Li, M.: A global long-term (1981–2000) land surface temperature product for NOAA AVHRR, Earth Syst. Sci. Data, 12, 3247–3268, https://doi.org/10.5194/essd-12-3247-2020, 2020.
Ma, J., Shen, H., Jiang, M., Lin, L., Meng, C., Zeng, C., Li, H., and Wu, P.: A mechanism-guided machine learning method for mapping gapless land surface temperature, Remote Sens. Environ., 303, 114001, https://doi.org/10.1016/j.rse.2024.114001, 2024.
Ma, L., Liu, Y., Zhang, X., Ye, Y., Yin, G., and Johnson, B. A.: Deep learning in remote sensing applications: A meta-analysis and review, ISPRS J. Photogramm. Remote Sens., 152, 166–177, https://doi.org/10.1016/j.isprsjprs.2019.04.015, 2019.
Ma, Y., Hu, Z., Xie, Z., Ma, W., Wang, B., Chen, X., Li, M., Zhong, L., Sun, F., Gu, L., Han, C., Zhang, L., Liu, X., Ding, Z., Sun, G., Wang, S., Wang, Y., and Wang, Z.: A long-term (2005–2016) dataset of hourly integrated land–atmosphere interaction observations on the Tibetan Plateau, Earth Syst. Sci. Data, 12, 2937–2957, https://doi.org/10.5194/essd-12-2937-2020, 2020.
Mao, K., Zuo, Z., Shen, X., Xu, T., Gao, C., and Liu, G.: Retrieval of Land-surface Temperature from AMSR2 Data Using a Deep Dynamic Learning Neural Network, Chin. Geogr. Sci., 28, 1–11, https://doi.org/10.1007/s11769-018-0930-1, 2018.
McFarland, M. J., Miller, R. L., and Neale, C. M. U.: Land surface temperature derived from the SSM/I passive microwave brightness temperatures, IEEE T. Geosci. Remote, 28, 839–845, https://doi.org/10.1109/36.58971, 1990.
Mercury, M., Green, R., Hook, S., Oaida, B., Wu, W., Gunderson, A., and Chodas, M.: Global cloud cover for assessment of optical satellite observation opportunities: A HyspIRI case study, Remote Sens. Environ., 126, 62–71, https://doi.org/10.1016/j.rse.2012.08.007, 2012.
Metz, M., Rocchini, D., and Neteler, M.: Surface Temperatures at the Continental Scale: Tracking Changes with Remote Sensing at Unprecedented Detail, Remote Sens., 6, 3822–3840, https://doi.org/10.3390/rs6053822, 2014.
Muñoz-Sabater, J., Dutra, E., Agustí-Panareda, A., Albergel, C., Arduini, G., Balsamo, G., Boussetta, S., Choulga, M., Harrigan, S., Hersbach, H., Martens, B., Miralles, D. G., Piles, M., Rodríguez-Fernández, N. J., Zsoter, E., Buontempo, C., and Thépaut, J.-N.: ERA5-Land: a state-of-the-art global reanalysis dataset for land applications, Earth Syst. Sci. Data, 13, 4349–4383, https://doi.org/10.5194/essd-13-4349-2021, 2021.
Ohmura, A., Gilgen, H., Hegner, H., Müller, G., Wild, M., Dutton, E. G., Forgan, B., Fröhlich, C., Philipona, R., Heimo, A., König-Langlo, G., McArthur, B., Pinker, R., Whitlock, C. H., and Dehne, K.: Baseline Surface Radiation Network (BSRN/WCRP): New Precision Radiometry for Climate Research, B. Am. Meteorol. Soc., 79, 2115–2136, https://doi.org/10.1175/1520-0477(1998)079<2115:bsrnbw>2.0.co;2, 1998.
Østby, T. I., Schuler, T. V., and Westermann, S.: Severe cloud contamination of MODIS Land Surface Temperatures over an Arctic ice cap, Svalbard, Remote Sens. Environ., 142, 95–102, https://doi.org/10.1016/j.rse.2013.11.005, 2014.
Pede, T. and Mountrakis, G.: An empirical comparison of interpolation methods for MODIS 8-day land surface temperature composites across the conterminous Unites States, ISPRS J. Photogramm. Remote Sens., 142, 137–150, https://doi.org/10.1016/j.isprsjprs.2018.06.003, 2018.
Qu, Y., Liu, Q., Liang, S., Wang, L., Liu, N., and Liu, S.: Direct-Estimation Algorithm for Mapping Daily Land-Surface Broadband Albedo From MODIS Data, IEEE T. Geosci. Remote, 52, 907–919, https://doi.org/10.1109/tgrs.2013.2245670, 2014.
Qu, Y., Liang, S., Liu, Q., Li, X., Feng, Y., and Liu, S.: Estimating Arctic sea-ice shortwave albedo from MODIS data, Remote Sens. Environ., 186, 32–46, https://doi.org/10.1016/j.rse.2016.08.015, 2016.
Rao, Y., Liang, S., Wang, D., Yu, Y., Song, Z., Zhou, Y., Shen, M., and Xu, B.: Estimating daily average surface air temperature using satellite land surface temperature and top-of-atmosphere radiation products over the Tibetan Plateau, Remote Sens. Environ., 234, 111462, https://doi.org/10.1016/j.rse.2019.111462, 2019.
Shen, H., Jiang, Y., Li, T., Cheng, Q., Zeng, C., and Zhang, L.: Deep learning-based air temperature mapping by fusing remote sensing, station, simulation and socioeconomic data, Remote Sens. Environ., 240, 111692, https://doi.org/10.1016/j.rse.2020.111692, 2020.
Shiff, S., Helman, D., and Lensky, I. M.: Worldwide continuous gap-filled MODIS land surface temperature dataset, Sci. Data, 8, 74, https://doi.org/10.1038/s41597-021-00861-7, 2021.
Stokes, G. M. and Schwartz, S. E.: The Atmospheric Radiation Measurement (ARM) Program: Programmatic Background and Design of the Cloud and Radiation Test Bed, B. Am. Meteorol. Soc., 75, 1201–1221, https://doi.org/10.1175/1520-0477(1994)075<1201:tarmpp>2.0.co;2, 1994.
Sun, D. and Pinker, R. T.: Implementation of GOES-based land surface temperature diurnal cycle to AVHRR, Int. J. Remote Sens., 26, 3975–3984, https://doi.org/10.1080/01431160500117634, 2005.
Tang, W., Zhou, J., Ma, J., Wang, Z., Ding, L., Zhang, X., and Zhang, X.: TRIMS LST: a daily 1 km all-weather land surface temperature dataset for China's landmass and surrounding areas (2000–2022), Earth Syst. Sci. Data, 16, 387–419, https://doi.org/10.5194/essd-16-387-2024, 2024.
Tomlinson, C. J., Chapman, L., Thornes, J. E., and Baker, C.: Remote sensing land surface temperature for meteorology and climatology: a review, Meteorol. Appl., 18, 296–306, https://doi.org/10.1002/met.287, 2011.
Townshend, J. R. G., Justice, C. O., Skole, D., Malingreau, J. P., Cihlar, J., Teillet, P., Sadowski, F., and Ruttenberg, S.: The 1 km resolution global data set: needs of the International Geosphere Biosphere Programme, Int. J. Remote Sens., 15, 3417–3441, https://doi.org/10.1080/01431169408954338, 2007.
Wan, Z.: New refinements and validation of the collection-6 MODIS land-surface temperature/emissivity product, Remote Sens. Environ., 140, 36–45, https://doi.org/10.1016/j.rse.2013.08.027, 2014.
Wan, Z. and Li, Z.-L.: A physics-based algorithm for retrieving land-surface emissivity and temperature from EOS/MODIS data, IEEE T. Geosci. Remote, 35, 980–996, 1997.
Wan, Z., Wang, P., and Li, X.: Using MODIS Land Surface Temperature and Normalized Difference Vegetation Index products for monitoring drought in the southern Great Plains, USA, Int. J. Remote Sens., 25, 61–72, https://doi.org/10.1080/0143116031000115328, 2010.
Weng, Q.: Thermal infrared remote sensing for urban climate and environmental studies: Methods, applications, and trends, ISPRS J. Photogramm. Remote Sens., 64, 335–344, https://doi.org/10.1016/j.isprsjprs.2009.03.007, 2009.
Williamson, S., Hik, D., Gamon, J., Kavanaugh, J., and Flowers, G.: Estimating Temperature Fields from MODIS Land Surface Temperature and Air Temperature Observations in a Sub-Arctic Alpine Environment, Remote Sens., 6, 946–963, https://doi.org/10.3390/rs6020946, 2014.
Wu, P., Yin, Z., Zeng, C., Duan, S.-B., Gottsche, F.-M., Ma, X., Li, X., Yang, H., and Shen, H.: Spatially Continuous and High-Resolution Land Surface Temperature Product Generation: A review of reconstruction and spatiotemporal fusion techniques, IEEE Geosci. Remote Sens. Mag., 9, 112–137, https://doi.org/10.1109/mgrs.2021.3050782, 2021.
Wu, P., Su, Y., Duan, S.-B., Li, X., Yang, H., Zeng, C., Ma, X., Wu, Y., and Shen, H.: A two-step deep learning framework for mapping gapless all-weather land surface temperature using thermal infrared and passive microwave data, Remote Sens. Environ., 277, 113070, https://doi.org/10.1016/j.rse.2022.113070, 2022.
Xing, Z., Li, Z.-L., Duan, S.-B., Liu, X., Zheng, X., Leng, P., Gao, M., Zhang, X., and Shang, G.: Estimation of daily mean land surface temperature at global scale using pairs of daytime and nighttime MODIS instantaneous observations, ISPRS J. Photogramm. Remote Sens., 178, 51–67, https://doi.org/10.1016/j.isprsjprs.2021.05.017, 2021.
Xu, S. and Cheng, J.: A new land surface temperature fusion strategy based on cumulative distribution function matching and multiresolution Kalman filtering, Remote Sens. Environ., 254, 112256, https://doi.org/10.1016/j.rse.2020.112256, 2021.
Yamamoto, S.: Findings through the AsiaFlux network and a view toward the future, J. Geogr. Sci., 15, 142, https://doi.org/10.1360/gs050203, 2005.
Yao, R., Wang, L., Huang, X., Cao, Q., Wei, J., He, P., Wang, S., and Wang, L.: Global seamless and high-resolution temperature dataset (GSHTD), 2001–2020, Remote Sens. Environ., 286, 113422, https://doi.org/10.1016/j.rse.2022.113422, 2023.
Yu, P., Zhao, T., Shi, J., Ran, Y., Jia, L., Ji, D., and Xue, H.: Global spatiotemporally continuous MODIS land surface temperature dataset, Sci. Data, 9, 143, https://doi.org/10.1038/s41597-022-01214-8, 2022.
Yu, W., Ma, M., Wang, X., and Tan, J.: Estimating the land-surface temperature of pixels covered by clouds in MODIS products, J. Appl. Remote Sens., 8, 083525, https://doi.org/10.1117/1.jrs.8.083525, 2014.
Yuan, Q., Shen, H., Li, T., Li, Z., Li, S., Jiang, Y., Xu, H., Tan, W., Yang, Q., Wang, J., Gao, J., and Zhang, L.: Deep learning in environmental remote sensing: Achievements and challenges, Remote Sens. Environ., 241, 111716, https://doi.org/10.1016/j.rse.2020.111716, 2020.
Zeng, C., Long, D., Shen, H., Wu, P., Cui, Y., and Hong, Y.: A two-step framework for reconstructing remotely sensed land surface temperatures contaminated by cloud, ISPRS J. Photogramm. Remote Sens., 141, 30–45, https://doi.org/10.1016/j.isprsjprs.2018.04.005, 2018.
Zhang, D., Tang, R., Tang, B.-H., Wu, H., and Li, Z.-L.: A Simple Method for Soil Moisture Determination From LST–VI Feature Space Using Nonlinear Interpolation Based on Thermal Infrared Remotely Sensed Data, IEEE J. Sel. Top. Appl. Earth Obs., 8, 638–648, https://doi.org/10.1109/jstars.2014.2371135, 2015.
Zhang, H., Tang, B.-H., and Li, Z.-L.: A practical two-step framework for all-sky land surface temperature estimation, Remote Sens. Environ., 303, 113991, https://doi.org/10.1016/j.rse.2024.113991, 2024.
Zhang, Q., Yuan, Q., Zeng, C., Li, X., and Wei, Y.: Missing Data Reconstruction in Remote Sensing Image With a Unified Spatial–Temporal–Spectral Deep Convolutional Neural Network, IEEE T. Geosci. Remote, 56, 4274–4288, https://doi.org/10.1109/tgrs.2018.2810208, 2018.
Zhang, T., Zhou, Y., Zhu, Z., Li, X., and Asrar, G. R.: A global seamless 1 km resolution daily land surface temperature dataset (2003–2020), Earth Syst. Sci. Data, 14, 651–664, https://doi.org/10.5194/essd-14-651-2022, 2022.
Zhang, X., Wang, D., Liu, Q., Yao, Y., Jia, K., He, T., Jiang, B., Wei, Y., Ma, H., and Zhao, X.: An operational approach for generating the global land surface downward shortwave radiation product from MODIS data, IEEE T. Geosci. Remote, 57, 4636–4650, 2019.
Zhang, X., Zhou, J., Liang, S., Chai, L., Wang, D., and Liu, J.: Estimation of 1-km all-weather remotely sensed land surface temperature based on reconstructed spatial-seamless satellite passive microwave brightness temperature and thermal infrared data, ISPRS J. Photogramm. Remote Sens., 167, 321–344, https://doi.org/10.1016/j.isprsjprs.2020.07.014, 2020.
Zhang, X., Zhou, J., Liang, S., and Wang, D.: A practical reanalysis data and thermal infrared remote sensing data merging (RTM) method for reconstruction of a 1-km all-weather land surface temperature, Remote Sens. Environ., 260, 112437, https://doi.org/10.1016/j.rse.2021.112437, 2021.
Zhang, Y., Liang, S., Ma, H., He, T., Wang, Q., Li, B., Xu, J., Zhang, G., Liu, X., and Xiong, C.: Generation of global 1 km daily soil moisture product from 2000 to 2020 using ensemble learning, Earth Syst. Sci. Data, 15, 2055–2079, https://doi.org/10.5194/essd-15-2055-2023, 2023.
Zhao, W., Duan, S.-B., Li, A., and Yin, G.: A practical method for reducing terrain effect on land surface temperature using random forest regression, Remote Sens. Environ., 221, 635–649, https://doi.org/10.1016/j.rse.2018.12.008, 2019.
Zhou, D., Xiao, J., Bonafoni, S., Berger, C., Deilami, K., Zhou, Y., Frolking, S., Yao, R., Qiao, Z., and Sobrino, J.: Satellite Remote Sensing of Surface Urban Heat Islands: Progress, Challenges, and Perspectives, Remote Sens., 11, 48, https://doi.org/10.3390/rs11010048, 2018.
Zhou, J., Dai, F., Zhang, X., Zhao, S., and Li, M.: Developing a temporally land cover-based look-up table (TL-LUT) method for estimating land surface temperature based on AMSR-E data over the Chinese landmass, Int. J. Appl. Earth Obs. Geoinf., 34, 35–50, https://doi.org/10.1016/j.jag.2014.07.001, 2015.
Zhou, S., Cheng, J., and Shi, J.: A Physical-Based Framework for Estimating the Hourly All-Weather Land Surface Temperature by Synchronizing Geostationary Satellite Observations and Land Surface Model Simulations, IEEE T. Geosci. Remote, 60, 1–22, https://doi.org/10.1109/tgrs.2022.3222563, 2022.