the Creative Commons Attribution 4.0 License.
the Creative Commons Attribution 4.0 License.
 | 16 Aug 2024
A 100 m gridded population dataset of China's seventh census using ensemble learning and big geospatial data
Yuehong Chen
Congcong Xu
Yong Ge
Xiaoxiang Zhang
Ya'nan Zhou
China has undergone rapid urbanization and internal migration in the past few years, and its up-to-date gridded population datasets are essential for various applications. Existing datasets for China, however, suffer from either outdatedness or failure to incorporate data from the latest Seventh National Population Census of China, conducted in 2020. In this study, we develop a novel population downscaling approach that leverages stacking ensemble learning and big geospatial data to produce up-to-date population grids at a 100 m resolution for China using seventh census data at both county and town levels. The proposed approach employs stacking ensemble learning to integrate the strengths of random forest, XGBoost, and LightGBM through fusing their predictions in a training mechanism, and it delineates the inhabited areas from big geospatial data to enhance the gridded population estimation. Experimental results demonstrate that the proposed approach exhibits the best-fit performance compared to individual base models. Meanwhile, the out-of-sample town-level test set indicates that the estimated gridded population dataset (R2=0.8936) is more accurate than existing WorldPop (R2=0.7427) and LandScan (R2=0.7165) products for China in 2020. Furthermore, with the inhabited area enhancement, the spatial distribution of population grids is intuitively more reasonable than the two existing products. Hence, the proposed population downscaling approach provides a valuable option for producing gridded population datasets. The estimated 100 m gridded population dataset of China holds great significance for future applications, and it is publicly available at https://doi.org/10.6084/m9.figshare.24916140.v1 (Chen et al., 2024b).
- Article
(7135 KB) - Full-text XML
- BibTeX
- EndNote


Human population distribution is a critical factor in measuring, mapping, and understanding human–nature interactions (Leyk et al., 2019; Wardrop et al., 2018). It serves as a fundamental variable in a wide range of applications (Baynes et al., 2022; Yi et al., 2019), including exposure to disasters and pollutants (Zhang et al., 2022; Fang et al., 2014; Nadim et al., 2006; MacManus et al., 2021), access to resources and facilities (Song et al., 2018; Chen et al., 2023; Tatem and J., 2014; Linard et al., 2010), and impact on the environment (Feng et al., 2021; Zhou et al., 2021; Wang et al., 2020; Samir and Lutz, 2017). The general manner of collecting population distribution data is through demographical data linked to spatial boundary datasets (e.g., administrative units) (Chen et al., 2019; Leyk et al., 2019). Census data are the primary source of demographic information; however, this form of population data provides only a single value for each irregular census unit and cannot specify detailed distribution at grid scales within each census unit (Wardrop et al., 2018; Qiu et al., 2022). Converting irregular census data into regular population grids (termed as population spatialization or population downscaling) has proven itself to be an effective technique to overcome the limitations of census data. The benefits of gridded population data have been widely acknowledged in integration with other gridded spatial variables, such as remote sensing products (Leyk et al., 2019; Chen et al., 2019).
In recent years, there has been increasing demand for gridded population data for a variety of applications (Kubíček et al., 2018; Stevens et al., 2019; Chen et al., 2024a). Timely and reliable gridded population data are highly desired to meet this demand, especially in countries experiencing rapid urbanization and internal migration like China. In China, informed decision-making and sustainable urban development greatly depend on timely and accurate gridded population distribution data (Chen et al., 2020a; Cheng et al., 2020; Guo et al., 2023b; Tu et al., 2022). The Seventh National Population Census of China, conducted in 2020, presents a valuable opportunity to produce the required up-to-date and reliable gridded population data.
In recent years, several continuous and significant efforts have been made to generate gridded population data for China. Ye et al. (2019) used a random forest algorithm to downscale the Sixth National Population Census data of China in 2010 to gridded population data at a 1 km resolution. Zhao et al. (2020) converted China's county-level population data in 2015 into 1 km gridded population data. Cheng et al. (2020) combined the random forest algorithm and area-to-point kriging to disaggregate the town-level population sample survey data of China in 2015 to 1 km monthly population grids. M. Chen et al. (2022) employed geographically weighted regression to generate 0.01° population grids from the county-level population of China in 2018. Tu et al. (2022) utilized human digital footprints to produce gridded population dynamics at a 0.01° resolution in 2018. Chen et al. (2020a) leveraged existing gridded population data to simulate future gridded population distribution every 5 years from 2015 to 2050. Chen et al. (2020b) projected provincial population data from 2010 to 2100 under shared socioeconomic pathways and spatially allocated the projected population into grids at a 30 arcsec resolution. Apart from estimating population grids at the national scale in China, recent similar efforts have been made for individual cities (Chen et al., 2019; Guo et al., 2023a; Yang et al., 2023; Liu et al., 2023; Wu et al., 2020; Zhao et al., 2021a, b) and provinces (Gao et al., 2021; Yi et al., 2019). Additionally, several global gridded population datasets are available for China, including LandScan and WorldPop (Bright and Coleman, 2000; Tatem, 2017). The LandScan program, initiated at the Oak Ridge National Laboratory, provides global yearly population grids at a 30 arcsec resolution (Bright and Coleman, 2000). WorldPop, a research project launched in the United Kingdom, also offers global yearly population grids up to year 2020 with a higher resolution of 100 m (Tatem, 2017; Stevens et al., 2015). Although these efforts can provide abundant gridded population datasets for China, they are either outdated (several datasets before 2020) or lack the ability to utilize the actual county-level and finer town-level Seventh National Population Census data of China in 2020.
In the past few years, these studies have developed various methods to downscale population census data to population grids. However, they usually employ a single machine learning method to model the complex relationship between population and its auxiliary variables (i.e., covariates) when producing gridded population datasets (Stevens et al., 2015; Ye et al., 2019; Zhao et al., 2020; Bright and Coleman, 2000). Individual machine learning methods often have their inherent disadvantages (e.g., overfitting and instability), which can be addressed by the recently popular method of ensemble learning to simultaneously take advantages of multiple homogeneous and heterogeneous individual methods (Yao et al., 2022; Tu et al., 2022; Costache and Bui, 2019; Fang et al., 2021). Ensemble learning is a technique in machine learning that focuses on combining multiple algorithms to improve the overall performance and robustness of predictions (Dong et al., 2020). Stacking ensemble learning is considered to be one of the most effective ensemble learning techniques due to its utilization of a training mechanism to merge the predictions of individual machine learning algorithms (Costache and Bui, 2019). Ensemble learning has been widely recognized for its merits in various applications (Dong et al., 2020; Wu et al., 2021; Xu et al., 2023). For instance, Yao et al. (2022) demonstrated that stacking ensemble learning outperformed typical individual machine learning algorithms in evaluating flash flood susceptibility. Despite its success in other domains, the potential of stacking ensemble learning in population disaggregation remains relatively unexplored.
To address these research and data gaps in the current literature, we develop a novel population downscaling approach that leverages stacking ensemble learning and big geospatial data to generate a 100 m gridded population dataset for China from the seventh census data in 2020. The county-level and town-level census data of China in 2020 and 10 related covariates at the 100 m resolution were first collected as the input datasets. Subsequently, three popular machine learning algorithms (i.e., random forest, XGBoost, and LightGBM) were chosen as base models to create and train the stacking ensemble learning to generate a gridded population dataset for China. Finally, we assessed the generated gridded population dataset using the town-level census data and compared it with the LandScan and WorldPop datasets.
Three types of datasets are utilized in this study. The first type consists of the county-level and town-level population data obtained from the Seventh National Population Census of China, which are considered to be the dependent variable. The second type comprises the 100 m gridded auxiliary data, which are regarded as the independent variables (i.e., covariates). Finally, the third type is the inhabited area data, which represents the areas of human activity (Baynes et al., 2022; Tu et al., 2022).
2.1 County-level and town-level census data
The seventh census data were collected at both county and town levels to generate population grids. The population count for 2848 counties across entire mainland China in 2020 was obtained from the seventh census data, as shown in Fig. 1a. As the town-level census data were released for parts of towns, the population count of 15 564 towns within 1135 counties was also collected. The county-level and town-level population datasets were split into two subsets: a training set and a test set. Due to the limited number of county-level samples, all were used for training. Taking the county as the basic sampling unit, we randomly selected 85 % of town-level census data in Fig. 1b, and they were combined with all county-level census data as the training set. That is to say, all counties in Fig. 1a and the towns in Fig. 1b were combined to train the base models and the stacking ensemble learning model for estimating population grids. The remaining 15 % of town-level census data formed the test set, as depicted in Fig. 1c. The test samples were randomly distributed across China, indicating their feasibility for evaluating the fitted models. In this study, Hong Kong SAR, Macao SAR, and Taiwan were excluded due to the different ways the census is conducted.
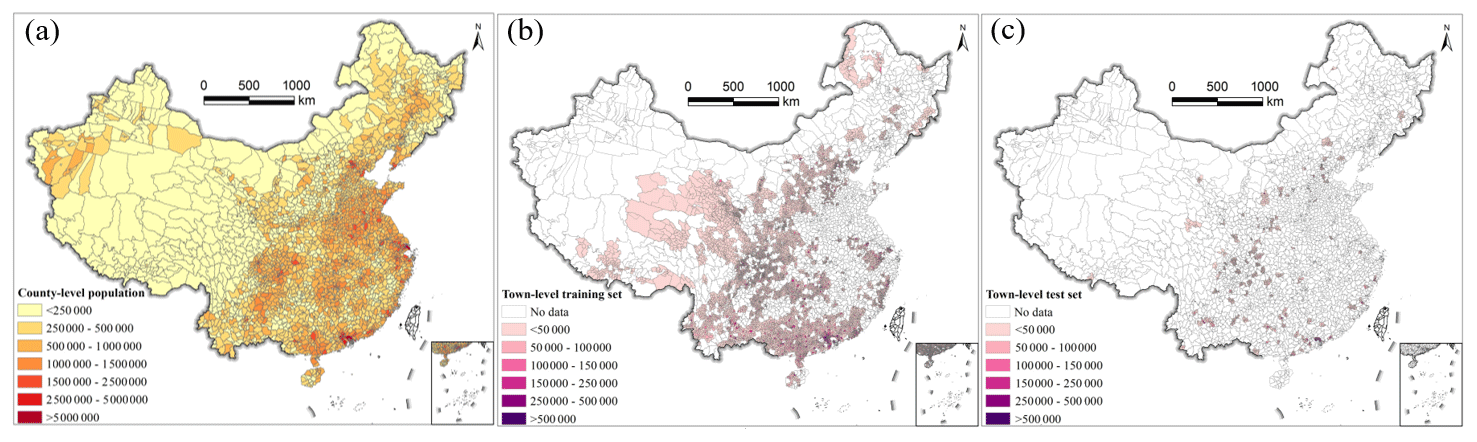
Figure 1The seventh census data of China. (a) The county-level census data, (b) the town-level census data for training, and (c) the town-level census data for testing.
2.2 Gridded auxiliary data of the population
Gridded auxiliary datasets play a pivotal role in estimating accurate gridded population distributions. In accordance with previous studies (Chen et al., 2016, 2021; Cheng et al., 2020; Tu et al., 2022; Tatem, 2017; Ye et al., 2019; Zhao et al., 2020), we collected eight categories of 100 m gridded big geospatial data that are associated with population distribution in Fig. 2.
The Tencent density user positioning data, sourced from China's largest social media company, Tencent, has been convincingly validated as a reliable proxy for human distribution (Chen et al., 2019; Tu et al., 2022; M. Chen et al., 2022; Cheng et al., 2020). Real-time density images of Tencent user positions, captured at a resolution of 0.01° (https://heat.qq.com/, last access: 30 June 2019), were collected every 5 min between 1 January and 30 June 2019. These images were subsequently averaged to yield an aggregated Tencent user density image. A projection transformation was conducted, and the bilinear resampling process was further implemented to convert it into a 100 m Tencent user density image, as illustrated in Fig. 2a.
Points of interest (POIs) often represent important places of human activities and they are valuable for characterizing population distribution. We gathered an extensive dataset of over 60 million POIs from AutoNavi maps (https://amap.com/, last access: 30 November 2020), one of China's prominent online map platforms. Only POIs associated with human activities were used. These POIs were classified into 10 main categories: restaurant, shopping, life service, working, education, medical facility, residence, transportation, recreation, and other. The Point Density tool in ArcMap summarized the number of POIs within each 100 m grid and this information was used as the POI density in Fig. 2b.
Human travel and activities are heavily reliant on road networks, and a higher density of roads often corresponds to increased human activity. The length of roads within each 100 m grid was computed by the Line Density tool in ArcMap using the road data acquired from the online map of AutoNavi maps, and it was considered the road density in Fig. 2c. Note that the roads used in this study mainly included city roads as well as provincial-, county-, and township-level roads, while excluding railways and expressways.
The nighttime light (NTL) data are proficient in effectively characterizing nocturnal human activities, and they have been demonstrated to be a significant indictor of human distribution (Elvidge et al., 2021). The annually composited Visible Infrared Imaging Radiometer Suite (VIIRS) NTL image in 2020 was acquired from the following website: https://eogdata.mines.edu/nighttime_light/annual/v20/ (last access: 30 June 2022). The original VIIRS NTL image, initially at a resolution of 500 m, was resampled by the bilinear algorithm to a 100 m NTL image as one covariate, as depicted in Fig. 2d.
Taller buildings tend to accommodate more population, and there exists a strong correlation between building height and population distribution. First, the building height at a 10 m resolution of China in 2020 was collected (Wu et al., 2023). It was then aggregated to the 100 m resolution building height covariate in Fig. 2e.
The built area is the geographical space covered by both residential and non-residential buildings, serving as a primary location for human activities. It is also related to population distribution. The 10 m land cover data of China in 2020 released by Esri Inc. (https://www.arcgis.com/apps/instant/media/index.html?appid=fc92d38533d440078f17678ebc20e8e2, last access: 30 June 2022) were first achieved, and then the class of built area was extracted to calculate the percentage of built area within each 100 m grid in Fig. 2f.
Digital elevation model (DEM) data are widely used in population downscaling, such as the WorldPop dataset (Tatem, 2017; Stevens et al., 2015) and the gridded population estimations in China (Cheng et al., 2020; Ye et al., 2019; Tu et al., 2022). In this context, the 30 m DEM data known as ALOS World 3D-30m (AW3D30) were procured from the official website at https://www.eorc.jaxa.jp/ALOS/en/dataset/aw3d30/aw3d30_e.htm (last access: 30 June 2022). For analytical purposes, this dataset was resampled to 100 m DEM by the nearest-neighbor algorithm in Fig. 2g, and its 100 m slope was further calculated in Fig. 2h.
Two location-related items of data, longitude and latitude, were calculated for each 100 m grid to account for the geographical properties of the dependent variable and its covariates.
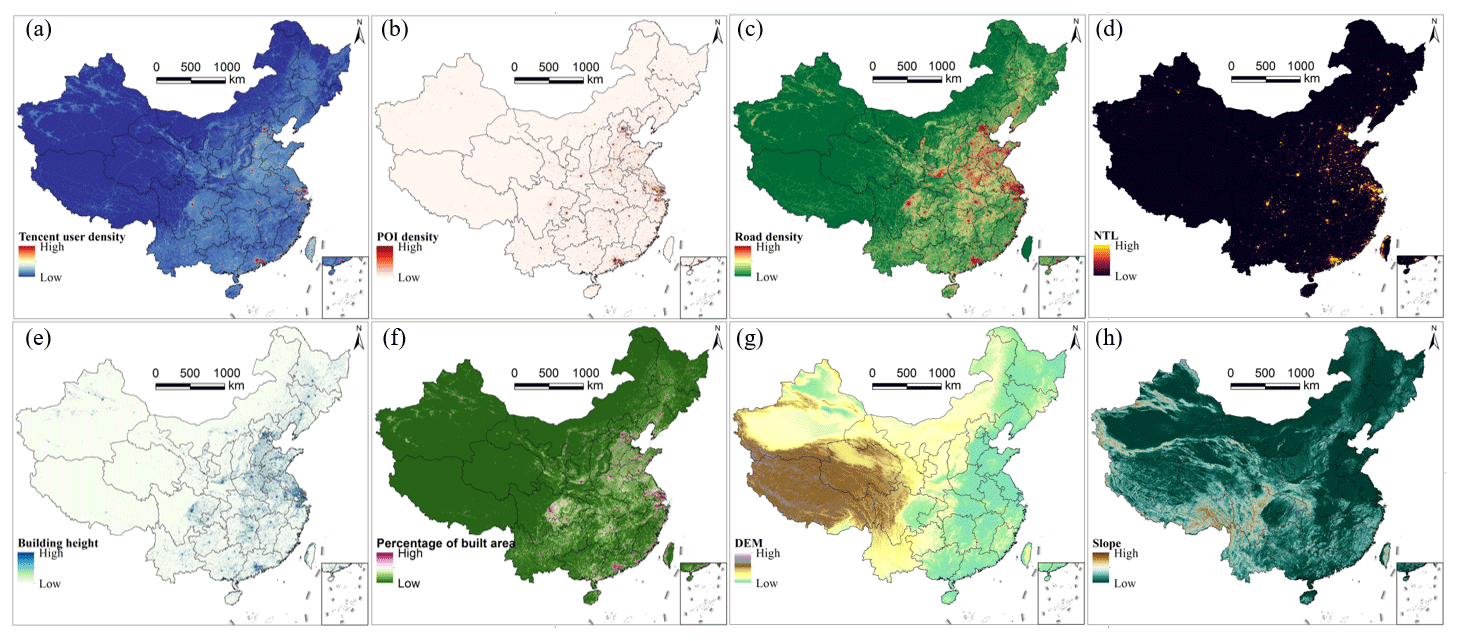
Figure 2The 100 m gridded covariates of China. (a) Tencent user density, (b) POI density, (c) road density, (d) NTL image, (e) building height, (f) percentage of built area, (g) DEM, and (h) slope.
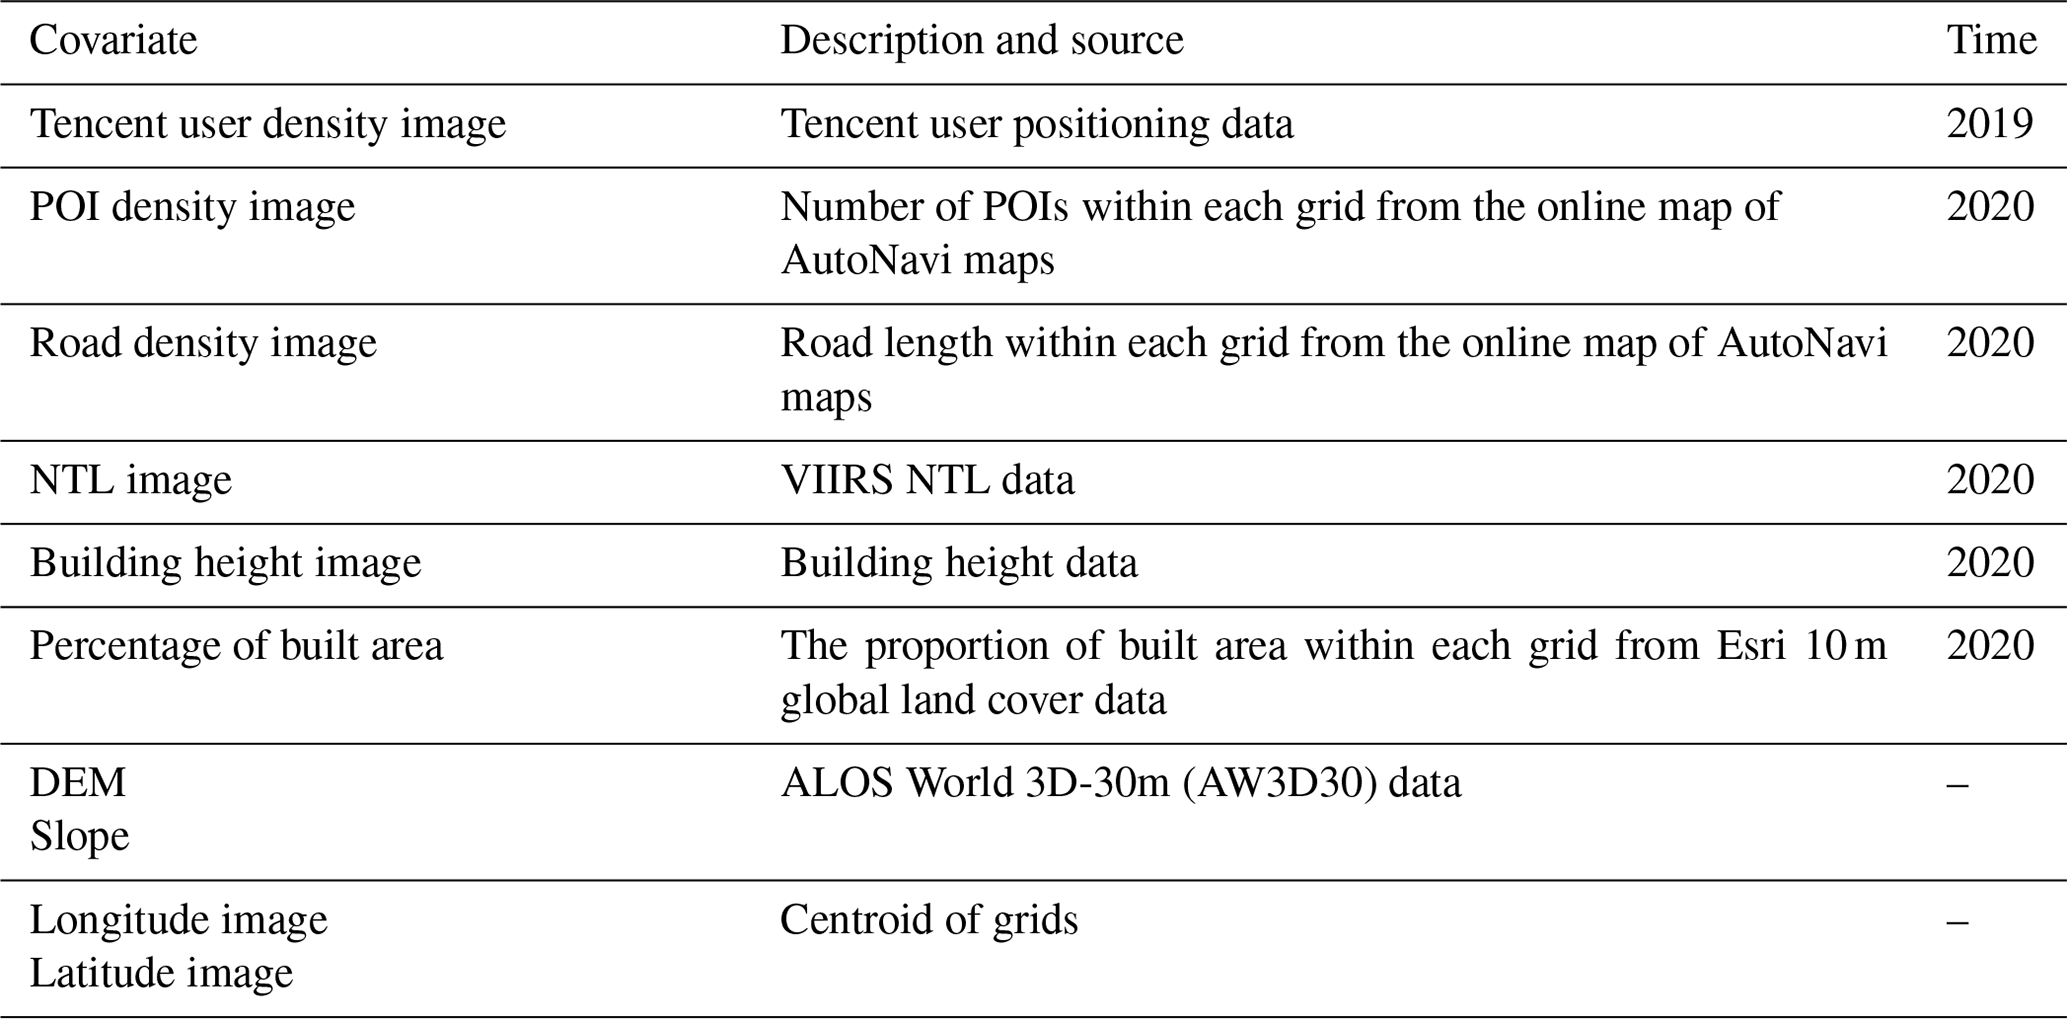
From the eight categories of auxiliary data, 10 ultimate gridded covariates at a 100 m resolution were extracted. They were employed in downscaling the seventh census data of mainland China to population grids, as illustrated in Table 1.
2.3 Inhabited area data
Recent studies on population downscaling have highlighted the effectiveness of excluding uninhabited areas to enhance the accuracy of gridded population estimates (Baynes et al., 2022; Tu et al., 2022). Usually, inhabited areas are identified as regions with human activities. Therefore, we generated inhabited areas using the gathered gridded big geospatial data in Fig. 2. According to the inhabited area definition (Baynes et al., 2022; Tu et al., 2022), these areas should contain at least one non-zero human-activity-related covariate. To achieve this, we employed the six covariates depicted in Fig. 2a–f to extract the inhabited areas of China, as illustrated in Fig. 3. During the census data downscaling process, only grids that fell within these inhabited areas were used to allocate the population counts.
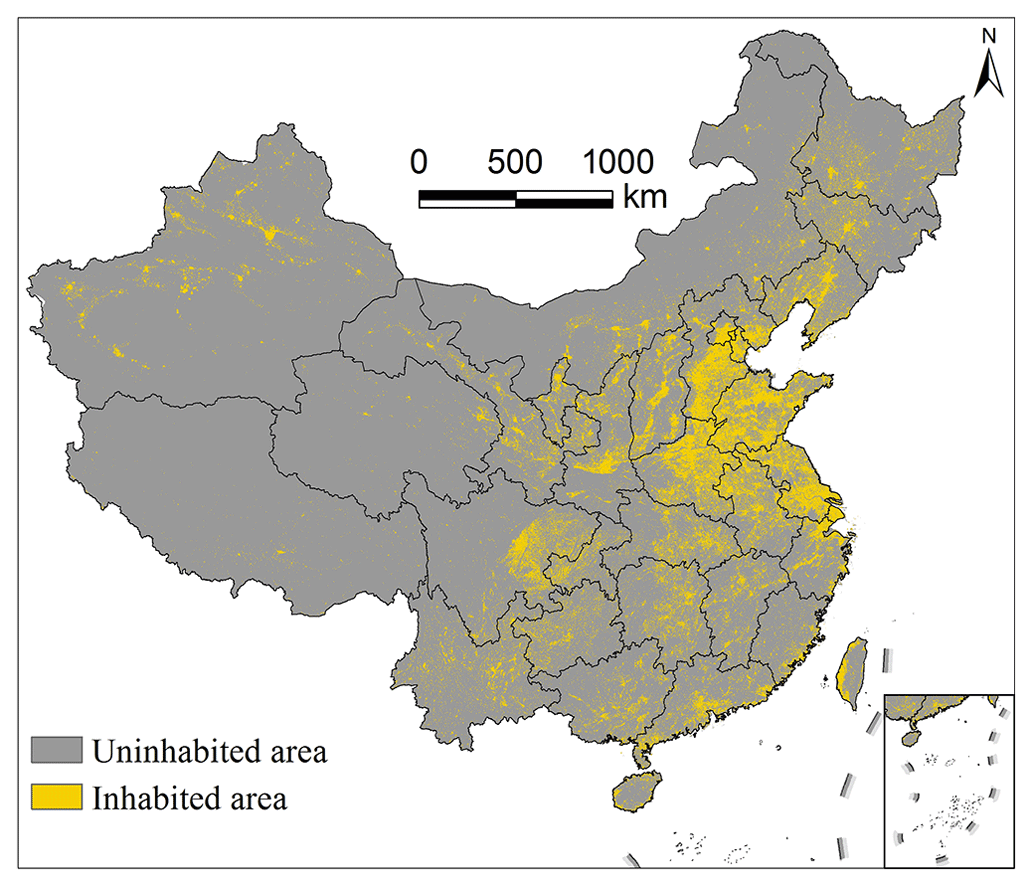
Figure 3The 100 m inhabited areas of China.
We devised a population downscaling approach by stacking ensemble learning (PopSE) to produce population grids. The framework illustrated in Fig. 4 outlines the use of the proposed PopSE model for generating population grids in China. The framework contains seven main steps as follows:
-
Collecting population data and covariates. The county-level and town-level population data were obtained from the Seventh National Population Census of China. These data were spatially linked to their respective administrative boundaries, as depicted in Fig. 1. As seen in Fig. 2, gridded covariates were collected and processed at the 100 m resolution. To facilitate analysis, both population data and covariates underwent a transformation to the Albers equal-area conic coordinate system.
-
Extracting the inhabited area. Six 100 m covariates (i.e., Tencent user density, POI density, road density, NTL image, building height, and percentage of built area) were used to generate the gridded inhabited area. According to the definition of an inhabited area, this was calculated using the logic operations of the Map Algebra tool in ArcMap. If a grid contains at least one non-zero value in each of the six covariates, the grid is labeled as an inhabited area.
-
Calculating county-level and town-level population density and covariates. Compared to population count, population density is more suitable for comparing regions of different sizes and is frequently used as the dependent variable in population estimations (Stevens et al., 2015; Cheng et al., 2020; Ye et al., 2019). Therefore, the county-level and town-level population density values were calculated through dividing the population count of each census unit by the size of the inhabited area of its corresponding unit. The logarithm of county-level and town-level population density was used as a dependent variable during the training of the proposed PopSE. Here, 10 county-level and town-level covariates were aggregated separately from the 100 m gridded covariates. This aggregation for covariates ensured spatial alignment with the county-level and town-level population density. The aggregated covariates were utilized as independent variables in the modeling process.
-
Building and training PopSE. PopSE was built based on stacking ensemble learning to combine individual algorithms to achieve a better result than any individual algorithm. Population density and covariates at both county-level and town-level served as inputs for training the proposed PopSE.
-
Predicting gridded population density using the trained PopSE. Utilizing 100 m gridded covariates as inputs, the trained PopSE model was applied to predict the 100 m gridded population density for China.
-
Converting gridded population density to gridded population data. To maintain the coherency between the population count of each census unit and the aggregated sum of population grids within the unit from the gridded population density, an adjustment was made to the gridded population density to generate the gridded population count.
-
Assessing and comparing gridded population data. The accuracy of the estimated 100 m population grids was evaluated using town-level population test data. This assessment aimed to compare the town-level census data with the corresponding town-level population count aggregated from the estimated population grids. Additionally, the WorldPop data and the LandScan data in 2020 were further gathered to compare with the estimated population grids of China in 2020.
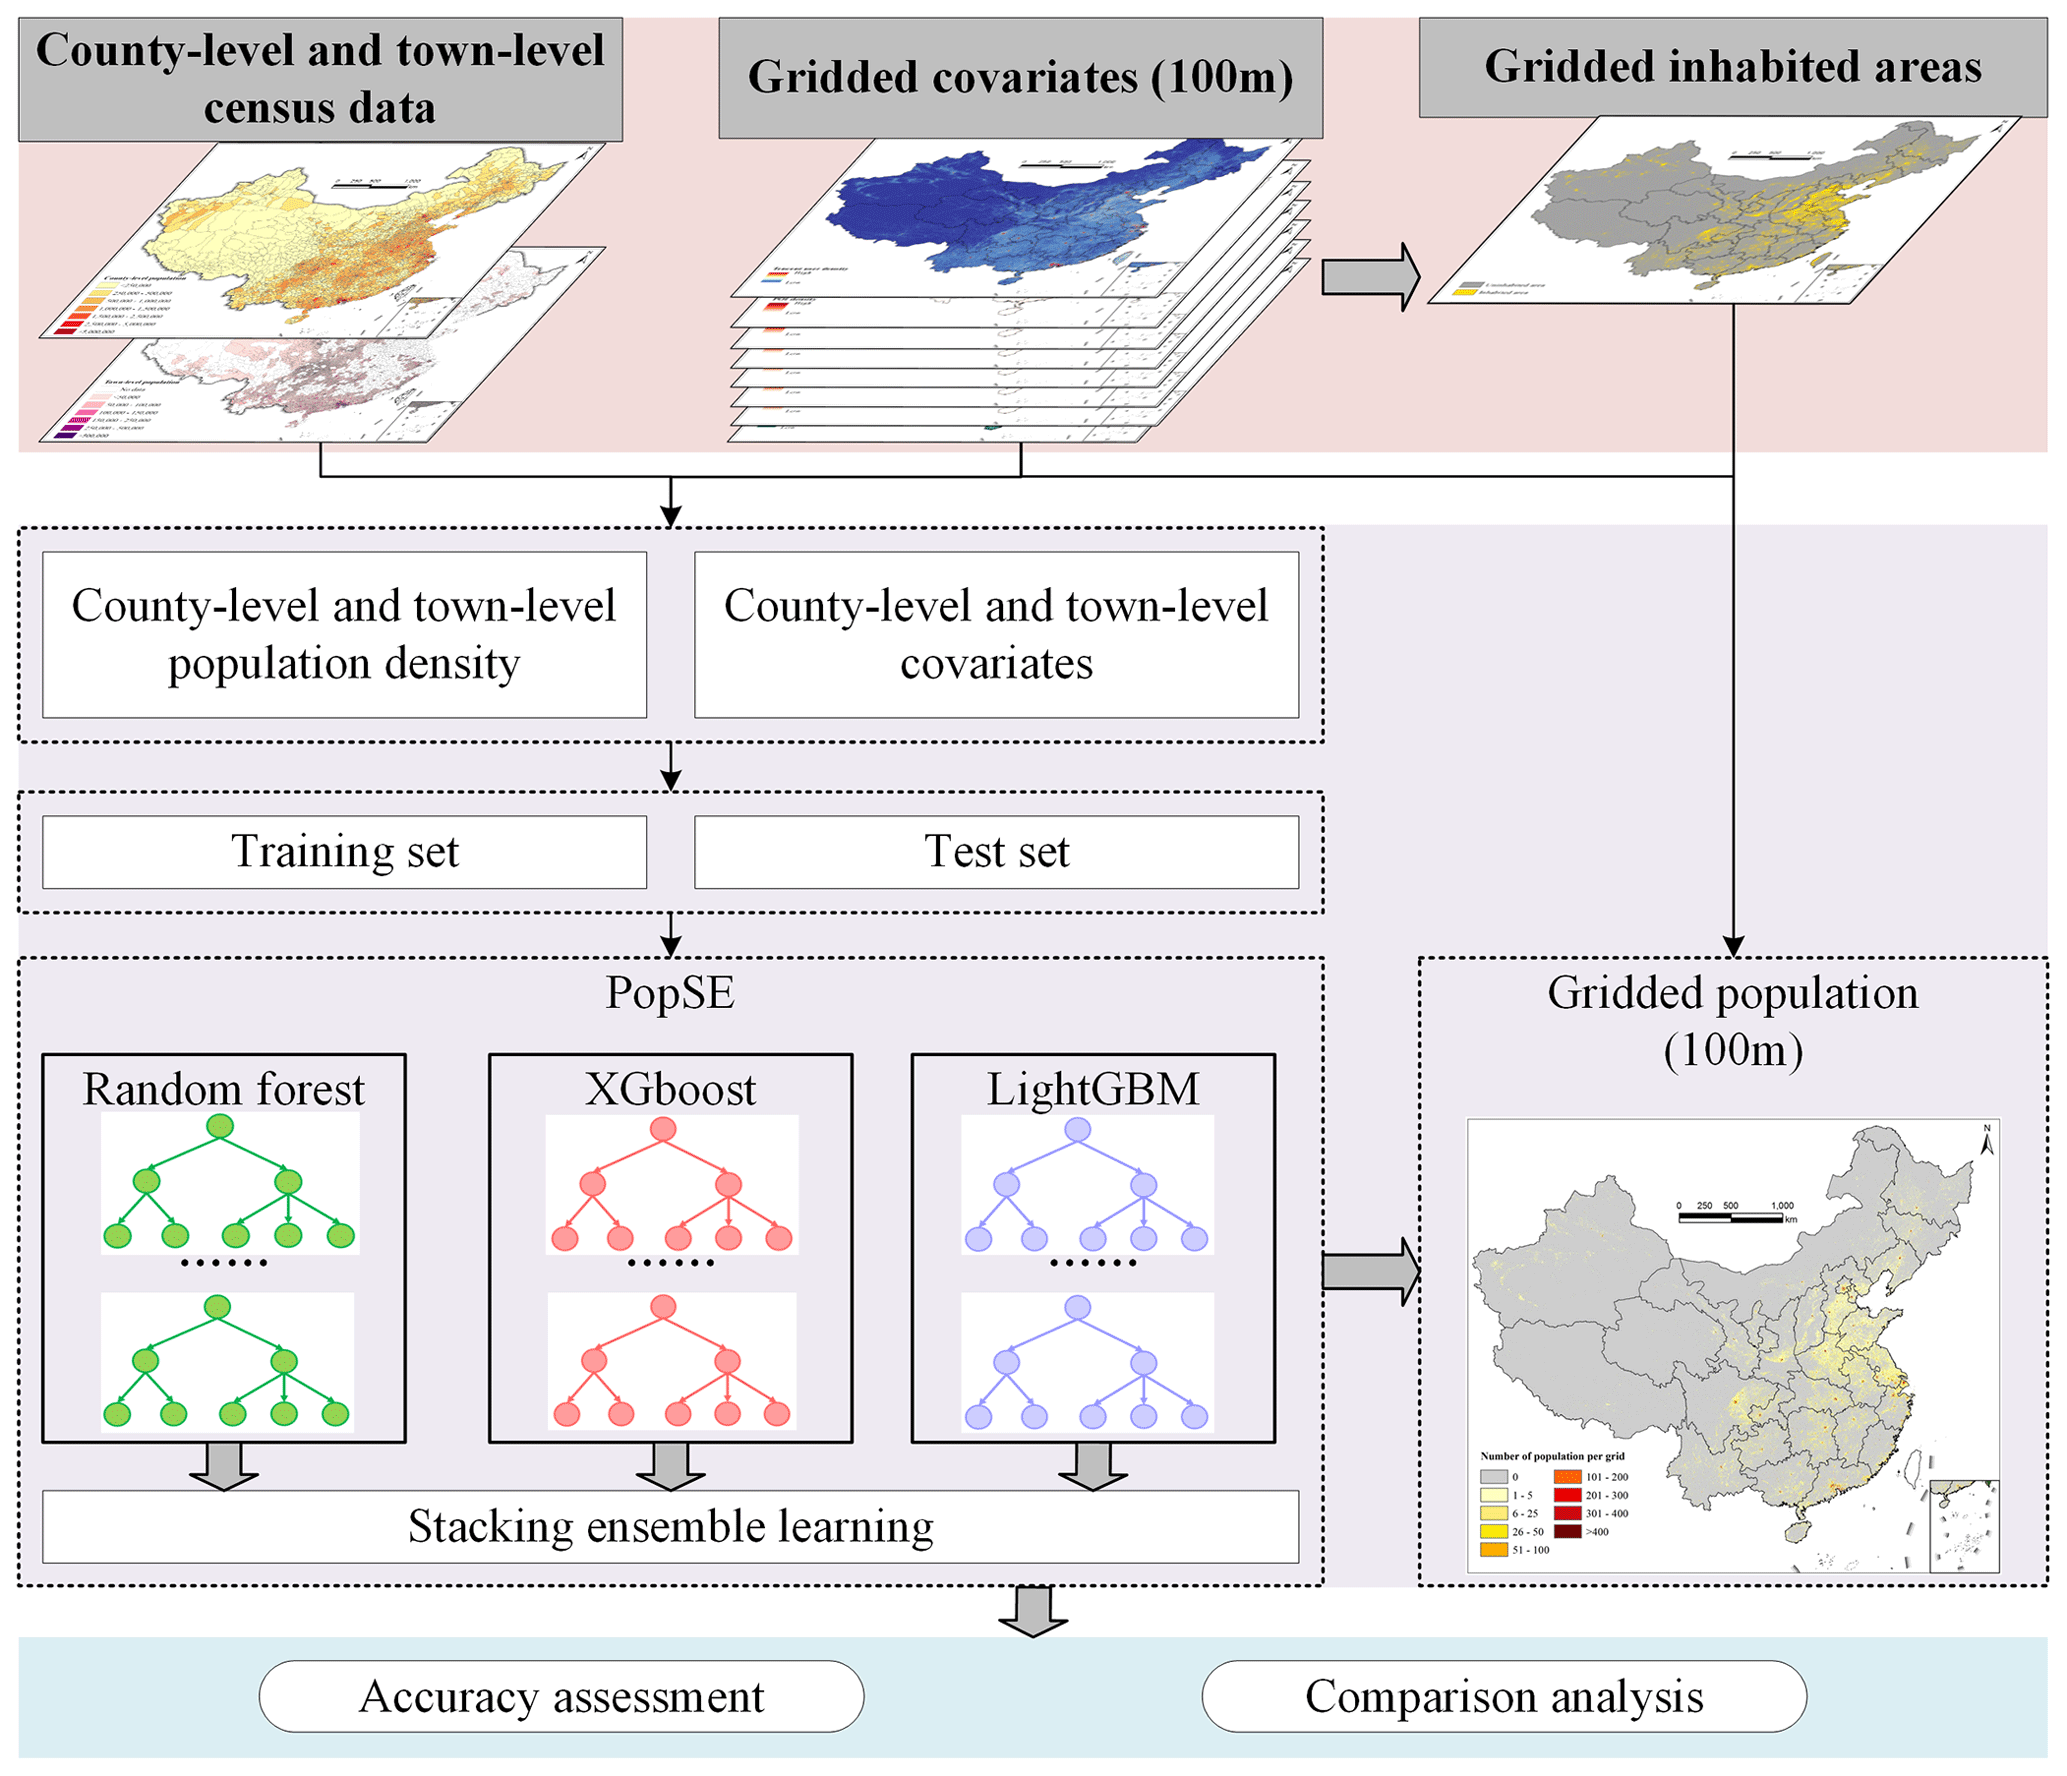
Figure 4Framework of generating population grids for China.
3.1 Building PopSE
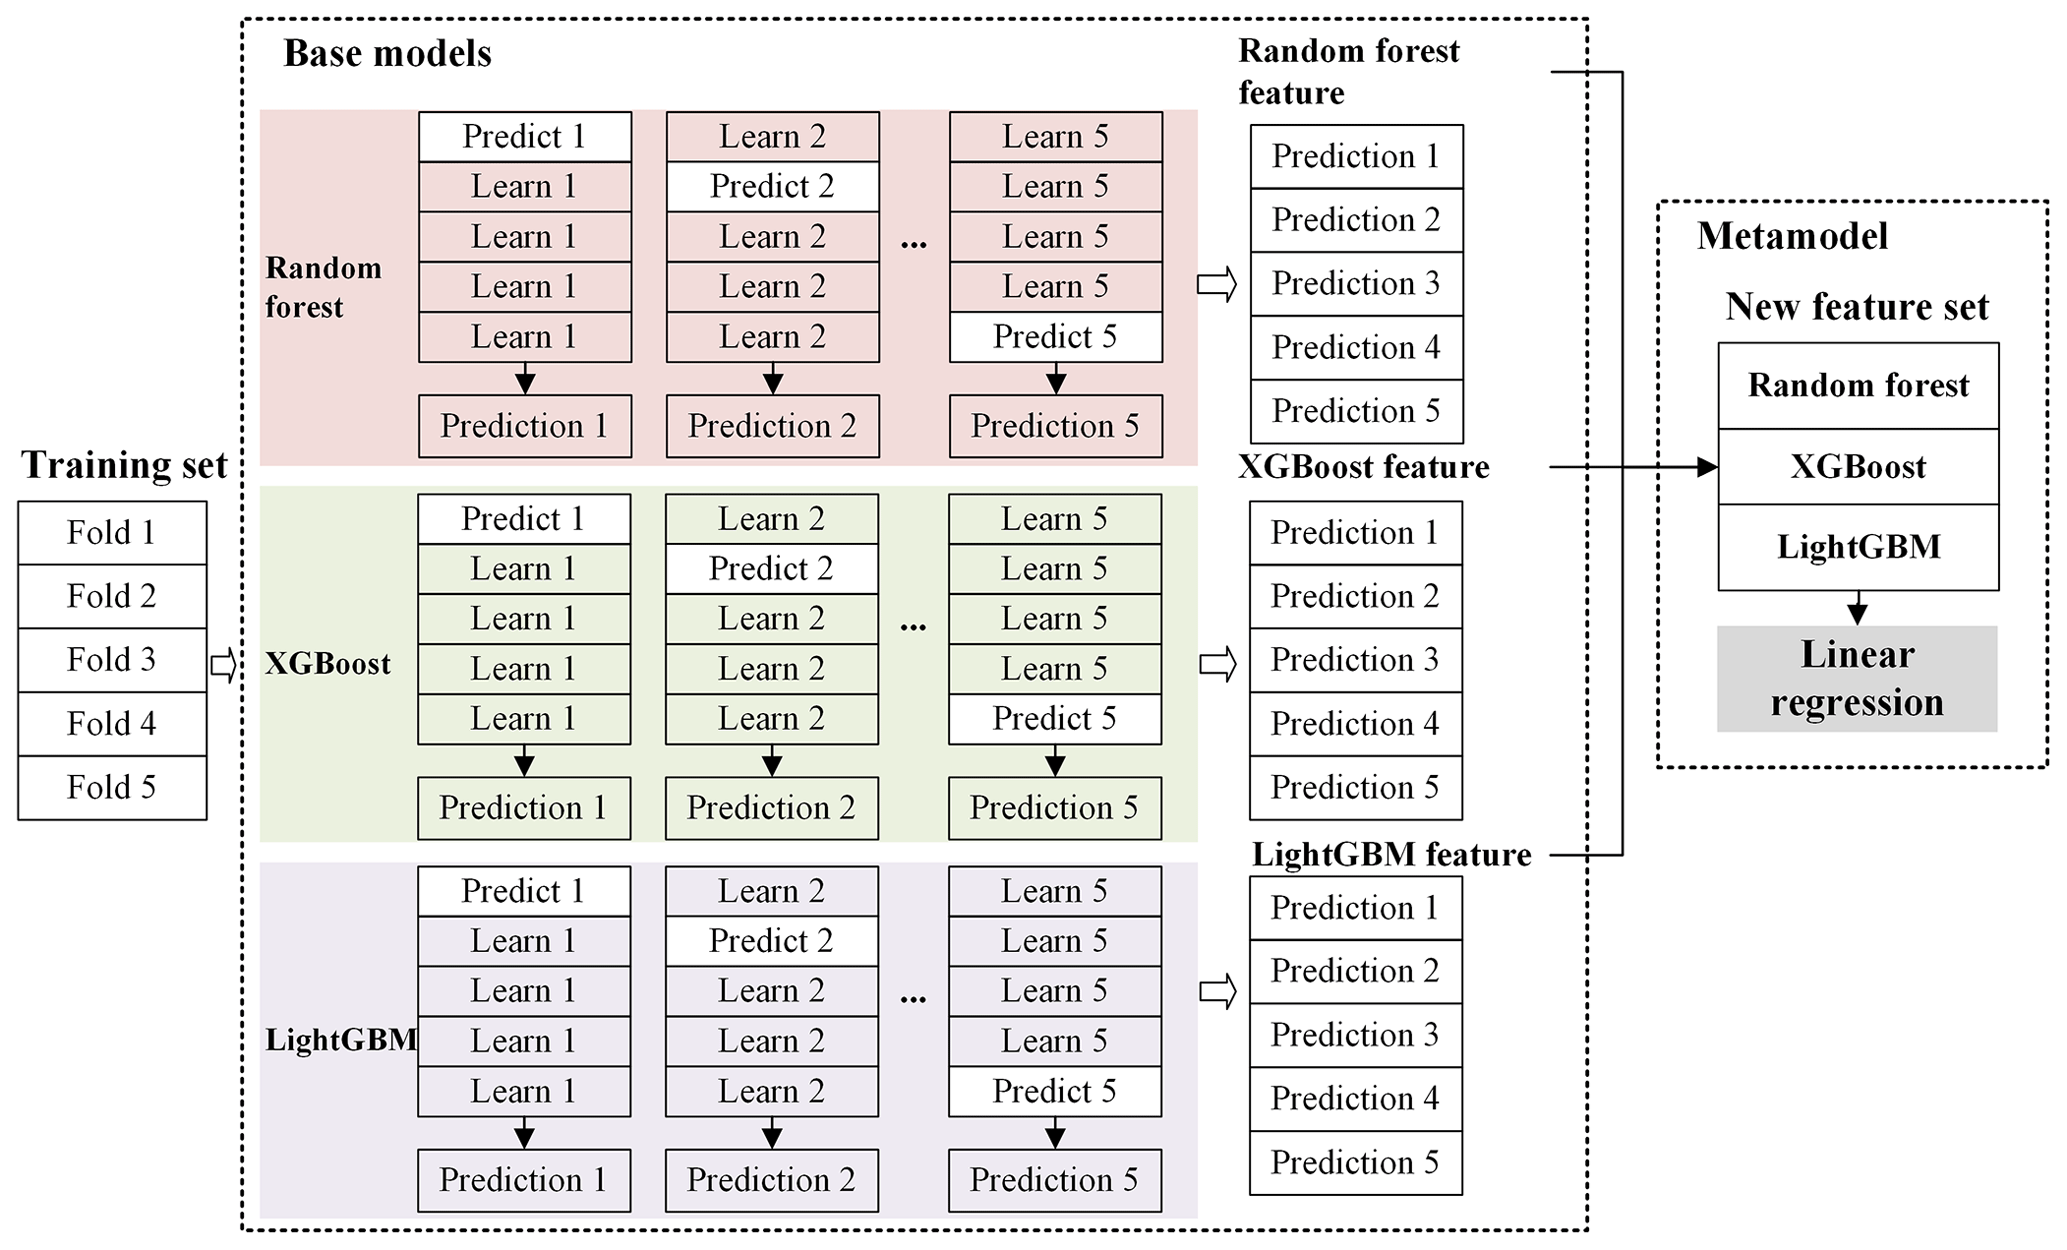
PopSE aims to leverage stacking ensemble learning to capitalize on the strengths of multiple individual machine learning algorithms to accurately characterize the complex relationship between population distribution and its covariates. PopSE follows the principles of typical stacking ensemble learning and needs multiple base models and a metamodel, as shown in Fig. 5. Three widely used algorithms – random forest, XGBoost, and LightGBM – were adopted as base models to construct PopSE. The random forest algorithm is a popular machine learning technique that trains different decision trees on various subsets of the training data to enhance accuracy and reduce variance, and it is widely used in population downscaling (Cheng et al., 2020; Stevens et al., 2015; Zhao et al., 2020). XGBoost is a powerful machine learning algorithm that operates on an ensemble of decision trees using a gradient boosting framework, and it is widely applied in various domains, including population and gross domestic product downscaling (Xu et al., 2023; Wu et al., 2020; Tu et al., 2022; Chen and Guestrin, 2016). LightGBM is a highly efficient gradient boosting decision tree algorithm that achieves a higher training speed and better accuracy through efficient histogram-based techniques, and it is also applied in diverse domains (Ke et al., 2017; Qiu et al., 2022; Xu et al., 2023; Y. Chen et al., 2022). PopSE inherits the common metamodel of linear regression in a standard stacking ensemble learning model to amalgamate the predictions of the three base models.
3.2 Training and testing
With the population density and covariates as inputs, the base models and metamodel of the constructed PopSE can be fitted. The metamodel (i.e., linear regression) underwent training using cross-validation (CV) on the out-of-fold predictions from the base models. Before the PopSE training, we tuned the hyperparameters for random forest, XGBoost, and LightGBM using the grid search approach to achieve their optimum hyperparameters. During PopSE training, a five-fold CV was used to divide the training set into two parts, as illustrated in Fig. 5. Four folds were utilized to fit each base model and the remaining fold was generated predictions from the fitted base models in Fig. 5. This process iterated through the five folds. Finally, the metamodel was fitted using predictions from all base models. After the training, the test set was employed to evaluate the fitted PopSE. As shown in Fig. 5, each base model was trained using four-fold training data and the fitted base model generated the prediction of the out-of-fold data. After five iterations, the five predictions from each base model were combined to form new features for the metamodel. The new feature set from the three base models was then used to fit the metamodel, completing the stacking ensemble learning process.
3.3 Generating population grids
With the fitted PopSE and the gridded covariates, the 100 m gridded population density for China can be estimated by
where Dj is the estimated population density for grid j, f is the fitted PopSE model, and xj is the vector of covariates for grid j.
To align the gridded population density with the population census count within each census unit, we adjusted the gridded population density by multiplying the ratio of the population census count to the sum of estimated population grids within a census unit as follows:
where Pj is the estimated population count for grid j within census unit i and Ci is the population count for census unit i.
3.4 Accuracy assessment
Due to the lack of population ground truth at a grid scale, the available town-level census data are the finest-scale population data for accuracy assessment. Thus, the town-level population test set was adopted to evaluate the performance of the proposed PopSE and the existing gridded population products. The town-level population census counts in the test set were compared with the corresponding town-level population counts aggregated from gridded population data to compute performance metrics. Three metrics, the mean absolute error (MAE), the root mean square error (RMSE) and the coefficient of determination (R2), were calculated for comparison. Their formulas are expressed as follows:
where Pk is the population census count for town k, is the estimated population count for town k, is the mean of the estimated population count for all towns, and N is the size of the town-level population test set.
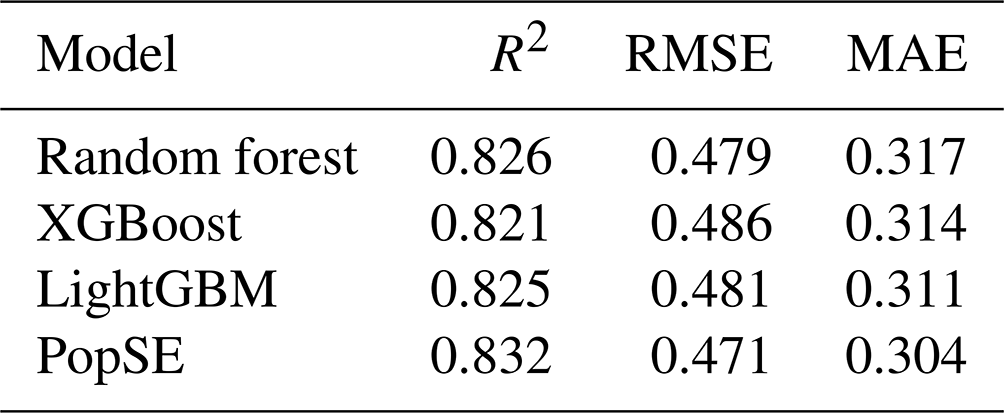
4.1 Model evaluation
Both base and PopSE models were initially fitted to the training set using hyperparameters. Subsequently, predictions were generated using the test set. Table 2 presents the performance metrics for each model on the test set. Notably, the proposed PopSE exhibited superior performance over the three base models, as indicated by the highest R2 (0.832) and the lowest RMSE (0.471) and MAE (0.304). In contrast, the random forest algorithm achieved the highest R2 (0.826) and lowest RMSE (0.479) among the base models, while it recorded the highest MAE (0.317). XGBoost achieved the worst performance among the base models, with the lowest R2 (0.821) and the highest RMSE (0.486). For LightGBM, its performance metrics fell between those of random forest and XGBoost. According to these metrics, the proposed PopSE performed the best on the test set, suggesting its potential to theoretically generate the most accurate gridded population dataset compared to the three base models.
4.2 Gridded population map of China
The fitted PopSE utilized 100 m covariates to generate gridded population density, and it was adjusted to the gridded population count using data from China's seventh census at both county level and town level. Figure 6 presents the gridded population map, derived from the proposed PopSE, at a spatial resolution of 100 m. Notably, numerous grids in the map exhibit zero population in uninhabited areas, mirroring the pattern observed in Fig. 4. Areas with a relatively high number of population grids are concentrated in southeastern China, including the North China Plain, the Sichuan Basin, the middle and lower reaches of the Yangtze River, and the Pearl River Basin. This distribution aligns with the spatial patterns observed in Fig. 1. The gridded population map also reveals a hierarchical clustered distribution. The primary population hotspots in the first hierarchy distribute around urban agglomerations like the Beijing–Tianjin–Hebei region, the Pearl River Delta, and the Yangtze River Delta. In the second hierarchy, hotspots are predominantly found in provincial cities such as Chengdu, Chongqing, Xi'an, Zhengzhou, and Wuhan. The third hierarchy includes population hotspots in other city centers. Four representative regions in focus, namely Chengdu, Guangzhou, Beijing, and Nanjing, were selected for a detailed analysis of the spatial distribution of population grids. The examination of these four regions in focus revealed that city centers contain a higher number of population grids compared to suburbs. In both city centers and suburbs of the four regions in focus, uninhabited areas such as water surfaces and mountains are shown to contain zero population. This spatial distribution of population grids intuitively aligns with the fundamental understanding of population patterns in China, suggesting the effectiveness of the proposed PopSE in visual form.
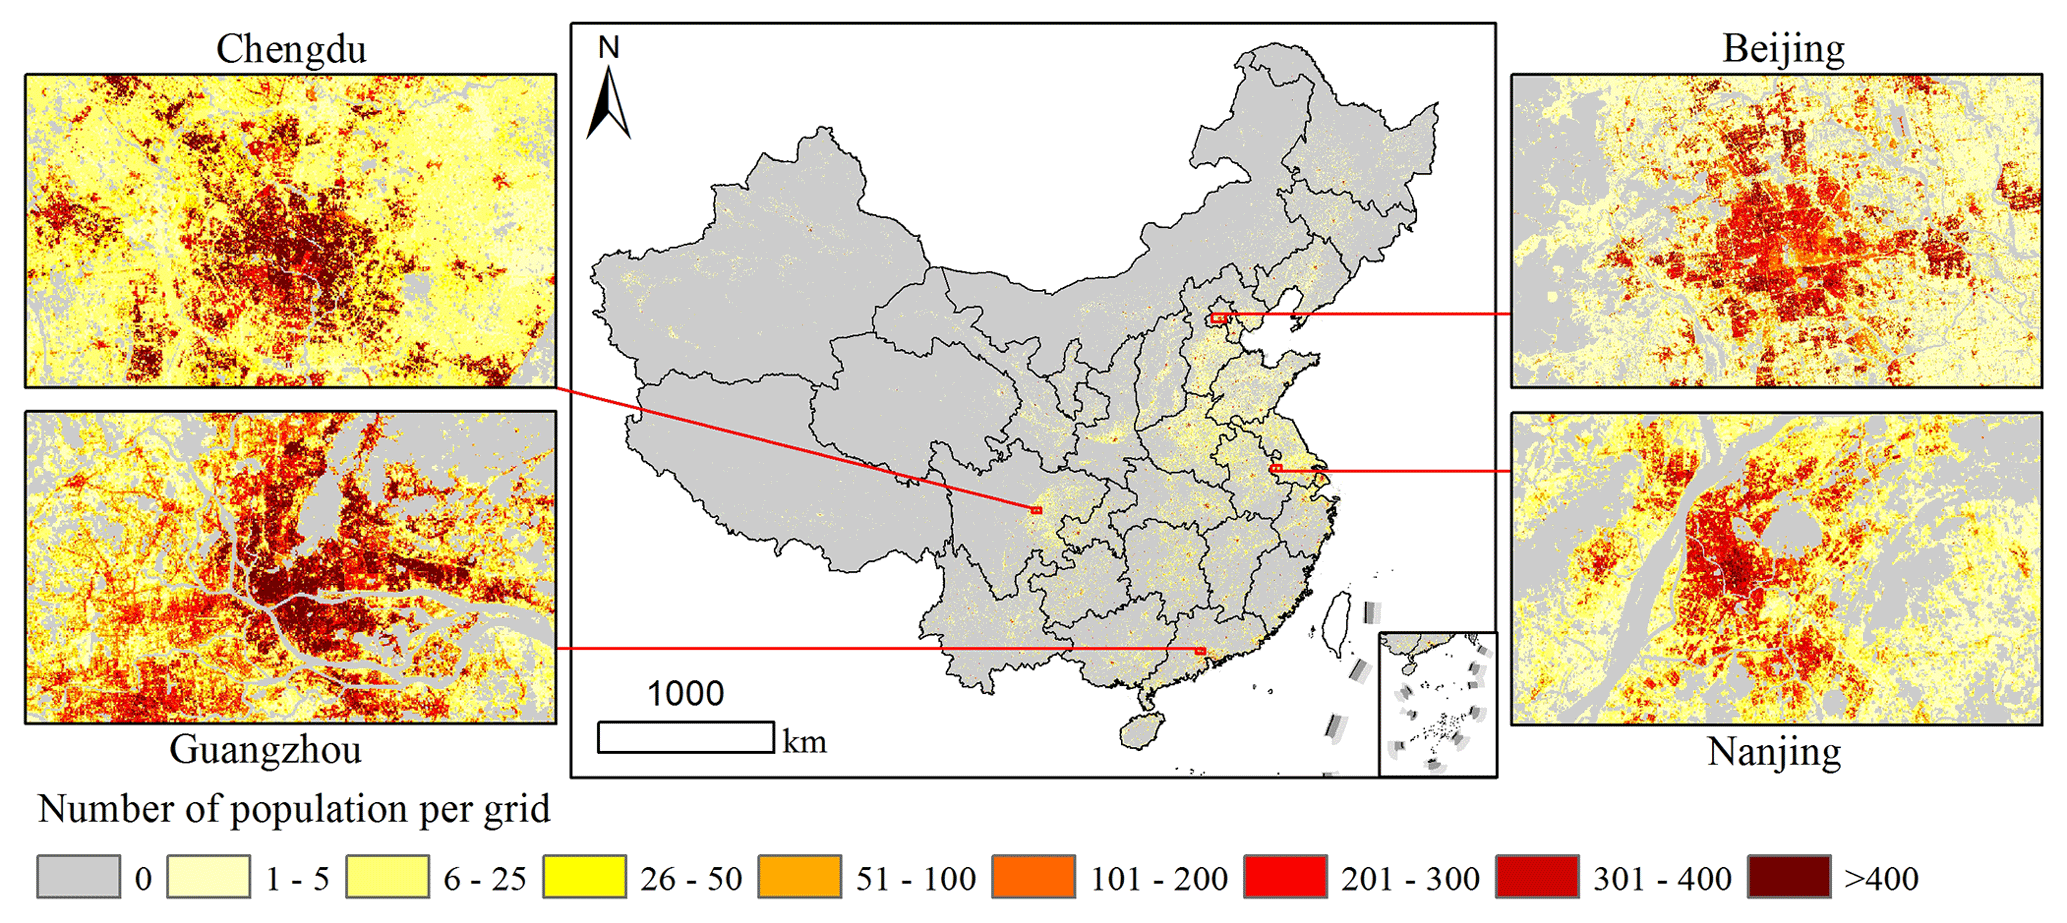
Figure 6The 100 m gridded population map of China in 2020 by PopSE.
4.3 Accuracy assessment
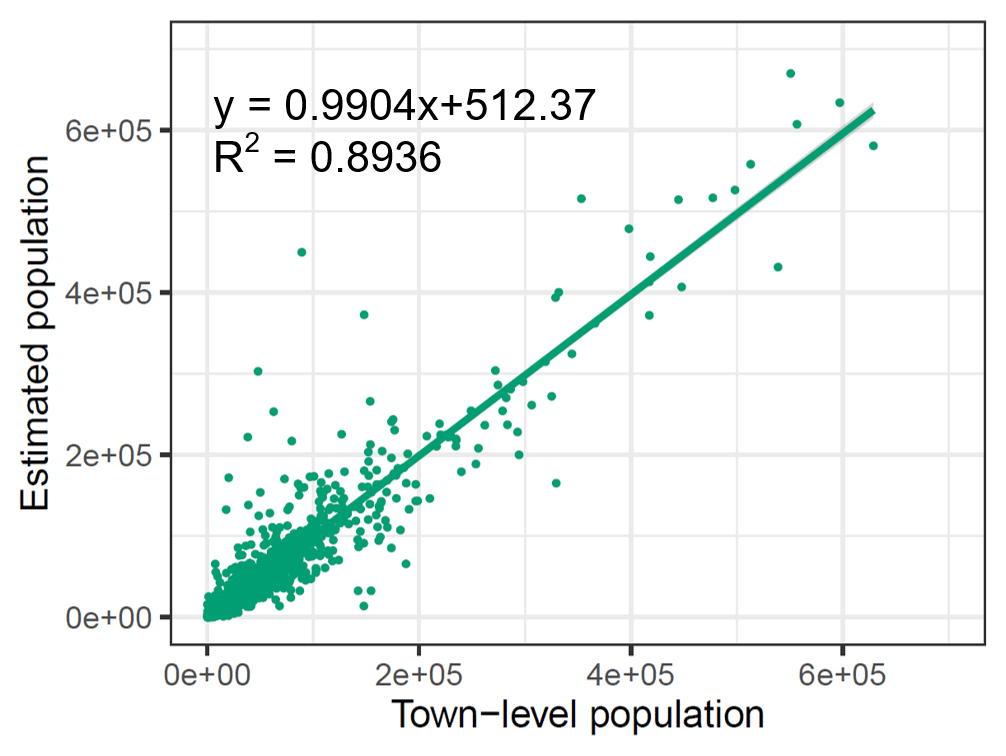
The test set was partially comprised of town-level census data (15 %, i.e., 1931 towns). During accuracy assessment, it was deemed necessary to exclude this set when adjusting estimated population density grids to population count grids. Consequently, for accuracy assessment, the 100 m population count grids were adjusted solely using county-level census data from estimated population density grids. The metrics for the accuracy assessment of estimated population count grids by PopSE are presented in Fig. 7. It can be seen from Fig. 7 that the R2 reached a high value (0.8936), indicating that the 100 m estimated population grids achieved a high accuracy at the town-level scale. The RMSE (22 798) and MAE (10 173) also imply a relatively low error in the estimated population grids. The coefficient (0.9904) of the fitted regression line in Fig. 7 closely approximates to 1, signifying a strong fit between the census population counts and the estimated population counts. This robustly demonstrates the effectiveness of the proposed PopSE.
5.1 Comparison with two existing gridded population products
In this study, we selected two existing widely used gridded population products to compare with the estimated gridded population dataset by the proposed PopSE. The 3 arcsec (∼ 100 m) WorldPop dataset (i.e., “Constrained individual countries 2020 UN adjusted”) and the 30 arcsec (∼ 1 km) LandScan dataset in 2020 were extracted and processed for the geographical region of China. The WorldPop dataset has the same spatial resolution as the estimated population grids, while the LandScan dataset is different from them. To ensure a consistent basis for comparison, the LandScan dataset was directly resampled to the spatial resolution of 3 arcsec (∼ 100 m) with the nearest-neighbor algorithm. It is evident from Fig. 8 that areas with a higher number of population grids are predominantly located in southeastern China, consistent with the patterns observed in Fig. 6. The WorldPop product exhibits slightly more zero-population grids compared to the LandScan product, yet it closely aligns with estimated population dataset in Fig. 6. The examination of the four regions in focus in particular reveals such a detailed population distribution pattern. It means that the LandScan product allocated more population to uninhabited areas, such as water surfaces and mountains. Focusing on the four regions, it can be further seen that WorldPop shows fewer population grids exceeding 300 than LandScan. However, both products exhibit a lower number of high-value population grids, especially those exceeding 300, compared to the estimated population dataset in Fig. 6. This suggests a potential underestimation of grid population counts in the two existing products. In addition, the four regions in focus show that LandScan is obviously coarser than both WorldPop and the estimated population datasets. The primary reason for this discrepancy is that the spatial resolution of the LandScan product is 1/10 of other two gridded population products.
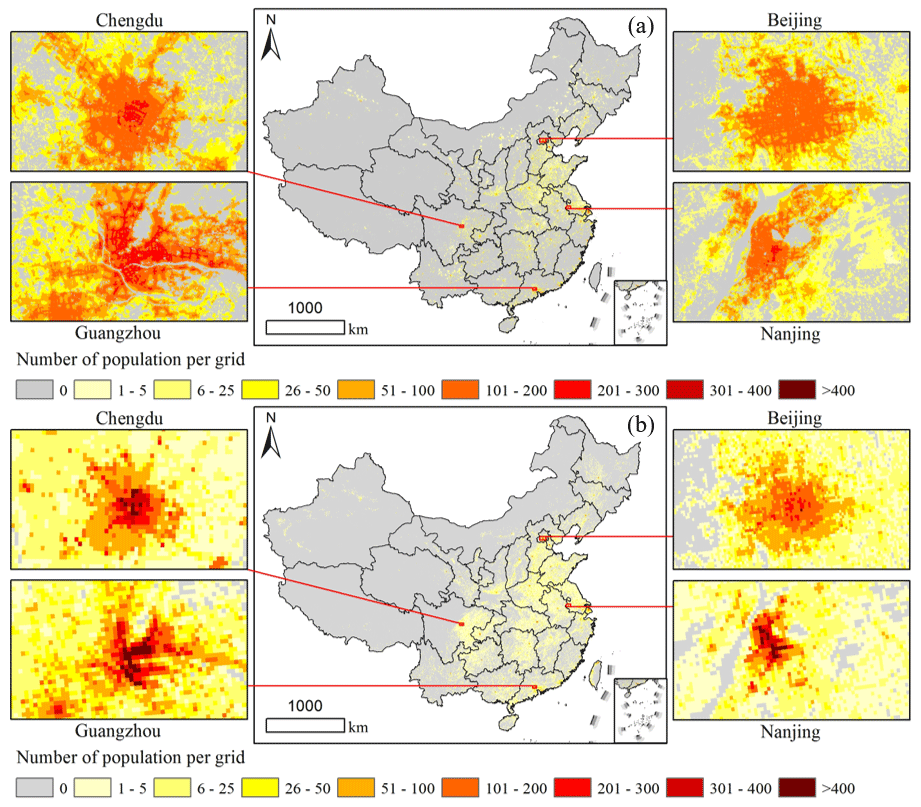
Figure 8Two existing gridded population maps of China in 2020. (a) WorldPop and (b) LandScan.
The town-level census test set was also adopted to evaluate the accuracy of the two existing gridded population products. Figure 9 depicts the evaluated metrics for the two products. It can be seen from Fig. 9 that the R2 values for WorldPop and LandScan are 0.7427 and 0.7165, respectively, indicating a decrease of 0.1509 and 0.1771 compared to the estimated population product by PopSE in Fig. 7. The RMSE values of WorldPop and LandScan are separately 34 315 and 36 508, while the MAE values of WorldPop and LandScan are 18 366 and 17 756, respectively. The RMSE and MAE for WorldPop and LandScan are notably higher than those in Fig. 7. Specifically, the RMSE values for WorldPop and LandScan are, respectively, 1.5 and 1.6 times of that for the estimated product, and the MAE values are, respectively, 0.8 and 0.7 times higher. The coefficients of the fitted regression line in Fig. 9 are 0.8155 and 0.6136 for WorldPop and LandScan, respectively. These values are noticeably lower than 1 and also lower than the coefficient in Fig. 7. This quantitatively demonstrates an underestimation of gridded population counts for both WorldPop and LandScan.
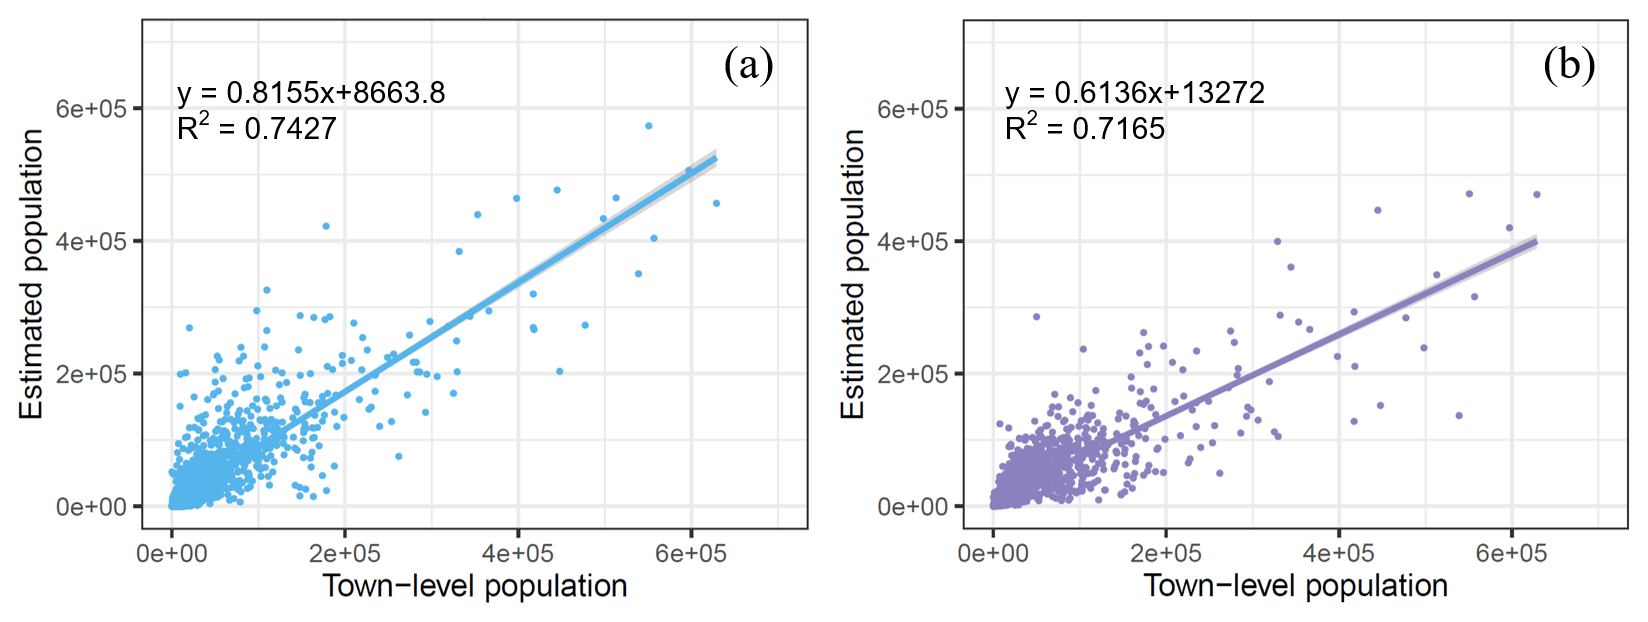
Figure 9Accuracy of two existing gridded population maps of China in 2020. (a) WorldPop and (b) LandScan.
5.2 Feature importance analysis in machine learning algorithms
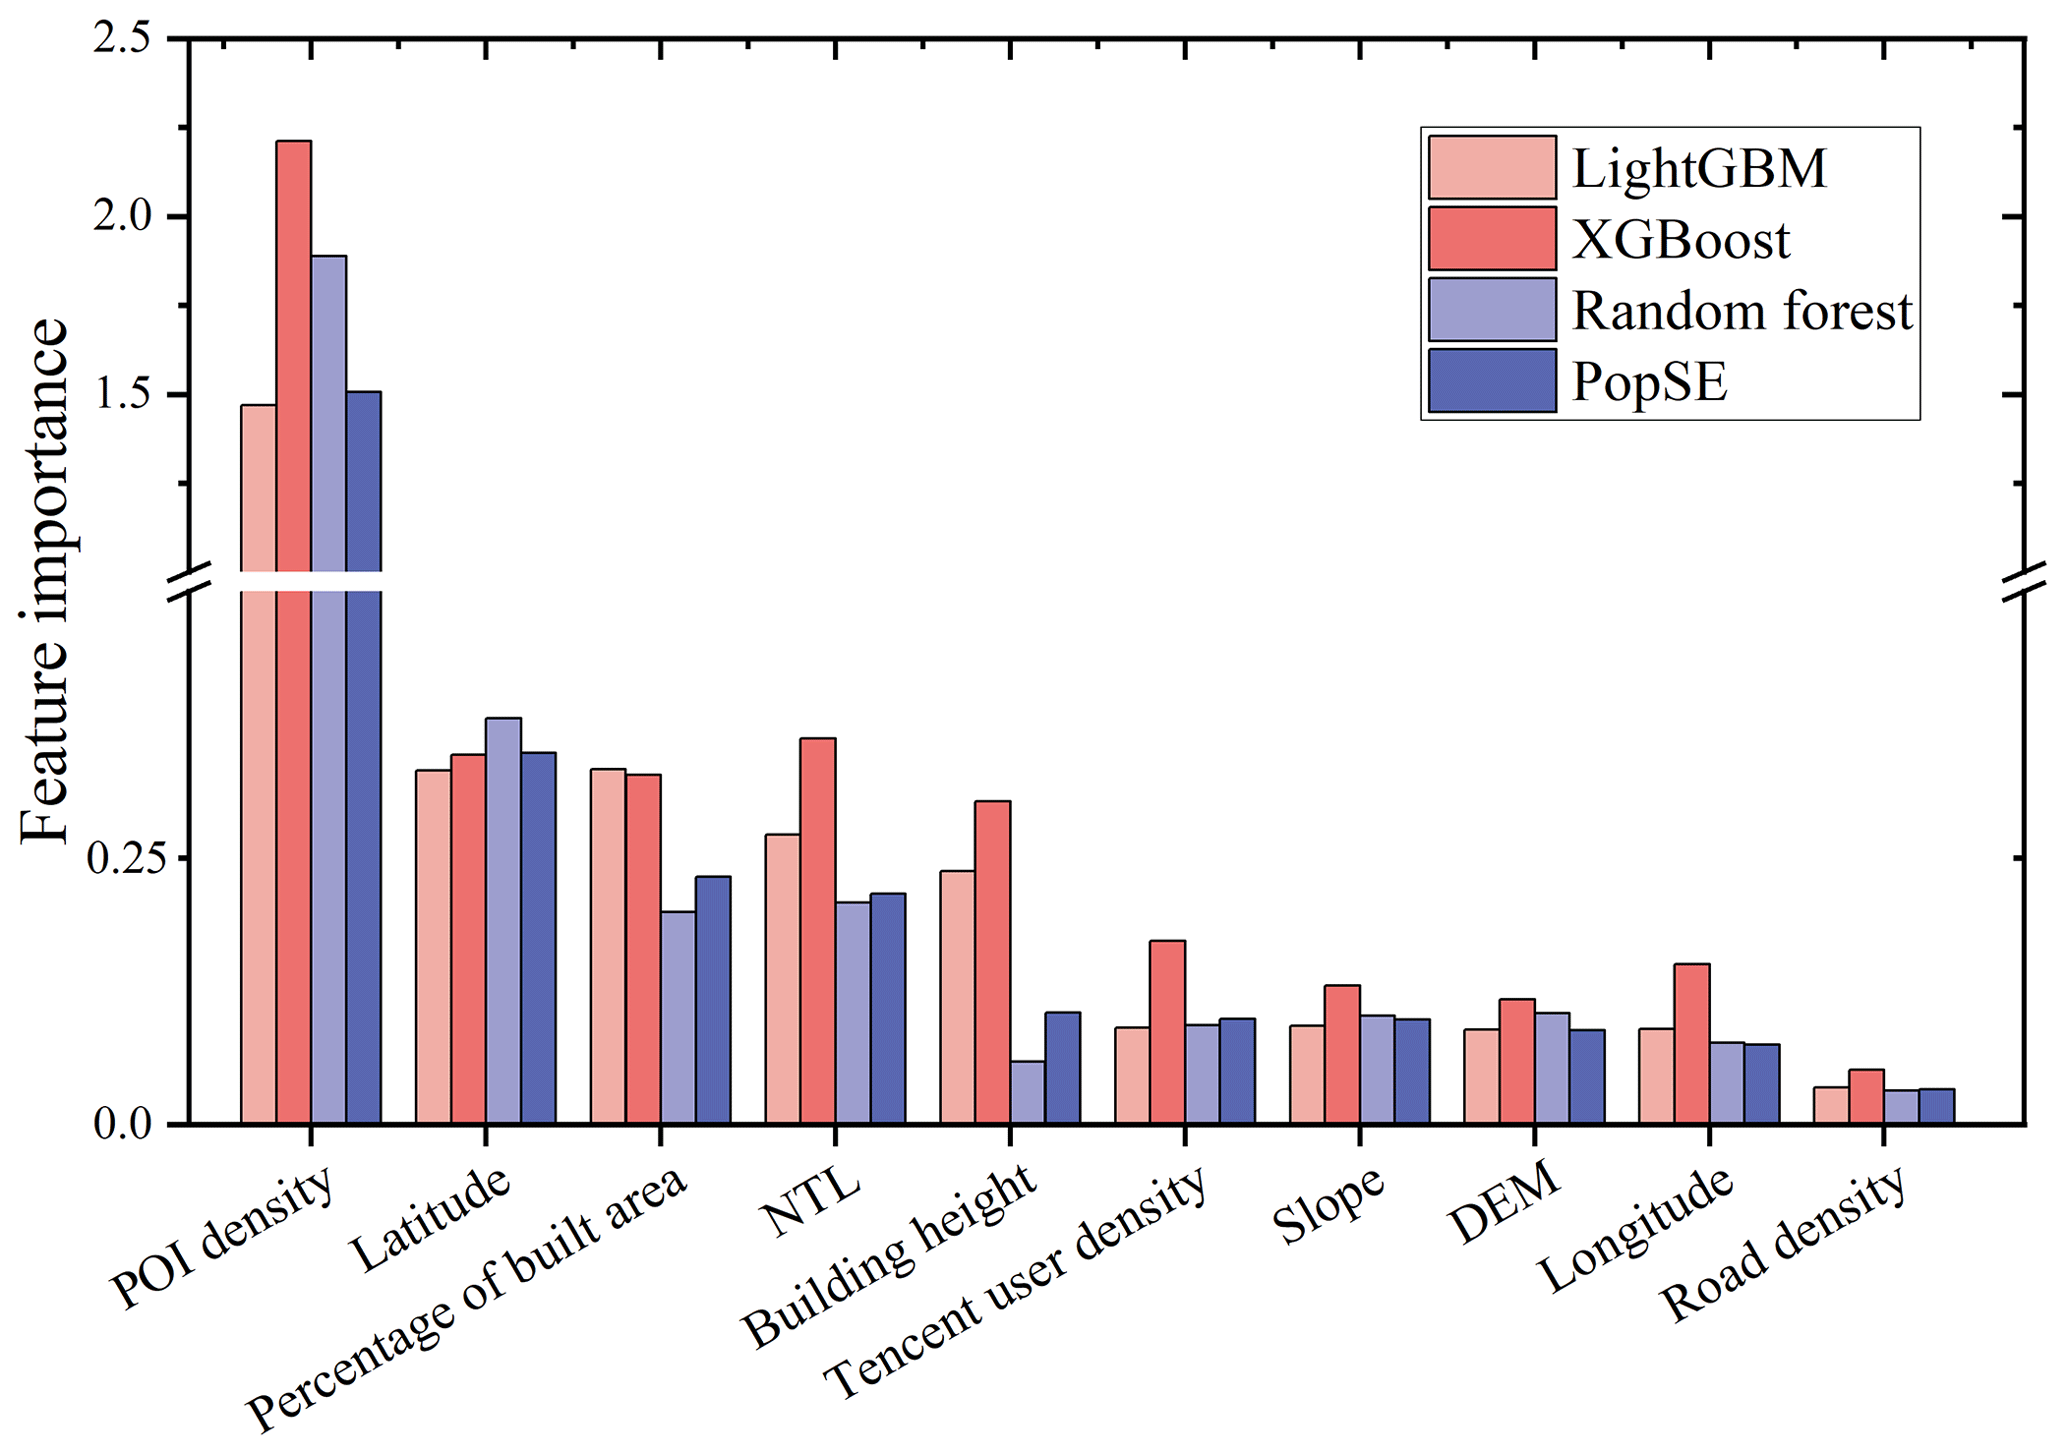
To investigate the influence of 10 covariates on the fitted PopSE, the feature importance (i.e., weight) of covariates was obtained using the ELI5 Python package. It allows us to show the feature importance of various machine learning algorithms, including random forest, XGBoost, LightGBM, and stacking ensemble learning. Figure 10 illustrates the feature importance of each covariate for the fitted PopSE and its three base models. Notably, POI density emerges as the most impactful in fitting PopSE and the three base models, with a significantly higher feature importance compared to the other nine covariates. Following closely are the four covariates of latitude, percentage of built area, NTL, and building height and they have a similar importance level, with relatively equal feature importance. Subsequently, the covariates Tencent user density, slope, DEM, and longitude exhibit comparable levels of feature importance in PopSE and the three base models. Road density has the lowest contribution to build PopSE with the lowest feature importance. Apart from building height, the feature importance of PopSE and its base models is comparable for each covariate in Fig. 10.
5.3 Hyperparameter tuning
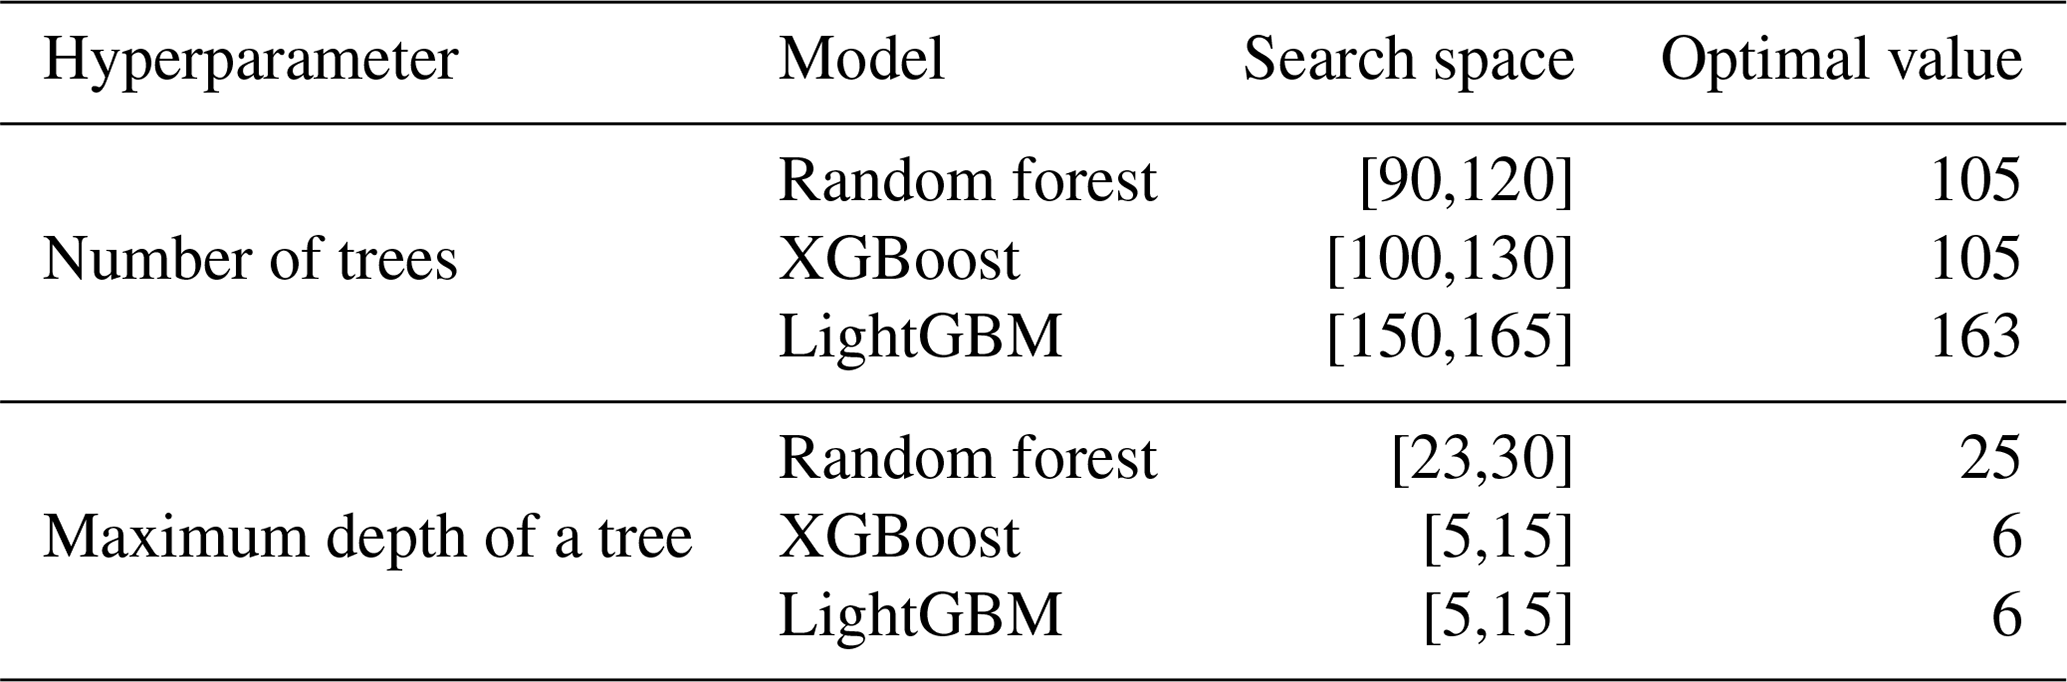
The three base models of PopSE incorporate multiple hyperparameters which have substantial influence on the learning outcomes. Consequently, fine-tuning these hyperparameters is often imperative for achieving optimal performance. Our hyperparameter tuning employed the grid search technique by exploring a defined parameter search space. Specifically, we tuned the number of trees and the maximum depth of a tree for each base model. The search interval was set to 1 for both the number of trees and the maximum depth of a tree. The initial search space for each base model was determined through a combination of trial and error along with empirical findings, as illustrated in Table 3. The optimal hyperparameter values were derived through cross validation utilizing the grid search technique, as shown in Table 3. Hyperparameters not listed in Table 3 retained default values from their respective Python packages.
Table 3Search space for hyperparameters in base models of PopSE.
5.4 Advantages and limitations
This study offers three main advantages compared to previous studies. First, we employed stacking ensemble learning to leverage the strengths of three popular machine learning algorithms (i.e., random forest, XGBoost, and LightGBM) and to possibly improve the overall performance and robustness of the gridded population estimation. Previous studies on estimating population grids often relied on a single machine learning algorithm, and random forest was the most common choice (Cheng et al., 2020; Stevens et al., 2015; Ye et al., 2019). The results in Table 2 show that PopSE had better performance than the three base models, including random forest. Second, we utilized a variety of big geospatial datasets to predict accurate population grids and delineate the inhabited area to enhance population estimation. Previous studies often lacked either abundant covariates or detailed inhabited area data for national-scale population grid estimation (Cheng et al., 2020; Stevens et al., 2015; Ye et al., 2019; Chen et al., 2016, 2020b). Third, the proposed PopSE and big geospatial data were used to generate a 100 m gridded population dataset from China's seventh census. This dataset outperformed two widely used gridded population datasets (i.e., LandScan and WorldPop).
Although the proposed PopSE outperformed three base models using the test set and generated more accurate gridded population dataset for China than two existing products, this study still has its inherent limitations. The proposed PopSE shares similarities with many previous population downscaling methods, and they assumed the scale invariance between the training set and the gridded covariates during training and prediction phases (Baynes et al., 2022; M. Chen et al., 2022; Chen et al., 2020a; Cheng et al., 2020; Gao et al., 2021; Leyk et al., 2019; Qiu et al., 2022; Stevens et al., 2015; Wardrop et al., 2018; Ye et al., 2019; Zhao et al., 2020). There is often a shortage of gridded ground-truth population data. Alternatively, census data collected in irregular administrative units were used as the ground truth for training population downscaling methods. Population downscaling methods, including the proposed PopSE fitted on census data, were typically executed on regular covariate grids to generate gridded population products. However, irregular census data have a spatial-scale difference compared to the target regular population grids. This disparity may introduce uncertainty in the generation of population grids. At the same time, we employed only three widely used machine learning algorithms as base models, limiting the learning ability of the proposed PopSE.
Future work could benefit from incorporating more sophisticated and powerful algorithms into PopSE. Meanwhile, the use of high-quality covariates is crucial for generating accurate gridded population datasets. With the increasing availability of higher-resolution data, integrating more of these high-quality covariates (e.g., mobile phone signaling data, Weibo check-in data, and house renting data) can further enhance the accuracy of gridded population datasets. In addition, the proposed method can be applied to other regions and time periods for generating gridded population datasets.
The dataset of the 100 m gridded population counts for China in 2020 is stored in GeoTIFF format and is freely available at https://doi.org/10.6084/m9.figshare.24916140.v1 (Chen et al., 2024b).
In this study, we developed a novel population downscaling approach by leveraging stacking ensemble learning and big geospatial data. It aimed to employ stacking ensemble learning to combine the advantages of individual base models of random forest, XGBoost, and LightGBM. By integrating the predictions of these base models, the overall performance and robustness of gridded population estimation were enhanced compared to individual algorithms. Meanwhile, a variety of 100 m gridded big geospatial datasets were collected to delineate inhabited areas to specify and estimate population counts exclusively for China's seventh population census data. Experimental results have demonstrated that the proposed population downscaling approach outperformed individual base models and generated a better gridded population dataset for China in 2020 than two existing gridded population products, WorldPop and LandScan, in both quantitative and visual aspects. Hence, the proposed population downscaling approach will be a valuable option to generate population grids in other regions, and the dataset described here will be useful for a wide range of applications, such as disaster and pollutant exposure assessment and resource and facility allocation.
YC and YG designed the research and performed the analysis. YC and CX wrote the paper. XZ and YZ prepared the data and performed the analysis. YG edited and revised the paper. All authors contributed to and approved the final paper.
The contact author has declared that none of the authors has any competing interests.
Publisher’s note: Copernicus Publications remains neutral with regard to jurisdictional claims made in the text, published maps, institutional affiliations, or any other geographical representation in this paper. While Copernicus Publications makes every effort to include appropriate place names, the final responsibility lies with the authors. Regarding the maps used in this paper, please note that Figs. 1–4, 6, and 8 contain disputed territories.
This work was supported in part by the National Key R&D Program of China (grant no. 2023YFC3006701) and in part by the National Natural Science Foundation of China (grant no. 42071315).
This paper was edited by Qingxiang Li and reviewed by two anonymous referees.
Baynes, J., Neale, A., and Hultgren, T.: Improving intelligent dasymetric mapping population density estimates at 30 m resolution for the conterminous United States by excluding uninhabited areas, Earth Syst. Sci. Data, 14, 2833–2849, https://doi.org/10.5194/essd-14-2833-2022, 2022.
Bright, E. A. and Coleman, P. R.: LandScan: a global population database for estimating populations at risk, Photogramm. Eng. Rem. S., 66, 849–858, 2000.
Chen, M., Xian, Y., Huang, Y., Zhang, X., Hu, M., Guo, S., Chen, L., and Liang, L.: Fine-scale population spatialization data of China in 2018 based on real location-based big data, Scientific Data, 9, 624, https://doi.org/10.1038/s41597-022-01740-5, 2022.
Chen, Q., Hou, X., Zhang, X., and Ma, C.: Improved GDP spatialization approach by combining land-use data and night-time light data: a case study in China's continental coastal area, Int. J. Remote Sens., 37, 4610–4622, 2016.
Chen, Q., Ye, T., Zhao, N., Ding, M., Ouyang, Z., Jia, P., Yue, W., and Yang, X.: Mapping China's regional economic activity by integrating points-of-interest and remote sensing data with random forest, Environment and Planning B: Urban Analytics and City Science, 48, 1876–1894, https://doi.org/10.1177/2399808320951580, 2021.
Chen, T. and Guestrin, C.: XGBoost: A scalable tree boosting system, Proceedings of the 22nd acm sigkdd international conference on knowledge discovery and data mining, 785–794, https://doi.org/10.1145/2939672.2939785, 2016.
Chen, Y., Ruojing, Z., Ge, Y., Yan, J., and Zelong, X.: Downscaling census data for gridded population mapping with geographically weighted area-to-point regression kriging, IEEE Access, 7, 149132–149141, https://doi.org/10.1109/ACCESS.2019.2945000, 2019.
Chen, Y., Li, X., Huang, K., Luo, M., and Gao, M.: High-resolution gridded population projections for China under the shared socioeconomic pathways, Earth's Future, 8, e2020EF001491, https://doi.org/10.1029/2020EF001491, 2020a.
Chen, Y., Guo, F., Wang, J., Cai, W., Wang, C., and Wang, K.: Provincial and gridded population projection for China under shared socioeconomic pathways from 2010 to 2100, Scientific Data, 7, 83, https://doi.org/10.1038/s41597-020-0421-y, 2020b.
Chen, Y., Wu, G., Ge, Y., and Xu, Z.: Mapping gridded gross domestic product distribution of China using deep learning with multiple geospatial big data, IEEE J. Sel. Top. Appl., 15, 1791–1802, https://doi.org/10.1109/JSTARS.2022.3148448, 2022.
Chen, Y., Wu, G., Chen, Y., and Xia, Z.: Spatial location optimization of fire stations with traffic status and urban functional areas, Appl. Spat. Anal. Polic., 16, 771–788, https://doi.org/10.1007/s12061-023-09502-5, 2023.
Chen, Y., Zhou, J., Ge, Y., and Dong, J.: Uncovering the rapid expansion of photovoltaic power plants in China from 2010 to 2022 using satellite data and deep learning, Remote Sens. Environ., 305, 114100, https://doi.org/10.1016/j.rse.2024.114100, 2024a.
Chen, Y., Xu, C., Ge, Y., Zhang, X., and Zhou, Y. N.: A 100-m gridded population dataset of China's seventh census using ensemble learning and geospatial big data, Figshare [data set], https://doi.org/10.6084/m9.figshare.24916140.v1, 2024b.
Cheng, Z., Wang, J., and Ge, Y.: Mapping monthly population distribution and variation at 1 km resolution across China, Int. J. Geogr. Inf. Sci., 36, 1166–1184, https://doi.org/10.1080/13658816.2020.1854767, 2020.
Costache, R. and Bui, D. T.: Spatial prediction of flood potential using new ensembles of bivariate statistics and artificial intelligence: A case study at the Putna river catchment of Romania, Sci. Total Environ., 691, 1098–1118, 2019.
Dong, X., Yu, Z., Cao, W., Shi, Y., and Ma, Q.: A survey on ensemble learning, Frontiers of Computer Science, 14, 241–258, 2020.
Elvidge, C. D., Zhizhin, M., Ghosh, T., Hsu, F.-C., and Taneja, J.: Annual Time Series of Global VIIRS Nighttime Lights Derived from Monthly Averages: 2012 to 2019, Remote Sensing, 13, 922, https://doi.org/10.3390/rs13050922, 2021.
Fang, J., Sun, S., Shi, P., and Wang, J. a.: Assessment and mapping of potential storm surge impacts on global population and economy, Int. J. Disast. Risk Sc., 5, 323–331, 2014.
Fang, Z., Wang, Y., Peng, L., and Hong, H.: A comparative study of heterogeneous ensemble-learning techniques for landslide susceptibility mapping, Int. J. Geogr. Inf. Sci., 35, 321–347, https://doi.org/10.1080/13658816.2020.1808897, 2021.
Feng, L., Yang, S., Zhou, Y., and Shuai, L.: Exploring the effects of the spatial arrangement and leaf area density of trees on building wall temperature, Build. Environ., 205, 108295, https://doi.org/10.1016/j.buildenv.2021.108295, 2021.
Gao, P., Wu, T., Ge, Y., and Li, Z.: Improving the accuracy of extant gridded population maps using multisource map fusion, GISci. Remote Sens., 59, 54–70, https://doi.org/10.1080/15481603.2021.2012371, 2021.
Guo, W., Zhang, J., Zhao, X., Li, Y., Liu, J., Sun, W., and Fan, D.: Combining Luojia1-01 Nighttime Light and Points-of-Interest Data for Fine Mapping of Population Spatialization Based on the Zonal Classification Method, IEEE J. Sel. Top. Appl., 16, 1589–1600, https://doi.org/10.1109/JSTARS.2023.3238188, 2023a.
Guo, W., Liu, J., Zhao, X., Hou, W., Zhao, Y., Li, Y., Sun, W., and Fan, D.: Spatiotemporal dynamics of population density in China using nighttime light and geographic weighted regression method, Int. J. Digit. Earth, 16, 2704–2723, 2023b.
Ke, G., Meng, Q., Finley, T., Wang, T., Chen, W., Ma, W., Ye, Q., and Liu, T.-Y.: Lightgbm: A highly efficient gradient boosting decision tree, Adv. Neur. In., 30, 3149–3157, https://api.semanticscholar.org/CorpusID:3815895 (last access: 30 June 2022), 2017.
Kubíček, P., Konečný, M., Stachoň, Z., Shen, J., Herman, L., Řezník, T., Staněk, K., Štampach, R., and Leitgeb, Š.: Population distribution modelling at fine spatio-temporal scale based on mobile phone data, Int. J. Digit. Earth, 12, 1319–1340, https://doi.org/10.1080/17538947.2018.1548654, 2018.
Leyk, S., Gaughan, A. E., Adamo, S. B., de Sherbinin, A., Balk, D., Freire, S., Rose, A., Stevens, F. R., Blankespoor, B., Frye, C., Comenetz, J., Sorichetta, A., MacManus, K., Pistolesi, L., Levy, M., Tatem, A. J., and Pesaresi, M.: The spatial allocation of population: a review of large-scale gridded population data products and their fitness for use, Earth Syst. Sci. Data, 11, 1385–1409, https://doi.org/10.5194/essd-11-1385-2019, 2019.
Linard, C., Alegana, V. A., Noor, A. M., Snow, R. W., and Tatem, A. J.: A high resolution spatial population database of Somalia for disease risk mapping, Int. J. Health Geogr., 9, 45, https://doi.org/10.1186/1476-072x-9-45, 2010.
Liu, L., Cheng, G., Yang, J., and Cheng, Y.: Population spatialization in Zhengzhou city based on multi-source data and random forest model, Front. Earth Sci., 11, 1092664, https://doi.org/10.3389/feart.2023.1092664, 2023.
MacManus, K., Balk, D., Engin, H., McGranahan, G., and Inman, R.: Estimating population and urban areas at risk of coastal hazards, 1990–2015: how data choices matter, Earth Syst. Sci. Data, 13, 5747–5801, https://doi.org/10.5194/essd-13-5747-2021, 2021.
Nadim, F., Kjekstad, O., Peduzzi, P., Herold, C., and Jaedicke, C.: Global landslide and avalanche hotspots, Landslides, 3, 159–173, https://doi.org/10.1007/s10346-006-0036-1, 2006.
Qiu, Y., Zhao, X., Fan, D., Li, S., and Zhao, Y.: Disaggregating population data for assessing progress of SDGs: methods and applications, Int. J. Digit. Earth, 15, 2–29, https://doi.org/10.1080/17538947.2021.2013553, 2022.
Samir, K. C. and Lutz, W.: The human core of the shared socioeconomic pathways: Population scenarios by age, sex and level of education for all countries to 2100, Global Environmental Change, 42, 181–192, 2017.
Song, Y., Tan, Y., Song, Y., Wu, P., Cheng, J. C., Kim, M. J., and Wang, X.: Spatial and temporal variations of spatial population accessibility to public hospitals: A case study of rural–urban comparison, GISci. Remote Sens., 55, 718–744, 2018.
Stevens, F. R., Gaughan, A. E., Linard, C., and Tatem, A. J.: Disaggregating census data for population mapping using random forests with remotely-sensed and ancillary data, Plos One, 10, e0107042, https://doi.org/10.1371/journal.pone.0107042, 2015.
Stevens, F. R., Gaughan, A. E., Nieves, J. J., King, A., Sorichetta, A., Linard, C., and Tatem, A. J.: Comparisons of two global built area land cover datasets in methods to disaggregate human population in eleven countries from the global South, Int. J. Digit. Earth, 13, 78–100, https://doi.org/10.1080/17538947.2019.1633424, 2019.
Tatem, A. J.: Mapping the denominator: spatial demography in the measurement of progress, Int. Health, 6, 153–155, https://academic.oup.com/inthealth/article/6/3/153/2964850 (last access: 30 June 2022), 2014.
Tatem, A. J.: WorldPop, open data for spatial demography, Scientific Data, 4, 170004, https://doi.org/10.1038/sdata.2017.4, 2017.
Tu, W., Liu, Z., Du, Y., Yi, J., Liang, F., Wang, N., Qian, J., Huang, S., and Wang, H.: An ensemble method to generate high-resolution gridded population data for China from digital footprint and ancillary geospatial data, Int. J. Appl. Earth Obs., 107, 102709, https://doi.org/10.1016/j.jag.2022.102709, 2022.
Wang, J., Zheng, S., and Obradovich, N.: A 43-Million-Person Investigation into Weather and Expressed Sentiment in a Changing Climate, One Earth, 2, 568–577, 2020.
Wardrop, N. A., Jochem, W. C., Bird, T. J., Chamberlain, H. R., Clarke, D., Kerr, D., Bengtsson, L., Juran, S., Seaman, V., and Tatem, A. J.: Spatially disaggregated population estimates in the absence of national population and housing census data, P. Natl. Acad. Sci. USA, 115, 3529–3537, 2018.
Wu, T., Luo, J., Dong, W., Gao, L., Hu, X., Wu, Z., Sun, Y., and Liu, J.: Disaggregating County-Level Census Data for Population Mapping Using Residential Geo-Objects with Multi-Source Geo-Spatial Data, IEEE J. Sel. Top. Appl., 13, 1189–1205, https://doi.org/10.1109/JSTARS.2020.2974896, 2020.
Wu, T., Zhang, W., Jiao, X., Guo, W., and Alhaj Hamoud, Y.: Evaluation of stacking and blending ensemble learning methods for estimating daily reference evapotranspiration, Comput. Electron. Agr., 184, 106039, https://doi.org/10.1016/j.compag.2021.106039, 2021.
Wu, W.-B., Ma, J., Banzhaf, E., Meadows, M. E., Yu, Z.-W., Guo, F.-X., Sengupta, D., Cai, X.-X., and Zhao, B.: A first Chinese building height estimate at 10 m resolution (CNBH-10 m) using multi-source earth observations and machine learning, Remote Sens. Environ., 291, 113578, https://doi.org/10.1016/j.rse.2023.113578, 2023.
Xu, Z., Wang, Y., Sun, G., Chen, Y., Ma, Q., and Zhang, X.: Generating gridded gross domestic product data for China using geographically weighted ensemble learning, ISPRS Int. J. Geo-Inf., 12, 123, https://doi.org/10.3390/ijgi12030123, 2023.
Yang, W., Wan, X., Liu, M., Zheng, D., and Liu, H.: A two-level random forest model for predicting the population distributions of urban functional zones: A case study in Changsha, China, Sustai. Cities Soc., 88, 104297, https://doi.org/10.1016/j.scs.2022.104297, 2023.
Yao, J., Zhang, X., Luo, W., Liu, C., and Ren, L.: Applications of Stacking/Blending ensemble learning approaches for evaluating flash flood susceptibility, Int. J. Appl. Earth Obs., 112, 102932, https://doi.org/10.1016/j.jag.2022.102932, 2022.
Ye, T., Zhao, N., Yang, X., Ouyang, Z., Liu, X., Chen, Q., Hu, K., Yue, W., Qi, J., Li, Z., and Jia, P.: Improved population mapping for China using remotely sensed and points-of-interest data within a random forests model, Sci. Total Environ., 658, 936–946, https://doi.org/10.1016/j.scitotenv.2018.12.276, 2019.
Yi, J., Du, Y., Liang, F., Tu, W., Qi, W., and Ge, Y.: Mapping human's digital footprints on the Tibetan Plateau from multi-source geospatial big data, Sci. Total Environ., 711, 134540, https://doi.org/10.1016/j.scitotenv.2019.134540, 2019.
Zhang, R., Chen, Y., Zhang, X., Ma, Q., and Ren, L.: Mapping homogeneous regions for flash floods using machine learning: A case study in Jiangxi province, China, Int. J. Appl. Earth Obs., 108, 102717, https://doi.org/10.1016/j.jag.2022.102717, 2022.
Zhao, S., Liu, Y., Zhang, R., and Fu, B.: China's population spatialization based on three machine learning models, J. Clean. Prod., 256, 120644, https://doi.org/10.1016/j.jclepro.2020.120644, 2020.
Zhao, X., Xia, N., Xu, Y., Huang, X., and Li, M.: Mapping population distribution based on XGBoost using multisource data, IEEE J. Sel. Top. Appl., 14, 11567–11580, 2021a.
Zhao, X., Zhou, Y., Chen, W., Li, X., Li, X., and Li, D.: Mapping hourly population dynamics using remotely sensed and geospatial data: a case study in Beijing, China, GISci. Remote Sens., 58, 717–732, https://doi.org/10.1080/15481603.2021.1935128, 2021b.
Zhou, Y. n., Feng, L., Zhang, X., Wang, Y., Wang, S., and Wu, T.: Spatiotemporal patterns of the COVID-19 control measures impact on industrial production in Wuhan using time-series earth observation data, Sustain. Cities Soc., 75, 103388, https://doi.org/10.1016/j.scs.2021.103388, 2021.